10-k filed period 12/31/2010 filed on 03/01/2011 … corporation ("tesoro") ... code of...
TRANSCRIPT
TESORO CORP /NEW/ (TSO)
10-K
Annual report pursuant to section 13 and 15(d)Filed on 03/01/2011Filed Period 12/31/2010
Table of Contents
UNITED STATES SECURITIES AND EXCHANGE COMMISSIONWashington, D.C. 20549
Form 10-K
(Mark One)
þ
ANNUAL REPORT PURSUANT TO SECTION 13 OR 15(d) OF THE SECURITIES EXCHANGE ACTOF 1934
For the fiscal year ended December 31, 2010or
o
TRANSITION REPORT PURSUANT TO SECTION 13 OR 15(d) OF THE SECURITIES EXCHANGEACT OF 1934
For the transition period from to Commission File Number 1-3473
TESORO CORPORATION(Exact name of registrant as specified in its charter)
Delaware 95-0862768(State or other jurisdiction of incorporation or organization) (I.R.S. Employer Identification No.)
19100 Ridgewood Parkway
San Antonio, Texas(Address of principal executive offices)
78259-1828(Zip Code)
Registrant's telephone number, including area code:210-626-6000
Securities registered pursuant to Section 12(b) of the Act:
Title of Each Class Name of Each Exchange on Which Registered
Common Stock, $0.16 2/3 par value New York Stock Exchange
Securities registered pursuant to Section 12(g) of the Act: None
Indicate by check mark if the registrant is a well-known seasoned issuer, as defined in Rule 405 of the Securities Act. Yes þ No o
Indicate by check mark if the registrant is not required to file reports pursuant to Section 13 or Section 15(d) of the Act. Yes o No þ
Indicate by check mark whether the registrant (1) has filed all reports required to be filed by Section 13 or 15(d) of the Securities Exchange Act of1934 during the preceding 12 months (or for such shorter period that the registrant was required to file such reports), and (2) has been subject to suchfiling requirements for the past 90 days. Yes þ No o
Indicate by check mark whether the registrant has submitted electronically and posted on its corporate Website, if any, every Interactive Data Filerequired to be submitted and posted pursuant to Rule 405 of Regulation S-T during the preceding 12 months (or for such shorter period that theregistrant was required to submit and post such files). Yes þ No o
Indicate by check mark if disclosure of delinquent filers pursuant to Item 405 of Regulation S-K is not contained herein, and will not be contained,to the best of the registrant's knowledge, in definitive proxy or information statements incorporated by reference in Part III of this Form 10-K or anyamendment to this Form 10-K. þ
Indicate by check mark whether the registrant is a large accelerated filer, an accelerated filer, a non-accelerated filer, or a smaller reportingcompany. See the definitions of "large accelerated filer," "accelerated filer" and "smaller reporting company" in Rule 12b-2 of the Exchange Act.(Check one):
Large accelerated filer þ Accelerated filer o Non-accelerated filer o Smaller reporting company o(Do not check if a smaller reporting company)
Indicate by check mark whether the registrant is a shell company (as defined by Rule 12b-2 of the Act). Yes o No þ
At June 30, 2010, the aggregate market value of the voting common stock held by non-affiliates of the registrant was approximately $1.6 billionbased upon the closing price of its common stock on the New York Stock Exchange Composite tape. At February 21, 2011, there were143,174,369 shares of the registrant's common stock outstanding.
DOCUMENTS INCORPORATED BY REFERENCE
Portions of the registrant's Proxy Statement to be filed pursuant to Regulation 14A pertaining to the 2011 Annual Meeting of Stockholders areincorporated by reference into Part III hereof. The Company intends to file such Proxy Statement no later than 120 days after the end of the fiscal yearcovered by this Form 10-K.

TESOROCORPORATION
ANNUAL REPORT ONFORM 10-K
TABLE OF CONTENTS
Page
PART I Items 1. and 2. Business and Properties 2 Refining 3 Retail 11 Competition 12 Government Regulation and Legislation 13 Working Capital 15 Seasonality 15 Employees 15 Properties 15 Glossary of Terms 16 Executive Officers of the Registrant 18 Board of Directors of the Registrant 20 Item 1A. Risk Factors 21 Item 1B. Unresolved Staff Comments 25 Item 3. Legal Proceedings 25 Item 4. Removed and reserved 26
PART II Item 5. Market for Registrant's Common Equity, Related Stockholder Matters and Issuer Purchases of Equity Securities 27 Item 6. Selected Financial Data 29 Item 7. Management's Discussion and Analysis of Financial Condition and Results of Operations 30 Important Information Regarding Forward-Looking Statements 30 Business Strategy and Overview 31 Results of Operations 34 Capital Resources and Liquidity 42 Accounting Standards 50 Item 7A. Quantitative and Qualitative Disclosures about Market Risk 54 Item 8. Financial Statements and Supplementary Data 56 Item 9. Changes in and Disagreements with Accountants on Accounting and Financial Disclosure 105 Item 9A. Controls and Procedures 105 Item 9B. Other Information 105
PART III Item 10. Directors, Executive Officers and Corporate Governance 107 Item 11. Executive Compensation 107 Item 12. Security Ownership of Certain Beneficial Owners and Management and Related Stockholder Matters 107 Item 13. Certain Relationships and Related Transactions, and Director Independence 107 Item 14. Principal Accounting Fees and Services 107
PART IV Item 15. Exhibits and Financial Statement Schedules 108 Signatures 113 EX-10.21 EX-21.1 EX-23.1 EX-31.1 EX-31.2 EX-32.1 EX-32.2 EX-101 INSTANCE DOCUMENT EX-101 SCHEMA DOCUMENT EX-101 CALCULATION LINKBASE DOCUMENT EX-101 LABELS LINKBASE DOCUMENT EX-101 PRESENTATION LINKBASE DOCUMENT EX-101 DEFINITION LINKBASE DOCUMENT
This Annual Report on Form 10-K (including documents incorporated by reference herein) contains statements with respect to ourexpectations or beliefs as to future events. These types of statements are "forward-looking" and subject to uncertainties. See "ImportantInformation Regarding Forward-Looking Statements" on page 30.
As used in this Annual Report on Form 10-K, the terms "Tesoro," "we," "us" or "our" may refer to Tesoro Corporation, one or more of itsconsolidated subsidiaries or all of them taken as a whole.
1

Table of Contents
PART I
ITEMS 1. AND 2. BUSINESS AND PROPERTIES
Statements in this Annual Report on Form 10-K, that are not historical in nature should be deemed forward-looking statements that areinherently uncertain. See "Important Information Regarding Forward-Looking Statements" in Management's Discussion and Analysis ofFinancial Condition and Results of Operations in Item 7 for a discussion of forward-looking statements and of factors that could cause actualoutcomes and results to differ materially from those projected.
Tesoro Corporation ("Tesoro") was incorporated in Delaware in 1968. Based in San Antonio, Texas, we are one of the largest independentpetroleum refiners and marketers in the United States. Our subsidiaries, operating through two business segments, primarily manufacture and selltransportation fuels. Our refining operating segment ("refining"), which operates seven refineries in the western United States, refines crude oil andother feedstocks into transportation fuels, such as gasoline, gasoline blendstocks, jet fuel and diesel fuel, as well as other products, including heavyfuel oils, liquefied petroleum gas, petroleum coke and asphalt. This operating segment sells refined products in wholesale and bulk markets to a widevariety of customers within the operations area. Our retail operating segment ("retail") sells transportation fuels and convenience products in15 states through a network of 880 retail stations, primarily under the Tesoro®, Shell®, USA Gasolinetm and Mirastar® brands. See Notes N and Qto our consolidated financial statements in Item 8 for additional information on our operating segments and properties.
Our principal executive offices are located at 19100 Ridgewood Parkway, San Antonio, Texas 78259-1828 and our telephone number is(210) 626-6000. Our common stock trades on the New York Stock Exchange under the symbol "TSO." We file reports with the Securities andExchange Commission ("SEC"), including annual reports on Form 10-K, quarterly reports on Form 10-Q and other reports from time to time. Thepublic may read and copy any materials that we file with the SEC at the SEC's Public Reference Room at 100 F Street, N.E., Washington, DC20549. The public may obtain information on the operation of the Public Reference Room by calling the SEC at 1-800-SEC-0330. Our SEC filingsare also available to the public on the SEC's Internet site at http://www.sec.gov and our website at http://www.tsocorp.com as soon as reasonablypracticable after we electronically file such material with, or furnish it to, the SEC. You may receive a copy of our Annual Report on Form 10-K,including the financial statements, free of charge by writing to Tesoro Corporation, Attention: Investor Relations, 19100 RidgewoodParkway, San Antonio, Texas 78259-1828. We also post our corporate governance guidelines, code of business conduct, code of ethics for seniorfinancial officers and our Board of Director committee charters on our website. Our governance documents are available in print by writing to theaddress above. We submitted to the New York Stock Exchange on June 18, 2010 our annual certification concerning corporate governance pursuantto Section 303A.12 (a) of the New York Stock Exchange Listed Company Manual.
2

Table of Contents
REFINING
Overview
We currently own and operate seven petroleum refineries located in the western United States and sell transportation fuels to a wide variety ofcustomers. Our refineries produce a high proportion of the transportation fuels that we sell, and we purchase the remainder from other refiners andsuppliers. Our seven refineries have a combined crude oil capacity of 665 thousand barrels per day ("Mbpd"). Crude oil capacity and throughputrates of crude oil and other feedstocks by refinery are as follows:
Crude Oil Capacity Throughput (bpd) Refinery (bpd)(a) 2010 2009 2008
California Golden Eagle 166,000 124,000 140,900 153,300 Los Angeles 97,000 98,800 100,500 105,100
Pacific Northwest Washington(b) 120,000 39,300 84,200 103,100 Alaska 72,000 53,400 50,600 55,600
Mid-Pacific Hawaii 93,500 63,900 68,200 69,100
Mid-Continent North Dakota 58,000 50,800 54,000 56,000 Utah 58,000 50,100 50,600 52,900
Total(c) 664,500 480,300 549,000 595,100
(a) Crude oil capacity by refinery as reported by the Energy Information Administration (2010). Throughput can exceed crude oil capacity due tothe processing of other feedstocks in addition to crude oil.
(b) Our Washington refinery was temporarily shut-down from April 2010 to November 2010.
(c) See discussion regarding changes in total refining throughput in Management's Discussion and Analysis of Financial Condition and Results ofOperations in Item 7.
3
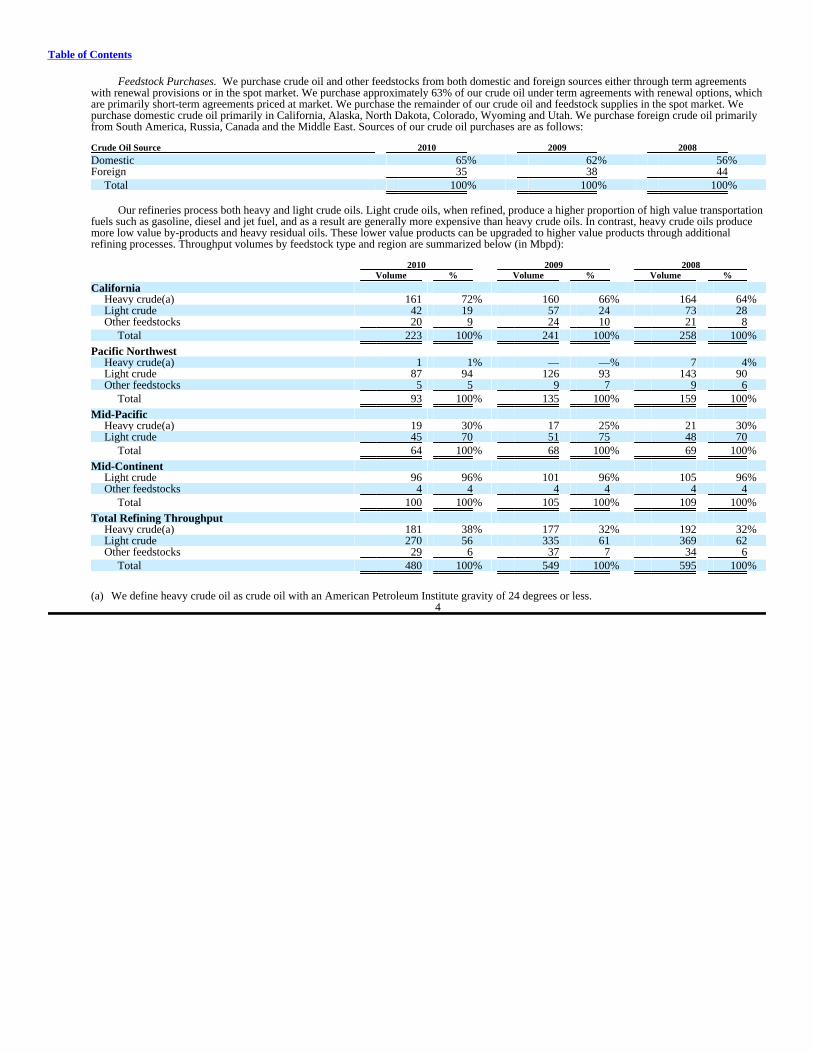
Table of Contents
Feedstock Purchases. We purchase crude oil and other feedstocks from both domestic and foreign sources either through term agreementswith renewal provisions or in the spot market. We purchase approximately 63% of our crude oil under term agreements with renewal options, whichare primarily short-term agreements priced at market. We purchase the remainder of our crude oil and feedstock supplies in the spot market. Wepurchase domestic crude oil primarily in California, Alaska, North Dakota, Colorado, Wyoming and Utah. We purchase foreign crude oil primarilyfrom South America, Russia, Canada and the Middle East. Sources of our crude oil purchases are as follows:
Crude Oil Source 2010 2009 2008
Domestic 65% 62% 56%Foreign 35 38 44
Total 100% 100% 100%
Our refineries process both heavy and light crude oils. Light crude oils, when refined, produce a higher proportion of high value transportationfuels such as gasoline, diesel and jet fuel, and as a result are generally more expensive than heavy crude oils. In contrast, heavy crude oils producemore low value by-products and heavy residual oils. These lower value products can be upgraded to higher value products through additionalrefining processes. Throughput volumes by feedstock type and region are summarized below (in Mbpd):
2010 2009 2008 Volume % Volume % Volume %
California Heavy crude(a) 161 72% 160 66% 164 64%Light crude 42 19 57 24 73 28 Other feedstocks 20 9 24 10 21 8
Total 223 100% 241 100% 258 100%
Pacific Northwest Heavy crude(a) 1 1% — —% 7 4%Light crude 87 94 126 93 143 90 Other feedstocks 5 5 9 7 9 6
Total 93 100% 135 100% 159 100%
Mid-Pacific Heavy crude(a) 19 30% 17 25% 21 30%Light crude 45 70 51 75 48 70
Total 64 100% 68 100% 69 100%
Mid-Continent Light crude 96 96% 101 96% 105 96%Other feedstocks 4 4 4 4 4 4
Total 100 100% 105 100% 109 100%
Total Refining Throughput Heavy crude(a) 181 38% 177 32% 192 32%Light crude 270 56 335 61 369 62 Other feedstocks 29 6 37 7 34 6
Total 480 100% 549 100% 595 100%
(a) We define heavy crude oil as crude oil with an American Petroleum Institute gravity of 24 degrees or less. 4

Table of Contents
Refined Products. The total products produced in the manufacturing process are referred to as the refining yield. The refining yield consistsprimarily of transportation fuels, including gasoline and gasoline blendstocks, jet fuel and diesel fuel, but also may include other products includingheavy fuel oils, liquefied petroleum gas, petroleum coke and asphalt. Our refining yield by region is summarized below (in Mbpd):
2010 2009 2008 Volume % Volume % Volume %
California Gasoline and gasoline blendstocks 124 51% 130 49% 133 48%Jet fuel 19 8 18 7 18 6 Diesel fuel 54 22 52 20 72 26 Heavy oils, residual products, internally produced fuel and other 47 19 63 24 54 20
Total 244 100% 263 100% 277 100%
Pacific Northwest Gasoline and gasoline blendstocks 34 35% 60 43% 63 38%Jet fuel 24 25 26 19 32 20 Diesel fuel 11 12 23 16 30 18 Heavy oils, residual products, internally produced fuel and other 27 28 30 22 39 24
Total 96 100% 139 100% 164 100%
Mid-Pacific Gasoline and gasoline blendstocks 15 23% 16 23% 16 23%Jet fuel 15 23 17 25 18 25 Diesel fuel 12 19 12 17 11 15 Heavy oils, residual products, internally produced fuel and other 23 35 24 35 26 37
Total 65 100% 69 100% 71 100%
Mid-Continent Gasoline and gasoline blendstocks 59 57% 62 58% 63 56%Jet fuel 10 10 9 8 10 9 Diesel fuel 26 25 27 25 30 26 Heavy oils, residual products, internally produced fuel and other 9 8 10 9 10 9
Total 104 100% 108 100% 113 100%
Total Refining Yield Gasoline and gasoline blendstocks 232 46% 268 46% 275 44%Jet fuel 68 13 70 12 78 12 Diesel fuel 103 20 114 20 143 23 Heavy oils, residual products, internally produced fuel and other 106 21 127 22 129 21
Total 509 100% 579 100% 625 100%
5
Table of Contents
Marine. We time charter four U.S.-flag tankers and four foreign-flag tankers to optimize the transportation of crude oil and refined productswithin our refinery system and ensure adequate shipping capacity. All of the tankers are double-hulled. The foreign-flag tankers, with charters thatexpire between 2011 and 2013, include three Aframax and one Suezmax class vessels. We chartered two new U.S.-flag tankers in 2010 that we useto move crude and products between Alaska, Hawaii and the U.S. West Coast. The U.S.-flag tankers' charters will expire between 2012 and 2013unless we exercise renewal options. Additionally, we time charter seven barges and two tugs over varying terms ending in 2011 to 2016.
Pipelines and Storage. We receive crude oils and ship refined products through owned and third-party pipelines. We own and operate over900 miles of crude oil and product pipelines, located primarily in North Dakota, Montana, Alaska and Hawaii, through which we transport more than355 Mbpd within our refining system.
In September 2007, Gunvor SA ("Gunvor"), formerly Castor Petroleum, entered into a Transportation and Storage Agreement ("TSA") withPetroterminal de Panama, S.A. ("PTP"). Concurrent with the execution of the TSA, Tesoro Panama Company Sociedad Anonima ("TPSA"), awholly owned subsidiary of Tesoro, entered into a Transportation and Storage Agreement ("the TPSA Agreement") with Gunvor. The TSA providesGunvor the use of the Trans-Panama pipeline ("Pipeline") and several tanks at the Atlantic and Pacific terminals for a seven-year period. ThePipeline is 81 miles long, with a capacity exceeding 860 Mbpd, and runs across Panama near the Costa Rican border from Port Chiriqui Grande,Bocas del Toro on the Caribbean to Port Charco Azul on the Pacific coast. The TPSA Agreement with Gunvor allocates and delegates a portion ofGunvor's rights, duties, and obligations set forth in Gunvor's TSA agreement with PTP to TPSA. TPSA has leased access to, and is obligated for,pipeline capacity of more than 100 Mbpd and tank capacity of approximately 4.4 million barrels. The pipeline allows us to deliver crude oilsacquired in Africa, the Atlantic region of South America and the North Sea to refineries in the Pacific basin.
Trucking. We operate a proprietary trucking business at three of our refineries to transport crude oil to the refinery or refined products to ourretail outlets and other customers.
Terminalling. We operate 18 refined products terminals at our refineries and other locations in California, Washington, Alaska, Hawaii, NorthDakota, Utah and Idaho. We also distribute products through third-party terminals and truck racks in our market areas and through purchases andexchange arrangements with other refining and marketing companies.
Tesoro Logistics LP. On January 4, 2011, Tesoro Logistics LP, a wholly owned subsidiary of Tesoro Corporation, filed a registrationstatement on Form S-1 with the SEC in connection with a proposed initial public offering of its common units representing limited partner interests.On February 9, 2011, Tesoro Logistics LP filed an amendment to the initial Form S-1 on Form S-1/A. The number of common units to be offeredand the price range for the offering have not yet been determined. Tesoro Logistics LP was formed by Tesoro Corporation to own, operate, developand acquire crude oil and refined products logistics assets. Headquartered in San Antonio, Texas, Tesoro Logistics LP's initial assets will consist of acrude oil gathering system in the Bakken Shale/Williston Basin area, eight refined products terminals in the western United States, and a crude oiland refined products storage facility and five related short-haul pipelines in Utah.
At the date of this report, the registration statement is not effective. The completion of the offering is subject to numerous conditions,including market conditions, and we can provide no assurance that it will be successfully completed. The securities offered under the registrationstatement may not be sold, nor may offers to buy be accepted prior to the time that the registration statement becomes effective. The informationcontained in this Form 10-K with respect to this offering shall not constitute an offer to sell or a solicitation of an offer to buy these securities.
California Refineries
Golden Eagle
Refining. Our 166 Mbpd Golden Eagle refinery is located in Martinez, California on approximately 2,200 acres about 30 miles east ofSan Francisco. We source crude oil for our Golden Eagle refinery from California, Alaska and foreign locations. The Golden Eagle refinery alsoprocesses intermediate feedstocks. The refinery's major upgrading units include fluid catalytic cracking, delayed coking, hydrocracking, naphthareforming, vacuum distillation, hydrotreating and alkylation units. The refinery produces a high proportion of transportation fuels, including cleaner-burning California Air Resources Board ("CARB") gasoline and CARB
6
Table of Contents
diesel fuel, as well as conventional gasoline and diesel fuel. The refinery also produces heavy fuel oils, liquefied petroleum gas and petroleum coke.
Transportation. Our Golden Eagle refinery's two marine terminals have access through the San Francisco Bay that enables us to receive crudeoil and ship refined products. In addition, the refinery can receive crude oil through a third-party marine terminal at Martinez. We also receiveCalifornia crude oils and ship refined products from the refinery through third-party pipelines.
Terminals. We operate refined products terminals at Stockton, California and at the refinery. We distribute refined products through third-party terminals in our market areas and through purchase and exchange arrangements with other refining and marketing companies. We also leasethird-party clean product tanks with access to the San Francisco Bay.
Los Angeles
Refining. Our 97 Mbpd Los Angeles refinery is located in Wilmington, California on approximately 300 acres about 20 miles south of LosAngeles. We source crude oil for our Los Angeles refinery from California as well as foreign locations. The Los Angeles refinery also processesintermediate feedstocks. The refinery's major upgrading units include fluid catalytic cracking, delayed coking, hydrocracking, vacuum distillation,hydrotreating, reforming, butane isomerization and alkylation units. The refinery produces a high proportion of transportation fuels, includingCARB gasoline and CARB diesel fuel, as well as conventional gasoline, diesel fuel and jet fuel. The refinery also produces heavy fuel oils, liquefiedpetroleum gas and petroleum coke.
Transportation. Our Los Angeles refinery leases a marine terminal at the Port of Long Beach that enables us to receive crude oil and shiprefined products. The refinery can also receive crude oil from the San Joaquin Valley and the Los Angeles Basin through third-party pipelines.
Terminals. We operate a refined products terminal at the Los Angeles refinery and distribute refined products through third-party terminals inour market areas and through purchases and exchange arrangements with other refining and marketing companies. We also lease refined productstorage tanks at third-party terminals in Southern California, the majority of which have access to marine terminals.
Pacific Northwest Refineries
Washington
Refining. Our 120 Mbpd Anacortes, Washington refinery is located in northwest Washington on approximately 900 acres about 70 miles northof Seattle. We source our Washington refinery's crude oil from Alaska, Canada and other foreign locations. The Washington refinery also processesintermediate feedstocks, primarily heavy vacuum gas oil, produced by some of our other refineries and purchased in the spot-market from third-parties. The refinery's major upgrading units include fluid catalytic cracking, butane isomerization, alkylation, hydrotreating, vacuum distillation,deasphalting and naphtha reforming units, which enable us to produce a high proportion of transportation fuels, such as gasoline including CARBgasoline and components for CARB gasoline, diesel fuel and jet fuel. The refinery also produces heavy fuel oils, liquefied petroleum gas andasphalt.
On April 2, 2010, the naphtha hydrotreater unit at our Washington refinery was involved in a fire. Subsequent to the incident, refineryprocessing was temporarily shut down until after the unit reconstruction was completed. The Washington refinery resumed operations at plannedrates in November 2010.
Transportation. Our Washington refinery receives Canadian crude oil through a third-party pipeline originating in Edmonton, Alberta,Canada. We receive other crude oils through our Washington refinery's marine terminal. The refinery ships transportation fuels including gasoline,jet fuel and diesel fuel through a third-party pipeline system, which serves western Washington and Portland, Oregon. We also deliver refinedproducts through our marine terminal via ships and barges to West Coast and Pacific Rim markets.
Terminals. We operate a distillate terminal at our Washington refinery and operate refined products terminals at Port Angeles and Vancouver,Washington, all of which are supplied primarily by our refinery. We also distribute refined products through third-party terminals in our marketareas, and through purchases and exchange arrangements with other refining and marketing companies.
7

Table of Contents
Alaska
Refining. Our 72 Mbpd Alaska refinery is located on the Cook Inlet near Kenai on approximately 450 acres about 60 miles southwest ofAnchorage. Our Alaska refinery processes crude oil from Alaska and, to a lesser extent, foreign locations. The refinery's major upgrading unitsinclude vacuum distillation, distillate hydrocracking, hydrotreating, naphtha reforming, diesel desulfurizing and light naphtha isomerization unitswhich produce transportation fuels, including gasoline and gasoline blendstocks, jet fuel and diesel fuel, as well as other products, including heatingoil, heavy fuel oils, liquefied petroleum gas and asphalt.
Transportation. We receive crude oil into our Kenai marine terminal by tanker and through our owned and operated crude oil pipeline. Ourcrude oil pipeline is a 24-mile common-carrier pipeline connected to the eastside Cook Inlet oil field. We also own and operate a common-carrierrefined products pipeline that runs from the Alaska refinery to our two terminal facilities in Anchorage and to the Anchorage International Airport.This 69-mile pipeline has the capacity to transport approximately 48 Mbpd of refined products and allows us to transport gasoline, diesel fuel and jetfuel. Both of our owned pipelines are subject to regulation by various federal, state and local agencies, including the Federal Energy RegulatoryCommission ("FERC"). We also deliver refined products through our Kenai marine terminal and from the Port of Anchorage marine facility tocustomers via ships and barges.
Terminals. We operate refined products terminals at Nikiski and Anchorage, which are supplied by our Alaska refinery. We also distributerefined products through a third-party terminal which is supplied through an exchange arrangement with another refining company.
Mid-Pacific Refinery
Hawaii
Refining. Our 94 Mbpd Hawaii refinery is located in Kapolei on approximately 130 acres about 20 miles west of Honolulu. We supply therefinery with crude oil from Southeast Asia, the Middle East, Russia and other foreign sources. The refinery's major upgrading units include vacuumdistillation, hydrocracking, hydrotreating, visbreaking and naphtha reforming units which produce gasoline and gasoline blendstocks, jet fuel, dieselfuel, heavy fuel oils, liquefied petroleum gas and asphalt.
Transportation. We transport crude oil to Hawaii in tankers, which discharge through our single-point mooring, approximately two milesoffshore from the refinery. Our three underwater pipelines from the single-point mooring allow crude oil and refined products to be transferred toand from the refinery. We own and operate a refined products pipeline from our Hawaii refinery to our Sand Island terminal and third-partyterminals on the island of Oahu. Furthermore, our refined products pipelines connect the Hawaii refinery to Barbers Point Harbor, approximatelythree miles away, where refined products are loaded on ships and barges to transport to the neighboring islands.
Terminals. We operate refined products terminals on Maui and on the Big Island of Hawaii and operate a diesel terminal on Oahu. We alsohave an aviation fuel terminal in Kauai, and distribute refined products from our refinery to customers through third-party terminals in our marketareas.
Mid-Continent Refineries
North Dakota
Refining. Our 58 Mbpd North Dakota refinery is located on the Missouri River near Mandan on approximately 950 acres. We supply therefinery primarily with crude oil produced from the Williston Basin gathered and transported by our crude oil pipeline system. The refinery also hasthe ability to access other crude oil supplies, including Canadian crude oil. The refinery's major upgrading units include fluid catalytic cracking,naphtha reforming, hydrotreating and alkylation units which produce transportation fuels, including gasoline, diesel fuel and jet fuel, as well as otherproducts, including heavy fuel oils and liquefied petroleum gas.
8
Table of Contents
Transportation. We own a crude oil pipeline system, consisting of an approximate 23 Mbpd truck-based crude oil gathering operation andapproximately 700 miles of trunkline and gathering pipelines and related storage assets with the current capacity to deliver up to 70 Mbpd to ourNorth Dakota refinery. This system gathers and transports crude oil produced from the Williston Basin, including production from the Bakken Shaleformation, to our refinery. We also have the ability to transport crude oil from Canada on this system through third-party pipeline connections. Ourpipeline system is also able to transport crude oil to other points in the region where there is additional demand. This pipeline system is a commoncarrier line subject to regulation by various federal, state and local agencies, including the FERC. We distribute a significant portion of our refinery'sproduction through a third-party refined products pipeline system which serves various areas from Mandan, North Dakota to Minneapolis,Minnesota. Most of the gasoline and distillate products from our refinery can be shipped through that pipeline system to third-party terminals.
Terminals. We operate a refined products terminal at the North Dakota refinery. The terminal consists of a truck loading rack located withinthe refinery gates. The truck loading rack consists of three light product bays and one residual fuel bay, each connected to pipelines that transportproduct from the refinery tank farm to the terminal. We also distribute refined products through a third-party pipeline system which connects tothird-party terminals in our market areas.
Utah
Refining. Our 58 Mbpd Utah refinery is located in Salt Lake City on approximately 150 acres. Our Utah refinery processes crude oilsprimarily from Utah, Colorado, Wyoming and Canada. The refinery's major upgrading units include fluid catalytic cracking, naphtha reforming,alkylation and hydrotreating units which produce transportation fuels, including gasoline, diesel fuel and jet fuel, as well as other products, includingheavy fuel oils and liquefied petroleum gas.
Transportation. Our Utah refinery receives crude oil primarily through third-party pipelines from oil fields in Utah, Colorado, Wyoming andCanada. We use proprietary trucking to supply the remainder of our Utah refinery's crude oil requirements. We distribute the refinery's productionthrough a system of both owned and third-party terminals and third-party pipeline systems, primarily in Utah, Idaho and eastern Washington, withsome refined products delivered by truck to Nevada and Wyoming.
Terminals. We operate a refined products terminal adjacent to our refinery. The terminal has the ability to receive refined products, includinggasoline, diesel and jet fuel from our refinery through our proprietary interconnecting pipelines that run between two facilities. Refined productsreceived at this terminal are sold locally and regionally by both us and third-parties through our truck loading rack. We also own and operate refinedproducts terminals in Boise and Burley, Idaho that are supplied by pipeline from our Utah refinery.
Wholesale Marketing and Refined Product Distribution
We sell refined products including gasoline and gasoline blendstocks, jet fuel, diesel fuel, heavy fuel oils and residual products in both thebulk and wholesale markets. We currently sell over 250 Mbpd in the wholesale market primarily through independent unbranded distributors thatsell refined products purchased from us through more than 60 owned and third-party terminals. Our bulk sales are primarily to independentunbranded distributors, other refining and marketing companies, utilities, railroads, airlines and marine and industrial end-users. These products aredistributed by pipelines, ships, barges, railcars and trucks. Our sales include refined products that we manufacture, purchase or receive throughexchange arrangements. Our refined product sales, including intersegment sales to our retail operations, consisted of (in Mbpd):
2010 2009 2008
Refined Product Sales Gasoline and gasoline blendstocks 288 306 326 Jet fuel 92 84 92 Diesel fuel 116 121 144 Heavy oils, residual products and other 76 85 94
Total Refined Product Sales 572 596 656
Gasoline and Gasoline Blendstocks. We sell gasoline and gasoline blendstocks in both the bulk and wholesale markets in the western UnitedStates. The demand for gasoline is seasonal in many of these markets, with lowest demand typically during the winter months. We sell gasoline towholesale customers and several other refining and marketing companies under various supply agreements and exchange arrangements. We sell, atwholesale, to unbranded distributors and high-volume retailers, and we distribute refined product through owned and third-party terminals.
9
Table of Contents
Jet Fuel. We supply jet fuel to passenger and cargo airlines at airports in Alaska, Hawaii, California, Washington, Utah and other westernstates. We also supply jet fuel to the U.S. military from our refineries in Alaska, Hawaii and North Dakota.
Diesel Fuel. We sell diesel fuel primarily on a wholesale basis for marine, transportation, industrial and agricultural use. We sell lesseramounts to end-users through marine terminals and for power generation in Hawaii and Washington. We are able to manufacture Ultra-Low SulfurDiesel ("ULSD") at all of our refineries and we currently are the sole producer of ULSD in both Alaska and Hawaii.
Heavy Fuel Oils and Residual Products. We sell heavy fuel oils to other refiners, third-party resellers, electric power producers and marineand industrial end-users. Our refineries supply substantially all of the marine fuels that we sell through facilities at Port Angeles, Seattle, andTacoma, Washington, and Portland, Oregon, and through our refinery terminals in Washington, Alaska and Hawaii. Our Golden Eagle and LosAngeles refineries produce petroleum coke that we sell primarily to industrial end-users. Tesoro is also a key supplier of liquid asphalt for pavingand construction companies in Washington, Alaska and Hawaii.
Sales of Purchased Products. In the normal course of business we purchase refined products manufactured by others for resale to ourcustomers to meet local market demands. We purchase these refined products, primarily gasoline, jet fuel, diesel fuel and industrial and marine fuelblendstocks mainly in the spot market. Our gasoline and diesel fuel purchase and resale transactions are principally on the U.S. West Coast. Ourprimary jet fuel resale activity consists of supplying markets in Alaska, California, Washington, Hawaii and Utah. We also purchase for resale alesser amount of gasoline and other refined products for sales outside of our refineries' markets.
10
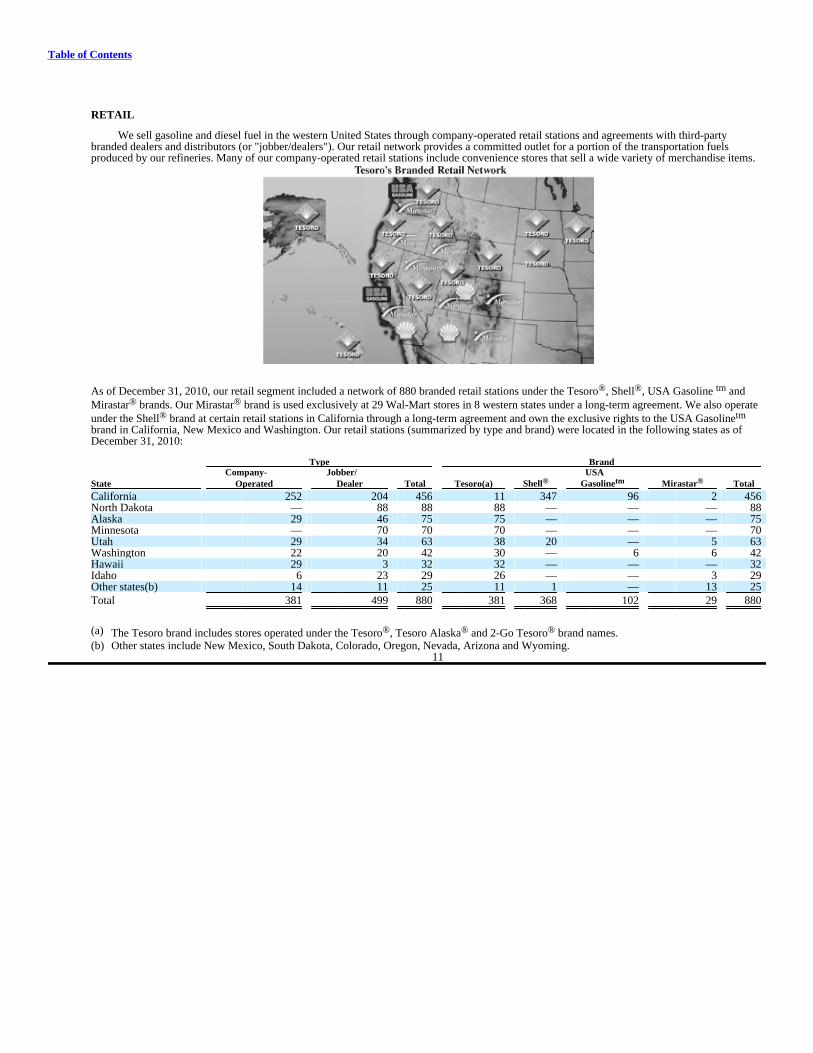
Table of Contents
RETAIL
We sell gasoline and diesel fuel in the western United States through company-operated retail stations and agreements with third-partybranded dealers and distributors (or "jobber/dealers"). Our retail network provides a committed outlet for a portion of the transportation fuelsproduced by our refineries. Many of our company-operated retail stations include convenience stores that sell a wide variety of merchandise items.
As of December 31, 2010, our retail segment included a network of 880 branded retail stations under the Tesoro®, Shell®, USA Gasoline tm andMirastar® brands. Our Mirastar® brand is used exclusively at 29 Wal-Mart stores in 8 western states under a long-term agreement. We also operateunder the Shell® brand at certain retail stations in California through a long-term agreement and own the exclusive rights to the USA Gasolinetm
brand in California, New Mexico and Washington. Our retail stations (summarized by type and brand) were located in the following states as ofDecember 31, 2010:
Type Brand Company- Jobber/ USA State Operated Dealer Total Tesoro(a) Shell® Gasolinetm Mirastar® Total
California 252 204 456 11 347 96 2 456 North Dakota — 88 88 88 — — — 88 Alaska 29 46 75 75 — — — 75 Minnesota — 70 70 70 — — — 70 Utah 29 34 63 38 20 — 5 63 Washington 22 20 42 30 — 6 6 42 Hawaii 29 3 32 32 — — — 32 Idaho 6 23 29 26 — — 3 29 Other states(b) 14 11 25 11 1 — 13 25
Total 381 499 880 381 368 102 29 880
(a) The Tesoro brand includes stores operated under the Tesoro®, Tesoro Alaska® and 2-Go Tesoro® brand names.
(b) Other states include New Mexico, South Dakota, Colorado, Oregon, Nevada, Arizona and Wyoming. 11

Table of Contents
The following table summarizes our retail operations:
2010 2009 2008
Fuel Revenues (in millions)(a) Company-operated $ 2,196 $ 1,877 $ 2,620 Jobber/dealer 1,387 1,123 1,564
Total Fuel Revenues $ 3,583 $ 3,000 $ 4,184
Number of Branded Retail Stations (end of year) Company-operated 381 387 389 Jobber/dealer 499 499 490
Total Retail Stations 880 886 879
Average Number of Branded Retail Stations (during the year) Company-operated 383 388 422 Jobber/dealer 499 487 489
Total Average Retail Stations 882 875 911
Fuel Sales (millions of gallons)(a) Company-operated 739 746 786 Jobber/dealer 597 583 568
Total Fuel Sales 1,336 1,329 1,354
(a) We have reclassified fuel revenues and fuel sale volumes associated with retail stations where Tesoro delivers the fuel, but the sites are ownedand operated by independent dealers from company-operated to jobber/dealer to conform to the current presentation. The fuel revenues relatedto these stations were $561 million and $788 million for the years ended December 31, 2009 and 2008, respectively. The fuel sales volumesrelated to these stations were 281 million gallons and 286 million gallons for the years ended December 31, 2009 and 2008, respectively.
COMPETITION
The refining industry is highly competitive. Our competitors include a number of companies that have greater financial and other resources.We compete on the world market for the crude oil and feedstocks we process, and then we compete for the customers who purchase our refinedproducts. The availability and cost of crude oil and other feedstocks, as well as the prices of the products we produce, are heavily influenced byglobal supply and demand dynamics. We obtain all of our crude oil from third-party sources and compete with other refiners for those limitedsupplies. We compete with a number of major, integrated multi-national oil companies who can supply their refineries with crude oil from their ownproduction.
We sell gasoline through our network of retail stations as well as on a wholesale basis. We sell most of our distillate production throughwholesale channels. We compete with other refiners and with importers for customers in most of our market areas. Competition and concentrationsspecific to each of our refineries are as follows:
• Our Golden Eagle, Los Angeles and Washington refineries compete with several refineries in the contiguous west coast states. Whenregional demand exceeds supply, products are imported to the U.S. West Coast from other parts of the country and the world. These aretypically pipeline shipments from the U.S. Gulf Coast but can also include imports from foreign sources such as the Far East, Europe andCanada.
• Our Alaska refinery competes with three other in-state refineries that together have a crude oil processing capacity of approximately 294Mbpd. It also competes with refineries on the U.S. West Coast. Our jet fuel sales in Alaska are concentrated in Anchorage, where we areone of the principal suppliers at the Anchorage International Airport.
12

Table of Contents
• Our Hawaii refinery competes primarily with one other in-state refinery, also located in Kapolei. It is owned by a major integrated oilcompany and has a crude oil capacity of approximately 54 Mbpd. All crude oil processed in Hawaii is from out of state. Product importsfrom the U.S. mainland and foreign sources are also required to meet the state's fuel demand. Our jet fuel sales are concentrated at theHonolulu International Airport, where we are the principal supplier. We serve five airports on other Hawaiian islands and compete withother suppliers for U.S. military contracts.
• Our North Dakota refinery is the only refinery in the state and primarily competes with refineries in Wyoming, Montana, the Midwest andpipeline supply from the U.S. Gulf Coast region. The Midwest region ranks second in crude oil demand in the United States and isdependent on crude oil imports, primarily from Canada.
• Our Utah refinery is the largest of five refineries located in Utah. The other refineries have a combined capacity to process approximately110 Mbpd of crude oil. These five refineries collectively supply a high proportion of the gasoline and distillate products consumed in thestates of Utah and Idaho, with additional supplies provided from refineries in surrounding states.
Our retail marketing operations compete with other independent marketers, integrated oil companies and high-volume retailers. We sellgasoline in Alaska, California, Hawaii, North Dakota, Utah, Washington and other western states through a network of company-operated retailstations and branded and unbranded jobber/dealers. Competitive factors that affect retail marketing include product price, station appearance,location and brand awareness. Large national retailers as well as regional retailers continue to enter the fuel retail business. Many of thesecompetitors are substantially larger than we are and through their greater resources may be better able to withstand volatile market conditions andlower profitability.
GOVERNMENT REGULATION AND LEGISLATION
Environmental Controls and Expenditures
All of our operations, like those of other companies engaged in similar businesses, are subject to extensive and frequently changing federal,state, regional and local laws, regulations and ordinances relating to the protection of the environment, including those governing emissions ordischarges to the land, air and water, the handling and disposal of solid and hazardous wastes and the remediation of contamination. While webelieve our facilities are in substantial compliance with current requirements, we will continue to engage in efforts to meet new legislative andregulatory requirements applicable to our operations. Compliance with these laws and regulations will require us to make significant expenditures.For example, the U.S. Environmental Protection Agency ("EPA") has proposed multiple regulations to control greenhouse gas emissions under thefederal Clean Air Act. Concurrent to this activity, the U.S. Congress may also consider legislation regarding greenhouse gas emissions in 2011. Thefederal Clean Air Act mandates the blending of increasing amounts of renewable fuels annually in the supply of transportation fuels useddomestically. This use of renewable fuels is required of all manufacturers of transportation fuels sold domestically on a prorated basis. The EPAimplements the renewable fuel standard ("RFS") through regulation and requires transportation fuel manufacturers to provide proof of purchase ofthese renewable fuels. The costs associated with RFS compliance fluctuate with market dynamics and are not certain.
The impact of these regulatory and legislative developments, if enacted or implemented, or both, is likely to result in increased compliancecosts, additional operating restrictions on our business and an increase in the cost of the products we manufacture. Depending on market conditions,we will attempt to pass these increased costs to consumers. If, however, that is not possible, the changes could have an adverse impact on ourfinancial position, results of operations, and liquidity. We cannot currently determine the amounts of such future impacts. For additional informationregarding our environmental matters see "Environmental and Other Matters" in Management's Discussion and Analysis of Financial Condition andResults of Operations in Item 7.
13

Table of Contents
Oil Spill Prevention and Response
We operate in environmentally sensitive coastal waters, where tanker, pipeline and other petroleum product transportation operations areregulated by federal, state and local agencies and monitored by environmental interest groups. The transportation of crude oil and refined productsover water involves risk and subjects us to the provisions of the Federal Oil Pollution Act of 1990 and related state requirements, which require thatmost oil refining, transport and storage companies maintain and update various oil spill prevention and oil spill contingency plans. We havesubmitted these plans and received federal and state approvals necessary to comply with the Federal Oil Pollution Act of 1990 and relatedregulations. We frequently review and modify our oil spill prevention plans and procedures to prevent crude oil and refined product releases and tominimize potential impacts should a release occur.
We currently use time charter tankers to ship crude oil from foreign and domestic sources to our California, Mid-Pacific and Pacific-Northwestrefineries. The tanker owners contract with Federally Certified Oil Spill Response Organizations ("OSROs") to comply with federal, state and localrequirements, except in Alaska where we contract with the OSROs. The OSROs are capable of responding to an oil spill equal to the greatest tankervolume delivering crude oil to our refineries. Those volumes range from 350,000 barrels at our California refineries to one million barrels at ourHawaii refinery. We maintain our own spill-response resources to mitigate the impact of a spill from a tanker at our refineries until an OSRO candeploy its resources.
We have entered into spill-response contracts with various OSROs to provide spill-response services, if required, to respond to a spill of oiloriginating from our facilities. We have spill-response agreements in Alaska with Cook Inlet Spill Prevention and Response, Incorporated and withAlyeska Pipeline Service Company. We have a spill-response services agreement in Hawaii with Clean Islands Council. We also have entered intocontracts with Marine Spill Response Corporation for Hawaii, the San Francisco Bay, Puget Sound, the Port of Los Angeles and the Port of LongBeach, Clean Rivers Cooperative, Inc. for the Columbia River, and Bay West, Inc. in our Mid-Continent region. These OSROs are capable ofresponding to an oil spill on water equal to the greatest volume above ground storage tank at our facilities. Those volumes range from 50,000 to600,000 barrels. We also contract with two spill-response organizations outside the U.S. to support our shipments in foreign waters. In addition, wecontract with various spill-response specialists to ensure appropriate expertise is available for any contingency. We believe these contracts providethe additional services necessary to meet or exceed all regulatory spill-response requirements and support our commitment to environmentalstewardship.
The services provided by the OSROs principally consist of operating response-related equipment, managing certain aspects of a response andproviding technical expertise. The OSROs provide various resources in response to an oil spill. The resources include dedicated vessels that haveskimming equipment to recover oil, storage barges to temporarily store recovered oil, containment boom to control the spread of oil on water andland and to protect shorelines, and various pumps and other equipment supporting oil recovery efforts and the protection of natural resources. TheOSROs have full-time personnel and contract with third-parties to provide additional personnel when needed.
As a general matter, our agreements with these organizations do not contain specific physical or financial limitations. General physicallimitations of these organizations would include the geographical area for which services are available and the amount of resources available at theinitiation of a request for services or the duration of response and recovery efforts.
Additionally, we require all chartered vessels used for the transportation of crude oil and heavy products over water to be double-hulled. Allvessels used by us to transport crude oil and refined products over water are examined or evaluated and subject to our approval prior to their use.
Regulation of Pipelines
Our crude oil pipeline system in North Dakota and our pipeline systems in Alaska are common carriers subject to regulation by variousfederal, state and local agencies, including the FERC under the Interstate Commerce Act. The Interstate Commerce Act provides that, to be lawful,the rates charged by common carrier petroleum pipelines must be "just and reasonable" and not unduly discriminatory. Portions of our pipelines areregulated by the U.S. Department of Transportation in Alaska, California, Hawaii, North Dakota and Utah.
The intrastate operations of our North Dakota crude oil pipeline system are subject to regulation by the North Dakota Public ServicesCommission. The intrastate operations of our Alaska pipelines are subject to regulation by the Regulatory Commission of Alaska. Like the FERC,the state regulatory authorities require that we notify shippers of proposed tariff increases to provide the shippers an opportunity to protest theincreases. The North Dakota Public Services Commission also files with the state authorities copies of interstate tariff charges filed with the FERC.In addition to challenges to new or proposed rates, challenges to intrastate rates that have already become effective are permitted by complaint of aninterested person or by independent action of the appropriate regulatory authority.
14
Table of Contents
WORKING CAPITAL
We fund our business operations through a combination of available cash and equivalents and cash flows generated from operations. Inaddition, our revolving lines of credit are available for additional working capital needs. For additional information regarding working capital see the"Capital Resources and Liquidity" section in Management's Discussion and Analysis of Financial Condition and Results of Operations in Item 7.
SEASONALITY
Generally, demand for gasoline is higher during the spring and summer months than during the fall and winter months in most of our marketsdue to seasonal changes in highway traffic. As a result, our operating results for the first and fourth quarters are generally lower than for those in thesecond and third quarters.
EMPLOYEES
At December 31, 2010, we had approximately 5,300 full-time employees — approximately 1,350 of whom are covered by collectivebargaining agreements. The agreements expire on February 1, 2012 for approximately 1,100 employees and on May 1, 2012 for approximately250 employees. We consider our relations with our employees to be satisfactory.
PROPERTIES
Our principal properties are described above under the captions "Refining" and "Retail." We believe that our properties and facilities areadequate for our operations and that our facilities are adequately maintained. We are the lessee under a number of cancellable and noncancellableleases for certain properties, including office facilities, retail facilities, ship charters, barges and equipment used in the storage, transportation andproduction of feedstocks and refined products. We conduct our retail business under the Tesoro®, Shell®, USA Gasolinetm and Mirastar® brandsthrough a network of 880 retail stations, of which 381 are company-operated. See Notes J and N to our consolidated financial statements in Item 8.
15

Table of Contents
GLOSSARY OF TERMS
Alkylation — A process that chemically combines isobutane with other hydrocarbons through the control of temperature and pressure in thepresence of an acid catalyst. This process produces alkylates, which have a high octane value and are blended into gasoline to improve octanevalues.
API — American Petroleum Institute — the main U.S trade association for the oil and natural gas industry.
API Gravity — A scale for denoting the lightness or heaviness of crude oils and other liquid hydrocarbons. Calibrated in API degrees (ordegrees API), it is used universally to express a crude oil's relative density in an inverse measure — the lighter the crude, the higher the API gravity,and vice versa.
CARB — California Air Resources Board — Gasoline and diesel fuel sold in the state of California are regulated by CARB and require stricterquality and emissions reduction performance than required by other states.
Cracking — The process of breaking down larger hydrocarbon molecules into smaller molecules, using catalysts and/or elevated temperaturesand pressures.
Deasphalting — A solvent extraction process of recovering higher-value oils from refining residues.
Delayed Coking — A process by which the heaviest crude oil fractions can be thermally cracked under conditions of elevated temperatures toproduce both refined products and petroleum coke.
Distillate Hydrocracking — A catalytic hydrocracking process designed to produce primarily diesel fuel and jet fuel.
Exchange Arrangement — An agreement providing for the delivery of crude oil or refined products to a third-party, in exchange for thedelivery of crude oil or refined products from the third-party.
Fluid Catalytic Cracking — Catalytic cracking is the refining process of breaking down larger, heavier, and more complex hydrocarbonmolecules into simpler and lighter molecules through the use of a catalytic agent to increase the yield of gasoline. Fluid catalytic cracking uses acatalyst in the form of very fine particles, which behave as a fluid when aerated with a vapor.
Gross Refining Margin — The margin on products manufactured and purchased, including those sold to our retail segment. Gross refiningmargin is calculated as revenues less costs of feedstocks, purchased refined products, transportation and distribution.
Heavy Crude Oil — Crude oil with an API gravity of 24 degrees or less. Heavy crude oils are generally sold at a discount to lighter crude oils.
Heavy Fuel Oils, Residual Products, Internally Produced Fuel and Other — Products other than gasoline, jet fuel and diesel fuel produced inthe refining process. These products include residual fuels, gas oils, propane, petroleum coke, asphalt and internally produced fuel.
Hydrocracking — The process of using a catalyst to crack heavy hydrocarbon molecules in the presence of hydrogen. Major products fromhydrocracking are jet fuel, naphtha, propane and gasoline components such as butane.
Hydrotreating — The process of removing sulfur from refined products in the presence of catalysts and substantial quantities of hydrogen toreduce sulfur dioxide emissions that result from the use of the products.
Isomerization — A process that alters the fundamental arrangement of atoms in the molecule without adding or removing anything from theoriginal material. The process is used to convert normal butane into isobutane and normal pentane into isopentane and hexane into isohexane. Bothisopentane and isohexane are high-octane gasoline components.
Jobber/Dealer Stations — Retail stations owned by third-parties that sell products purchased from or through us and carry one of our brands.
Light Crude Oil — Crude oil with an API gravity greater than 24 degrees. Light crude oils are generally sold at a premium to heavy crude oils.
Manufacturing Costs — Costs associated directly with the manufacturing process including cash operating expenses, but excludingdepreciation and amortization.
16

Table of Contents
Mbpd — Thousand barrels per day.
Naphtha — Refined product used as a gasoline blending component, a feedstock for reforming and as a petrochemical feedstock.
Refining Yield — Volumes of product produced from crude oils and feedstocks.
Reforming — A process using controlled heat and pressure with catalysts to rearrange certain hydrocarbon molecules into petrochemicalfeedstocks and higher octane stocks suitable for blending into finished gasoline.
Retail Fuel Margin — The margin on fuel products sold through our retail segment calculated as revenues less cost of sales. Cost of sales infuel margin are based on purchases from our refining segment and third-parties using average bulk market prices adjusted for transportation andother differentials.
Throughput — The quantity of crude oil and other feedstocks processed at a refinery measured in barrels per day.
Turnaround — The scheduled shutdown of a refinery processing unit for significant overhaul and refurbishment. Turnaround expenditures arecapitalized and amortized over the period of time until the next planned turnaround of the unit.
Ultra-Low Sulfur Diesel (ULSD) — Diesel fuel produced with lower sulfur content to lower emissions, which has been required for on-roaduse in the U.S. beginning in 2006.
Vacuum Distillation — Distillation under reduced pressure which lowers the boiling temperature of crude oils in order to distill crude oilcomponents that have high boiling points.
Visbreaking — A thermal cracking process in which heavy atmospheric or vacuum unit residues are cracked at moderate temperatures toincrease production of distillate products and reduce viscosity of the distillate residues.
17
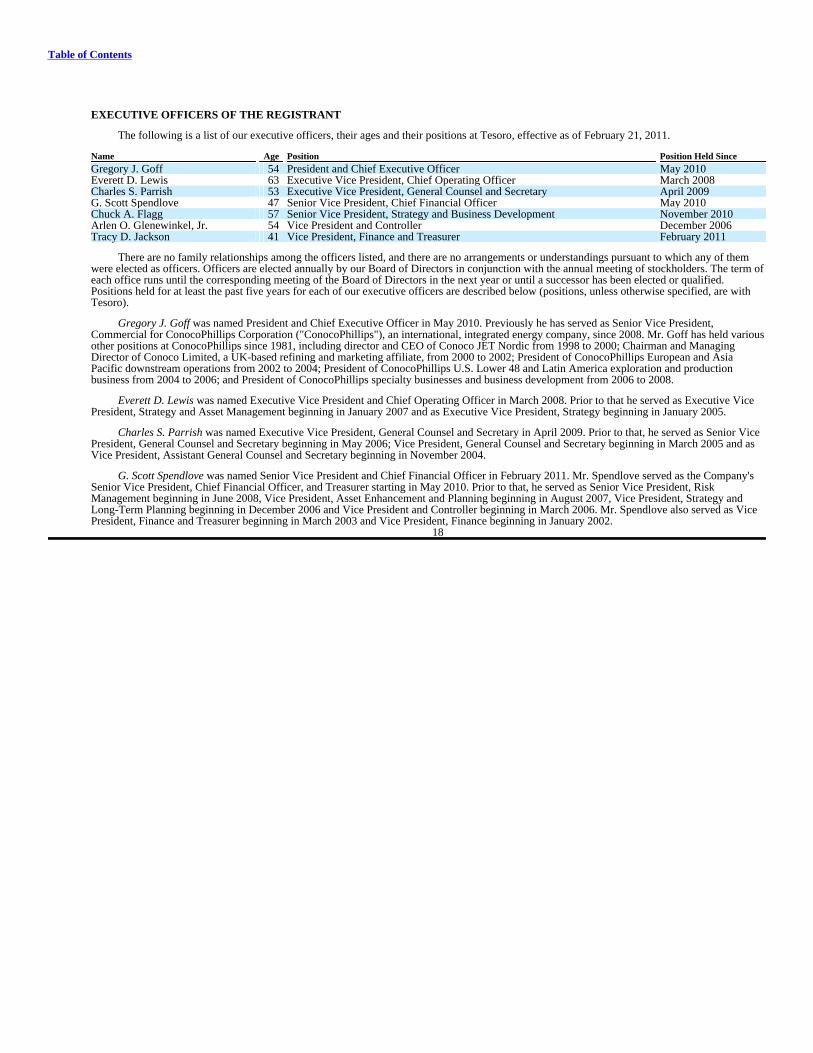
Table of Contents
EXECUTIVE OFFICERS OF THE REGISTRANT
The following is a list of our executive officers, their ages and their positions at Tesoro, effective as of February 21, 2011.
Name Age Position Position Held Since
Gregory J. Goff 54 President and Chief Executive Officer May 2010Everett D. Lewis 63 Executive Vice President, Chief Operating Officer March 2008Charles S. Parrish 53 Executive Vice President, General Counsel and Secretary April 2009G. Scott Spendlove 47 Senior Vice President, Chief Financial Officer May 2010Chuck A. Flagg 57 Senior Vice President, Strategy and Business Development November 2010Arlen O. Glenewinkel, Jr. 54 Vice President and Controller December 2006Tracy D. Jackson 41 Vice President, Finance and Treasurer February 2011
There are no family relationships among the officers listed, and there are no arrangements or understandings pursuant to which any of themwere elected as officers. Officers are elected annually by our Board of Directors in conjunction with the annual meeting of stockholders. The term ofeach office runs until the corresponding meeting of the Board of Directors in the next year or until a successor has been elected or qualified.Positions held for at least the past five years for each of our executive officers are described below (positions, unless otherwise specified, are withTesoro).
Gregory J. Goff was named President and Chief Executive Officer in May 2010. Previously he has served as Senior Vice President,Commercial for ConocoPhillips Corporation ("ConocoPhillips"), an international, integrated energy company, since 2008. Mr. Goff has held variousother positions at ConocoPhillips since 1981, including director and CEO of Conoco JET Nordic from 1998 to 2000; Chairman and ManagingDirector of Conoco Limited, a UK-based refining and marketing affiliate, from 2000 to 2002; President of ConocoPhillips European and AsiaPacific downstream operations from 2002 to 2004; President of ConocoPhillips U.S. Lower 48 and Latin America exploration and productionbusiness from 2004 to 2006; and President of ConocoPhillips specialty businesses and business development from 2006 to 2008.
Everett D. Lewis was named Executive Vice President and Chief Operating Officer in March 2008. Prior to that he served as Executive VicePresident, Strategy and Asset Management beginning in January 2007 and as Executive Vice President, Strategy beginning in January 2005.
Charles S. Parrish was named Executive Vice President, General Counsel and Secretary in April 2009. Prior to that, he served as Senior VicePresident, General Counsel and Secretary beginning in May 2006; Vice President, General Counsel and Secretary beginning in March 2005 and asVice President, Assistant General Counsel and Secretary beginning in November 2004.
G. Scott Spendlove was named Senior Vice President and Chief Financial Officer in February 2011. Mr. Spendlove served as the Company'sSenior Vice President, Chief Financial Officer, and Treasurer starting in May 2010. Prior to that, he served as Senior Vice President, RiskManagement beginning in June 2008, Vice President, Asset Enhancement and Planning beginning in August 2007, Vice President, Strategy andLong-Term Planning beginning in December 2006 and Vice President and Controller beginning in March 2006. Mr. Spendlove also served as VicePresident, Finance and Treasurer beginning in March 2003 and Vice President, Finance beginning in January 2002.
18

Table of Contents
Chuck A. Flagg was named Senior Vice President, Strategy and Business Development in November 2010. Prior to being in his currentposition, he served as Senior Vice President, System Optimization beginning in February 2005. He joined Tesoro in January 2005 as Senior VicePresident of Planning and Optimization.
Arlen O. Glenewinkel, Jr. was named Vice President and Controller in December 2006. Prior to that, he served as Vice President, EnterpriseRisk beginning in April 2005 and Vice President, Internal Audit, from August 2002 to April 2005.
Tracy D. Jackson was named Vice President, Finance and Treasurer in February 2011. Ms. Jackson served as the Company's Vice President,Finance starting in November 2010 and the Vice President of Internal Audit beginning in May 2007. Prior to that, she served as Executive Directorof Internal Audit at Valero Corporation beginning in May 2005.
19
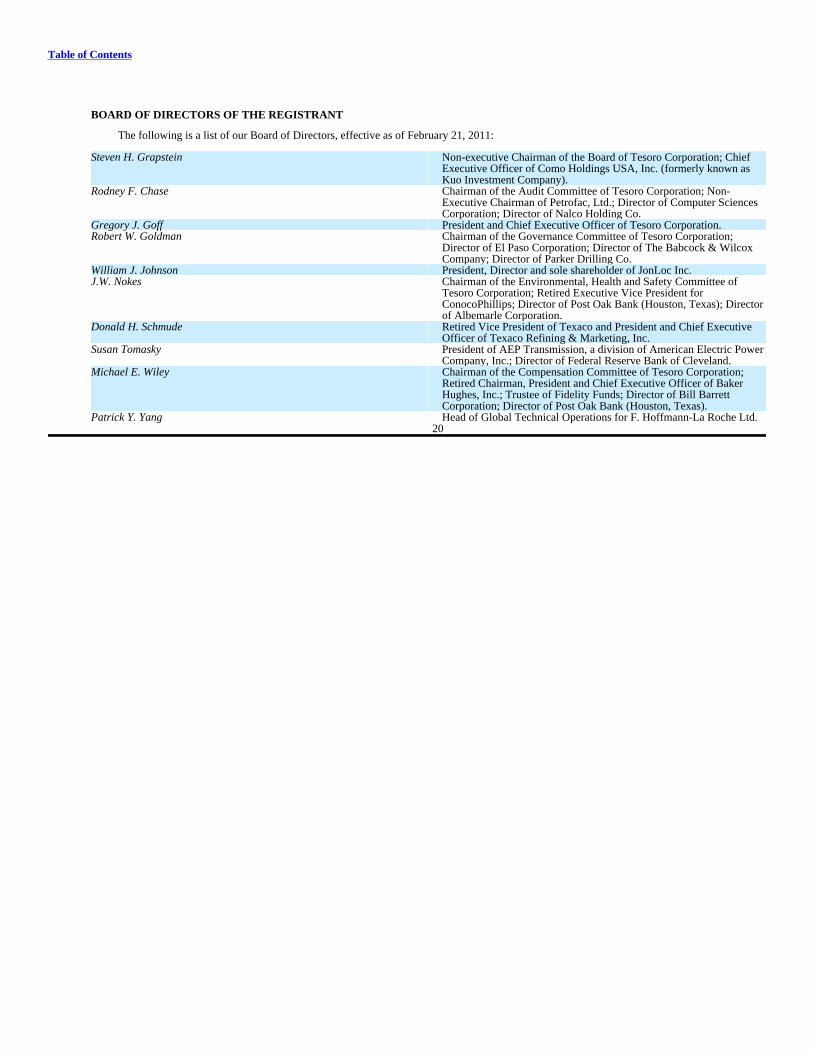
Table of Contents
BOARD OF DIRECTORS OF THE REGISTRANT
The following is a list of our Board of Directors, effective as of February 21, 2011:
Steven H. Grapstein
Non-executive Chairman of the Board of Tesoro Corporation; ChiefExecutive Officer of Como Holdings USA, Inc. (formerly known asKuo Investment Company).
Rodney F. Chase
Chairman of the Audit Committee of Tesoro Corporation; Non-Executive Chairman of Petrofac, Ltd.; Director of Computer SciencesCorporation; Director of Nalco Holding Co.
Gregory J. Goff President and Chief Executive Officer of Tesoro Corporation.Robert W. Goldman
Chairman of the Governance Committee of Tesoro Corporation;Director of El Paso Corporation; Director of The Babcock & WilcoxCompany; Director of Parker Drilling Co.
William J. Johnson President, Director and sole shareholder of JonLoc Inc.J.W. Nokes
Chairman of the Environmental, Health and Safety Committee ofTesoro Corporation; Retired Executive Vice President forConocoPhillips; Director of Post Oak Bank (Houston, Texas); Directorof Albemarle Corporation.
Donald H. Schmude
Retired Vice President of Texaco and President and Chief ExecutiveOfficer of Texaco Refining & Marketing, Inc.
Susan Tomasky
President of AEP Transmission, a division of American Electric PowerCompany, Inc.; Director of Federal Reserve Bank of Cleveland.
Michael E. Wiley
Chairman of the Compensation Committee of Tesoro Corporation;Retired Chairman, President and Chief Executive Officer of BakerHughes, Inc.; Trustee of Fidelity Funds; Director of Bill BarrettCorporation; Director of Post Oak Bank (Houston, Texas).
Patrick Y. Yang Head of Global Technical Operations for F. Hoffmann-La Roche Ltd. 20
Table of Contents
ITEM 1A. RISK FACTORS
Additional adverse changes in global economic conditions and the demand for transportation fuels may continue to impact our business andfinancial condition in ways that we currently cannot predict.
The economic recession, including declines in consumer and business confidence and spending as well as increased unemployment andreduced demand for transportation fuels continues to adversely affect the business and economic environment in which we operate. These conditionsincrease the risks associated with the creditworthiness of our suppliers, customers and business partners. The consequences of such adverse effectscould include interruptions or delays in our suppliers' performance of our contracts, reductions and delays in customer purchases, delays in or theinability of customers to obtain financing to purchase our products, and bankruptcy of customers. Any of these events may adversely affect our cashflow, profitability and financial condition.
Competition from companies that produce their own supply of feedstocks, have more extensive retail outlets, or have greater financialresources could materially affect our business, financial condition and results of operations.
We compete on a global basis with a number of integrated and nationally owned oil companies who produce crude oil, some of which is usedin their refining operations. Unlike these oil companies, we must purchase all of our crude oil from unaffiliated sources. Because these companiesbenefit from increased commodity prices, have greater access to capital and have stronger capital structures, they are able to better withstand poorand volatile market conditions, such as a lower refining margin environment, shortages of crude oil and other feedstocks or extreme pricefluctuations. In addition, we compete with producers and marketers in other industries that supply alternative forms of energy and fuels to satisfy therequirements of our industrial, commercial and individual customers.
We also face strong competition in the market for the sale of retail gasoline and merchandise. Our competitors include service stationsoperated by fully integrated major oil companies and other well-recognized national or regional retail outlets, often selling gasoline or merchandiseat aggressively competitive prices.
Some of our competitors also have materially greater financial and other resources than we have. Such competitors have a greater ability tobear the economic risks inherent in all phases of our industry. The actions of our competitors, along with changes in the supply and price of foreignimports, could lead to lower prices or reduced margins for the products we sell, which could have an adverse effect on our business, financialcondition and results of operations.
Meeting the requirements of evolving environmental, health and safety laws and regulations including those related to climate change couldadversely affect our performance.
Consistent with the experience of other U.S. refiners, environmental laws and regulations have raised operating costs and require significantcapital investments at our refineries. We believe that existing physical facilities at our refineries are substantially adequate to maintain compliancewith existing applicable laws and regulatory requirements. However, we may be required to address conditions that may be discovered in the futureand require a response. Also, potentially material expenditures could be required in the future as a result of evolving environmental, health andsafety, and energy laws, regulations or requirements that may be adopted or imposed in the future. Future developments in federal laws andregulations governing environmental, health and safety and energy matters are especially difficult to predict.
Currently, multiple legislative and regulatory measures to address greenhouse gas emissions (including carbon dioxide, methane and nitrousoxides) are in various phases of consideration, promulgation or implementation. These include requirements effective in January 2010 to reportemissions of greenhouse gases to the EPA and proposed federal legislation and regulation as well as state actions to develop statewide or regionalprograms, each of which require or could require reductions in our greenhouse gas emissions. Requiring reductions in our greenhouse gas emissionscould result in increased costs to (i) operate and maintain our facilities, (ii) install new emission controls at our facilities and (iii) administer andmanage any greenhouse gas emissions programs, including acquiring emission credits or allotments.
21
Table of Contents
Requiring reductions in our greenhouse gas emissions and increased use of renewable fuels could also decrease the demand for our refinedproducts, and could have a material adverse effect on our business, financial condition and results of operations. For example:
• In California, Assembly Bill 32 ("AB 32"), created a statewide cap on greenhouse gas emissions and requires that the state return to 1990emission levels by 2020. AB 32 also created a low carbon fuel standard which requires a 10% reduction in the carbon intensity of fuels by2020.
• In December 2007, the U.S. Congress passed the Energy Independence and Security Act that created a second renewable fuels standard("RFS2"). This standard requires the total volume of renewable transportation fuels (including ethanol and advanced biofuels) sold orintroduced in the U.S. to reach 13.95 billion gallons in 2011 and rise to 36 billion gallons by 2022.
• In 2009, the EPA proposed regulations that would require the reduction of emissions of greenhouse gases from light trucks and cars, andwould establish permitting thresholds for stationary sources that emit greenhouse gases and require emissions controls for those sources.Promulgation of the final rule on April 1, 2010, has resulted in a cascade of related rulemakings by the EPA pursuant to the Clean Air Actrelative to controlling greenhouse gas emissions.
Our operations are subject to operational hazards that could expose us to potentially significant losses.
Our operations are subject to potential operational hazards and risks inherent in refining operations and in transporting and storing crude oiland refined products, such as fires, major accidents, severe weather, natural disasters, explosions, maritime disasters, labor disputes, securitybreaches, pipeline ruptures and spills and mechanical failure of equipment at our or third-party facilities, any of which can result in businessinterruptions or shutdowns and damage to our properties and the properties of others. A serious accident at our facilities could also result in seriousinjury or death to our employees or contractors and could expose us to significant liability for personal injury claims and reputational risk. Any suchevent or unplanned shutdown could have a material adverse effect on our business, financial condition and results of operations.
We carry property, casualty and business interruption insurance but we do not maintain insurance coverage against all potential losses. Marinevessel charter agreements do not include indemnity provisions for oil spills so we also carry marine charterer's liability insurance. We could sufferlosses for uninsurable or uninsured risks or in amounts in excess of existing insurance coverage. The occurrence of an event that is not fully coveredby insurance or failure by one or more insurers to honor its coverage commitments for an insured event could have a material adverse effect on ourbusiness, financial condition and results of operations.
While we do not act as an owner or operator of any marine tankers, we do maintain marine charterer's liability insurance with a primarycoverage of $500 million, subject to a $25,000 deductible, and an additional $500 million in umbrella policies for a total of $1 billion in coverage forliabilities, costs and expenses arising from a discharge of pollutants. In addition, Tesoro maintains $10 million in marine terminal operator's liabilitycoverage, subject to a $150,000 deductible, and an additional $500 million in umbrella coverage for a total of $510 million in coverage for suddenand accidental pollution events and liability arising from marine terminal operations. We cannot assure you that we will not suffer losses in excess ofsuch coverage.
Our business is impacted by environmental risks inherent in refining operations.
The operation of refineries, pipelines and refined products terminals is inherently subject to the risks of spills, discharges or other inadvertentreleases of petroleum or hazardous substances. If any of these events had previously occurred or occurs in the future in connection with any of ourrefineries, pipelines or refined products terminals, or in connection with any facilities which receives our wastes or by-products for treatment ordisposal, other than events for which we are indemnified, we could be liable for all costs and penalties associated with their remediation underfederal, state and local environmental laws or common law, and could be liable for property damage to third-parties caused by contamination fromreleases and spills. The penalties and clean-up costs that we may have to pay for releases or the amounts that we may have to pay to third-parties fordamages to their property, could be significant and the payment of these amounts could have a material adverse effect on our business, financialcondition and results of operations.
We operate in and adjacent to environmentally sensitive coastal waters where tanker, pipeline and refined product transportation and storageoperations are closely regulated by federal, state and local agencies and
22
Table of Contents
monitored by environmental interest groups. Our California, Mid-Pacific and Pacific Northwest refineries import crude oil and other feedstocks bytanker. Transportation and storage of crude oil and refined products over and adjacent to water involves inherent risk and subjects us to theprovisions of the Federal Oil Pollution Act of 1990 and state laws in California, Hawaii, Washington and Alaska. Among other things, these lawsrequire us and the owners of tankers that we charter to deliver crude oil to our refineries to demonstrate in some situations the capacity to respond toa spill up to one million barrels of oil from a tanker and up to 600,000 barrels of oil from an above ground storage tank adjacent to water (a "worstcase discharge") to the maximum extent possible.
We and the owners of tankers we charter have contracted with various spill response service companies in the areas in which we transport andstore crude oil and refined products to meet the requirements of the Federal Oil Pollution Act of 1990 and state and foreign laws. However, theremay be accidents involving tankers, pipelines or above ground storage tanks transporting or storing crude oil or refined products, and responseservices may not respond to a "worst case discharge" in a manner that will adequately contain that discharge, or we may be subject to liability inconnection with a discharge. Additionally, we cannot ensure that all resources noted above could be available for our or a chartered tanker owner'suse at any given time. There are many factors that could inhibit the availability of these resources, including, but not limited to, weather conditions,governmental regulations or other global events. By requirement of state or federal ruling, these resources could be diverted to respond to otherglobal events.
Our operations are subject to general environmental risks, expenses and liabilities which could affect our results of operations.
From time to time we have been, and presently are, subject to litigation and investigations with respect to environmental and related matters,including product liability claims related to the oxygenate methyl tertiary butyl ether ("MTBE"). We may become involved in further litigation orother proceedings, or we may be held responsible in any existing or future litigation or proceedings, the costs of which could be material.
We operate and have in the past operated retail stations with underground storage tanks in various jurisdictions. Federal and state regulationsand legislation govern the storage tanks, and compliance with these requirements can be costly. The operation of underground storage tanks posescertain risks, including leaks. Leaks from underground storage tanks which may occur at one or more of our retail stations, or which may haveoccurred at our previously operated retail stations, may impact soil or groundwater and could result in fines or civil liability for us.
The volatility of crude oil prices, refined product prices and natural gas and electrical power prices may have a material adverse effect on ourcash flow and results of operations.
Our earnings and cash flows from our refining and wholesale marketing operations depend on a number of factors, including fixed andvariable expenses (including the cost of crude oil and other refinery feedstocks) and the margin relative to those expenses at which we are able tosell refined products. In recent years, the prices of crude oil and refined products have fluctuated substantially. These prices depend on numerousfactors beyond our control, including the global supply and demand for crude oil, gasoline and other refined products, which are subject to, amongother things:
• changes in the global economy and the level of foreign and domestic production of crude oil and refined products;
• availability of crude oil and refined products and the infrastructure to transport crude oil and refined products;
• local factors, including market conditions, the level of operations of other refineries in our markets, and the volume of refined productsimported;
• threatened or actual terrorist incidents, acts of war, and other global political conditions;
• government regulations; and
• weather conditions, hurricanes or other natural disasters.
Prices for refined products are influenced by the price of crude oil. We do not produce crude oil and must purchase all of the crude oil weprocess. Many crude oils available on the world market will not meet the quality restrictions for use in our refineries. Others are not economical touse due to excessive transportation costs or for
23
Table of Contents
other reasons. The price of the crude oils used in our refineries fluctuates on worldwide market conditions. Generally, an increase or decrease in theprice of crude oil affects the price of gasoline and other refined products. However, the prices for crude oil and prices for our refined products canfluctuate differently based on global and local market conditions. In addition, the timing of the relative movement of the prices (both amongdifferent classes of refined products and among various global markets for similar refined products) as well as the overall change in refined productprices, can reduce profit margins and could have a significant impact on our refining and wholesale marketing operations, earnings and cash flow.Also, crude oil supply contracts generally have market-responsive pricing provisions. We purchase our refinery feedstocks weeks beforemanufacturing and selling the refined products. Price level changes during the period between purchasing feedstocks and selling the manufacturedrefined products from these feedstocks could have a significant effect on our financial results. We also purchase refined products manufactured byothers for sale to our customers. Price level changes during the periods between purchasing and selling these refined products also could have amaterial adverse effect on our business, financial condition and results of operations.
Volatile prices for natural gas and electrical power used by our refineries and other operations affect manufacturing and operating costs.Natural gas and electricity prices have been, and will continue to be, affected by supply and demand for fuel and utility services in both local andregional markets.
We are subject to interruptions of supply and increased costs as a result of our reliance on third-party transportation of crude oil and refinedproducts.
Our Washington refinery receives all of its Canadian crude oil and delivers a high proportion of its gasoline, diesel fuel and jet fuel throughthird-party pipelines and the balance through marine vessels. Our Hawaii and Alaska refineries receive most of their crude oil and transport asubstantial portion of their refined products through ships and barges. Our Utah refinery receives substantially all of its crude oil and deliverssubstantially all of its refined products through third-party pipelines. Our North Dakota refinery delivers substantially all of its refined productsthrough a third-party pipeline system. Our Golden Eagle refinery receives approximately one-third of its crude oil through third-party pipelines andthe balance through marine vessels. Substantially all of our Golden Eagle refinery's production is delivered through third-party pipelines, ships andbarges. Our Los Angeles refinery receives California crudes through third-party pipelines and the balance of its crude supply through marine vessels.Approximately two-thirds of our Los Angeles refinery's production is delivered through third-party pipelines, terminals, ships and barges. Inaddition to environmental risks discussed above, we could experience an interruption of supply or an increased cost to deliver refined products tomarket if the ability of the pipelines or vessels to transport crude oil or refined products is disrupted because of accidents, governmental regulation orthird-party action. A prolonged disruption of the ability of a pipeline or vessels to transport crude oil or refined product could have a materialadverse effect on our business, financial condition and results of operations.
Terrorist attacks and threats or actual war may negatively impact our business.
Our business is affected by global economic conditions and fluctuations in consumer confidence and spending, which can decline as a result ofnumerous factors outside of our control, such as actual or threatened terrorist attacks and acts of war. Terrorist attacks, as well as events occurring inresponse to or in connection with them, including future terrorist attacks against U.S. targets, rumors or threats of war, actual conflicts involving theUnited States or its allies, or military or trade disruptions impacting our suppliers or our customers or energy markets in general, may adverselyimpact our operations. As a result, there could be delays or losses in the delivery of supplies and raw materials to us, delays in our delivery of refinedproducts, decreased sales of our refined products and extension of time for payment of accounts receivable from our customers. Strategic targetssuch as energy-related assets (which could include refineries such as ours) may be at greater risk of future terrorist attacks than other targets in theUnited States. These occurrences could significantly impact energy prices, including prices for our crude oil and refined products, and have amaterial adverse impact on the margins from our refining and wholesale marketing operations. In addition, significant increases in energy pricescould result in government-imposed price controls. Any one of, or a combination of, these occurrences could have a material adverse effect on ourbusiness, financial condition and results of operations.
24

Table of Contents
Our operating results are seasonal and generally are lower in the first and fourth quarters of the year.
Generally, demand for gasoline is higher during the spring and summer months than during the winter months in most of our markets due toseasonal changes in highway traffic. As a result, our operating results for the first and fourth quarters are generally lower than for those in the secondand third quarters.
Compliance with and changes in tax laws could adversely affect our performance.
We are subject to extensive tax laws and regulations, including federal, state, and foreign income taxes and transactional taxes such as excise,sales/use, payroll, franchise, and ad valorem taxes. New tax laws and regulations and changes in existing tax laws and regulations are continuouslybeing enacted that could result in increased tax expenditures in the future. Many of these tax liabilities are subject to audits by the respective taxingauthority. These audits may result in additional taxes as well as interest and penalties.
ITEM 1B. UNRESOLVED STAFF COMMENTS
None.
ITEM 3. LEGAL PROCEEDINGS
In the ordinary course of business, we become party to lawsuits, administrative proceedings and governmental investigations, includingenvironmental, regulatory and other matters. Large, and sometimes unspecified, damages or penalties may be sought from us in some matters andsome matters may require years to resolve. Although we cannot provide assurance, we believe that an adverse resolution of these matters describedbelow will not have a material adverse effect on our financial position or results of operations.
On February 21, 2011 we received notice from the California Attorney General of alleged violations at twelve of our retail gasoline sites inCalifornia. In the notice we were informed that the State Water Resources Control Board referred an investigation to the Attorney General allegingviolations of the California Health and Safety Code. The allegations relate to the testing, monitoring, repair and reporting of information concerningthe underground storage tanks at the sites but no fine or penalty is proposed. We are investigating the allegations but do not believe the resolution ofthis matter will have a material impact on our operations or financial condition.
In February 2011, Tesoro Corporation, Tesoro Refining and Marketing Company and other defendants were named in a lawsuit brought by theestates and families of six of the seven fatally injured employees arising from the April 2, 2010 Washington refinery incident. In addition, a third-party propane truck driver has alleged damages in the lawsuit. The lawsuit includes allegations of negligence, premises liability, strict liability,product liability and seeks unspecified compensatory and punitive damages. The Company believes that it has defenses to the allegations containedin the lawsuit. The case of Donald and Peggy Zimmerman et al. v. Tesoro Corporation and Tesoro Refining and Marketing et al. is proceeding inthe Superior Court of the State of Washington, Skagit County. We are still evaluating the allegations contained in the lawsuit, however we believethat the outcome will not materially impact our liquidity and consolidated financial position.
In October 2010, the Washington State Department of Labor & Industries ("L&I") issued citations to us and assessed a penalty of $2.4 millionfor alleged violations of state health and safety regulations related to the fire that occurred at our Washington refinery on April 2, 2010. OnOctober 22, 2010, we filed an appeal of the citation, L&I reassumed jurisdiction of the citation and affirmed the allegations on December 29, 2010.We disagree with L&I's characterizations of Tesoro's operations at our Washington refinery and believe, based on available evidence and scientificreviews, that many of the agency's conclusions are mistaken. On January 29, 2011 we filed an appeal of the citation. The U.S. Chemical Safety andHazard Investigation Board ("CSB") and the U.S. Environmental Protection Agency ("EPA") are also conducting investigations concerning the fire.As a result of the fire, seven employees were fatally injured. We cannot predict with certainty the ultimate resolution of the appeal of the L&Icitations and are unable to predict the CSB's findings or estimate what actions the EPA may require or what penalties they might assess.
During 2009, Chevron filed a lawsuit against us claiming they are entitled to a share of the refunds we received in 2008 from the owners of theTrans Alaska Pipeline System ("TAPS"). We received $50 million in 2008, net of contingent legal fees, for excessive intrastate rates charged byTAPS during 1997 though 2000, and the period of 2001 through June 2003. Chevron is asserting that it is entitled to a share of its portion of therefunds for retroactive price adjustments under our previous crude oil contracts with them. In September 2010, the trial court judge grantedChevron's motion for summary judgment and awarded them $16 million. We disagree with the trial court and have appealed the decision to theAlaska Supreme Court in which the proceeding is now pending. We have established an accrual for this matter and believe that the outcome will notmaterially impact our liquidity and consolidated financial position.
25
Table of Contents
We are a defendant, along with other manufacturing, supply and marketing defendants, in six lawsuits alleging MTBE contamination ingroundwater. We were served with the sixth lawsuit in April 2010. The defendants are being sued for having manufactured MTBE and havingmanufactured, supplied and distributed gasoline containing MTBE. The plaintiffs in the six cases, all in California, are municipalities andgovernmental authorities. The plaintiffs allege, in part, that the defendants are liable for manufacturing or distributing a defective product. The suitsgenerally seek individual, unquantified compensatory and punitive damages and attorney's fees. We intend to vigorously assert our defenses againstthese claims.
The names of the courts in which the proceedings are pending and the date instituted are as follows:
Name of Court where Name of Case proceeding is pending Date Instituted
The People of the State of California et al. v. Atlantic Richfield Companyet al., Tesoro Petroleum Corporation and Tesoro Refining and MarketingCompany
Superior Court of California, County ofSacramento
October 31, 2003
City of Fresno v. Chevron USA Inc., et al., Tesoro Petroleum Corporationand Tesoro Refining and Marketing Company, Inc.
United States District Court of Southern Districtof New York
October 29, 2004
Orange County Water District v. Unocal Corporation et al., TesoroPetroleum Corporation and Tesoro Refining and Marketing Company,Inc.
United States District Court of Southern Districtof New York
October 28, 2004
City of Pomona v. Chevron USA Inc., Tesoro Corporation and TesoroRefining and Marketing Inc.
United States District Court of Southern Districtof New York
January 16, 2009
Great Oaks Water Company v. USA Petroleum Corporation, et al., TesoroCorporation and Tesoro Refining and Marketing Company
Superior Court of California, County ofSanta Clara
January 4, 2010
City of Santa Barbara v. Chevron USA, Inc., et al., Tesoro Refining andMarketing Company
Superior Court of California, County of ContraCosta
April 6, 2010
On February 5, 2010, the EPA filed suit against us alleging violations of the Clean Air Act and corresponding regulatory requirementsconcerning the testing and reporting of transportation fuels and fuel additives. In February 2009, we received a Notice of Violation ("NOV") fromthe EPA for the alleged violations arising from a compliance review conducted by the EPA in 2006 for the years 2003 through the time of the reviewin 2006. We are discussing the alleged violations contained in the suit with the EPA and the U.S. Department of Justice and have not established anaccrual for this matter. On the basis of existing information, we believe that the resolution of this matter will not have a material adverse effect onour financial position or results of operations.
In June 2010, we settled an enforcement action brought by the Alaska Department of Environmental Conservation ("ADEC") related to thegrounding of a vessel in the Alaska Cook Inlet on February 2, 2006. We settled this matter for a total of $265,000. The ADEC had alleged that twovessels chartered by us violated provisions of our Cook Inlet Vessel Oil Prevention and Contingency Plan from December 2004 to February 2006.
In June 2010, we accepted a final settlement offer that was less than the original settlement offer, from the Bay Area Air Quality ManagementDistrict (the "District") to settle 44 NOVs. The NOVs were issued from May 2006 to April 2008 and allege violations of air quality regulations atour Golden Eagle refinery. The District's original 2008 settlement offer was $740,000.
On July 1, 2010, we received an offer from the District to settle 46 NOVs for $620,000. The NOVs were issued from June 2006 to September2009 and allege violations of air quality regulations at our Golden Eagle refinery. We are evaluating the allegations contained in the settlement offerand will seek to negotiate a settlement of the NOVs with the District. The resolution of this matter will not have a material adverse effect on ourfinancial position or results of operations.
ITEM 4. REMOVED AND RESERVED 26
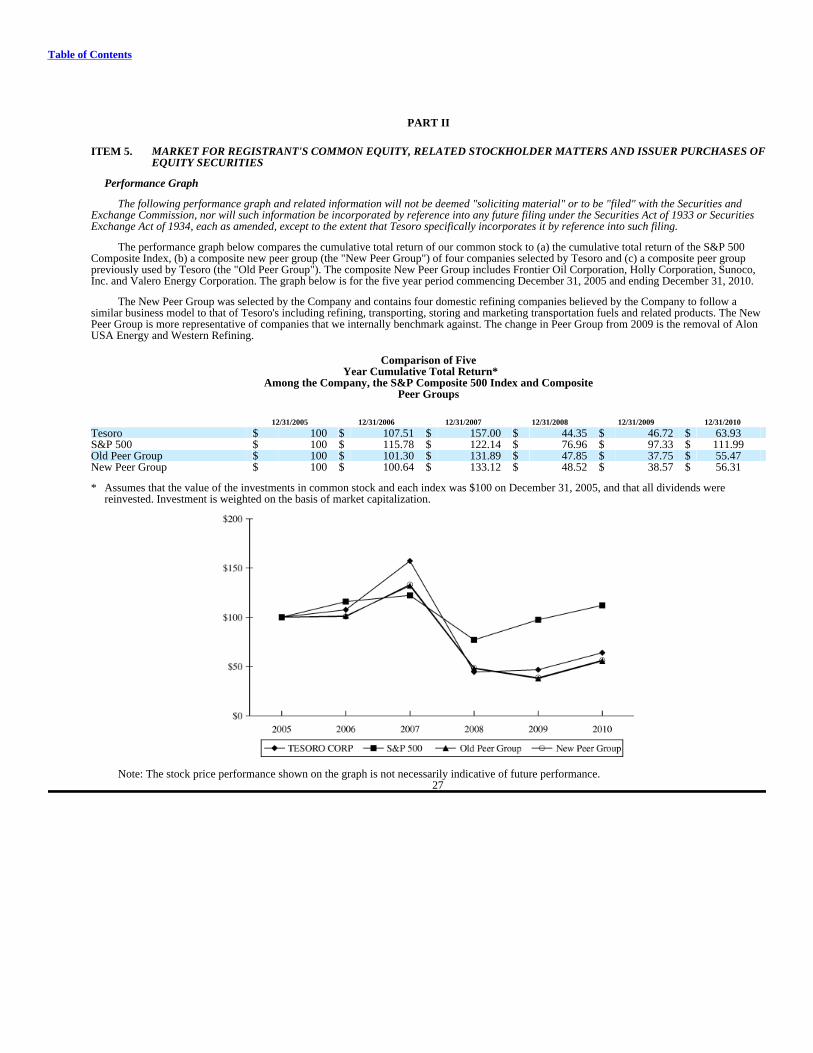
Table of Contents
PART II
ITEM 5. MARKET FOR REGISTRANT'S COMMON EQUITY, RELATED STOCKHOLDER MATTERS AND ISSUER PURCHASES OFEQUITY SECURITIES
Performance Graph
The following performance graph and related information will not be deemed "soliciting material" or to be "filed" with the Securities andExchange Commission, nor will such information be incorporated by reference into any future filing under the Securities Act of 1933 or SecuritiesExchange Act of 1934, each as amended, except to the extent that Tesoro specifically incorporates it by reference into such filing.
The performance graph below compares the cumulative total return of our common stock to (a) the cumulative total return of the S&P 500Composite Index, (b) a composite new peer group (the "New Peer Group") of four companies selected by Tesoro and (c) a composite peer grouppreviously used by Tesoro (the "Old Peer Group"). The composite New Peer Group includes Frontier Oil Corporation, Holly Corporation, Sunoco,Inc. and Valero Energy Corporation. The graph below is for the five year period commencing December 31, 2005 and ending December 31, 2010.
The New Peer Group was selected by the Company and contains four domestic refining companies believed by the Company to follow asimilar business model to that of Tesoro's including refining, transporting, storing and marketing transportation fuels and related products. The NewPeer Group is more representative of companies that we internally benchmark against. The change in Peer Group from 2009 is the removal of AlonUSA Energy and Western Refining.
Comparison of FiveYear Cumulative Total Return*
Among the Company, the S&P Composite 500 Index and CompositePeer Groups
12/31/2005 12/31/2006 12/31/2007 12/31/2008 12/31/2009 12/31/2010
Tesoro $ 100 $ 107.51 $ 157.00 $ 44.35 $ 46.72 $ 63.93 S&P 500 $ 100 $ 115.78 $ 122.14 $ 76.96 $ 97.33 $ 111.99 Old Peer Group $ 100 $ 101.30 $ 131.89 $ 47.85 $ 37.75 $ 55.47 New Peer Group $ 100 $ 100.64 $ 133.12 $ 48.52 $ 38.57 $ 56.31
* Assumes that the value of the investments in common stock and each index was $100 on December 31, 2005, and that all dividends werereinvested. Investment is weighted on the basis of market capitalization.
Note: The stock price performance shown on the graph is not necessarily indicative of future performance. 27

Table of Contents
Stock Prices and Dividends per Common Share
Our common stock is listed under the symbol "TSO" on the New York Stock Exchange. Summarized below are high and low sales prices ofand dividends declared on our common stock on the New York Stock Exchange during 2010 and 2009.
Sales Prices per Dividends Common Share perQuarter Ended High Low Common Share
December 31, 2010 $ 18.94 $ 12.79 $ 0.00 September 30, 2010 $ 13.50 $ 10.40 $ 0.00 June 30, 2010 $ 14.43 $ 10.76 $ 0.00 March 31, 2010 $ 15.33 $ 11.48 $ 0.00 December 31, 2009 $ 16.93 $ 12.26 $ 0.05 September 30, 2009 $ 16.04 $ 10.62 $ 0.10 June 30, 2009 $ 18.77 $ 12.25 $ 0.10 March 31, 2009 $ 19.16 $ 11.75 $ 0.10
Dividend Policy
In February 2010, our Board of Directors suspended indefinitely our quarterly cash dividend on common stock as described in Management'sDiscussion and Analysis of Financial Condition and Results of Operations in Item 7. At February 21, 2011, there were approximately 1,663 holdersof record of our 143,174,369 outstanding shares of common stock.
Purchases of Equity Securities
Tesoro may acquire shares to satisfy tax withholding obligations in connection with the vesting of restricted stock issued to certain employees.There were no such shares acquired during the three-month period ended December 31, 2010.
2011 Annual Meeting of Stockholders
The 2011 Annual Meeting of Stockholders will be held at 4:00 P.M. Central Time on Wednesday, May 4, 2011, at Tesoro CorporateHeadquarters, 19100 Ridgewood Parkway, San Antonio, Texas. Holders of common stock of record at the close of business on March 15, 2011 areentitled to notice of and to vote at the annual meeting.
28
Table of Contents
ITEM 6. SELECTED FINANCIAL DATA
The following table sets forth certain selected consolidated financial data of Tesoro as of and for each of the five years in the period endedDecember 31, 2010. The selected consolidated financial information presented below has been derived from our historical financial statements. Thefollowing table should be read in conjunction with Management's Discussion and Analysis of Financial Condition and Results of Operations inItem 7 and our consolidated financial statements in Item 8.
Years Ended December 31, 2010 2009 2008 2007(a)(b) 2006(b) (Dollars in millions except per share amounts)
Statement of Operations Data Total Revenues $ 20,583 $ 16,872 $ 28,416 $ 21,976 $ 18,061 Net Earnings (Loss)(c) $ (29) $ (140) $ 278 $ 566 $ 801 Net Earnings (Loss) Per Share:
Basic $ (0.21) $ (1.01) $ 2.03 $ 4.17 $ 5.89 Diluted $ (0.21) $ (1.01) $ 2.00 $ 4.06 $ 5.73
Weighted Shares Outstanding (millions): Basic 140.6 138.2 136.8 135.7 136.0 Diluted 140.6 138.2 139.2 139.5 139.8
Dividends per share $ 0.00 $ 0.35 $ 0.40 $ 0.35 $ 0.20 Balance Sheet Data Current Assets $ 2,928 $ 2,223 $ 1,646 $ 2,600 $ 2,811 Property, Plant and Equipment, Net $ 5,170 $ 5,190 $ 5,081 $ 4,780 $ 2,687 Total Assets $ 8,732 $ 8,070 $ 7,433 $ 8,128 $ 5,904 Current Liabilities $ 2,496 $ 1,889 $ 1,441 $ 2,494 $ 1,672 Total Debt(d) $ 1,995 $ 1,841 $ 1,611 $ 1,659 $ 1,046 Stockholders' Equity $ 3,215 $ 3,087 $ 3,218 $ 3,052 $ 2,502 Current Ratio 1.2:1 1.2:1 1.1:1 1.0:1 1.7:1 Working Capital $ 432 $ 334 $ 205 $ 106 $ 1,139 Total Debt to Capitalization(d) 38% 37% 33% 35% 29%Common Stock Outstanding (millions of shares) 143.2 140.4 138.4 137.0 135.8 Book Value Per Common Share $ 22.45 $ 21.99 $ 23.25 $ 22.28 $ 18.42 Cash Flows From (Used In) Operating Activities $ 385 $ 663 $ 716 $ 1,322 $ 1,139 Investing Activities (295) (436) (610) (2,838) (430)Financing Activities(d) 145 166 (109) 553 (163)
Increase (Decrease) in Cash and Cash Equivalents $ 235 $ 393 $ (3) $ (963) $ 546
Capital Expenditures $ 287 $ 401 $ 619 $ 789 $ 453
(a) Our financial results include the results of our Los Angeles refinery and Shell and USA Gasoline retail stations since acquisition in May 2007.
(b) Share and per share amounts have been adjusted to reflect our May 2007 two-for-one stock split.
(c) Net earnings (loss) included the following pre-tax items that affect the comparability of the periods presented. During 2010, we recordedapproximately $67 million from insurance recoveries and $27 million in charges directly related to the April 2, 2010 incident at our Washingtonrefinery and a $48 million gain from the elimination of postretirement life insurance benefits for current and future retirees. During 2009, weincurred a $43 million goodwill write-off in our refining segment and reduced inventories resulting in a last-in-first-out ("LIFO") liquidation orreduction in cost of sales of $69 million. During 2008, we incurred a $91 million bad debt charge, reduced inventories resulting in a LIFOliquidation or reduction in cost of sales of $138 million and received net refunds of $50 million from the Trans Alaska Pipeline Systemassociated with our protest of prior year intrastate rates. During 2006, we incurred charges of $28 million for termination of a delayed cokerproject at the Washington refinery.
(d) During 2009, we issued $300 million in senior notes for general corporate purposes and during 2007 we issued $500 million in senior notesprimarily to fund the acquisition of the Los Angeles refinery. Total debt includes capital lease obligations.
29
Table of Contents
ITEM 7. MANAGEMENT'S DISCUSSION AND ANALYSIS OF FINANCIAL CONDITION AND RESULTS OF OPERATIONS
The following information concerning our results of operations and financial condition should be read in conjunction with Business in Item 1and our consolidated financial statements in Item 8.
IMPORTANT INFORMATION REGARDING FORWARD-LOOKING STATEMENTS
This Annual Report on Form 10-K (including information incorporated by reference) includes and references "forward-looking statements"within the meaning of the Private Securities Litigation Reform Act of 1995. These statements relate to, among other things, expectations regardingrefining margins, revenues, cash flows, capital expenditures, turnaround expenses, and other financial items. These statements also relate to ourbusiness strategy, goals and expectations concerning our market position, future operations, margins and profitability. We have used the words"anticipate," "believe," "could," "estimate," "expect," "intend," "may," "plan," "predict," "project," "will," "would" and similar terms and phrases toidentify forward-looking statements in this Annual Report on Form 10-K, which speak only as of the date the statements were made.
Although we believe the assumptions upon which these forward-looking statements are based are reasonable, any of these assumptions couldprove to be inaccurate and the forward-looking statements based on these assumptions could be incorrect.
The matters discussed in these forward-looking statements are subject to risks, uncertainties and other factors that could cause actual resultsand trends to differ materially from those made, projected, or implied in or by the forward-looking statements depending on a variety of uncertaintiesor other factors including, but not limited to:
• changes in global economic conditions and the effects of the global economic downturn on our business and the business of our suppliers,customers, business partners and credit lenders;
• the timing and extent of changes in commodity prices and underlying demand for our refined products;
• state and federal environmental, economic, health and safety, energy and other policies and regulations, including those related to climatechange and any changes therein, and any legal or regulatory investigations, delays or other factors beyond our control;
• operational hazards inherent in refining operations and in transporting and storing crude oil and refined products;
• changes in capital requirements or in execution of planned capital projects;
• disruptions due to equipment interruption or failure at our facilities or third-party facilities;
• the availability and costs of crude oil, other refinery feedstocks and refined products;
• changes in our cash flow from operations;
• changes in the cost or availability of third-party vessels, pipelines and other means of transporting crude oil feedstocks and refinedproducts;
• actions of customers and competitors;
• direct or indirect effects on our business resulting from actual or threatened terrorist incidents or acts of war;
• political developments;
• changes in our inventory levels and carrying costs;
• seasonal variations in demand for refined products;
• changes in fuel and utility costs for our facilities;
• risks related to labor relations and workplace safety;
• changes in insurance markets impacting costs and the level and types of coverage available;
• adverse rulings, judgments, or settlements in litigation or other legal or tax matters, including unexpected environmental remediation costsin excess of any reserves;
30

Table of Contents
• weather conditions affecting our operations or the areas in which our refined products are marketed; and
• earthquakes or other natural disasters affecting operations.
Many of these factors, as well as other factors, are described in greater detail in "Competition" on page 12 and "Risk Factors" on page 21. Allfuture written and oral forward-looking statements attributable to us or persons acting on our behalf are expressly qualified in their entirety by theprevious statements. The forward-looking statements in this Annual Report on Form 10-K speak only as of the date of this Annual Report onForm 10-K. We undertake no obligation to update any information contained herein or to publicly release the results of any revisions to any forward-looking statements that may be made to reflect events or circumstances that occur, or that we become aware of, after the date of this Annual Reporton Form 10-K.
BUSINESS STRATEGY AND OVERVIEW
Strategy and Goals
Our vision is to be the premier low-cost supplier of transportation fuels in the refining and marketing business in our markets, providing valuefor our customers while delivering industry leading returns for our shareholders and conducting ourselves responsibly in the communities in whichwe operate. To achieve these goals we are pursuing the following strategic priorities:
• improve operational efficiency and effectiveness by focusing on safety and reliability, system improvements and cost leadership;
• drive commercial excellence by strengthening our supply and trading activities to provide additional value to the business;
• strengthen our financial position by exercising capital discipline and focusing on improving our liquidity; and
• capture value-driven growth through a focus on our logistics assets and growing our marketing business.
During 2010, our goals were focused on optimizing cash flows from operations by improving our capture of available margins, devotingcapital to income improvement projects, lowering administrative costs and lowering our energy and maintenance costs. Relative to these goals,during 2010 we:
• improved our gross refining margin by $191 million and improved our cash balance approximately $235 million as a result of our capitaland non-capital initiatives to lower transportation and feedstock costs, increase product margins and improve refinery yields;
• funded our capital spending of $287 million through cash flows from operations of $385 million of which approximately 10% was devotedto income improvement projects; and
• significantly reduced our employee benefit obligation by $207 million primarily through changes to our post-retirement life, medical andpension benefit programs.
Tesoro Logistics LP
On January 4, 2011, Tesoro Logistics LP, a wholly owned subsidiary of Tesoro Corporation, filed a registration statement on Form S-1 withthe SEC in connection with a proposed initial public offering of its common units representing limited partner interests. On February 9, 2011, TesoroLogistics LP filed an amendment to the initial Form S-1 on Form S-1/A. The number of common units to be offered and the price range for theoffering have not yet been determined. Tesoro Logistics LP was formed by Tesoro Corporation to own, operate, develop and acquire crude oil andrefined products logistics assets. Headquartered in San Antonio, Texas, Tesoro Logistics LP's initial assets will consist of a crude oil gatheringsystem in the Bakken Shale/Williston Basin area, eight refined products terminals in the western United States, and a crude oil and refined productsstorage facility and five related short-haul pipelines in Utah.
31
Table of Contents
At the date of this report, the registration statement is not effective. The completion of the offering is subject to numerous conditions,including market conditions, and we can provide no assurance that it will be successfully completed. The securities offered under the registrationstatement may not be sold, nor may offers to buy be accepted prior to the time that the registration statement becomes effective. The informationcontained in this Form 10-K with respect to this offering shall not constitute an offer to sell or a solicitation of an offer to buy these securities.
Tesoro Panama Company Sociedad Anonima ("TPSA")
As part of our business strategy, we formed TPSA to use our leased pipeline and tank facilities in Panama by enhancing strategic partnerships,developing economies of scale around freight and storage opportunities, providing discretionary crude oil trading, expanding global commercialrelationships and evaluating opportunities to source crude from alternative supply markets. TPSA is:
• a directly and wholly consolidated subsidiary of Tesoro Corporation;
• not a subsidiary guarantor of our senior notes;
• an excluded subsidiary (as defined) in the Fourth Amended and Restated Credit Agreement (financing and credit obtained by TPSA is notguaranteed by Tesoro Corporation); and
• an unrestricted subsidiary and will not be subject to the restrictive covenants in Tesoro Corporation's indentures.
The TPSA Agreement with Gunvor allocates and delegates a portion of Gunvor's rights, duties, and obligations set forth in Gunvor's TSAagreement with PTP to TPSA. TPSA has leased access to, and is obligated for, pipeline capacity of more than 100 Mbpd and tank capacity ofapproximately 4.4 million barrels. In October 2010, TPSA entered into a revolving credit agreement which provides for an uncommitted, securedrevolving credit facility ("TPSA Revolving Credit Facility"). The TPSA Revolving Credit Facility is non-recourse to the Company, meaning onlyTPSA is liable for any borrowings or interest under this credit agreement.
Industry Overview
Our profitability is heavily influenced by the cost of crude oil and the aggregate value of the products we make from that crude oil and is alsoaffected by changes in economic conditions. Product values and crude oil costs are set by the market and are outside of the control of independentrefiners.
Crude Oil Price and Product Margin Analysis
The overall U.S. economy, including that of the West Coast, has shown signs of improvement, though these improvements have notconsistently translated into stronger demand for refined products. Measures of commercial activity that are correlated with oil demand showedimprovement, particularly in the second half of 2010. Container traffic at the five largest West Coast ports recovered to their 2007 levels in August2010 and have remained above 2008 levels since May 2010. In 2010, self-reported available seat miles at the largest U.S.-flagged air carriers were1.1% higher than the previous year, with year-on-year growth for the second half of 2010 of 3.7%.
U.S. Gross Domestic Product continues to grow. However, the recovery to date has been without an accompanying improvement in the laborsector as unemployment remains above 9%. Events in other countries during 2010 affected regional supply and demand fundamentals, such asoutages at refineries in Chile and Mexico during the first half of the year. The effect of these events was relatively short-lived but provided upwardpressure on margins by decreasing excess refinery capacity.
32

Table of Contents
The following table depicts average key crude oil pricing and West Coast benchmark product margins for 2010 and 2009:
Improved West Coast distillate supply and demand fundamentals led to improved diesel margins in 2010 as compared to 2009. During 2010,U.S. West Coast benchmark diesel fuel margins increased by approximately 37% due to strengthening commercial activity, diesel exports andrefinery outages. However, West Coast gasoline margins decreased in 2010 by 13% over 2009 primarily due to continued lower demand, increasedalternative fuel supply and spare refining capacity.
Outlook
The slow recovery of the global and domestic economies, coupled with persistent high unemployment in the U.S. is expected to continue tonegatively impact demand for refined products. The impact of reduced demand has been compounded by excess global refining capacity andhistorically high inventory levels. These conditions have continued to put pressure on refined product margins. Recently, we have seenimprovements in regional margins and expect margins to be slightly higher in 2011 as compared to 2010.
In addition to current market conditions, there are long-term factors that may impact the supply and demand of refined products in theU.S. These factors include:
• higher fuel efficiency standards for vehicles;
• mandated renewable fuels standards;
• potential and enacted climate change legislation, including the EPA regulation of greenhouse gas emissions under the Clean Air Act; and
• competing refineries being built overseas.
33

Table of Contents
RESULTS OF OPERATIONS
A discussion and analysis of the factors contributing to our results of operations is presented below. The accompanying consolidated financialstatements in Item 8, together with the following information, are intended to provide investors with a reasonable basis for assessing our historicaloperations, but should not serve as the only criteria for predicting our future performance.
Summary
Our net loss in 2010 was $29 million ($0.21 per diluted share) compared with a net loss of $140 million ($1.01 per diluted share) in 2009. Theincrease in net earnings of $0.80 per diluted share was primarily due to the following:
• contribution from our capital and non-capital initiative program during 2010 which increased our overall margin through reducedtransportation and feedstock costs, increased product margins, and improved refinery yields;
• increased gross refining margins due to local crude discounts and improved distillate margins partially offset by weaker gasoline margins;
• a $48 million gain from the elimination of postretirement life insurance benefits for current and future retirees as part of our strategy toreduce overhead and benefit expenses;
• a $39 million decrease in losses on our derivative instruments;
• improved contribution of $14 million from our retail marketing segment; and
• a goodwill write-off of $10 million in 2010 compared to $43 million in 2009.
The increase in net earnings during 2010 relative to 2009 was partially offset by the following:
• lower throughput primarily from the temporary shut-down of processing at our Washington refinery and completion of scheduled refineryturnarounds at several of our other refineries. The gross margin impact of the temporary shut-down at the Washington refinery was partiallyoffset by the receipt of $55 million in business interruption insurance recoveries;
• a $51 million increase in incentive and stock-based compensation expense. The increase in stock based compensation is related to our stockappreciation rights and phantom stock options which increased primarily as a result of increases in Tesoro stock prices during 2010 ascompared to 2009;
• a reduction in cost of sales of $69 million resulting from a LIFO liquidation benefit during 2009; and
• additional operating expenses of $27 million directly related to the April 2, 2010, incident at our Washington refinery, partially offset by$12 million in property insurance recoveries.
Our net loss in 2009 was $140 million ($1.01 per diluted share) compared with net earnings of $278 million ($2.00 per diluted share) in 2008.The decrease in net earnings of $3.01 per diluted share was primarily due to the following:
• significantly lower industry distillate margins primarily from reduced demand and excess inventories;
• the narrowing of price differentials between heavy and light crude oils;
• a lower LIFO liquidation benefit of $69 million in 2009 compared to $138 million in 2008;
• a goodwill write-off of $43 million;
• the impact of scheduled and unscheduled downtime; and
• refunds received in 2008 totaling $50 million in connection with our protest of intrastate pipeline rates.
The decrease in net earnings during 2009 relative to 2008 was partially offset by the following:
• higher industry gasoline margins on the U.S. West Coast;
• reduced refining operating expenses by $149 million primarily reflecting decreased utility costs and lower refining throughput; and
• a $91 million bad debt charge in 2008. 34
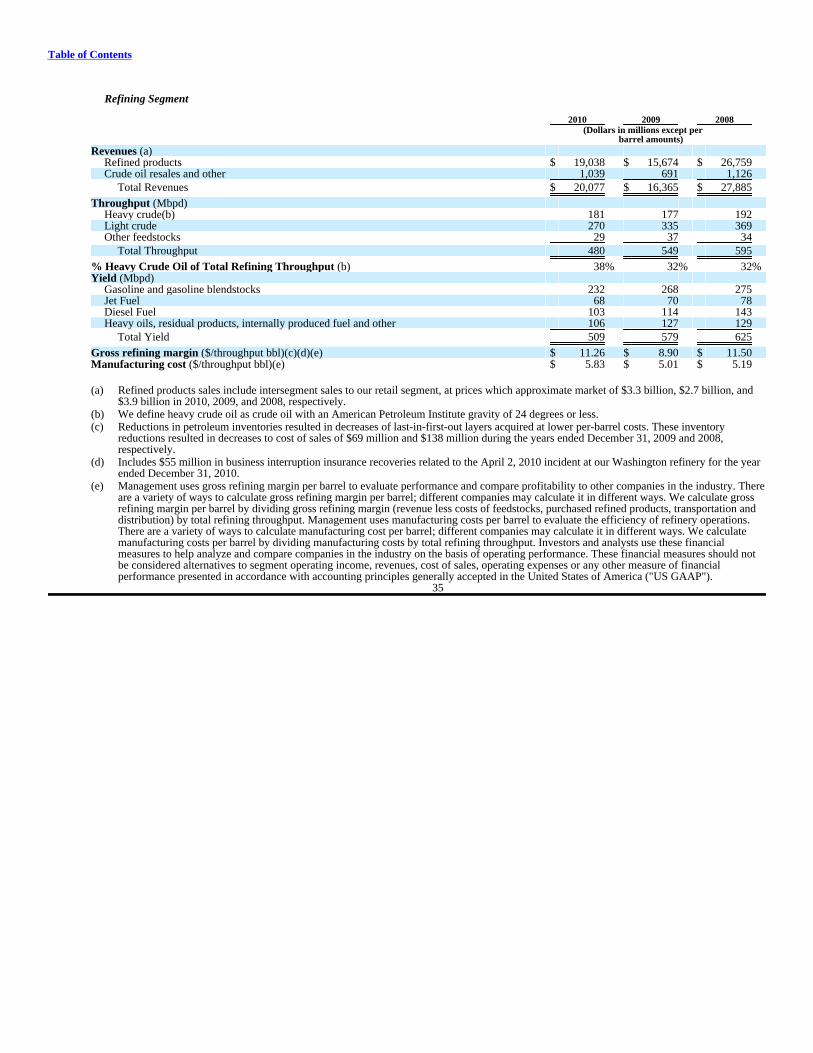
Table of Contents
Refining Segment
2010 2009 2008 (Dollars in millions except per barrel amounts)
Revenues (a) Refined products $ 19,038 $ 15,674 $ 26,759 Crude oil resales and other 1,039 691 1,126
Total Revenues $ 20,077 $ 16,365 $ 27,885
Throughput (Mbpd) Heavy crude(b) 181 177 192 Light crude 270 335 369 Other feedstocks 29 37 34
Total Throughput 480 549 595
% Heavy Crude Oil of Total Refining Throughput (b) 38% 32% 32%Yield (Mbpd)
Gasoline and gasoline blendstocks 232 268 275 Jet Fuel 68 70 78 Diesel Fuel 103 114 143 Heavy oils, residual products, internally produced fuel and other 106 127 129
Total Yield 509 579 625
Gross refining margin ($/throughput bbl)(c)(d)(e) $ 11.26 $ 8.90 $ 11.50 Manufacturing cost ($/throughput bbl)(e) $ 5.83 $ 5.01 $ 5.19
(a) Refined products sales include intersegment sales to our retail segment, at prices which approximate market of $3.3 billion, $2.7 billion, and$3.9 billion in 2010, 2009, and 2008, respectively.
(b) We define heavy crude oil as crude oil with an American Petroleum Institute gravity of 24 degrees or less.
(c) Reductions in petroleum inventories resulted in decreases of last-in-first-out layers acquired at lower per-barrel costs. These inventoryreductions resulted in decreases to cost of sales of $69 million and $138 million during the years ended December 31, 2009 and 2008,respectively.
(d) Includes $55 million in business interruption insurance recoveries related to the April 2, 2010 incident at our Washington refinery for the yearended December 31, 2010.
(e) Management uses gross refining margin per barrel to evaluate performance and compare profitability to other companies in the industry. Thereare a variety of ways to calculate gross refining margin per barrel; different companies may calculate it in different ways. We calculate grossrefining margin per barrel by dividing gross refining margin (revenue less costs of feedstocks, purchased refined products, transportation anddistribution) by total refining throughput. Management uses manufacturing costs per barrel to evaluate the efficiency of refinery operations.There are a variety of ways to calculate manufacturing cost per barrel; different companies may calculate it in different ways. We calculatemanufacturing costs per barrel by dividing manufacturing costs by total refining throughput. Investors and analysts use these financialmeasures to help analyze and compare companies in the industry on the basis of operating performance. These financial measures should notbe considered alternatives to segment operating income, revenues, cost of sales, operating expenses or any other measure of financialperformance presented in accordance with accounting principles generally accepted in the United States of America ("US GAAP").
35
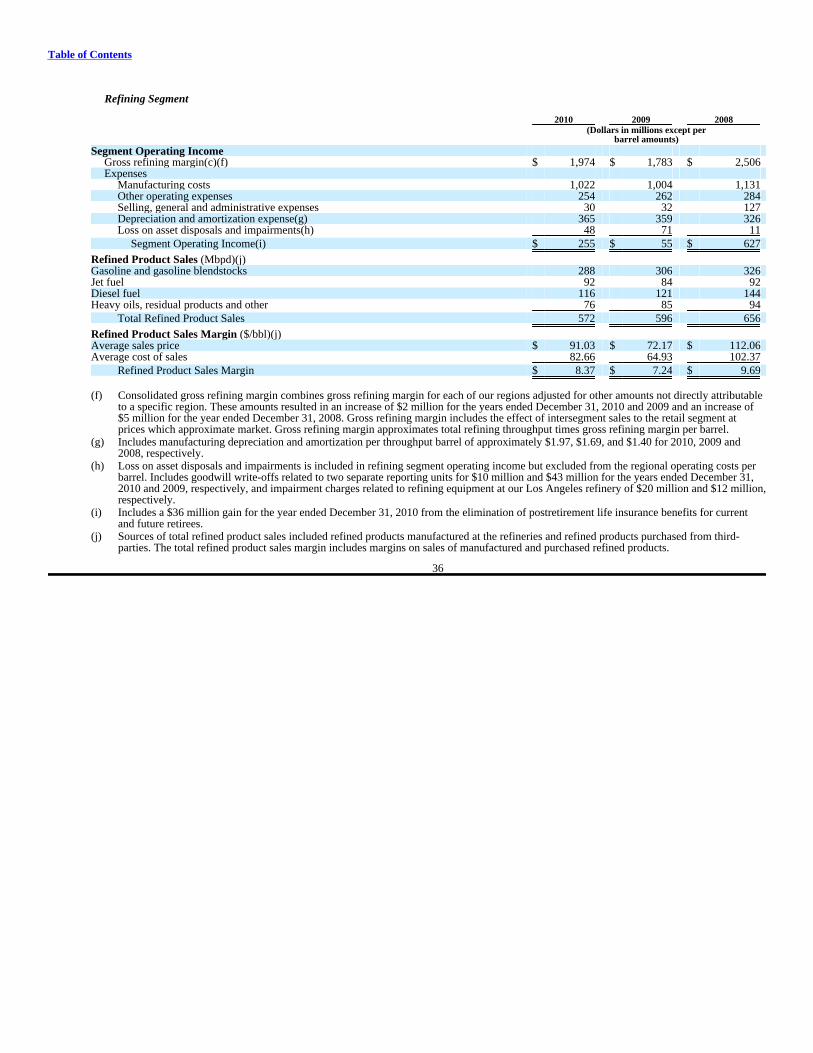
Table of Contents
Refining Segment
2010 2009 2008 (Dollars in millions except per barrel amounts)
Segment Operating Income Gross refining margin(c)(f) $ 1,974 $ 1,783 $ 2,506 Expenses
Manufacturing costs 1,022 1,004 1,131 Other operating expenses 254 262 284 Selling, general and administrative expenses 30 32 127 Depreciation and amortization expense(g) 365 359 326 Loss on asset disposals and impairments(h) 48 71 11
Segment Operating Income(i) $ 255 $ 55 $ 627
Refined Product Sales (Mbpd)(j) Gasoline and gasoline blendstocks 288 306 326 Jet fuel 92 84 92 Diesel fuel 116 121 144 Heavy oils, residual products and other 76 85 94
Total Refined Product Sales 572 596 656
Refined Product Sales Margin ($/bbl)(j) Average sales price $ 91.03 $ 72.17 $ 112.06 Average cost of sales 82.66 64.93 102.37
Refined Product Sales Margin $ 8.37 $ 7.24 $ 9.69
(f) Consolidated gross refining margin combines gross refining margin for each of our regions adjusted for other amounts not directly attributableto a specific region. These amounts resulted in an increase of $2 million for the years ended December 31, 2010 and 2009 and an increase of$5 million for the year ended December 31, 2008. Gross refining margin includes the effect of intersegment sales to the retail segment atprices which approximate market. Gross refining margin approximates total refining throughput times gross refining margin per barrel.
(g) Includes manufacturing depreciation and amortization per throughput barrel of approximately $1.97, $1.69, and $1.40 for 2010, 2009 and2008, respectively.
(h) Loss on asset disposals and impairments is included in refining segment operating income but excluded from the regional operating costs perbarrel. Includes goodwill write-offs related to two separate reporting units for $10 million and $43 million for the years ended December 31,2010 and 2009, respectively, and impairment charges related to refining equipment at our Los Angeles refinery of $20 million and $12 million,respectively.
(i) Includes a $36 million gain for the year ended December 31, 2010 from the elimination of postretirement life insurance benefits for currentand future retirees.
(j) Sources of total refined product sales included refined products manufactured at the refineries and refined products purchased from third-parties. The total refined product sales margin includes margins on sales of manufactured and purchased refined products.
36

Table of Contents
2010 2009 2008 (Dollars in millions except per barrel amounts)
Refining Data by Region California (Golden Eagle and Los Angeles)
Refining throughput (Mbpd)(k) 223 241 258 Gross refining margin $ 979 $ 897 $ 1,332 Gross refining margin ($/throughput bbl)(e) $ 12.03 $ 10.18 $ 14.08 Manufacturing cost ($/throughput bbl)(e) $ 7.54 $ 6.86 $ 7.18
Pacific Northwest (Washington and Alaska) Refining throughput (Mbpd)(k) 93 135 159 Gross refining margin(d) $ 367 $ 376 $ 396 Gross refining margin ($/throughput barrel)(c)(e) $ 10.84 $ 7.65 $ 6.82 Manufacturing cost ($/throughput bbl)(e) $ 5.88 $ 3.81 $ 3.99
Mid-Pacific (Hawaii) Refining throughput (Mbpd)(k) 64 68 69 Gross refining margin $ 88 $ 90 $ 170 Gross refining margin ($/throughput bbl)(e) $ 3.77 $ 3.62 $ 6.72 Manufacturing cost ($/throughput bbl)(e) $ 3.18 $ 3.18 $ 3.30
Mid-Continent (North Dakota and Utah) Refining throughput (Mbpd)(k) 100 105 109 Gross refining margin $ 538 $ 418 $ 603 Gross refining margin ($/throughput bbl)(e) $ 14.62 $ 10.95 $ 15.12 Manufacturing cost ($/throughput bbl)(e) $ 3.68 $ 3.49 $ 3.44
(k) We experienced reduced throughput due to scheduled turnarounds at our Hawaii, North Dakota, Golden Eagle and Utah refineries in 2010. Wealso temporarily shut-down processing at the Washington refinery beginning in April 2010, and resumed operations at planned rates inNovember 2010. We experienced reduced throughput due to scheduled turnarounds at our Alaska and Golden Eagle refineries, unscheduleddowntime at our Los Angeles refinery and scheduled maintenance at our Washington refinery during 2009, and scheduled turnarounds at theGolden Eagle and Washington refineries during 2008.
2010 Compared to 2009
Overview. Operating income for our refining segment increased by $200 million, or 364% to $255 million during 2010 as compared to$55 million during 2009. The increase primarily reflects improved total gross refining margins of $191 million during the year. The increase in grossmargin was partially offset by an increase of $10 million in manufacturing and other operating expenses.
Gross Refining Margins. Our gross refining margin per barrel increased by $2.36 per barrel, or 27%, to $11.26 per barrel in 2010 as comparedto $8.90 per barrel in 2009, primarily due to significantly higher industry diesel fuel margins and our initiatives to improve our margin capture rates,partially offset by lower industry margins for gasoline. Industry diesel fuel margins in the U.S. West Coast region increased, primarily due to strongexports and increased manufacturing activity nationwide. Industry gasoline margins on the U.S. West Coast decreased in 2010 as compared to 2009reflecting poor global demand and higher inventories resulting from high domestic unemployment rates.
During 2010, we reduced our transportation and feedstock costs, realized better refinery yields and improved margins on finished products,which improved consolidated gross margin. Our California refineries benefited from improved product yields and increased throughput ofdiscounted foreign heavy crude oils as these refineries run a high proportion of heavy crude oils (72% of total refining throughput during 2010). Inaddition, we experienced higher gross refining margins at our Mid-Continent refineries due to increased use of discounted local crudes anddowntime at other refineries in the region. See "Industry Overview" for additional information on the increase in industry diesel margins and thedecrease in industry gasoline margins during 2010.
37

Table of Contents
We periodically use non-trading derivative instruments to primarily manage exposure to commodity price risks associated with the purchase orsale of crude oil and finished products. We may also use non-trading derivative instruments to manage price risks associated with inventories aboveor below our target levels. Gains or losses associated with our derivative instruments are included in gross refining margin. Our losses totaled$29 million during 2010 versus $68 million during 2009. Crude prices increased significantly during 2009 compared to marginal increases during2010. This pricing difference and lower price volatility improved derivative results during 2010.
Refining Throughput. Total refining throughput declined 69 Mbpd, or 13%, to 480 Mbpd during 2010 as compared to 549 Mbpd during 2009primarily due to the following:
• the temporary shutdown of processing at the Washington refinery subsequent to the April 2, 2010, naphtha hydrotreater fire. The grossmargin impact of the reduced throughput was partially offset by $55 million in business interruption insurance recoveries recorded as anoffset to cost of sales;
• scheduled turnarounds at our Hawaii, North Dakota, Golden Eagle and Utah refineries.
Total refining throughput during 2009 was impacted by scheduled turnarounds at our Alaska and Golden Eagle refineries, scheduledmaintenance at our Washington refinery and unscheduled downtime at the Los Angeles refinery.
Refined Products Sales. Revenues from sales of refined products increased $3.3 billion, or 21%, to $19.0 billion in 2010 as compared to$15.7 billion in 2009, primarily due to higher average refined product sales prices, partially offset by lower refined product sales volumes. Ouraverage product sales price increased $18.86 per barrel, or 26%, to $91.03 per barrel in 2010 as compared to $72.17 in 2009, due to higher averagecrude oil prices placing upward pressure on product prices. Total refined product sales decreased by 24 Mbpd, or 4%, to 572 Mbpd in 2010 ascompared to 596 Mbpd in 2009, primarily reflecting lower product demand.
Cost of Sales and Expenses. Our average cost of sales increased by $17.73 per barrel, or 27%, to $82.66 per barrel during 2010 as comparedto $64.93 during 2009, reflecting higher average crude oil prices. Manufacturing and other operating expenses increased by $10 million, or 1%, to$1.3 billion in 2010, primarily due to $15 million in charges, net of property insurance recoveries, directly related to the April 2, 2010, incident atthe Washington refinery coupled with higher natural gas costs at our California refineries, partially offset by a $32 million gain in operatingexpenses from the elimination of postretirement life insurance benefits. Refining depreciation and amortization expenses and selling, general andadministrative expenses had nominal changes in 2010 with an increase of $6 million and decrease of $2 million, respectively.
Loss on Asset Disposals and Impairments. Loss on asset disposals decreased by $23 million, or 32%, primarily due to a decrease in thegoodwill write-offs of $33 million, partially offset by an increase in refining equipment impairment charges at our Los Angeles refinery of$8 million. The 2010 goodwill write-off of $10 million was a result of an increase in the net book value of our Hawaii refinery reporting unitcompared to a decrease in its fair value resulting from decreases in forecasted cash flows. For further discussion, see Note E to our consolidatedfinancial statements in Item 8. The $20 million loss on asset disposals at our Los Angeles refinery in 2010 relates to the deferral of a capital projectat our Los Angeles refinery, which resulted in a write-down to fair value of equipment specifically manufactured and uniquely configured for theproject.
2009 Compared to 2008
Overview. Operating income for our refining segment decreased by $572 million, or 91%, to $55 million during 2009 as compared to$627 million during 2008. The decrease primarily reflects a lower gross refining margin partially offset by a decrease in manufacturing and otheroperating expenses of $149 million. The impact of a lower per barrel gross refining margin decreased total gross refining margins by $723 millionduring the year. Operating income included a goodwill write-off of $43 million during 2009 and a bad debt charge of $91 million during 2008. Ouroperating income in both periods benefited from a reduction in cost of sales from decreasing LIFO inventory layers acquired at lower per-barrelcosts. These inventory reductions resulted in operating income improvements of $69 million during 2009 and $138 million during 2008.
38

Table of Contents
Gross Refining Margins. Our gross refining margin per barrel decreased by $2.60 per barrel, or 23%, to $8.90 per barrel in 2009 as comparedto $11.50 per barrel in 2008, due to significantly lower industry diesel fuel and jet fuel margins, partially offset by higher industry margins forgasoline and heavy products. The decrease in industry diesel fuel margins throughout 2009 reflected lower global demand and significantly higherU.S. inventories. Industry gasoline margins on the U.S. West Coast improved in 2009 as compared to 2008 primarily due to heavy scheduled andunscheduled industry downtime and lower average gasoline inventories. Our California region was negatively impacted by a reduction in heavy andlight crude oil price differentials that reduced gross refining margin during 2009, because our California refineries run a high proportion of heavycrude oils (66% of total refining throughput during 2009).
Our derivative losses totaled $68 million during 2009 versus $107 million during 2008. The decrease in our losses reflected the impact ofchanging our hedging strategy. During the 2008 second quarter, we closed the majority of our crude oil derivative positions associated with our longhaul strategy that matched the price of long haul crude oils to crude oil prices on the day of processing.
Refining Throughput. Total refining throughput declined 46 Mbpd, or 8%, to 549 Mbpd during 2009 as compared to 595 Mbpd during 2008,primarily due to matching production to lower demand and the following:
• refinery-wide turnarounds at the Alaska and Golden Eagle refineries;
• scheduled maintenance at the Washington refinery; and
• unscheduled downtime of the delayed coker at the Los Angeles refinery.
Total refining throughput during 2008 was impacted by turnarounds at our Golden Eagle and Washington refineries.
Refined Products Sales. Revenues from sales of refined products decreased $11.1 billion, or 41%, to $15.7 billion in 2009 as compared to$26.8 billion in 2008, primarily due to significantly lower average refined product sales prices and lower refined product sales volumes. Our averageproduct sales price decreased $39.89 per barrel, or 36% to $72.17 per barrel in 2009 as compared to $112.06 per barrel in 2008, reflecting lowerproduct demand and lower average crude oil prices. Total refined product sales decreased 60 Mbpd, or 9%, to 596 Mbpd in 2009 as compared to 656Mbpd in 2008, primarily due to lower product demand.
Cost of Sales and Expenses. Our average cost of sales decreased $37.44, or 37%, to $64.93 per barrel during 2009 as compared to $102.37 perbarrel during 2008, reflecting significantly lower average crude oil prices. Manufacturing and other operating expenses decreased $149 million, or11%, to $1.3 billion in 2009 as compared to $1.4 billion in 2008, due to lower natural gas utility costs and lower refining throughput. Depreciationand amortization increased by $33 million, or 10%, to $359 million during 2009 as compared to $326 million during 2008, reflecting the completionof several capital projects during 2008, including the $600 million delayed coker at the Golden Eagle refinery. The decrease in selling, general andadministrative costs of $95 million, or 75%, from 2008 is related to a $91 million bad debt charge in 2008. The increase of $60 million in loss onasset disposals and impairments primarily reflects a goodwill write-off of $43 million and a net termination charge of $12 million related to acancelled purchase of equipment associated with a capital project at our Los Angeles refinery. The equipment purchase was cancelled as we re-evaluated the scope and timing of the project.
39
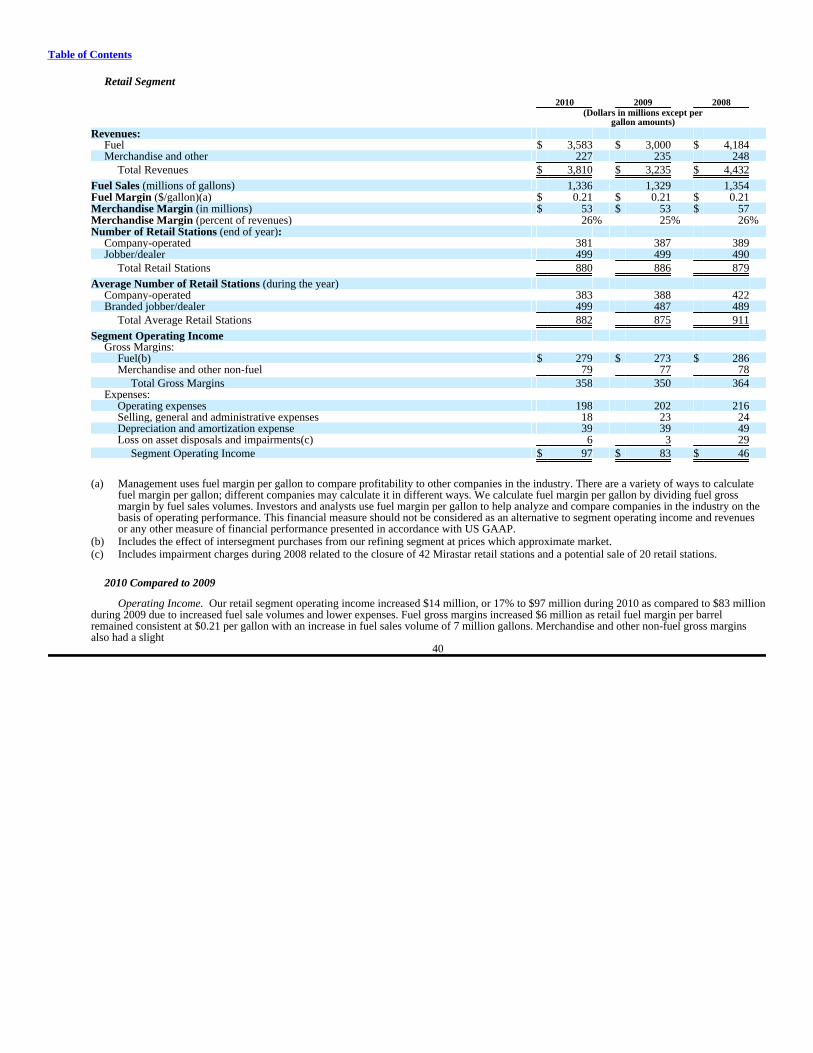
Table of Contents
Retail Segment
2010 2009 2008 (Dollars in millions except per gallon amounts)
Revenues: Fuel $ 3,583 $ 3,000 $ 4,184 Merchandise and other 227 235 248
Total Revenues $ 3,810 $ 3,235 $ 4,432
Fuel Sales (millions of gallons) 1,336 1,329 1,354 Fuel Margin ($/gallon)(a) $ 0.21 $ 0.21 $ 0.21 Merchandise Margin (in millions) $ 53 $ 53 $ 57 Merchandise Margin (percent of revenues) 26% 25% 26%Number of Retail Stations (end of year):
Company-operated 381 387 389 Jobber/dealer 499 499 490
Total Retail Stations 880 886 879
Average Number of Retail Stations (during the year) Company-operated 383 388 422 Branded jobber/dealer 499 487 489
Total Average Retail Stations 882 875 911
Segment Operating Income Gross Margins:
Fuel(b) $ 279 $ 273 $ 286 Merchandise and other non-fuel 79 77 78
Total Gross Margins 358 350 364 Expenses:
Operating expenses 198 202 216 Selling, general and administrative expenses 18 23 24 Depreciation and amortization expense 39 39 49 Loss on asset disposals and impairments(c) 6 3 29
Segment Operating Income $ 97 $ 83 $ 46
(a) Management uses fuel margin per gallon to compare profitability to other companies in the industry. There are a variety of ways to calculatefuel margin per gallon; different companies may calculate it in different ways. We calculate fuel margin per gallon by dividing fuel grossmargin by fuel sales volumes. Investors and analysts use fuel margin per gallon to help analyze and compare companies in the industry on thebasis of operating performance. This financial measure should not be considered as an alternative to segment operating income and revenuesor any other measure of financial performance presented in accordance with US GAAP.
(b) Includes the effect of intersegment purchases from our refining segment at prices which approximate market.
(c) Includes impairment charges during 2008 related to the closure of 42 Mirastar retail stations and a potential sale of 20 retail stations.
2010 Compared to 2009
Operating Income. Our retail segment operating income increased $14 million, or 17% to $97 million during 2010 as compared to $83 millionduring 2009 due to increased fuel sale volumes and lower expenses. Fuel gross margins increased $6 million as retail fuel margin per barrelremained consistent at $0.21 per gallon with an increase in fuel sales volume of 7 million gallons. Merchandise and other non-fuel gross marginsalso had a slight
40

Table of Contents
increase of $2 million resulting from higher average 2010 retail station counts. As a result, total gross margins increased $8 million, or 2%, to$358 million in 2010 as compared to $350 million in 2009.
Fuel sale revenues increased $583 million, or 19%, to $3.6 billion in 2010 as compared to $3.0 billion in 2009, reflecting significantly higheraverage sales prices and a minor increase in fuel sales volumes. Cost of sales increased from 2009 due to higher prices for purchased fuel. Our otherexpenses, excluding the loss on asset disposals and impairments, decreased by $9 million, or 3%, to $255 million during 2010 as compared to$264 million during 2009 primarily due to cost savings from the elimination of postretirement life insurance for current and future retirees of$4 million.
2009 Compared to 2008
Operating Income. Our retail segment operating income increased $37 million, or 80%, to $83 million during 2009 as compared to$46 million in 2008 reflecting lower expenses partially offset by lower gross margins. Operating income during 2008 included impairment chargesof $29 million related to closing 42 Mirastar retail stations and a write-down of 20 other retail stations associated with a potential sale. Total grossmargins decreased $14 million, or 4%, to $350 million in 2009 as compared to $364 million in 2008, reflecting lower sales volumes due to lowergasoline demand and a lower average retail station count. The decrease in average retail station count from 2008 related to closing the 42 Mirastarretail stations.
Fuel sale revenues decreased $1.2 billion, or 28%, to $3.0 billion in 2009, from $4.2 billion in 2008, reflecting significantly lower sales pricesand decreased fuel sales volumes. Cost of sales decreased from 2008 due to lower prices for purchased fuel. Our other expenses, excluding the losson asset disposals and impairments, decreased by $25 million, or 9%, to $264 million during 2009 as compared to $289 million during 2008reflecting a decrease of 36 average retail stations.
Consolidated Results of Operations
Selling, General and Administrative Expenses. Our selling, general and administrative expenses increased $21 million or 10% to $242 millionin 2010 from $221 million in 2009. The increase was primarily due to the impact of higher stock prices on stock-based compensation expenserecorded for our stock appreciation rights and phantom stock options which increased by $15 million and $4 million, respectively. Our stockappreciation rights and phantom stock options are adjusted to fair value at the end of each reporting period. In addition, incentive compensation costsincreased by $13 million during 2010. The increase in 2010 was partially offset by a $15 million gain recognized on the elimination of thepostretirement life insurance benefits for current and future retirees. Of this gain $4 million, $2 million and $9 million relate to refining, retail andcorporate, respectively. Selling, general and administrative expenses decreased by $104 million or 32% to $221 million in 2009 from $325 million in2008 primarily due to a $91 million bad debt charge recorded in 2008.
Interest and Financing Costs. Interest and financing cost increased $27 million or 21% to $157 million in 2010 from $130 million in 2009primarily due to additional interest expense recognized in 2010 as a result of the issuance of our $300 million senior notes in June 2009 and due toincreases in our letter of credit fees resulting from the February 2010 amendment to the Tesoro Corporation Revolving Credit Facility ("RevolvingCredit Facility"). Interest and financing costs increased $19 million or 17% to $130 million in 2009 from $111 million in 2008 due to the issuance ofour $300 million senior notes in June 2009, partially offset by lower outstanding revolver borrowings.
Other Income (Expense). We recorded other expense of $13 million in 2010 primarily as a result of a summary judgment award of$16 million granted in late 2010 related to Chevron's assertion that it was entitled to a share of our 2008 refund from the Trans Alaska PipelineSystem ("TAPS"). In 2008, we recorded $50 million of other income related to a refund we received from TAPS in connection with rulings made bythe Regulatory Commission of Alaska concerning our protest of intrastate pipeline rates.
Income Tax Expense (Benefit). Income tax expense was $4 million in 2010 compared to a benefit of $48 million in 2009 and an expense of$151 million in 2008. The combined federal and state effective tax rates were (16%), 26% and 35% in 2010, 2009 and 2008, respectively. The$4 million of tax expense in 2010 included a $7 million charge relating to the passage of the 2010 health care legislation. The health care legislationmade retiree prescription health care costs non-deductible to the extent of Medicare prescription heath care subsidies received after 2012.
41

Table of Contents
The 2009 tax benefit was reduced by $17 million relating to a goodwill write-off for which there was no corresponding tax basis. The 2008 taxexpense benefited from the favorable settlement of federal tax audits for the years 1996 through 2005.
CAPITAL RESOURCES AND LIQUIDITY
Overview
We operate in an environment where our capital resources and liquidity are impacted by changes in the price of crude oil and refined products,availability of trade credit, market uncertainty and a variety of additional factors beyond our control. These factors include the level of consumerdemand for transportation fuels, weather conditions, fluctuations in seasonal demand, governmental regulations, geo-political conditions and overallmarket and global economic conditions. See "Important Information Regarding Forward-Looking Statements" on page 30 for further informationrelated to risks and other factors. Future capital expenditures, as well as borrowings under our credit facilities and other sources of capital, may beaffected by these conditions.
Our primary sources of liquidity have been cash flows from operations and borrowing availability under revolving lines of credit. We ended2010 with $648 million of cash and cash equivalents, no borrowings under the Revolving Credit Facility and $150 million in borrowings under theTPSA Revolving Credit Facility. Further, we had borrowing ability under our credit agreements as follows (in millions):
Amount Outstanding Total Borrowed Letters of Available Capacity to date Credit Capacity
Tesoro Corporation Revolving Credit Facility(a) $ 1,860 $ — $ 755 $ 1,105 Letter of Credit Agreements 550 — 324 226 TPSA Revolving Credit Facility 350 150 — 200
Total credit agreements $ 2,760 $ 150 $ 1,079 $ 1,531
(a) Borrowing base is the lesser of the amount of the periodically adjusted borrowing base or the agreement's total capacity
We believe available capital resources will be adequate to meet our capital expenditure, working capital and debt service requirements. Wecontinue to focus on maximizing our available cash through the management of working capital, capital expenditures and operating expenses.
Credit Facilities
Tesoro Corporation Revolving Credit Facility
We amended our Revolving Credit Facility in February 2010. Modifications included: lowering the minimum required tangible net worth, thepurchase or sale of certain assets is no longer subject to the fixed charge coverage ratio, the covenant permitting additional unsecured indebtednessincreased the allowable amount of unsecured indebtedness, letters of credit allowed under separate letter of credit agreements are no longer subjectto a cap, the applicable margin was adjusted and the annual rate of commitment fees for the unused portion of the Revolving Credit Facility waslowered.
Our Revolving Credit Facility and senior notes impose various restrictions and covenants that could potentially limit our ability to respond tomarket conditions, raise additional debt or equity capital, pay cash dividends, or repurchase stock. The indentures for our senior notes containcovenants and restrictions which are customary for notes of this nature. These covenants and restrictions limit, among other things, our ability to:
• pay dividends and make other distributions with respect to our capital stock and purchase, redeem or retire our capital stock;
• incur additional indebtedness and issue preferred stock;
• sell assets unless the proceeds from those sales are used to repay debt or are reinvested in our business;
• incur liens on assets to secure certain debt;
• engage in certain business activities; 42

Table of Contents
• make certain payments and distributions from our subsidiaries;
• engage in certain mergers or consolidations and transfers of assets; and
• enter into transactions with affiliates.
Borrowing availability under the Revolving Credit Facility is based on a minimum fixed charge coverage ratio. We have a default covenant,which requires us to maintain specified levels of tangible net worth. We were in compliance with the tangible net worth requirement for the yearended December 31, 2010. The Revolving Credit Facility is guaranteed by substantially all of Tesoro's active domestic subsidiaries and allows up to$100 million of restricted payments during any four-quarter period subject to credit availability exceeding 20% of the borrowing base.
At December 31, 2010, our Revolving Credit Facility provided for borrowings (including letters of credit) up to the lesser of the amount of aperiodically adjusted borrowing base of approximately $2.2 billion (based upon an Alaska North Slope crude oil price of $84 per barrel), consistingof Tesoro's eligible cash and cash equivalents, receivables and petroleum inventories, net of the standard reserve as defined, or the Revolving CreditFacility's total capacity of $1.86 billion. The total capacity can be further increased from $1.86 billion up to $2.0 billion.
Borrowings under the Revolving Credit Facility bear interest at either a base rate (3.25% at December 31, 2010), or a Eurodollar rate (0.26%at December 31, 2010) plus an applicable margin. The applicable margin at December 31, 2010, was 2.25% in the case of the Eurodollar rate, butvaries based upon our Revolving Credit Facility's credit availability and credit ratings. Letters of credit outstanding under the Revolving CreditFacility incur fees at an annual rate tied to the applicable margin described above (2.25% at December 31, 2010). We also incur commitment fees forthe unused portion of the Revolving Credit Facility at an annual rate of 0.50% as of December 31, 2010. Our Revolving Credit Facility expires inMay 2012.
Letter of Credit Agreements
The Revolving Credit Facility allows us to obtain letters of credit under separate letter of credit agreements for foreign crude oil purchases. AtDecember 31, 2010, we had three separate letter of credit agreements. Letters of credit outstanding under these agreements incur fees and aresecured by the petroleum inventories for which they are issued. The letter of credit agreements may be terminated by either party, at any time.
TPSA Revolving Credit Facility
On October 18, 2010, TPSA, a directly and wholly owned subsidiary of Tesoro, entered into a 364-day uncommitted, secured revolving creditagreement. TPSA is an excluded and unrestricted subsidiary from Tesoro's Fourth Amended and Restated Credit Agreement and outstandingindentures. The TPSA Revolving Credit Facility is non-recourse to Tesoro and is guaranteed by TPSA's assets. The TPSA Revolving Credit Facilityincludes two uncommitted facilities, which provide for revolving borrowings ("Revolving Borrowings"), swing line loans and daylight overdraftloans ("TPSA Loans") and letters of credit. Our total capacity under the TPSA facilities can be further increased up to $700 million provided thefacilities' maximum amounts do not exceed $550 million and $350 million, respectively.
Revolving Borrowings bear interest at a Eurodollar rate plus an applicable margin (2.75% as of December 31, 2010), or an alternative baserate (3.25% as of December 31, 2010) plus an applicable margin (1.75% as of December 31, 2010). TPSA Loans bear interest at the alternative baserate plus the applicable margin plus 0.50% per annum.
At December 31, 2010, our TPSA Revolving Credit Facility provided for borrowings (including letters of credit) up to the lesser of the amountof a periodically adjusted borrowing base consisting of TPSA eligible receivables and petroleum inventories, net of reserves or the agreement'scapacity based on the new worth of TPSA. As of December 31, 2010 TPSA's net worth limited the facility to a maximum capacity of $350 million.
The TPSA Revolving Credit Facility contains certain default covenants and conditions relative to TPSA's financial results that, among otherthings, limit TPSA's ability to incur indebtedness or carry inventory levels above certain thresholds. TPSA is also required to maintain specifiedlevels of adjusted tangible net worth (as defined) and adjusted net working capital (as defined). We were in compliance with all of the TPSARevolving Credit Facility's covenants and conditions as of December 31, 2010.
43

Table of Contents
Capitalization
Our capital structure at December 31, 2010 was comprised of (in millions):
Debt, including current maturities: Tesoro Corporation Revolving Credit Facility $ — TPSA Revolving Credit Facility 150 93/4% Senior Notes Due 2019 (net of unamortized discount of $10) 290 61/2% Senior Notes Due 2017 500 65/8% Senior Notes Due 2015 450 61/4% Senior Notes Due 2012 450 Junior subordinated notes due 2012 (net of unamortized discount of $16) 134 Capital lease obligations and other 21
Total Debt 1,995 Stockholders' Equity 3,215
Total Capitalization $ 5,210
At December 31, 2010, our debt-to-capitalization ratio was 38%, compared to 37% at year-end 2009, reflecting $150 million of borrowingsoutstanding on the TPSA Revolving Credit Facility.
Cash Dividends
We did not pay any cash dividends during 2010. During 2009 and 2008, we paid cash dividends on common stock totaling $0.35 per share and$0.40 per share, respectively.
Cash Flow Summary
Components of our cash flows are set forth below (in millions):
2010 2009 2008
Cash Flows from (Used In): Operating activities $ 385 $ 663 $ 716 Investing activities (295) (436) (610)Financing activities 145 166 (109)
Increase (Decrease) in Cash and cash equivalents $ 235 $ 393 $ (3)
2010 Compared to 2009
Net cash from operating activities decreased $278 million, or 42%, to $385 million in 2010 as compared to $663 million in 2009 primarily dueto higher working capital requirements partially offset by a decrease in net losses for the period. Net cash used in investing activities decreased$141 million, or 32% to $295 million in 2010 as compared to $436 million in 2009 primarily due to a decrease in capital expenditures. Net cashfrom financing activities decreased $21 million or 13% to $145 million in 2010 from $166 million in 2009 primarily due to $150 million in netborrowings under the TPSA Revolving Credit Facility in 2010 offset by net proceeds on our senior note issuance of $282 million, net repayments onour revolver of $66 million and dividend payments of $49 million in 2009.
Working capital (excluding cash) was a source of $137 million in cash for the year ending December 31, 2010, primarily related to a run-up incrude and product prices towards the end of the year. We collect our receivables approximately three times faster than we pay our payables, themajority of which settle on the 20th of the month following the date of crude delivery. In a period of rising crude oil and product prices, we collecthigher product prices sooner than we pay for more expensive crude purchases. Inventories increased by approximately seven million barrels fromDecember 31, 2009. This was offset by corresponding increases in accounts payable and current maturities of long-term debt in the statement ofconsolidated cash flows.
44

Table of Contents
2009 Compared to 2008
Net cash from operating activities decreased $53 million, or 7%, to $663 million in 2009 as compared to $716 million in 2008 primarily due tolower cash earnings, partially offset by lower working capital requirements. Net cash used in investing activities decreased $174 million, or 29%, to$436 million in 2009 as compared to $610 million in 2008 primarily as a result of decreased capital expenditures. Net cash from (used in) financingactivities increased $275 million or 252% to $166 million in 2009 from $(109) million in 2008 primarily due to the net proceeds from our seniornotes issuance partially offset by repayments on our revolver and dividend payments.
Gross borrowings under our revolving credit agreement totaled $418 million, and we repaid $484 million in borrowings during 2009. Workingcapital (excluding cash) decreased $264 million at December 31, 2009 from $185 million at December 31, 2008, as payables increased by a largeramount than both receivables and inventories due to higher crude oil prices at year end. Inventories decreased by approximately 4 million barrelsfrom December 31, 2008 reflecting our initiatives to optimize working capital and matching production to lower product demand.
Capital Expenditures
Our capital budget for 2011 is $380 million. Our capital spending during 2010 was $287 million compared to our 2010 capital budget of$470 million. Our 2011 budgeted and 2010 actual capital spending amounts are comprised of the following project categories at December 31, 2010:
Percent of 2011 Percent of 2010Project Category Capital Budget Capital Spending
Regulatory 40% 60%Sustaining 30% 30%Income Improvement 30% 10%
The capital spending plans for 2011 reflect the Company's strategic priorities including continued focus on safety and reliability and greaterfocus on value-driven growth. Sustaining capital expenditures, primarily repairs and maintenance not related to turnaround activity, are expected toremain at about 30% of our total capital expenditures in 2011. Spending on income improvement projects is expected to increase from 10% of allcapital dollars to 30% in 2011 as the company puts greater focus on these value-added projects which are expected to improve yields, reduce costsand expand our infrastructure. Regulatory spending as a percent of total spending declines though total dollars expected to be spent remainsrelatively constant. See "Business Strategy and Overview" and "Environmental Capital Expenditures" for additional information.
Refinery Turnaround Spending
Our 2011 budget for refinery turnarounds and catalyst is $160 million. The turnaround spending is primarily at our Golden Eagle and LosAngeles refineries. Refining throughput and yields in 2011 will be affected by these turnarounds. During 2010, we spent $140 million for refineryturnarounds and catalyst, primarily at our Utah, Golden Eagle, North Dakota and Hawaii refineries.
45
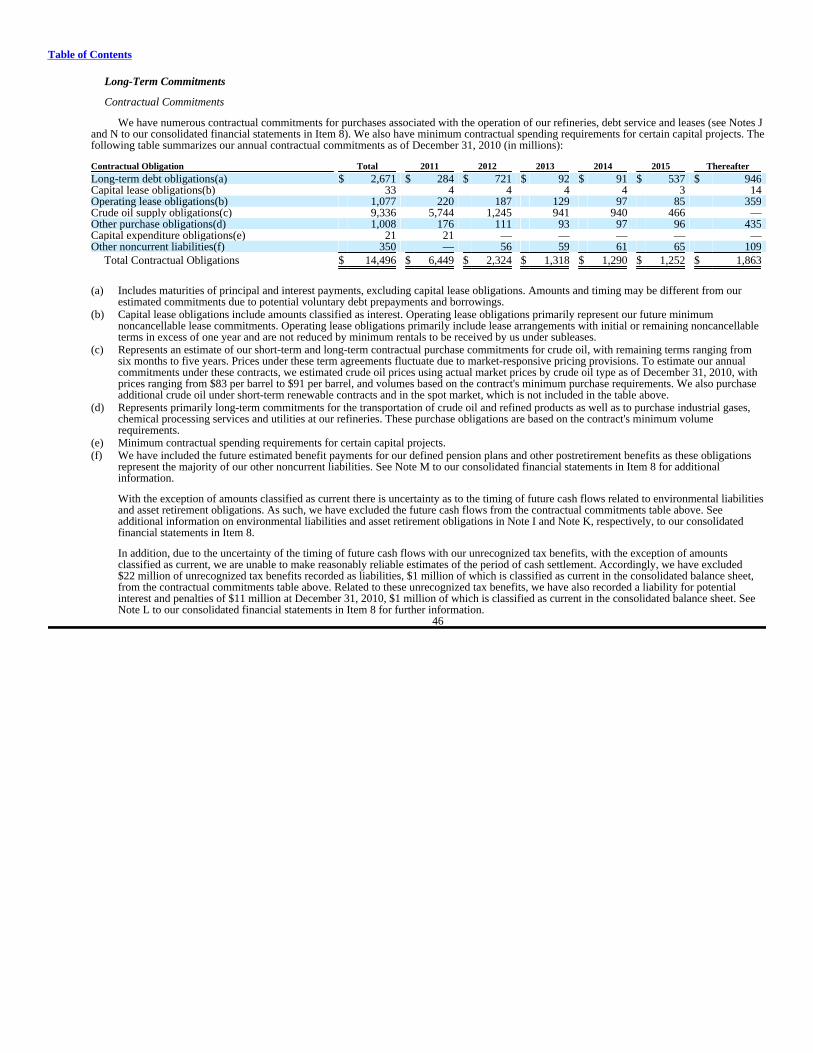
Table of Contents
Long-Term Commitments
Contractual Commitments
We have numerous contractual commitments for purchases associated with the operation of our refineries, debt service and leases (see Notes Jand N to our consolidated financial statements in Item 8). We also have minimum contractual spending requirements for certain capital projects. Thefollowing table summarizes our annual contractual commitments as of December 31, 2010 (in millions):
Contractual Obligation Total 2011 2012 2013 2014 2015 Thereafter
Long-term debt obligations(a) $ 2,671 $ 284 $ 721 $ 92 $ 91 $ 537 $ 946 Capital lease obligations(b) 33 4 4 4 4 3 14 Operating lease obligations(b) 1,077 220 187 129 97 85 359 Crude oil supply obligations(c) 9,336 5,744 1,245 941 940 466 — Other purchase obligations(d) 1,008 176 111 93 97 96 435 Capital expenditure obligations(e) 21 21 — — — — — Other noncurrent liabilities(f) 350 — 56 59 61 65 109
Total Contractual Obligations $ 14,496 $ 6,449 $ 2,324 $ 1,318 $ 1,290 $ 1,252 $ 1,863
(a) Includes maturities of principal and interest payments, excluding capital lease obligations. Amounts and timing may be different from ourestimated commitments due to potential voluntary debt prepayments and borrowings.
(b) Capital lease obligations include amounts classified as interest. Operating lease obligations primarily represent our future minimumnoncancellable lease commitments. Operating lease obligations primarily include lease arrangements with initial or remaining noncancellableterms in excess of one year and are not reduced by minimum rentals to be received by us under subleases.
(c) Represents an estimate of our short-term and long-term contractual purchase commitments for crude oil, with remaining terms ranging fromsix months to five years. Prices under these term agreements fluctuate due to market-responsive pricing provisions. To estimate our annualcommitments under these contracts, we estimated crude oil prices using actual market prices by crude oil type as of December 31, 2010, withprices ranging from $83 per barrel to $91 per barrel, and volumes based on the contract's minimum purchase requirements. We also purchaseadditional crude oil under short-term renewable contracts and in the spot market, which is not included in the table above.
(d) Represents primarily long-term commitments for the transportation of crude oil and refined products as well as to purchase industrial gases,chemical processing services and utilities at our refineries. These purchase obligations are based on the contract's minimum volumerequirements.
(e) Minimum contractual spending requirements for certain capital projects.
(f) We have included the future estimated benefit payments for our defined pension plans and other postretirement benefits as these obligationsrepresent the majority of our other noncurrent liabilities. See Note M to our consolidated financial statements in Item 8 for additionalinformation.
With the exception of amounts classified as current there is uncertainty as to the timing of future cash flows related to environmental liabilitiesand asset retirement obligations. As such, we have excluded the future cash flows from the contractual commitments table above. Seeadditional information on environmental liabilities and asset retirement obligations in Note I and Note K, respectively, to our consolidatedfinancial statements in Item 8.
In addition, due to the uncertainty of the timing of future cash flows with our unrecognized tax benefits, with the exception of amountsclassified as current, we are unable to make reasonably reliable estimates of the period of cash settlement. Accordingly, we have excluded$22 million of unrecognized tax benefits recorded as liabilities, $1 million of which is classified as current in the consolidated balance sheet,from the contractual commitments table above. Related to these unrecognized tax benefits, we have also recorded a liability for potentialinterest and penalties of $11 million at December 31, 2010, $1 million of which is classified as current in the consolidated balance sheet. SeeNote L to our consolidated financial statements in Item 8 for further information.
46
Table of Contents
Off-Balance Sheet Arrangements
Other than our leasing arrangements described in Note N to our consolidated financial statements in Item 8, we have not entered into anytransactions, agreements or other contractual arrangements that would result in off-balance sheet liabilities.
Environmental and Other Matters
We are a party to various litigation and contingent loss situations, including environmental and income tax matters, arising in the ordinarycourse of business. Although we cannot predict the ultimate outcomes of these matters with certainty, we have accrued for the estimated liabilitieswhen appropriate. We believe that the outcome of these matters will not materially impact our liquidity and consolidated financial position, althoughthe resolution of certain of these matters could have a material impact on interim or annual results of operations. Additionally, if applicable, weaccrue receivables for probable insurance or other third-party recoveries.
We are subject to extensive federal, state and local environmental laws and regulations. These laws, which change frequently, regulate thedischarge of materials into the environment and may require us to remove or mitigate the environmental effects of the disposal or release ofpetroleum or chemical substances at various sites, install additional controls, or make other modifications to certain emission sources.
Future expenditures may be required to comply with proposed regulations under the Clean Air Act and other federal, state and localrequirements for our various sites, including our refineries, tank farms, pipelines, operating retail stations, closed retail stations operating refinedproducts terminals and closed refined products terminals. The impact of these legislative and regulatory developments, including any greenhouse gascap-and-trade program or low carbon fuel standards, could result in increased compliance costs, additional operating restrictions on our business,and an increase in the cost of the products we manufacture, which could have an adverse impact on our financial position, results of operations, andliquidity.
In December 2007, the U.S. Congress passed the Energy Independence and Security Act that created a second renewable fuels standard("RFS2"). This standard requires the total volume of renewable transportation fuels (including ethanol and advanced biofuels) sold or introduced inthe U.S. to reach 12.95 billion gallons in 2010, 13.95 billion gallons in 2011 and rise to 36 billion gallons by 2022. The requirements could reducefuture demand growth for petroleum products that we manufacture. In the near term, the RFS2 presents ethanol production and logistics challengesfor the ethanol, alternative fuel and refining and marketing industries. Additional expenditures could be required to logistically accommodate theincreased use of renewable transportation fuels.
In California, Assembly Bill 32 ("AB 32"), created a statewide cap on greenhouse gas emissions and requires that the state return to 1990emission levels by 2020. AB 32 focuses on using market mechanisms, such as a cap-and-trade program and a low carbon fuel standard ("LCFS") toachieve emission reduction targets. The LCFS became effective in January 2010 and requires a 10% reduction in the carbon intensity of gasoline anddiesel fuel by 2020. Final regulations for all other aspects of AB 32, including cap and trade requirements, are being developed by CARB, will takeeffect in 2012, and will be fully implemented by 2020. The implementation and implications of AB 32 will take many years to realize, and wecannot currently predict its impact on our financial position, results of operations and liquidity.
In 2009, the EPA proposed regulating greenhouse gas emissions under the Clean Air Act. The first of these regulations finalized on April 1,2010, sets standards for the control of greenhouse gas emissions from light trucks and cars. It could reduce the demand for our manufacturedtransportation fuels. In addition, other proposed regulations include permitting requirements for stationary sources that emit greenhouse gases abovea certain threshold. The resulting permitting requirements could impose emission controls that increase required capital expenditures at ourrefineries.
We are subject to extensive federal, state and foreign tax laws and regulations. Newly enacted tax laws and regulations, and changes inexisting tax laws and regulations, could result in increased expenditures in the future. We are also subject to audits by federal, state and foreigntaxing authorities in the normal course of business. It is possible that tax audits could result in claims against us in excess of recorded liabilities. Webelieve that resolution of any such claim(s) would not materially affect our consolidated financial position or results of operations. We believe it isreasonably possible that unrecognized tax benefits could decrease by as much as $12 million in the next twelve months through settlements or otherconclusions, primarily regarding state tax issues.
47
Table of Contents
Environmental Liabilities
We are, and expect to continue, incurring expenses for environmental liabilities at a number of currently and previously owned or operatedrefining, pipeline, terminal and retail station properties. We have accrued liabilities for these expenses and believe these accruals are adequate. AtDecember 31, 2010 and December 31, 2009, our accruals for environmental expenditures totaled $108 million and $106 million, respectively. Ourenvironmental accruals are based on estimates including engineering assessments and it is possible that our estimates will change and additionalcosts will be recorded as more information becomes available.
We received $58.5 million in a settlement with a prior owner of our Golden Eagle refinery in 2007 in exchange for assuming responsibility forcertain environmental liabilities arising from operations at the refinery prior to August 2000. These environmental liabilities totaled $62 million and$73 million at December 31, 2010 and 2009, respectively. We cannot reasonably determine the full extent of remedial activities that may be requiredat the Golden Eagle refinery. Therefore, it is possible that we will identify additional remediation costs as more information becomes available. Wehave filed insurance claims under environmental insurance policies that provide coverage up to $190 million for expenditures in excess of the$50 million in self-insurance. Amounts recorded for environmental liabilities have not been reduced for possible insurance recoveries.
We are continuing to investigate conditions at certain active wastewater treatment units at our Golden Eagle refinery. This investigation isdriven by an order from the San Francisco Bay Regional Water Quality Control Board that names us as well as two previous owners of the GoldenEagle refinery. Costs to investigate these conditions are included in our environmental accruals. We cannot currently estimate the amount of theultimate resolution of the order, but we believe it will not have a material adverse effect on our financial position or results of operations.
Washington Refinery Fire
On April 2, 2010, the naphtha hydrotreater unit at our Washington refinery was involved in a fire, which fatally injured seven employees andrendered the unit inoperable. Subsequent to the incident, refinery processing was temporarily shut down until after the unit reconstruction wascompleted. The Washington refinery resumed operations at planned rates in November 2010.
In February 2011, Tesoro Corporation, Tesoro Refining and Marketing Company and other defendants were named in a lawsuit brought by theestates and families of six of the seven fatally injured employees arising from the April 2, 2010 Washington refinery incident. In addition, a third-party propane truck driver has alleged damages in the lawsuit. The lawsuit includes allegations of negligence, premises liability, strict liability,product liability and seeks unspecified compensatory and punitive damages. The Company believes that it has defenses to the allegations containedin the lawsuit. The case of Donald and Peggy Zimmerman et al. v. Tesoro Corporation and Tesoro Refining and Marketing et al. is proceeding inthe Superior Court of the State of Washington, Skagit County. We are still evaluating the allegations contained in the lawsuit, however we believethat the outcome will not materially impact our liquidity and consolidated financial position.
We maintain comprehensive property (including business interruption), workers' compensation, and general liability insurance policies withsignificant loss limits. Our business interruption insurance deductible is satisfied after we have exceeded both 60 days of operational disruption and$25 million in losses primarily based on the operating plan that existed prior to the incident. Our property damage insurance has a $10 milliondeductible. We have filed business interruption insurance claims and property damage claims related to this incident.
During 2010, we collected $55 million in business interruption insurance recoveries that relate to downtime from April 2010 to August 2010,which were recorded as an offset to cost of sales in the consolidated statement of operations. We have filed additional business interruptioninsurance claims and expect to settle remaining matters in the first half of 2011. We also filed claims for $22 million in property damages andrecorded $12 million in property insurance recoveries, net of the $10 million deductible. These amounts were recorded in operating expenses in theconsolidated statement of operations. We do not believe that this tragic incident will have a material adverse effect on our financial position orresults of operations.
Other Matters
In the ordinary course of business, we become party to lawsuits, administrative proceedings and governmental investigations, includingenvironmental, regulatory and other matters. Large, and sometimes unspecified, damages or penalties may be sought from us in some matters forwhich the likelihood of loss may be reasonably possible but the amount of loss is not currently estimable. As a result, we have not establishedaccruals for these matters. On the basis of existing information, we believe that the resolution of these matters, individually or in the aggregate, willnot have a material adverse effect on our financial position or results of operations.
48

Table of Contents
During 2009, Chevron filed a lawsuit against us claiming they are entitled to a share of the refunds we received in 2008 from the owners of theTrans Alaska Pipeline System ("TAPS"). We received $50 million in 2008, net of contingent legal fees, for excessive intrastate rates charged byTAPS during 1997 though 2000, and the period of 2001 through June 2003. Chevron is asserting that it is entitled to a share of its portion of therefunds for retroactive price adjustments under our previous crude oil contracts with them. In September 2010, the trial court judge grantedChevron's motion for summary judgment and awarded them $16 million. We disagree with the trial court and have appealed the decision to theAlaska Supreme Court in which the proceeding is now pending. We have established an accrual for this matter and believe that the outcome will notmaterially impact our liquidity and consolidated financial position.
We are a defendant, along with other manufacturing, supply and marketing defendants, in six lawsuits alleging MTBE contamination ingroundwater. We were served with the sixth lawsuit in April 2010. The defendants are being sued for having manufactured MTBE and havingmanufactured, supplied and distributed gasoline containing MTBE. The plaintiffs in the six cases, all in California, are municipalities andgovernmental authorities. The plaintiffs allege, in part, that the defendants are liable for manufacturing or distributing a defective product. The suitsgenerally seek individual, unquantified compensatory and punitive damages and attorney's fees. We intend to vigorously assert our defenses againstthese claims.
On February 5, 2010, the EPA filed suit against us alleging violations of the Clean Air Act and corresponding regulatory requirementsconcerning the testing and reporting of transportation fuels and fuel additives. In February 2009, we received a Notice of Violation ("NOV") fromthe EPA for the alleged violations arising from a compliance review conducted by the EPA in 2006 for the years 2003 through the time of the reviewin 2006. We are discussing the alleged violations contained in the suit with the EPA and the U.S. Department of Justice and have not established anaccrual for this matter. On the basis of existing information, we believe that the resolution of this matter will not have a material adverse effect onour financial position or results of operations.
On July 21, 2010, the Dodd-Frank Wall Street Reform and Consumer Protection Act, also known as the Financial Reform Act of 2010, wassigned into law. Key provisions of the act require that standardized swaps be cleared through a registered clearinghouse and executed on a registeredtrading platform with specific margin requirements. These requirements could make these products more complicated or costly by creating newregulatory risks and increasing reporting, capital, and administrative requirements for companies that use derivatives for hedging and tradingactivities. Final rules on provisions in the legislation will be established and will take effect twelve months after the date of enactment. Although wecannot predict the ultimate outcome of this legislation, new regulations in this area may result in increased hedging costs and cash collateralrequirements, and ultimately affect liquidity and working capital requirements.
Prior to this year, we received two NOVs from the EPA for the Washington refinery alleging that prior to our acquisition of the refinery,certain modifications were made to the fluid catalytic cracking unit in violation of the Clean Air Act. We have investigated the allegations andbelieve we have defenses to the allegations and intend to vigorously defend ourselves.
Prior to this year, we received a NOV from the EPA concerning our Utah refinery alleging certain violations of the Clean Air Act at therefinery beginning in 2004. We have investigated the allegations contained in the NOV and sent the EPA additional information in 2009.
Environmental Capital Expenditures
The EPA issued regulations in February 2007 that require the reduction of benzene in gasoline. We spent $62 million in 2010, and plan tospend an additional $89 million through 2013 at five of our refineries to comply with the regulations. Our California refineries will not requirecapital spending to meet the benzene reduction standards.
We have evaluated alternative projects for wharves at our Golden Eagle refinery to meet engineering and maintenance standards issued by theState of California in February 2006 and expect a commercial transaction could significantly reduce capital spending requirements. We are currentlyworking with a counterparty on this agreement. Based on the updated alternatives, we expect to spend $15 million through 2013. The timing of theseprojects is being evaluated and is subject to change.
49
Table of Contents
Regulations issued by California's South Coast Air Quality Management District require the emission of nitrogen oxides to be initially reducedin 2011 at our Los Angeles refinery. Currently, we plan to meet this requirement by implementing operational changes, small capital projects and thecontinued management of our emissions credits. We do not expect significant environmental capital expenditures in future years to satisfy thesereductions.
Other projects at our Los Angeles refinery include replacing underground pipelines with above-ground pipelines to comply with an order fromthe California Regional Water Quality Control Board. We spent $3 million in 2010, and do not expect to spend significant environmental capital infuture years to comply with these orders.
We spent approximately $12 million to reconfigure and replace above-ground storage tank systems at our Golden Eagle refinery during 2010to comply with a California Regional Water Quality Board Order. We do not expect significant environmental capital expenditures in future years tocomply with this order.
We spent $13 million in 2010 to install equipment in the first quarter at our Golden Eagle refinery to eliminate the use of atmosphericblowdown towers as emergency relief systems.
We were required under a consent decree with the EPA to reduce air emissions at our North Dakota and Utah refineries. We spent $5 millionin 2010 to install emission controls for nitrogen oxides on boilers and heaters at these refineries. We do not expect significant environmental capitalexpenditures in future years to comply with this order.
The cost estimates for the environmental projects described above are subject to further review and analysis and include estimates forcapitalized interest and labor costs.
Pension Funding
We provide a qualified defined benefit retirement plan for all eligible employees, with benefits based on years of service and compensation.Our long-term expected return on plan assets is 7.5% as of December 31, 2010, and our funded employee pension plan assets experienced a return of$30 million in 2010 and a return of $34 million in 2009. Based on a 5.55% discount rate and fair values of plan assets as of December 31, 2010, thefair values of the assets in our funded employee pension plan were equal to approximately 52% of the projected benefit obligation as of the end of2010. At January 1, 2010 the adjusted funding target attainment percentage (a funding measure defined under applicable pension regulations) was97%. Although Tesoro had no minimum required contribution obligation to its funded employee pension plan under applicable laws and regulationsin 2010, we voluntarily contributed $34 million to improve the funded status of the plan. We currently are not required to fund any contributions in2011 and continue to evaluate our expected 2011 voluntary contributions. Future contributions are affected by returns on plan assets, discount rates,employee demographics, regulatory environments and other factors. See Note M to our consolidated financial statements in Item 8 for furtherdiscussion.
ACCOUNTING STANDARDS
Critical Accounting Policies
Our accounting policies are described in Note A to our consolidated financial statements in Item 8. We prepare our consolidated financialstatements in conformity with US GAAP, which require us to make estimates and assumptions that affect the amounts reported in the consolidatedfinancial statements and accompanying footnotes. Actual results could differ from those estimates. We consider the following policies to be the mostcritical in understanding the judgments that are involved in preparing our financial statements and the uncertainties that could impact our financialcondition and results of operations.
Receivables — Our trade receivables are stated at their invoiced amounts, less an allowance for potentially uncollectible amounts. We monitorthe credit and payment experience of our customers and manage our loss exposure through our credit policies and procedures. The estimatedallowance for doubtful accounts is based on our general loss experience and identified loss exposures on individual accounts. Actual losses couldvary from estimates as global economic conditions and the related credit environment could change.
Property, Plant and Equipment and Acquired Intangibles — We calculate depreciation and amortization using the straight-line method basedon estimated useful lives and salvage values of our assets. When assets are placed into service, we make estimates with respect to their useful livesthat we believe are reasonable. However, factors such as maintenance levels, economic conditions impacting the demand for these assets, andregulatory or environmental requirements could cause us to change our estimates, thus impacting the future calculation of depreciation and
50

Table of Contents
amortization. We evaluate these assets for potential impairment when an asset disposition is probable or when there are indicators of impairment (forexample, current period operating losses combined with a history of operating losses or a temporary shutdown of a refinery) and, if so, assessingwhether the asset net book values are recoverable from estimated future undiscounted cash flows. The actual amount of an impairment loss to berecorded, if any, is equal to the amount by which the asset's net book value exceeds its fair market value. Fair market value is generally based on thepresent values of estimated future cash flows in the absence of quoted market prices. Estimates of future cash flows and fair market values of assetsrequire subjective assumptions with regard to several factors, including an assessment of global market conditions, future operating results andforecasts of the remaining useful lives of the assets. Actual results could differ from those estimates. At December 31, 2010, we evaluated certain ofour refineries for potential impairment and we determined that no impairment charge was necessary.
Goodwill — As of December 31, 2010 and 2009, we had goodwill of $36 million and $46 million, respectively. Goodwill is not amortized, butis tested for impairment annually or more frequently when indicators of impairment exist for the underlying assets. We review the recorded value ofour goodwill for impairment annually during the fourth quarter, or sooner if events or changes in circumstances indicate the carrying amount mayexceed fair value. Recoverability is determined by comparing the estimated fair value of a reporting unit to the carrying value, including the relatedgoodwill, of that reporting unit. We use an income approach based on the present value of expected net cash flows and a market approach based onrecent sales transactions and current stock prices to determine the estimated fair value of our reporting units.
Market conditions associated with the economic recession, including excess product inventories and rising crude oil costs, reduced currentperiod and forecasted earnings within our business and industry as well as quoted market prices for comparable company common stocks andrefinery sales transactions. Decreased forecasted cash flows and quoted market prices reduced our estimated fair value below carrying value atcertain of our refining reporting units resulting in a goodwill write-off of $10 million and $43 million, for the years ended 2010 and 2009,respectively. The estimated fair value of our largest remaining reporting unit with goodwill of approximately $30 million significantly exceeded itscarrying value at year-end. However, our impairment test is subject to change from period to period as it requires us to make cash flow assumptionsabout many things including, future margins, volumes, operating costs, capital expenditures, growth rates and discount rates. Our assumptionsregarding future margins and volumes require significant judgment as actual margins and volumes have fluctuated in the past and will likelycontinue to do so. Changes in market conditions could result in impairment charges in the future.
Environmental Liabilities — At December 31, 2010 and 2009, our total environmental liabilities included in accrued liabilities and othernoncurrent liabilities were $108 million and $106 million, respectively. We record environmental liabilities when environmental assessments and/orproposed environmental remedies are probable and can be reasonably estimated. Generally, the timing of our accruals coincides with assessing theliability and then completing a feasibility study or committing to a formal plan of action. When we complete our analysis or when we commit to aplan of action, we accrue a liability based on the minimum range of the expected costs, unless we consider another amount more likely. We base ourcost estimates on the extent of remedial actions required by applicable governing agencies, experience gained from similar environmental projectsand the amounts to be paid by other responsible parties. Accruals for our environmental liabilities require judgment due to the uncertainties relatedto the magnitude of the liability and timing of the remediation effort. Our environmental liability estimates are subject to change due to potentialchanges in environmental laws, regulations or interpretations, additional information related to the extent and nature of the liability, and potentialimprovements in remediation technologies. We do not discount our estimated liabilities to present value.
Legal Liabilities — In the ordinary course of business, we become party to lawsuits, administrative proceedings, and governmentalinvestigations. These matters may involve large or unspecified damages or penalties that may be sought from us and may require years to resolve.We record a liability related to a loss contingency attributable to such legal matters if we determine the loss to be both probable and estimable. Theliability is recorded for an amount that is management's best estimate of the loss, or when a best estimate cannot be made, the minimum loss amountof a range of possible outcomes. Significant judgment is required in estimating such liabilities, the results of which can vary significantly from actuallitigation results.
Income Taxes — As part of the process of preparing our consolidated financial statements, we must assess the likelihood that our deferredincome tax assets will be recovered through future taxable income. We must establish a valuation allowance to the extent we believe that recovery isnot likely. Significant management judgment is required in determining any valuation allowance recorded against deferred income tax assets. Wehave recorded a
51
Table of Contents
valuation allowance of $9 million on certain state credit carryforwards as of December 31, 2010 based on our estimates of taxable income in eachjurisdiction in which we operate and the period over which deferred income tax assets will be recoverable. We may need to establish an additionalvaluation allowance if actual results differ from these estimates or we make adjustments to these estimates in future periods. We also recognize thefinancial statement effects of a tax position when it is more likely than not that the position will be sustained upon examination. Tax positions thatare not recognized that we have taken or expect to take, are recorded as liabilities. Our liability for unrecognized tax benefits, including interest andpenalties totaled $33 million and $57 million at December 31, 2010 and 2009, respectively.
Asset Retirement Obligations — Our asset retirement obligations totaled $30 million and $34 million at December 31, 2010 and 2009,respectively. We record asset retirement obligations in the period in which the obligations are incurred and a reasonable estimate of fair value can bemade. We use the present value of expected cash flows using third-party estimates or historical data to estimate fair value. The calculation of fairvalue is based on several estimates and assumptions, including projected cash flows, inflation, a discount rate, the settlement dates or a range ofpotential settlement dates and the probabilities associated with settlement. We consider our past practice, industry practice, management's intent andestimated economic lives to estimate settlement dates. Our estimates are subject to change due to potential changes in laws, regulations orinterpretations, additional information related to the extent and nature of the retirement and technological improvements associated with theretirement activities. We cannot currently make reasonable estimates of the fair values of some retirement obligations, principally those associatedwith our refineries, pipelines and certain terminals and retail stations, because the related assets have indeterminate useful lives which precludedevelopment of assumptions about the potential timing of settlement dates. Such obligations will be recognized in the period in which sufficientinformation exists to estimate a range of potential settlement dates.
Pension and Other Postretirement Benefits — Accounting for pensions and other postretirement benefits involves several assumptions andestimates including discount rates, expected rate of return on plan assets, rates of compensation, health care cost trends, inflation, retirement ratesand mortality rates. We must assume a rate of return on funded pension plan assets in order to estimate our obligations under our defined benefitplans. Due to the nature of these calculations, we engage an actuarial firm to assist with these estimates and the calculation of certain employeebenefit expenses. We record an asset for our plans overfunded status or a liability if the plans are underfunded. The funded status represents thedifference between the fair value of our plans assets and its projected benefit obligations. While we believe the assumptions we used are appropriate,significant differences in actual experience or significant changes in assumptions would affect pension and other postretirement benefits costs andobligations. We determine the discount rate primarily by reference to rates of high quality corporate bonds that mature in a pattern similar to theexpected payments to be made under our plans. The expected return on plan assets is based upon the weighted averages of the expected long-termrates of return for the broad categories of investments held in our plans. These assumptions can have a significant effect on the amounts reported inour consolidated financial statements.
A one-percentage-point change in the expected return on plan assets and discount rate for the pension plans would have had the followingeffects in 2010 (in millions):
1-Percentage- 1-Percentage- Point Increase Point Decrease
Expected Rate of Return: Effect on net periodic pension expense $ (3) $ 3
Discount Rate: Effect on net periodic pension expense $ (13) $ 15 Effect on projected benefit obligation $ (82) $ 97
See Note M to our consolidated financial statements in Item 8 for more information regarding costs and assumptions. 52

Table of Contents
Stock-Based Compensation — We follow the fair value method of accounting for stock-based compensation. We estimate the fair value ofoptions and certain other stock-based awards using the Black-Scholes option-pricing model or a Monte Carlo simulation with assumptions basedprimarily on historical data. The Black-Scholes option-pricing model requires assumptions including the expected term the stock-based awards areheld until exercised, the estimated volatility of our stock price over the expected term, and the number of awards that will be forfeited prior tovesting. The Monte-Carlo simulation takes into account the same input assumptions as the Black-Scholes option-pricing model as outlined above,however, it also incorporates into the fair-value determination the possibility that the market condition may not be satisfied and impact of thepossible differing stock price paths. Changes in our assumptions may impact the expenses related to our stock-based awards. The fair values of ourstock appreciation rights, phantom stock options and performance unit awards are estimated at the end of each reporting period and are recorded asliabilities. Changes in our assumptions may impact our liabilities and expenses associated with our stock-based awards.
New Accounting Standards and Disclosures
Fair Value Measurements
We adopted a standard on January 1, 2009, that expanded the framework and disclosures for measuring the fair value of nonfinancial assetsand nonfinancial liabilities, including:
• acquired or impaired goodwill;
• the initial recognition of asset retirement obligations; and
• impaired property, plant and equipment.
The adoption of this standard did not impact our financial position or results of operations.
In January 2010, the FASB amended the standard covering fair value measurements to require additional disclosures, including transfers inand out of levels 1 and 2 fair value measurements, the gross basis presentation of the reconciliation of level 3 fair value measurements, and fair valuemeasurement disclosure at the class level, as opposed to category level, as previously required. This guidance is effective for interim and annualreporting periods beginning after December 15, 2009, except for disclosures related to level 3 fair value measurements, which are effective for fiscalyears beginning after December 15, 2010 (including interim periods). The adoption of the amendment did not impact our financial position or resultsof operations.
Variable Interest Entities
The FASB issued a standard in June 2009 that amends previous guidance on variable interest entities. The standard modifies the criteria fordetermining whether an entity is a variable interest entity and requires ongoing reassessments of whether an enterprise is the primary beneficiary of avariable interest entity and an analysis to determine whether the enterprise's variable interest(s) give it a controlling financial interest in a variableinterest entity. This standard became effective January 1, 2010, and did not impact our financial position or results of operations.
53
Table of Contents
ITEM 7A. QUANTITATIVE AND QUALITATIVE DISCLOSURES ABOUT MARKET RISK
Our primary source of market risk is the difference between the prices we sell our refined products for and the prices we pay for crude oil andother feedstocks. We may use derivative instruments to manage the risks from changes in the prices of crude oil and refined products, fluctuations inforeign currency exchange rates, or to capture market opportunities. We have a risk committee whose responsibilities include reviewing a quarterlyassessment of risks to the corporation and presenting a quarterly risk report to executive management for consideration.
Commodity Price Risks
Tesoro Refining and Marketing
Our earnings and cash flows from operations depend on the margin, relative to fixed and variable expenses (including the costs of crude oiland other feedstocks), at which we are able to sell our refined products. The prices of crude oil and refined products have fluctuated substantially inrecent years and depend on many factors. These factors include the global supply and demand for crude oil and refined products. This demand isimpacted by changes in the global economy, the level of foreign and domestic production of crude oil and refined products, geo-political conditions,the availability of imports of crude oil and refined products, the relative strength of the U.S. dollar, the marketing of alternative and competing fuelsand the impact of government regulations. The prices we sell our refined products for are also affected by local factors such as local marketconditions and the level of operations of other suppliers in our markets.
Prices for refined products are influenced by the price of crude oil. Generally, an increase or decrease in the price of crude oil results in acorresponding increase or decrease in the price of gasoline and other refined products. The timing, direction and the overall change in refinedproduct prices versus crude oil prices will impact profit margins and could have a significant impact on our earnings and cash flows. Assuming allother factors remained constant, a $1 per barrel change in average gross refining margins, based on the average throughput from 2008 to 2010 of 541Mbpd, would change annualized pretax operating income by approximately $200 million.
We maintain inventories of crude oil, intermediate products and refined products, the values of which are subject to fluctuations in marketprices. Our inventories of refinery feedstocks and refined products totaled 27 million barrels and 20 million barrels at December 31, 2010 and 2009,respectively. The average cost of our refinery feedstocks and refined products at December 31, 2010, was approximately $42 per barrel on a LIFObasis, compared to market prices of approximately $96 per barrel. If market prices decline to a level below the average cost of these inventories, wewould be required to write down the carrying value of our inventory to market.
We periodically use non-trading derivative instruments to primarily manage exposure to commodity price risks associated with the purchase orsale of crude oil and finished products. We may also use non-trading derivative instruments to manage price risks associated with inventories aboveor below our target levels. These derivative instruments typically include exchange-traded futures and over-the-counter swaps and options, generallywith durations of less than one year. We continue to monitor our hedging strategy in 2011.
We mark-to-market our derivative instruments and recognize the changes in their fair value in our statements of consolidated operations. Weelected not to designate our derivative instruments as fair value hedges during 2009. In the fourth quarter of 2010, we began using fair value hedgeaccounting for a portion of our TPSA inventory.
Net earnings during 2010 and 2009 included net losses of $29 million and $68 million, respectively, on our derivative positions comprised ofthe following (dollars in millions and volumes in millions of barrels):
2010 2009 Contract Net Contract Net Gain Volumes Loss Volumes (Loss)
Unrealized loss carried on open positions from prior year 1 $ (2) 1 $ (18)Settled derivative positions 427 (18) 287 (52)Unrealized gain (loss) on open positions 5 (9) 1 2
Net loss $ (29) $ (68)
Our open positions at December 31, 2010, will expire at various times primarily during 2011. We prepared a sensitivity analysis to estimateour exposure to market risk associated with our derivative instruments. This analysis may differ from actual results. Based on our open net positionsof five million barrels at December 31, 2010, a $1.00
54
Table of Contents
per-barrel change in quoted market prices of our derivative instruments, assuming all other factors remain constant, could change the fair value ofour derivative instruments and pretax operating income by approximately $5 million.
Tesoro Panama Company Sociedad Anonima
We formed TPSA to use our leased pipeline and tank facilities in Panama by enhancing strategic partnerships, developing economies of scalearound freight and storage opportunities, providing discretionary crude oil trading, expanding global commercial relationships and evaluatingopportunities to source crude from alternative supply markets. We may use our excess storage capacity in Panama to take advantage of contangomarkets, when the price of crude oil is higher in the future than the current spot price. We use commodity derivatives to hedge crude oil held inconnection with these arbitrage opportunities. The above table and sensitivity analysis includes approximately two million barrels in open derivativepositions at December 31, 2010, entered into to manage exposure to commodity price risks associated with TPSA. The above sensitivity analysis, asit relates to these derivative instruments on a stand-alone basis, would not materially change the fair value of trading derivative instruments or pre-tax operating income.
We use fair value hedge accounting for certain derivatives instruments acquired by TPSA and the crude oil inventory underlying theseinstruments. If we designate a hedging relationship as a fair value hedge, we record the changes in fair value of the hedged asset or liability and anyineffective portion in cost of sales in our statements of consolidated operations.
Risk Management
The Company has a system of governance and management oversight and has put in place a number of controls to ensure procedures areproperly followed and accountability is present at the appropriate levels. For example, the Company has put in place controls designed to:
• create and maintain a comprehensive risk management policy;
• provide for authorization by the appropriate levels of management;
• provide for segregation of duties;
• maintain an appropriate level of knowledge regarding the execution of and the accounting for derivative instruments; and
• have key performance indicators in place to adequately measure the performance of its hedging activities.
The Company believes the governance structure that it has in place is adequate given the size and sophistication of its hedging program.
Counterparty Credit Risk
We have exposure to concentrations of credit risk related to the ability of our counterparties to meet their contractual payment obligations, andthe potential non-performance of counterparties to deliver contracted commodities or services at the contracted price. We have risk managementpolicies in place, and continue to monitor closely the status of our counterparties. We perform ongoing credit evaluations of our customers' financialcondition, and in certain circumstances, require prepayments, letters of credit or other collateral.
Foreign Currency Risk
We are exposed to exchange rate fluctuations on our purchases of Canadian crude oil. Beginning in August 2009, we have entered intoforward contracts of Canadian dollars to manage any monthly exchange rate fluctuations. We had approximately $1 million in losses related to thesetransactions for the year ended December 31, 2010. As of December 31, 2010, we had a forward contract to purchase 65 million Canadian dollarsthat matured on January 25, 2011. Based on our open forward contract position, a $0.01 change in the Canadian dollar to U.S. dollar exchange ratewould change operating income by less than $1 million.
55

Table of Contents
ITEM 8. FINANCIAL STATEMENTS AND SUPPLEMENTARY DATA
REPORT OF INDEPENDENT REGISTERED PUBLIC ACCOUNTING FIRM
To the Board of Directors and Stockholders ofTesoro Corporation
We have audited the accompanying consolidated balance sheets of Tesoro Corporation as of December 31, 2010 and 2009, and the relatedconsolidated statements of operations, comprehensive income (loss) and stockholders' equity, and cash flows for each of the three years in the periodended December 31, 2010. These financial statements are the responsibility of the Company's management. Our responsibility is to express anopinion on these financial statements based on our audits.
We conducted our audits in accordance with the standards of the Public Company Accounting Oversight Board (United States). Thosestandards require that we plan and perform the audit to obtain reasonable assurance about whether the financial statements are free of materialmisstatement. An audit includes examining, on a test basis, evidence supporting the amounts and disclosures in the financial statements. An auditalso includes assessing the accounting principles used and significant estimates made by management, as well as evaluating the overall financialstatement presentation. We believe that our audits provide a reasonable basis for our opinion.
In our opinion, the financial statements referred to above present fairly, in all material respects, the consolidated financial position of TesoroCorporation at December 31, 2010 and 2009, and the consolidated results of its operations and its cash flows for each of the three years in the periodended December 31, 2010, in conformity with U.S. generally accepted accounting principles.
We also have audited, in accordance with the standards of the Public Company Accounting Oversight Board (United States), TesoroCorporation's internal control over financial reporting as of December 31, 2010, based on criteria established in Internal Control-IntegratedFramework issued by the Committee of Sponsoring Organizations of the Treadway Commission and our report dated March 1, 2011 expressed anunqualified opinion thereon.
/s/ ERNST & YOUNG LLP
San Antonio, TexasMarch 1, 2011
56
Table of Contents
TESOROCORPORATION
STATEMENTS OF CONSOLIDATED OPERATIONS
Years Ended December 31, 2010 2009 2008 (In millions except per share amounts)
REVENUES(a) $ 20,583 $ 16,872 $ 28,416 COSTS AND EXPENSES:
Cost of sales(a) 18,251 14,739 25,546 Operating expenses 1,474 1,469 1,631 Selling, general and administrative expenses 242 221 325 Depreciation and amortization expense 422 426 401 Loss on asset disposals and impairments 54 74 42
OPERATING INCOME (LOSS) 140 (57) 471 Interest and financing costs (157) (130) (111)Interest income 3 4 7 Foreign currency exchange gain (loss) 2 (5) 12 Other income (expense) (13) — 50
EARNINGS (LOSS) BEFORE INCOME TAXES (25) (188) 429 Income tax expense (benefit) 4 (48) 151
NET EARNINGS (LOSS) $ (29) $ (140) $ 278
NET EARNINGS (LOSS) PER SHARE: Basic $ (0.21) $ (1.01) $ 2.03 Diluted $ (0.21) $ (1.01) $ 2.00
WEIGHTED AVERAGE COMMON SHARES: Basic 140.6 138.2 136.8 Diluted 140.6 138.2 139.2
DIVIDENDS PER SHARE $ 0.00 $ 0.35 $ 0.40 SUPPLEMENTAL INFORMATION: (a) Includes excise taxes collected by our retail segment $ 330 $ 283 $ 278
The accompanying notes are an integral part of these consolidated financial statements. 57

Table of Contents
TESOROCORPORATION
CONSOLIDATED BALANCE SHEETS
December 31, 2010 2009 (Dollars in millions except per share amounts)
ASSETSCURRENT ASSETS
Cash and cash equivalents $ 648 $ 413 Receivables, less allowance for doubtful accounts 908 1,116 Inventories 1,257 622 Prepayments and other 115 72
Total Current Assets 2,928 2,223
PROPERTY, PLANT AND EQUIPMENT Refining 5,984 5,789 Retail 659 647 Corporate and other 204 213
6,847 6,649 Less accumulated depreciation and amortization (1,677) (1,459)
Net Property, Plant and Equipment 5,170 5,190
OTHER NONCURRENT ASSETS Acquired intangibles, net 246 255 Other, net 388 402
Total Other Noncurrent Assets 634 657
Total Assets $ 8,732 $ 8,070
LIABILITIES AND STOCKHOLDERS' EQUITY
CURRENT LIABILITIES Accounts payable $ 1,852 $ 1,441 Accrued liabilities 492 444 Current maturities of debt 152 4
Total Current Liabilities 2,496 1,889
DEFERRED INCOME TAXES 616 505 OTHER NONCURRENT LIABILITIES 562 752 DEBT 1,843 1,837 COMMITMENTS AND CONTINGENCIES (Note N) STOCKHOLDERS' EQUITY Common stock, par value $0.162/3; authorized 200,000,000 shares; 149,105,570 shares issued
(147,295,424 in 2009) 25 24 Additional paid-in capital 970 947 Retained earnings 2,398 2,427 Treasury stock, 5,925,541 common shares (6,867,848 in 2009), at cost (128) (140)Accumulated other comprehensive loss (50) (171)
Total Stockholders' Equity 3,215 3,087
Total Liabilities and Stockholders' Equity $ 8,732 $ 8,070
The accompanying notes are an integral part of these consolidated financial statements. 58

Table of Contents
TESOROCORPORATION
STATEMENTS OF CONSOLIDATEDCOMPREHENSIVE INCOME (LOSS) AND
STOCKHOLDERS' EQUITY
Stockholders' Equity Accumulated Other Additional Comprehensive Comprehensive Common Stock Paid-In Retained Treasury Stock Income Income (Loss) Shares Amount Capital Earnings Shares Amount (Loss)
(In millions)
AT DECEMBER 31, 2007 144.5 $ 24 $ 876 $ 2,393 (7.5) $ (151) $ (90)Net earnings 278 — — — 278 — — — Cash dividends — — — — (55) — — — Repurchases of common stock — — — — — (0.2) (5) — Shares issued for stock options and benefit plans — 0.7 — 25 — 0.3 9 — Excess tax benefits from stock-based compensation arrangements
exercised — — — 3 — — — — Restricted common stock grants and amortization — 0.6 — 12 — — — — Other comprehensive loss:
Pension and other benefit liability adjustments (net of tax benefit of$65) (101) — — — — — — (101)
Total Comprehensive Income $ 177
AT DECEMBER 31, 2008 145.8 $ 24 $ 916 $ 2,616 (7.4) $ (147) $ (191)Net loss (140) — — — (140) — — — Cash dividends — — — — (49) — — — Repurchases of common stock — — — — — (0.1) (2) — Shares issued for stock options and benefit plans — 0.6 — 17 — 0.6 9 — Restricted common stock grants and amortization — 0.9 — 14 — — — — Other comprehensive income:
Pension and other benefit liability adjustments (net of tax expenseof $13) 20 — — — — — — 20
Total Comprehensive Loss $ (120)
AT DECEMBER 31, 2009 147.3 $ 24 $ 947 $ 2,427 (6.9) $ (140) $ (171)Net loss (29) — — — (29) — — — Repurchases of common stock — — — — — (0.2) (2) — Shares issued for stock options and benefit plans — 0.9 1 11 — 1.1 14 — Excess tax benefits from stock-based compensation arrangements
exercised — — — (1) — — — — Restricted common stock grants and amortization — 0.9 — 13 — 0.1 — — Other comprehensive income:
Pension and other benefit liability adjustments (net of tax expense of$77) 121 — — — — — — 121
Total Comprehensive Income $ 92
AT DECEMBER 31, 2010 149.1 $ 25 $ 970 $ 2,398 (5.9) $ (128) $ (50)
The accompanying notes are an integral part of these consolidated financial statements. 59
Table of Contents
TESOROCORPORATION
STATEMENTS OF CONSOLIDATED CASH FLOWS
Years Ended December 31, 2010 2009 2008 (In millions)
CASH FLOWS FROM (USED IN) OPERATING ACTIVITIES Net earnings (loss) $ (29) $ (140) $ 278
Adjustments to reconcile net earnings (loss) to net cash from (used in) operating activities: Depreciation and amortization expense 422 426 401 Amortization of debt issuance costs and discounts 18 13 11 Loss on asset disposals and impairments 54 74 42 Stock-based compensation expense 58 46 14 Provision for bad debts 1 9 95 Deferred income taxes 9 95 89 Excess tax benefits from stock-based compensation arrangements (3) (2) (3)Other changes in non-current assets and liabilities (136) (103) (64)
Changes in current assets and current liabilities: Receivables 208 (387) 410 Inventories (635) 165 413 Prepayments and other (34) 17 28 Accounts payable and accrued liabilities 452 450 (998)
Net cash from operating activities 385 663 716
CASH FLOWS FROM (USED IN) INVESTING ACTIVITIES Capital expenditures (297) (437) (650)Proceeds from asset sales 2 1 40
Net cash used in investing activities (295) (436) (610)
CASH FLOWS FROM (USED IN) FINANCING ACTIVITIES Proceeds from debt offerings, net of discount and issuance costs — 282 — Borrowings under revolving credit agreements 216 418 5,658 Repayments on revolving credit agreements (66) (484) (5,712)Repayments of debt (3) (2) (2)Dividend payments — (49) (55)Proceeds from stock options exercised 5 4 5 Repurchases of common stock (2) (2) (5)Excess tax benefits from stock-based compensation arrangements 3 2 3 Financing costs and other (8) (3) (1)
Net cash from (used in) financing activities 145 166 (109)
INCREASE (DECREASE) IN CASH AND CASH EQUIVALENTS 235 393 (3)CASH AND CASH EQUIVALENTS, BEGINNING OF YEAR 413 20 23
CASH AND CASH EQUIVALENTS, END OF YEAR $ 648 $ 413 $ 20
SUPPLEMENTAL CASH FLOW DISCLOSURES Interest paid, net of capitalized interest $ 115 $ 95 $ 84 Income taxes paid (refunded), net $ (112) $ (18) $ 45
SUPPLEMENTAL DISCLOSURE OF NON-CASH INVESTING ACTIVITIES Capital expenditures included in accounts payable and accrued liabilities at end of period $ 23 $ 34 $ 70
The accompanying notes are an integral part of these consolidated financial statements. 60

Table of Contents
TESOROCORPORATION
NOTES TO CONSOLIDATED FINANCIAL STATEMENTS
NOTE A — SUMMARY OF SIGNIFICANT ACCOUNTING POLICIES
Description and Nature of Business
As used in this report, the terms "Tesoro," "we," "us," or "our" may refer to Tesoro Corporation, one or more of its consolidated subsidiaries orall of them taken as a whole.
Tesoro Corporation was incorporated in Delaware in 1968. Based in San Antonio, Texas, we are one of the largest independent petroleumrefiners and marketers in the United States. Our subsidiaries, operating through two business segments, primarily manufacture and sell transportationfuels. Our refining operating segment ("refining"), which operates seven refineries in the western United States, refines crude oil and otherfeedstocks into transportation fuels, such as gasoline, gasoline blendstocks, jet fuel and diesel fuel, as well as other products, including heavy fueloils, liquefied petroleum gas, petroleum coke and asphalt. Our refineries have a combined crude oil capacity of 665 thousand barrels per day("Mbpd"). This operating segment sells refined products in wholesale and bulk markets to a wide variety of customers within the operations area.Our retail operating segment ("retail") sells transportation fuels and convenience products in 15 states through a network of 880 retail stations,primarily under the Tesoro®, Shell®, USA Gasolinetm, and Mirastar® brands.
Our earnings, cash flows from operations and liquidity depend upon many factors, including producing and selling refined products at marginsabove fixed and variable expenses. The prices of crude oil and refined products have fluctuated substantially in our markets. Our operations aresignificantly influenced by the timing of changes in crude oil costs and how quickly refined product prices adjust to reflect these changes. Theseprice fluctuations depend on numerous factors beyond our control, including the global supply and demand for crude oil and refined products, whichare subject to, among other things, changes in the global economy and the level of foreign and domestic production of crude oil and refinedproducts, geo-political conditions, availability of crude oil and refined product imports, the infrastructure to transport crude oil and refined products,weather conditions, earthquakes and other natural disasters, seasonal variations, government regulations, threatened or actual terrorist incidents oracts of war, and local factors, including market conditions and the level of operations of other suppliers in our markets. As a result of these factors,margin fluctuations during any reporting period can have a significant impact on our results of operations, cash flows, liquidity and financialposition.
Principles of Consolidation and Basis of Presentation
The accompanying consolidated financial statements include the accounts of Tesoro and its subsidiaries. All intercompany accounts andtransactions have been eliminated. Certain investments are carried at cost. These investments are not material, either individually or in the aggregate,to Tesoro's financial position, results of operations or cash flows. We have evaluated subsequent events through the filing of this Form 10-K. Anymaterial subsequent events that occurred during this time have been properly recognized or disclosed in our financial statements.
Use of Estimates
We prepare our consolidated financial statements in conformity with accounting principles generally accepted in the United States of America,which requires management to make estimates and assumptions that affect the reported amounts of assets and liabilities and disclosures ofcontingent assets and liabilities at the date of the financial statements and the reported amounts of revenues and expenses during the year. We reviewour estimates on an ongoing basis, based on currently available information. Changes in facts and circumstances may result in revised estimates andactual results could differ from those estimates.
Cash and Cash Equivalents
Cash and cash equivalents include bank deposits and low-risk short-term investments with original maturities of three months or less at thetime of purchase. Our cash investment policy disallows investments with sub-prime market exposure. Cash equivalents are stated at cost, whichapproximates market value.
61

Table of Contents
TESOROCORPORATION
NOTES TO CONSOLIDATED FINANCIAL STATEMENTS — (Continued)
Receivables
Our receivables primarily consist of customer accounts receivable, including proprietary credit card receivables. Credit is extended based onan evaluation of the customer's financial condition and in certain circumstances, collateral, such as letters of credit or guarantees, is required. Ourreserve for bad debts is based on factors including current sales amounts, historical charge-offs and specific accounts identified as high risk.Uncollectible accounts receivable are charged against the allowance for doubtful accounts when reasonable efforts to collect the amounts due havebeen exhausted.
Financial Instruments
The carrying value of our financial instruments, including cash and cash equivalents, receivables, accounts payable and certain accruedliabilities approximate fair value because of the short maturities of these instruments. We estimate the fair value for our debt primarily using quotedmarket prices.
Inventories
Inventories are stated at the lower of cost or market. We use last-in, first-out ("LIFO") as the primary method to determine the cost of crude oilheld by our U.S. subsidiaries ("domestic crude oil") and refined product inventories in our refining and retail segments. We determine the carryingvalue of inventories of crude oil held by our foreign subsidiaries ("foreign subsidiary crude oil"), oxygenates and by-products using the first-in, first-out ("FIFO") cost method. We value merchandise along with materials and supplies at average cost.
We use commodity derivatives to manage price volatility associated with our foreign subsidiary crude oil inventories. In the fourth quarter of2010, we began designating certain commodity derivatives as fair value hedges for accounting purposes. Subsequent to the designation of those fairvalue hedging relationships, changes in fair value of the designated hedged inventory have been recorded in inventory on our consolidated balancesheet and have been recorded in cost of sales in our statements of consolidated operations.
Property, Plant and Equipment
We capitalize the cost of additions, major improvements and modifications to property, plant and equipment. We compute depreciation ofproperty, plant and equipment using the straight-line method, based on the estimated useful life of each asset. We record property under capitalleases at the lower of the present value of minimum lease payments using our incremental borrowing rate or the fair value of the leased property atthe date of lease inception. We depreciate leasehold improvements and property acquired under capital leases over the lesser of the lease term or theeconomic life of the asset. Depreciation expense totaled $266 million, $276 million and $253 million for 2010, 2009 and 2008, respectively.
We capitalize interest as part of the cost of major projects during the construction period. Capitalized interest totaled $19 million, $25 millionand $27 million during 2010, 2009 and 2008, respectively, and is recorded as a reduction to interest and financing costs.
Asset Retirement Obligations
An asset retirement obligation ("ARO") is an estimated liability for the cost to retire a tangible asset. We record AROs at fair value in theperiod in which we have a legal obligation to incur these costs and can make a reasonable estimate of the fair value of the liability. When the liabilityis initially recorded, we capitalize the cost by increasing the book value of the related long-lived tangible asset. The liability is accreted to itsestimated settlement value and the related capitalized cost is depreciated over the asset's useful life. We recognize a gain or loss at settlement for anydifference between the settlement amount and the recorded liability. We estimate settlement dates by considering our past practice, industry practice,management's intent and estimated economic lives.
62
Table of Contents
TESOROCORPORATION
NOTES TO CONSOLIDATED FINANCIAL STATEMENTS — (Continued)
We cannot currently estimate the fair value for certain AROs primarily because we cannot estimate settlement dates (or range of dates)associated with these assets. These AROs include:
• hazardous materials disposal (such as petroleum manufacturing by-products, chemical catalysts, and sealed insulation material containingasbestos), site restoration, and removal or dismantlement requirements associated with the closure of our refining facilities, terminalfacilities or pipelines, including the demolition or removal of certain major processing units, buildings, tanks, pipelines or otherequipment; and
• removal of underground storage tanks at our owned retail stations at or near the time of closure.
We have not historically incurred significant AROs for hazardous materials disposal or other removal costs associated with asset retirementsor replacements during scheduled maintenance projects. We believe that the majority of our tangible assets have indeterminate useful lives. Thisprecludes development of assumptions about the potential timing of settlement dates based on the following:
• there are no plans or expectations of plans to retire or dispose of these assets;
• we plan on extending the assets' estimated economic lives through scheduled maintenance projects at our refineries and other normal repairand maintenance and by continuing to make improvements based on technological advances;
• we have rarely retired similar assets in the past; and
• industry practice for similar assets has historically been to extend the economic lives through regular repair and maintenance andimplementation of technological advances.
Environmental Matters
We capitalize environmental expenditures that extend the life or increase the capacity of facilities as well as expenditures that preventenvironmental contamination. We expense costs that relate to an existing condition caused by past operations and that do not contribute to current orfuture revenue generation. We record liabilities when environmental assessments and/or remedial efforts are probable and can be reasonablyestimated. Cost estimates are based on the expected timing and the extent of remedial actions required by governing agencies, experience gainedfrom similar sites for which environmental assessments or remediation have been completed, and the amount of our anticipated liability consideringthe proportional liability and financial abilities of other responsible parties. Generally, the timing of these accruals coincides with the completion ofa feasibility study or our commitment to a formal plan of action. Estimated liabilities are not discounted to present value, and environmentalexpenses are recorded primarily in operating expenses.
Legal Liabilities
In the ordinary course of business, we become party to lawsuits, administrative proceedings, and governmental investigations. These mattersmay involve large or unspecified damages or penalties that may be sought from us and may require years to resolve. We record a liability related to aloss contingency attributable to such legal matters in accrued liabilities or other liabilities depending on the classification as current or non-current ifwe determine the loss to be both probable and estimable. The liability is recorded for an amount that is management's best estimate of the loss, orwhen a best estimate cannot be made, the minimum loss amount of a range of possible outcomes.
Goodwill and Acquired Intangibles
Goodwill represents the amount the purchase price exceeds the fair value of net assets acquired in a business combination. We do not amortizegoodwill or indefinite-lived intangible assets. We are required, however, to review goodwill and indefinite-lived intangible assets for impairmentannually or more frequently if events or changes in business circumstances indicate the book value of the assets may not be recoverable, and werecord the impairment in loss on asset disposals and impairments.
Acquired intangibles are recorded at fair value as of the date acquired and consist primarily of air emissions credits, customer agreements andcontracts and the USA Gasoline trade name. We amortize acquired intangibles with finite lives on a straight-line basis over estimated useful lives of2 to 31 years, and we include the amortization in depreciation and amortization.
63
Table of Contents
TESOROCORPORATION
NOTES TO CONSOLIDATED FINANCIAL STATEMENTS — (Continued)
Other Assets
We defer turnaround costs and the costs of certain catalysts used in the refinery processing units that have a benefit period that exceeds oneyear and amortize these costs on a straight-line basis over the expected periods of benefit, generally ranging from 2 to 10 years. Turnaroundexpenditures are amortized over the period of time until the next planned turnaround of the processing unit. Amortization for these deferred costs,which is included in depreciation and amortization expense, amounted to $138 million, $129 million and $127 million in 2010, 2009 and 2008,respectively.
We defer debt issuance costs related to our Credit Agreement and senior notes and amortize the costs over the terms of each instrument. Weinclude the amortization in interest and financing costs. We reassess the carrying value of debt issuance costs when modifications are made to therelated debt instruments.
Impairment of Long-Lived Assets
We review property, plant and equipment and other long-lived assets, including acquired intangible assets with finite lives for impairmentwhenever events or changes in business circumstances indicate the net book values of the assets may not be recoverable. Impairment is indicatedwhen the undiscounted cash flows estimated to be generated by those assets are less than the assets' net book value. If this occurs, an impairmentloss is recognized for the difference between the fair value and net book value. Factors that indicate potential impairment include: a significantdecrease in the market value of the asset, operating or cash flow losses associated with the use of the asset, and a significant change in the asset'sphysical condition or use.
Revenue Recognition
We recognize revenues upon delivery of goods or services to a customer. For goods, this is generally the point at which title is transferred, andwhen payment has either been received or collection is reasonably assured. Revenues for services are recorded when the services have beenprovided. We record certain transactions in cost of sales on a net basis. These transactions include nonmonetary crude oil and refined productexchange transactions used to optimize our refinery supply, and sale and purchase transactions entered into with the same counterparty that aredeemed to be in contemplation with one another. We include transportation fees charged to customers in revenues, and we include the related costsin cost of sales or operating expenses.
Federal excise and state motor fuel taxes, which are remitted to governmental agencies through our refining segment and collected fromcustomers in our retail segment, are included in both revenues and cost of sales. These taxes, primarily related to sales of gasoline and diesel fuel,totaled $330 million, $283 million and $278 million in 2010, 2009 and 2008, respectively.
Income Taxes
We record deferred tax assets and liabilities for future income tax consequences that are attributable to differences between the financialstatement carrying amounts of assets and liabilities and their income tax bases. We base the measurement of deferred tax assets and liabilities onenacted tax rates that we expect will apply to taxable income in the year we expect to settle or recover those temporary differences. We recognize theeffect on deferred tax assets and liabilities of any change in income tax rates in the period that includes the enactment date. We provide a valuationallowance for deferred tax assets if it is more likely than not that those items will either expire before we are able to realize their benefit or theirfuture deductibility is uncertain. We recognize the financial statement effects of a tax position when it is more likely than not that the position will besustained upon examination. Tax positions taken, or expected to be taken, that are not recognized are recorded as liabilities.
Pension and Other Postretirement Benefits
We recognize an asset for a plan's overfunded status or a liability for a plan's underfunded status. A change in the funded status of our definedbenefit retirement plan is recognized in other comprehensive income in the period the change occurs.
64

Table of Contents
TESOROCORPORATION
NOTES TO CONSOLIDATED FINANCIAL STATEMENTS — (Continued)
Stock-Based Compensation
Our stock-based compensation includes stock options, restricted common stock, restricted stock units, stock-appreciation rights, performanceunit awards and phantom stock options. We estimate the fair value of certain stock-based awards using the Black-Scholes option-pricing model or aMonte Carlo simulation. The fair value of our restricted common stock awards on the date of grant is equal to the market price of our common stock.We amortize the fair value of our stock options, restricted common stock and restricted stock units using the straight-line method over the vestingperiod. The fair values of our stock appreciation rights, phantom stock options and performance unit awards are estimated at the end of eachreporting period and are recorded as liabilities. Expenses related to stock-based compensation are included in selling, general and administrativeexpenses.
Derivative Instruments and Hedging Activities
We periodically use non-trading derivative instruments to primarily manage exposure to commodity price risks associated with the purchase orsale of crude oil and finished products. We may also use non-trading derivative instruments to manage price risks associated with inventories aboveor below our target levels. These derivative instruments typically include exchange-traded futures and over-the-counter swaps and options, generallywith durations of less than one year. Our positions are monitored on a daily basis by our trading controls group to ensure compliance with our riskmanagement policy.
When we acquire a derivative instrument, it is designated as a mark-to-market derivative or a fair value hedge derivative. Our derivativeinstruments are matched against physical crude oil or finished product barrels in our refining and marketing operations.
We mark-to-market our derivative instruments and recognize the changes in their fair values, realized or unrealized, in either revenues or costsof sales depending on the purpose for acquiring and holding the derivatives. For instruments that are not designated as fair value hedges, we do notrecord a change in the value of the related underlying physical commodity. The gain or loss on derivative instruments designated and qualifying asfair value hedges, as well as the offsetting gain or loss on the hedged item, are recognized in income in the same period. Fair value hedges are onlyused for TPSA inventories.
All derivatives are recorded and carried at fair value on the consolidated balance sheets in prepayments and other or accrued liabilities. For ourfair value hedges, the changes in fair value of the designated hedged inventory have been recorded in inventories. We net our asset and liabilitypositions associated with multiple derivative instruments that are executed with the same counterparty under master netting arrangements.
We apply hedge accounting when transactions meet specified criteria for such treatment and may designate a derivative as a fair value hedginginstrument for accounting purposes to hedge certain foreign subsidiary crude inventories and at the inception of firm commitments to purchaseinventories. The hedged inventory is valued at current spot market prices whereas the financial derivative is valued using forward commodity prices.Changes in the difference between forward and spot prices are recorded as unrealized gains and losses until the commodity is sold and the relatedfinancial derivative is settled. A hedge is regarded as highly effective and qualifies for hedge accounting if, at its inception and throughout the termof the contract, it is expected that changes in the fair value of the hedged item are almost fully offset by the changes in the fair value of the hedginginstrument.
We discontinue hedge accounting when it is determined that the derivative has ceased to be highly effective as a hedge; when the derivativeexpires, or is sold, terminated, or exercised; when the hedged item is sold; or when a forecasted transaction is no longer deemed probable. Anyineffectiveness is recorded in the statements of consolidated operations during the period in which the derivative instrument is deemed ineffective.
Foreign Currency Exchange
The functional currency for our foreign subsidiaries is the U.S. dollar. The translation of our foreign operations into U.S. dollars is computedfor balance sheet accounts using exchange rates in effect as of the balance sheet date and for revenue and expense accounts using weighted-averageexchange rates during the year. We are exposed to exchange rate fluctuations on transactions related to our Canadian operations. We use foreigncurrency exchange
65

Table of Contents
TESOROCORPORATION
NOTES TO CONSOLIDATED FINANCIAL STATEMENTS — (Continued)
and purchase contracts to manage our exposure to these exchange rate fluctuations. Amounts are recorded in foreign currency exchange gain (loss).
New Accounting Standards and Disclosures
Fair Value Measurements
We adopted a standard on January 1, 2009, that expanded the framework and disclosures for measuring the fair value of nonfinancial assetsand nonfinancial liabilities, including:
• acquired or impaired goodwill;
• the initial recognition of asset retirement obligations; and
• impaired property, plant and equipment.
The adoption of this standard did not impact our financial position or results of operations.
In January 2010, the FASB amended the standard covering fair value measurements to require additional disclosures, including transfers inand out of levels 1 and 2 fair value measurements, the gross basis presentation of the reconciliation of level 3 fair value measurements, and fair valuemeasurement disclosure at the class level, as opposed to category level, as previously required. This guidance is effective for interim and annualreporting periods beginning after December 15, 2009, except for disclosures related to level 3 fair value measurements, which are effective for fiscalyears beginning after December 15, 2010 (including interim periods). The adoption of the amendment did not impact our financial position or resultsof operations.
Variable Interest Entities
The FASB issued a standard in June 2009 that amends previous guidance on variable interest entities. The standard modifies the criteria fordetermining whether an entity is a variable interest entity and requires ongoing reassessments of whether an enterprise is the primary beneficiary of avariable interest entity and an analysis to determine whether the enterprise's variable interest(s) give it a controlling financial interest in a variableinterest entity. This standard became effective January 1, 2010, and did not impact our financial position or results of operations.
NOTE B — EARNINGS (LOSS) PER SHARE
We compute basic earnings (loss) per share by dividing net earnings (loss) by the weighted average number of common shares outstandingduring the period. Diluted earnings (loss) per share include the effects of potentially dilutive shares, principally consisting of common stock optionsand unvested restricted common stock outstanding during the period.
66

Table of Contents
TESOROCORPORATION
NOTES TO CONSOLIDATED FINANCIAL STATEMENTS — (Continued)
Share and per share calculations are presented below (in millions except per share amounts):
2010 2009 2008
Basic: Net earnings (loss) $ (29) $ (140) $ 278
Weighted average common shares outstanding 140.6 138.2 136.8
Basic Earnings (Loss) Per Share $ (0.21) $ (1.01) $ 2.03
Diluted: Net earnings (loss) $ (29) $ (140) $ 278
Weighted average common shares outstanding 140.6 138.2 136.8 Common stock equivalents — — 2.4
Total Diluted Shares 140.6 138.2 139.2
Diluted Earnings (Loss) Per Share $ (0.21) $ (1.01) $ 2.00
Common stock equivalents were excluded from the calculation of diluted earnings (loss) per share, as their inclusion would have been anti-dilutive, as follows (in millions):
2010 2009 2008
Common stock equivalents(a) 1.4 1.5 — Stock options(b) 5.6 4.8 3.3
(a) For the years ended December 31, 2010 and 2009, common stock equivalents, including stock options, were excluded as a result of the net lossreported during the period.
(b) Common stock options presented above were excluded as the exercise prices were greater than the average market price of the common stockduring each respective reporting period.
NOTE C — RECEIVABLES
Receivables at December 31, 2010 and 2009, consisted of the following (in millions):
2010 2009
Trade receivables $ 875 $ 966 Tax receivables 20 151 Other receivables 21 7 Allowance for doubtful accounts (8) (8)
Total Receivables, Net $ 908 $ 1,116
Concentrations of credit risk with respect to trade receivables are influenced by the large number of customers comprising our customer baseand their dispersion across various industry groups and geographic areas of operations. We perform ongoing credit evaluations of our customers'financial condition, and in certain circumstances, require prepayments, letters of credit or other collateral.
67
Table of Contents
TESOROCORPORATION
NOTES TO CONSOLIDATED FINANCIAL STATEMENTS — (Continued)
NOTE D — INVENTORIES
Components of inventories at December 31, 2010 and 2009, were (in millions):
2010 2009
Domestic crude oil and refined products $ 954 $ 495 Foreign subsidiary crude oil 177 12 Oxygenates and by-products 30 22 Merchandise 14 13 Materials and supplies 82 80
Total Inventories $ 1,257 $ 622
Crude oil and refined products inventories valued primarily at LIFO cost were less than replacement cost by approximately $1.4 billion and$1.1 billion, at December 31, 2010 and 2009, respectively. During 2009, reductions in inventory quantities resulted in liquidations of applicableLIFO inventory quantities acquired at lower costs in prior years. The 2009 LIFO liquidation resulted in a decrease in cost of sales of $69 million.
NOTE E — GOODWILL AND ACQUIRED INTANGIBLES
Goodwill
Goodwill is not amortized but is tested for impairment at least annually. We review the recorded value of goodwill for impairment during thefourth quarter of each year, or sooner if events or changes in circumstances indicate the carrying amount may exceed fair value. Our annualevaluation of goodwill impairment requires us to make significant estimates to determine the fair value of our reporting units. Our estimates maychange from period to period because we must make assumptions about future cash flows, profitability and other matters. It is reasonably possiblethat future changes in our estimates could significantly affect the carrying amount of goodwill. Goodwill in our refining segment totaled $31 millionand $41 million at December 31, 2010 and 2009, respectively. In our retail segment, goodwill totaled $5 million at both December 31, 2010 and2009. The changes in the carrying amount of goodwill during 2010 and 2009 were as follows (in millions):
2010 2009
Balance as of beginning of year $ 46 $ 89 Goodwill write-off (10) (43)
Balance as of end of year $ 36 $ 46
The fair value of our refining and retail reporting units are estimated based on an income approach using the present value of expected futurecash flows for each reporting unit. We also use a market approach to value our refining reporting units using recent refinery sales transactions andquoted common stock prices of comparable companies within the refining industry.
The carrying value of our Hawaii refinery reporting unit increased during the year as a result of increased turnaround spending and a reductionin certain pension and other postretirement obligations. However, the fair value of our Hawaii reporting unit decreased below its carrying value as aresult of lower projected future cash flows driven primarily by a revised margin outlook for this refinery. We determined that all of the goodwillrelated to the Hawaii refinery reporting unit was impaired and wrote-off $10 million during the fourth quarter of 2010. Decreased forecasted cashflows and quoted market prices reduced our estimated fair value below carrying value for our Washington refinery reporting unit resulting in agoodwill write-off of $43 million in 2009. The impairment charges are included in loss on asset disposals and impairments. We continue to carrygoodwill for reporting units where estimated fair values exceed carrying values.
68
Table of Contents
TESOROCORPORATION
NOTES TO CONSOLIDATED FINANCIAL STATEMENTS — (Continued)
Acquired Intangibles
The following table provides the historical cost and accumulated amortization for each major class of acquired intangible assets, excludinggoodwill (in millions):
December 31, 2010 December 31, 2009 Net Net Historical Accumulated Book Historical Accumulated Book Cost Amortization Value Cost Amortization Value
Air emissions credits $ 229 $ 51 $ 178 $ 220 $ 43 $ 177 Customer agreements and contracts(a) 34 18 16 50 31 19 USA Gasoline tradename 35 6 29 35 5 30 Refinery permits and plans 17 6 11 17 5 12 Favorable leases 12 3 9 12 2 10 Other intangibles 27 24 3 26 19 7
Total $ 354 $ 108 $ 246 $ 360 $ 105 $ 255
(a) $16 million decrease to the historical cost and related accumulated amortization relates to the retirement of expired customer contracts thatwere fully amortized.
All of our acquired intangible assets are subject to amortization with the exception of approximately $1 million of indefinite-lived intangibleassets included in other intangibles. Amortization expense of acquired intangible assets amounted to $18 million, $23 million and $21 million for theyears ended December 31, 2010, 2009 and 2008, respectively. Our estimated amortization expense for each of the following five years is: 2011 —$19 million; 2012 — $13 million; 2013 — $12 million; 2014 — $12 million; and 2015 — $12 million.
NOTE F — OTHER NONCURRENT ASSETS
Other noncurrent assets at December 31, 2010 and 2009, consisted of (in millions):
2010 2009
Deferred maintenance costs, including refinery turnarounds, net of amortization $ 301 $ 299 Goodwill 36 46 Debt issuance costs, net of amortization 25 25 Other assets, net of amortization 26 32
Total Other Noncurrent Assets $ 388 $ 402
NOTE G — FAIR VALUE MEASUREMENTS
We classify financial assets and financial liabilities into the following fair value hierarchy:
• level 1 — quoted prices in active markets for identical assets and liabilities;
• level 2 — quoted prices for similar assets and liabilities in active markets, and inputs other than quoted prices that are observable for theasset or liability; and
• level 3 — unobservable inputs that are supported by little or no market activity and that are significant to the fair value of the assets orliabilities.
When available, we measure fair value using level 1 inputs because they provide the most reliable evidence of fair value. Derivativeinstruments are our only financial assets and financial liabilities measured at fair value on a recurring basis. See Note H for further information onthe Company's derivative instruments.
69
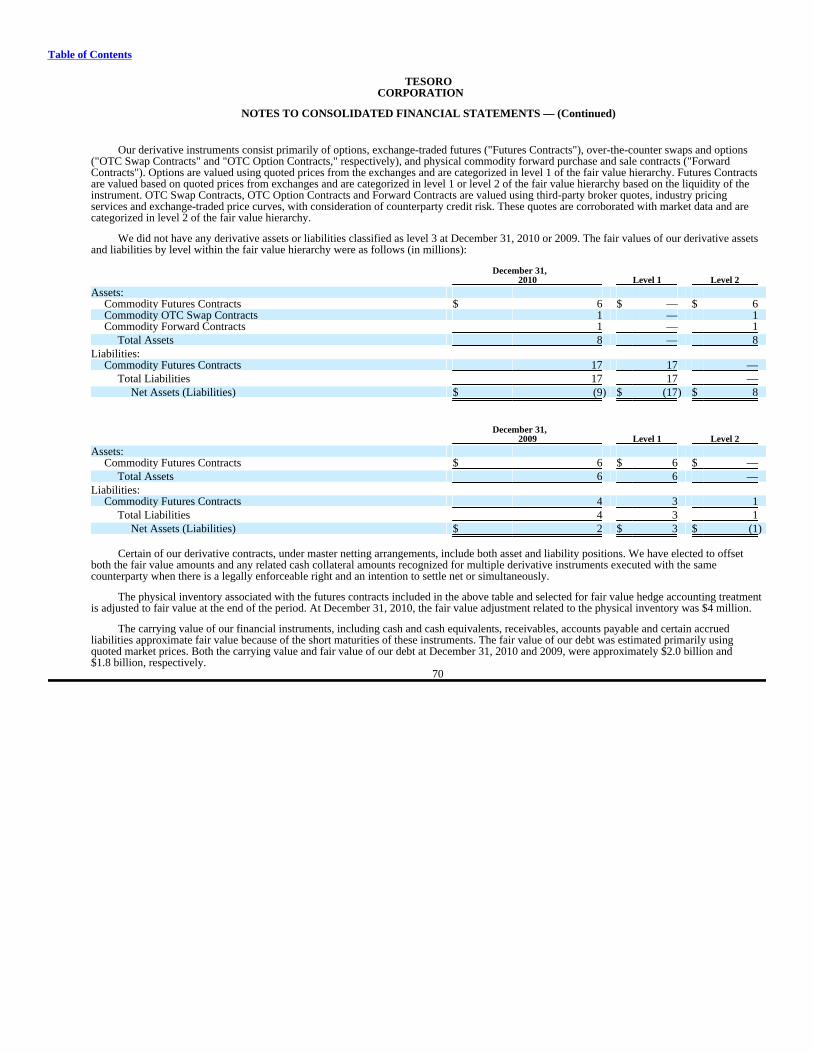
Table of Contents
TESOROCORPORATION
NOTES TO CONSOLIDATED FINANCIAL STATEMENTS — (Continued)
Our derivative instruments consist primarily of options, exchange-traded futures ("Futures Contracts"), over-the-counter swaps and options("OTC Swap Contracts" and "OTC Option Contracts," respectively), and physical commodity forward purchase and sale contracts ("ForwardContracts"). Options are valued using quoted prices from the exchanges and are categorized in level 1 of the fair value hierarchy. Futures Contractsare valued based on quoted prices from exchanges and are categorized in level 1 or level 2 of the fair value hierarchy based on the liquidity of theinstrument. OTC Swap Contracts, OTC Option Contracts and Forward Contracts are valued using third-party broker quotes, industry pricingservices and exchange-traded price curves, with consideration of counterparty credit risk. These quotes are corroborated with market data and arecategorized in level 2 of the fair value hierarchy.
We did not have any derivative assets or liabilities classified as level 3 at December 31, 2010 or 2009. The fair values of our derivative assetsand liabilities by level within the fair value hierarchy were as follows (in millions):
December 31, 2010 Level 1 Level 2
Assets: Commodity Futures Contracts $ 6 $ — $ 6 Commodity OTC Swap Contracts 1 — 1 Commodity Forward Contracts 1 — 1
Total Assets 8 — 8
Liabilities: Commodity Futures Contracts 17 17 —
Total Liabilities 17 17 —
Net Assets (Liabilities) $ (9) $ (17) $ 8
December 31, 2009 Level 1 Level 2
Assets: Commodity Futures Contracts $ 6 $ 6 $ —
Total Assets 6 6 —
Liabilities: Commodity Futures Contracts 4 3 1
Total Liabilities 4 3 1
Net Assets (Liabilities) $ 2 $ 3 $ (1)
Certain of our derivative contracts, under master netting arrangements, include both asset and liability positions. We have elected to offsetboth the fair value amounts and any related cash collateral amounts recognized for multiple derivative instruments executed with the samecounterparty when there is a legally enforceable right and an intention to settle net or simultaneously.
The physical inventory associated with the futures contracts included in the above table and selected for fair value hedge accounting treatmentis adjusted to fair value at the end of the period. At December 31, 2010, the fair value adjustment related to the physical inventory was $4 million.
The carrying value of our financial instruments, including cash and cash equivalents, receivables, accounts payable and certain accruedliabilities approximate fair value because of the short maturities of these instruments. The fair value of our debt was estimated primarily usingquoted market prices. Both the carrying value and fair value of our debt at December 31, 2010 and 2009, were approximately $2.0 billion and$1.8 billion, respectively.
70

Table of Contents
TESOROCORPORATION
NOTES TO CONSOLIDATED FINANCIAL STATEMENTS — (Continued)
The fair value of certain impaired nonfinancial assets, including acquired or impaired goodwill, initial recognition of asset retirementobligations, indefinite-lived intangible assets and impaired property, plant and equipment, measured on a non-recurring basis as of and for the yearended December 31, 2010, were as follows (in millions):
December 31, 2010 Level 1 Level 2 Level 3 Total Losses
Assets: Refining equipment $ 4 $ — $ — $ 4 $ 20 Goodwill $ 36 $ — $ — $ 36 $ 10
Due to the impact of the continuing weak economy on the refining industry, we continue to evaluate the recoverability of certain capitalprojects currently in progress. This evaluation resulted in an impairment charge of $20 million related to the deferral of a capital project at our LosAngeles refinery, recognized during the three months ended March 31, 2010. The impairment charge is included in loss on asset disposals andimpairments. Equipment specifically manufactured and uniquely configured for this project was written down from a carrying value of $20 millionto a fair value of $4 million for a loss of $16 million. The estimated recovery amounts were based on direct equipment cost recoverable if sold to anend user, in the principal or most advantageous market for the asset, in an orderly transaction. An additional $4 million loss was related to certainengineering costs that were determined to not be recoverable. The amounts presented represent our estimates on unobservable inputs that requiresignificant judgment, for which there is little or no market data.
As part of our annual goodwill impairment test, we reviewed the recorded value of goodwill for impairment during the fourth quarter. Thewrite-off is included in loss on asset disposals and impairments. See information about the valuation techniques used to develop fair value in Note E.There were no material new asset retirement obligations or indefinite lived intangible assets that were measured at fair value during 2010.
NOTE H — DERIVATIVE INSTRUMENTS
The timing, direction and overall change in refined product prices versus crude oil prices impacts profit margins and has a significant impacton our earnings and cash flows. To manage these commodity risks, we periodically use non-trading derivative instruments to primarily manageexposure to commodity price risks associated with the purchase or sale of physical delivery of feedstocks, products and energy supplies to or fromthe Company's refineries, terminals, retail operations and customers in our normal market areas. We may also use non-trading derivative instrumentsto manage price risks associated with inventories above or below our target levels. To achieve our objectives, we may use derivative instrumentssuch as Listed Options, Futures Contracts, OTC Swap Contracts, OTC Option Contracts, and Forward Contracts, all generally with maturity dates ofless than one year. We believe that there is minimal credit risk with respect to our counterparties.
We may use our excess storage capacity in Panama to take advantage of contango markets when the price of crude oil is higher in the futurethan the current spot price. We use commodity derivatives to hedge crude oil held in connection with these arbitrage opportunities.
Option contracts provide the right, but not the obligation to buy or sell the commodity at a specified price in the future. Futures Contractsinclude a requirement to buy or sell the commodity at a fixed price in the future. OTC Swap Contracts, OTC Option Contracts and ForwardContracts require cash settlement for the commodity based on the difference between a fixed or floating price and the market price on the settlementdate. We also have certain contracts that require cash collateral if our liability position exceeds specified thresholds. At December 31, 2010 we didnot have any cash collateral outstanding.
The following table presents the fair value (in millions) and balance sheet classification of our derivative instruments as of December 31,2010, and December 31, 2009. The fair value amounts below are presented on a gross basis and do not reflect the netting of asset and liabilitypositions permitted under the terms of our master netting arrangements. We have elected to offset the recognized fair value amounts for multiplederivative instruments executed with the same counterparty in our financial statements. As a result, the asset and liability
71
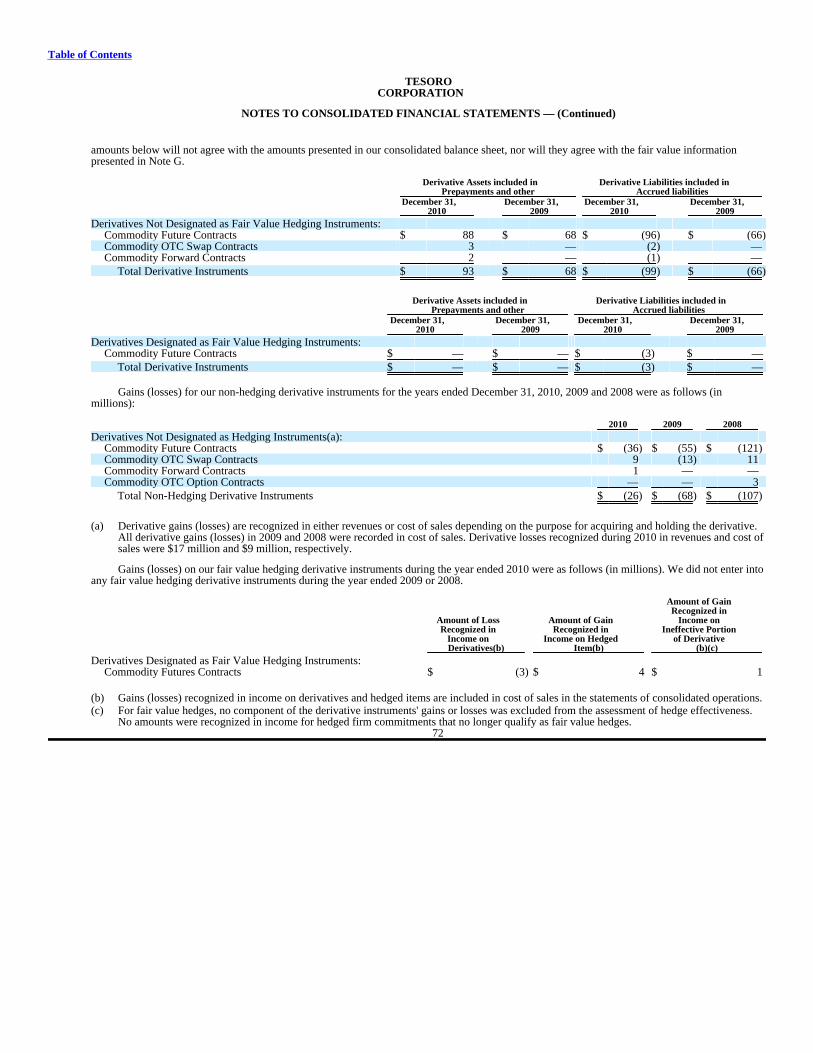
Table of Contents
TESOROCORPORATION
NOTES TO CONSOLIDATED FINANCIAL STATEMENTS — (Continued)
amounts below will not agree with the amounts presented in our consolidated balance sheet, nor will they agree with the fair value informationpresented in Note G.
Derivative Assets included in Derivative Liabilities included in Prepayments and other Accrued liabilities
December 31, December 31, December 31, December 31, 2010 2009 2010 2009
Derivatives Not Designated as Fair Value Hedging Instruments: Commodity Future Contracts $ 88 $ 68 $ (96) $ (66)Commodity OTC Swap Contracts 3 — (2) — Commodity Forward Contracts 2 — (1) —
Total Derivative Instruments $ 93 $ 68 $ (99) $ (66)
Derivative Assets included in Derivative Liabilities included in Prepayments and other Accrued liabilities
December 31, December 31, December 31, December 31, 2010 2009 2010 2009
Derivatives Designated as Fair Value Hedging Instruments: Commodity Future Contracts $ — $ — $ (3) $ —
Total Derivative Instruments $ — $ — $ (3) $ —
Gains (losses) for our non-hedging derivative instruments for the years ended December 31, 2010, 2009 and 2008 were as follows (inmillions):
2010 2009 2008
Derivatives Not Designated as Hedging Instruments(a): Commodity Future Contracts $ (36) $ (55) $ (121)Commodity OTC Swap Contracts 9 (13) 11 Commodity Forward Contracts 1 — — Commodity OTC Option Contracts — — 3
Total Non-Hedging Derivative Instruments $ (26) $ (68) $ (107)
(a) Derivative gains (losses) are recognized in either revenues or cost of sales depending on the purpose for acquiring and holding the derivative.All derivative gains (losses) in 2009 and 2008 were recorded in cost of sales. Derivative losses recognized during 2010 in revenues and cost ofsales were $17 million and $9 million, respectively.
Gains (losses) on our fair value hedging derivative instruments during the year ended 2010 were as follows (in millions). We did not enter intoany fair value hedging derivative instruments during the year ended 2009 or 2008.
Amount of Gain Recognized in Amount of Loss Amount of Gain Income on Recognized in Recognized in Ineffective Portion Income on Income on Hedged of Derivative Derivatives(b) Item(b) (b)(c)
Derivatives Designated as Fair Value Hedging Instruments: Commodity Futures Contracts $ (3) $ 4 $ 1
(b) Gains (losses) recognized in income on derivatives and hedged items are included in cost of sales in the statements of consolidated operations.
(c) For fair value hedges, no component of the derivative instruments' gains or losses was excluded from the assessment of hedge effectiveness.No amounts were recognized in income for hedged firm commitments that no longer qualify as fair value hedges.
72

Table of Contents
TESOROCORPORATION
NOTES TO CONSOLIDATED FINANCIAL STATEMENTS — (Continued)
Open Short Positions
All of our open positions are scheduled to mature within the next twelve months. The information below presents the net volume ofoutstanding contracts by type of instrument and year of maturity as of December 31, 2010 (volumes in thousands of barrels):
Fair Value Hedges Mark-to-Market DerivativesDerivative
Instrument and Contract Derivative
Instrument and ContractYear of Maturity Volumes Year of Maturity Volumes
Swaps Swaps 2011 — 2011 (1,050)
Futures Futures 2011 (924) 2011 (3,053)
Forwards Forwards 2011 — 2011 (280)
Options Options 2011 — 2011 —
NOTE I — ACCRUED LIABILITIES
Our current accrued liabilities and other noncurrent liabilities at December 31, 2010 and 2009 included (in millions):
2010 2009
Current Accrued Liabilities: Taxes other than income taxes, primarily excise taxes $ 182 $ 153 Employee costs 154 72 Environmental liabilities 23 50 Liability for unrecognized tax benefits, including interest and penalties 2 28 Deferred income tax liability — 15 Interest 16 16 Pension and other postretirement benefits 16 15 Other 99 95
Total Current Accrued Liabilities $ 492 $ 444
Other Noncurrent Liabilities: Pension and other postretirement benefits $ 350 $ 590 Environmental liabilities 85 56 Liability for unrecognized tax benefits, including interest and penalties 31 29 Asset retirement obligations 23 28 Other 73 49
Total Other Noncurrent Liabilities $ 562 $ 752
73
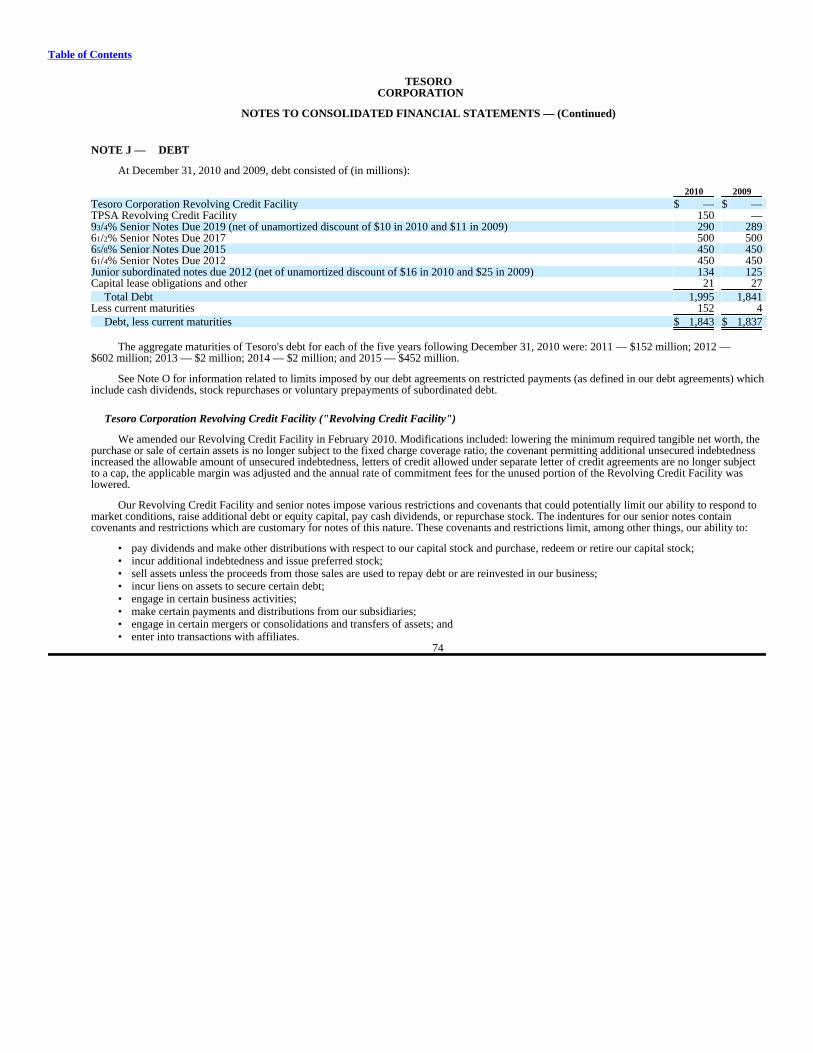
Table of Contents
TESOROCORPORATION
NOTES TO CONSOLIDATED FINANCIAL STATEMENTS — (Continued)
NOTE J — DEBT
At December 31, 2010 and 2009, debt consisted of (in millions):
2010 2009
Tesoro Corporation Revolving Credit Facility $ — $ — TPSA Revolving Credit Facility 150 — 93/4% Senior Notes Due 2019 (net of unamortized discount of $10 in 2010 and $11 in 2009) 290 289 61/2% Senior Notes Due 2017 500 500 65/8% Senior Notes Due 2015 450 450 61/4% Senior Notes Due 2012 450 450 Junior subordinated notes due 2012 (net of unamortized discount of $16 in 2010 and $25 in 2009) 134 125 Capital lease obligations and other 21 27
Total Debt 1,995 1,841 Less current maturities 152 4
Debt, less current maturities $ 1,843 $ 1,837
The aggregate maturities of Tesoro's debt for each of the five years following December 31, 2010 were: 2011 — $152 million; 2012 —$602 million; 2013 — $2 million; 2014 — $2 million; and 2015 — $452 million.
See Note O for information related to limits imposed by our debt agreements on restricted payments (as defined in our debt agreements) whichinclude cash dividends, stock repurchases or voluntary prepayments of subordinated debt.
Tesoro Corporation Revolving Credit Facility ("Revolving Credit Facility")
We amended our Revolving Credit Facility in February 2010. Modifications included: lowering the minimum required tangible net worth, thepurchase or sale of certain assets is no longer subject to the fixed charge coverage ratio, the covenant permitting additional unsecured indebtednessincreased the allowable amount of unsecured indebtedness, letters of credit allowed under separate letter of credit agreements are no longer subjectto a cap, the applicable margin was adjusted and the annual rate of commitment fees for the unused portion of the Revolving Credit Facility waslowered.
Our Revolving Credit Facility and senior notes impose various restrictions and covenants that could potentially limit our ability to respond tomarket conditions, raise additional debt or equity capital, pay cash dividends, or repurchase stock. The indentures for our senior notes containcovenants and restrictions which are customary for notes of this nature. These covenants and restrictions limit, among other things, our ability to:
• pay dividends and make other distributions with respect to our capital stock and purchase, redeem or retire our capital stock;
• incur additional indebtedness and issue preferred stock;
• sell assets unless the proceeds from those sales are used to repay debt or are reinvested in our business;
• incur liens on assets to secure certain debt;
• engage in certain business activities;
• make certain payments and distributions from our subsidiaries;
• engage in certain mergers or consolidations and transfers of assets; and
• enter into transactions with affiliates. 74
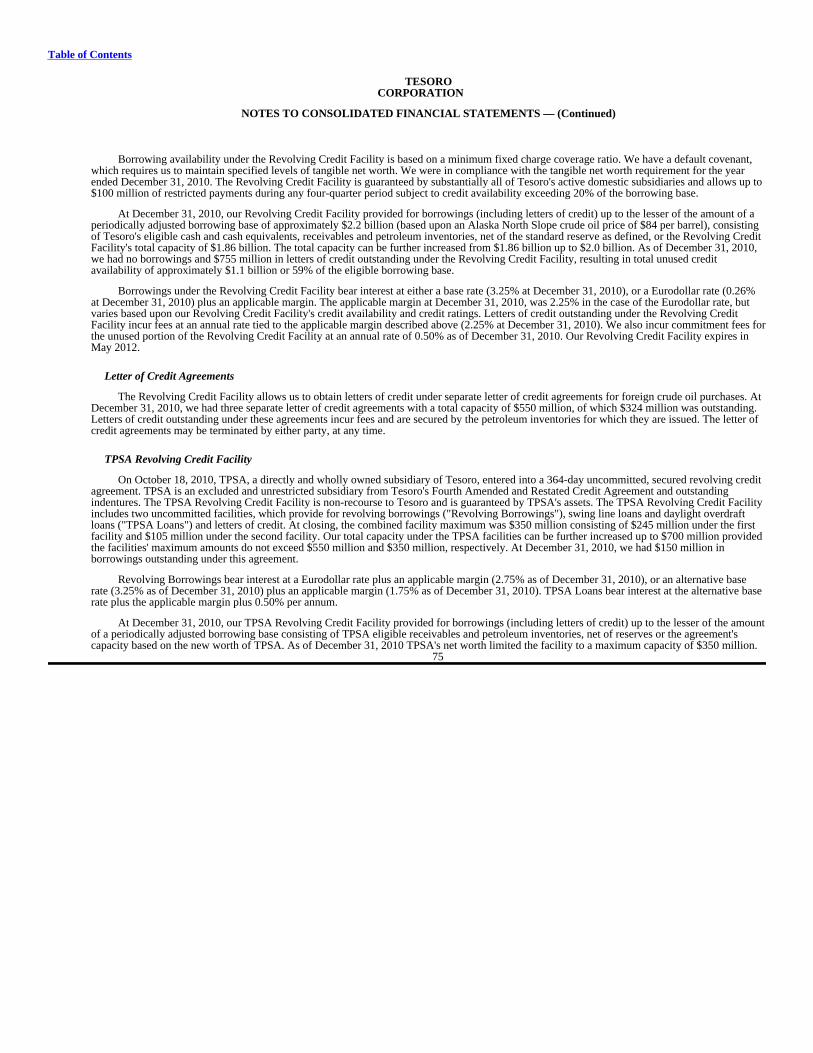
Table of Contents
TESOROCORPORATION
NOTES TO CONSOLIDATED FINANCIAL STATEMENTS — (Continued)
Borrowing availability under the Revolving Credit Facility is based on a minimum fixed charge coverage ratio. We have a default covenant,which requires us to maintain specified levels of tangible net worth. We were in compliance with the tangible net worth requirement for the yearended December 31, 2010. The Revolving Credit Facility is guaranteed by substantially all of Tesoro's active domestic subsidiaries and allows up to$100 million of restricted payments during any four-quarter period subject to credit availability exceeding 20% of the borrowing base.
At December 31, 2010, our Revolving Credit Facility provided for borrowings (including letters of credit) up to the lesser of the amount of aperiodically adjusted borrowing base of approximately $2.2 billion (based upon an Alaska North Slope crude oil price of $84 per barrel), consistingof Tesoro's eligible cash and cash equivalents, receivables and petroleum inventories, net of the standard reserve as defined, or the Revolving CreditFacility's total capacity of $1.86 billion. The total capacity can be further increased from $1.86 billion up to $2.0 billion. As of December 31, 2010,we had no borrowings and $755 million in letters of credit outstanding under the Revolving Credit Facility, resulting in total unused creditavailability of approximately $1.1 billion or 59% of the eligible borrowing base.
Borrowings under the Revolving Credit Facility bear interest at either a base rate (3.25% at December 31, 2010), or a Eurodollar rate (0.26%at December 31, 2010) plus an applicable margin. The applicable margin at December 31, 2010, was 2.25% in the case of the Eurodollar rate, butvaries based upon our Revolving Credit Facility's credit availability and credit ratings. Letters of credit outstanding under the Revolving CreditFacility incur fees at an annual rate tied to the applicable margin described above (2.25% at December 31, 2010). We also incur commitment fees forthe unused portion of the Revolving Credit Facility at an annual rate of 0.50% as of December 31, 2010. Our Revolving Credit Facility expires inMay 2012.
Letter of Credit Agreements
The Revolving Credit Facility allows us to obtain letters of credit under separate letter of credit agreements for foreign crude oil purchases. AtDecember 31, 2010, we had three separate letter of credit agreements with a total capacity of $550 million, of which $324 million was outstanding.Letters of credit outstanding under these agreements incur fees and are secured by the petroleum inventories for which they are issued. The letter ofcredit agreements may be terminated by either party, at any time.
TPSA Revolving Credit Facility
On October 18, 2010, TPSA, a directly and wholly owned subsidiary of Tesoro, entered into a 364-day uncommitted, secured revolving creditagreement. TPSA is an excluded and unrestricted subsidiary from Tesoro's Fourth Amended and Restated Credit Agreement and outstandingindentures. The TPSA Revolving Credit Facility is non-recourse to Tesoro and is guaranteed by TPSA's assets. The TPSA Revolving Credit Facilityincludes two uncommitted facilities, which provide for revolving borrowings ("Revolving Borrowings"), swing line loans and daylight overdraftloans ("TPSA Loans") and letters of credit. At closing, the combined facility maximum was $350 million consisting of $245 million under the firstfacility and $105 million under the second facility. Our total capacity under the TPSA facilities can be further increased up to $700 million providedthe facilities' maximum amounts do not exceed $550 million and $350 million, respectively. At December 31, 2010, we had $150 million inborrowings outstanding under this agreement.
Revolving Borrowings bear interest at a Eurodollar rate plus an applicable margin (2.75% as of December 31, 2010), or an alternative baserate (3.25% as of December 31, 2010) plus an applicable margin (1.75% as of December 31, 2010). TPSA Loans bear interest at the alternative baserate plus the applicable margin plus 0.50% per annum.
At December 31, 2010, our TPSA Revolving Credit Facility provided for borrowings (including letters of credit) up to the lesser of the amountof a periodically adjusted borrowing base consisting of TPSA eligible receivables and petroleum inventories, net of reserves or the agreement'scapacity based on the new worth of TPSA. As of December 31, 2010 TPSA's net worth limited the facility to a maximum capacity of $350 million.
75
Table of Contents
TESOROCORPORATION
NOTES TO CONSOLIDATED FINANCIAL STATEMENTS — (Continued)
The TPSA Revolving Credit Facility contains certain default covenants and conditions relative to TPSA's financial results that, among otherthings, limit TPSA's ability to incur indebtedness or carry inventory levels above certain thresholds. TPSA is also required to maintain specifiedlevels of adjusted tangible net worth (as defined) and adjusted net working capital (as defined). We were in compliance with all of the TPSARevolving Credit Facility's covenants and conditions as of December 31, 2010.
93/4% Senior Notes Due 2019
In June 2009, we issued $300 million aggregate principal amount of 93/4% senior notes due June 2019 for general corporate purposes. Thenotes were issued at 96.172% of face value at an effective interest rate of 10.375%. The notes have a ten-year maturity with no sinking fundrequirements and are subject to optional redemption by Tesoro beginning June 1, 2014 at premiums of 4.875% through May 31, 2015; 3.25% fromJune 1, 2015 through May 31, 2016; 1.625% from June 1, 2016 through May 31, 2017; and at par thereafter. We have the right to redeem up to 35%of the aggregate principal amount at 109.75% of face value with proceeds from certain equity issuances through June 1, 2012. The indenture for thenotes contains covenants and restrictions that are customary for notes of this nature. Substantially all of these covenants will terminate before thenotes mature if one of two specified ratings agencies assigns the notes an investment grade rating and no events of default exist under the indenture.The terminated covenants will not be restored even if the credit rating assigned to the notes subsequently falls below investment grade. The notes areunsecured and are guaranteed by substantially all of our domestic subsidiaries.
61/2% Senior Notes Due 2017
In May 2007, we issued $500 million aggregate principal amount of 61/2% senior notes due June 2017. The notes have a ten-year maturitywith no sinking fund requirements and are subject to optional redemption by Tesoro beginning June 2012 at premiums of 3.25% through May 2013;2.17% from June 2013 through May 2014; 1.08% from June 2014 through May 2015; and at par thereafter. We had the right to redeem up to 35% ofthe aggregate principal amount at a redemption price of 106.5% with proceeds from certain equity issuances through June 1, 2010, but did notexercise this right. The indenture for the notes contains covenants and restrictions that are customary for notes of this nature. Substantially all ofthese covenants will terminate before the notes mature if one of two specified ratings agencies assigns the notes an investment grade rating and noevents of default exist under the indenture. The terminated covenants will not be restored even if the credit rating assigned to the notes subsequentlyfalls below investment grade. The notes are unsecured and are guaranteed by substantially all of our active domestic subsidiaries.
65/8% Senior Notes Due 2015
In November 2005, we issued $450 million aggregate principal amount of 65/8% senior notes due November 2015. The notes have a ten-yearmaturity with no sinking fund requirements and are subject to optional redemption by Tesoro beginning November 2010 at premiums of 3.3%through October 2011; 2.2% from November 2011 to October 2012; 1.1% from November 2012 to October 2013; and at par thereafter. Theindenture for the notes contains covenants and restrictions that are customary for notes of this nature and are identical to the covenants in theindenture for Tesoro's 61/4% senior notes due 2012. Substantially all of these covenants will terminate before the notes mature if one of two specifiedratings agencies assigns the notes an investment grade rating and no events of default exist under the indenture. The terminated covenants will not berestored even if the credit rating assigned to the notes subsequently falls below investment grade. The notes are unsecured and are guaranteed bysubstantially all of Tesoro's active domestic subsidiaries.
61/4% Senior Notes Due 2012
In November 2005, we issued $450 million aggregate principal amount of 61/4% senior notes due November 2012. The notes have a seven-year maturity with no sinking fund requirements and are not callable. The indenture for the notes contains covenants and restrictions that arecustomary for notes of this nature and are identical to the covenants in the indenture for Tesoro's 65/8% senior notes due 2015. Substantially all ofthese covenants will terminate before the notes mature if one of two specified ratings agencies assigns the notes an investment grade
76

Table of Contents
TESOROCORPORATION
NOTES TO CONSOLIDATED FINANCIAL STATEMENTS — (Continued)
rating and no events of default exist under the indenture. The terminated covenants will not be restored even if the credit rating assigned to the notessubsequently falls below investment grade. The notes are unsecured and are guaranteed by substantially all of Tesoro's active domestic subsidiaries.
Junior Subordinated Notes Due 2012
In May 2002, we issued junior subordinated notes. The notes consist of: (i) a $100 million junior subordinated note, due July 2012, whichcarries a 7.5% interest rate (through May 2007 the note was non-interest bearing), and (ii) a $50 million junior subordinated note, due July 2012,which incurs interest at 7.5%. We recorded these two notes at a combined present value of $61 million, discounted at rates of 15.625% and 14.375%,respectively. We are amortizing the discount over the term of the notes.
Capital Lease Obligations
Our capital lease obligations relate primarily to the lease of 30 retail stations with initial terms of 17 years, with four 5-year renewal options.At December 31, 2010 and 2009, the total cost of assets under capital leases was $39 million and $38 million, respectively, with accumulatedamortization of $25 million and $24 million for December 31, 2010 and 2009, respectively. We include amortization of the cost of assets undercapital leases in depreciation and amortization expense. Future minimum annual lease payments, including interest, as of December 31, 2010 forcapital leases were (in millions):
2011 $ 4 2012 4 2013 4 2014 4 2015 3 Thereafter 14
Total minimum lease payments 33 Less amount representing interest 12
Capital lease obligations $ 21
NOTE K — ASSET RETIREMENT OBLIGATIONS
We have recorded asset retirement obligations for requirements imposed by certain regulations pertaining to hazardous materials disposal andother cleanup obligations. Our asset retirement obligations primarily include obligations to clean or dispose of hazardous waste related to replacingor disposing of equipment or piping at our refineries. We have also recorded obligations related to underground storage tank removal at our leasedretail stations. Changes in asset retirement obligations for the years ended December 31, 2010 and 2009 were as follows (in millions):
2010 2009
Balance at beginning of year $ 34 $ 35 Additions to accrual 2 5 Accretion expense 2 1 Settlements (7) (10)Changes in timing and amount of estimated cash flows (1) 3
Balance at end of year $ 30 $ 34
77
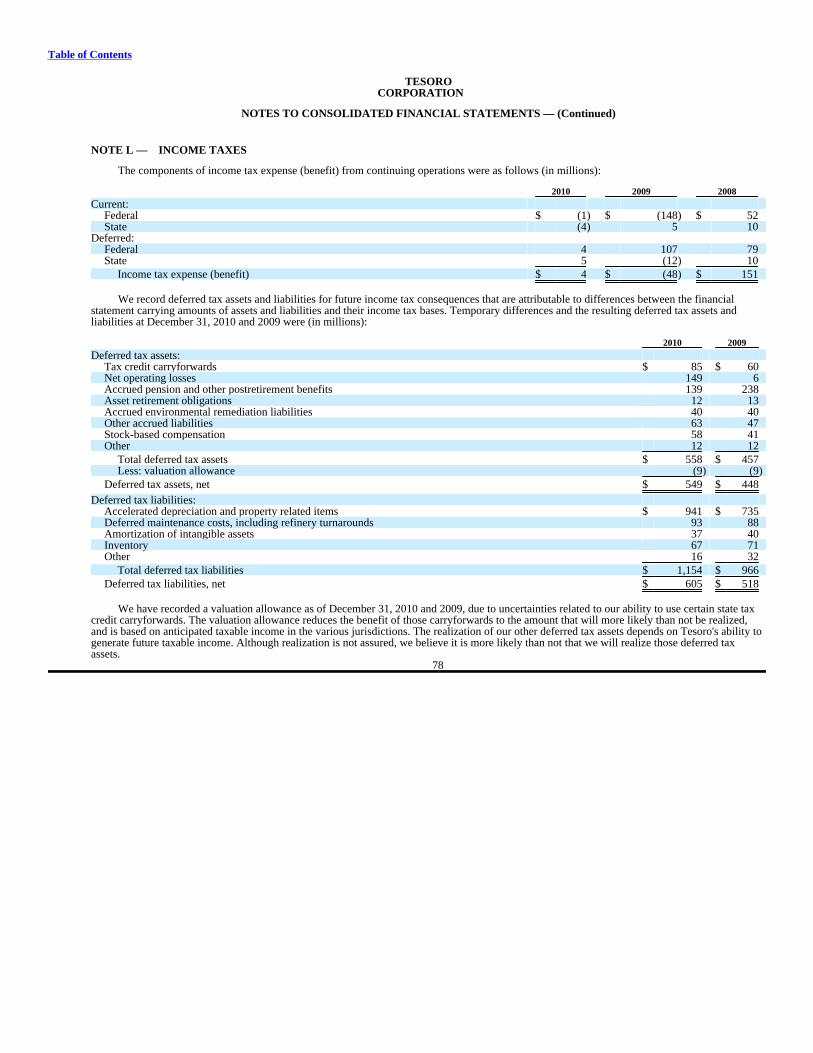
Table of Contents
TESOROCORPORATION
NOTES TO CONSOLIDATED FINANCIAL STATEMENTS — (Continued)
NOTE L — INCOME TAXES
The components of income tax expense (benefit) from continuing operations were as follows (in millions):
2010 2009 2008
Current: Federal $ (1) $ (148) $ 52 State (4) 5 10
Deferred: Federal 4 107 79 State 5 (12) 10
Income tax expense (benefit) $ 4 $ (48) $ 151
We record deferred tax assets and liabilities for future income tax consequences that are attributable to differences between the financialstatement carrying amounts of assets and liabilities and their income tax bases. Temporary differences and the resulting deferred tax assets andliabilities at December 31, 2010 and 2009 were (in millions):
2010 2009
Deferred tax assets: Tax credit carryforwards $ 85 $ 60 Net operating losses 149 6 Accrued pension and other postretirement benefits 139 238 Asset retirement obligations 12 13 Accrued environmental remediation liabilities 40 40 Other accrued liabilities 63 47 Stock-based compensation 58 41 Other 12 12
Total deferred tax assets $ 558 $ 457 Less: valuation allowance (9) (9)
Deferred tax assets, net $ 549 $ 448
Deferred tax liabilities: Accelerated depreciation and property related items $ 941 $ 735 Deferred maintenance costs, including refinery turnarounds 93 88 Amortization of intangible assets 37 40 Inventory 67 71 Other 16 32
Total deferred tax liabilities $ 1,154 $ 966
Deferred tax liabilities, net $ 605 $ 518
We have recorded a valuation allowance as of December 31, 2010 and 2009, due to uncertainties related to our ability to use certain state taxcredit carryforwards. The valuation allowance reduces the benefit of those carryforwards to the amount that will more likely than not be realized,and is based on anticipated taxable income in the various jurisdictions. The realization of our other deferred tax assets depends on Tesoro's ability togenerate future taxable income. Although realization is not assured, we believe it is more likely than not that we will realize those deferred taxassets.
78

Table of Contents
TESOROCORPORATION
NOTES TO CONSOLIDATED FINANCIAL STATEMENTS — (Continued)
The net deferred income tax liability is classified in the consolidated balance sheets as follows (in millions):
2010 2009
Current Assets $ 11 $ 2 Current Liabilities $ — $ 15 Noncurrent Liabilities $ 616 $ 505
The reconciliation of income tax expense (benefit) at the U.S. statutory rate to the income tax expense (benefit) is as follows (in millions):
2010 2009 2008
Income tax expense (benefit) at U.S. federal statutory rate $ (9) $ (66) $ 150 Effect of:
State income taxes, net of federal income tax effect — (7) 13 Manufacturing activities deduction — 4 (7)Goodwill write-off 1 17 — Income tax settlements — — (6)Medicare Part D law change 7 — — Other 5 4 1
Income tax expense (benefit) $ 4 $ (48) $ 151
As of December 31, 2010, we have approximately $64 million of federal and $17 million of state alternative minimum tax creditcarryforwards which never expire. Additionally, we have approximately $12 million of other state income tax credit carryforwards, most of whichexpire in 2026. We have approximately $380 million of federal regular tax net operating loss carryforwards that expire in 2030, and approximately$950 million of alternative minimum tax net operating loss carryforwards that expire between 2028 and 2030. At the state level we have netoperating loss carryforwards that expire between 2014 and 2030 that give rise to a $25 million state deferred tax asset.
We are subject to income taxes in the U.S., multiple state jurisdictions, and a few foreign jurisdictions. Our unrecognized tax benefits totaled$34 million and $36 million as of December 31, 2010 and 2009, respectively, of which $22 million and $29 million are recognized as liabilities.Included in those amounts as of December 31, 2010 and 2009, are $19 million and $23 million (net of the tax benefit on state issues), respectively,that would reduce the effective tax rate if recognized.
Within the next twelve months we believe it is reasonably possible that we could settle or otherwise conclude as much as $12 million of ouruncertain tax positions, $10 million of which is recognized as a liability, primarily regarding state issues related to tax credits and to apportionmentof income. At December 31, 2010 and 2009, we had accrued $11 million and $28 million, respectively, for interest and penalties. During the yearsended December 31, 2010, 2009, and 2008, we recognized $(4) million, $5 million and $3 million in interest and penalties associated withunrecognized tax benefits. For interest and penalties relating to income taxes we recognize accrued interest in interest and financing costs, andpenalties in selling, general and administrative expenses in the statements of consolidated operations. The federal tax years 2006 to 2009 remainopen to adjustment, and in general
79

Table of Contents
TESOROCORPORATION
NOTES TO CONSOLIDATED FINANCIAL STATEMENTS — (Continued)
the state tax years open to adjustment range from 1994 to 2009. A reconciliation of the beginning and ending amounts of unrecognized tax benefitsis as follows (in millions):
2010 2009 2008
Balance as of beginning of year $ 36 $ 44 $ 44 Increases related to prior year tax positions 2 1 5 Decreases related to prior year tax positions (1) (6) (12)Increases related to current year tax positions — — 11 Decreases related to lapse of applicable statute of limitations (1) (2) — Decreases related to settlements with taxing authorities (2) (1) (4)
Balance as of end of year $ 34 $ 36 $ 44
NOTE M — BENEFIT PLANS
Pension and Other Postretirement Benefits
We sponsor four defined benefit pension plans, one qualified plan and three nonqualified plans, which are described below. Only the first threeplans were effective as of December 31, 2010.
• The funded qualified employee retirement plan provides benefits to all eligible employees based on years of service and compensation.Although our funded employee retirement plan fully meets all of the funding requirements under applicable laws and regulations, during2010 and 2009 we voluntarily contributed $34 million and $35 million, respectively, to improve the plan's funded status.
• The unfunded nonqualified executive security plan provides certain executive officers and other key personnel with supplemental pensionbenefits. These benefits are provided by a nonqualified, noncontributory plan and are based on years of service and compensation. During2010 and 2009, we made payments of $30 million and $1 million, respectively, for current retiree obligations under the plan.
• The unfunded nonqualified restoration retirement plan provides for the restoration of retirement benefits to certain senior level employeesthat are not provided under the qualified retirement plan due to limits imposed by the Internal Revenue Code.
• The unfunded nonqualified supplemental executive retirement plan provides eligible senior level executives a supplemental pension benefitin excess of those earned under the qualified retirement plan. This plan was approved and adopted by the Compensation Committee onJanuary 12, 2011. Currently there are no employees eligible to participate in the Plan.
Tesoro provides health care benefits to retirees who met certain service requirements and were participating in our group health insuranceprogram at retirement. In addition, Tesoro sponsors two 401(k) plans, the thrift plan and the retail savings plan, both of which provide for eligibleemployees to make contributions, subject to certain limitations, into designated investment funds with a matching contribution by Tesoro.
In June 2010, the Compensation Committee of the Board of Directors approved changes to certain retirement and postretirement benefits to beeffective beginning January 1, 2011. The majority of our employees and retirees will be impacted by these changes subject to applicable collectivebargaining and/or purchase and sale agreements.
80

Table of Contents
TESOROCORPORATION
NOTES TO CONSOLIDATED FINANCIAL STATEMENTS — (Continued)
Changes to retirement plans
• The funded qualified employee retirement plan changed from a "Final Average Pay" ("FAP") based formula to a "Cash Balance Account"based formula. The FAP benefit formula will incorporate benefit service through December 31, 2010, and employees will begin to earn aCash Balance benefit for service on or after January 1, 2011. This change will reduce our future pension costs and funding obligations.
• The unfunded nonqualified restoration retirement plan will also be amended to reflect changes in the qualified employee retirement plan.
Changes to postretirement benefits
• Postretirement medical insurance cost sharing for current and future retirees was changed to reflect actual retiree claims experience ratherthan a blended premium cost (combination of active and retiree claim experience) effective January 1, 2011. The additional cost to retireeswill be phased in over three years. Beginning in 2014, the company contribution for retirees hired before January 1, 2006, will be cappedand retirees will pay for any increases in costs.
• Postretirement dental benefits for all current and future retirees was eliminated effective January 1, 2011.
• Postretirement medical coverage will be eliminated for retirees over the age of 65 as of January 1, 2014.
• Postretirement life insurance was eliminated for future retirees effective January 1, 2011.
• Postretirement life insurance for current retirees was reduced to $10,000 effective January 1, 2011, and will be eliminated entirelybeginning January 1, 2016.
Changes to the thrift plan
• Our present $1 for $1 match on 7% of pay (base pay, overtime and bonus) for our thrift plan will be reduced to a $1 for $1 match on 6% ofpay (base pay only), effective January 1, 2011.
Investment Policies and Strategies
Our funded qualified retirement plan assets are invested using a total return investment approach (including dividends, interest, and realizedand unrealized capital appreciation) whereby a mix of equity securities, fixed income securities and other investments are used to preserve assetvalues, diversify risk and achieve our target investment return. Plan assets are managed in a diversified portfolio comprised of two primarycomponents: an equity portion and a fixed income portion. The expected role of the plan's equity investments is to maximize the long-term realgrowth of plan assets, while the role of fixed income investments are to generate current income, lower funded status volatility, provide for morestable periodic returns and provide protection against a prolonged decline in the equity markets. Investment strategies and asset allocation decisionsare based on careful consideration of risk tolerance, plan liabilities, the plan's funded status and our financial condition.
In November 2009, we revised our investment policy to reduce equity exposure and increase fixed income exposure while extending theduration in order to better match the plan's liabilities. Our target allocation is as follows: 50% long duration fixed income, 15% domestic equity,15% international equity and 20% other investments comprised primarily of assets which provide protection in inflationary periods and investmentswhich target a return regardless of market conditions. We are currently transitioning the existing plan assets to the target allocation and anticipate tobe fully transitioned by the end of 2011.
81
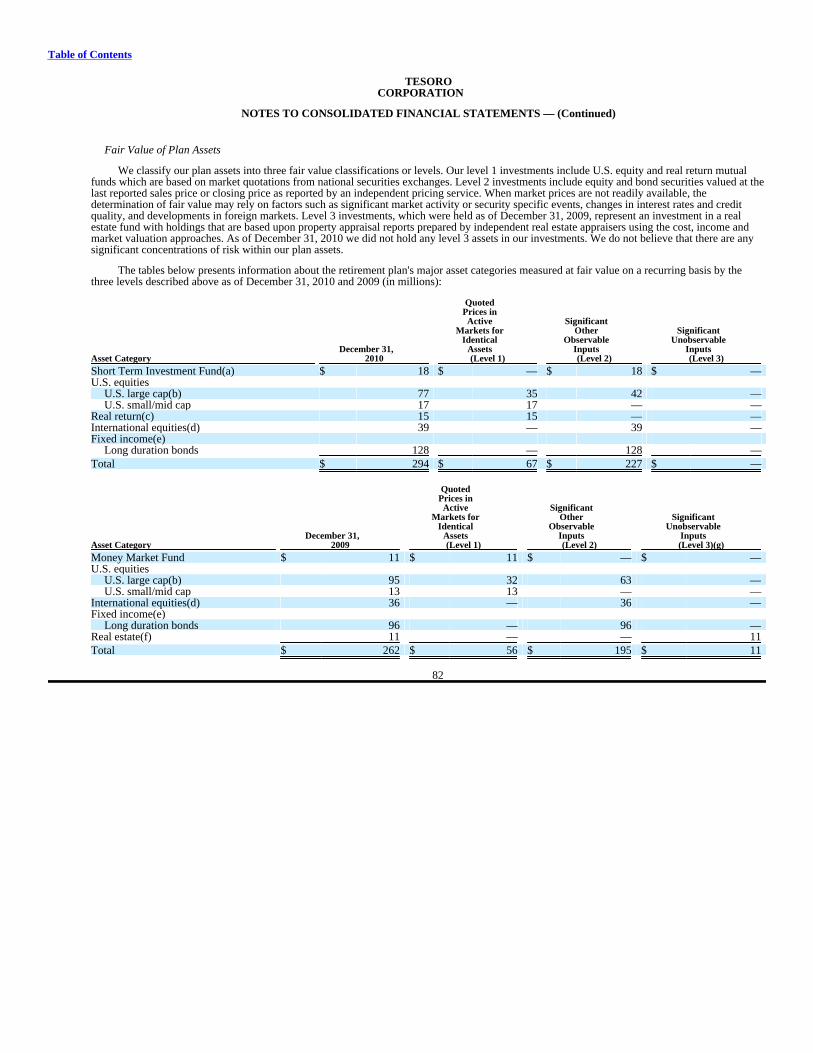
Table of Contents
TESOROCORPORATION
NOTES TO CONSOLIDATED FINANCIAL STATEMENTS — (Continued)
Fair Value of Plan Assets
We classify our plan assets into three fair value classifications or levels. Our level 1 investments include U.S. equity and real return mutualfunds which are based on market quotations from national securities exchanges. Level 2 investments include equity and bond securities valued at thelast reported sales price or closing price as reported by an independent pricing service. When market prices are not readily available, thedetermination of fair value may rely on factors such as significant market activity or security specific events, changes in interest rates and creditquality, and developments in foreign markets. Level 3 investments, which were held as of December 31, 2009, represent an investment in a realestate fund with holdings that are based upon property appraisal reports prepared by independent real estate appraisers using the cost, income andmarket valuation approaches. As of December 31, 2010 we did not hold any level 3 assets in our investments. We do not believe that there are anysignificant concentrations of risk within our plan assets.
The tables below presents information about the retirement plan's major asset categories measured at fair value on a recurring basis by thethree levels described above as of December 31, 2010 and 2009 (in millions):
Quoted Prices in Active Significant Markets for Other Significant Identical Observable Unobservable December 31, Assets Inputs Inputs Asset Category 2010 (Level 1) (Level 2) (Level 3)
Short Term Investment Fund(a) $ 18 $ — $ 18 $ — U.S. equities
U.S. large cap(b) 77 35 42 — U.S. small/mid cap 17 17 — —
Real return(c) 15 15 — — International equities(d) 39 — 39 — Fixed income(e)
Long duration bonds 128 — 128 —
Total $ 294 $ 67 $ 227 $ —
Quoted Prices in Active Significant Markets for Other Significant Identical Observable Unobservable December 31, Assets Inputs Inputs Asset Category 2009 (Level 1) (Level 2) (Level 3)(g)
Money Market Fund $ 11 $ 11 $ — $ — U.S. equities
U.S. large cap(b) 95 32 63 — U.S. small/mid cap 13 13 — —
International equities(d) 36 — 36 — Fixed income(e)
Long duration bonds 96 — 96 — Real estate(f) 11 — — 11
Total $ 262 $ 56 $ 195 $ 11
82
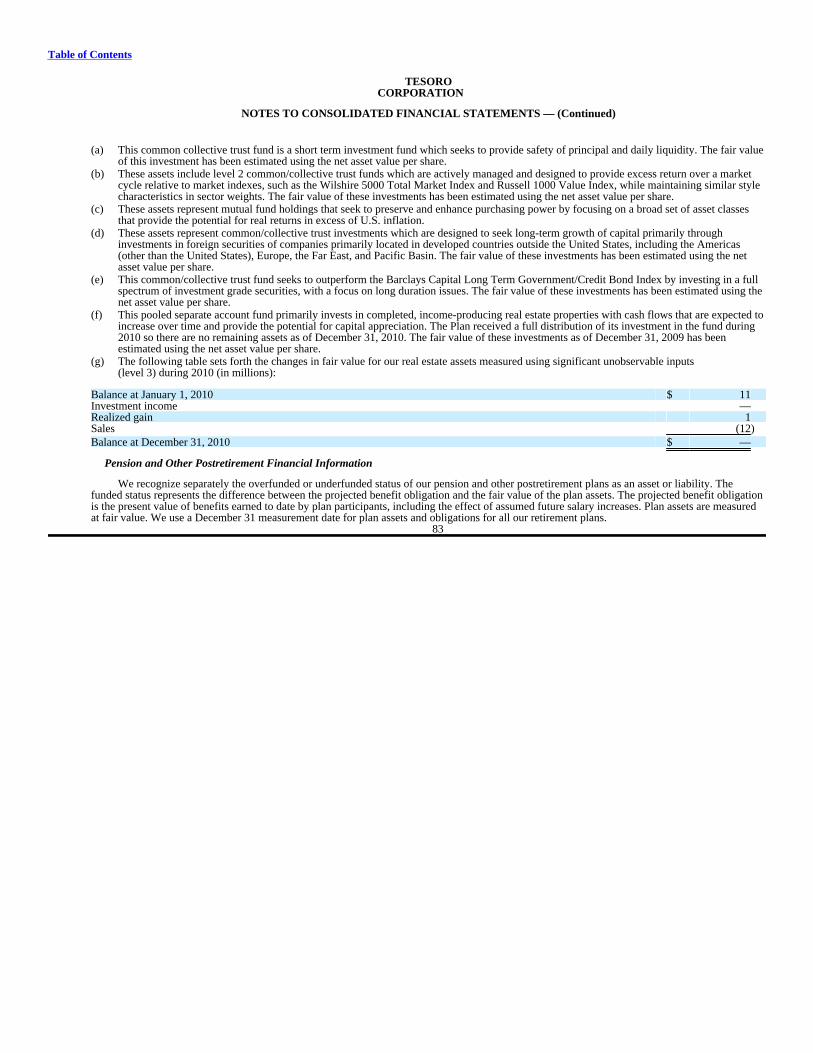
Table of Contents
TESOROCORPORATION
NOTES TO CONSOLIDATED FINANCIAL STATEMENTS — (Continued)
(a) This common collective trust fund is a short term investment fund which seeks to provide safety of principal and daily liquidity. The fair valueof this investment has been estimated using the net asset value per share.
(b) These assets include level 2 common/collective trust funds which are actively managed and designed to provide excess return over a marketcycle relative to market indexes, such as the Wilshire 5000 Total Market Index and Russell 1000 Value Index, while maintaining similar stylecharacteristics in sector weights. The fair value of these investments has been estimated using the net asset value per share.
(c) These assets represent mutual fund holdings that seek to preserve and enhance purchasing power by focusing on a broad set of asset classesthat provide the potential for real returns in excess of U.S. inflation.
(d) These assets represent common/collective trust investments which are designed to seek long-term growth of capital primarily throughinvestments in foreign securities of companies primarily located in developed countries outside the United States, including the Americas(other than the United States), Europe, the Far East, and Pacific Basin. The fair value of these investments has been estimated using the netasset value per share.
(e) This common/collective trust fund seeks to outperform the Barclays Capital Long Term Government/Credit Bond Index by investing in a fullspectrum of investment grade securities, with a focus on long duration issues. The fair value of these investments has been estimated using thenet asset value per share.
(f) This pooled separate account fund primarily invests in completed, income-producing real estate properties with cash flows that are expected toincrease over time and provide the potential for capital appreciation. The Plan received a full distribution of its investment in the fund during2010 so there are no remaining assets as of December 31, 2010. The fair value of these investments as of December 31, 2009 has beenestimated using the net asset value per share.
(g) The following table sets forth the changes in fair value for our real estate assets measured using significant unobservable inputs(level 3) during 2010 (in millions):
Balance at January 1, 2010 $ 11 Investment income — Realized gain 1 Sales (12)
Balance at December 31, 2010 $ —
Pension and Other Postretirement Financial Information
We recognize separately the overfunded or underfunded status of our pension and other postretirement plans as an asset or liability. Thefunded status represents the difference between the projected benefit obligation and the fair value of the plan assets. The projected benefit obligationis the present value of benefits earned to date by plan participants, including the effect of assumed future salary increases. Plan assets are measuredat fair value. We use a December 31 measurement date for plan assets and obligations for all our retirement plans.
83

Table of Contents
TESOROCORPORATION
NOTES TO CONSOLIDATED FINANCIAL STATEMENTS — (Continued)
Changes in our projected benefit obligations and plan assets, and the funded status for our pension plans and other postretirement benefits as ofDecember 31, 2010 and 2009 were (in millions):
Other Postretirement Pension Benefits Benefits 2010 2009 2010 2009
Change in projected benefit obligation: Projected benefit obligations at beginning of year $ 511 $ 437 $ 356 $ 353 Service cost 39 36 11 16 Interest cost 27 27 14 20 Actuarial (gain) loss 45 30 85 (29)Benefits paid (62) (19) (6) (4)Plan amendments — — (317) — Curtailments 4 — (47) —
Projected benefit obligation at end of year $ 564 $ 511 $ 96 $ 356
Changes in plan assets: Fair value of plan assets at beginning of year $ 262 $ 210 $ — $ — Actual return on plan assets 30 34 — — Employer contributions 64 37 6 4 Benefits paid (62) (19) (6) (4)
Fair value of plan assets at end of year $ 294 $ 262 $ — $ —
Funded status at end of year $ (270) $ (249) $ (96) $ (356)
The accumulated benefit obligation is the present value of benefits earned to date, assuming no future salary growth. The accumulated benefitobligation for our pension plans at December 31, 2010 and 2009 was $431 million and $392 million, respectively. Liability amounts recognized inour consolidated balance sheet related to our defined benefit pension plans and other postretirement benefits as of December 31, 2010 and 2009consisted of (in millions):
Other Postretirement Pension Benefits Benefits 2010 2009 2010 2009
Accrued liabilities $ 8 $ 6 $ 8 $ 8 Other Noncurrent Liabilities 262 243 88 348
Total amount recognized $ 270 $ 249 $ 96 $ 356
84
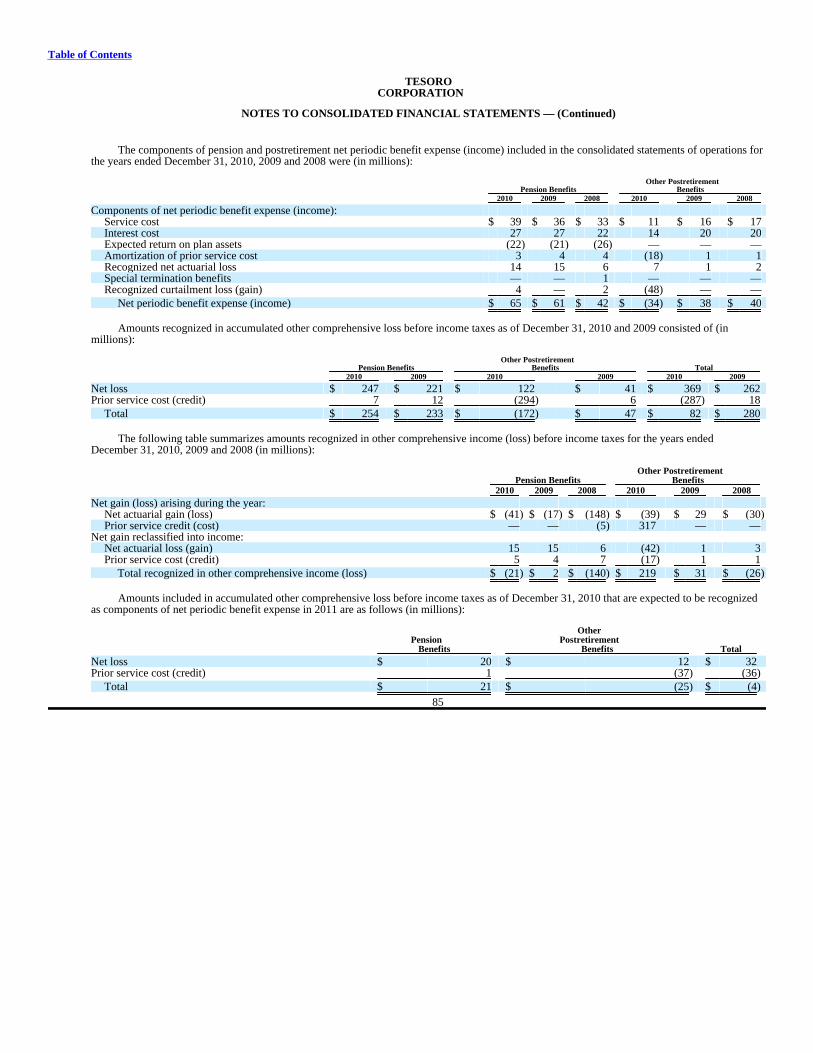
Table of Contents
TESOROCORPORATION
NOTES TO CONSOLIDATED FINANCIAL STATEMENTS — (Continued)
The components of pension and postretirement net periodic benefit expense (income) included in the consolidated statements of operations forthe years ended December 31, 2010, 2009 and 2008 were (in millions):
Other Postretirement Pension Benefits Benefits 2010 2009 2008 2010 2009 2008
Components of net periodic benefit expense (income): Service cost $ 39 $ 36 $ 33 $ 11 $ 16 $ 17 Interest cost 27 27 22 14 20 20 Expected return on plan assets (22) (21) (26) — — — Amortization of prior service cost 3 4 4 (18) 1 1 Recognized net actuarial loss 14 15 6 7 1 2 Special termination benefits — — 1 — — — Recognized curtailment loss (gain) 4 — 2 (48) — —
Net periodic benefit expense (income) $ 65 $ 61 $ 42 $ (34) $ 38 $ 40
Amounts recognized in accumulated other comprehensive loss before income taxes as of December 31, 2010 and 2009 consisted of (inmillions):
Other Postretirement Pension Benefits Benefits Total 2010 2009 2010 2009 2010 2009
Net loss $ 247 $ 221 $ 122 $ 41 $ 369 $ 262 Prior service cost (credit) 7 12 (294) 6 (287) 18
Total $ 254 $ 233 $ (172) $ 47 $ 82 $ 280
The following table summarizes amounts recognized in other comprehensive income (loss) before income taxes for the years endedDecember 31, 2010, 2009 and 2008 (in millions):
Other Postretirement Pension Benefits Benefits 2010 2009 2008 2010 2009 2008
Net gain (loss) arising during the year: Net actuarial gain (loss) $ (41) $ (17) $ (148) $ (39) $ 29 $ (30)Prior service credit (cost) — — (5) 317 — —
Net gain reclassified into income: Net actuarial loss (gain) 15 15 6 (42) 1 3 Prior service cost (credit) 5 4 7 (17) 1 1
Total recognized in other comprehensive income (loss) $ (21) $ 2 $ (140) $ 219 $ 31 $ (26)
Amounts included in accumulated other comprehensive loss before income taxes as of December 31, 2010 that are expected to be recognizedas components of net periodic benefit expense in 2011 are as follows (in millions):
Other Pension Postretirement Benefits Benefits Total
Net loss $ 20 $ 12 $ 32 Prior service cost (credit) 1 (37) (36)
Total $ 21 $ (25) $ (4)
85
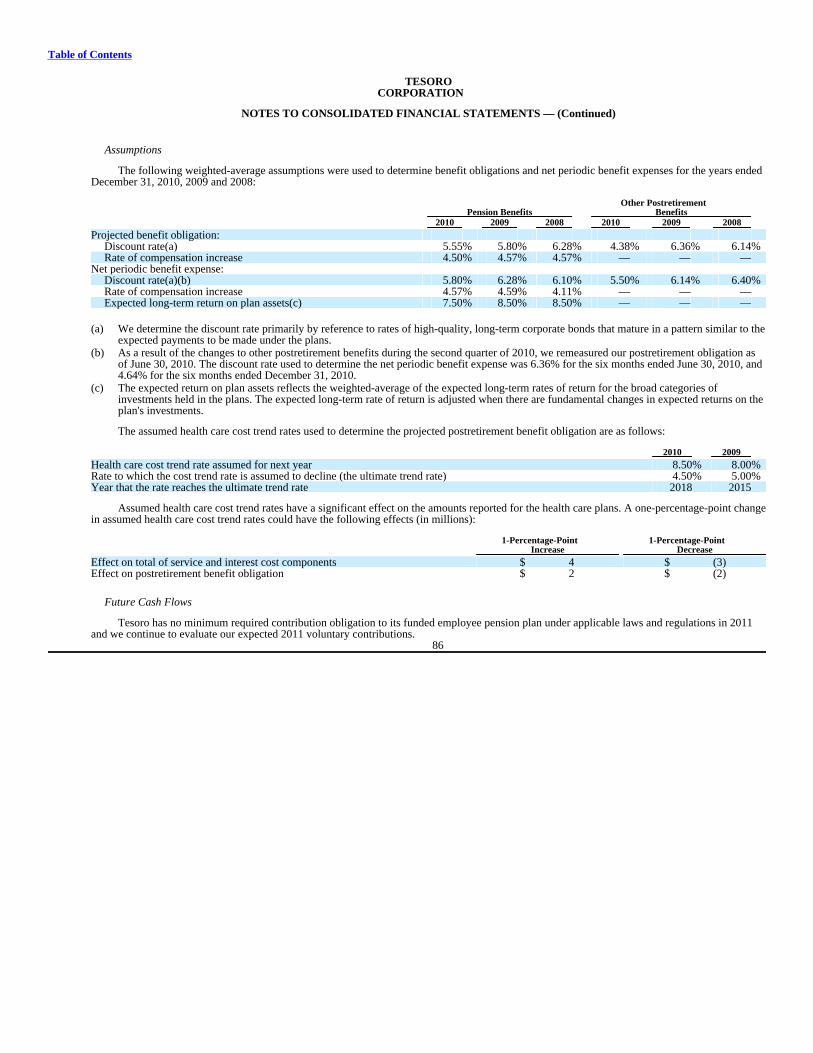
Table of Contents
TESOROCORPORATION
NOTES TO CONSOLIDATED FINANCIAL STATEMENTS — (Continued)
Assumptions
The following weighted-average assumptions were used to determine benefit obligations and net periodic benefit expenses for the years endedDecember 31, 2010, 2009 and 2008:
Other Postretirement Pension Benefits Benefits 2010 2009 2008 2010 2009 2008
Projected benefit obligation: Discount rate(a) 5.55% 5.80% 6.28% 4.38% 6.36% 6.14%Rate of compensation increase 4.50% 4.57% 4.57% — — —
Net periodic benefit expense: Discount rate(a)(b) 5.80% 6.28% 6.10% 5.50% 6.14% 6.40%Rate of compensation increase 4.57% 4.59% 4.11% — — — Expected long-term return on plan assets(c) 7.50% 8.50% 8.50% — — —
(a) We determine the discount rate primarily by reference to rates of high-quality, long-term corporate bonds that mature in a pattern similar to theexpected payments to be made under the plans.
(b) As a result of the changes to other postretirement benefits during the second quarter of 2010, we remeasured our postretirement obligation asof June 30, 2010. The discount rate used to determine the net periodic benefit expense was 6.36% for the six months ended June 30, 2010, and4.64% for the six months ended December 31, 2010.
(c) The expected return on plan assets reflects the weighted-average of the expected long-term rates of return for the broad categories ofinvestments held in the plans. The expected long-term rate of return is adjusted when there are fundamental changes in expected returns on theplan's investments.
The assumed health care cost trend rates used to determine the projected postretirement benefit obligation are as follows:
2010 2009
Health care cost trend rate assumed for next year 8.50% 8.00%Rate to which the cost trend rate is assumed to decline (the ultimate trend rate) 4.50% 5.00%Year that the rate reaches the ultimate trend rate 2018 2015
Assumed health care cost trend rates have a significant effect on the amounts reported for the health care plans. A one-percentage-point changein assumed health care cost trend rates could have the following effects (in millions):
1-Percentage-Point 1-Percentage-Point Increase Decrease
Effect on total of service and interest cost components $ 4 $ (3)Effect on postretirement benefit obligation $ 2 $ (2)
Future Cash Flows
Tesoro has no minimum required contribution obligation to its funded employee pension plan under applicable laws and regulations in 2011and we continue to evaluate our expected 2011 voluntary contributions.
86

Table of Contents
TESOROCORPORATION
NOTES TO CONSOLIDATED FINANCIAL STATEMENTS — (Continued)
The following estimated future benefit payments, which reflect expected future service, as appropriate, are expected to be paid for our definedbenefit pension plans and other postretirement benefits in the years indicated(in millions):
Other Pension Postretirement Benefits Benefits
2011 $ 48 $ 8 2012 46 10 2013 47 12 2014 51 10 2015 55 10 2016-2020 314 54
Thrift Plan
We sponsor an employee thrift 401(k) plan that provides for contributions, subject to certain limitations, by eligible employees into designatedinvestment funds with a matching contribution by Tesoro. Employees may elect tax-deferred treatment in accordance with the provisions ofSection 401(k) of the Internal Revenue Code. Throughout 2010, for most employees, we matched 100% of employee contributions, up to 7% of theemployee's eligible earnings, with at least 50% of the matching contribution directed for initial investment in our common stock. As mentionedabove, our match for our thrift plan will be reduced to a $1 for $1 match on 6% of pay (base pay only), effective January 1, 2011. Our contributionsto the thrift plan amounted to $24 million for each of the years in 2010, 2009 and 2008, respectively, of which $13 million, $8 million and $9 millionconsisted of treasury stock reissuances in 2010, 2009 and 2008, respectively.
The unfunded executive deferred compensation plan provides the ability to defer compensation and receive a matching contribution by Tesoroto certain executives and other employees that is not available under the employee thrift plan due to limits imposed by the Internal Revenue Code.
Retail Savings Plan
We sponsor a separate 401(k) savings plan for eligible retail employees who have completed one year of service and have worked at least1,000 hours within that time. Eligible employees automatically receive a non-elective employer contribution equal to 3% of eligible earnings,regardless of participation. If employees elect to make pretax contributions, we also contribute an employer match equal to $0.50 for each $1.00 ofemployee contributions, up to 6% of eligible earnings. At least 50% of the matching employer contributions must be directed for initial investmentin Tesoro common stock. Our contributions amounted to $0.1 million, $0.6 million and $0.6 million in 2010, 2009 and 2008, respectively, of which$0.1 million consisted of treasury stock reissuances for each of the years in 2010, 2009 and 2008, respectively. Beginning with the 2010 plan year,the non-elective 3% employer contribution will be made in one payment after the end of the plan year. We anticipate contributing the 2010 non-elective contribution to eligible employees by March 31, 2011.
NOTE N — COMMITMENTS AND CONTINGENCIES
Operating Leases
We have various cancellable and noncancellable operating leases related to land, office and retail facilities, ship charters, tanks and equipmentand other facilities used in the storage, transportation, and sale of crude oil, feedstocks and refined products. In general, these leases have remainingprimary terms up to 10 years and typically contain multiple renewal options. Total rental expense for all operating leases, including leases with aterm of one month or less, amounted to $347 million in 2010, $374 million in 2009 and $469 million in 2008. See Note J for information related tocapital leases.
The majority of our future lease payments relate to marine transportation, retail station and tank storage leases. As of December 31, 2010, wehad eight ships on time charter used to transport crude oil and refined products. Four of the ships are U.S.-flag ships, including two new tankersdelivered during 2010, with remaining time charters expiring
87

Table of Contents
TESOROCORPORATION
NOTES TO CONSOLIDATED FINANCIAL STATEMENTS — (Continued)
between 2012 and 2013 with options to renew. The other four ships are foreign-flag ships with remaining time charters expiring between 2011 and2013. We also time charter tugs and product barges over varying terms ending in 2011 through 2016, most with options to renew and some withescalation clauses. Our time charters generally contain terms of three to seven years. We have operating leases for most of our retail stations withprimary remaining terms up to 42 years, and generally containing renewal options and escalation clauses. Our storage tank leases run primarilythrough 2017.
Our minimum annual lease payments, as of December 31, 2010, for operating leases having initial or remaining noncancellable lease terms inexcess of one year were (in millions):
Ship Charters(a) Other Total
2011 $ 118 $ 102 $ 220 2012 90 97 187 2013 44 85 129 2014 18 79 97 2015 11 74 85 Thereafter 10 349 359
Total $ 291 $ 786 $ 1,077
(a) Includes minimum annual lease payments for tugs and barges, which range between $11 million and $25 million over the next five years.
Purchase Obligations and Other Commitments
We have long-term take-or-pay commitments for the transportation of crude oil and refined products as well as to purchase industrial gases,chemical processing services and utilities associated with the operation of our refineries. The minimum annual payments under these take-or-payagreements are estimated to total $176 million in 2011, $111 million in 2012, $93 million in 2013, $97 million in 2014 and $96 million in 2015. Theremaining minimum commitments after 2015 total approximately $435 million over 14 years. We paid approximately $338 million, $300 millionand $525 million in 2010, 2009 and 2008, respectively, under these take-or-pay contracts. We also have significant obligations to purchase crude oilto operate our refineries. These crude oil commitments have terms less than five years.
Environmental and Tax Matters
We are a party to various litigation and contingent loss situations, including environmental and income tax matters, arising in the ordinarycourse of business. Although we cannot predict the ultimate outcomes of these matters with certainty, we have accrued for the estimated liabilitieswhen appropriate. We believe that the outcome of these matters will not materially impact our liquidity and consolidated financial position, althoughthe resolution of certain of these matters could have a material impact on interim or annual results of operations. Additionally, if applicable, weaccrue receivables for probable insurance or other third-party recoveries.
We are subject to extensive federal, state and local environmental laws and regulations. These laws, which change frequently, regulate thedischarge of materials into the environment and may require us to remove or mitigate the environmental effects of the disposal or release ofpetroleum or chemical substances at various sites, install additional controls, or make other modifications to certain emission sources.
We are subject to extensive federal, state and foreign tax laws and regulations. Newly enacted tax laws and regulations, and changes inexisting tax laws and regulations, could result in increased expenditures in the future. We are also subject to audits by federal, state and foreigntaxing authorities in the normal course of business. It is possible that tax audits could result in claims against us in excess of recorded liabilities. Webelieve that resolution of any such claim(s) would not materially affect our consolidated financial position or results of operations. We believe it isreasonably possible that unrecognized tax benefits could decrease by as much as $12 million in the next twelve months through settlements or otherconclusions, primarily regarding state tax issues.
88
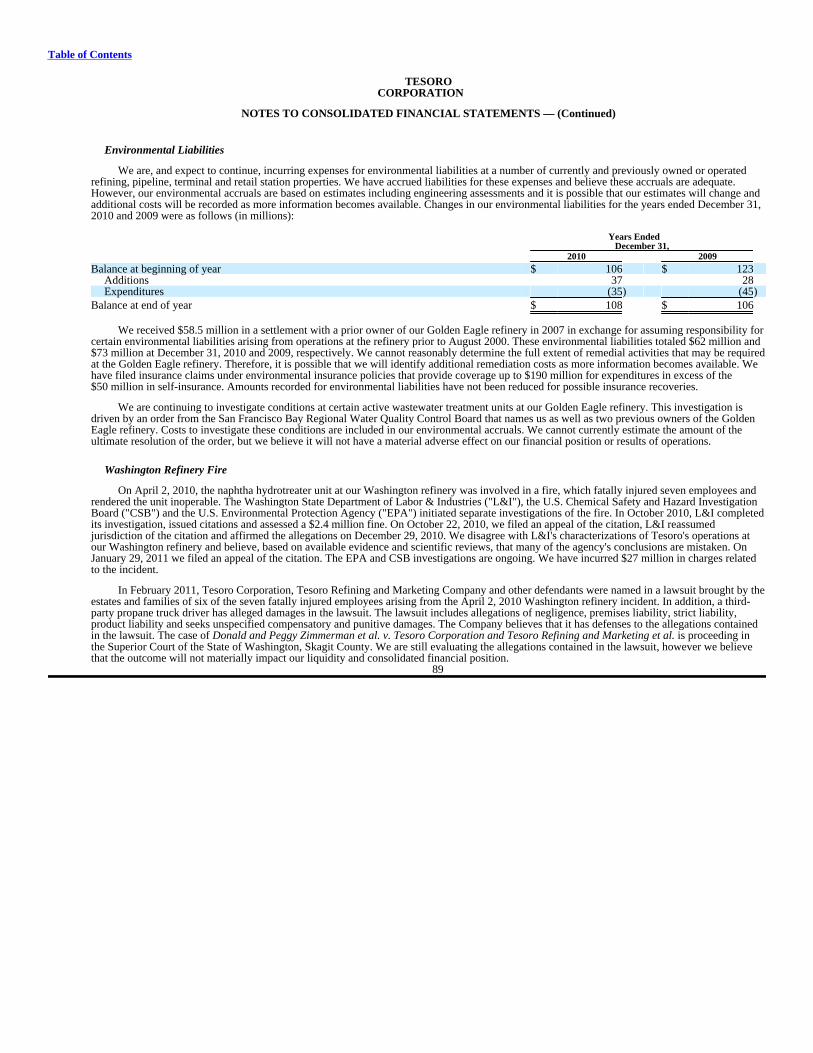
Table of Contents
TESOROCORPORATION
NOTES TO CONSOLIDATED FINANCIAL STATEMENTS — (Continued)
Environmental Liabilities
We are, and expect to continue, incurring expenses for environmental liabilities at a number of currently and previously owned or operatedrefining, pipeline, terminal and retail station properties. We have accrued liabilities for these expenses and believe these accruals are adequate.However, our environmental accruals are based on estimates including engineering assessments and it is possible that our estimates will change andadditional costs will be recorded as more information becomes available. Changes in our environmental liabilities for the years ended December 31,2010 and 2009 were as follows (in millions):
Years Ended December 31, 2010 2009
Balance at beginning of year $ 106 $ 123 Additions 37 28 Expenditures (35) (45)
Balance at end of year $ 108 $ 106
We received $58.5 million in a settlement with a prior owner of our Golden Eagle refinery in 2007 in exchange for assuming responsibility forcertain environmental liabilities arising from operations at the refinery prior to August 2000. These environmental liabilities totaled $62 million and$73 million at December 31, 2010 and 2009, respectively. We cannot reasonably determine the full extent of remedial activities that may be requiredat the Golden Eagle refinery. Therefore, it is possible that we will identify additional remediation costs as more information becomes available. Wehave filed insurance claims under environmental insurance policies that provide coverage up to $190 million for expenditures in excess of the$50 million in self-insurance. Amounts recorded for environmental liabilities have not been reduced for possible insurance recoveries.
We are continuing to investigate conditions at certain active wastewater treatment units at our Golden Eagle refinery. This investigation isdriven by an order from the San Francisco Bay Regional Water Quality Control Board that names us as well as two previous owners of the GoldenEagle refinery. Costs to investigate these conditions are included in our environmental accruals. We cannot currently estimate the amount of theultimate resolution of the order, but we believe it will not have a material adverse effect on our financial position or results of operations.
Washington Refinery Fire
On April 2, 2010, the naphtha hydrotreater unit at our Washington refinery was involved in a fire, which fatally injured seven employees andrendered the unit inoperable. The Washington State Department of Labor & Industries ("L&I"), the U.S. Chemical Safety and Hazard InvestigationBoard ("CSB") and the U.S. Environmental Protection Agency ("EPA") initiated separate investigations of the fire. In October 2010, L&I completedits investigation, issued citations and assessed a $2.4 million fine. On October 22, 2010, we filed an appeal of the citation, L&I reassumedjurisdiction of the citation and affirmed the allegations on December 29, 2010. We disagree with L&I's characterizations of Tesoro's operations atour Washington refinery and believe, based on available evidence and scientific reviews, that many of the agency's conclusions are mistaken. OnJanuary 29, 2011 we filed an appeal of the citation. The EPA and CSB investigations are ongoing. We have incurred $27 million in charges relatedto the incident.
In February 2011, Tesoro Corporation, Tesoro Refining and Marketing Company and other defendants were named in a lawsuit brought by theestates and families of six of the seven fatally injured employees arising from the April 2, 2010 Washington refinery incident. In addition, a third-party propane truck driver has alleged damages in the lawsuit. The lawsuit includes allegations of negligence, premises liability, strict liability,product liability and seeks unspecified compensatory and punitive damages. The Company believes that it has defenses to the allegations containedin the lawsuit. The case of Donald and Peggy Zimmerman et al. v. Tesoro Corporation and Tesoro Refining and Marketing et al. is proceeding inthe Superior Court of the State of Washington, Skagit County. We are still evaluating the allegations contained in the lawsuit, however we believethat the outcome will not materially impact our liquidity and consolidated financial position.
89
Table of Contents
TESOROCORPORATION
NOTES TO CONSOLIDATED FINANCIAL STATEMENTS — (Continued)
Our business interruption insurance deductible is satisfied after we have exceeded both 60 days of operational disruption and $25 million inlosses primarily based on the operating plan that existed prior to the incident. Our property damage insurance has a $10 million deductible. We havefiled business interruption insurance claims and property damage claims related to this incident. During 2010, we collected $55 million in businessinterruption insurance recoveries, which were recorded as an offset to cost of sales in the consolidated statement of operations.
Other Matters
In the ordinary course of business, we become party to lawsuits, administrative proceedings and governmental investigations, includingenvironmental, regulatory and other matters. Large, and sometimes unspecified, damages or penalties may be sought from us in some matters forwhich the likelihood of loss may be reasonably possible but the amount of loss is not currently estimable. As a result, we have not establishedaccruals for these matters. On the basis of existing information, we believe that the resolution of these matters, individually or in the aggregate, willnot have a material adverse effect on our financial position or results of operations.
During 2009, Chevron filed a lawsuit against us claiming they are entitled to a share of the refunds we received in 2008 from the owners of theTrans Alaska Pipeline System ("TAPS"). We received $50 million in 2008, net of contingent legal fees, for excessive intrastate rates charged byTAPS during 1997 though 2000, and the period of 2001 through June 2003. Chevron is asserting that it is entitled to a share of its portion of therefunds for retroactive price adjustments under our previous crude oil contracts with them. In September 2010, the trial court judge grantedChevron's motion for summary judgment and awarded them $16 million. We disagree with the trial court and have appealed the decision to theAlaska Supreme Court in which the proceeding is now pending. We have established an accrual for this matter and believe that the outcome will notmaterially impact our liquidity and consolidated financial position.
On February 5, 2010, the EPA filed suit against us alleging violations of the Clean Air Act and corresponding regulatory requirementsconcerning the testing and reporting of transportation fuels and fuel additives. In February 2009, we received a Notice of Violation ("NOV") fromthe EPA for the alleged violations arising from a compliance review conducted by the EPA in 2006 for the years 2003 through the time of the reviewin 2006. We are discussing the alleged violations contained in the suit with the EPA and the U.S. Department of Justice and have not established anaccrual for this matter. On the basis of existing information, we believe that the resolution of this matter will not have a material adverse effect onour financial position or results of operations.
NOTE O — STOCKHOLDERS' EQUITY
Our Credit Agreement and senior notes each limit our ability to pay cash dividends or repurchase stock. The limitation in each of our debtagreements is based on limits on restricted payments (as defined in our debt agreements), which include dividends, stock repurchases or voluntaryprepayments of subordinate debt. The aggregate amount of restricted payments cannot exceed an amount defined in each of the debt agreements.The indentures for our senior notes also limit our subsidiaries ability to make certain payments and distributions. We do not believe that thelimitations will restrict our ability to pay dividends or repurchase stock under our current programs. See Note P for information relating to stock-based compensation and common stock reserved for exercise of options.
90
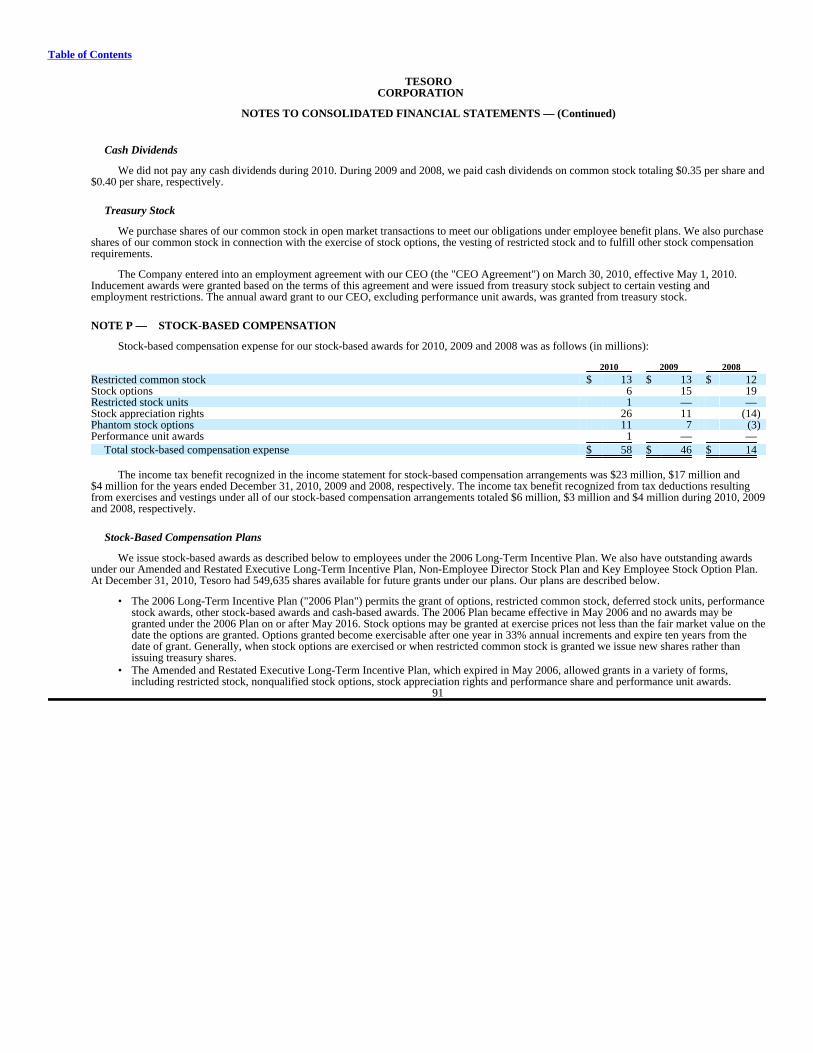
Table of Contents
TESOROCORPORATION
NOTES TO CONSOLIDATED FINANCIAL STATEMENTS — (Continued)
Cash Dividends
We did not pay any cash dividends during 2010. During 2009 and 2008, we paid cash dividends on common stock totaling $0.35 per share and$0.40 per share, respectively.
Treasury Stock
We purchase shares of our common stock in open market transactions to meet our obligations under employee benefit plans. We also purchaseshares of our common stock in connection with the exercise of stock options, the vesting of restricted stock and to fulfill other stock compensationrequirements.
The Company entered into an employment agreement with our CEO (the "CEO Agreement") on March 30, 2010, effective May 1, 2010.Inducement awards were granted based on the terms of this agreement and were issued from treasury stock subject to certain vesting andemployment restrictions. The annual award grant to our CEO, excluding performance unit awards, was granted from treasury stock.
NOTE P — STOCK-BASED COMPENSATION
Stock-based compensation expense for our stock-based awards for 2010, 2009 and 2008 was as follows (in millions):
2010 2009 2008
Restricted common stock $ 13 $ 13 $ 12 Stock options 6 15 19 Restricted stock units 1 — — Stock appreciation rights 26 11 (14)Phantom stock options 11 7 (3)Performance unit awards 1 — —
Total stock-based compensation expense $ 58 $ 46 $ 14
The income tax benefit recognized in the income statement for stock-based compensation arrangements was $23 million, $17 million and$4 million for the years ended December 31, 2010, 2009 and 2008, respectively. The income tax benefit recognized from tax deductions resultingfrom exercises and vestings under all of our stock-based compensation arrangements totaled $6 million, $3 million and $4 million during 2010, 2009and 2008, respectively.
Stock-Based Compensation Plans
We issue stock-based awards as described below to employees under the 2006 Long-Term Incentive Plan. We also have outstanding awardsunder our Amended and Restated Executive Long-Term Incentive Plan, Non-Employee Director Stock Plan and Key Employee Stock Option Plan.At December 31, 2010, Tesoro had 549,635 shares available for future grants under our plans. Our plans are described below.
• The 2006 Long-Term Incentive Plan ("2006 Plan") permits the grant of options, restricted common stock, deferred stock units, performancestock awards, other stock-based awards and cash-based awards. The 2006 Plan became effective in May 2006 and no awards may begranted under the 2006 Plan on or after May 2016. Stock options may be granted at exercise prices not less than the fair market value on thedate the options are granted. Options granted become exercisable after one year in 33% annual increments and expire ten years from thedate of grant. Generally, when stock options are exercised or when restricted common stock is granted we issue new shares rather thanissuing treasury shares.
• The Amended and Restated Executive Long-Term Incentive Plan, which expired in May 2006, allowed grants in a variety of forms,including restricted stock, nonqualified stock options, stock appreciation rights and performance share and performance unit awards.
91
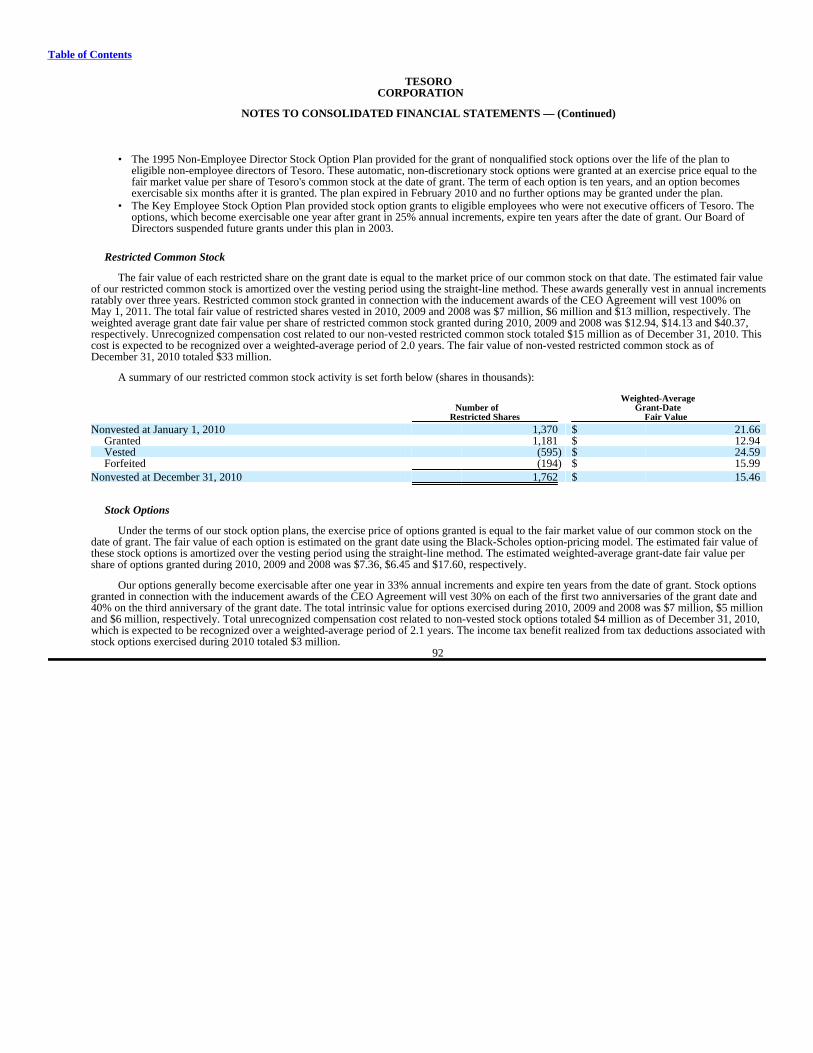
Table of Contents
TESOROCORPORATION
NOTES TO CONSOLIDATED FINANCIAL STATEMENTS — (Continued)
• The 1995 Non-Employee Director Stock Option Plan provided for the grant of nonqualified stock options over the life of the plan toeligible non-employee directors of Tesoro. These automatic, non-discretionary stock options were granted at an exercise price equal to thefair market value per share of Tesoro's common stock at the date of grant. The term of each option is ten years, and an option becomesexercisable six months after it is granted. The plan expired in February 2010 and no further options may be granted under the plan.
• The Key Employee Stock Option Plan provided stock option grants to eligible employees who were not executive officers of Tesoro. Theoptions, which become exercisable one year after grant in 25% annual increments, expire ten years after the date of grant. Our Board ofDirectors suspended future grants under this plan in 2003.
Restricted Common Stock
The fair value of each restricted share on the grant date is equal to the market price of our common stock on that date. The estimated fair valueof our restricted common stock is amortized over the vesting period using the straight-line method. These awards generally vest in annual incrementsratably over three years. Restricted common stock granted in connection with the inducement awards of the CEO Agreement will vest 100% onMay 1, 2011. The total fair value of restricted shares vested in 2010, 2009 and 2008 was $7 million, $6 million and $13 million, respectively. Theweighted average grant date fair value per share of restricted common stock granted during 2010, 2009 and 2008 was $12.94, $14.13 and $40.37,respectively. Unrecognized compensation cost related to our non-vested restricted common stock totaled $15 million as of December 31, 2010. Thiscost is expected to be recognized over a weighted-average period of 2.0 years. The fair value of non-vested restricted common stock as ofDecember 31, 2010 totaled $33 million.
A summary of our restricted common stock activity is set forth below (shares in thousands):
Weighted-Average Number of Grant-Date Restricted Shares Fair Value
Nonvested at January 1, 2010 1,370 $ 21.66 Granted 1,181 $ 12.94 Vested (595) $ 24.59 Forfeited (194) $ 15.99
Nonvested at December 31, 2010 1,762 $ 15.46
Stock Options
Under the terms of our stock option plans, the exercise price of options granted is equal to the fair market value of our common stock on thedate of grant. The fair value of each option is estimated on the grant date using the Black-Scholes option-pricing model. The estimated fair value ofthese stock options is amortized over the vesting period using the straight-line method. The estimated weighted-average grant-date fair value pershare of options granted during 2010, 2009 and 2008 was $7.36, $6.45 and $17.60, respectively.
Our options generally become exercisable after one year in 33% annual increments and expire ten years from the date of grant. Stock optionsgranted in connection with the inducement awards of the CEO Agreement will vest 30% on each of the first two anniversaries of the grant date and40% on the third anniversary of the grant date. The total intrinsic value for options exercised during 2010, 2009 and 2008 was $7 million, $5 millionand $6 million, respectively. Total unrecognized compensation cost related to non-vested stock options totaled $4 million as of December 31, 2010,which is expected to be recognized over a weighted-average period of 2.1 years. The income tax benefit realized from tax deductions associated withstock options exercised during 2010 totaled $3 million.
92
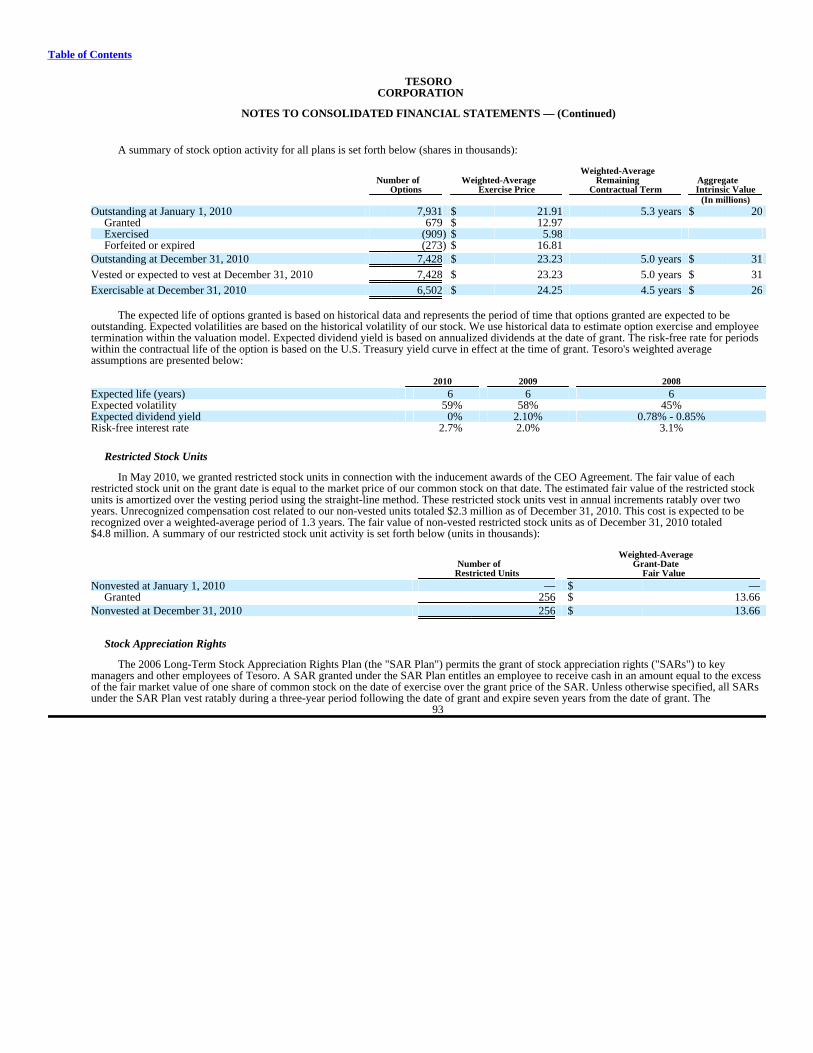
Table of Contents
TESOROCORPORATION
NOTES TO CONSOLIDATED FINANCIAL STATEMENTS — (Continued)
A summary of stock option activity for all plans is set forth below (shares in thousands):
Weighted-Average Number of Weighted-Average Remaining Aggregate Options Exercise Price Contractual Term Intrinsic Value (In millions)
Outstanding at January 1, 2010 7,931 $ 21.91 5.3 years $ 20 Granted 679 $ 12.97 Exercised (909) $ 5.98 Forfeited or expired (273) $ 16.81
Outstanding at December 31, 2010 7,428 $ 23.23 5.0 years $ 31
Vested or expected to vest at December 31, 2010 7,428 $ 23.23 5.0 years $ 31
Exercisable at December 31, 2010 6,502 $ 24.25 4.5 years $ 26
The expected life of options granted is based on historical data and represents the period of time that options granted are expected to beoutstanding. Expected volatilities are based on the historical volatility of our stock. We use historical data to estimate option exercise and employeetermination within the valuation model. Expected dividend yield is based on annualized dividends at the date of grant. The risk-free rate for periodswithin the contractual life of the option is based on the U.S. Treasury yield curve in effect at the time of grant. Tesoro's weighted averageassumptions are presented below:
2010 2009 2008
Expected life (years) 6 6 6Expected volatility 59% 58% 45%Expected dividend yield 0% 2.10% 0.78% - 0.85%Risk-free interest rate 2.7% 2.0% 3.1%
Restricted Stock Units
In May 2010, we granted restricted stock units in connection with the inducement awards of the CEO Agreement. The fair value of eachrestricted stock unit on the grant date is equal to the market price of our common stock on that date. The estimated fair value of the restricted stockunits is amortized over the vesting period using the straight-line method. These restricted stock units vest in annual increments ratably over twoyears. Unrecognized compensation cost related to our non-vested units totaled $2.3 million as of December 31, 2010. This cost is expected to berecognized over a weighted-average period of 1.3 years. The fair value of non-vested restricted stock units as of December 31, 2010 totaled$4.8 million. A summary of our restricted stock unit activity is set forth below (units in thousands):
Weighted-Average Number of Grant-Date Restricted Units Fair Value
Nonvested at January 1, 2010 — $ — Granted 256 $ 13.66
Nonvested at December 31, 2010 256 $ 13.66
Stock Appreciation Rights
The 2006 Long-Term Stock Appreciation Rights Plan (the "SAR Plan") permits the grant of stock appreciation rights ("SARs") to keymanagers and other employees of Tesoro. A SAR granted under the SAR Plan entitles an employee to receive cash in an amount equal to the excessof the fair market value of one share of common stock on the date of exercise over the grant price of the SAR. Unless otherwise specified, all SARsunder the SAR Plan vest ratably during a three-year period following the date of grant and expire seven years from the date of grant. The
93
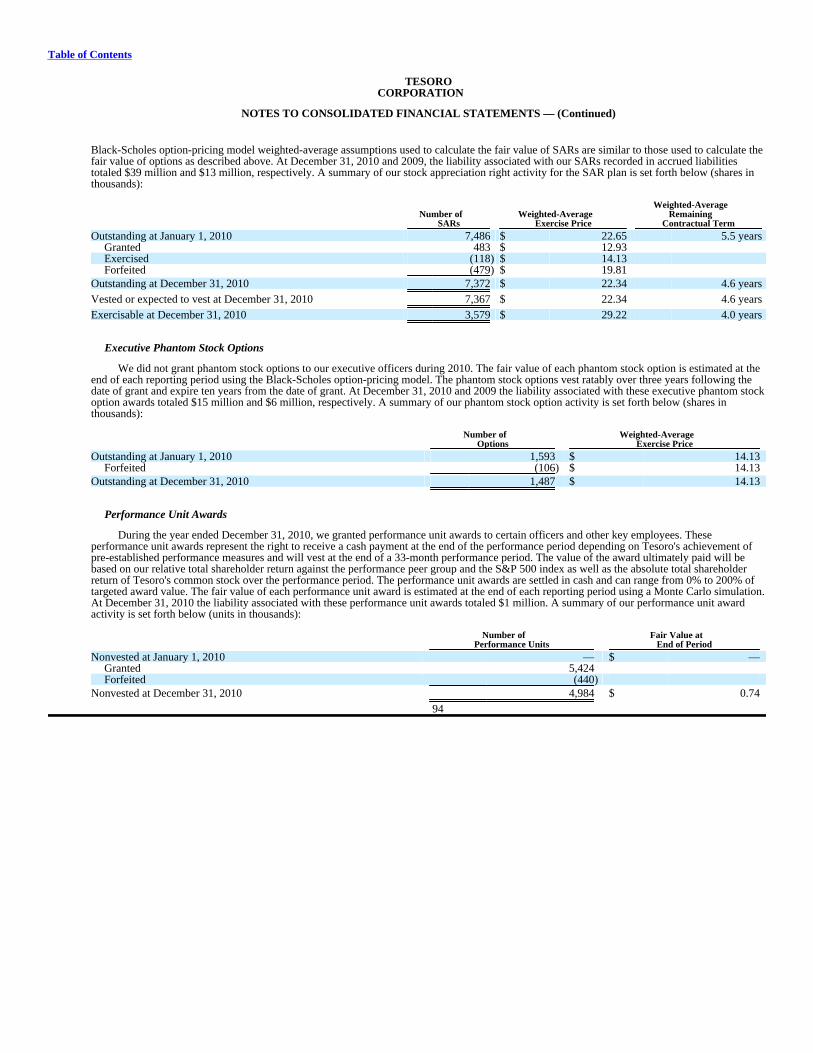
Table of Contents
TESOROCORPORATION
NOTES TO CONSOLIDATED FINANCIAL STATEMENTS — (Continued)
Black-Scholes option-pricing model weighted-average assumptions used to calculate the fair value of SARs are similar to those used to calculate thefair value of options as described above. At December 31, 2010 and 2009, the liability associated with our SARs recorded in accrued liabilitiestotaled $39 million and $13 million, respectively. A summary of our stock appreciation right activity for the SAR plan is set forth below (shares inthousands):
Weighted-Average Number of Weighted-Average Remaining SARs Exercise Price Contractual Term
Outstanding at January 1, 2010 7,486 $ 22.65 5.5 years Granted 483 $ 12.93 Exercised (118) $ 14.13 Forfeited (479) $ 19.81
Outstanding at December 31, 2010 7,372 $ 22.34 4.6 years
Vested or expected to vest at December 31, 2010 7,367 $ 22.34 4.6 years
Exercisable at December 31, 2010 3,579 $ 29.22 4.0 years
Executive Phantom Stock Options
We did not grant phantom stock options to our executive officers during 2010. The fair value of each phantom stock option is estimated at theend of each reporting period using the Black-Scholes option-pricing model. The phantom stock options vest ratably over three years following thedate of grant and expire ten years from the date of grant. At December 31, 2010 and 2009 the liability associated with these executive phantom stockoption awards totaled $15 million and $6 million, respectively. A summary of our phantom stock option activity is set forth below (shares inthousands):
Number of Weighted-Average Options Exercise Price
Outstanding at January 1, 2010 1,593 $ 14.13 Forfeited (106) $ 14.13
Outstanding at December 31, 2010 1,487 $ 14.13
Performance Unit Awards
During the year ended December 31, 2010, we granted performance unit awards to certain officers and other key employees. Theseperformance unit awards represent the right to receive a cash payment at the end of the performance period depending on Tesoro's achievement ofpre-established performance measures and will vest at the end of a 33-month performance period. The value of the award ultimately paid will bebased on our relative total shareholder return against the performance peer group and the S&P 500 index as well as the absolute total shareholderreturn of Tesoro's common stock over the performance period. The performance unit awards are settled in cash and can range from 0% to 200% oftargeted award value. The fair value of each performance unit award is estimated at the end of each reporting period using a Monte Carlo simulation.At December 31, 2010 the liability associated with these performance unit awards totaled $1 million. A summary of our performance unit awardactivity is set forth below (units in thousands):
Number of Fair Value at Performance Units End of Period
Nonvested at January 1, 2010 — $ — Granted 5,424 Forfeited (440)
Nonvested at December 31, 2010 4,984 $ 0.74
94
Table of Contents
TESOROCORPORATION
NOTES TO CONSOLIDATED FINANCIAL STATEMENTS — (Continued)
Board of Directors Deferred Compensation Plan
Effective May 1, 2009, our Non-Employee Director Phantom Stock Plan was amended and restated as the Board of Directors DeferredCompensation Plan. Under this plan, half of a director's annual retainer will be paid in cash or deferred (as elected) in a cash account or a stockaccount. The other half of a director's annual retainer will be mandatorily deferred into the stock account for three years. The annual retainer is paidor deferred on the last business day of each calendar quarter. New directors will receive sign-on awards that will be mandatorily deferred into thestock account. The portion of the annual retainer that is deferred into the stock account will be converted into units, based on the closing marketprice of Tesoro's common stock on the date of credit. The value of each stock account is a function of the changes in the market value of Tesoro'scommon stock, which is payable in cash commencing at the separation of service, death, disability or in the case of elective deferrals, an in-servicelump sum. Payments may be made as a total distribution or in annual installments, not to exceed ten years.
NOTE Q — OPERATING SEGMENTS
The Company's revenues are derived from two operating segments, refining and retail. We own and operate seven petroleum refineries locatedin California, Washington, Alaska, Hawaii, North Dakota and Utah. These refineries manufacture gasoline and gasoline blendstocks, jet fuel, dieselfuel, residual fuel oils and other refined products. We sell these refined products, together with refined products purchased from third-parties, atwholesale through terminal facilities and other locations. Our refining segment also sells refined products to unbranded marketers and occasionallyexports refined products to foreign markets. Our retail segment sells gasoline, diesel fuel and convenience store items through company-operatedretail stations and branded jobber/dealers in 15 states from Minnesota to Alaska and Hawaii. We do not have significant operations in foreigncountries. Therefore, revenue in foreign countries and long-lived assets located in foreign countries are not material to our operations. No singlecustomer accounted for more than 10% of our consolidated operating revenues for the years ended December 31, 2010, 2009, or 2008.
The operating segments adhere to the accounting policies used for our consolidated financial statements, as described in Note A. We evaluatethe performance of our segments based primarily on segment operating income. Segment operating income includes those revenues and expensesthat are directly attributable to management of the respective segment. Intersegment sales from refining to retail are made at prevailing market rates.Income taxes, other income, foreign currency exchange gain (loss), interest and financing costs, interest income, corporate depreciation andcorporate general and administrative expenses are excluded from segment operating income. Identifiable assets are those used by the segments,whereas corporate assets are principally cash and other assets that are not associated with a specific operating segment.
95
Table of Contents
TESOROCORPORATION
NOTES TO CONSOLIDATED FINANCIAL STATEMENTS — (Continued)
Segment information for each of the three years ended is as follows (in millions):
2010 2009 2008
Revenues Refining(a):
Refined products $ 19,038 $ 15,674 $ 26,759 Crude oil resales and other 1,039 691 1,126
Retail: Fuel(b) 3,583 3,000 4,184 Merchandise and other 227 235 248
Intersegment sales from Refining to Retail (3,304) (2,728) (3,901)
Total Revenues $ 20,583 $ 16,872 $ 28,416
Segment Operating Income (Loss) Refining(c)(d) $ 255 $ 55 $ 627 Retail(e) 97 83 46
Total Segment Operating Income 352 138 673 Corporate and unallocated costs (212) (195) (202)
Operating Income (Loss)(f) 140 (57) 471 Interest and financing costs (157) (130) (111)Interest income 3 4 7 Foreign currency exchange gain (loss) 2 (5) 12 Other income (expense)(g) (13) — 50
Earnings (Loss) Before Income Taxes $ (25) $ (188) $ 429
Depreciation and Amortization Expense Refining $ 365 $ 359 $ 326 Retail 39 39 49 Corporate 18 28 26
Total Depreciation and Amortization Expense $ 422 $ 426 $ 401
(a) Refined products sales include intersegment sales to our retail segment, at prices which approximate market of $3.3 billion, $2.7 billion and$3.9 billion in 2010, 2009 and 2008, respectively.
(b) Federal and state motor fuel taxes on sales by our retail segment are included in both revenues and cost of sales in our statements ofconsolidated operations. These taxes totaled $330 million, $283 million and $278 million for the years ended December 31, 2010, 2009 and2008, respectively.
(c) Includes goodwill write-off related to two separate reporting units for $10 million and $43 million for the years ended December 31, 2010 and2009, respectively, and impairment charges related to refining equipment at our Los Angeles refinery of $20 million and $12 million,respectively.
(d) Includes $55 million in business interruption insurance recoveries related to the April 2, 2010 incident at our Washington refinery for the yearended December 31, 2010.
(e) Retail operating income for 2008 includes impairment charges of $29 million primarily related to closing 42 Mirastar retail stations and thepotential sale of 20 retail stations.
(f) Includes a $48 million gain for the year ended December 31, 2010 from the elimination of postretirement life insurance benefits for currentand future retirees.
(g) During 2008, we received net refunds totaling $50 million from the Trans Alaska Pipeline System for previous years' refinery transportationand distribution costs associated with our protest of intrastate tariffs charged between 1997 and 2003. During 2010, we accrued $16 million forclaims asserted against us in connection with these refunds. See Note N for further information.
96
Table of Contents
TESOROCORPORATION
NOTES TO CONSOLIDATED FINANCIAL STATEMENTS — (Continued)
Segment information as of and for each of the three years ended is as follows (in millions):
December 31, 2010 2009 2008
Capital Expenditures: Refining $ 263 $ 356 $ 561 Retail 22 14 20 Corporate 2 31 38
Total Capital Expenditures $ 287 $ 401 $ 619
December 31, 2010 2009 2008
Identifiable Assets: Refining $ 7,303 $ 6,690 $ 6,542 Retail 619 656 649 Corporate 810 724 242
Total Assets $ 8,732 $ 8,070 $ 7,433
NOTE R — SUBSEQUENT EVENTS
On January 4, 2011, Tesoro Logistics LP, a wholly owned subsidiary of Tesoro Corporation, filed a registration statement on Form S-1 withthe U.S. Securities and Exchange Commission in connection with a proposed initial public offering of its common units representing limited partnerinterests. On February 9, 2011, Tesoro Logistics LP filed an amendment to the initial Form S-1 on Form S-1/A. The number of common units to beoffered and the price range for the offering have not yet been determined. Tesoro Logistics LP was formed by Tesoro Corporation to own, operate,develop and acquire crude oil and refined products logistics assets. Headquartered in San Antonio, Texas, Tesoro Logistics LP's initial assets willconsist of a crude oil gathering system in the Bakken Shale/Williston Basin area, eight refined products terminals in the western United States, and acrude oil and refined products storage facility and five related short-haul pipelines in Utah. At the date of this report, the registration statement is noteffective. The completion of the offering is subject to numerous conditions, including market conditions, and we can provide no assurance that itwill be successfully completed.
NOTE S — CONDENSED CONSOLIDATING FINANCIAL INFORMATION
Separate condensed consolidating financial information of Tesoro Corporation, subsidiary guarantors and non-guarantors are presented below.Tesoro and certain subsidiary guarantors have fully and unconditionally guaranteed our 61/4% senior notes due 2012, 65/8% senior notes due 2015,61/2% senior notes due 2017 and 93/4% senior notes due 2019. As a result of these guarantee arrangements, we are required to present the followingcondensed consolidating financial information. The following condensed consolidating financial information should be read in conjunction with theaccompanying consolidated financial statements and notes. The following condensed consolidating financial information is provided as analternative to providing separate financial statements for guarantor subsidiaries. Separate financial statements of Tesoro's subsidiary guarantors arenot included because the guarantees are full and unconditional and these subsidiary guarantors are 100% owned and jointly and severally liable forTesoro's outstanding senior notes. The information is presented using the equity method of accounting for investments in subsidiaries.
97

Table of Contents
TESOROCORPORATION
NOTES TO CONSOLIDATED FINANCIAL STATEMENTS — (Continued)
Condensed Consolidating Balance Sheet as of December 31, 2010
Non- Tesoro Guarantor Guarantor Corporation Subsidiaries Subsidiaries Eliminations Consolidated (In millions)
ASSETSCurrent Assets:
Cash and cash equivalents $ — $ 612 $ 36 $ — $ 648 Receivables, less allowance for doubtful accounts 8 719 181 — 908 Inventories — 1,080 177 — 1,257 Prepayments and other 29 78 8 — 115
Total Current Assets 37 2,489 402 — 2,928
Net Property, Plant and Equipment — 5,008 162 — 5,170 Investment in Subsidiaries 4,011 (147) (5) (3,859) — Long-Term Receivables from Affiliates 2,037 — 88 (2,125) — Other Noncurrent Assets 34 597 3 — 634
Total Assets $ 6,119 $ 7,947 $ 650 $ (5,984) $ 8,732
LIABILITIES AND STOCKHOLDERS' EQUITY
Current Liabilities: Accounts payable and accrued liabilities $ 76 $ 1,940 $ 328 $ — $ 2,344 Current maturities of debt — 2 150 — 152
Total Current Liabilities 76 1,942 478 — 2,496
Long-Term Payables to Affiliates — 2,125 — (2,125) — Debt 1,823 20 — — 1,843 Other Noncurrent Liabilities 1,005 174 (1) — 1,178 Stockholders' Equity 3,215 3,686 173 (3,859) 3,215
Total Liabilities and Stockholders' Equity $ 6,119 $ 7,947 $ 650 $ (5,984) $ 8,732
98

Table of Contents
TESOROCORPORATION
NOTES TO CONSOLIDATED FINANCIAL STATEMENTS — (Continued)
Condensed Consolidating Balance Sheet as of December 31, 2009
Non- Tesoro Guarantor Guarantor Corporation Subsidiaries Subsidiaries Eliminations Consolidated (In millions)
ASSETSCurrent Assets:
Cash and cash equivalents $ — $ 411 $ 2 $ — $ 413 Receivables, less allowance for doubtful accounts 114 760 242 — 1,116 Inventories — 610 12 — 622 Prepayments and other 28 43 1 — 72
Total Current Assets 142 1,824 257 — 2,223
Net Property, Plant and Equipment — 5,019 171 — 5,190 Investment in Subsidiaries 3,999 (102) (5) (3,892) — Long-Term Receivables from Affiliates 1,878 — 83 (1,961) — Other Noncurrent Assets 42 615 — — 657
Total Assets $ 6,061 $ 7,356 $ 506 $ (5,853) $ 8,070
LIABILITIES AND STOCKHOLDERS' EQUITY
Current Liabilities: Accounts payable and accrued liabilities $ 88 $ 1,428 $ 369 $ — $ 1,885 Current maturities of debt — 4 — — 4
Total Current Liabilities 88 1,432 369 — 1,889
Long-Term Payables to Affiliates — 1,961 — (1,961) — Debt 1,814 23 — — 1,837 Other Noncurrent Liabilities 1,072 183 2 — 1,257 Stockholders' Equity 3,087 3,757 135 (3,892) 3,087
Total Liabilities and Stockholders' Equity $ 6,061 $ 7,356 $ 506 $ (5,853) $ 8,070
99
Table of Contents
TESOROCORPORATION
NOTES TO CONSOLIDATED FINANCIAL STATEMENTS — (Continued)
Condensed Consolidating Statement of Operations for the Year Ended December 31, 2010
Non- Tesoro Guarantor Guarantor Corporation Subsidiaries Subsidiaries Eliminations Consolidated (In millions)
REVENUES $ — $ 26,108 $ 2,624 $ (8,149) $ 20,583 Costs and expenses 9 25,966 2,617 (8,149) 20,443
OPERATING INCOME (LOSS) (9) 142 7 — 140 Equity in earnings (loss) of subsidiaries (23) (45) — 68 — Other expense — (164) (1) — (165)
EARNINGS (LOSS) BEFORE INCOME TAXES (32) (67) 6 68 (25)Income tax expense (benefit)(a) (3) 4 3 — 4
NET EARNINGS (LOSS) $ (29) $ (71) $ 3 $ 68 $ (29)
(a) The income tax expense (benefit) reflected in each column does not include any tax effect of the equity in earnings from subsidiaries.
Condensed Consolidating Statement of Operations for the Year Ended December 31, 2009
Non- Tesoro Guarantor Guarantor Corporation Subsidiaries Subsidiaries Eliminations Consolidated (In millions)
REVENUES $ — $ 20,377 $ 2,047 $ (5,552) $ 16,872 Costs and expenses 7 20,428 2,046 (5,552) 16,929
OPERATING INCOME (LOSS) (7) (51) 1 — (57)Equity in earnings (loss) of subsidiaries (135) (53) (3) 191 — Other expense — (131) — — (131)
EARNINGS (LOSS) BEFORE INCOME TAXES (142) (235) (2) 191 (188)Income tax benefit(a) (2) (46) — — (48)
NET EARNINGS (LOSS) $ (140) $ (189) $ (2) $ 191 $ (140)
(a) The income tax benefit reflected in each column does not include any tax effect of the equity in earnings from subsidiaries.
Condensed Consolidating Statement of Operations for the Year Ended December 31, 2008
Non- Tesoro Guarantor Guarantor Corporation Subsidiaries Subsidiaries Eliminations Consolidated (In millions)
REVENUES $ — $ 33,546 $ 4,030 $ (9,160) $ 28,416 Costs and expenses 4 33,111 3,990 (9,160) 27,945
OPERATING INCOME (LOSS) (4) 435 40 — 471 Equity in earnings (loss) of subsidiaries 280 (48) (2) (230) — Other expense — (42) — — (42)
EARNINGS (LOSS) BEFORE INCOME TAXES 276 345 38 (230) 429 Income tax expense (benefit)(a) (2) 140 13 — 151
NET EARNINGS (LOSS) $ 278 $ 205 $ 25 $ (230) $ 278
(a) The income tax expense (benefit) reflected in each column does not include any tax effect of the equity in earnings from subsidiaries. 100
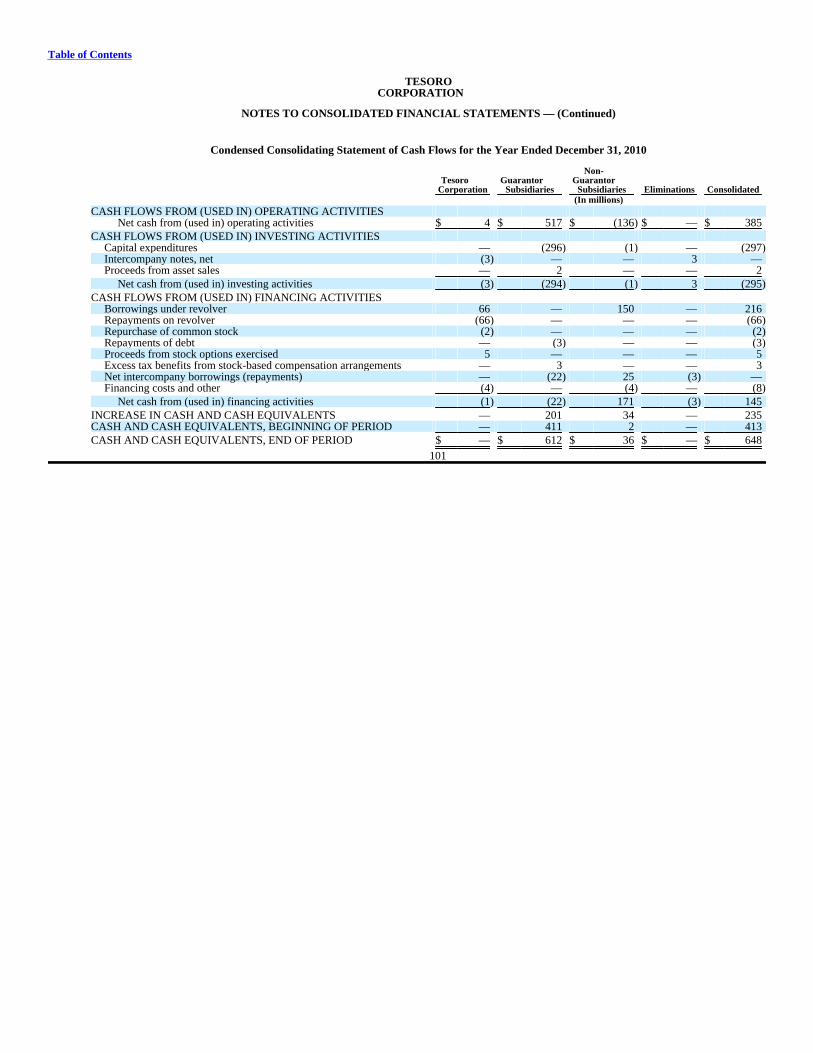
Table of Contents
TESOROCORPORATION
NOTES TO CONSOLIDATED FINANCIAL STATEMENTS — (Continued)
Condensed Consolidating Statement of Cash Flows for the Year Ended December 31, 2010
Non- Tesoro Guarantor Guarantor Corporation Subsidiaries Subsidiaries Eliminations Consolidated (In millions)
CASH FLOWS FROM (USED IN) OPERATING ACTIVITIES Net cash from (used in) operating activities $ 4 $ 517 $ (136) $ — $ 385
CASH FLOWS FROM (USED IN) INVESTING ACTIVITIES Capital expenditures — (296) (1) — (297)Intercompany notes, net (3) — — 3 — Proceeds from asset sales — 2 — — 2
Net cash from (used in) investing activities (3) (294) (1) 3 (295)
CASH FLOWS FROM (USED IN) FINANCING ACTIVITIES Borrowings under revolver 66 — 150 — 216 Repayments on revolver (66) — — — (66)Repurchase of common stock (2) — — — (2)Repayments of debt — (3) — — (3)Proceeds from stock options exercised 5 — — — 5 Excess tax benefits from stock-based compensation arrangements — 3 — — 3 Net intercompany borrowings (repayments) — (22) 25 (3) — Financing costs and other (4) — (4) — (8)
Net cash from (used in) financing activities (1) (22) 171 (3) 145
INCREASE IN CASH AND CASH EQUIVALENTS — 201 34 — 235 CASH AND CASH EQUIVALENTS, BEGINNING OF PERIOD — 411 2 — 413
CASH AND CASH EQUIVALENTS, END OF PERIOD $ — $ 612 $ 36 $ — $ 648
101

Table of Contents
TESOROCORPORATION
NOTES TO CONSOLIDATED FINANCIAL STATEMENTS — (Continued)
Condensed Consolidating Statement of Cash Flows for the Year Ended December 31, 2009
Non- Tesoro Guarantor Guarantor Corporation Subsidiaries Subsidiaries Eliminations Consolidated (In millions)
CASH FLOWS FROM (USED IN) OPERATING ACTIVITIES Net cash from (used in) operating activities $ (11) $ 598 $ 76 $ — $ 663
CASH FLOWS FROM (USED IN) INVESTING ACTIVITIES Capital expenditures — (399) (38) — (437)Intercompany notes, net (155) — — 155 — Proceeds from asset sales — 1 — — 1
Net cash from (used in) investing activities (155) (398) (38) 155 (436)
CASH FLOWS FROM (USED IN) FINANCING ACTIVITIES Proceeds from debt borrowings 282 — — — 282 Borrowings under revolver 418 — — — 418 Repayments on revolver (484) — — — (484)Repurchase of common stock (2) — — — (2)Dividend payments (49) — — — (49)Repayments of debt — (2) — — (2)Proceeds from stock options exercised 4 — — — 4 Excess tax benefits from stock-based compensation arrangements — 2 — — 2 Net intercompany borrowings (repayments) — 191 (36) (155) — Financing costs and other (3) — — — (3)
Net cash from (used in) financing activities 166 191 (36) (155) 166
INCREASE IN CASH AND CASH EQUIVALENTS — 391 2 — 393 CASH AND CASH EQUIVALENTS, BEGINNING OF PERIOD — 20 — — 20
CASH AND CASH EQUIVALENTS, END OF PERIOD $ — $ 411 $ 2 $ — $ 413
102
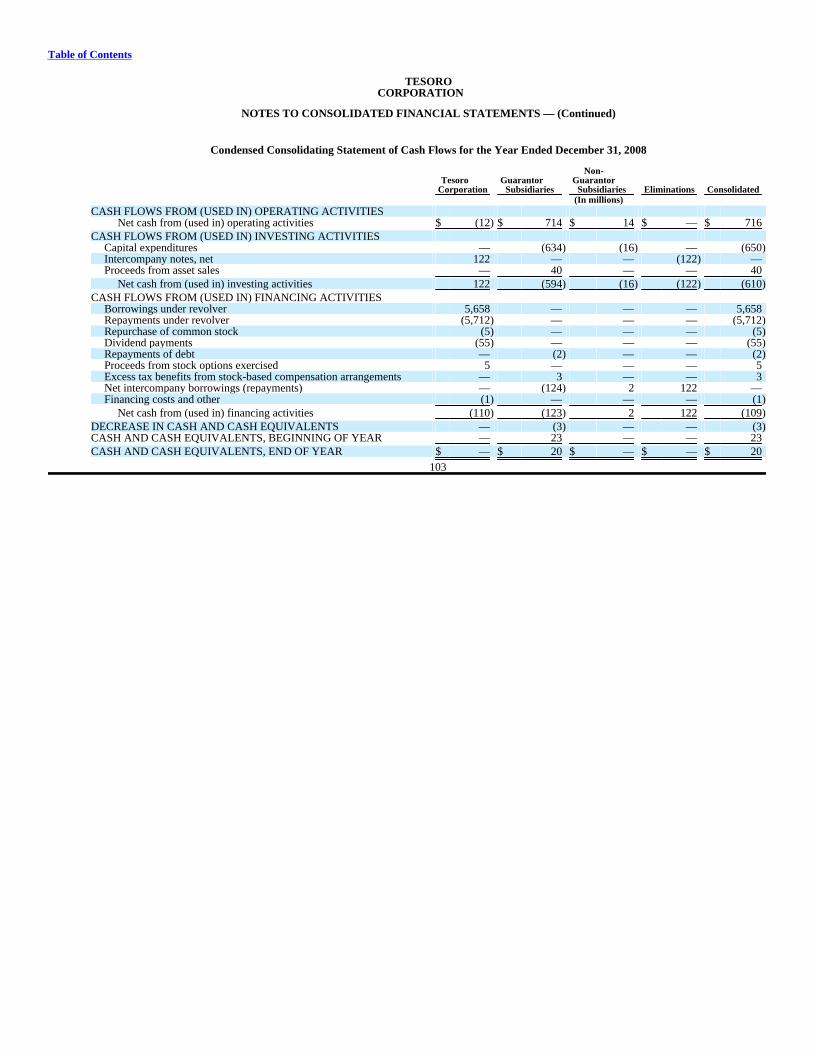
Table of Contents
TESOROCORPORATION
NOTES TO CONSOLIDATED FINANCIAL STATEMENTS — (Continued)
Condensed Consolidating Statement of Cash Flows for the Year Ended December 31, 2008
Non- Tesoro Guarantor Guarantor Corporation Subsidiaries Subsidiaries Eliminations Consolidated (In millions)
CASH FLOWS FROM (USED IN) OPERATING ACTIVITIES Net cash from (used in) operating activities $ (12) $ 714 $ 14 $ — $ 716
CASH FLOWS FROM (USED IN) INVESTING ACTIVITIES Capital expenditures — (634) (16) — (650)Intercompany notes, net 122 — — (122) — Proceeds from asset sales — 40 — — 40
Net cash from (used in) investing activities 122 (594) (16) (122) (610)
CASH FLOWS FROM (USED IN) FINANCING ACTIVITIES Borrowings under revolver 5,658 — — — 5,658 Repayments under revolver (5,712) — — — (5,712)Repurchase of common stock (5) — — — (5)Dividend payments (55) — — — (55)Repayments of debt — (2) — — (2)Proceeds from stock options exercised 5 — — — 5 Excess tax benefits from stock-based compensation arrangements — 3 — — 3 Net intercompany borrowings (repayments) — (124) 2 122 — Financing costs and other (1) — — — (1)
Net cash from (used in) financing activities (110) (123) 2 122 (109)
DECREASE IN CASH AND CASH EQUIVALENTS — (3) — — (3)CASH AND CASH EQUIVALENTS, BEGINNING OF YEAR — 23 — — 23
CASH AND CASH EQUIVALENTS, END OF YEAR $ — $ 20 $ — $ — $ 20
103

Table of Contents
TESOROCORPORATION
NOTES TO CONSOLIDATED FINANCIAL STATEMENTS — (Continued)
NOTE T — QUARTERLY FINANCIAL DATA (UNAUDITED)
Quarters Total First Second Third Fourth Year (In millions except per share amounts)
2010 Revenues $ 4,607 $ 5,143 $ 5,320 $ 5,513 $ 20,583 Cost of sales $ 4,247 $ 4,492 $ 4,647 $ 4,865 $ 18,251 Operating expenses $ 373 $ 348 $ 375 $ 378 $ 1,474 Operating Income (Loss) $ (202) $ 143 $ 129 $ 70 $ 140 Net Earnings (Loss)(a) $ (155) $ 67 $ 56 $ 3 $ (29)Net Earnings (Loss) Per Share(b):
Basic $ (1.11) $ 0.48 $ 0.40 $ 0.02 $ (0.21)Diluted $ (1.11) $ 0.47 $ 0.39 $ 0.02 $ (0.21)
2009 Revenues $ 3,280 $ 4,181 $ 4,742 $ 4,669 $ 16,872 Cost of sales(c) $ 2,642 $ 3,668 $ 4,125 $ 4,304 $ 14,739 Operating expenses $ 366 $ 368 $ 367 $ 368 $ 1,469 Operating Income (Loss)(d) $ 112 $ (36) $ 89 $ (222) $ (57)Net Earnings (Loss) $ 51 $ (45) $ 33 $ (179) $ (140)Net Earnings (Loss) Per Share(b):
Basic $ 0.37 $ (0.33) $ 0.24 $ (1.30) $ (1.01)Diluted $ 0.37 $ (0.33) $ 0.24 $ (1.30) $ (1.01)
(a) Includes $55 million in business interruption insurance recoveries and $12 million in property damage insurance recoveries related to theApril 2, 2010 incident at our Washington refinery for the three months and year ended December 31, 2010.
(b) The sum of four quarters may not equal annual results due to rounding or quarterly number of shares outstanding.
(c) Reductions in petroleum inventories in 2009 resulted in decreases of last-in-first-out layers acquired at lower per-barrel costs. These inventoryreductions resulted in decreases to cost of sales of $57 million and $69 million during the three months and year ended December 31, 2009,respectively.
(d) During the 2009 fourth quarter, we incurred a $43 million write-off for goodwill in our refining segment. 104

Table of Contents
ITEM 9. CHANGES IN AND DISAGREEMENTS WITH ACCOUNTANTS ON ACCOUNTING AND FINANCIAL DISCLOSURE
None.
ITEM 9A. CONTROLS AND PROCEDURES
Disclosure Controls and Procedures
We carried out an evaluation required by the Securities Exchange Act of 1934, as amended (the "Exchange Act"), under the supervision andwith the participation of our management, including the Chief Executive Officer and Chief Financial Officer, of the effectiveness of the design andoperation of our disclosure controls and procedures pursuant to Rule 13a-15(b) under the Exchange Act as of the end of the year. Based upon thatevaluation, the Chief Executive Officer and Chief Financial Officer concluded that our disclosure controls and procedures are effective. Ourdisclosure controls and procedures are designed to provide reasonable assurance that the information that we are required to disclose in reports wefile under the Exchange Act is accumulated and communicated to management, as appropriate.
During the quarter ended December 31, 2010, there have been no changes in our internal control over financial reporting that have materiallyaffected, or are reasonably likely to materially affect, our internal control over financial reporting.
Management Report on Internal Control over Financial Reporting
We, as management of Tesoro Corporation and its subsidiaries (the "Company"), are responsible for establishing and maintaining adequateinternal control over financial reporting as defined in the Securities Exchange Act of 1934, Rule 13a-15(f). The Company's internal control system isdesigned to provide reasonable assurance regarding the reliability of financial reporting and the preparation of financial statements for externalpurposes in accordance with generally accepted accounting principles in the United States of America. Due to its inherent limitations, internalcontrol over financial reporting may not prevent or detect misstatements. Therefore, even those systems determined to be effective can provide onlyreasonable assurance with respect to financial statement preparation and presentation.
Management assessed the effectiveness of our internal control over financial reporting as of December 31, 2010, using the criteria set forth bythe Committee of Sponsoring Organizations of the Treadway Commission in Internal Control — Integrated Framework. Based on such assessment,we conclude that as of December 31, 2010, the Company's internal control over financial reporting is effective.
The independent registered public accounting firm of Ernst & Young LLP, as auditors of the Company's consolidated financial statements, hasissued an attestation report on the effectiveness of the Company's internal control over financial reporting, included herein.
ITEM 9B. OTHER INFORMATION
None. 105

Table of Contents
REPORT OF INDEPENDENT REGISTERED PUBLIC ACCOUNTING FIRM
To the Board of Directors and Stockholders ofTesoro Corporation
We have audited Tesoro Corporation's internal control over financial reporting as of December 31, 2010, based on criteria established inInternal Control — Integrated Framework issued by the Committee of Sponsoring Organizations of the Treadway Commission (the COSO criteria).Tesoro Corporation's management is responsible for maintaining effective internal control over financial reporting, and for its assessment of theeffectiveness of internal control over financial reporting included in the accompanying Management Report on Internal Control over FinancialReporting. Our responsibility is to express an opinion on the company's internal control over financial reporting based on our audit.
We conducted our audit in accordance with the standards of the Public Company Accounting Oversight Board (United States). Thosestandards require that we plan and perform the audit to obtain reasonable assurance about whether effective internal control over financial reportingwas maintained in all material respects. Our audit included obtaining an understanding of internal control over financial reporting, assessing the riskthat a material weakness exists, testing and evaluating the design and operating effectiveness of internal control based on the assessed risk, andperforming such other procedures as we considered necessary in the circumstances. We believe that our audit provides a reasonable basis for ouropinion.
A company's internal control over financial reporting is a process designed to provide reasonable assurance regarding the reliability offinancial reporting and the preparation of financial statements for external purposes in accordance with generally accepted accounting principles. Acompany's internal control over financial reporting includes those policies and procedures that (1) pertain to the maintenance of records that, inreasonable detail, accurately and fairly reflect the transactions and dispositions of the assets of the company; (2) provide reasonable assurance thattransactions are recorded as necessary to permit preparation of financial statements in accordance with generally accepted accounting principles, andthat receipts and expenditures of the company are being made only in accordance with authorizations of management and directors of the company;and (3) provide reasonable assurance regarding prevention or timely detection of unauthorized acquisition, use or disposition of the company's assetsthat could have a material effect on the financial statements.
Because of its inherent limitations, internal control over financial reporting may not prevent or detect misstatements. Also, projections of anyevaluation of effectiveness to future periods are subject to the risk that controls may become inadequate because of changes in conditions, or that thedegree of compliance with the policies or procedures may deteriorate.
In our opinion, Tesoro Corporation maintained, in all material respects, effective internal control over financial reporting as of December 31,2010, based on the COSO criteria.
We also have audited, in accordance with the standards of the Public Company Accounting Oversight Board (United States), the consolidatedbalance sheets of Tesoro Corporation as of December 31, 2010 and 2009, and the related consolidated statements of operations, comprehensiveincome (loss) and stockholders' equity, and cash flows for each of the three years in the period ended December 31, 2010 and our report datedMarch 1, 2011 expressed an unqualified opinion thereon.
/s/ ERNST & YOUNG LLP
San Antonio, TexasMarch 1, 2011
106

Table of Contents
PART III
ITEM 10. DIRECTORS, EXECUTIVE OFFICERS AND CORPORATE GOVERNANCE
Information required under this Item will be contained in the Company's 2011 Proxy Statement, incorporated herein by reference. See alsoExecutive Officers of the Registrant and Board of Directors of the Registrant under Business in Item 1 hereof.
You can access our code of business conduct and ethics for senior financial executives on our website at www.tsocorp.com, and you mayreceive a copy, free of charge by writing to Tesoro Corporation, Attention: Investor Relations, 19100 Ridgewood Pkwy, San Antonio, Texas78259-1828.
ITEM 11. EXECUTIVE COMPENSATION
Information required under this Item will be contained in the Company's 2011 Proxy Statement, incorporated herein by reference.
ITEM 12. SECURITY OWNERSHIP OF CERTAIN BENEFICIAL OWNERS AND MANAGEMENT AND RELATED STOCKHOLDERMATTERS
Equity Compensation Plan Information
The following table summarizes, as of December 31, 2010, certain information regarding equity compensation to our employees, officers,directors and other persons under our equity compensation plans.
Number of Securities Remaining Available for Future Issuance under Number of Securities to be Weighted-Average Exercise Equity Compensation Issued Upon Exercise of Price of Outstanding Plans (Excluding Outstanding Options, Options, Warrants Securities Reflected in Plan Category Warrants and Rights And Rights the Second Column)
Equity compensation plans approved by security holders 7,226,097 $ 23.58 549,635 Equity compensation plans not approved by security holders(a)
(b) 201,513 $ 10.82 —
Total 7,427,610 $ 23.23 549,635
(a) The Key Employee Stock Option Plan was approved by our Board of Directors in November 1999 and provided for stock option grants toeligible employees who are not our executive officers. The options expire ten years after the date of grant. Our Board of Directors suspendedany future grants under this plan in 2003.
(b) Stock options granted in connection with the inducement awards of the CEO Agreement were not granted under an equity compensation plan.
ITEM 13. CERTAIN RELATIONSHIPS AND RELATED TRANSACTIONS, AND DIRECTOR INDEPENDENCE
Information required under this Item will be contained in the Company's 2011 Proxy Statement, incorporated herein by reference.
ITEM 14. PRINCIPAL ACCOUNTING FEES AND SERVICES
Information required under this Item will be contained in the Company's 2011 Proxy Statement, incorporated herein by reference. 107
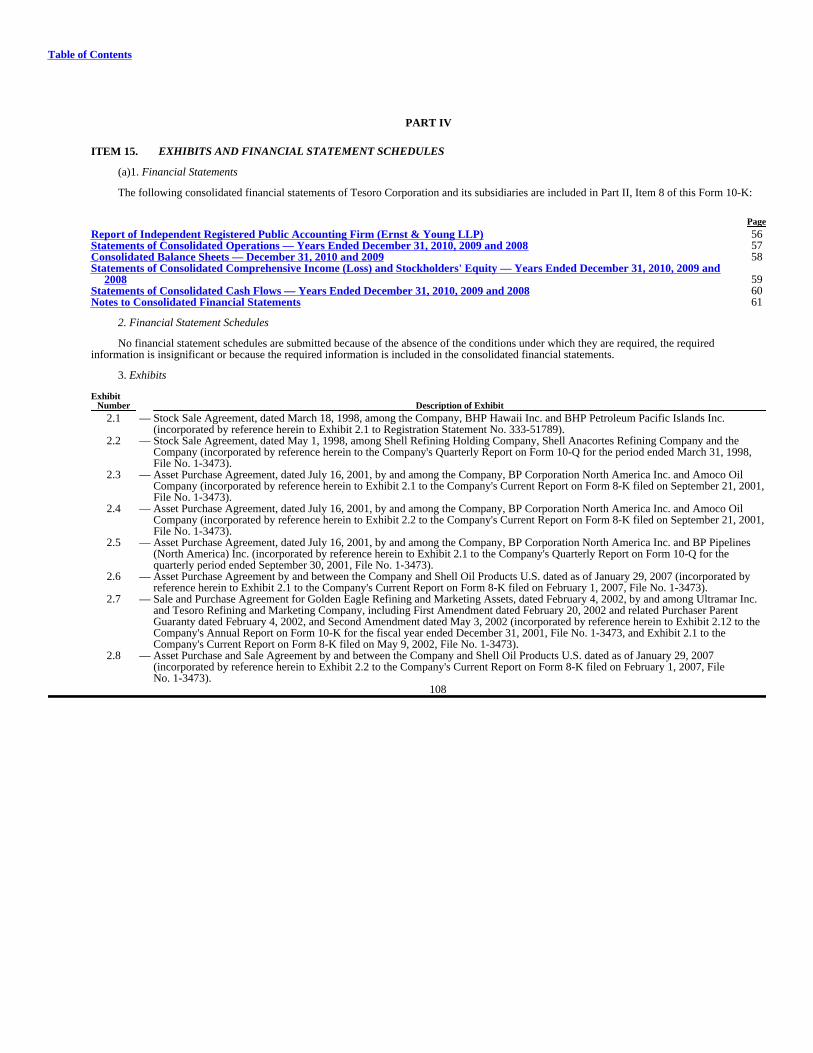
Table of Contents
PART IV
ITEM 15. EXHIBITS AND FINANCIAL STATEMENT SCHEDULES
(a)1. Financial Statements
The following consolidated financial statements of Tesoro Corporation and its subsidiaries are included in Part II, Item 8 of this Form 10-K:
Page
Report of Independent Registered Public Accounting Firm (Ernst & Young LLP) 56 Statements of Consolidated Operations — Years Ended December 31, 2010, 2009 and 2008 57 Consolidated Balance Sheets — December 31, 2010 and 2009 58 Statements of Consolidated Comprehensive Income (Loss) and Stockholders' Equity — Years Ended December 31, 2010, 2009 and
2008 59 Statements of Consolidated Cash Flows — Years Ended December 31, 2010, 2009 and 2008 60 Notes to Consolidated Financial Statements 61
2. Financial Statement Schedules
No financial statement schedules are submitted because of the absence of the conditions under which they are required, the requiredinformation is insignificant or because the required information is included in the consolidated financial statements.
3. Exhibits
Exhibit Number Description of Exhibit
2.1 —
Stock Sale Agreement, dated March 18, 1998, among the Company, BHP Hawaii Inc. and BHP Petroleum Pacific Islands Inc.(incorporated by reference herein to Exhibit 2.1 to Registration Statement No. 333-51789).
2.2
—
Stock Sale Agreement, dated May 1, 1998, among Shell Refining Holding Company, Shell Anacortes Refining Company and theCompany (incorporated by reference herein to the Company's Quarterly Report on Form 10-Q for the period ended March 31, 1998,File No. 1-3473).
2.3
—
Asset Purchase Agreement, dated July 16, 2001, by and among the Company, BP Corporation North America Inc. and Amoco OilCompany (incorporated by reference herein to Exhibit 2.1 to the Company's Current Report on Form 8-K filed on September 21, 2001,File No. 1-3473).
2.4
—
Asset Purchase Agreement, dated July 16, 2001, by and among the Company, BP Corporation North America Inc. and Amoco OilCompany (incorporated by reference herein to Exhibit 2.2 to the Company's Current Report on Form 8-K filed on September 21, 2001,File No. 1-3473).
2.5
—
Asset Purchase Agreement, dated July 16, 2001, by and among the Company, BP Corporation North America Inc. and BP Pipelines(North America) Inc. (incorporated by reference herein to Exhibit 2.1 to the Company's Quarterly Report on Form 10-Q for thequarterly period ended September 30, 2001, File No. 1-3473).
2.6 —
Asset Purchase Agreement by and between the Company and Shell Oil Products U.S. dated as of January 29, 2007 (incorporated byreference herein to Exhibit 2.1 to the Company's Current Report on Form 8-K filed on February 1, 2007, File No. 1-3473).
2.7
—
Sale and Purchase Agreement for Golden Eagle Refining and Marketing Assets, dated February 4, 2002, by and among Ultramar Inc.and Tesoro Refining and Marketing Company, including First Amendment dated February 20, 2002 and related Purchaser ParentGuaranty dated February 4, 2002, and Second Amendment dated May 3, 2002 (incorporated by reference herein to Exhibit 2.12 to theCompany's Annual Report on Form 10-K for the fiscal year ended December 31, 2001, File No. 1-3473, and Exhibit 2.1 to theCompany's Current Report on Form 8-K filed on May 9, 2002, File No. 1-3473).
2.8
—
Asset Purchase and Sale Agreement by and between the Company and Shell Oil Products U.S. dated as of January 29, 2007(incorporated by reference herein to Exhibit 2.2 to the Company's Current Report on Form 8-K filed on February 1, 2007, FileNo. 1-3473).
108

Table of Contents
Exhibit Number Description of Exhibit
2.9
—
Purchase and Sale Agreement and Joint Escrow Instructions by and among the Company and USA Petroleum Corporation, USAGasoline Corporation, Palisades Gas and Wash, Inc. and USA San Diego LLC dated as of January 26, 2007 (incorporated by referenceherein to Exhibit 2.3 to the Company's Current Report on Form 8-K filed on February 1, 2007, File No. 1-3473).
2.10
—
Letter Agreement to the Purchase and Sale Agreement and Joint Escrow Instructions dated April 30, 2007 between the Company andUSA Petroleum Corporation, Palisades Gas and Wash, Inc. and USA San Diego, LLC (incorporated by reference herein to Exhibit 2.1to the Company's Quarterly Report on Form 10-Q for the quarterly period ended June 30, 2007, File No. 1-3473).
3.1 —
Restated Certificate of Incorporation of the Company (incorporated by reference herein to Exhibit 3 to the Company's Annual Reporton Form 10-K for the fiscal year ended December 31, 1993, File No. 1-3473).
3.2
—
Amendment to Restated Certificate of Incorporation of the Company adding a new Article IX limiting Directors' Liability(incorporated by reference herein to Exhibit 3(b) to the Company's Annual Report on Form 10-K for the fiscal year endedDecember 31, 1993, File No. 1-3473).
3.3
—
Certificate of Amendment, dated as of May 4, 2006, to Certificate of Incorporation of the Company, amending Article IV, increasingthe number of authorized shares of common stock from 100 million to 200 million (incorporated by reference herein to Exhibit 3.1 tothe Company's Quarterly Report on Form 10-Q for the period ended March 31, 2006, File No. 1-3473).
3.4
—
Certificate of Amendment, dated as of February 9, 1994, to Restated Certificate of Incorporation of the Company amending Article IV,Article V, Article VII and Article VIII (incorporated by reference herein to Exhibit 3(e) to the Company's Annual Report on Form 10-K for the fiscal year ended December 31, 1993, File No. 1-3473).
3.5
—
Certificate of Amendment, dated as of August 3, 1998, to Certificate of Incorporation of the Company, amending Article IV,increasing the number of authorized shares of Common Stock from 50 million to 100 million (incorporated by reference herein toExhibit 3.1 to the Company's Quarterly Report on Form 10-Q for the period ended September 30, 1998, File No. 1-3473).
3.6
—
Certificate of Ownership of Merger merging Tesoro Merger Corp. into Tesoro Petroleum Corporation and changing the name ofTesoro Petroleum Corporation to Tesoro Corporation, dated November 8, 2004 (incorporated by reference herein to Exhibit 3.1 to theCompany's Current Report on Form 8-K filed on November 9, 2004).
3.7 —
Amended and Restated Bylaws of Tesoro Corporation effective January 26, 2011 (incorporated by reference herein to Exhibit 3.1 tothe Company's Current Report on Form 8-K filed on January 28, 2011).
4.1
—
Form of Indenture relating to the 61/4% Senior Notes due 2012, dated as of November 16, 2005, among Tesoro Corporation, certainsubsidiary guarantors and U.S. Bank National Association, as Trustee (including form of note) (incorporated by reference herein toExhibit 4.1 to the Company's Current Report on Form 8-K filed on November 17, 2005, File No. 1-3473).
4.2
—
Form of Indenture relating to the 65/8% Senior Notes due 2015, dated as of November 16, 2005, among Tesoro Corporation, certainsubsidiary guarantors and U.S. Bank National Association, as Trustee (including form of note) (incorporated by reference herein toExhibit 4.2 to the Company's Current Report on Form 8-K filed on November 17, 2005, File No. 1-3473).
4.3
—
Form of Indenture relating to the 61/2% Senior Notes due 2017, dated as of May 29, 2007, among Tesoro Corporation, certainsubsidiary guarantors and U.S. Bank National Association, as Trustee (including form of note) (incorporated by reference herein toExhibit 4.1 to the Company's Current Report on Form 8-K filed on June 4, 2007, File No. 1-3473)
4.4
—
Form of Indenture relating to the 93/4% Senior Notes due 2019, dated as of May 29, 2007, among Tesoro Corporation, certainsubsidiary guarantors and J.P. Morgan Securities Inc., as Trustee (including form of note) (incorporated by reference herein toExhibit 4.1 to the Company's Current Report on Form 8-K filed on June 5, 2009, File No. 1-3473).
10.1
—
Fourth Amended and Restated Credit Agreement, dated as of May 11, 2007, among the Company, JPMorgan Chase Bank, N.A asadministrative agent and a syndicate of banks, financial institutions and other entities (incorporated by reference to Exhibit 10.1 to theCompany's Current Report on Form 8-K filed on May 15, 2007, File No. 1-3473).
109

Table of Contents
Exhibit Number Description of Exhibit
10.2
—
First Amendment to the Fourth Amended and Restated Credit Agreement, dated as of February 22, 2008, among the Company, JPMorgan Chase Bank, NA as administrative agent and a syndicate of banks, financial institutions and other entities. (incorporated byreference herein to Exhibit 10.2 to the Company's Annual Report on Form 10-K for the fiscal year ended December 31, 2007,File No. 1-3473).
10.3
—
Second Amendment to the Fourth Amended and Restated Credit Agreement, dated as of May 28, 2009, among the Company, JPMorgan Chase Bank, NA as administrative agent and a syndicate of banks, financial institutions and other entities (incorporated byreference herein to Exhibit 10.1 to the Company's Current Report on Form 8-K filed on May 28, 2009, File No. 1-3473).
10.4
—
Third Amendment to the Fourth Amended and Restated Credit Agreement, dated as of February 23, 2010, among the Company, JPMorgan Chase Bank, NA as administrative agent and a syndicate of banks, financial institutions and other entities (incorporated byreference herein to Exhibit 10.4 to the Company's Annual Report on Form 10-K for the year ended December 31, 2009, FileNo. 1-3473).
10.5
—
Uncommitted Revolving Credit Agreement dated as of October 18, 2010, among Tesoro Panama Company, S.A. as Borrower, certainlenders listed on the signature pages, as Lenders, and BNP Paribas, as Administrative Agent, Collateral Agent, Letter of Credit Issuer,Swing Line Lender and Daylight Overdraft Bank (incorporated by reference herein to Exhibit 10.1 to the Company's Current Reporton Form 8-K filed on October 22, 2010, File No. 1-3473).
10.6 —
$100 million Promissory Note, dated as of May 17, 2002, payable by the Company to Ultramar Inc. (incorporated by reference toExhibit 10.1 to the Company's Current Report on Form 8-K filed on May 24, 2002, File No. 1-3473).
10.7 —
$50 million Promissory Note, dated as of May 17, 2002, payable by the Company to Ultramar Inc. (incorporated by reference toExhibit 10.2 to the Company's Current Report on Form 8-K filed on May 24, 2002, File No. 1-3473).
†10.8 —
Amended and Restated Executive Security Plan effective January 1, 2009 (incorporated by reference to Exhibit 10.1 to the Company'sCurrent Report on Form 8-K filed December 18, 2008, File No. 1-3473).
†10.9 —
Amendment No. 1 to the Amended and Restated Executive Security Plan effective as of January 1, 2010 (incorporated by referenceherein to Exhibit 10.8 to the Company's Annual Report on Form 10-K for the year ended December 31, 2009, File No. 1-3473).
†10.10 —
Amended and Restated Executive Long-Term Incentive Plan effective as of February 2, 2006 (incorporated by reference herein toExhibit 10.3 to the Company's Current Report on Form 8-K filed on February 8, 2006, File No. 1-3473).
†10.11 —
2006 Long-Term Incentive Plan dated effective January 1, 2009 (incorporated by reference to Exhibit 10.4 to the Company's CurrentReport on Form 8-K filed December 18, 2008, File No. 1-3473).
†10.12 —
Tesoro Corporation 2006 Executive Deferred Compensation Plan effective January 1, 2009 (incorporated by reference to Exhibit 10.6to the Company's Current Report on Form 8-K filed December 18, 2008, File No. 1-3473).
†10.13 —
Tesoro Corporation Restoration Retirement Plan effective January 1, 2009 (incorporated by reference to Exhibit 10.5 to the Company'sCurrent Report on Form 8-K filed December 18, 2008, File No. 1-3473).
†10.14 —
Amendment No. 1 to the Tesoro Corporation Restoration Retirement Plan effective January 1, 2010 (incorporated by reference hereinto Exhibit 10.13 to the Company's Annual Report on Form 10-K for the year ended December 31, 2009, File No. 1-3473).
†10.15 —
Copy of the Company's Key Employee Stock Option Plan dated November 12, 1999 (incorporated by reference herein to Exhibit 10.3to the Company's Quarterly Report on Form 10-Q for the quarterly period ended March 31, 2002, File No. 1-3473).
†10.16 —
2006 Long-Term Stock Appreciation Rights Plan of Tesoro Corporation (incorporated by reference herein to Exhibit 10.1 to theCompany's Current Report on Form 8-K filed on February 8, 2006, File No. 1-3473).
†10.17 —
Employment Agreement between Tesoro and Gregory J. Goff dated as of March 30, 2010 (incorporated by reference herein toExhibit 10.1 to the Company's Current Report on Form 8-K filed on April 5, 2010, File No. 1-3473).
†10.18
—
Separation and Waiver of Liability Agreement between Tesoro Corporation and William J. Finnerty dated March 18, 2010(incorporated by reference herein to Exhibit 10.1 to the Company's Current Report on Form 8-K filed on March 23, 2010, FileNo. 1-3473).
110
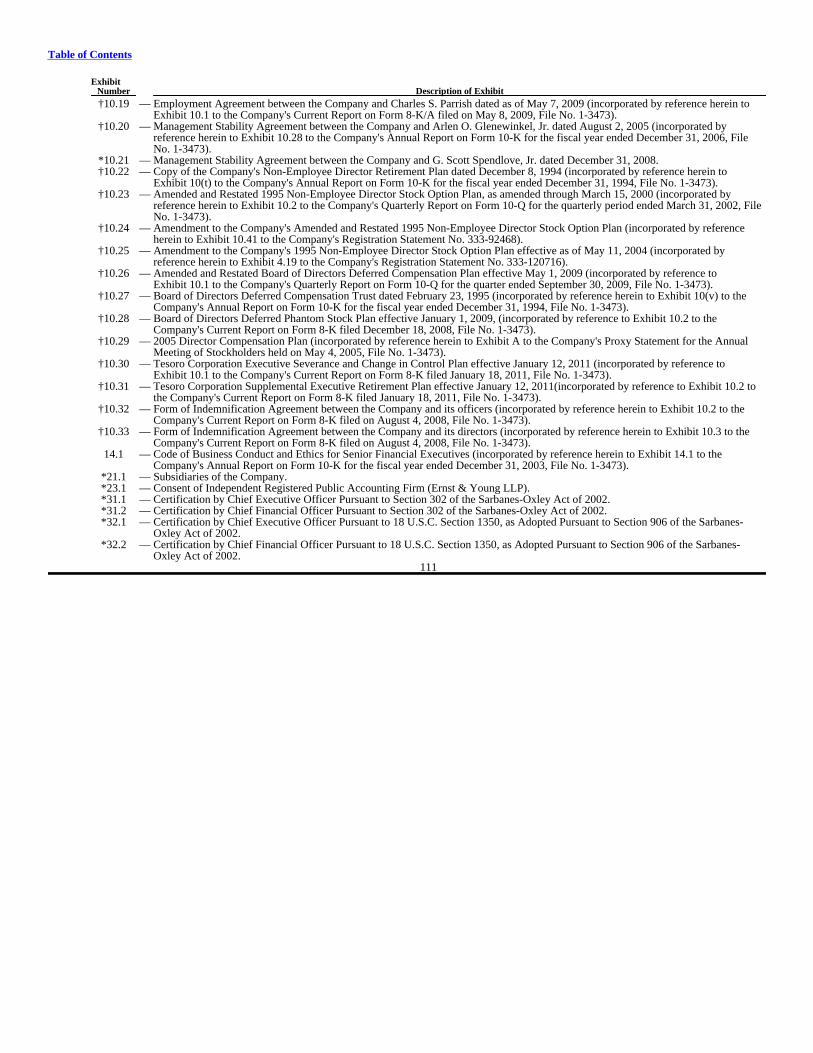
Table of Contents
Exhibit Number Description of Exhibit
†10.19 —
Employment Agreement between the Company and Charles S. Parrish dated as of May 7, 2009 (incorporated by reference herein toExhibit 10.1 to the Company's Current Report on Form 8-K/A filed on May 8, 2009, File No. 1-3473).
†10.20
—
Management Stability Agreement between the Company and Arlen O. Glenewinkel, Jr. dated August 2, 2005 (incorporated byreference herein to Exhibit 10.28 to the Company's Annual Report on Form 10-K for the fiscal year ended December 31, 2006, FileNo. 1-3473).
*10.21 — Management Stability Agreement between the Company and G. Scott Spendlove, Jr. dated December 31, 2008.†10.22
—
Copy of the Company's Non-Employee Director Retirement Plan dated December 8, 1994 (incorporated by reference herein toExhibit 10(t) to the Company's Annual Report on Form 10-K for the fiscal year ended December 31, 1994, File No. 1-3473).
†10.23
—
Amended and Restated 1995 Non-Employee Director Stock Option Plan, as amended through March 15, 2000 (incorporated byreference herein to Exhibit 10.2 to the Company's Quarterly Report on Form 10-Q for the quarterly period ended March 31, 2002, FileNo. 1-3473).
†10.24 —
Amendment to the Company's Amended and Restated 1995 Non-Employee Director Stock Option Plan (incorporated by referenceherein to Exhibit 10.41 to the Company's Registration Statement No. 333-92468).
†10.25 —
Amendment to the Company's 1995 Non-Employee Director Stock Option Plan effective as of May 11, 2004 (incorporated byreference herein to Exhibit 4.19 to the Company's Registration Statement No. 333-120716).
†10.26 —
Amended and Restated Board of Directors Deferred Compensation Plan effective May 1, 2009 (incorporated by reference toExhibit 10.1 to the Company's Quarterly Report on Form 10-Q for the quarter ended September 30, 2009, File No. 1-3473).
†10.27 —
Board of Directors Deferred Compensation Trust dated February 23, 1995 (incorporated by reference herein to Exhibit 10(v) to theCompany's Annual Report on Form 10-K for the fiscal year ended December 31, 1994, File No. 1-3473).
†10.28 —
Board of Directors Deferred Phantom Stock Plan effective January 1, 2009, (incorporated by reference to Exhibit 10.2 to theCompany's Current Report on Form 8-K filed December 18, 2008, File No. 1-3473).
†10.29 —
2005 Director Compensation Plan (incorporated by reference herein to Exhibit A to the Company's Proxy Statement for the AnnualMeeting of Stockholders held on May 4, 2005, File No. 1-3473).
†10.30 —
Tesoro Corporation Executive Severance and Change in Control Plan effective January 12, 2011 (incorporated by reference toExhibit 10.1 to the Company's Current Report on Form 8-K filed January 18, 2011, File No. 1-3473).
†10.31 —
Tesoro Corporation Supplemental Executive Retirement Plan effective January 12, 2011(incorporated by reference to Exhibit 10.2 tothe Company's Current Report on Form 8-K filed January 18, 2011, File No. 1-3473).
†10.32 —
Form of Indemnification Agreement between the Company and its officers (incorporated by reference herein to Exhibit 10.2 to theCompany's Current Report on Form 8-K filed on August 4, 2008, File No. 1-3473).
†10.33 —
Form of Indemnification Agreement between the Company and its directors (incorporated by reference herein to Exhibit 10.3 to theCompany's Current Report on Form 8-K filed on August 4, 2008, File No. 1-3473).
14.1 —
Code of Business Conduct and Ethics for Senior Financial Executives (incorporated by reference herein to Exhibit 14.1 to theCompany's Annual Report on Form 10-K for the fiscal year ended December 31, 2003, File No. 1-3473).
*21.1 — Subsidiaries of the Company.*23.1 — Consent of Independent Registered Public Accounting Firm (Ernst & Young LLP).*31.1 — Certification by Chief Executive Officer Pursuant to Section 302 of the Sarbanes-Oxley Act of 2002.*31.2 — Certification by Chief Financial Officer Pursuant to Section 302 of the Sarbanes-Oxley Act of 2002.*32.1
—
Certification by Chief Executive Officer Pursuant to 18 U.S.C. Section 1350, as Adopted Pursuant to Section 906 of the Sarbanes-Oxley Act of 2002.
*32.2 —
Certification by Chief Financial Officer Pursuant to 18 U.S.C. Section 1350, as Adopted Pursuant to Section 906 of the Sarbanes-Oxley Act of 2002.
111
Table of Contents
Exhibit Number Description of Exhibit
** 101
—
The following materials from Tesoro Corporation's Form 10-K for the fiscal year ended December 31, 2010, formatted in XBRL(Extensible Business Reporting Language): (i) Statements of Consolidated Operations, (ii) Consolidated Balance Sheets,(iii) Statements of Consolidated Comprehensive Income (Loss) and Stockholders' Equity, (iv) Statements of Consolidated Cash Flows,and (v) Notes to Consolidated Financial Statements, tagged as blocks of text.
* Filed herewith.
** Submitted electronically herewith.
Confidential treatment has been granted for certain portions of this Exhibit pursuant to Rule 24b-2 of the Securities Exchange Act of 1934,which portions have been omitted and filed separately with the Securities and Exchange Commission.
† Identifies management contracts or compensatory plans or arrangements required to be filed as an exhibit hereto pursuant to Item 14(a)(3) ofForm 10-K.
In accordance with Rule 402 of Regulation S-T, the XBRL information in Exhibit 101 to this Annual Report on Form 10-K shall not bedeemed to be filed for purposes of Section 18 of the Securities Exchange Act of 1934, as amended (Exchange Act), or otherwise subject to theliability of that section, and shall not be incorporated by reference into any registration statement or other document filed under the SecuritiesAct of 1933, as amended, or the Exchange Act, except as shall be expressly set forth by specific reference in such filing.
Copies of exhibits filed as part of this Form 10-K may be obtained by stockholders of record at a charge of $0.15 per page, minimum $5.00each request. Direct inquiries to the Corporate Secretary, Tesoro Corporation, 19100 Ridgewood Pkwy, San Antonio, Texas, 78259-1828.
112
Table of Contents
SIGNATURES
Pursuant to the requirements of Section 13 or 15(d) of the Securities Exchange Act of 1934, the registrant has duly caused this report to besigned on its behalf by the undersigned, thereunto duly authorized.
TESORO CORPORATION
By /s/ GREGORY J. GOFFGregory J. Goff
President and Chief Executive Officer(Principal Executive Officer)
Dated: March 1, 2011
Pursuant to the requirements of the Securities Exchange Act of 1934, this report has been signed below by the following persons on behalf ofthe registrant and in the capacities and on the dates indicated.
Signature Title Date
/s/ GREGORY J. GOFF
Gregory J. Goff President and Chief Executive Officer (Principal Executive Officer)
February 23, 2011
/s/ G. SCOTT SPENDLOVE
G. Scott Spendlove Senior Vice President and Chief Financial Officer (Principal Financial Officer)
February 23, 2011
/s/ ARLEN O. GLENEWINKEL, JR.
Arlen O. Glenewinkel, Jr. Vice President and Controller (Principal Accounting Officer)
February 23, 2011
/s/ STEVEN H. GRAPSTEIN
Steven H. Grapstein Chairman of the Board of Directors
February 23, 2011
/s/ RODNEY F. CHASE
Rodney F. Chase Director
February 23, 2011
/s/ ROBERT W. GOLDMAN
Robert W. Goldman Director
February 23, 2011
/s/ WILLIAM J. JOHNSON
William J. Johnson Director
February 23, 2011
/s/ J.W. NOKES
J.W. Nokes Director
February 23, 2011
/s/ DONALD H. SCHMUDE
Donald H. Schmude Director
February 23, 2011
Susan Tomasky Director
/s/ MICHAEL E. WILEY
Michael E. Wiley Director
February 23, 2011
/s/ PATRICK Y. YANG
Patrick Y. Yang Director
February 23, 2011
113
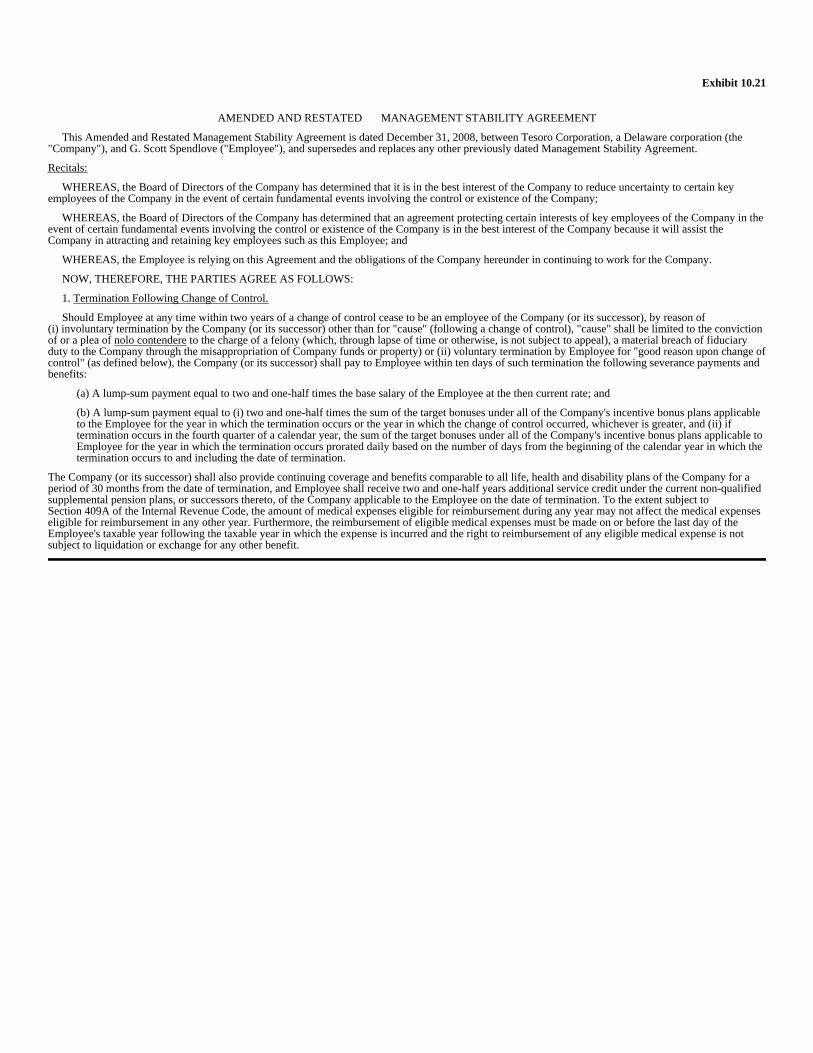
Exhibit 10.21
AMENDED AND RESTATED MANAGEMENT STABILITY AGREEMENT
This Amended and Restated Management Stability Agreement is dated December 31, 2008, between Tesoro Corporation, a Delaware corporation (the"Company"), and G. Scott Spendlove ("Employee"), and supersedes and replaces any other previously dated Management Stability Agreement.
Recitals:
WHEREAS, the Board of Directors of the Company has determined that it is in the best interest of the Company to reduce uncertainty to certain keyemployees of the Company in the event of certain fundamental events involving the control or existence of the Company;
WHEREAS, the Board of Directors of the Company has determined that an agreement protecting certain interests of key employees of the Company in theevent of certain fundamental events involving the control or existence of the Company is in the best interest of the Company because it will assist theCompany in attracting and retaining key employees such as this Employee; and
WHEREAS, the Employee is relying on this Agreement and the obligations of the Company hereunder in continuing to work for the Company.
NOW, THEREFORE, THE PARTIES AGREE AS FOLLOWS:
1. Termination Following Change of Control.
Should Employee at any time within two years of a change of control cease to be an employee of the Company (or its successor), by reason of(i) involuntary termination by the Company (or its successor) other than for "cause" (following a change of control), "cause" shall be limited to the convictionof or a plea of nolo contendere to the charge of a felony (which, through lapse of time or otherwise, is not subject to appeal), a material breach of fiduciaryduty to the Company through the misappropriation of Company funds or property) or (ii) voluntary termination by Employee for "good reason upon change ofcontrol" (as defined below), the Company (or its successor) shall pay to Employee within ten days of such termination the following severance payments andbenefits:
(a) A lump-sum payment equal to two and one-half times the base salary of the Employee at the then current rate; and
(b) A lump-sum payment equal to (i) two and one-half times the sum of the target bonuses under all of the Company's incentive bonus plans applicableto the Employee for the year in which the termination occurs or the year in which the change of control occurred, whichever is greater, and (ii) iftermination occurs in the fourth quarter of a calendar year, the sum of the target bonuses under all of the Company's incentive bonus plans applicable toEmployee for the year in which the termination occurs prorated daily based on the number of days from the beginning of the calendar year in which thetermination occurs to and including the date of termination.
The Company (or its successor) shall also provide continuing coverage and benefits comparable to all life, health and disability plans of the Company for aperiod of 30 months from the date of termination, and Employee shall receive two and one-half years additional service credit under the current non-qualifiedsupplemental pension plans, or successors thereto, of the Company applicable to the Employee on the date of termination. To the extent subject toSection 409A of the Internal Revenue Code, the amount of medical expenses eligible for reimbursement during any year may not affect the medical expenseseligible for reimbursement in any other year. Furthermore, the reimbursement of eligible medical expenses must be made on or before the last day of theEmployee's taxable year following the taxable year in which the expense is incurred and the right to reimbursement of any eligible medical expense is notsubject to liquidation or exchange for any other benefit.

For purposes of this Agreement, a "change of control" shall be deemed to have occurred if (i) there shall be consummated (A) any consolidation or mergerof the Company in which the Company is not the continuing or surviving corporation or pursuant to which shares of the Company's Common Stock would beconverted into cash, securities or other property, other than a merger of the Company where a majority of the Board of Directors of the surviving corporationare, and for a two year period after the merger continue to be, persons who were directors of the Company immediately prior to the merger or were elected asdirectors, or nominated for election as directors, by a vote of at least two-thirds of the directors then still in office who were directors of the Companyimmediately prior to the merger, or (B) any sale, lease, exchange or transfer (in one transaction or a series of related transactions) of all or substantially all ofthe assets of the Company, or (ii) the shareholders of the Company shall approve any plan or proposal for the liquidation or dissolution of the Company, or(iii) (A) any "person" (as such term is used in Sections 13(d) and 14(d)(2) of the Securities Exchange Act of 1934, as amended (the "Exchange Act"), otherthan the Company or a subsidiary thereof or any employee benefit plan sponsored by the Company or a subsidiary thereof, shall become the beneficial owner(within the meaning of Rule 13d-3 under the Exchange Act) of securities of the Company representing 20 percent or more of the combined voting power ofthe Company's then outstanding securities ordinarily (and apart from rights accruing in special circumstances) having the right to vote in the election ofdirectors, as a result of a tender or exchange offer, open market purchases, privately negotiated purchases or otherwise, and (B) at any time during a period ofone year thereafter, individuals who immediately prior to the beginning of such period constituted the Board of Directors of the Company shall cease for anyreason to constitute at least a majority thereof, unless the election or the nomination by the Board of Directors for election by the Company's shareholders ofeach new director during such period was approved by a vote of at least two-thirds of the directors then still in office who were directors at the beginning ofsuch period.
For purposes of any payment to which Employee becomes entitled on account of termination following a change of control, as provided in this Section 1,such termination shall be deemed to refer only to a termination of employment that constitutes a "Separation from Service". "Separation from Service" shallmean a reasonably anticipated permanent reduction in the level of bona fide services performed by the Employee for the Company and all Affiliates to 20% orless of the average level of bona fide services performed by the Employee for the Company and all Affiliates (whether as an employee or an independentcontractor) over the immediately preceding thirty-six (36) months (or the full period of service to the Company and all Affiliates if less than thirty-six (36)months). For purposes of this paragraph, the term "Affiliate" means each entity that would be considered a single employer with the Company under Section414(b) or Section 414(c) of the Internal Revenue Code, except that the phrase "at least 50%" shall be substituted for the phrase "at least 80%" as used therein.In addition, payment of any amounts under this Section 1 will be deferred to the extent necessary to cause such payment to comply with the six-monthdeferral rule described in Section 409A(a)(2)(B) of the Internal Revenue Code if Employee is at the time of termination a "specified employee" within themeaning of Section 409A.
For purposes of this Section 1, "good reason upon change of control" shall exist if any of the following occurs:
(i) without Employee's express written consent, the assignment to Employee of any duties inconsistent with the employment of Employee immediatelyprior to the change of control, or a significant diminution of Employee's positions, duties, responsibilities and status with the Company from thoseimmediately prior to a change of control or a diminution in Employee's titles or offices as in effect immediately prior to a change of control, or anyremoval of Employee from, or any failure to reelect Employee to, any of such positions;
(ii) a reduction by the Company in Employee's base salary in effect immediately prior to a change of control;2
(iii) the failure by the Company to continue in effect any thrift, stock ownership, pension, life insurance, health, dental and accident or disability plan inwhich Employee is participating or is eligible to participate at the time of the change of control (or plans providing Employee with substantially similarbenefits), except as otherwise required by the terms of such plans as in effect at the time of any change of control or the taking of any action by theCompany which would adversely affect Employee's participation in or materially reduce Employee's benefits under any of such plans or depriveEmployee of any material fringe benefits enjoyed by Employee at the time of the change of control or the failure by the Company to provide theEmployee with the number of paid vacation days to which Employee is entitled in accordance with the vacation policies of the Company in effect at thetime of a change of control;
(iv) the failure by the Company to continue in effect any incentive plan or arrangement (including without limitation, the Company's IncentiveCompensation Plan and similar incentive compensation benefits) in which Employee is participating at the time of a change of control (or to substituteand continue other plans or arrangements providing the Employee with substantially similar benefits), except as otherwise required by the terms of suchplans as in effect at the time of any change of control;
(v) the failure by the Company to continue in effect any plan or arrangement with respect to securities of the Company (including, without limitation,any plan or arrangement to receive and exercise stock options, stock appreciation rights, restricted stock or grants thereof or to acquire stock or othersecurities of the Company) in which Employee is participating at the time of a change of control (or to substitute and continue plans or arrangementsproviding the Employee with substantially similar benefits), except as otherwise required by the terms of such plans as in effect at the time of anychange of control or the taking of any action by the Company which would adversely affect Employee's participation in or materially reduceEmployee's benefits under any such plan;
(vi) the relocation of the Company's principal executive offices to a location outside the San Antonio, Texas, area, or the Company's requiringEmployee to be based anywhere other than at the location of the Company's principal executive offices, except for required travel on the Company'sbusiness to an extent substantially consistent with Employee's present business travel obligations, or, in the event Employee consents to any suchrelocation of the Company's principal executive or divisional offices, the failure by the Company to pay (or reimburse Employee for) all reasonablemoving expenses incurred by Employee relating to a change of Employee's principal residence in connection with such relocation and to indemnifyEmployee against any loss (defined as the difference between the actual sale price of such residence and the higher of (a) Employee's aggregateinvestment in such residence or (b) the fair market value thereof as determined by a real estate appraiser reasonably satisfactory to both Employee andthe Company at the time the Employee's principal residence is offered for sale in connection with any such change of residence;
(vii) any failure by the Company to obtain the assumption of this Agreement by any successor or assign of the Company;3

In the event of a change of control as "change of control" is defined in any stock option plan or stock option agreement pursuant to which the Employeeholds options to purchase common stock of the Company, Employee shall retain the rights to all accelerated vesting and other benefits under the termsthereof.
The Company shall pay any attorney fees incurred by Employee in reasonably seeking to enforce the terms of this Paragraph 1.
2. Complete Agreement.
This Agreement constitutes the entire agreement between the parties and cancels and supersedes all other agreements between the parties which may haverelated to the subject matter contained in this Agreement.
1. Modification: Amendment: Waiver.
No modification, amendment or waiver of any provisions of this Agreement shall be effective unless approved in writing by both parties. The failure at anytime to enforce any of the provisions of this Agreement shall in no way be construed as a waiver of such provisions and shall not affect the right of eitherparty thereafter to enforce each and every provision hereof in accordance with its terms.
3. Governing Law: Jurisdiction.
This Agreement and performance under it, and all proceedings that may ensue from its breach, shall be construed in accordance with and under the laws ofthe State of Texas.
4. Severability.
Whenever possible, each provision of this Agreement shall be interpreted in such manner as to be effective and valid under applicable law, but if anyprovision of this Agreement shall be held to be prohibited by or invalid under applicable law, such provision shall be ineffective only to the extent of suchprohibition or invalidity, without invalidating the remainder of such provision or the remaining provisions of this Agreement.
5. Assignment.
The rights and obligations of the parties under this Agreement shall be binding upon and inure to the benefit of their respective successors, assigns,executors, administrators and heirs, provided, however, that the Company may not assign any duties under this Agreement without the prior written consent ofthe Employee.
6. Limitation.
This Agreement shall not confer any right or impose any obligation on the Company to continue the employment of Employee in any capacity, or limit theright of the Company or Employee to terminate Employee's employment.
7. Notices.
All notices and other communications under this Agreement shall be in writing and shall be given in person or by telegraph, facsimile or first class mail,certified or registered with return receipt requested, and shall be deemed to have been duly given when delivered personally or three days after mailing or oneday after transmission of a telegram or facsimile, as the case may be, to the representative persons named below:
4

If to the Company:
Corporate SecretaryTesoro Corporation300 Concord Plaza DriveSan Antonio, Texas 78216-6999
If to the Employee: G. Scott Spendlove
IN WITNESS WHEREOF, the parties have executed this Agreement as of the day and year first above written. COMPANY: TESORO CORPORATION
By: /s/ Bruce A. Smith Bruce A. Smith
Chairman of the Board of Directors,President and Chief Executive Officer
EMPLOYEE: G. Scott Spendlove
/s/ G. Scott Spendlove
5

Exhibit 21.1
SUBSIDIARIES OF THE COMPANY
Tesoro Corporation is publicly held and has no parent. The subsidiaries listed below are wholly-owned. Small or inactive subsidiaries are omitted from thelist below. Such omitted subsidiaries, considered in the aggregate as a single subsidiary, would not constitute a "significant subsidiary" at the end of the yearended December 31, 2010.
Incorporated or OrganizedName of Subsidiary Under Laws ofTesoro Alaska Company DelawareTesoro Refining and Marketing Company DelawareTesoro Companies, Inc. DelawareTesoro Northstore Company DelawareTesoro Canada Supply & Distribution, Ltd. British ColumbiaTesoro Hawaii Corporation HawaiiTesoro Panama Company Sociedad Anonima Panama

Exhibit 23.1
CONSENT OF INDEPENDENT REGISTERED PUBLIC ACCOUNTING FIRM
We consent to the incorporation by reference in the Registration Statement Forms S-3 (Nos. 333-159655 and 333-156270) and in the related Prospectuses,Forms S-4 (Nos. 333-146230 and 333-135104) and in the related Prospectuses and Forms S-8 (Nos. 333-25379, 333-39070, 333-112427, 333-120716 and333-156268) of Tesoro Corporation of our reports dated March 1, 2011, with respect to the consolidated financial statements of Tesoro Corporation, and theeffectiveness of internal control over financial reporting of Tesoro Corporation, included in this Annual Report (Form 10-K) for the year ended December 31,2010.
/s/ ERNST & YOUNG LLP
San Antonio, Texas March 1, 2011
Exhibit 31.1
CERTIFICATIONPURSUANT TO
SECTION 302 OFTHE SARBANES-OXLEY ACT OF 2002
I, Gregory J. Goff, certify that:
1. I have reviewed this annual report on Form 10-K of Tesoro Corporation;
2. Based on my knowledge, this annual report does not contain any untrue statement of a material fact or omit to state a material fact necessaryto make the statements made, in light of the circumstances under which such statements were made, not misleading with respect to the periodcovered by this annual report;
3. Based on my knowledge, the financial statements, and other financial information included in this annual report, fairly present in allmaterial respects the financial condition, results of operations and cash flows of the registrant as of, and for, the periods presented in this annualreport;
4. The registrant's other certifying officers and I are responsible for establishing and maintaining disclosure controls and procedures (asdefined in Exchange Act Rules 13a-15(e) and 15d-15(e)) and internal control over financial reporting (as defined in Exchange Act Rules 13a-15(f)and 15(d)-15(f)) for the registrant and have:
a. Designed such disclosure controls and procedures, or caused such disclosure controls and procedures to be designed under oursupervision, to ensure that material information relating to the registrant, including its consolidated subsidiaries, is made known to us by otherswithin those entities, particularly during the period in which this annual report is being prepared;
b. Designed such internal control over financial reporting, or caused such internal control over financial reporting to be designed underour supervision, to provide reasonable assurance regarding the reliability of financial reporting and the preparation of financial statements forexternal purposes in accordance with generally accepted accounting principles;
c. Evaluated the effectiveness of the registrant's disclosure controls and procedures and presented in this annual report our conclusionsabout the effectiveness of the disclosure controls and procedures, as of the end of the period covered by this annual report based on suchevaluation; and
d. Disclosed in this annual report any change in the registrant's internal control over financial reporting that occurred during theregistrant's most recent fiscal quarter (the registrant's fourth fiscal quarter in the case of an annual report) that has materially affected, or isreasonably likely to materially affect, the registrant's internal control over financial reporting; and
5. The registrant's other certifying officers and I have disclosed, based on our most recent evaluation of internal control over financialreporting, to the registrant's auditors and the audit committee of the registrant's board of directors (or persons performing the equivalent functions):
a. All significant deficiencies and material weaknesses in the design or operation of internal control over financial reporting which arereasonably likely to adversely affect the registrant's ability to record, process, summarize and report financial information; and
b. Any fraud, whether or not material, that involves management or other employees who have a significant role in the registrant'sinternal control over financial reporting.
/s/ GREGORY J. GOFFGregory J. Goff
Chief Executive Officer
Date: March 1, 2011

Exhibit 31.2
CERTIFICATIONPURSUANT TO
SECTION 302 OFTHE SARBANES-OXLEY ACT OF 2002
I, G. Scott Spendlove, certify that:
1. I have reviewed this annual report on Form 10-K of Tesoro Corporation;
2. Based on my knowledge, this annual report does not contain any untrue statement of a material fact or omit to state a material fact necessaryto make the statements made, in light of the circumstances under which such statements were made, not misleading with respect to the periodcovered by this annual report;
3. Based on my knowledge, the financial statements, and other financial information included in this annual report, fairly present in allmaterial respects the financial condition, results of operations and cash flows of the registrant as of, and for, the periods presented in this annualreport;
4. The registrant's other certifying officers and I are responsible for establishing and maintaining disclosure controls and procedures (asdefined in Exchange Act Rules 13a-15(e) and 15d-15(e)) and internal control over financial reporting (as defined in Exchange Act Rules 13a-15(f)and 15(d)-15(f)) for the registrant and have:
a. Designed such disclosure controls and procedures, or caused such disclosure controls and procedures to be designed under oursupervision, to ensure that material information relating to the registrant, including its consolidated subsidiaries, is made known to us by otherswithin those entities, particularly during the period in which this annual report is being prepared;
b. Designed such internal control over financial reporting, or caused such internal control over financial reporting to be designed underour supervision, to provide reasonable assurance regarding the reliability of financial reporting and the preparation of financial statements forexternal purposes in accordance with generally accepted accounting principles;
c. Evaluated the effectiveness of the registrant's disclosure controls and procedures and presented in this annual report our conclusionsabout the effectiveness of the disclosure controls and procedures, as of the end of the period covered by this annual report based on suchevaluation; and
d. Disclosed in this annual report any change in the registrant's internal control over financial reporting that occurred during theregistrant's most recent fiscal quarter (the registrant's fourth fiscal quarter in the case of an annual report) that has materially affected, or isreasonably likely to materially affect, the registrant's internal control over financial reporting; and
5. The registrant's other certifying officers and I have disclosed, based on our most recent evaluation of internal control over financialreporting, to the registrant's auditors and the audit committee of the registrant's board of directors (or persons performing the equivalent functions):
a. All significant deficiencies and material weaknesses in the design or operation of internal control over financial reporting which arereasonably likely to adversely affect the registrant's ability to record, process, summarize and report financial information; and
b. Any fraud, whether or not material, that involves management or other employees who have a significant role in the registrant'sinternal control over financial reporting.
/s/ G. SCOTT SPENDLOVEG. Scott Spendlove
Chief Financial Officer
Date: March 1, 2011

Exhibit 32.1
CERTIFICATIONPURSUANT TO
18 U.S.C. SECTION 1350,AS ADOPTED PURSUANT TO
SECTION 906 OF THE SARBANES-OXLEY ACT OF 2002
In connection with the Annual Report of Tesoro Corporation (the "Company") on Form 10-K for the year ended December 31, 2010 as filedwith the Securities and Exchange Commission on the date hereof (the "Report"), I, Gregory J. Goff, Chief Executive Officer of the Company,certify, pursuant to 18 U.S.C. Section 1350, as adopted pursuant to Section 906 of the Sarbanes-Oxley Act of 2002, that:
(1) The Report fully complies with the requirements of section 13(a) or 15(d) of the Securities Exchange Act of 1934; and
(2) The information contained in the Report fairly presents, in all material respects, the financial condition and results of operations ofthe Company.
/s/ GREGORY J. GOFFGregory J. Goff
Chief Executive Officer
Date: March 1, 2011
A signed original of this written statement required by Section 906 has been provided to the Company and will be retained by the Companyand furnished to the Securities and Exchange Commission or its staff upon request.
Exhibit 32.2
CERTIFICATIONPURSUANT TO
18 U.S.C. SECTION 1350,AS ADOPTED PURSUANT TO
SECTION 906 OF THE SARBANES-OXLEY ACT OF 2002
In connection with the Annual Report of Tesoro Corporation (the "Company") on Form 10-K for the year ended December 31, 2010 as filedwith the Securities and Exchange Commission on the date hereof (the "Report"), I, G. Scott Spendlove, Chief Financial Officer of the Company,certify, pursuant to 18 U.S.C. Section 1350, as adopted pursuant to Section 906 of the Sarbanes-Oxley Act of 2002, that:
(1) The Report fully complies with the requirements of section 13(a) or 15(d) of the Securities Exchange Act of 1934; and
(2) The information contained in the Report fairly presents, in all material respects, the financial condition and results of operations ofthe Company.
/s/ G. SCOTT SPENDLOVEG. Scott Spendlove
Chief Financial Officer
Date: March 1, 2011
A signed original of this written statement required by Section 906 has been provided to the Company and will be retained by the Companyand furnished to the Securities and Exchange Commission or its staff upon request.