10-k filed period 12/31/2011 filed on 02/09/2012 annual … · dupont e i de nemours & co (dd)...
TRANSCRIPT
DUPONT E I DE NEMOURS & CO (DD)
10-K Annual report pursuant to section 13 and 15(d)
Filed on 02/09/2012Filed Period 12/31/2011
Table of Contents
2011
UNITED STATESSECURITIES AND EXCHANGE COMMISSION
WASHINGTON, D.C. 20549
FORM 10-K
(Mark One)
ý ANNUAL REPORT PURSUANT TO SECTION 13 or 15(d) OF THE SECURITIES EXCHANGE ACT OF 1934
For the fiscal year ended December 31, 2011
OR
o TRANSITION REPORT PURSUANT TO SECTION 13 or 15(d) OF THE SECURITIES EXCHANGE ACT OF 1934____________________________________________________________________________
Commission file number 1-815
E. I. DU PONT DE NEMOURS AND COMPANY(Exact name of registrant as specified in its charter)
DELAWARE(State or Other Jurisdiction of Incorporation or Organization)
51-0014090(I.R.S. Employer Identification No.)
1007 Market StreetWilmington, Delaware 19898
(Address of principal executive offices)Registrant's telephone number, including area code: 302-774-1000
Securities registered pursuant to Section 12(b) of the Act(Each class is registered on the New York Stock Exchange, Inc.):
Title of Each Class__________________________________________________
Common Stock ($.30 par value)Preferred Stock
(without par value-cumulative)$4.50 Series$3.50 Series
No securities are registered pursuant to Section 12(g) of the Act._____________________________________________________
Indicate by check mark whether the registrant is a well-known seasoned issuer (as defined in Rule 405 of the SecuritiesAct). Yes ý No o Indicate by check mark whether the registrant is not required to file reports pursuant to Section 13 or Section 15(d) of theAct. Yes o No ý Indicate by check mark whether the registrant (1) has filed all reports required to be filed by Section 13 or 15(d) of the Securities Exchange Actof 1934 during the preceding 12 months (or for such shorter period that the registrant was required to file such reports), and (2) has been subject tosuch filing requirements for the past 90 days. Yes ý No o Indicate by check mark whether the registrant has submitted electronically and posted on its corporate Web site, if any, every Interactive DataFile required to be submitted and posted pursuant to Rule 405 of Regulation S-T (§232.405 of this chapter) during the preceding 12 months (or forsuch shorter period that the registrant was required to submit and post such files). Yes ý No o Indicate by check mark if disclosure of delinquent filers pursuant to Item 405 of Regulation S-K is not contained herein, and will not becontained, to the best of registrant's knowledge, in definitive proxy or information statements incorporated by reference in Part III of this Form 10-K or any amendment to this Form 10-K. o Indicate by check mark whether the registrant is a large accelerated filer, an accelerated filer, or a non-accelerated filer. See definition of"accelerated filer and large accelerated filer" in Rule 12b-2 of the Exchange Act.
Large accelerated filer ý Accelerated filer o Non-accelerated filer o Smaller reporting company o
Indicate by check mark whether the registrant is a shell company (as defined in Rule 12b-2 of the Act). Yes o No ý The aggregate market value of voting stock held by nonaffiliates of the registrant (excludes outstanding shares beneficially owned by directorsand officers and treasury shares) as of June 30, 2011, was approximately $50.3 billion. As of January 31, 2012, 932,253,000 shares (excludes 87,041,000 shares of treasury stock) of the company's common stock, $0.30 par value, wereoutstanding.
Documents Incorporated by Reference(Specific pages incorporated are indicated under the applicable Item herein):
IncorporatedBy ReferenceIn Part No.
The company's Proxy Statement in connection with the Annual Meeting of Stockholders to be held on April 25, 2012 III

Table of Contents
E. I. du Pont de Nemours and Company
Form 10-K
Table of Contents
The terms "DuPont" or the "company" as used herein refer to E. I. du Pont de Nemours and Company and its consolidated subsidiaries, or to E. I. du Pont deNemours and Company, as the context may indicate.
Page
PART I Item 1. Business 2 Item 1A. Risk Factors 8 Item 1B. Unresolved Staff Comments 11 Item 2. Properties 11 Item 3. Legal Proceedings 12 Item 4. Mine Safety Disclosures 12
PART II Item 5. Market for Registrant's Common Equity, Related Stockholder Matters and Issuer Purchases of Equity
Securities13
Item 6. Selected Financial Data 15 Item 7. Management's Discussion and Analysis of Financial Condition and Results of Operations 16 Item 7A. Quantitative and Qualitative Disclosures About Market Risk 35 Item 8. Financial Statements and Supplementary Data 36 Item 9. Changes In and Disagreements With Accountants on Accounting and Financial Disclosure 37 Item 9A. Controls and Procedures 37 Item 9B. Other Information 37
PART III Item 10. Directors, Executive Officers and Corporate Governance 38 Item 11. Executive Compensation 39 Item 12. Security Ownership of Certain Beneficial Owners and Management and Related Stockholder Matters 40 Item 13. Certain Relationships and Related Transactions, and Director Independence 40 Item 14. Principal Accountant Fees and Services 40
PART IV Item 15. Exhibits and Financial Statement Schedules 41
SIGNATURES 44
Note on Incorporation by Reference
Information pertaining to certain Items in Part III of this report is incorporated by reference to portions of the company's definitive 2012 Annual MeetingProxy Statement to be filed within 120 days after the end of the year covered by this Annual Report on Form 10-K, pursuant to Regulation 14A (the Proxy).
1
Table of Contents
Part I
ITEM 1. BUSINESS
DuPont was founded in 1802 and was incorporated in Delaware in 1915. DuPont brings world-class science and engineering to the global marketplace in theform of innovative products, materials and services. The company believes that by collaborating with customers, governments, non-governmentalorganizations and thought leaders it can help find solutions to such global challenges as providing enough healthy food for people everywhere, decreasingdependence on fossil fuels, and protecting life and the environment. Total worldwide employment at December 31, 2011 , was approximately 70,000 people.The company has operations in more than 90 countries worldwide and about 65 percent of consolidated net sales are made to customers outside the UnitedStates of America (U.S.).
Subsidiaries and affiliates of DuPont conduct manufacturing, seed production or selling activities and some are distributors of products manufactured by thecompany. As a science and technology based company, DuPont competes on a variety of factors such as product quality and performance or specifications,continuity of supply, price, customer service and breadth of product line, depending on the characteristics of the particular market involved and the product orservice provided. Most products are marketed primarily through DuPont's sales force, although in some regions, more emphasis is placed on sales throughdistributors. The company utilizes numerous suppliers as well as internal sources to supply a wide range of raw materials, energy, supplies, services andequipment. To ensure availability, the company maintains multiple sources for fuels and many raw materials, including hydrocarbon feedstocks. Largevolume purchases are generally procured under competitively priced supply contracts.
In 2011, DuPont acquired Danisco A/S (Danisco), a global enzyme and specialty food ingredients company. This acquisition was valued at $6.4 billion, plusnet debt assumed of $0.6 billion.
Business SegmentsThe company consists of 14 businesses which are aggregated into nine reportable segments based on similar economic characteristics, the nature of theproducts and production processes, end-use markets, channels of distribution and regulatory environment. The company's reportable segments are Agriculture,Electronics & Communications, Industrial Biosciences, Nutrition & Health, Performance Chemicals, Performance Coatings, Performance Materials, Safety &Protection and Pharmaceuticals. The company includes certain embryonic businesses not included in the reportable segments, such as pre-commercialprograms, and nonaligned businesses in Other.
AgricultureAgriculture businesses, Pioneer Hi-Bred International, Inc. (Pioneer) and DuPont Crop Protection, leverage the company's technology, customer relationshipsand industry knowledge to improve the quantity, quality and safety of the global food supply and the global production agriculture industry. Land availablefor worldwide agricultural production is increasingly limited so production growth will need to be achieved principally through improving crop yields andproductivity rather than through increases in planted area. The segment's businesses deliver a broad portfolio of products and services that are specificallytargeted to achieve gains in crop yields and productivity, including Pioneer® brand seed products and well-established brands of insecticides, fungicides andherbicides. Research and development focuses on leveraging technology to increase grower productivity and enhance the value of grains and soy throughimproved seed traits, superior seed germplasm and effective use of insecticides, herbicides and fungicides. Agriculture accounted for approximately 50percent of the company's total research and development expense in 2011.
Sales of the company's products in the segment are affected by seasonal cropping and weather patterns. Sales and earnings performance in the Agriculturesegment are strongest in the first half of the year reflecting the northern hemisphere planting season. The segment generally operates at a loss during the thirdand fourth quarters of the year. As a result of the seasonal nature of its business, Agriculture's inventory is at its highest level at the end of the calendar yearand is sold down in the first and second quarters. Trade receivables in the Agriculture segment are at a low point at year-end and increase through the sellingseason to peak at the end of the second quarter.
Pioneer is a world leader in developing, producing and marketing corn hybrid and soybean varieties which improve the productivity and profitability of itscustomers. Additionally, Pioneer sells canola, sunflower, sorghum, inoculants, wheat and rice. As the world's population grows and the middle class expands,the need for crops for animal feed, food, biofuels and industrial uses continues to increase. The business competes with other seed and plant biotechnologycompanies. Pioneer seed sales amounted to 16 percent, 17 percent and 18 percent of the company's total consolidated net sales for the years endedDecember 31, 2011, 2010 and 2009, respectively.
2
Table of Contents
Part I
ITEM 1. BUSINESS, continued
Pioneer's research and development focuses on integrating high yielding germplasm with value added proprietary and/or licensed native and biotechnologytraits with local environment and service expertise. Pioneer uniquely develops integrated products for specific regional application based on local productadvancement and testing of the product concepts. Research and development in this arena requires long-term commitment of resources, extensive regulatoryefforts and collaborations, partnerships and business arrangements to successfully bring products to market. Pioneer licenses biotechnology traits from thirdparties as a normal course of business. To protect its investment, the business employs the use of patents covering germplasm and native and biotechnologytraits in accordance with country laws.
Pioneer is actively pursuing the development of innovations for corn hybrid, soybean varieties, canola, sunflower, wheat and rice based on marketassessments of the most valuable opportunities. In corn hybrids, programs include innovations for drought and nitrogen efficiency, insect protection andherbicide tolerance. In soybean varieties, programs include products with high oleic content, multiple herbicide tolerance and insect protection.
Pioneer has seed production facilities located throughout the world. Seed production is performed directly by the business or contracted with independentgrowers and conditioners. Pioneer's ability to produce seeds primarily depends upon weather conditions and availability of reliable contract growers.
Pioneer markets and sells seed product primarily under the Pioneer ® brand but also sells and distributes products utilizing additional brand names. Pioneerpromotes its products through multiple marketing channels around the world. In the corn and soybean markets of the U.S. Corn Belt, Pioneer® brand productsare sold through a specialized force of independent sales representatives. Outside of North America Pioneer's products are marketed through a network ofsubsidiaries, joint ventures and independent producer-distributors.
DuPont Crop Protection serves the global production agriculture industry with crop protection products for field crops such as wheat, corn, soybean and rice;specialty crops such as fruit, nut, vine and vegetables; and non-crop segments, including forestry and land management. Principal crop protection products areweed control, disease control and insect control products. Crop Protection products are marketed and sold to growers and other end users through a network ofwholesale distributors and crop input retailers. The sales growth of the business' insect control portfolio is led by DuPontTM Rynaxypyr® insecticide, a productregistered for sale in over 80 countries and sold under four key brands for use across a broad range of core agricultural crops.
The major commodities, raw materials and supplies for the Agriculture segment include: corn and soybean seeds, benzene and carbamic acid relatedintermediates, copper, insect control products, natural gas, soybeans and sulfonamides.
Agriculture segment sales outside the U.S. accounted for 54 percent of the segment's total sales in 2011.
Electronics & CommunicationsElectronics & Communications (E&C) is a leading supplier of differentiated materials and systems for photovoltaics, consumer electronics, displays andadvanced printing that enable superior performance and lower total cost of ownership for customers. The segment leverages DuPont's strong materials andtechnology base to target attractive growth opportunities in photovoltaic materials, circuit and semiconductor fabrication and packaging materials, displaymaterials, packaging graphics, and ink-jet printing. In the growing photovoltaics market, E&C continues to be a leading supplier of metalization pastes andbacksheet materials for use in solar cells and modules. In 2011, the segment completed the acquisition of Innovalight, Inc., a company specializing inadvanced silicon inks and process technologies that increase the efficiency of crystalline silicon solar cells. The acquisition further strengthens the segment'sposition as a leader in materials for the solar energy market, enabling a broader and more integrated photovoltaic materials and technology offering from thebusiness. The segment completed a $295 million expansion to support the DuPont TM Tedlar® polyvinyl fluoride films business. This included a $120 millioninvestment in capacity expansion to produce the raw materials that make the film, which was completed in 2010, and a multi-phase $175 million investmentof high-performance Tedlar ® PV2001 series oriented film production completed in 2011. Tedlar® films serve as the critical component of photovoltaicmodule backsheets, providing long-term durability and performance in all weather conditions.
In the displays market, E&C continues to be a leading materials supplier for plasma displays. In 2011, the segment signed a technology licensing agreementwith a leading Asian manufacturer of active matrix organic light emitting diode (AMOLED) display products that will enable solution-process technologydeveloped by the manufacturer to be used in the segment's production of large AMOLED television displays.
3
Table of Contents
Part I
ITEM 1. BUSINESS, continued
The segment is expanding its broad portfolio of materials for semiconductor fabrication and packaging, as well as innovative materials for circuit applications,to address critical needs of electronic component and device manufacturers. In packaging graphics, E&C is a leading supplier of flexographic printingsystems, including Cyrel® photopolymer plates. The segment is investing in new products such as Cyrel® FAST Round to strengthen its market leadershipposition in advanced printing markets. The segment is also expanding its leadership position in black-pigmented inks and developing new color-pigmentedinks for network printing applications.
The major commodities, raw materials and supplies for E&C include: block co-polymers, copper, hydroxylamine, oxydianiline, polyester film, preciousmetals, difluoroethane and pyromellitic dianhydride.
E&C segment sales outside the U.S. accounted for 86 percent of the segment's total sales in 2011.
Industrial BiosciencesIndustrial Biosciences is comprised of Danisco's enzyme business acquired in 2011, as well as the DuPontTM Sorona ® renewably sourced polymer andBioPDOTM 1,3 propanediol businesses, previously reported in Other. Industrial Biosciences leverages DuPont's unique combination of biotechnology,chemical, materials science and process engineering capabilities to deliver customer-driven, superior-performing, sustainable solutions. Industrial Biosciencesis a leader in developing and manufacturing a wide range of enzymes, which are biocatalysts that enable chemical reactions, on a large scale. The segment'senzymes add value and functionality to a broad range of products and processes such as animal nutrition, detergents, food manufacturing, ethanol productionand industrial applications resulting in cost and process benefits, better product performance and improved environmental outcomes.
The segment includes a joint venture with Tate & Lyle PLC, DuPont Tate and Lyle Bio Products LLC, to produce BioPDOTM using a proprietaryfermentation and purification process. BioPDOTM is the key building block for DuPontTM Sorona®, which is used primarily in carpet and apparel fibers.
The major commodities, raw materials and supplies for the Industrial Biosciences segment include: grain products, such as dextrose and glucose,glucoamylase, purified terephthalic acid and glycols.
Industrial Biosciences segment sales outside the U.S. accounted for 53 percent of the segment's total sales in 2011.
Nutrition & HealthNutrition & Health is comprised of Danisco's world leading specialty food ingredients business and Solae, a majority-owned venture with Bunge Limited,which is a world leader in developing soy based technologies. The segment is the premier provider of innovative solutions for specialty food ingredients,health and safety. The segment's products, which include cultures, emulsifiers, gums, natural sweeteners and soy-based food ingredients, hold leading marketpositions based on industry leading innovation, relevant product portfolio and close-partnering with the world's food manufacturers. Nutrition & Health servesvarious end markets within the food industry including meat, dairy, beverages and bakery segments. Nutrition & Health has research, production anddistribution operations around the world. Nutrition & Health products are marketed and sold under a variety of brand names and are distributed primarily through its direct route to market. The directroute to market focuses on strong customer collaborations and insights with multinational customers and regional customers alike. The major commodities, raw materials and supplies for the Nutrition & Health segment include: soybean, oils and fats, grain products, locust bean gum,glycerin, seaweed, acetyls, sugar, yeast and citrus peels.
Nutrition & Health segment sales outside the U.S. accounted for 69 percent of the segment's total sales in 2011.
Performance ChemicalsPerformance Chemicals businesses, DuPont Titanium Technologies and DuPont Chemicals and Fluoroproducts, deliver customized solutions with a widerange of industrial and specialty chemical products for markets including plastics and coatings, textiles, mining, pulp and paper, water treatment andhealthcare.
DuPont Titanium Technologies is the world's largest manufacturer of titanium dioxide, and is dedicated to creating greater value for the coatings, paper,plastics, specialties and minerals markets through service, brand and product. The business' main products include its broad line of DuPontTM Ti-Pure®
titanium dioxide products. In 2011, the business announced a global expansion to
4
Table of Contents
Part I
ITEM 1. BUSINESS, continued
support increased customer demand for titanium dioxide, including a $500 million investment in new production facilities at the company's Altamira, Mexicosite scheduled for completion in 2014. In addition, the business is investing in facility upgrades to improve productivity at its other global manufacturing sitesover the next three years.
DuPont Chemicals and Fluoroproducts is a leading global manufacturer of industrial and specialty fluorochemicals, fluoropolymers and performancechemicals. The business' broad line of products that include refrigerants, lubricants, propellants, solvents, fire extinguishants and electronic gases, cover awide range of industries and markets. Key brands include DuPont™ Teflon®, Capstone® , Dymel®, OpteonTM yf, Isceon®, Suva® , Vertrel®, Zyron® , Vazo®
and Virkon® .
The major commodities, raw materials and supplies for the Performance Chemicals segment include: ammonia, benzene, chlorine, chloroform, fluorspar,hydrofluoric acid, industrial gases, methanol, natural gas, perchloroethylene, sulfur, petroleum coke and titanium ore.
Performance Chemicals segment sales outside the U.S. accounted for 60 percent of the segment's total sales in 2011.
Performance CoatingsPerformance Coatings is one of the world's leading motor vehicle coatings suppliers. Products offered include high performance liquid and powder coatingsfor motor vehicle original equipment manufacturers (OEMs), the motor vehicle after-market, and general industrial applications, such as coatings for heavyequipment, pipes and appliances and electrical insulation. After-market coatings products are marketed using the DuPontTM Standox ® , Spies Hecker®,Cromax Pro ® and Nason® brand names. Standox ® , Spies Hecker® and Cromax Pro ® are focused on the high-end motor vehicle after-markets, whileNason® is primarily focused on economy coating applications. The segment has several large customers, primarily in the motor vehicle OEM industry supplychain. The company has long-standing relationships with these customers and they are considered to be important to the segments' operating results.
The major commodities, raw materials and supplies for the Performance Coatings segment include: isocyanates, pigments, resins and solvents.
Performance Coatings segment sales outside the U.S. accounted for 75 percent of the segment's total sales in 2011.
Performance MaterialsPerformance Materials businesses, Performance Polymers and Packaging & Industrial Polymers, provide productive, higher performance polymers,elastomers, films, parts, and systems and solutions which improve the uniqueness, functionality and profitability of its customers' offerings. The key marketsserved by the segment include the automotive OEM and associated after-market industries, as well as electrical, packaging, construction, oil, electronics,photovoltaics, aerospace, chemical processing and consumer durable goods. The segment has several large customers, primarily in the motor vehicle OEMindustry supply chain. The company has long-standing relationships with these customers and they are considered to be important to the segments' operatingresults.
Performance Polymers delivers a broad range of polymer-based high performance materials in its product portfolio, including elastomers and thermoplasticand thermoset engineering polymers which are used by customers to fabricate components for mechanical, chemical and electrical systems. The mainproducts include: DuPont TM Zytel® nylon resins, Delrin ® acetal resins, Hytrel® polyester thermoplastic elastomer resins, Tynex ® filaments, Vespel® partsand shapes, Vamac ® ethylene acrylic elastomer, Kalrez® perfluoroelastomer and Viton ® fluoroelastomers. Performance Polymers also includes the DuPontTeijin Films joint venture, whose primary products are Mylar® and Melinex ® polyester films.
Packaging & Industrial Polymers specializes in resins and films used in packaging and industrial polymer applications, sealants and adhesives, sporting goods,and interlayers for laminated safety glass. Key brands include: DuPontTM Surlyn® ionomer resins, Bynel® coextrudable adhesive resins, Elvax® EVA resins,SentryGlas®, Butacite® laminate interlayers and Elvaloy® copolymer resins.
The major commodities, raw materials and supplies for the Performance Materials segment include: acrylic monomers, adipic acid, butadiene, butanediol,dimethyl terephthalate, ethane, fiberglass, hexamethylenediamine, methanol, natural gas and purified terephthalic acid.
Performance Materials segment sales outside the U.S. accounted for 68 percent of the segment's total sales in 2011.
5
Table of Contents
Part I
ITEM 1. BUSINESS, continued
Safety & ProtectionSafety & Protection businesses, Protection Technologies, Sustainable Solutions and Building Innovations, satisfy the growing global needs of businesses,governments and consumers for solutions that make life safer, healthier and more secure. By uniting market-driven science with the strength of highlyregarded brands, the segment delivers products and services to a large number of markets, including construction, transportation, communications, industrialchemicals, oil and gas, electric utilities, automotive, manufacturing, defense, homeland security and safety consulting.
Protection Technologies is focused on finding solutions to protect people and the environment. With products like DuPont™ Kevlar® high strength material,Nomex® thermal resistant material and Tyvek® protective material, the business continues to hold strong positions in life protection markets and meet thecontinued demand for body armor and personal protective gear for the military, law enforcement personnel, firefighters and other first responders, as well asfor workers in the oil and gas industry around the world. In 2011, the business announced the start up of its $500 million Cooper River Kevlar® facility nearCharleston, South Carolina. The Cooper River Kevlar® plant uses state-of-the-art technology that will allow the business to meet increased customer demandfor advanced protective materials in emerging industries around the world by expanding its portfolio of science-based innovations and boosting productivity.Commercial supply began at the end of 2011.
Sustainable Solutions continues to help organizations worldwide reduce workplace injuries and fatalities while improving operating costs, productivity andquality. Sustainable Solutions is a leader in the safety consulting field, selling training products, as well as consulting services. Additionally, SustainableSolutions is dedicated to clean air, clean fuel and clean water with offerings that help reduce sulfur and other emissions, formulate cleaner fuels, or dispose ofliquid waste. Its goal is to help maintain business continuity and environmental compliance for companies in the refining and petrochemical industries, as wellas for government entities. In 2010, the business completed the acquisition of MECS, Inc. (MECS), which is a leading global provider of process technology,proprietary specialty equipment and technical services to the sulfuric acid industry.
Building Innovations is committed to the building science behind increasing the performance of building systems, helping reduce operating costs and creatingmore sustainable structures. The business is a market leader of solid surfaces through its DuPont™ Corian® and Montelli® lines of products which offerdurable and versatile materials for residential and commercial purposes. Other products such as DuPont™ Tyvek® and Typar® offer leading solutions for theprotection and energy efficiency of buildings.
The major commodities, raw materials and supplies for the Safety & Protection segment include: alumina hydroxide, benzene, high density polyethylene,isophthaloyl chloride, metaphenylenediamine, methyl methacrylate, paraphenylenediamine, polyester fiber, terephthaloyl chloride and wood pulp.
Safety & Protection segment sales outside the U.S. accounted for 63 percent of the segment's total sales in 2011.
PharmaceuticalsOn October 1, 2001, DuPont Pharmaceuticals was sold to the Bristol-Myers Squibb Company. DuPont retained its interest in Cozaar ® (losartan potassium)and Hyzaar® (losartan potassium with hydrochlorothiazide), which are used in the treatment of hypertension. DuPont has exclusively licensed worldwidemarketing and manufacturing rights for Cozaar ® and Hyzaar® to Merck & Co., Inc. (Merck).
Pharmaceuticals' Cozaar® /Hyzaar® income is the sum of two parts: income related to a share of the profits from North American sales and certain markets inEurope, and royalty income derived from worldwide contract net sales linked to the exclusivity term in a particular country. Patents and exclusivity started toexpire in prior years and the U.S. exclusivity for Cozaar® ended in April 2010. The worldwide agreement terminates when the following conditions are met:(i) the Canadian exclusivity ends (which occurred in January 2012), and (ii) North American sales fall below a certain level, which could occur by year end2012. The company experienced its first significant step-down in income from Cozaar®/Hyzaar® in 2010 and expects a continued step-down to zero when thecontract ends. In general, management expects a traditional earnings and cash decline for a drug going off patent in the pharmaceutical industry to continueuntil the contract ends.
BacklogIn general, the company does not manufacture its products against a backlog of orders and does not consider backlog to be a significant indicator of the levelof future sales activity. Production and inventory levels are based on the level of incoming orders as well as projections of future demand. Therefore, thecompany believes that backlog information is not material to understanding its overall business and should not be considered a reliable indicator of thecompany's ability to achieve any particular level of revenue or financial performance.
6
Table of Contents
Part I
ITEM 1. BUSINESS, continued
Intellectual PropertyDuPont believes that its intellectual property estate provides it with an important competitive advantage. It has an established global network of attorneys, aswell as branding, advertising and licensing professionals, to procure, maintain, protect, enhance and gain value from this estate.
The company has a large portfolio of and is licensed under various patents. These definite-lived patents cover many products, processes and product uses.These patents protect many aspects of the company's significant research programs and the goods and services it sells. The actual protection afforded by thesepatents varies from country to country and depends upon the scope of coverage of each individual patent as well as the availability of legal remedies in eachcountry. DuPont owns about 19,000 worldwide patents and is awaiting action on about 18,000 worldwide patent applications. In 2011, the company wasgranted 910 U.S. patents, the highest number for a single year in the company's history, and about 2,100 international patents. DuPont's rights under its patentsand licenses, as well as the products made and sold under them, are important to the company as a whole, and to varying degrees, important to each reportablesegment.
Trade secrets are an important element of the company's intellectual property. Many of the processes used to make DuPont products are kept as trade secretswhich, from time to time, may be licensed to third parties. DuPont vigilantly protects all of its intellectual property including its trade secrets. When thecompany discovers that its trade secrets have been unlawfully taken, it reports the matter to governmental authorities for investigation and potential criminalaction, as appropriate. In addition, the company takes measures to mitigate any potential impact, which may include civil actions seeking redress, restitutionand/or damages based on loss to the company and/or unjust enrichment.
Ownership of and access to intellectual property rights, pa rticularly those relating to biotechnology and germplasm, will continue to be important to Pioneerand its competitors. The environment in which Pioneer competes is characterized by the use among competitors of intellectual property rights, includingpatent lawsuits, to gain advantage in commercial markets. In support of its business, Pioneer continues to build a large collection of intellectual property rightsrelated to biotechnology and germplasm and to license technology from others, including competitors. Pioneer endeavors to obtain such licenses oncommercially reasonable terms.
The company has about 2,450 unique trademarks for its products and services and approximately 22,500 registrations for these trademarks worldwide.Ownership rights in trademarks do not expire if the trademarks are continued in use and properly protected. The company has many trademarks that havesignificant recognition at the consumer retail level and/or business to business level.
Research and DevelopmentThe company conducts research at either dedicated research facilities or manufacturing plants. There are twelve major research locations in the U.S. &Canada, with the highest concentration of facilities being located in the Wilmington, Delaware area. Reflecting the company's global interests, five majorresearch locations are located in both the Asia Pacific and Europe, Middle East and Africa (EMEA) regions. One major location is also located in LatinAmerica.
The objectives of the company's research and development programs are to create new technologies, processes and business opportunities in relevant fields, aswell as to improve existing products and processes. Each segment of the company funds research and development activities that support its business mission.The company is expanding its offerings addressing safety, environment, energy and climate challenges in the global marketplace by developing andcommercializing renewable, bio-based materials; advanced biofuels; energy-efficient technologies; enhanced safety and protection products; and alternativeenergy products and technologies. The goals are tied directly to business growth, including increasing food production, increasing renewable sources forenergy and raw materials, and providing greater safety and protection for people and the environment. All research and development activities areadministered by senior research and development management to ensure consistency with the business and corporate strategy. The future of the company isnot dependent upon the outcome of any single research program.
Additional information with respect to research and development, including the amount incurred during each of the last three fiscal years, is included inItem 7, Management's Discussion and Analysis of Financial Condition and Results of Operations, on page 19 of this report.
7
Table of Contents
Part I
ITEM 1. BUSINESS, continued
Environmental MattersInformation related to environmental matters is included in several areas of this report: (1) Environmental Proceedings beginning on page 12,(2) Management's Discussion and Analysis of Financial Condition and Results of Operations beginning on pages 29, 33-34 and (3) Notes 1 and 15 to theConsolidated Financial Statements.
Available InformationThe company is subject to the reporting requirements under the Securities Exchange Act of 1934. Consequently, the company is required to file reports andinformation with the Securities and Exchange Commission (SEC), including reports on the following forms: annual report on Form 10-K, quarterly reports onForm 10-Q, current reports on Form 8-K, and amendments to those reports filed or furnished pursuant to Section 13(a) or 15(d) of the Securities ExchangeAct of 1934.
The public may read and copy any materials the company files with the SEC at the SEC's Public Reference Room at 100 F Street, NE, Washington, DC20549. The public may obtain information on the operation of the Public Reference Room by calling the SEC at 1-800-SEC-0330. The SEC also maintains anInternet site at http://www.sec.gov that contains reports, proxy and information statements, and other information regarding issuers that file electronically withthe SEC.
The company's annual report on Form 10-K, quarterly reports on Form 10-Q, current reports on Form 8-K and amendments to those reports are alsoaccessible on the company's website at http://www.dupont.com by clicking on the tab labeled "Investor Center", then on "Key Financials & Filings" and thenon "SEC Filings." These reports are made available, without charge, as soon as is reasonably practicable after the company files or furnishes themelectronically with the SEC.
Executive Officers of the RegistrantInformation related to the company's Executive Officers is included in Item 10, Directors, Executive Officers and Corporate Governance, beginning onpage 38 of this report.
ITEM 1A. RISK FACTORS
The company's operations could be affected by various risks, many of which are beyond its control. Based on current information, the company believes thatthe following identifies the most significant risk factors that could affect its businesses. Past financial performance may not be a reliable indicator of futureperformance and historical trends should not be used to anticipate results or trends in future periods.
Price increases for energy and raw materials could have a significant impact on the company's ability to sustain and grow earnings.The company's manufacturing processes consume significant amounts of energy and raw materials, the costs of which are subject to worldwide supply anddemand as well as other factors beyond the control of the company. Significant variations in the cost of energy, which primarily reflect market prices for oiland natural gas and raw materials affect the company's operating results from period to period. Legislation to address climate change by reducing greenhousegas emissions and establishing a price on carbon could create increases in energy costs and price volatility. When possible, the company purchases rawmaterials through negotiated long-term contracts to minimize the impact of price fluctuations. Additionally, the company enters into over-the-counter andexchange traded derivative commodity instruments to hedge its exposure to price fluctuations on certain raw material purchases. The company takes actionsto offset the effects of higher energy and raw material costs through selling price increases, productivity improvements and cost reduction programs. Successin offsetting higher raw material costs with price increases is largely influenced by competitive and economic conditions and could vary significantlydepending on the market served. If the company is not able to fully offset the effects of higher energy and raw material costs, it could have a significantimpact on the company's financial results.
Failure to develop and market new products and manage product life cycles could impact the company's competitive position and have an adverseeffect on the company's financial results.Operating results are largely dependent on the company's assessment and management of its portfolio of current, new and developing products and servicesand its ability to bring those products and services to market. The company plans to grow earnings by focusing on developing markets and solutions to meetincreasing demand for food productivity, decrease dependency on fossil fuels and protect people, assets and the environment. This ability could be adverselyaffected by difficulties or delays in product development such as the inability to identify viable new products, successfully complete research anddevelopment, obtain relevant regulatory approvals, obtain intellectual property protection, or gain market acceptance of new products and services. Because ofthe lengthy development process, technological challenges and intense competition, there can be no assurance that any of the
8
Table of Contents
Part I
ITEM 1A. RISK FACTORS, continued
products the company is currently developing, or could begin to develop in the future, will achieve substantial commercial success. Sales of the company'snew products could replace sales of some of its current products, offsetting the benefit of even a successful product introduction.
The company's results of operations could be adversely affected by litigation and other commitments and contingencies.The company faces risks arising from various unasserted and asserted litigation matters, including, but not limited to, product liability, patent infringement,antitrust claims, and claims for third party property damage or personal injury stemming from alleged environmental torts. The company has noted anationwide trend in purported class actions against chemical manufacturers generally seeking relief such as medical monitoring, property damages, off-siteremediation and punitive damages arising from alleged environmental torts without claiming present personal injuries. The company also has noted a trend inpublic and private nuisance suits being filed on behalf of states, counties, cities and utilities alleging harm to the general public. Various factors ordevelopments can lead to changes in current estimates of liabilities such as a final adverse judgment, significant settlement or changes in applicable law. Afuture adverse ruling or unfavorable development could result in future charges that could have a material adverse effect on the company. An adverseoutcome in any one or more of these matters could be material to the company's financial results.
In the ordinary course of business, the company may make certain commitments, including representations, warranties and indemnities relating to current andpast operations, including those related to divested businesses and issue guarantees of third party obligations. If the company were required to make paymentsas a result, they could exceed the amounts accrued, thereby adversely affecting the company's results of operations.
The company's business, including its results of operations and reputation, could be adversely affected by process safety and product stewardshipissues.Failure to appropriately manage safety, human health, product liability and environmental risks associated with the company's products, product life cyclesand production processes could adversely impact employees, communities, stakeholders, the company's reputation and its results of operations. Publicperception of the risks associated with the company's products and production processes could impact product acceptance and influence the regulatoryenvironment in which the company operates. While the company has procedures and controls to manage process safety risks, issues could be created byevents outside of its control including natural disasters, severe weather events and acts of sabotage.
As a result of the company's current and past operations, including operations related to divested businesses, the company could incur significantenvironmental liabilities.The company is subject to various laws and regulations around the world governing the environment, including the discharge of pollutants and themanagement and disposal of hazardous substances. As a result of its operations, including its past operations and operations of divested businesses, thecompany could incur substantial costs, including remediation and restoration costs. The costs of complying with complex environmental laws and regulations,as well as internal voluntary programs, are significant and will continue to be so for the foreseeable future. The ultimate costs under environmental laws andthe timing of these costs are difficult to predict. The company's accruals for such costs and liabilities may not be adequate because the estimates on which theaccruals are based depend on a number of factors including the nature of the matter, the complexity of the site, site geology, the nature and extent ofcontamination, the type of remedy, the outcome of discussions with regulatory agencies and other Potentially Responsible Parties (PRPs) at multi-party sitesand the number and financial viability of other PRPs.
Market acceptance, government policies, rules or regulations and competition could affect the company's ability to generate sales from geneticallymodified products.The company is using biotechnology to create and improve products, particularly in its Agriculture segment. The use of biotechnology to characterize thegenetic and performance characteristics of Pioneer seeds provides Pioneer with competitive advantages in the development of new products, and in the mosteffective placement of those products on customer acres. In addition, the company uses biotechnology to enhance the performance of its seed productsthrough the addition of specific transgenes. The company's ability to generate sales from such products could be affected by market acceptance of geneticallymodified products as well as governmental policies, laws and regulations that affect the development, manufacture and distribution of products, including thetesting and planting of seeds containing biotechnology traits and the import of commodity grain grown from those seeds.
The company competes with major global companies that have strong intellectual property estates supporting the use of biotechnology to enhance products,particularly in the agricultural products and production markets. Speed in discovering and protecting new technologies and bringing products based on themto market is a significant competitive advantage. Failure to predict and respond effectively to this competition could cause the company's existing or candidateproducts to become less
9
Table of Contents
Part I
ITEM 1A. RISK FACTORS, continued
competitive, adversely affecting sales.
Changes in government policies and laws could adversely affect the company's financial results.Sales outside the U.S. constitute approximately 65 percent of the company's 2011 revenue. The company anticipates that international sales will continue torepresent a substantial portion of its total sales and that continued growth and profitability will require further international expansion, particularly indeveloping markets. Sales from developing markets represent 34 percent of the company's revenue in 2011 and the company's growth plans include focusingon expanding its presence in developing markets. The company's financial results could be affected by changes in trade, monetary and fiscal policies, lawsand regulations, or other activities of U.S. and non-U.S. governments, agencies and similar organizations. These conditions include, but are not limited to,changes in a country's or region's economic or political conditions, trade regulations affecting production, pricing and marketing of products, local laborconditions and regulations, reduced protection of intellectual property rights in some countries, changes in the regulatory or legal environment, restrictions oncurrency exchange activities, burdensome taxes and tariffs and other trade barriers. International risks and uncertainties, including changing social andeconomic conditions as well as terrorism, political hostilities and war, could lead to reduced sales and profitability.
Economic factors, including inflation, deflation and fluctuations in currency exchange rates, interest rates and commodity prices could affect thecompany's financial results.The company is exposed to fluctuations in currency exchange rates, interest rates and commodity prices. Because the company has significant internationaloperations, there are a large number of currency transactions that result from international sales, purchases, investments and borrowings. The companyactively manages currency exposures that are associated with net monetary asset positions, committed currency purchases and sales, foreign currency-denominated revenues and other assets and liabilities created in the normal course of business. Failure to successfully manage these risks could have anadverse impact on the company's financial position, results of operations and cash flows.
Conditions in the global economy and global capital markets may adversely affect the company's results of operations, financial condition, and cashflows.The company's business and operating results may in the future be adversely affected by global economic conditions, including instability in credit markets,declining consumer and business confidence, fluctuating commodity prices, volatile exchange rates, and other challenges that could affect the globaleconomy. The company's customers may experience deterioration of their businesses, cash flow shortages, and difficulty obtaining financing. As a result,existing or potential customers may delay or cancel plans to purchase products and may not be able to fulfill their obligations in a timely fashion. Further,suppliers could experience similar conditions, which could impact their ability to fulfill their obligations to the company. Adversity within capital marketsmay impact future return on pension assets, thus resulting in greater future pension costs that impact the company's results. Future weakness in the globaleconomy could adversely affect the company's results of operations, financial condition and cash flows in future periods.
The company's results of operations and financial condition could be seriously impacted by business disruptions and security threats.Business disruptions, including supply disruptions, increasing costs for energy, temporary plant and/or power outages and information technology system andnetwork disruptions, could seriously harm the company's operations as well as the operations of its customers and suppliers. Like many other multinationalorganizations, the company faces security threats to its facilities, data and information technology infrastructure. Although it is impossible to predict theoccurrences or consequences of business disruptions or security threats, they could result in reduced demand for the company's products, make it difficult orimpossible for the company to deliver products to its customers or to receive raw materials from suppliers, and create delays and inefficiencies in the supplychain. The company actively manages the risks within its control that could lead to business disruptions or security breaches in order to mitigate any potentialimpact from business disruptions regardless of cause including acts of sabotage, terrorism or war, weather events and natural disasters. Despite these efforts,the impact from business disruptions and security breaches could significantly increase the cost of doing business or otherwise adversely impact thecompany's financial performance.
Inability to protect and enforce the company's intellectual property rights could adversely affect the company's financial results.Intellectual property rights, including patents, plant variety protection, trade secrets, confidential information, trademarks, tradenames and other forms of tradedress, are important to the company's business. The company endeavors to protect its intellectual property rights in jurisdictions in which its products areproduced or used and in jurisdictions into which its products are imported. However, the company may be unable to obtain protection for its intellectualproperty in key jurisdictions. The company has designed and implemented internal controls to restrict access to and distribution of its intellectual property.Despite these
10
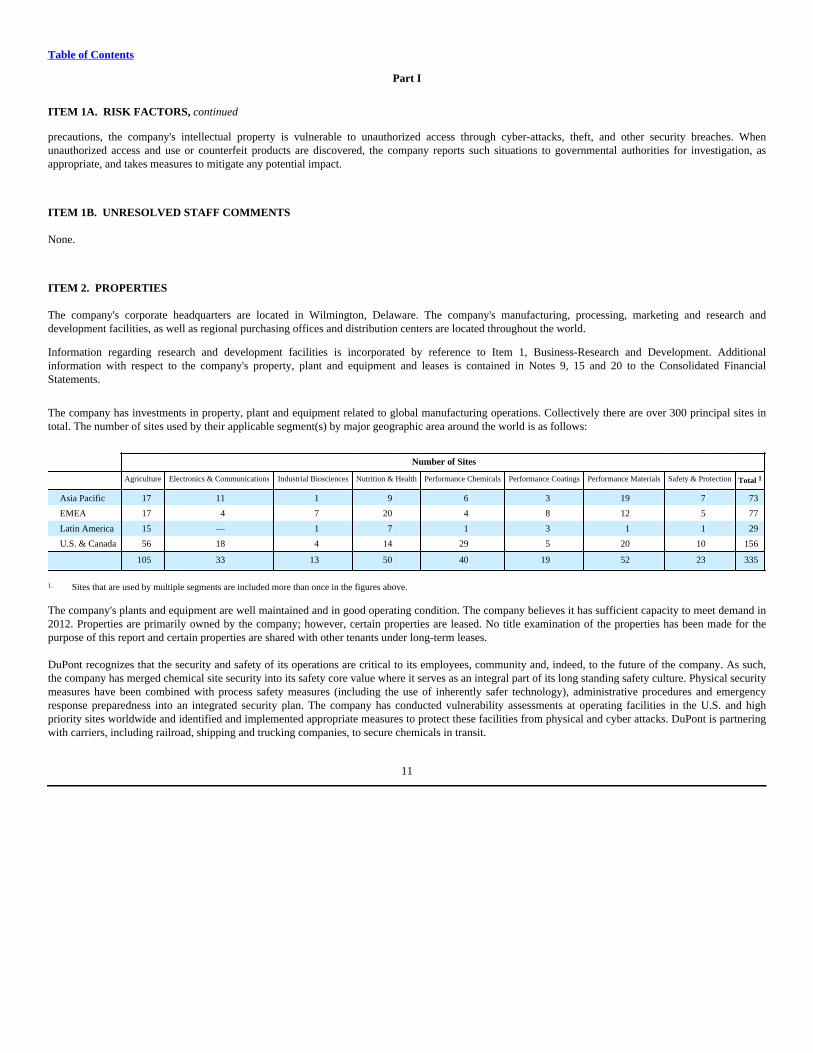
Table of Contents
Part I
ITEM 1A. RISK FACTORS, continued
precautions, the company's intellectual property is vulnerable to unauthorized access through cyber-attacks, theft, and other security breaches. Whenunauthorized access and use or counterfeit products are discovered, the company reports such situations to governmental authorities for investigation, asappropriate, and takes measures to mitigate any potential impact.
ITEM 1B. UNRESOLVED STAFF COMMENTS
None.
ITEM 2. PROPERTIES
The company's corporate headquarters are located in Wilmington, Delaware. The company's manufacturing, processing, marketing and research anddevelopment facilities, as well as regional purchasing offices and distribution centers are located throughout the world.
Information regarding research and development facilities is incorporated by reference to Item 1, Business-Research and Development. Additionalinformation with respect to the company's property, plant and equipment and leases is contained in Notes 9, 15 and 20 to the Consolidated FinancialStatements.
The company has investments in property, plant and equipment related to global manufacturing operations. Collectively there are over 300 principal sites intotal. The number of sites used by their applicable segment(s) by major geographic area around the world is as follows:
Number of Sites
Agriculture Electronics & Communications Industrial Biosciences Nutrition & Health Performance Chemicals Performance Coatings Performance Materials Safety & Protection Total 1
Asia Pacific 17 11 1 9 6 3 19 7 73
EMEA 17 4 7 20 4 8 12 5 77
Latin America 15 — 1 7 1 3 1 1 29
U.S. & Canada 56 18 4 14 29 5 20 10 156
105 33 13 50 40 19 52 23 335
1. Sites that are used by multiple segments are included more than once in the figures above.
The company's plants and equipment are well maintained and in good operating condition. The company believes it has sufficient capacity to meet demand in2012. Properties are primarily owned by the company; however, certain properties are leased. No title examination of the properties has been made for thepurpose of this report and certain properties are shared with other tenants under long-term leases.
DuPont recognizes that the security and safety of its operations are critical to its employees, community and, indeed, to the future of the company. As such,the company has merged chemical site security into its safety core value where it serves as an integral part of its long standing safety culture. Physical securitymeasures have been combined with process safety measures (including the use of inherently safer technology), administrative procedures and emergencyresponse preparedness into an integrated security plan. The company has conducted vulnerability assessments at operating facilities in the U.S. and highpriority sites worldwide and identified and implemented appropriate measures to protect these facilities from physical and cyber attacks. DuPont is partneringwith carriers, including railroad, shipping and trucking companies, to secure chemicals in transit.
11
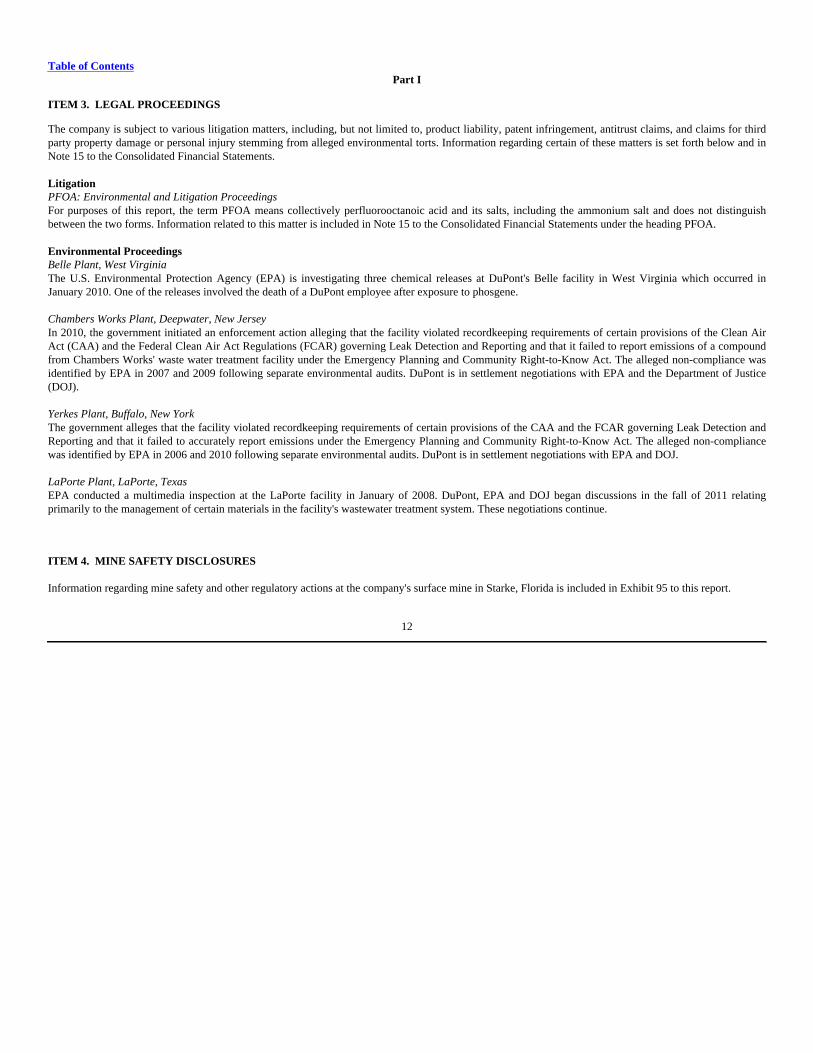
Table of ContentsPart I
ITEM 3. LEGAL PROCEEDINGS
The company is subject to various litigation matters, including, but not limited to, product liability, patent infringement, antitrust claims, and claims for thirdparty property damage or personal injury stemming from alleged environmental torts. Information regarding certain of these matters is set forth below and inNote 15 to the Consolidated Financial Statements.
LitigationPFOA: Environmental and Litigation ProceedingsFor purposes of this report, the term PFOA means collectively perfluorooctanoic acid and its salts, including the ammonium salt and does not distinguishbetween the two forms. Information related to this matter is included in Note 15 to the Consolidated Financial Statements under the heading PFOA.
Environmental ProceedingsBelle Plant, West VirginiaThe U.S. Environmental Protection Agency (EPA) is investigating three chemical releases at DuPont's Belle facility in West Virginia which occurred inJanuary 2010. One of the releases involved the death of a DuPont employee after exposure to phosgene.
Chambers Works Plant, Deepwater, New JerseyIn 2010, the government initiated an enforcement action alleging that the facility violated recordkeeping requirements of certain provisions of the Clean AirAct (CAA) and the Federal Clean Air Act Regulations (FCAR) governing Leak Detection and Reporting and that it failed to report emissions of a compoundfrom Chambers Works' waste water treatment facility under the Emergency Planning and Community Right-to-Know Act. The alleged non-compliance wasidentified by EPA in 2007 and 2009 following separate environmental audits. DuPont is in settlement negotiations with EPA and the Department of Justice(DOJ).
Yerkes Plant, Buffalo, New YorkThe government alleges that the facility violated recordkeeping requirements of certain provisions of the CAA and the FCAR governing Leak Detection andReporting and that it failed to accurately report emissions under the Emergency Planning and Community Right-to-Know Act. The alleged non-compliancewas identified by EPA in 2006 and 2010 following separate environmental audits. DuPont is in settlement negotiations with EPA and DOJ.
LaPorte Plant, LaPorte, TexasEPA conducted a multimedia inspection at the LaPorte facility in January of 2008. DuPont, EPA and DOJ began discussions in the fall of 2011 relatingprimarily to the management of certain materials in the facility's wastewater treatment system. These negotiations continue.
ITEM 4. MINE SAFETY DISCLOSURES
Information regarding mine safety and other regulatory actions at the company's surface mine in Starke, Florida is included in Exhibit 95 to this report.
12
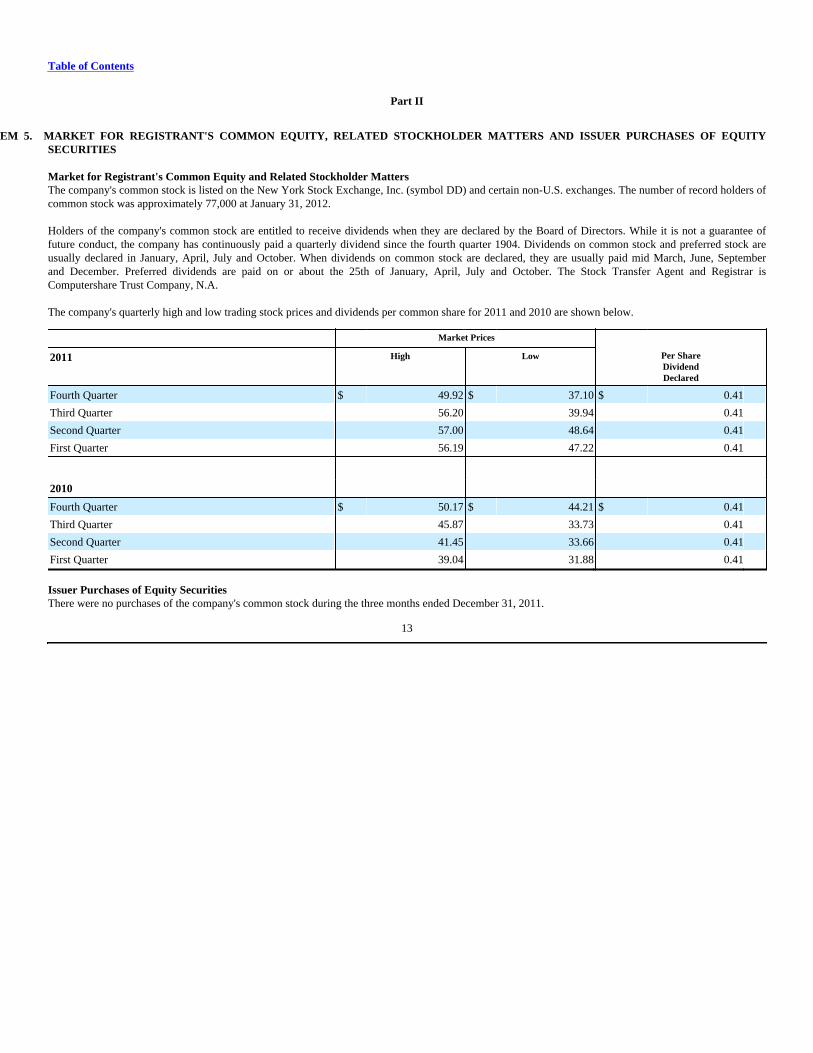
Table of Contents
Part II
ITEM 5. MARKET FOR REGISTRANT'S COMMON EQUITY, RELATED STOCKHOLDER MATTERS AND ISSUER PURCHASES OF EQUITYSECURITIES
Market for Registrant's Common Equity and Related Stockholder MattersThe company's common stock is listed on the New York Stock Exchange, Inc. (symbol DD) and certain non-U.S. exchanges. The number of record holders ofcommon stock was approximately 77,000 at January 31, 2012.
Holders of the company's common stock are entitled to receive dividends when they are declared by the Board of Directors. While it is not a guarantee offuture conduct, the company has continuously paid a quarterly dividend since the fourth quarter 1904. Dividends on common stock and preferred stock areusually declared in January, April, July and October. When dividends on common stock are declared, they are usually paid mid March, June, Septemberand December. Preferred dividends are paid on or about the 25th of January, April, July and October. The Stock Transfer Agent and Registrar isComputershare Trust Company, N.A.
The company's quarterly high and low trading stock prices and dividends per common share for 2011 and 2010 are shown below.
Market Prices
2011 High Low Per ShareDividendDeclared
Fourth Quarter $ 49.92 $ 37.10 $ 0.41
Third Quarter 56.20 39.94 0.41
Second Quarter 57.00 48.64 0.41
First Quarter 56.19 47.22 0.41
2010
Fourth Quarter $ 50.17 $ 44.21 $ 0.41
Third Quarter 45.87 33.73 0.41
Second Quarter 41.45 33.66 0.41
First Quarter 39.04 31.88 0.41
Issuer Purchases of Equity SecuritiesThere were no purchases of the company's common stock during the three months ended December 31, 2011.
13
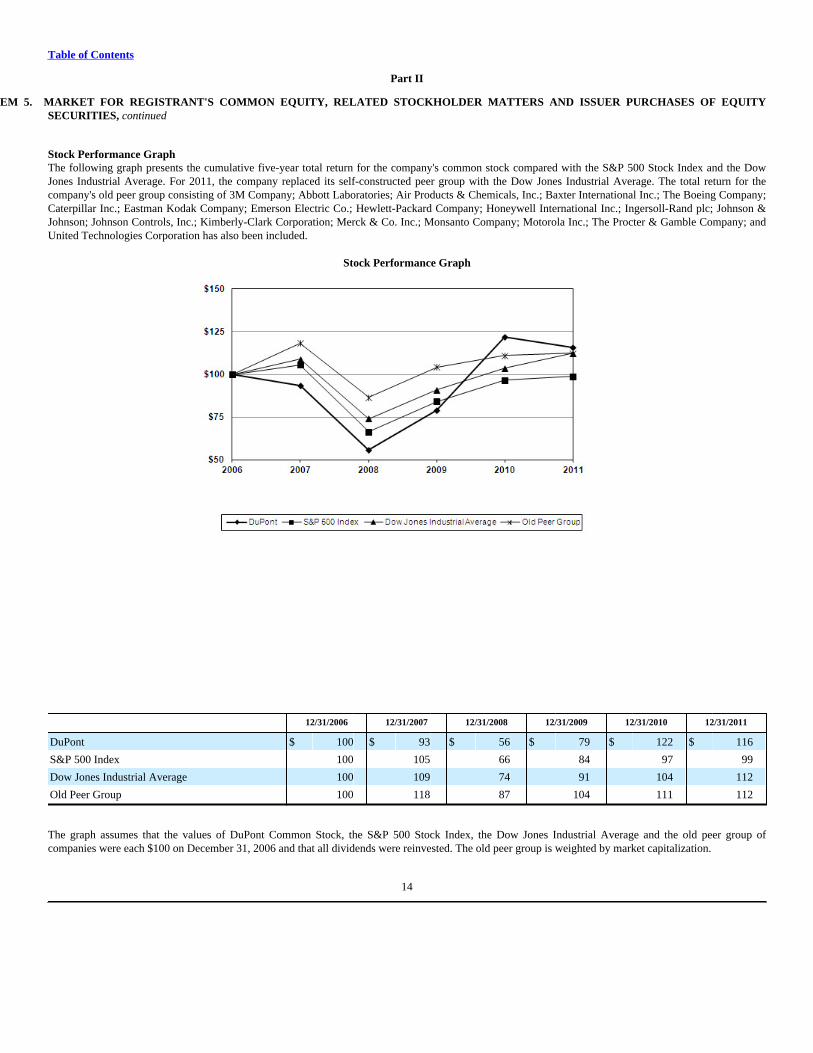
Table of Contents
Part II
ITEM 5. MARKET FOR REGISTRANT'S COMMON EQUITY, RELATED STOCKHOLDER MATTERS AND ISSUER PURCHASES OF EQUITYSECURITIES, continued
Stock Performance GraphThe following graph presents the cumulative five-year total return for the company's common stock compared with the S&P 500 Stock Index and the DowJones Industrial Average. For 2011, the company replaced its self-constructed peer group with the Dow Jones Industrial Average. The total return for thecompany's old peer group consisting of 3M Company; Abbott Laboratories; Air Products & Chemicals, Inc.; Baxter International Inc.; The Boeing Company;Caterpillar Inc.; Eastman Kodak Company; Emerson Electric Co.; Hewlett-Packard Company; Honeywell International Inc.; Ingersoll-Rand plc; Johnson &Johnson; Johnson Controls, Inc.; Kimberly-Clark Corporation; Merck & Co. Inc.; Monsanto Company; Motorola Inc.; The Procter & Gamble Company; andUnited Technologies Corporation has also been included.
Stock Performance Graph
12/31/2006 12/31/2007 12/31/2008 12/31/2009 12/31/2010 12/31/2011
DuPont $ 100 $ 93 $ 56 $ 79 $ 122 $ 116
S&P 500 Index 100 105 66 84 97 99
Dow Jones Industrial Average 100 109 74 91 104 112
Old Peer Group 100 118 87 104 111 112
The graph assumes that the values of DuPont Common Stock, the S&P 500 Stock Index, the Dow Jones Industrial Average and the old peer group ofcompanies were each $100 on December 31, 2006 and that all dividends were reinvested. The old peer group is weighted by market capitalization.
14
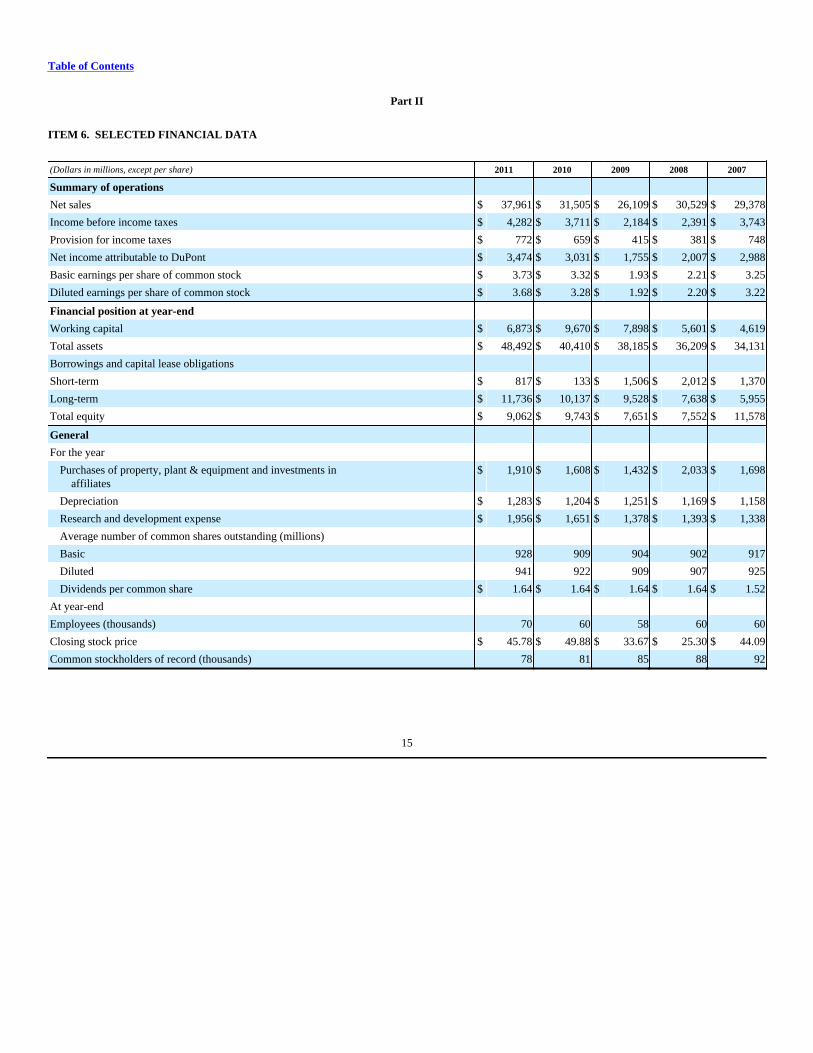
Table of Contents
Part II
ITEM 6. SELECTED FINANCIAL DATA
(Dollars in millions, except per share) 2011 2010 2009 2008 2007
Summary of operations
Net sales $ 37,961 $ 31,505 $ 26,109 $ 30,529 $ 29,378
Income before income taxes $ 4,282 $ 3,711 $ 2,184 $ 2,391 $ 3,743
Provision for income taxes $ 772 $ 659 $ 415 $ 381 $ 748
Net income attributable to DuPont $ 3,474 $ 3,031 $ 1,755 $ 2,007 $ 2,988
Basic earnings per share of common stock $ 3.73 $ 3.32 $ 1.93 $ 2.21 $ 3.25
Diluted earnings per share of common stock $ 3.68 $ 3.28 $ 1.92 $ 2.20 $ 3.22
Financial position at year-end
Working capital $ 6,873 $ 9,670 $ 7,898 $ 5,601 $ 4,619
Total assets $ 48,492 $ 40,410 $ 38,185 $ 36,209 $ 34,131
Borrowings and capital lease obligations
Short-term $ 817 $ 133 $ 1,506 $ 2,012 $ 1,370
Long-term $ 11,736 $ 10,137 $ 9,528 $ 7,638 $ 5,955
Total equity $ 9,062 $ 9,743 $ 7,651 $ 7,552 $ 11,578
General
For the year
Purchases of property, plant & equipment and investments in affiliates
$ 1,910 $ 1,608 $ 1,432 $ 2,033 $ 1,698
Depreciation $ 1,283 $ 1,204 $ 1,251 $ 1,169 $ 1,158
Research and development expense $ 1,956 $ 1,651 $ 1,378 $ 1,393 $ 1,338
Average number of common shares outstanding (millions)
Basic 928 909 904 902 917
Diluted 941 922 909 907 925
Dividends per common share $ 1.64 $ 1.64 $ 1.64 $ 1.64 $ 1.52
At year-end
Employees (thousands) 70 60 58 60 60
Closing stock price $ 45.78 $ 49.88 $ 33.67 $ 25.30 $ 44.09
Common stockholders of record (thousands) 78 81 85 88 92
15
Table of Contents
Part II
ITEM 7. MANAGEMENT'S DISCUSSION AND ANALYSIS OF FINANCIAL CONDITION AND RESULTS OF OPERATIONS
CAUTIONARY STATEMENTS ABOUT FORWARD-LOOKING STATEMENTSThis report contains forward-looking statements which may be identified by their use of words like “plans,” “expects,” “will,” “anticipates,” "believes,"“intends,” “projects,” “estimates” or other words of similar meaning. All statements that address expectations or projections about the future, includingstatements about the company's strategy for growth, product development, regulatory approval, market position, anticipated benefits of recent acquisitions,outcome of contingencies, such as litigation and environmental matters, expenditures and financial results, are forward-looking statements.
Forward-looking statements are based on certain assumptions and expectations of future events which may not be accurate or realized. Forward-lookingstatements also involve risks and uncertainties, many of which are beyond the company's control. Some of the important factors that could cause thecompany's actual results to differ materially from those projected in any such forward-looking statements are:
• Fluctuations in energy and raw material prices;• Failure to develop and market new products and optimally manage product life cycles;• Outcome of significant litigation and environmental matters, including those related to divested businesses;• Failure to appropriately manage process safety and product stewardship issues;• Effect of changes in tax, environmental and other laws and regulations or political conditions in the U.S. and other countries in which the company
operates;• Conditions in the global economy and global capital markets, including economic factors, such as inflation, deflation and fluctuations in currency
exchange rates, interest rates and commodity prices, as well as regulatory requirements;• Impact of business disruptions, including supply disruptions, and security threats, regardless of cause, including acts of sabotage, terrorism or war,
weather events and natural disasters;• Inability to protect and enforce the company's intellectual property rights; and• Successful integration of acquired businesses and completion of divestitures of underperforming or non-strategic assets or businesses.
For some of the important factors that could cause the company's actual results to differ materially from those projected in any such forward-lookingstatements, see the Risk Factors discussion set forth under Part I, Item 1A beginning on page 8.
OverviewVision DuPont's vision is to be the world's most dynamic science company, creating sustainable solutions essential to a better, safer and healthier life forpeople everywhere. The company is committed to growing shareholder and societal value while reducing its environmental footprint in the value chains inwhich it operates, over the long-term.
Strategy The company's strategy for growth is to apply its science and technology to address three challenges driven by global population growth: feedingthe world , reducing our dependence on fossil fuels and keeping people and the environment safe . Critical areas for the company's growth are innovation,differential management and productivity. Applying science to deliver innovative solutions and new products in the marketplace generates shareholder valueand profitable growth. Differential management is a disciplined process to prioritize and allocate resources across businesses and geographies aligned withgrowth opportunities. The company continues to achieve fixed cost, working capital and variable cost productivity through disciplined business processescalled DuPont Integrated Business Management (DIBM) and DuPont Production System (DPS). DIBM focuses on the business supply chain to maximizeefficiency and optimize working capital, while DPS focuses on productivity outcomes to eliminate operational inefficiencies and improve lead time, cycletime and quality.
Goals The company's long-term plan includes compound annual growth targets of 7 percent for sales and 12 percent for earnings per share. In 2011, saleswere up 20 percent with strong contributions across most segments with earnings per share increasing 12 percent. Sales in developing markets, which includeChina, India, and the countries located in Latin America, Eastern and Central Europe, Middle East, Africa, and Southeast Asia, are targeted to make up40 percent of the company's sales by 2015, a 6 percentage point increase from 2011. In 2011, sales of new products introduced in the last four years were inline with the company's long-term target of 30 percent of total sales. Additionally, the company exceeded its 2011 goals for fixed cost and working capitalproductivity. The company remains on-track to exceed its three-year 2010-2012 plan of $1 billion fixed cost productivity actions and has already exceeded itsthree-year 2010-2012 plan of $1 billion working capital productivity. The company is committed to maintain a strong balance sheet and to return excess cashto shareholders unless there is a compelling opportunity to invest for growth.
16
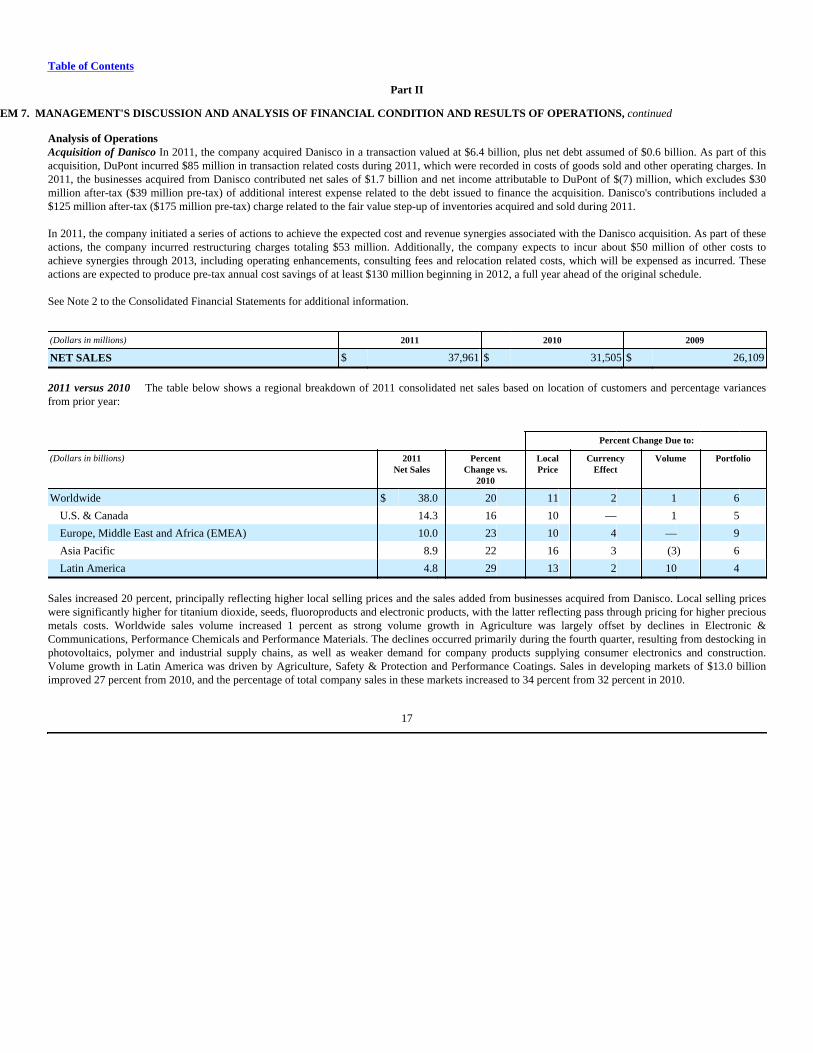
Table of Contents
Part II
ITEM 7. MANAGEMENT'S DISCUSSION AND ANALYSIS OF FINANCIAL CONDITION AND RESULTS OF OPERATIONS, continued
Analysis of OperationsAcquisition of Danisco In 2011, the company acquired Danisco in a transaction valued at $6.4 billion, plus net debt assumed of $0.6 billion. As part of thisacquisition, DuPont incurred $85 million in transaction related costs during 2011, which were recorded in costs of goods sold and other operating charges. In2011, the businesses acquired from Danisco contributed net sales of $1.7 billion and net income attributable to DuPont of $(7) million, which excludes $30million after-tax ($39 million pre-tax) of additional interest expense related to the debt issued to finance the acquisition. Danisco's contributions included a$125 million after-tax ($175 million pre-tax) charge related to the fair value step-up of inventories acquired and sold during 2011.
In 2011, the company initiated a series of actions to achieve the expected cost and revenue synergies associated with the Danisco acquisition. As part of theseactions, the company incurred restructuring charges totaling $53 million. Additionally, the company expects to incur about $50 million of other costs toachieve synergies through 2013, including operating enhancements, consulting fees and relocation related costs, which will be expensed as incurred. Theseactions are expected to produce pre-tax annual cost savings of at least $130 million beginning in 2012, a full year ahead of the original schedule.
See Note 2 to the Consolidated Financial Statements for additional information.
(Dollars in millions) 2011 2010 2009
NET SALES $ 37,961 $ 31,505 $ 26,109
2011 versus 2010 The table below shows a regional breakdown of 2011 consolidated net sales based on location of customers and percentage variancesfrom prior year:
Percent Change Due to:
(Dollars in billions) 2011Net Sales
PercentChange vs.
2010
LocalPrice
CurrencyEffect
Volume Portfolio
Worldwide $ 38.0 20 11 2 1 6
U.S. & Canada 14.3 16 10 — 1 5
Europe, Middle East and Africa (EMEA) 10.0 23 10 4 — 9
Asia Pacific 8.9 22 16 3 (3) 6
Latin America 4.8 29 13 2 10 4
Sales increased 20 percent, principally reflecting higher local selling prices and the sales added from businesses acquired from Danisco. Local selling priceswere significantly higher for titanium dioxide, seeds, fluoroproducts and electronic products, with the latter reflecting pass through pricing for higher preciousmetals costs. Worldwide sales volume increased 1 percent as strong volume growth in Agriculture was largely offset by declines in Electronic &Communications, Performance Chemicals and Performance Materials. The declines occurred primarily during the fourth quarter, resulting from destocking inphotovoltaics, polymer and industrial supply chains, as well as weaker demand for company products supplying consumer electronics and construction.Volume growth in Latin America was driven by Agriculture, Safety & Protection and Performance Coatings. Sales in developing markets of $13.0 billionimproved 27 percent from 2010, and the percentage of total company sales in these markets increased to 34 percent from 32 percent in 2010.
17
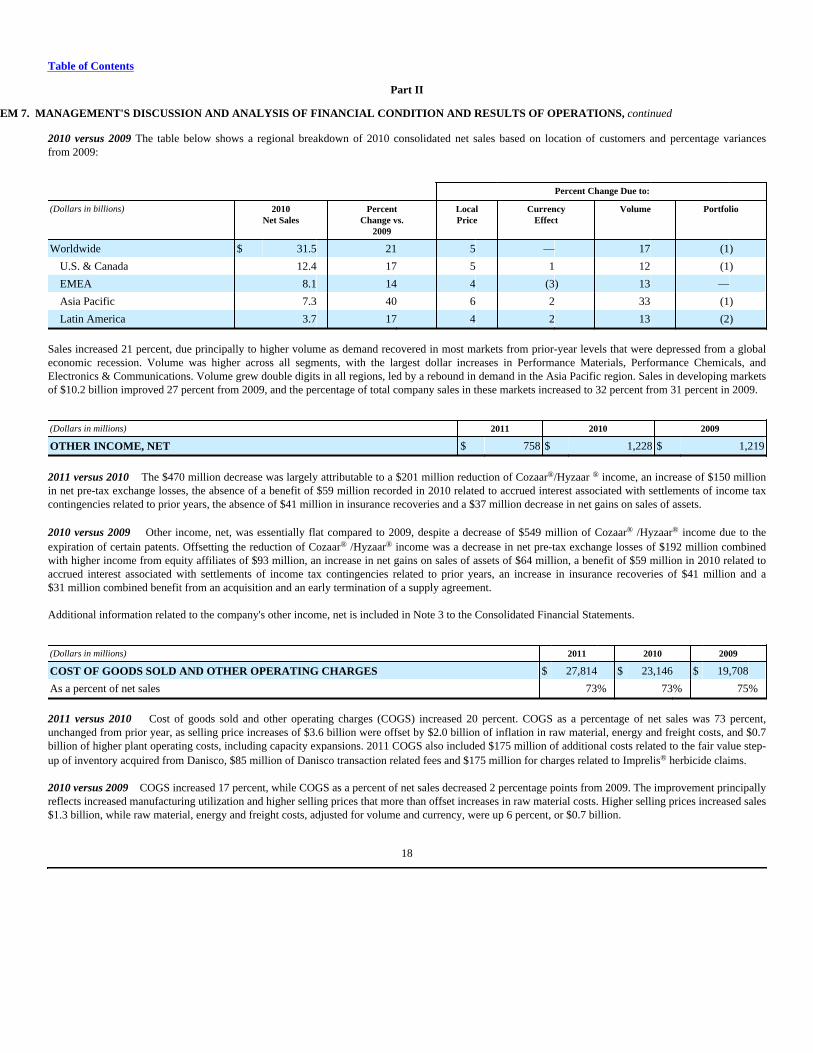
Table of Contents
Part II
ITEM 7. MANAGEMENT'S DISCUSSION AND ANALYSIS OF FINANCIAL CONDITION AND RESULTS OF OPERATIONS, continued
2010 versus 2009 The table below shows a regional breakdown of 2010 consolidated net sales based on location of customers and percentage variancesfrom 2009:
Percent Change Due to:
(Dollars in billions) 2010Net Sales
PercentChange vs.
2009
LocalPrice
CurrencyEffect
Volume Portfolio
Worldwide $ 31.5 21 5 — 17 (1)
U.S. & Canada 12.4 17 5 1 12 (1)
EMEA 8.1 14 4 (3) 13 —
Asia Pacific 7.3 40 6 2 33 (1)
Latin America 3.7 17 4 2 13 (2)
Sales increased 21 percent, due principally to higher volume as demand recovered in most markets from prior-year levels that were depressed from a globaleconomic recession. Volume was higher across all segments, with the largest dollar increases in Performance Materials, Performance Chemicals, andElectronics & Communications. Volume grew double digits in all regions, led by a rebound in demand in the Asia Pacific region. Sales in developing marketsof $10.2 billion improved 27 percent from 2009, and the percentage of total company sales in these markets increased to 32 percent from 31 percent in 2009.
(Dollars in millions) 2011 2010 2009
OTHER INCOME, NET $ 758 $ 1,228 $ 1,219
2011 versus 2010 The $470 million decrease was largely attributable to a $201 million reduction of Cozaar®/Hyzaar ® income, an increase of $150 millionin net pre-tax exchange losses, the absence of a benefit of $59 million recorded in 2010 related to accrued interest associated with settlements of income taxcontingencies related to prior years, the absence of $41 million in insurance recoveries and a $37 million decrease in net gains on sales of assets.
2010 versus 2009 Other income, net, was essentially flat compared to 2009, despite a decrease of $549 million of Cozaar® /Hyzaar® income due to theexpiration of certain patents. Offsetting the reduction of Cozaar® /Hyzaar® income was a decrease in net pre-tax exchange losses of $192 million combinedwith higher income from equity affiliates of $93 million, an increase in net gains on sales of assets of $64 million, a benefit of $59 million in 2010 related toaccrued interest associated with settlements of income tax contingencies related to prior years, an increase in insurance recoveries of $41 million and a$31 million combined benefit from an acquisition and an early termination of a supply agreement.
Additional information related to the company's other income, net is included in Note 3 to the Consolidated Financial Statements.
(Dollars in millions) 2011 2010 2009
COST OF GOODS SOLD AND OTHER OPERATING CHARGES $ 27,814 $ 23,146 $ 19,708
As a percent of net sales 73% 73% 75%
2011 versus 2010 Cost of goods sold and other operating charges (COGS) increased 20 percent. COGS as a percentage of net sales was 73 percent,unchanged from prior year, as selling price increases of $3.6 billion were offset by $2.0 billion of inflation in raw material, energy and freight costs, and $0.7billion of higher plant operating costs, including capacity expansions. 2011 COGS also included $175 million of additional costs related to the fair value step-up of inventory acquired from Danisco, $85 million of Danisco transaction related fees and $175 million for charges related to Imprelis® herbicide claims.
2010 versus 2009 COGS increased 17 percent, while COGS as a percent of net sales decreased 2 percentage points from 2009. The improvement principallyreflects increased manufacturing utilization and higher selling prices that more than offset increases in raw material costs. Higher selling prices increased sales$1.3 billion, while raw material, energy and freight costs, adjusted for volume and currency, were up 6 percent, or $0.7 billion.
18
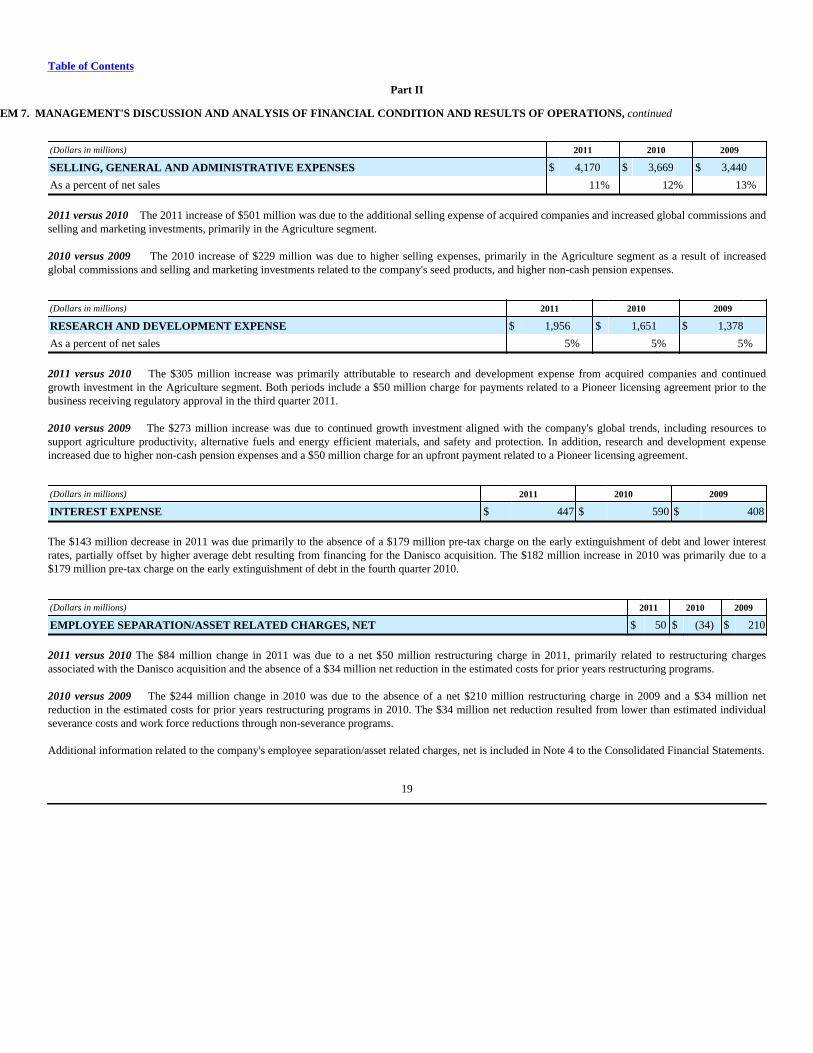
Table of Contents
Part II
ITEM 7. MANAGEMENT'S DISCUSSION AND ANALYSIS OF FINANCIAL CONDITION AND RESULTS OF OPERATIONS, continued
(Dollars in millions) 2011 2010 2009
SELLING, GENERAL AND ADMINISTRATIVE EXPENSES $ 4,170 $ 3,669 $ 3,440
As a percent of net sales 11% 12% 13%
2011 versus 2010 The 2011 increase of $501 million was due to the additional selling expense of acquired companies and increased global commissions andselling and marketing investments, primarily in the Agriculture segment.
2010 versus 2009 The 2010 increase of $229 million was due to higher selling expenses, primarily in the Agriculture segment as a result of increasedglobal commissions and selling and marketing investments related to the company's seed products, and higher non-cash pension expenses.
(Dollars in millions) 2011 2010 2009
RESEARCH AND DEVELOPMENT EXPENSE $ 1,956 $ 1,651 $ 1,378
As a percent of net sales 5% 5% 5%
2011 versus 2010 The $305 million increase was primarily attributable to research and development expense from acquired companies and continuedgrowth investment in the Agriculture segment. Both periods include a $50 million charge for payments related to a Pioneer licensing agreement prior to thebusiness receiving regulatory approval in the third quarter 2011.
2010 versus 2009 The $273 million increase was due to continued growth investment aligned with the company's global trends, including resources tosupport agriculture productivity, alternative fuels and energy efficient materials, and safety and protection. In addition, research and development expenseincreased due to higher non-cash pension expenses and a $50 million charge for an upfront payment related to a Pioneer licensing agreement.
(Dollars in millions) 2011 2010 2009
INTEREST EXPENSE $ 447 $ 590 $ 408
The $143 million decrease in 2011 was due primarily to the absence of a $179 million pre-tax charge on the early extinguishment of debt and lower interestrates, partially offset by higher average debt resulting from financing for the Danisco acquisition. The $182 million increase in 2010 was primarily due to a$179 million pre-tax charge on the early extinguishment of debt in the fourth quarter 2010.
(Dollars in millions) 2011 2010 2009
EMPLOYEE SEPARATION/ASSET RELATED CHARGES, NET $ 50 $ (34) $ 210
2011 versus 2010 The $84 million change in 2011 was due to a net $50 million restructuring charge in 2011, primarily related to restructuring chargesassociated with the Danisco acquisition and the absence of a $34 million net reduction in the estimated costs for prior years restructuring programs.
2010 versus 2009 The $244 million change in 2010 was due to the absence of a net $210 million restructuring charge in 2009 and a $34 million netreduction in the estimated costs for prior years restructuring programs in 2010. The $34 million net reduction resulted from lower than estimated individualseverance costs and work force reductions through non-severance programs.
Additional information related to the company's employee separation/asset related charges, net is included in Note 4 to the Consolidated Financial Statements.
19
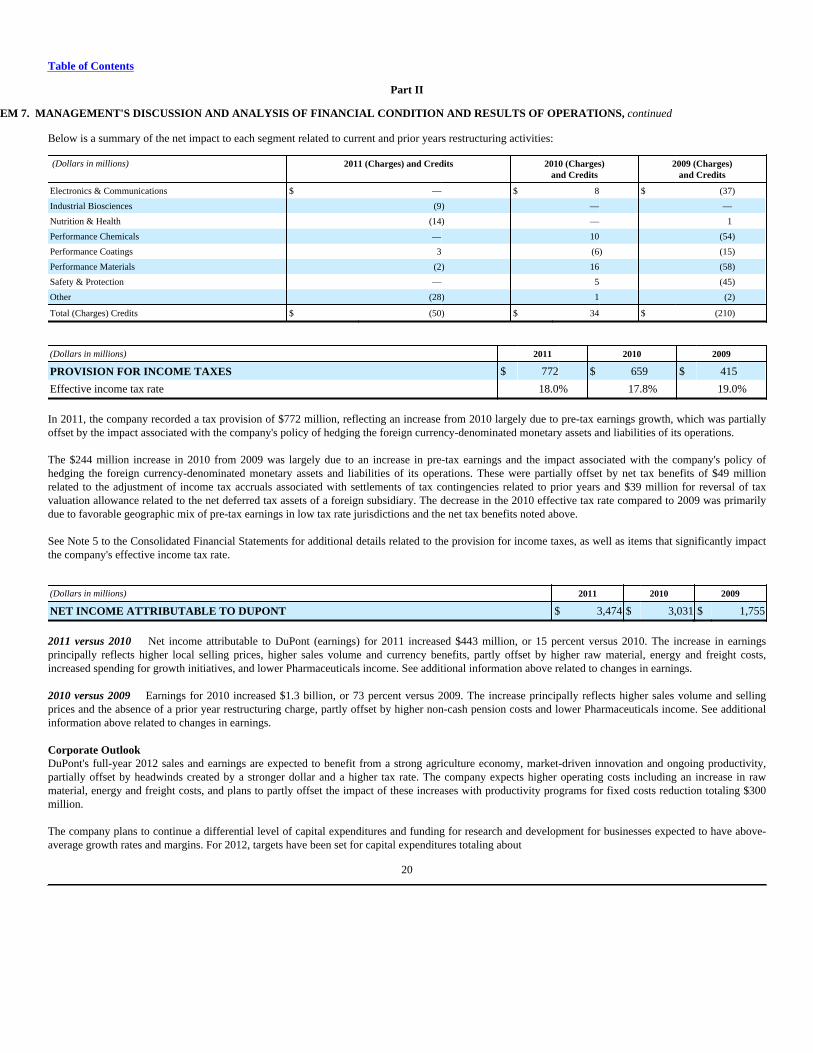
Table of Contents
Part II
ITEM 7. MANAGEMENT'S DISCUSSION AND ANALYSIS OF FINANCIAL CONDITION AND RESULTS OF OPERATIONS, continued
Below is a summary of the net impact to each segment related to current and prior years restructuring activities:
(Dollars in millions) 2011 (Charges) and Credits 2010 (Charges)and Credits
2009 (Charges)and Credits
Electronics & Communications $ — $ 8 $ (37)
Industrial Biosciences (9) — —
Nutrition & Health (14) — 1
Performance Chemicals — 10 (54)
Performance Coatings 3 (6) (15)
Performance Materials (2) 16 (58)
Safety & Protection — 5 (45)
Other (28) 1 (2)
Total (Charges) Credits $ (50) $ 34 $ (210)
(Dollars in millions) 2011 2010 2009
PROVISION FOR INCOME TAXES $ 772 $ 659 $ 415
Effective income tax rate 18.0% 17.8% 19.0%
In 2011, the company recorded a tax provision of $772 million, reflecting an increase from 2010 largely due to pre-tax earnings growth, which was partiallyoffset by the impact associated with the company's policy of hedging the foreign currency-denominated monetary assets and liabilities of its operations.
The $244 million increase in 2010 from 2009 was largely due to an increase in pre-tax earnings and the impact associated with the company's policy ofhedging the foreign currency-denominated monetary assets and liabilities of its operations. These were partially offset by net tax benefits of $49 millionrelated to the adjustment of income tax accruals associated with settlements of tax contingencies related to prior years and $39 million for reversal of taxvaluation allowance related to the net deferred tax assets of a foreign subsidiary. The decrease in the 2010 effective tax rate compared to 2009 was primarilydue to favorable geographic mix of pre-tax earnings in low tax rate jurisdictions and the net tax benefits noted above.
See Note 5 to the Consolidated Financial Statements for additional details related to the provision for income taxes, as well as items that significantly impactthe company's effective income tax rate.
(Dollars in millions) 2011 2010 2009
NET INCOME ATTRIBUTABLE TO DUPONT $ 3,474 $ 3,031 $ 1,755
2011 versus 2010 Net income attributable to DuPont (earnings) for 2011 increased $443 million, or 15 percent versus 2010. The increase in earningsprincipally reflects higher local selling prices, higher sales volume and currency benefits, partly offset by higher raw material, energy and freight costs,increased spending for growth initiatives, and lower Pharmaceuticals income. See additional information above related to changes in earnings.
2010 versus 2009 Earnings for 2010 increased $1.3 billion, or 73 percent versus 2009. The increase principally reflects higher sales volume and sellingprices and the absence of a prior year restructuring charge, partly offset by higher non-cash pension costs and lower Pharmaceuticals income. See additionalinformation above related to changes in earnings.
Corporate OutlookDuPont's full-year 2012 sales and earnings are expected to benefit from a strong agriculture economy, market-driven innovation and ongoing productivity,partially offset by headwinds created by a stronger dollar and a higher tax rate. The company expects higher operating costs including an increase in rawmaterial, energy and freight costs, and plans to partly offset the impact of these increases with productivity programs for fixed costs reduction totaling $300million.
The company plans to continue a differential level of capital expenditures and funding for research and development for businesses expected to have above-average growth rates and margins. For 2012, targets have been set for capital expenditures totaling about
20
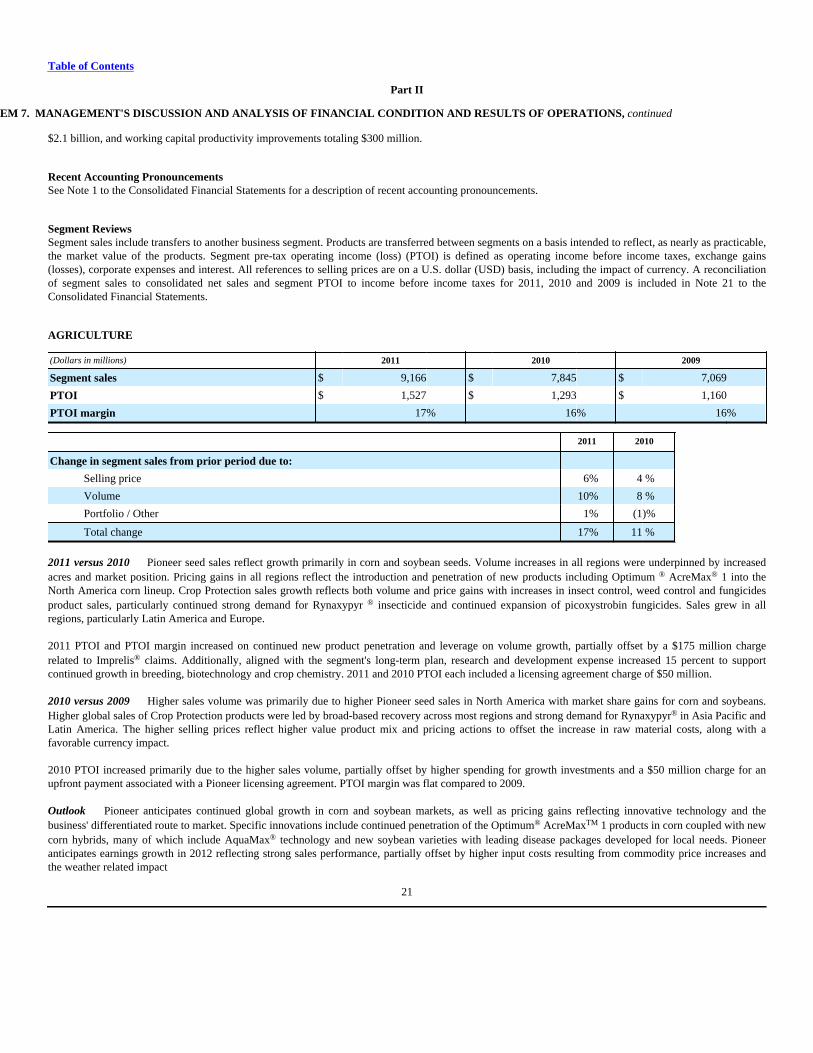
Table of Contents
Part II
ITEM 7. MANAGEMENT'S DISCUSSION AND ANALYSIS OF FINANCIAL CONDITION AND RESULTS OF OPERATIONS, continued
$2.1 billion, and working capital productivity improvements totaling $300 million.
Recent Accounting PronouncementsSee Note 1 to the Consolidated Financial Statements for a description of recent accounting pronouncements.
Segment ReviewsSegment sales include transfers to another business segment. Products are transferred between segments on a basis intended to reflect, as nearly as practicable,the market value of the products. Segment pre-tax operating income (loss) (PTOI) is defined as operating income before income taxes, exchange gains(losses), corporate expenses and interest. All references to selling prices are on a U.S. dollar (USD) basis, including the impact of currency. A reconciliationof segment sales to consolidated net sales and segment PTOI to income before income taxes for 2011, 2010 and 2009 is included in Note 21 to theConsolidated Financial Statements.
AGRICULTURE
(Dollars in millions) 2011 2010 2009
Segment sales $ 9,166 $ 7,845 $ 7,069
PTOI $ 1,527 $ 1,293 $ 1,160
PTOI margin 17% 16% 16%
2011 2010
Change in segment sales from prior period due to:
Selling price 6% 4 %
Volume 10% 8 %
Portfolio / Other 1% (1)%
Total change 17% 11 %
2011 versus 2010 Pioneer seed sales reflect growth primarily in corn and soybean seeds. Volume increases in all regions were underpinned by increasedacres and market position. Pricing gains in all regions reflect the introduction and penetration of new products including Optimum ® AcreMax® 1 into theNorth America corn lineup. Crop Protection sales growth reflects both volume and price gains with increases in insect control, weed control and fungicidesproduct sales, particularly continued strong demand for Rynaxypyr ® insecticide and continued expansion of picoxystrobin fungicides. Sales grew in allregions, particularly Latin America and Europe.
2011 PTOI and PTOI margin increased on continued new product penetration and leverage on volume growth, partially offset by a $175 million chargerelated to Imprelis® claims. Additionally, aligned with the segment's long-term plan, research and development expense increased 15 percent to supportcontinued growth in breeding, biotechnology and crop chemistry. 2011 and 2010 PTOI each included a licensing agreement charge of $50 million.
2010 versus 2009 Higher sales volume was primarily due to higher Pioneer seed sales in North America with market share gains for corn and soybeans.Higher global sales of Crop Protection products were led by broad-based recovery across most regions and strong demand for Rynaxypyr® in Asia Pacific andLatin America. The higher selling prices reflect higher value product mix and pricing actions to offset the increase in raw material costs, along with afavorable currency impact. 2010 PTOI increased primarily due to the higher sales volume, partially offset by higher spending for growth investments and a $50 million charge for anupfront payment associated with a Pioneer licensing agreement. PTOI margin was flat compared to 2009.
Outlook Pioneer anticipates continued global growth in corn and soybean markets, as well as pricing gains reflecting innovative technology and thebusiness' differentiated route to market. Specific innovations include continued penetration of the Optimum® AcreMaxTM 1 products in corn coupled with newcorn hybrids, many of which include AquaMax® technology and new soybean varieties with leading disease packages developed for local needs. Pioneeranticipates earnings growth in 2012 reflecting strong sales performance, partially offset by higher input costs resulting from commodity price increases andthe weather related impact
21
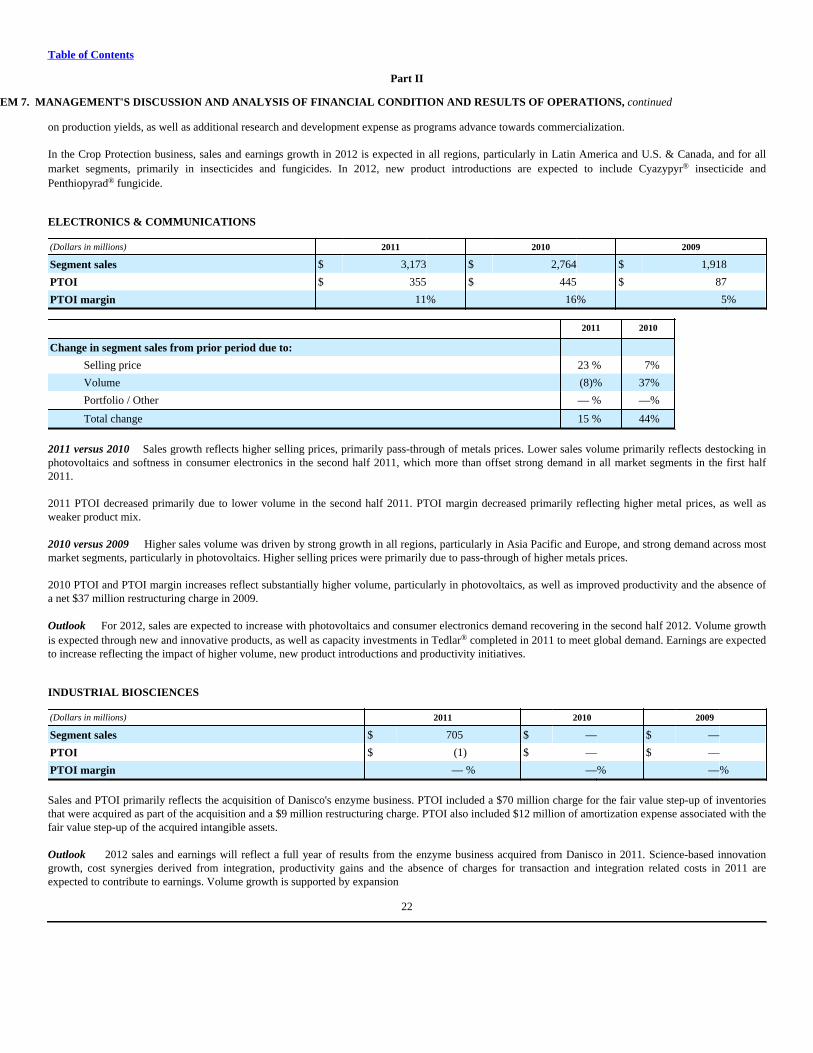
Table of Contents
Part II
ITEM 7. MANAGEMENT'S DISCUSSION AND ANALYSIS OF FINANCIAL CONDITION AND RESULTS OF OPERATIONS, continued
on production yields, as well as additional research and development expense as programs advance towards commercialization. In the Crop Protection business, sales and earnings growth in 2012 is expected in all regions, particularly in Latin America and U.S. & Canada, and for allmarket segments, primarily in insecticides and fungicides. In 2012, new product introductions are expected to include Cyazypyr® insecticide andPenthiopyrad® fungicide.
ELECTRONICS & COMMUNICATIONS
(Dollars in millions) 2011 2010 2009
Segment sales $ 3,173 $ 2,764 $ 1,918
PTOI $ 355 $ 445 $ 87
PTOI margin 11% 16% 5%
2011 2010
Change in segment sales from prior period due to:
Selling price 23 % 7%
Volume (8)% 37%
Portfolio / Other — % —%
Total change 15 % 44%
2011 versus 2010 Sales growth reflects higher selling prices, primarily pass-through of metals prices. Lower sales volume primarily reflects destocking inphotovoltaics and softness in consumer electronics in the second half 2011, which more than offset strong demand in all market segments in the first half2011. 2011 PTOI decreased primarily due to lower volume in the second half 2011. PTOI margin decreased primarily reflecting higher metal prices, as well asweaker product mix.
2010 versus 2009 Higher sales volume was driven by strong growth in all regions, particularly in Asia Pacific and Europe, and strong demand across mostmarket segments, particularly in photovoltaics. Higher selling prices were primarily due to pass-through of higher metals prices.
2010 PTOI and PTOI margin increases reflect substantially higher volume, particularly in photovoltaics, as well as improved productivity and the absence ofa net $37 million restructuring charge in 2009.
Outlook For 2012, sales are expected to increase with photovoltaics and consumer electronics demand recovering in the second half 2012. Volume growthis expected through new and innovative products, as well as capacity investments in Tedlar® completed in 2011 to meet global demand. Earnings are expectedto increase reflecting the impact of higher volume, new product introductions and productivity initiatives.
INDUSTRIAL BIOSCIENCES
(Dollars in millions) 2011 2010 2009
Segment sales $ 705 $ — $ —
PTOI $ (1) $ — $ —
PTOI margin — % —% —%
Sales and PTOI primarily reflects the acquisition of Danisco's enzyme business. PTOI included a $70 million charge for the fair value step-up of inventoriesthat were acquired as part of the acquisition and a $9 million restructuring charge. PTOI also included $12 million of amortization expense associated with thefair value step-up of the acquired intangible assets.
Outlook 2012 sales and earnings will reflect a full year of results from the enzyme business acquired from Danisco in 2011. Science-based innovationgrowth, cost synergies derived from integration, productivity gains and the absence of charges for transaction and integration related costs in 2011 areexpected to contribute to earnings. Volume growth is supported by expansion
22
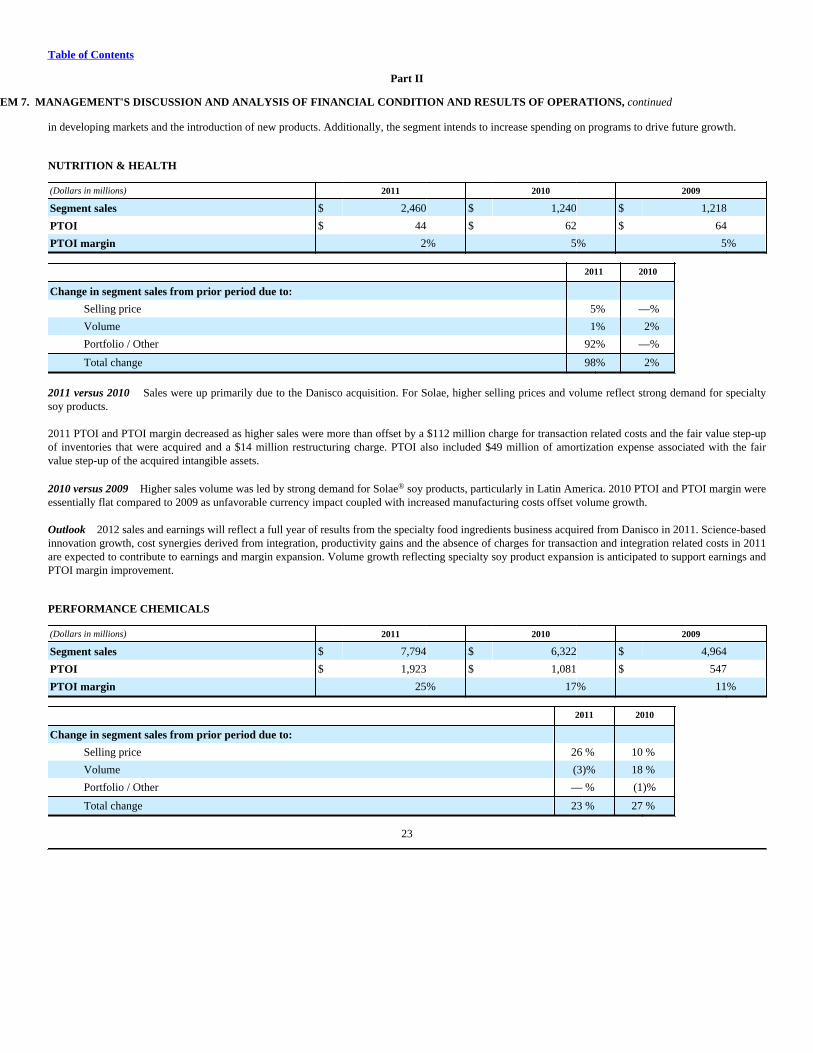
Table of Contents
Part II
ITEM 7. MANAGEMENT'S DISCUSSION AND ANALYSIS OF FINANCIAL CONDITION AND RESULTS OF OPERATIONS, continued
in developing markets and the introduction of new products. Additionally, the segment intends to increase spending on programs to drive future growth.
NUTRITION & HEALTH
(Dollars in millions) 2011 2010 2009
Segment sales $ 2,460 $ 1,240 $ 1,218
PTOI $ 44 $ 62 $ 64
PTOI margin 2% 5% 5%
2011 2010
Change in segment sales from prior period due to:
Selling price 5% —%
Volume 1% 2%
Portfolio / Other 92% —%
Total change 98% 2%
2011 versus 2010 Sales were up primarily due to the Danisco acquisition. For Solae, higher selling prices and volume reflect strong demand for specialtysoy products. 2011 PTOI and PTOI margin decreased as higher sales were more than offset by a $112 million charge for transaction related costs and the fair value step-upof inventories that were acquired and a $14 million restructuring charge. PTOI also included $49 million of amortization expense associated with the fairvalue step-up of the acquired intangible assets.
2010 versus 2009 Higher sales volume was led by strong demand for Solae® soy products, particularly in Latin America. 2010 PTOI and PTOI margin wereessentially flat compared to 2009 as unfavorable currency impact coupled with increased manufacturing costs offset volume growth.
Outlook 2012 sales and earnings will reflect a full year of results from the specialty food ingredients business acquired from Danisco in 2011. Science-basedinnovation growth, cost synergies derived from integration, productivity gains and the absence of charges for transaction and integration related costs in 2011are expected to contribute to earnings and margin expansion. Volume growth reflecting specialty soy product expansion is anticipated to support earnings andPTOI margin improvement.
PERFORMANCE CHEMICALS
(Dollars in millions) 2011 2010 2009
Segment sales $ 7,794 $ 6,322 $ 4,964
PTOI $ 1,923 $ 1,081 $ 547
PTOI margin 25% 17% 11%
2011 2010
Change in segment sales from prior period due to:
Selling price 26 % 10 %
Volume (3)% 18 %
Portfolio / Other — % (1)%
Total change 23 % 27 %
23
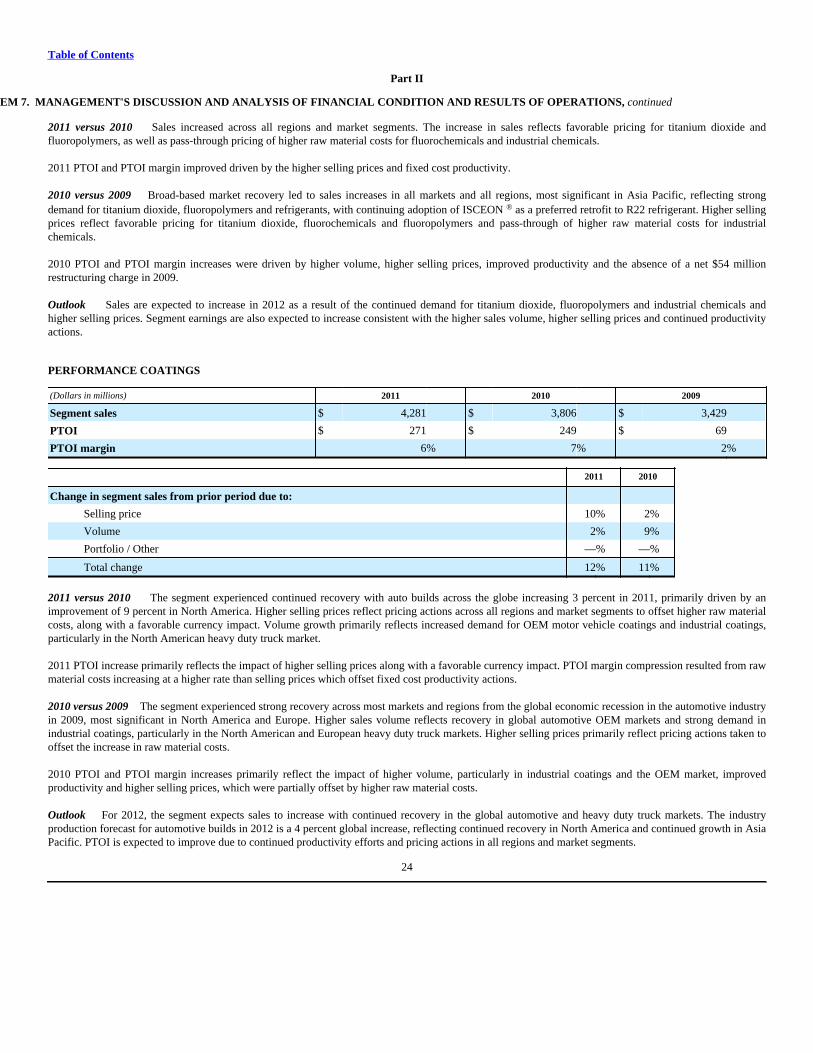
Table of Contents
Part II
ITEM 7. MANAGEMENT'S DISCUSSION AND ANALYSIS OF FINANCIAL CONDITION AND RESULTS OF OPERATIONS, continued
2011 versus 2010 Sales increased across all regions and market segments. The increase in sales reflects favorable pricing for titanium dioxide andfluoropolymers, as well as pass-through pricing of higher raw material costs for fluorochemicals and industrial chemicals. 2011 PTOI and PTOI margin improved driven by the higher selling prices and fixed cost productivity.
2010 versus 2009 Broad-based market recovery led to sales increases in all markets and all regions, most significant in Asia Pacific, reflecting strongdemand for titanium dioxide, fluoropolymers and refrigerants, with continuing adoption of ISCEON ® as a preferred retrofit to R22 refrigerant. Higher sellingprices reflect favorable pricing for titanium dioxide, fluorochemicals and fluoropolymers and pass-through of higher raw material costs for industrialchemicals.
2010 PTOI and PTOI margin increases were driven by higher volume, higher selling prices, improved productivity and the absence of a net $54 millionrestructuring charge in 2009.
Outlook Sales are expected to increase in 2012 as a result of the continued demand for titanium dioxide, fluoropolymers and industrial chemicals andhigher selling prices. Segment earnings are also expected to increase consistent with the higher sales volume, higher selling prices and continued productivityactions.
PERFORMANCE COATINGS
(Dollars in millions) 2011 2010 2009
Segment sales $ 4,281 $ 3,806 $ 3,429
PTOI $ 271 $ 249 $ 69
PTOI margin 6% 7% 2%
2011 2010
Change in segment sales from prior period due to:
Selling price 10% 2%
Volume 2% 9%
Portfolio / Other —% —%
Total change 12% 11%
2011 versus 2010 The segment experienced continued recovery with auto builds across the globe increasing 3 percent in 2011, primarily driven by animprovement of 9 percent in North America. Higher selling prices reflect pricing actions across all regions and market segments to offset higher raw materialcosts, along with a favorable currency impact. Volume growth primarily reflects increased demand for OEM motor vehicle coatings and industrial coatings,particularly in the North American heavy duty truck market. 2011 PTOI increase primarily reflects the impact of higher selling prices along with a favorable currency impact. PTOI margin compression resulted from rawmaterial costs increasing at a higher rate than selling prices which offset fixed cost productivity actions.
2010 versus 2009 The segment experienced strong recovery across most markets and regions from the global economic recession in the automotive industryin 2009, most significant in North America and Europe. Higher sales volume reflects recovery in global automotive OEM markets and strong demand inindustrial coatings, particularly in the North American and European heavy duty truck markets. Higher selling prices primarily reflect pricing actions taken tooffset the increase in raw material costs.
2010 PTOI and PTOI margin increases primarily reflect the impact of higher volume, particularly in industrial coatings and the OEM market, improvedproductivity and higher selling prices, which were partially offset by higher raw material costs.
Outlook For 2012, the segment expects sales to increase with continued recovery in the global automotive and heavy duty truck markets. The industryproduction forecast for automotive builds in 2012 is a 4 percent global increase, reflecting continued recovery in North America and continued growth in AsiaPacific. PTOI is expected to improve due to continued productivity efforts and pricing actions in all regions and market segments.
24
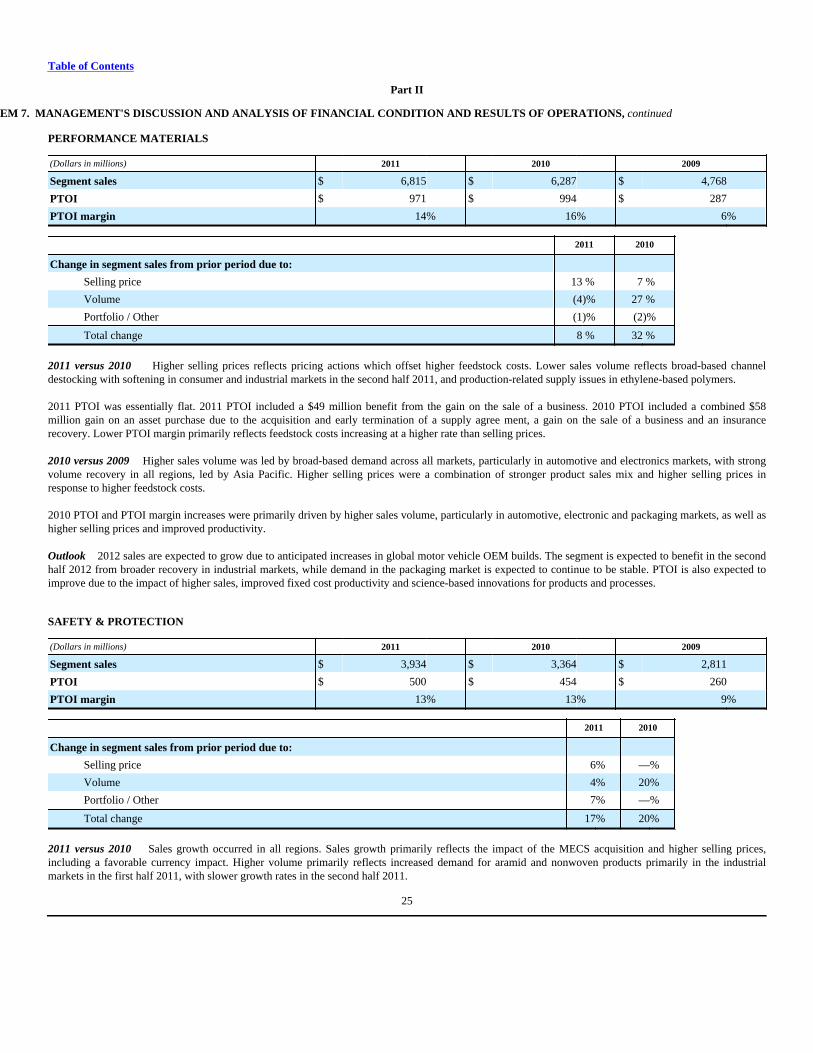
Table of Contents
Part II
ITEM 7. MANAGEMENT'S DISCUSSION AND ANALYSIS OF FINANCIAL CONDITION AND RESULTS OF OPERATIONS, continued
PERFORMANCE MATERIALS
(Dollars in millions) 2011 2010 2009
Segment sales $ 6,815 $ 6,287 $ 4,768
PTOI $ 971 $ 994 $ 287
PTOI margin 14% 16% 6%
2011 2010
Change in segment sales from prior period due to:
Selling price 13 % 7 %
Volume (4)% 27 %
Portfolio / Other (1)% (2)%
Total change 8 % 32 %
2011 versus 2010 Higher selling prices reflects pricing actions which offset higher feedstock costs. Lower sales volume reflects broad-based channeldestocking with softening in consumer and industrial markets in the second half 2011, and production-related supply issues in ethylene-based polymers. 2011 PTOI was essentially flat. 2011 PTOI included a $49 million benefit from the gain on the sale of a business. 2010 PTOI included a combined $58million gain on an asset purchase due to the acquisition and early termination of a supply agree ment, a gain on the sale of a business and an insurancerecovery. Lower PTOI margin primarily reflects feedstock costs increasing at a higher rate than selling prices.
2010 versus 2009 Higher sales volume was led by broad-based demand across all markets, particularly in automotive and electronics markets, with strongvolume recovery in all regions, led by Asia Pacific. Higher selling prices were a combination of stronger product sales mix and higher selling prices inresponse to higher feedstock costs.
2010 PTOI and PTOI margin increases were primarily driven by higher sales volume, particularly in automotive, electronic and packaging markets, as well ashigher selling prices and improved productivity.
Outlook 2012 sales are expected to grow due to anticipated increases in global motor vehicle OEM builds. The segment is expected to benefit in the secondhalf 2012 from broader recovery in industrial markets, while demand in the packaging market is expected to continue to be stable. PTOI is also expected toimprove due to the impact of higher sales, improved fixed cost productivity and science-based innovations for products and processes.
SAFETY & PROTECTION
(Dollars in millions) 2011 2010 2009
Segment sales $ 3,934 $ 3,364 $ 2,811
PTOI $ 500 $ 454 $ 260
PTOI margin 13% 13% 9%
2011 2010
Change in segment sales from prior period due to:
Selling price 6% —%
Volume 4% 20%
Portfolio / Other 7% —%
Total change 17% 20%
2011 versus 2010 Sales growth occurred in all regions. Sales growth primarily reflects the impact of the MECS acquisition and higher selling prices,including a favorable currency impact. Higher volume primarily reflects increased demand for aramid and nonwoven products primarily in the industrialmarkets in the first half 2011, with slower growth rates in the second half 2011.
25
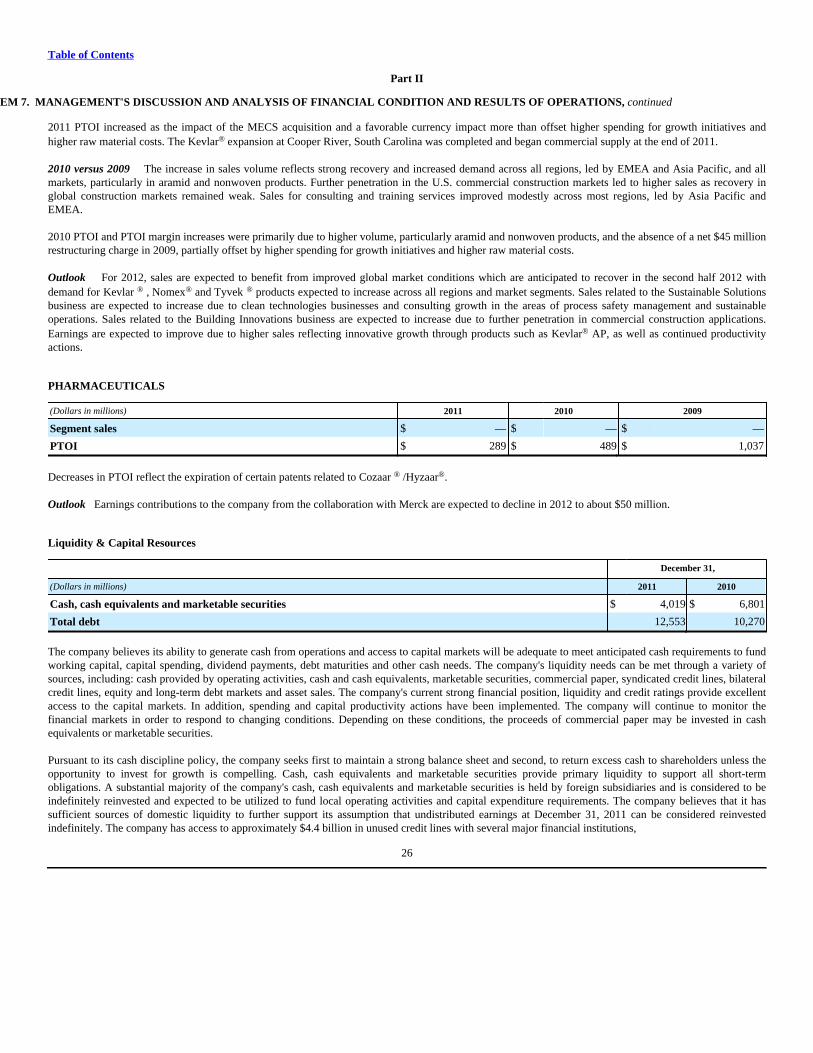
Table of Contents
Part II
ITEM 7. MANAGEMENT'S DISCUSSION AND ANALYSIS OF FINANCIAL CONDITION AND RESULTS OF OPERATIONS, continued
2011 PTOI increased as the impact of the MECS acquisition and a favorable currency impact more than offset higher spending for growth initiatives andhigher raw material costs. The Kevlar® expansion at Cooper River, South Carolina was completed and began commercial supply at the end of 2011.
2010 versus 2009 The increase in sales volume reflects strong recovery and increased demand across all regions, led by EMEA and Asia Pacific, and allmarkets, particularly in aramid and nonwoven products. Further penetration in the U.S. commercial construction markets led to higher sales as recovery inglobal construction markets remained weak. Sales for consulting and training services improved modestly across most regions, led by Asia Pacific andEMEA.
2010 PTOI and PTOI margin increases were primarily due to higher volume, particularly aramid and nonwoven products, and the absence of a net $45 millionrestructuring charge in 2009, partially offset by higher spending for growth initiatives and higher raw material costs.
Outlook For 2012, sales are expected to benefit from improved global market conditions which are anticipated to recover in the second half 2012 withdemand for Kevlar ® , Nomex® and Tyvek ® products expected to increase across all regions and market segments. Sales related to the Sustainable Solutionsbusiness are expected to increase due to clean technologies businesses and consulting growth in the areas of process safety management and sustainableoperations. Sales related to the Building Innovations business are expected to increase due to further penetration in commercial construction applications.Earnings are expected to improve due to higher sales reflecting innovative growth through products such as Kevlar® AP, as well as continued productivityactions.
PHARMACEUTICALS
(Dollars in millions) 2011 2010 2009
Segment sales $ — $ — $ —
PTOI $ 289 $ 489 $ 1,037
Decreases in PTOI reflect the expiration of certain patents related to Cozaar ® /Hyzaar®.
Outlook Earnings contributions to the company from the collaboration with Merck are expected to decline in 2012 to about $50 million.
Liquidity & Capital Resources
December 31,
(Dollars in millions) 2011 2010
Cash, cash equivalents and marketable securities $ 4,019 $ 6,801
Total debt 12,553 10,270
The company believes its ability to generate cash from operations and access to capital markets will be adequate to meet anticipated cash requirements to fundworking capital, capital spending, dividend payments, debt maturities and other cash needs. The company's liquidity needs can be met through a variety ofsources, including: cash provided by operating activities, cash and cash equivalents, marketable securities, commercial paper, syndicated credit lines, bilateralcredit lines, equity and long-term debt markets and asset sales. The company's current strong financial position, liquidity and credit ratings provide excellentaccess to the capital markets. In addition, spending and capital productivity actions have been implemented. The company will continue to monitor thefinancial markets in order to respond to changing conditions. Depending on these conditions, the proceeds of commercial paper may be invested in cashequivalents or marketable securities.
Pursuant to its cash discipline policy, the company seeks first to maintain a strong balance sheet and second, to return excess cash to shareholders unless theopportunity to invest for growth is compelling. Cash, cash equivalents and marketable securities provide primary liquidity to support all short-termobligations. A substantial majority of the company's cash, cash equivalents and marketable securities is held by foreign subsidiaries and is considered to beindefinitely reinvested and expected to be utilized to fund local operating activities and capital expenditure requirements. The company believes that it hassufficient sources of domestic liquidity to further support its assumption that undistributed earnings at December 31, 2011 can be considered reinvestedindefinitely. The company has access to approximately $4.4 billion in unused credit lines with several major financial institutions,
26
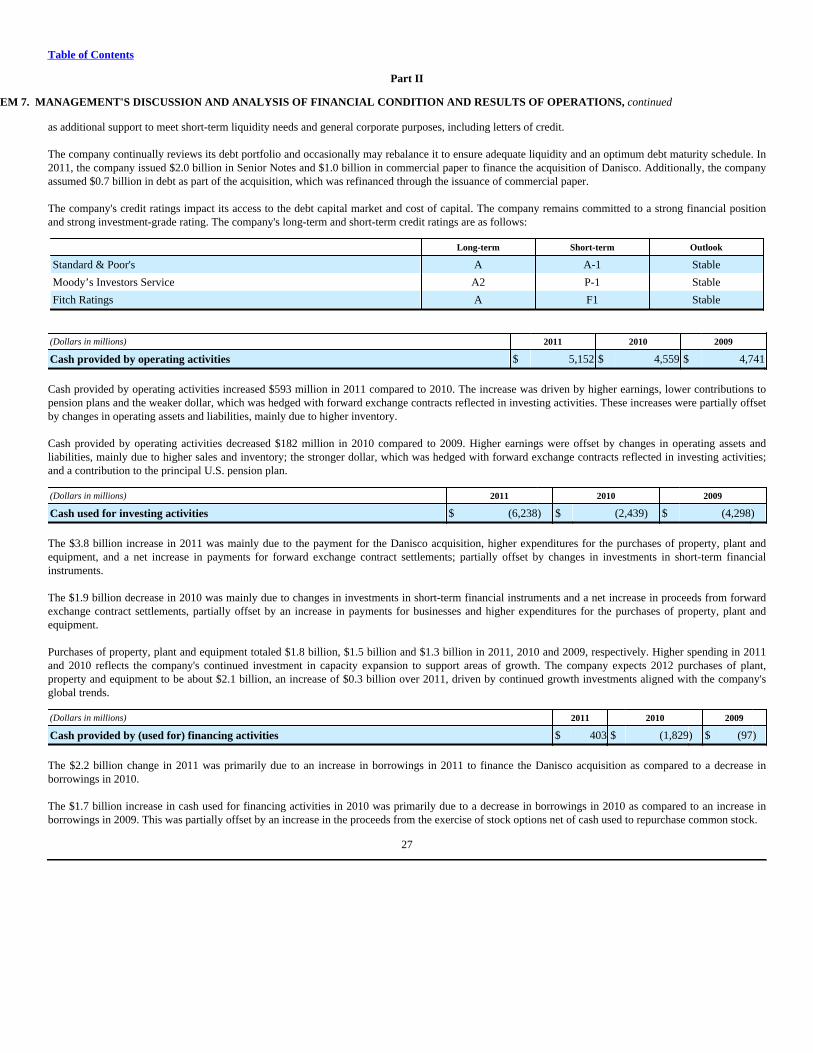
Table of Contents
Part II
ITEM 7. MANAGEMENT'S DISCUSSION AND ANALYSIS OF FINANCIAL CONDITION AND RESULTS OF OPERATIONS, continued
as additional support to meet short-term liquidity needs and general corporate purposes, including letters of credit.
The company continually reviews its debt portfolio and occasionally may rebalance it to ensure adequate liquidity and an optimum debt maturity schedule. In2011, the company issued $2.0 billion in Senior Notes and $1.0 billion in commercial paper to finance the acquisition of Danisco. Additionally, the companyassumed $0.7 billion in debt as part of the acquisition, which was refinanced through the issuance of commercial paper.
The company's credit ratings impact its access to the debt capital market and cost of capital. The company remains committed to a strong financial positionand strong investment-grade rating. The company's long-term and short-term credit ratings are as follows:
Long-term Short-term Outlook
Standard & Poor's A A-1 Stable
Moody’s Investors Service A2 P-1 Stable
Fitch Ratings A F1 Stable
(Dollars in millions) 2011 2010 2009
Cash provided by operating activities $ 5,152 $ 4,559 $ 4,741
Cash provided by operating activities increased $593 million in 2011 compared to 2010. The increase was driven by higher earnings, lower contributions topension plans and the weaker dollar, which was hedged with forward exchange contracts reflected in investing activities. These increases were partially offsetby changes in operating assets and liabilities, mainly due to higher inventory.
Cash provided by operating activities decreased $182 million in 2010 compared to 2009. Higher earnings were offset by changes in operating assets andliabilities, mainly due to higher sales and inventory; the stronger dollar, which was hedged with forward exchange contracts reflected in investing activities;and a contribution to the principal U.S. pension plan.
(Dollars in millions) 2011 2010 2009
Cash used for investing activities $ (6,238) $ (2,439) $ (4,298)
The $3.8 billion increase in 2011 was mainly due to the payment for the Danisco acquisition, higher expenditures for the purchases of property, plant andequipment, and a net increase in payments for forward exchange contract settlements; partially offset by changes in investments in short-term financialinstruments.
The $1.9 billion decrease in 2010 was mainly due to changes in investments in short-term financial instruments and a net increase in proceeds from forwardexchange contract settlements, partially offset by an increase in payments for businesses and higher expenditures for the purchases of property, plant andequipment.
Purchases of property, plant and equipment totaled $1.8 billion, $1.5 billion and $1.3 billion in 2011, 2010 and 2009, respectively. Higher spending in 2011and 2010 reflects the company's continued investment in capacity expansion to support areas of growth. The company expects 2012 purchases of plant,property and equipment to be about $2.1 billion, an increase of $0.3 billion over 2011, driven by continued growth investments aligned with the company'sglobal trends.
(Dollars in millions) 2011 2010 2009
Cash provided by (used for) financing activities $ 403 $ (1,829) $ (97)
The $2.2 billion change in 2011 was primarily due to an increase in borrowings in 2011 to finance the Danisco acquisition as compared to a decrease inborrowings in 2010.
The $1.7 billion increase in cash used for financing activities in 2010 was primarily due to a decrease in borrowings in 2010 as compared to an increase inborrowings in 2009. This was partially offset by an increase in the proceeds from the exercise of stock options net of cash used to repurchase common stock.
27
Table of Contents
Part II
ITEM 7. MANAGEMENT'S DISCUSSION AND ANALYSIS OF FINANCIAL CONDITION AND RESULTS OF OPERATIONS, continued
Dividends paid to common and preferred shareholders were $1.5 billion in 2011, 2010 and 2009. Dividends per share of common stock were $1.64 in 2011,2010 and 2009. The common dividend declared in the first quarter 2012 was the company's 430th consecutive dividend since the company's first dividend inthe fourth quarter 1904.
The company's Board of Directors authorized a $2 billion share buyback plan in June 2001. During 2011, the company purchased and retired 13.8 millionshares at a total cost of $672 million under this plan. During 2010, the company purchased and retired 5.4 million shares at a total cost of $250 million underthis plan. During 2009, there were no purchases of stock under this plan. As of December 31, 2011, the company has purchased 39.7 million shares at a totalcost of $1.9 billion. In April 2011, the company's Board of Directors authorized a $2 billion share buyback plan. This plan will not commence until the planauthorized in June 2001 is completed. There is no expiration date on the current authorizations.
(Dollars in millions) 2011 2010 2009
Cash provided by operating activities $ 5,152 $ 4,559 $ 4,741
Purchases of property, plant and equipment (1,843) (1,508) (1,308)
Free cash flow $ 3,309 $ 3,051 $ 3,433
Free cash flow is a measurement not recognized in accordance with generally accepted accounting principles in the U.S. (GAAP) and should not be viewed asan alternative to GAAP measures of performance. All companies do not calculate non-GAAP financial measures in the same manner and, accordingly, thecompany's free cash flow definition may not be consistent with the methodologies used by other companies. The company defines free cash flow as cashprovided by operating activities less purchases of property, plant and equipment, and therefore indicates operating cash flow available for payment ofdividends, other investing activities and other financing activities. Free cash flow is useful to investors and management to evaluate the company's cash flowand financial performance, and is an integral financial measure used in the company's financial planning process.
Critical Accounting EstimatesThe company's significant accounting policies are more fully described in Note 1 to the Consolidated Financial Statements. Management believes that theapplication of these policies on a consistent basis enables the company to provide the users of the financial statements with useful and reliable informationabout the company's operating results and financial condition.
The preparation of the Consolidated Financial Statements in conformity with GAAP requires management to make estimates and assumptions that affect thereported amounts, including, but not limited to, receivable and inventory valuations, impairment of tangible and intangible assets, long-term employee benefitobligations, income taxes, restructuring liabilities, environmental matters and litigation. Management's estimates are based on historical experience, facts andcircumstances available at the time and various other assumptions that are believed to be reasonable. The company reviews these matters and reflects changesin estimates as appropriate. Management believes that the following represents some of the more critical judgment areas in the application of the company'saccounting policies which could have a material effect on the company's financial position, liquidity or results of operations.
Long-term Employee BenefitsAccounting for employee benefit plans involves numerous assumptions and estimates. Discount rate and expected return on plan assets are two criticalassumptions in measuring the cost and benefit obligation of the company's pension and other long-term employee benefit plans. Management reviews thesetwo key assumptions annually as of December 31st. These and other assumptions are updated periodically to reflect the actual experience and expectations ona plan specific basis as appropriate. As permitted by GAAP, actual results that differ from the assumptions are accumulated on a plan by plan basis and to theextent that such differences exceed 10 percent of the greater of the plan obligations or the applicable plan assets, the excess is amortized over the averageremaining service period of active employees.
About 80 percent of the company's benefit obligation for pensions and essentially all of the company's other long-term employee benefit obligations areattributable to the benefit plans in the U.S. The company utilizes published long-term high quality corporate bond indices to determine the discount rate atmeasurement date. Where commonly available, the company considers indices of various durations to reflect the timing of future benefit payments.
Within the U.S., the company establishes strategic asset allocation percentage targets and appropriate benchmarks for significant asset classes with the aim ofachieving a prudent balance between return and risk. Strategic asset allocations in other countries are selected in accordance with the laws and practices ofthose countries. Where appropriate, asset-liability studies are also taken into
28
Table of Contents
Part II
ITEM 7. MANAGEMENT'S DISCUSSION AND ANALYSIS OF FINANCIAL CONDITION AND RESULTS OF OPERATIONS, continued
consideration. The long-term expected return on plan assets in the U.S. is based upon historical real returns (net of inflation) for the asset classes covered bythe investment policy, expected performance, and projections of inflation over the long-term period during which benefits are payable to plan participants.Consistent with prior years, the long-term expected return on plan assets in the U.S. reflects the asset allocation of the plan and the effect of the company'sactive management of the plans' assets.
In determining annual expense for the principal U.S. pension plan, the company uses a market-related value of assets rather than its fair value. The market-related value of assets is calculated by averaging market returns over 36 months. Accordingly, there may be a lag in recognition of changes in marketvaluation. As a result, changes in the fair value of assets are not immediately reflected in the company's calculation of net periodic pension cost. Thefollowing table shows the market-related value and fair value of plan assets for the principal U.S. pension plan:
(Dollars in billions) 2011 2010 2009
Market-related value of assets $ 13.9 $ 13.9 $ 14.0
Fair value of plan assets 13.9 14.8 13.9
For plans other than the principal U.S. pension plan, pension expense is typically determined using the fair value of assets.
The following table highlights the potential impact on the company's pre-tax earnings due to changes in certain key assumptions with respect to the company'spension and other long-term employee benefit plans, based on assets and liabilities at December 31, 2011 :
Pre-tax Earnings Benefit (Charge)(Dollars in millions)
1/2 PercentagePoint
Increase
1/2 PercentagePoint
Decrease
Discount rate $ 97 $ (101)
Expected rate of return on plan assets 88 (88)
Additional information with respect to pension and other long-term employee benefits expenses, liabilities and assumptions is discussed under "Long-termEmployee Benefits" beginning on page 32 and in Note 17 to the Consolidated Financial Statements.
Environmental MattersDuPont accrues for remediation activities when it is probable that a liability has been incurred and a reasonable estimate of the liability can be made. Thecompany has recorded a liability of $416 million in the Consolidated Balance Sheet as of December 31, 2011; these accrued liabilities exclude claims againstthird parties and are not discounted. As remediation activities vary substantially in duration and cost from site to site, it is difficult to develop precise estimatesof future site remediation costs. The company's estimates are based on a number of factors, including the complexity of the geology, the nature and extent ofcontamination, the type of remedy, the outcome of discussions with regulatory agencies and other PRPs at multi-party sites and the number of and financialviability of other PRPs. Therefore, considerable uncertainty exists with respect to environmental remediation costs and, under adverse changes incircumstances, the potential liability may range up to three times the amount accrued.
Legal ContingenciesThe company's results of operations could be affected by significant litigation adverse to the company, including product liability claims, patent infringementand antitrust claims, and claims for third party property damage or personal injury stemming from alleged environmental torts. The company records accrualsfor legal matters when the information available indicates that it is probable that a liability has been incurred and the amount of the loss can be reasonablyestimated. Management makes adjustments to these accruals to reflect the impact and status of negotiations, settlements, rulings, advice of counsel and otherinformation and events that may pertain to a particular matter. Predicting the outcome of claims and lawsuits and estimating related costs and exposureinvolves substantial uncertainties that could cause actual costs to vary materially from estimates. In making determinations of likely outcomes of litigationmatters, management considers many factors. These factors include, but are not limited to, the nature of specific claims including unasserted claims, thecompany's experience with similar types of claims, the jurisdiction in which the matter is filed, input from outside legal counsel, the likelihood of resolvingthe matter through alternative dispute resolution mechanisms and the matter's current status. Considerable judgment is required in determining whether toestablish a litigation accrual when an adverse judgment is rendered against the company in a court proceeding. In such situations, the company will notrecognize a loss if, based upon a thorough review of all relevant facts and information, management believes that it is
29
Table of Contents
Part II
ITEM 7. MANAGEMENT'S DISCUSSION AND ANALYSIS OF FINANCIAL CONDITION AND RESULTS OF OPERATIONS, continued
probable that the pending judgment will be successfully overturned on appeal. A detailed discussion of significant litigation matters is contained in Note 15 tothe Consolidated Financial Statements.
Income TaxesThe breadth of the company's operations and the global complexity of tax regulations require assessments of uncertainties and judgments in estimating taxesthe company will ultimately pay. The final taxes paid are dependent upon many factors, including negotiations with taxing authorities in various jurisdictions,outcomes of tax litigation and resolution of disputes arising from federal, state and international tax audits in the normal course of business. The resolution ofthese uncertainties may result in adjustments to the company's tax assets and tax liabilities. It is reasonably possible that changes to the company's globalunrecognized tax benefits could be significant, however, due to the uncertainty regarding the timing of completion of audits and possible outcomes, a currentestimate of the range of increases or decreases that may occur within the next twelve months cannot be made.
Deferred income taxes result from differences between the financial and tax basis of the company's assets and liabilities and are adjusted for changes in taxrates and tax laws when changes are enacted. Valuation allowances are recorded to reduce deferred tax assets when it is more likely than not that a tax benefitwill not be realized. Significant judgment is required in evaluating the need for and magnitude of appropriate valuation allowances against deferred tax assets.The realization of these assets is dependent on generating future taxable income, as well as successful implementation of various tax planning strategies. Forexample, changes in facts and circumstances that alter the probability that the company will realize deferred tax assets could result in recording a valuationallowance, thereby reducing the deferred tax asset and generating a deferred tax expense in the relevant period. In some situations these changes could bematerial.
At December 31, 2011 , the company had a deferred tax asset balance of $8.0 billion, net of valuation allowance of $2.0 billion. Realization of these assets isexpected to occur over an extended period of time. As a result, changes in tax laws, assumptions with respect to future taxable income, and tax planningstrategies could result in adjustments to these assets. See Note 5 to the Consolidated Financial Statements for additional details related to the deferred tax assetbalance.
Valuation of AssetsThe assets and liabilities of acquired businesses are measured at their estimated fair values at the dates of acquisition. The excess of the purchase price overthe estimated fair value of the net assets acquired, including identified intangibles, is recorded as goodwill. The determination and allocation of fair value tothe assets acquired and liabilities assumed is based on various assumptions and valuation methodologies requiring considerable management judgment,including estimates based on historical information, current market data and future expectations. The principal assumptions utilized in the company'svaluation methodologies include revenue growth rates, operating margin estimates and discount rates. Although the estimates were deemed reasonable bymanagement based on information available at the dates of acquisition, those estimates are inherently uncertain.
Assessment of the potential impairment of property, plant and equipment, goodwill, other intangible assets and investments in affiliates is an integral part ofthe company's normal ongoing review of operations. Testing for potential impairment of these assets is significantly dependent on numerous assumptions andreflects management's best estimates at a particular point in time. The dynamic economic environments in which the company's diversified businesses operate,and key economic and business assumptions with respect to projected selling prices, market growth and inflation rates, can significantly affect the outcome ofimpairment tests. Estimates based on these assumptions may differ significantly from actual results. Changes in factors and assumptions used in assessingpotential impairments can have a significant impact on the existence and magnitude of impairments, as well as the time in which such impairments arerecognized.
Based on the results of the company's annual goodwill impairment test in 2011, no impairments exist at this time. The company's methodology for estimatingthe fair value of its reporting units is using the income approach based on the present value of future cash flows. The income approach has been generallysupported by additional market transaction analyses. There can be no assurance that the company's estimates and assumptions regarding forecasted cash flowand revenue and operating income growth rates made for purposes of the annual goodwill impairment test will prove to be accurate predictions of the future.The company believes the current assumptions and estimates utilized are both reasonable and appropriate.
30
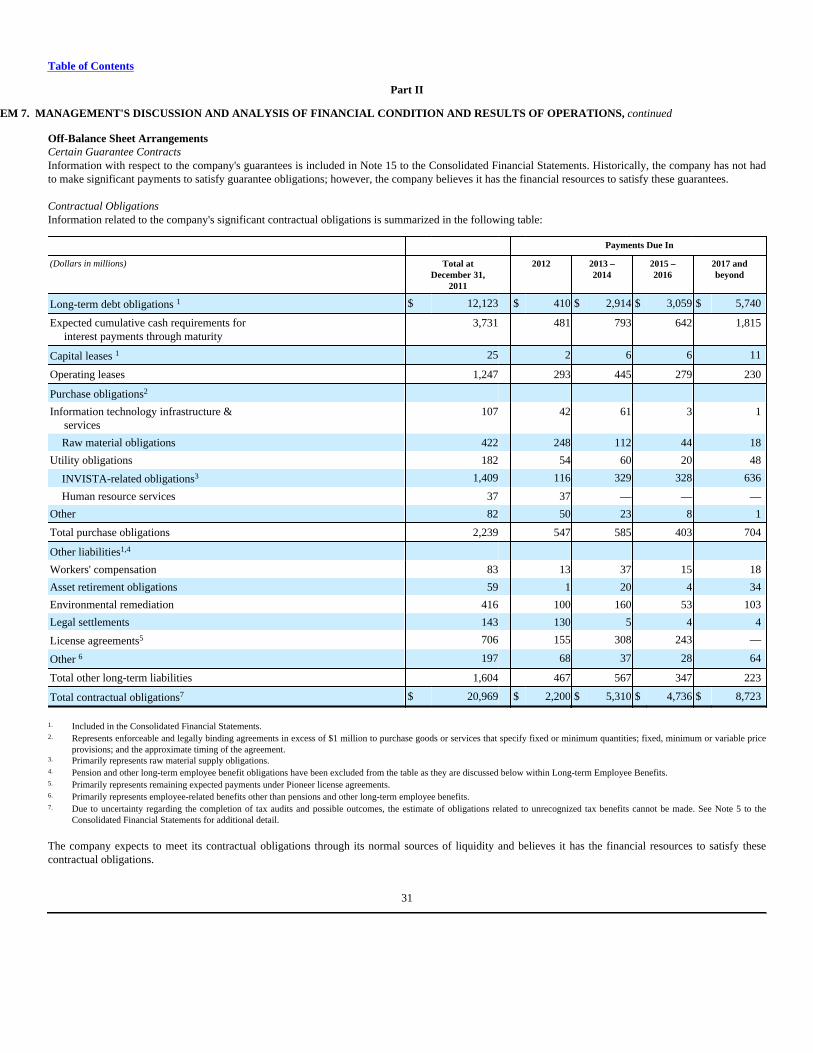
Table of Contents
Part II
ITEM 7. MANAGEMENT'S DISCUSSION AND ANALYSIS OF FINANCIAL CONDITION AND RESULTS OF OPERATIONS, continued
Off-Balance Sheet ArrangementsCertain Guarantee ContractsInformation with respect to the company's guarantees is included in Note 15 to the Consolidated Financial Statements. Historically, the company has not hadto make significant payments to satisfy guarantee obligations; however, the company believes it has the financial resources to satisfy these guarantees.
Contractual ObligationsInformation related to the company's significant contractual obligations is summarized in the following table:
Payments Due In
(Dollars in millions) Total atDecember 31,
2011
2012 2013 –2014
2015 –2016
2017 andbeyond
Long-term debt obligations 1 $ 12,123 $ 410 $ 2,914 $ 3,059 $ 5,740
Expected cumulative cash requirements for interest payments through maturity
3,731 481 793 642 1,815
Capital leases 1 25 2 6 6 11
Operating leases 1,247 293 445 279 230
Purchase obligations2
Information technology infrastructure & services
107 42 61 3 1
Raw material obligations 422 248 112 44 18
Utility obligations 182 54 60 20 48
INVISTA-related obligations3 1,409 116 329 328 636
Human resource services 37 37 — — —
Other 82 50 23 8 1
Total purchase obligations 2,239 547 585 403 704
Other liabilities1,4
Workers' compensation 83 13 37 15 18
Asset retirement obligations 59 1 20 4 34
Environmental remediation 416 100 160 53 103
Legal settlements 143 130 5 4 4
License agreements5 706 155 308 243 —
Other 6 197 68 37 28 64
Total other long-term liabilities 1,604 467 567 347 223
Total contractual obligations7 $ 20,969 $ 2,200 $ 5,310 $ 4,736 $ 8,723
1. Included in the Consolidated Financial Statements.2. Represents enforceable and legally binding agreements in excess of $1 million to purchase goods or services that specify fixed or minimum quantities; fixed, minimum or variable price
provisions; and the approximate timing of the agreement.3. Primarily represents raw material supply obligations.4. Pension and other long-term employee benefit obligations have been excluded from the table as they are discussed below within Long-term Employee Benefits.5. Primarily represents remaining expected payments under Pioneer license agreements.6. Primarily represents employee-related benefits other than pensions and other long-term employee benefits.7. Due to uncertainty regarding the completion of tax audits and possible outcomes, the estimate of obligations related to unrecognized tax benefits cannot be made. See Note 5 to the
Consolidated Financial Statements for additional detail.
The company expects to meet its contractual obligations through its normal sources of liquidity and believes it has the financial resources to satisfy thesecontractual obligations.
31
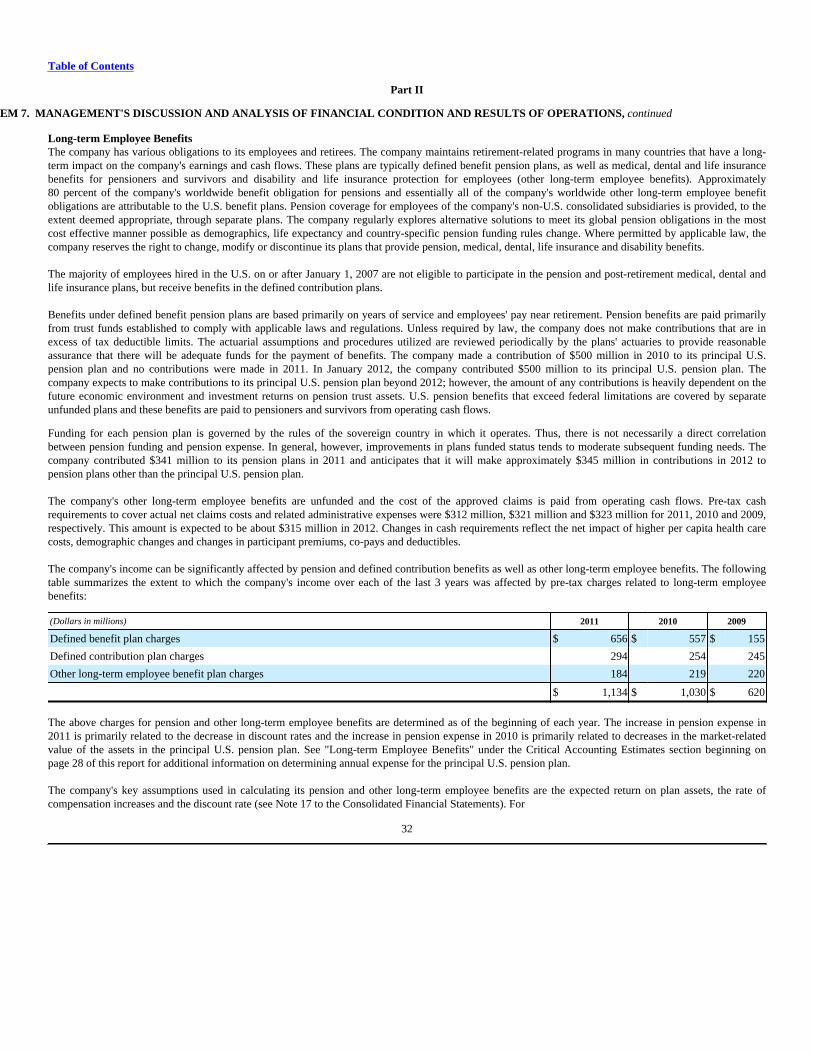
Table of Contents
Part II
ITEM 7. MANAGEMENT'S DISCUSSION AND ANALYSIS OF FINANCIAL CONDITION AND RESULTS OF OPERATIONS, continued
Long-term Employee BenefitsThe company has various obligations to its employees and retirees. The company maintains retirement-related programs in many countries that have a long-term impact on the company's earnings and cash flows. These plans are typically defined benefit pension plans, as well as medical, dental and life insurancebenefits for pensioners and survivors and disability and life insurance protection for employees (other long-term employee benefits). Approximately80 percent of the company's worldwide benefit obligation for pensions and essentially all of the company's worldwide other long-term employee benefitobligations are attributable to the U.S. benefit plans. Pension coverage for employees of the company's non-U.S. consolidated subsidiaries is provided, to theextent deemed appropriate, through separate plans. The company regularly explores alternative solutions to meet its global pension obligations in the mostcost effective manner possible as demographics, life expectancy and country-specific pension funding rules change. Where permitted by applicable law, thecompany reserves the right to change, modify or discontinue its plans that provide pension, medical, dental, life insurance and disability benefits.
The majority of employees hired in the U.S. on or after January 1, 2007 are not eligible to participate in the pension and post-retirement medical, dental andlife insurance plans, but receive benefits in the defined contribution plans.
Benefits under defined benefit pension plans are based primarily on years of service and employees' pay near retirement. Pension benefits are paid primarilyfrom trust funds established to comply with applicable laws and regulations. Unless required by law, the company does not make contributions that are inexcess of tax deductible limits. The actuarial assumptions and procedures utilized are reviewed periodically by the plans' actuaries to provide reasonableassurance that there will be adequate funds for the payment of benefits. The company made a contribution of $500 million in 2010 to its principal U.S.pension plan and no contributions were made in 2011. In January 2012, the company contributed $500 million to its principal U.S. pension plan. Thecompany expects to make contributions to its principal U.S. pension plan beyond 2012; however, the amount of any contributions is heavily dependent on thefuture economic environment and investment returns on pension trust assets. U.S. pension benefits that exceed federal limitations are covered by separateunfunded plans and these benefits are paid to pensioners and survivors from operating cash flows.
Funding for each pension plan is governed by the rules of the sovereign country in which it operates. Thus, there is not necessarily a direct correlationbetween pension funding and pension expense. In general, however, improvements in plans funded status tends to moderate subsequent funding needs. Thecompany contributed $341 million to its pension plans in 2011 and anticipates that it will make approximately $345 million in contributions in 2012 topension plans other than the principal U.S. pension plan.
The company's other long-term employee benefits are unfunded and the cost of the approved claims is paid from operating cash flows. Pre-tax cashrequirements to cover actual net claims costs and related administrative expenses were $312 million, $321 million and $323 million for 2011, 2010 and 2009,respectively. This amount is expected to be about $315 million in 2012. Changes in cash requirements reflect the net impact of higher per capita health carecosts, demographic changes and changes in participant premiums, co-pays and deductibles.
The company's income can be significantly affected by pension and defined contribution benefits as well as other long-term employee benefits. The followingtable summarizes the extent to which the company's income over each of the last 3 years was affected by pre-tax charges related to long-term employeebenefits:
(Dollars in millions) 2011 2010 2009
Defined benefit plan charges $ 656 $ 557 $ 155
Defined contribution plan charges 294 254 245
Other long-term employee benefit plan charges 184 219 220
$ 1,134 $ 1,030 $ 620
The above charges for pension and other long-term employee benefits are determined as of the beginning of each year. The increase in pension expense in2011 is primarily related to the decrease in discount rates and the increase in pension expense in 2010 is primarily related to decreases in the market-relatedvalue of the assets in the principal U.S. pension plan. See "Long-term Employee Benefits" under the Critical Accounting Estimates section beginning onpage 28 of this report for additional information on determining annual expense for the principal U.S. pension plan.
The company's key assumptions used in calculating its pension and other long-term employee benefits are the expected return on plan assets, the rate ofcompensation increases and the discount rate (see Note 17 to the Consolidated Financial Statements). For
32
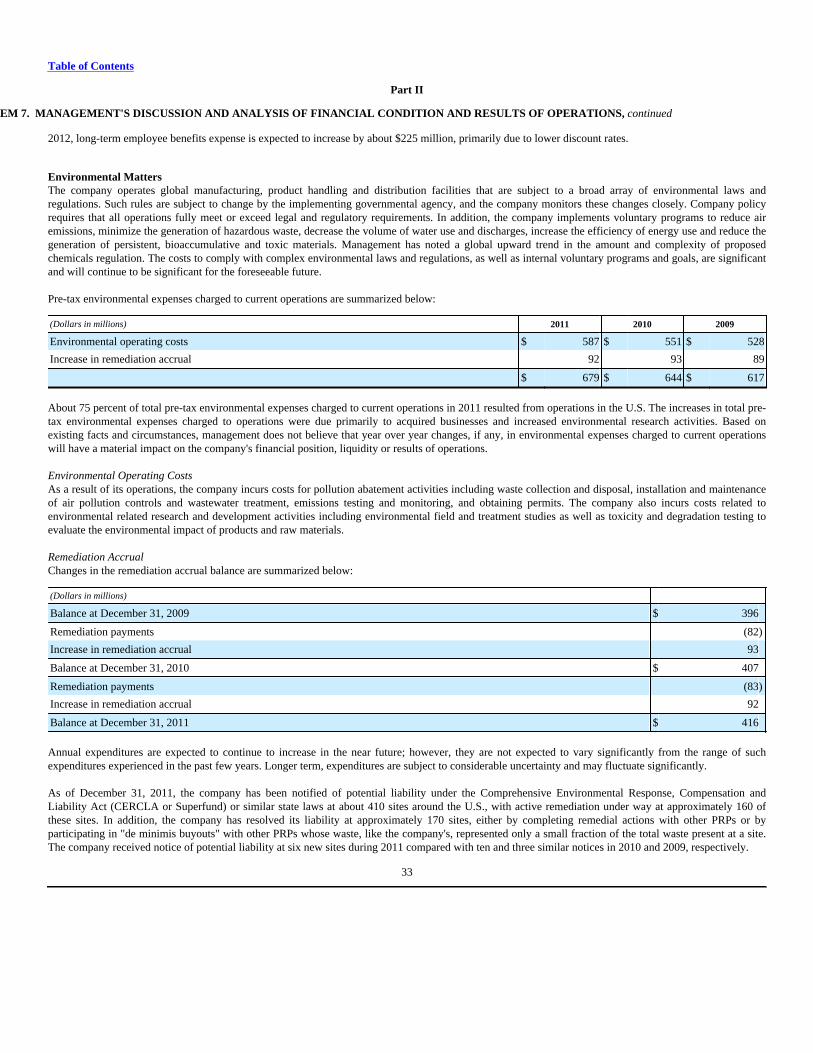
Table of Contents
Part II
ITEM 7. MANAGEMENT'S DISCUSSION AND ANALYSIS OF FINANCIAL CONDITION AND RESULTS OF OPERATIONS, continued
2012, long-term employee benefits expense is expected to increase by about $225 million, primarily due to lower discount rates.
Environmental MattersThe company operates global manufacturing, product handling and distribution facilities that are subject to a broad array of environmental laws andregulations. Such rules are subject to change by the implementing governmental agency, and the company monitors these changes closely. Company policyrequires that all operations fully meet or exceed legal and regulatory requirements. In addition, the company implements voluntary programs to reduce airemissions, minimize the generation of hazardous waste, decrease the volume of water use and discharges, increase the efficiency of energy use and reduce thegeneration of persistent, bioaccumulative and toxic materials. Management has noted a global upward trend in the amount and complexity of proposedchemicals regulation. The costs to comply with complex environmental laws and regulations, as well as internal voluntary programs and goals, are significantand will continue to be significant for the foreseeable future. Pre-tax environmental expenses charged to current operations are summarized below:
(Dollars in millions) 2011 2010 2009
Environmental operating costs $ 587 $ 551 $ 528
Increase in remediation accrual 92 93 89
$ 679 $ 644 $ 617
About 75 percent of total pre-tax environmental expenses charged to current operations in 2011 resulted from operations in the U.S. The increases in total pre-tax environmental expenses charged to operations were due primarily to acquired businesses and increased environmental research activities. Based onexisting facts and circumstances, management does not believe that year over year changes, if any, in environmental expenses charged to current operationswill have a material impact on the company's financial position, liquidity or results of operations.
Environmental Operating CostsAs a result of its operations, the company incurs costs for pollution abatement activities including waste collection and disposal, installation and maintenanceof air pollution controls and wastewater treatment, emissions testing and monitoring, and obtaining permits. The company also incurs costs related toenvironmental related research and development activities including environmental field and treatment studies as well as toxicity and degradation testing toevaluate the environmental impact of products and raw materials.
Remediation AccrualChanges in the remediation accrual balance are summarized below:
(Dollars in millions)
Balance at December 31, 2009 $ 396
Remediation payments (82)
Increase in remediation accrual 93
Balance at December 31, 2010 $ 407
Remediation payments (83)
Increase in remediation accrual 92
Balance at December 31, 2011 $ 416
Annual expenditures are expected to continue to increase in the near future; however, they are not expected to vary significantly from the range of suchexpenditures experienced in the past few years. Longer term, expenditures are subject to considerable uncertainty and may fluctuate significantly.
As of December 31, 2011, the company has been notified of potential liability under the Comprehensive Environmental Response, Compensation andLiability Act (CERCLA or Superfund) or similar state laws at about 410 sites around the U.S., with active remediation under way at approximately 160 ofthese sites. In addition, the company has resolved its liability at approximately 170 sites, either by completing remedial actions with other PRPs or byparticipating in "de minimis buyouts" with other PRPs whose waste, like the company's, represented only a small fraction of the total waste present at a site.The company received notice of potential liability at six new sites during 2011 compared with ten and three similar notices in 2010 and 2009, respectively.
33
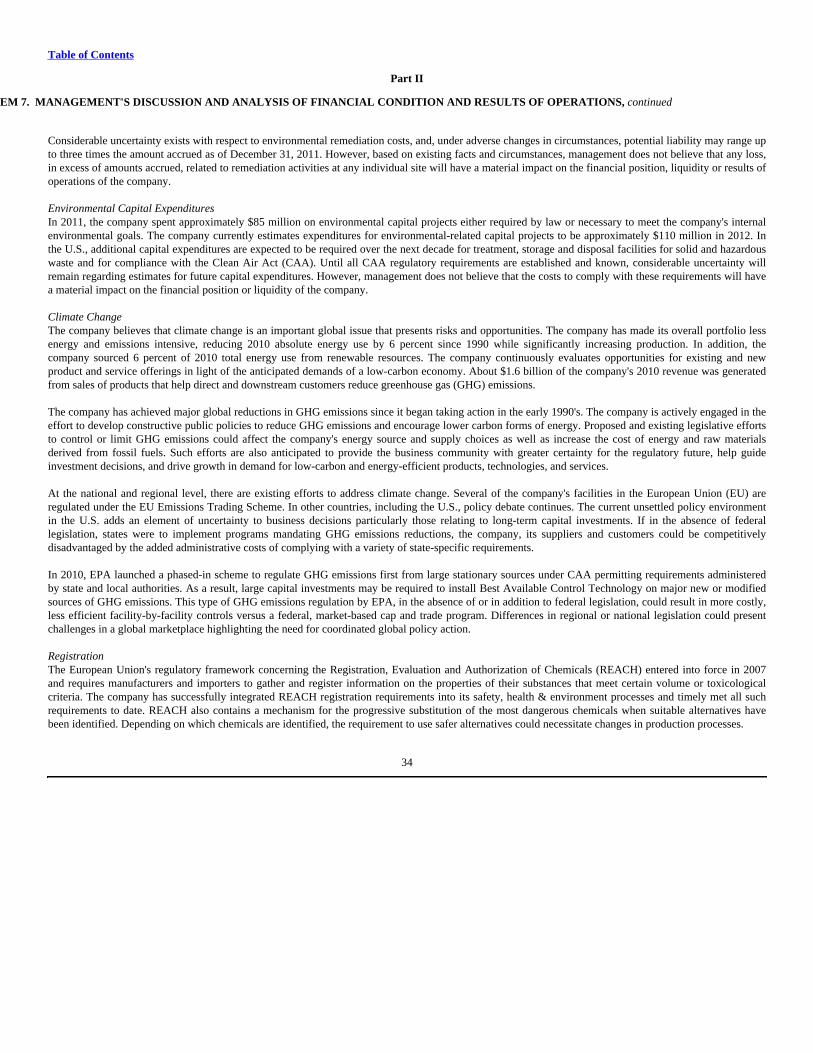
Table of Contents
Part II
ITEM 7. MANAGEMENT'S DISCUSSION AND ANALYSIS OF FINANCIAL CONDITION AND RESULTS OF OPERATIONS, continued
Considerable uncertainty exists with respect to environmental remediation costs, and, under adverse changes in circumstances, potential liability may range upto three times the amount accrued as of December 31, 2011. However, based on existing facts and circumstances, management does not believe that any loss,in excess of amounts accrued, related to remediation activities at any individual site will have a material impact on the financial position, liquidity or results ofoperations of the company.
Environmental Capital ExpendituresIn 2011, the company spent approximately $85 million on environmental capital projects either required by law or necessary to meet the company's internalenvironmental goals. The company currently estimates expenditures for environmental-related capital projects to be approximately $110 million in 2012. Inthe U.S., additional capital expenditures are expected to be required over the next decade for treatment, storage and disposal facilities for solid and hazardouswaste and for compliance with the Clean Air Act (CAA). Until all CAA regulatory requirements are established and known, considerable uncertainty willremain regarding estimates for future capital expenditures. However, management does not believe that the costs to comply with these requirements will havea material impact on the financial position or liquidity of the company.
Climate ChangeThe company believes that climate change is an important global issue that presents risks and opportunities. The company has made its overall portfolio lessenergy and emissions intensive, reducing 2010 absolute energy use by 6 percent since 1990 while significantly increasing production. In addition, thecompany sourced 6 percent of 2010 total energy use from renewable resources. The company continuously evaluates opportunities for existing and newproduct and service offerings in light of the anticipated demands of a low-carbon economy. About $1.6 billion of the company's 2010 revenue was generatedfrom sales of products that help direct and downstream customers reduce greenhouse gas (GHG) emissions.
The company has achieved major global reductions in GHG emissions since it began taking action in the early 1990's. The company is actively engaged in theeffort to develop constructive public policies to reduce GHG emissions and encourage lower carbon forms of energy. Proposed and existing legislative effortsto control or limit GHG emissions could affect the company's energy source and supply choices as well as increase the cost of energy and raw materialsderived from fossil fuels. Such efforts are also anticipated to provide the business community with greater certainty for the regulatory future, help guideinvestment decisions, and drive growth in demand for low-carbon and energy-efficient products, technologies, and services.
At the national and regional level, there are existing efforts to address climate change. Several of the company's facilities in the European Union (EU) areregulated under the EU Emissions Trading Scheme. In other countries, including the U.S., policy debate continues. The current unsettled policy environmentin the U.S. adds an element of uncertainty to business decisions particularly those relating to long-term capital investments. If in the absence of federallegislation, states were to implement programs mandating GHG emissions reductions, the company, its suppliers and customers could be competitivelydisadvantaged by the added administrative costs of complying with a variety of state-specific requirements.
In 2010, EPA launched a phased-in scheme to regulate GHG emissions first from large stationary sources under CAA permitting requirements administeredby state and local authorities. As a result, large capital investments may be required to install Best Available Control Technology on major new or modifiedsources of GHG emissions. This type of GHG emissions regulation by EPA, in the absence of or in addition to federal legislation, could result in more costly,less efficient facility-by-facility controls versus a federal, market-based cap and trade program. Differences in regional or national legislation could presentchallenges in a global marketplace highlighting the need for coordinated global policy action.
RegistrationThe European Union's regulatory framework concerning the Registration, Evaluation and Authorization of Chemicals (REACH) entered into force in 2007and requires manufacturers and importers to gather and register information on the properties of their substances that meet certain volume or toxicologicalcriteria. The company has successfully integrated REACH registration requirements into its safety, health & environment processes and timely met all suchrequirements to date. REACH also contains a mechanism for the progressive substitution of the most dangerous chemicals when suitable alternatives havebeen identified. Depending on which chemicals are identified, the requirement to use safer alternatives could necessitate changes in production processes.
34
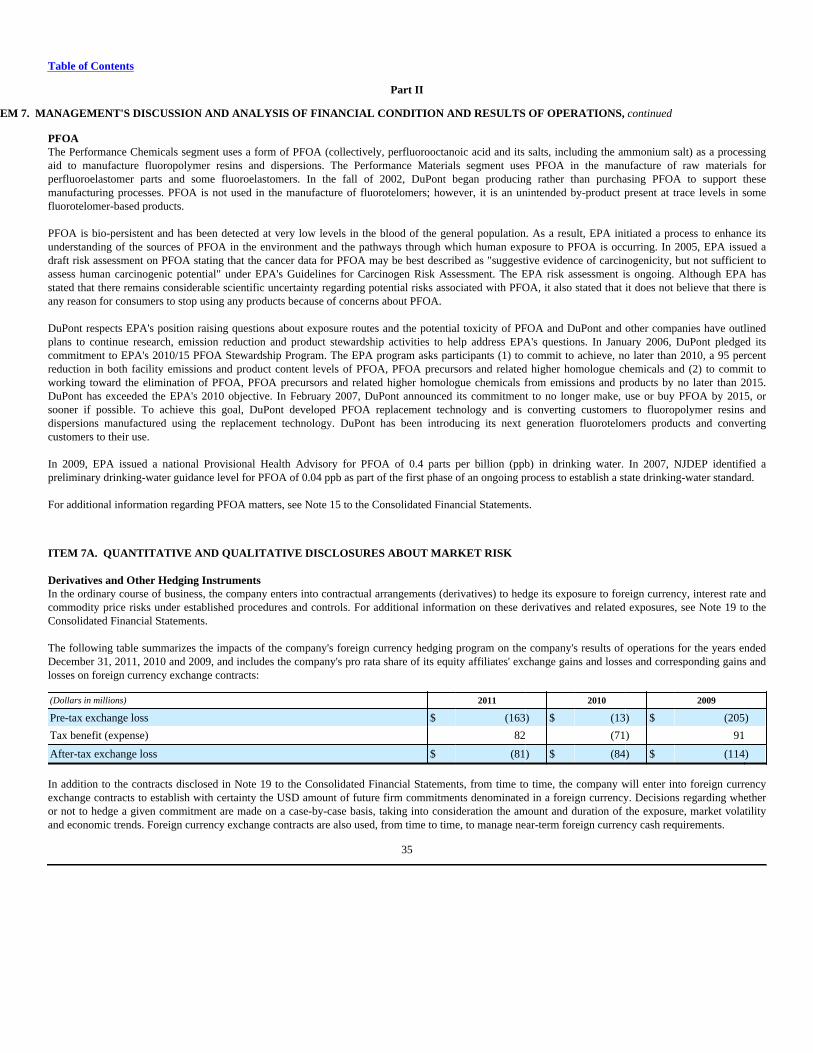
Table of Contents
Part II
ITEM 7. MANAGEMENT'S DISCUSSION AND ANALYSIS OF FINANCIAL CONDITION AND RESULTS OF OPERATIONS, continued
PFOAThe Performance Chemicals segment uses a form of PFOA (collectively, perfluorooctanoic acid and its salts, including the ammonium salt) as a processingaid to manufacture fluoropolymer resins and dispersions. The Performance Materials segment uses PFOA in the manufacture of raw materials forperfluoroelastomer parts and some fluoroelastomers. In the fall of 2002, DuPont began producing rather than purchasing PFOA to support thesemanufacturing processes. PFOA is not used in the manufacture of fluorotelomers; however, it is an unintended by-product present at trace levels in somefluorotelomer-based products. PFOA is bio-persistent and has been detected at very low levels in the blood of the general population. As a result, EPA initiated a process to enhance itsunderstanding of the sources of PFOA in the environment and the pathways through which human exposure to PFOA is occurring. In 2005, EPA issued adraft risk assessment on PFOA stating that the cancer data for PFOA may be best described as "suggestive evidence of carcinogenicity, but not sufficient toassess human carcinogenic potential" under EPA's Guidelines for Carcinogen Risk Assessment. The EPA risk assessment is ongoing. Although EPA hasstated that there remains considerable scientific uncertainty regarding potential risks associated with PFOA, it also stated that it does not believe that there isany reason for consumers to stop using any products because of concerns about PFOA. DuPont respects EPA's position raising questions about exposure routes and the potential toxicity of PFOA and DuPont and other companies have outlinedplans to continue research, emission reduction and product stewardship activities to help address EPA's questions. In January 2006, DuPont pledged itscommitment to EPA's 2010/15 PFOA Stewardship Program. The EPA program asks participants (1) to commit to achieve, no later than 2010, a 95 percentreduction in both facility emissions and product content levels of PFOA, PFOA precursors and related higher homologue chemicals and (2) to commit toworking toward the elimination of PFOA, PFOA precursors and related higher homologue chemicals from emissions and products by no later than 2015.DuPont has exceeded the EPA's 2010 objective. In February 2007, DuPont announced its commitment to no longer make, use or buy PFOA by 2015, orsooner if possible. To achieve this goal, DuPont developed PFOA replacement technology and is converting customers to fluoropolymer resins anddispersions manufactured using the replacement technology. DuPont has been introducing its next generation fluorotelomers products and convertingcustomers to their use. In 2009, EPA issued a national Provisional Health Advisory for PFOA of 0.4 parts per billion (ppb) in drinking water. In 2007, NJDEP identified apreliminary drinking-water guidance level for PFOA of 0.04 ppb as part of the first phase of an ongoing process to establish a state drinking-water standard.
For additional information regarding PFOA matters, see Note 15 to the Consolidated Financial Statements.
ITEM 7A. QUANTITATIVE AND QUALITATIVE DISCLOSURES ABOUT MARKET RISK
Derivatives and Other Hedging InstrumentsIn the ordinary course of business, the company enters into contractual arrangements (derivatives) to hedge its exposure to foreign currency, interest rate andcommodity price risks under established procedures and controls. For additional information on these derivatives and related exposures, see Note 19 to theConsolidated Financial Statements.
The following table summarizes the impacts of the company's foreign currency hedging program on the company's results of operations for the years endedDecember 31, 2011, 2010 and 2009, and includes the company's pro rata share of its equity affiliates' exchange gains and losses and corresponding gains andlosses on foreign currency exchange contracts:
(Dollars in millions) 2011 2010 2009
Pre-tax exchange loss $ (163) $ (13) $ (205)
Tax benefit (expense) 82 (71) 91
After-tax exchange loss $ (81) $ (84) $ (114)
In addition to the contracts disclosed in Note 19 to the Consolidated Financial Statements, from time to time, the company will enter into foreign currencyexchange contracts to establish with certainty the USD amount of future firm commitments denominated in a foreign currency. Decisions regarding whetheror not to hedge a given commitment are made on a case-by-case basis, taking into consideration the amount and duration of the exposure, market volatilityand economic trends. Foreign currency exchange contracts are also used, from time to time, to manage near-term foreign currency cash requirements.
35
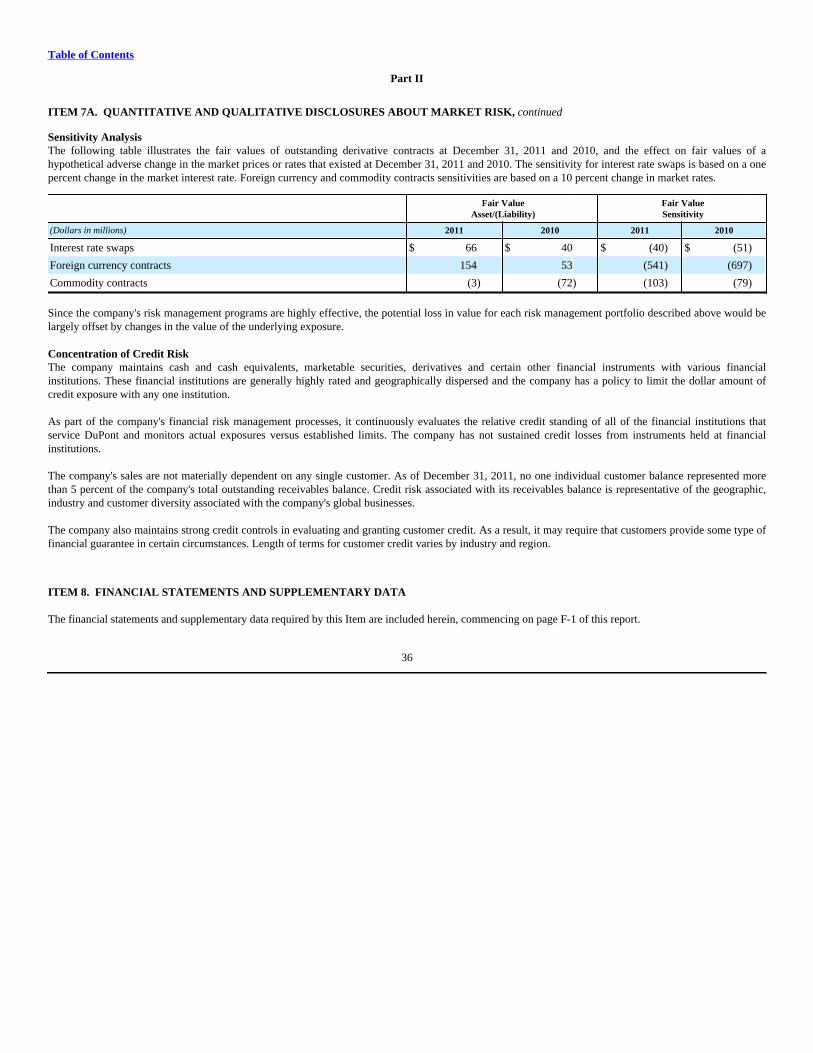
Table of Contents
Part II
ITEM 7A. QUANTITATIVE AND QUALITATIVE DISCLOSURES ABOUT MARKET RISK, continued
Sensitivity AnalysisThe following table illustrates the fair values of outstanding derivative contracts at December 31, 2011 and 2010, and the effect on fair values of ahypothetical adverse change in the market prices or rates that existed at December 31, 2011 and 2010. The sensitivity for interest rate swaps is based on a onepercent change in the market interest rate. Foreign currency and commodity contracts sensitivities are based on a 10 percent change in market rates.
Fair ValueAsset/(Liability)
Fair ValueSensitivity
(Dollars in millions) 2011 2010 2011 2010
Interest rate swaps $ 66 $ 40 $ (40) $ (51)
Foreign currency contracts 154 53 (541) (697)
Commodity contracts (3) (72) (103) (79)
Since the company's risk management programs are highly effective, the potential loss in value for each risk management portfolio described above would belargely offset by changes in the value of the underlying exposure.
Concentration of Credit RiskThe company maintains cash and cash equivalents, marketable securities, derivatives and certain other financial instruments with various financialinstitutions. These financial institutions are generally highly rated and geographically dispersed and the company has a policy to limit the dollar amount ofcredit exposure with any one institution.
As part of the company's financial risk management processes, it continuously evaluates the relative credit standing of all of the financial institutions thatservice DuPont and monitors actual exposures versus established limits. The company has not sustained credit losses from instruments held at financialinstitutions.
The company's sales are not materially dependent on any single customer. As of December 31, 2011, no one individual customer balance represented morethan 5 percent of the company's total outstanding receivables balance. Credit risk associated with its receivables balance is representative of the geographic,industry and customer diversity associated with the company's global businesses.
The company also maintains strong credit controls in evaluating and granting customer credit. As a result, it may require that customers provide some type offinancial guarantee in certain circumstances. Length of terms for customer credit varies by industry and region.
ITEM 8. FINANCIAL STATEMENTS AND SUPPLEMENTARY DATA
The financial statements and supplementary data required by this Item are included herein, commencing on page F-1 of this report.
36
Table of Contents Part II
ITEM 9. CHANGES IN AND DISAGREEMENTS WITH ACCOUNTANTS ON ACCOUNTING AND FINANCIAL DISCLOSURE
None.
ITEM 9A. CONTROLS AND PROCEDURES
The company maintains a system of disclosure controls and procedures to give reasonable assurance that information required to be disclosed in thecompany's reports filed or submitted under the Securities Exchange Act of 1934 (Exchange Act) is recorded, processed, summarized and reported within thetime periods specified in the rules and forms of the SEC. These controls and procedures also give reasonable assurance that information required to bedisclosed in such reports is accumulated and communicated to management to allow timely decisions regarding required disclosures.
As of December 31, 2011, the company's Chief Executive Officer (CEO) and Chief Financial Officer (CFO), together with management, conducted anevaluation of the effectiveness of the company's disclosure controls and procedures pursuant to Rules 13a-15(e) and 15d-15(e) of the Exchange Act. Based onthat evaluation, the CEO and CFO concluded that these disclosure controls and procedures are effective.
There has been no change in the company's internal control over financial reporting that occurred during the fourth quarter of 2011 that has materiallyaffected, or is reasonably likely to materially affect, the company's internal control over financial reporting. The company has completed its evaluation of itsinternal controls and has concluded that the company's system of internal controls over financial reporting was effective as of December 31, 2011 (seepage F-2).
ITEM 9B. OTHER INFORMATION
None.
37
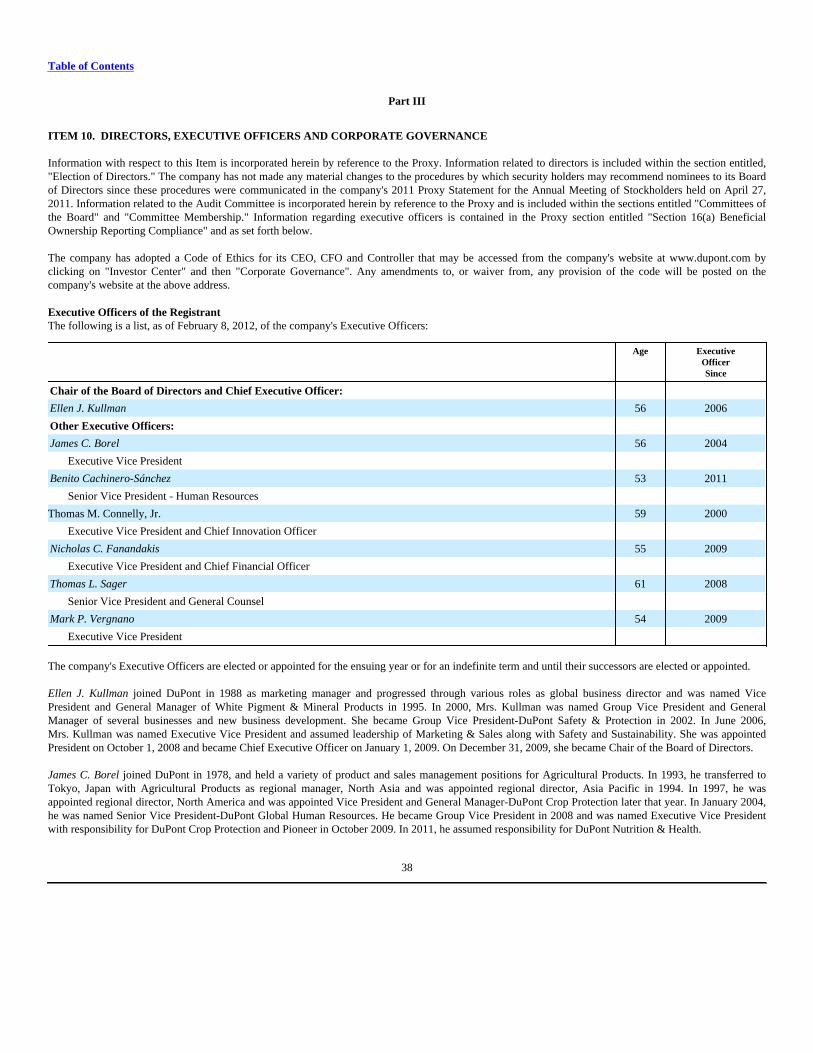
Table of Contents
Part III
ITEM 10. DIRECTORS, EXECUTIVE OFFICERS AND CORPORATE GOVERNANCE
Information with respect to this Item is incorporated herein by reference to the Proxy. Information related to directors is included within the section entitled,"Election of Directors." The company has not made any material changes to the procedures by which security holders may recommend nominees to its Boardof Directors since these procedures were communicated in the company's 2011 Proxy Statement for the Annual Meeting of Stockholders held on April 27,2011. Information related to the Audit Committee is incorporated herein by reference to the Proxy and is included within the sections entitled "Committees ofthe Board" and "Committee Membership." Information regarding executive officers is contained in the Proxy section entitled "Section 16(a) BeneficialOwnership Reporting Compliance" and as set forth below.
The company has adopted a Code of Ethics for its CEO, CFO and Controller that may be accessed from the company's website at www.dupont.com byclicking on "Investor Center" and then "Corporate Governance". Any amendments to, or waiver from, any provision of the code will be posted on thecompany's website at the above address.
Executive Officers of the RegistrantThe following is a list, as of February 8, 2012, of the company's Executive Officers:
Age ExecutiveOfficerSince
Chair of the Board of Directors and Chief Executive Officer:
Ellen J. Kullman 56 2006
Other Executive Officers:
James C. Borel 56 2004
Executive Vice President
Benito Cachinero-Sánchez 53 2011
Senior Vice President - Human Resources
Thomas M. Connelly, Jr. 59 2000
Executive Vice President and Chief Innovation Officer
Nicholas C. Fanandakis 55 2009
Executive Vice President and Chief Financial Officer
Thomas L. Sager 61 2008
Senior Vice President and General Counsel
Mark P. Vergnano 54 2009
Executive Vice President
The company's Executive Officers are elected or appointed for the ensuing year or for an indefinite term and until their successors are elected or appointed.
Ellen J. Kullman joined DuPont in 1988 as marketing manager and progressed through various roles as global business director and was named VicePresident and General Manager of White Pigment & Mineral Products in 1995. In 2000, Mrs. Kullman was named Group Vice President and GeneralManager of several businesses and new business development. She became Group Vice President-DuPont Safety & Protection in 2002. In June 2006,Mrs. Kullman was named Executive Vice President and assumed leadership of Marketing & Sales along with Safety and Sustainability. She was appointedPresident on October 1, 2008 and became Chief Executive Officer on January 1, 2009. On December 31, 2009, she became Chair of the Board of Directors.
James C. Borel joined DuPont in 1978, and held a variety of product and sales management positions for Agricultural Products. In 1993, he transferred toTokyo, Japan with Agricultural Products as regional manager, North Asia and was appointed regional director, Asia Pacific in 1994. In 1997, he wasappointed regional director, North America and was appointed Vice President and General Manager-DuPont Crop Protection later that year. In January 2004,he was named Senior Vice President-DuPont Global Human Resources. He became Group Vice President in 2008 and was named Executive Vice Presidentwith responsibility for DuPont Crop Protection and Pioneer in October 2009. In 2011, he assumed responsibility for DuPont Nutrition & Health.
38
Table of Contents
Part III
ITEM 10. DIRECTORS, EXECUTIVE OFFICERS AND CORPORATE GOVERNANCE, continued
Benito Cachinero-Sánchez joined DuPont in April 2011 as Senior Vice President - Human Resources. Prior to joining DuPont, he was Corporate VicePresident of Human Resources at Automatic Data Processing (ADP). Prior to ADP, he was Vice President, Human Resources for the Medical Devices &Diagnostics Group of Johnson & Johnson.
Thomas M. Connelly, Jr. joined DuPont in 1977 as a research engineer. Since then, Mr. Connelly has served in various research and plant technical leadershiproles, as well as product management and business director roles. Mr. Connelly served as Vice President and General Manager-DuPont Fluoroproducts from1999 until September 2000, when he was named Senior Vice President and Chief Science and Technology Officer. In June 2006, Mr. Connelly was namedExecutive Vice President and Chief Innovation Officer. In October 2009, responsibility for DuPont Performance Polymers, Packaging & Industrial Polymersas well as integrated operations was added. In 2011, he assumed responsibility for DuPont Industrial Biosciences and Performance Coatings.
Nicholas C. Fanandakis joined DuPont in 1979 as an accounting and business analyst. Since then, Mr. Fanandakis served in a variety of plant, marketing, andproduct management and business director roles. Mr. Fanandakis served as Vice President and General Manager—DuPont Chemical Solutions Enterprisefrom 2003 until February 2007 when he was named Vice President—Corporate Plans. In January 2008, Mr. Fanandakis was named Group Vice President—DuPont Applied BioSciences. In November 2009, he was named Senior Vice President and Chief Financial Officer. In August 2010, he was named ExecutiveVice President and Chief Financial Officer.
Thomas L. Sager joined DuPont in 1976 as an attorney in the labor and security group. In 1998, he was named Chief Litigation Counsel and assumedoversight responsibility for all company litigation matters. He was named Vice President and Assistant General Counsel in 1999. In July 2008, he wasappointed Senior Vice President and General Counsel.
Mark P. Vergnano joined DuPont in 1980 as a process engineer. He has had several assignments in manufacturing, technology, marketing, sales and businessstrategy. He has held assignments in various DuPont locations including Geneva, Switzerland. In February 2003 he was named Vice President and GeneralManager—Nonwovens and Vice President and General Manager—Surfaces and Building Innovations in October 2005. In June 2006, he was named GroupVice President of DuPont Safety & Protection. In October 2009, Mr. Vergnano was appointed Executive Vice President with responsibility for DuPontProtection Technologies, Building Innovations, Sustainable Solutions, Chemicals & Fluoroproducts, Titanium Technologies and Electronics &Communications. He also leads the company's sustainability, safety, communications, and sales and marketing functions.
ITEM 11. EXECUTIVE COMPENSATION
Information with respect to this Item is incorporated herein by reference to the Proxy and is included in the sections "Compensation Discussion and Analysis,""2011 Summary Compensation Table," " 2011 Grants of Plan-Based Awards," "Outstanding Equity Awards," "2011 Option Exercises and Stock Vested,""Pension Benefits," "Nonqualified Deferred Compensation," "Potential Payments Upon Termination or Change in Control," and "Directors' Compensation."Information related to the Compensation Committee is included within the sections entitled "Compensation Committee Interlocks and Insider Participation"and "Compensation Committee Report."
39
Table of Contents
Part III
ITEM 12. SECURITY OWNERSHIP OF CERTAIN BENEFICIAL OWNERS AND MANAGEMENT AND RELATED STOCKHOLDER MATTERS
Information with respect to Beneficial Owners is incorporated herein by reference to the Proxy and is included in the section entitled "Ownership of CompanyStock."
Securities authorized for issuance under equity compensation plans as of December 31, 2011(Shares in thousands, except per share)
Plan Category Number of Securities tobe Issued Upon Exerciseof Outstanding Options,
Warrants and Rights
Weighted-AverageExercise Price of
Outstanding Options,Warrants and Rights2
Number of SecuritiesRemaining Availablefor Future Issuance
Under EquityCompensation Plans 3
Equity compensation plans approved by security holders
44,784 1 $ 37.47 67,174
Equity compensation plans not approved by security holders
5,802 4 $ 44.53 — 5
Total 50,586 $ 38.40 67,174
1. Includes stock-settled time-vested and performance-based restricted stock units granted and stock units deferred under the company's Equity and Incentive Plan, Stock Performance Plan,Variable Compensation Plan and the Stock Accumulation and Deferred Compensation Plan for Directors. Performance-based restricted stock units reflect the maximum number of sharesto be awarded at the conclusion of the performance cycle (200 percent of the original grant). The actual award payouts can range from zero to 200 percent of the original grant.
2. Represents the weighted-average exercise price of the outstanding stock options only; the outstanding stock-settled time-vested and performance-based restricted stock units and deferredstock units are not included in this calculation.
3. Reflects shares available pursuant to the issuance of stock options, restricted stock, restricted stock units or other stock-based awards under the amended Equity and Incentive Planapproved by the shareholders in April 2011 (see Note 18 to the company's Consolidated Financial Statements). The maximum number of shares of stock reserved for the grant orsettlement of awards under the Equity and Incentive Plan (Share Limit) shall be 110,000 and shall be subject to adjustment as provided therein; provided that each share in excess of30,000 issued under the Equity and Incentive Plan pursuant to any award settled in stock, other than a stock option or stock appreciation right, shall be counted against the foregoingShare Limit as four and one-half shares for every one share actually issued in connection with such award. (For example, if 32,000 shares of restricted stock are granted under the Equityand Incentive Plan, 39,000 shall be charged against the Share Limit in connection with that award.)
4. Includes 12 deferred stock units resulting from base salary and short-term incentive (STIP) deferrals under the Management Deferred Compensation Plan (MDCP). Under the MDCP, aselect group of management or highly compensated employees can elect to defer the receipt of their base salary, STIP or Long Term Incentive (LTI) award. LTI deferrals are included infootnote 1 to the above chart. The company does not match deferrals under the MDCP. There are seven core investment options under the MDCP for base salary and STIP deferrals,including deferred stock units with dividend equivalents credited as additional stock units. In general, deferred stock units are distributed in the form of DuPont common stock and maybe made in the form of lump sum at a specified future date prior to retirement or a lump sum or annual installments after separation from service. Shareholder approval of the MDCP wasnot required under the rules of the New York Stock Exchange. This column also includes the following: (i) options totaling 5,416 granted under the company's 2002 Corporate SharingProgram (see Note 18 to the Consolidated Financial Statements); and (ii) 373 options from the conversion of DuPont Canada options to DuPont options in connection with the company'sacquisition of the minority interest in DuPont Canada.
5. There is no limit on the number of shares that can be issued under the MDCP and no further shares are available for issuance under the other equity compensation arrangements describedin footnote 4 to the above chart.
ITEM 13. CERTAIN RELATIONSHIPS AND RELATED TRANSACTIONS, AND DIRECTOR INDEPENDENCE
Information with respect to the company's policy and procedures for the review, approval or ratification of transactions with related persons is incorporated byreference herein to the Proxy and is included in the section entitled "Review and Approval of Transactions with Related Persons." Information with respect todirector independence is incorporated by reference herein to the Proxy and is included in the sections entitled "DuPont Board of Directors—CorporateGovernance Guidelines," "Guidelines for Determining the Independence of DuPont Directors," "Committees of the Board" and "Committee Membership."
ITEM 14. PRINCIPAL ACCOUNTANT FEES AND SERVICES
Information with respect to this Item is incorporated herein by reference to the Proxy and is included in the sections entitled "Ratification of IndependentRegistered Public Accounting Firm."
40
Table of Contents
Part IV
ITEM 15. EXHIBITS AND FINANCIAL STATEMENT SCHEDULES
(a) Financial Statements, Financial Statement Schedules and Exhibits:
1. Financial Statements (See the Index to the Consolidated Financial Statements on page F-1 of this report).
2. Financial Statement Schedules
Schedule II—Valuation and Qualifying Accounts
(Dollars in millions)
Year Ended December 31, 2011 2010 2009
Accounts Receivable—Allowance for Doubtful Receivables
Balance at beginning of period $ 326 $ 322 $ 238
Additions charged to cost and expenses 73 75 112
Deductions from reserves (107) (71) (28)
Balance at end of period $ 292 $ 326 $ 322
Deferred Tax Assets—Valuation Allowance
Balance at beginning of period $ 1,666 $ 1,759 $ 1,693
Net charges (benefits) to income tax expense 73 (19) 55
Additions charged to other comprehensive income (loss) 236 — —
Currency translation (4) (74) 11
Balance at end of period $ 1,971 $ 1,666 $ 1,759
Financial Statement Schedules listed under SEC rules but not included in this report are omitted because they are not applicable or the required information isshown in the Consolidated Financial Statements or notes thereto incorporated by reference.
41
Table of Contents
Part IV
ITEM 15. EXHIBITS AND FINANCIAL STATEMENT SCHEDULES, continued
3. Exhibits
The following list of exhibits includes both exhibits submitted with this Form 10-K as filed with the SEC and those incorporated by reference to other filings:
ExhibitNumber
Description
3.1
Company’s Restated Certificate of Incorporation (incorporated by reference to Exhibit 3.1 to the company’s Annual Report onForm 10-K for the year ended December 31, 2007).
3.2
Company’s Bylaws, as last amended effective November 1, 2009 (incorporated by reference to Exhibit 3.2 to the company’s AnnualReport on Form 10-K for the year ended December 31, 2009).
4
The company agrees to provide the Commission, on request, copies of instruments defining the rights of holders of long-term debt ofthe company and its subsidiaries.
10.1*
The DuPont Stock Accumulation and Deferred Compensation Plan for Directors, as last amended effective January 1, 2009(incorporated by reference to Exhibit 10.1 to the company’s Annual Report on Form 10-K for the year ended December 31, 2008).
10.2*
Company’s Supplemental Retirement Income Plan, as last amended effective June 4, 1996.
10.3*
Company’s Pension Restoration Plan, as restated effective July 17, 2006 (incorporated by reference to Exhibit 10.3 to the company’sQuarterly Report on Form 10-Q for the period ended June 30, 2011).
10.4*
Company’s Rules for Lump Sum Payments, as last amended effective December 20, 2007 (incorporated by reference to Exhibit 10.4 tothe company’s Quarterly Report on Form 10-Q for the period ended June 30, 2011).
10.5*
Company’s Stock Performance Plan, as last amended effective January 25, 2007.
10.6*
Company’s Equity and Incentive Plan as amended and restated effective March 2, 2011 and approved by the company’s shareholderson April 27, 2011 (incorporated by reference to pages B1-B15 of the company’s Annual Meeting Proxy Statement dated March 18,2011).
10.7*
Form of Award Terms under the company’s Equity and Incentive Plan (incorporated by reference to Exhibit 10.8 to the company’sQuarterly Report on Form 10-Q for the period ended March 31, 2009).
10.8*
Company’s Retirement Savings Restoration Plan, as last amended effective June 1, 2011 (incorporated by reference to Exhibit 10.8 tothe company’s Quarterly Report on Form 10-Q for the period ended June 30, 2011).
10.9*
Company’s Retirement Income Plan for Directors, as last amended August 1995.
10.11* Company’s Management Deferred Compensation Plan, adopted on May 2, 2008, as last amended May 12, 2010 (incorporated byreference to Exhibit 10.11 to the company’s Quarterly Report on Form 10-Q for the period ended June 30, 2010).
10.12* Supplemental Deferral Terms for Deferred Long Term Incentive Awards and Deferred Variable Compensation Awards (incorporated
by reference to Exhibit 10.15 to the company’s Annual Report on Form 10-K for the year ended December 31, 2008).
12 Computation of Ratio of Earnings to Fixed Charges.
21 Subsidiaries of the Registrant.
23 Consent of Independent Registered Public Accounting Firm.

42
Table of Contents
Part IV
ITEM 15. EXHIBITS AND FINANCIAL STATEMENT SCHEDULES, continued
ExhibitNumber
Description
31.1
Rule 13a-14(a)/15d-14(a) Certification of the company’s Principal Executive Officer.
31.2
Rule 13a-14(a)/15d-14(a) Certification of the company’s Principal Financial Officer.
32.1
Section 1350 Certification of the company’s Principal Executive Officer. The information contained in this Exhibit shall not be deemedfiled with the Securities and Exchange Commission nor incorporated by reference in any registration statement filed by the registrantunder the Securities Act of 1933, as amended.
32.2
Section 1350 Certification of the company’s Principal Financial Officer. The information contained in this Exhibit shall not be deemedfiled with the Securities and Exchange Commission nor incorporated by reference in any registration statement filed by the registrantunder the Securities Act of 1933, as amended.
95 Mine Safety Disclosures.
101.INS
XBRL Instance Document
101.SCH
XBRL Taxonomy Extension Schema Document
101.CAL
XBRL Taxonomy Extension Calculation Linkbase Document
101.DEF
XBRL Taxonomy Extension Definition Linkbase Document
101.LAB
XBRL Taxonomy Extension Label Linkbase Document
101.PRE
XBRL Taxonomy Extension Presentation Linkbase Document
* Management contract or compensatory plan or arrangement required to be filed as an exhibit to this Form 10-K.
43
Table of Contents Signatures
Pursuant to the requirements of Section 13 of the Securities Exchange Act of 1934, the registrant has duly caused this report to be signed on itsbehalf by the undersigned, thereunto duly authorized.
February 8, 2012
E. I. DU PONT DE NEMOURS AND COMPANY
By: /s/ Nicholas C. Fanandakis
Nicholas C. FanandakisExecutive Vice President and Chief Financial Officer(Principal Financial and Accounting Officer)
_____________________________________________
Pursuant to the requirements of the Securities Exchange Act of 1934, this report has been signed below by the following persons on behalf of theregistrant in the capacities and on the dates indicated:
Signature Title(s) Date
/s/ E. J. Kullman Chair of the Board of Directors andChief Executive Officer and Director
(Principal Executive Officer)
February 8, 2012
E. J. Kullman
/s/ R. H. Brown Director February 8, 2012
R. H. Brown
/s/ R. A. Brown Director February 8, 2012
R. A. Brown
/s/ B. P. Collomb Director February 8, 2012
B. P. Collomb
/s/ C. J. Crawford Director February 8, 2012
C. J. Crawford
/s/ A. M. Cutler Director February 8, 2012
A. M. Cutler
/s/ E. I. du Pont, II Director February 8, 2012
E. I. du Pont, II
/s/ M. A. Hewson Director February 8, 2012
M. A. Hewson
/s/ L. D. Juliber Director February 8, 2012
L. D. Juliber
/s/ W. K. Reilly Director February 8, 2012
W. K. Reilly
/s/ L. M. Thomas Director February 8, 2012
L. M. Thomas
44
Table of Contents
E.I. du Pont de Nemours and Company
Index to the Consolidated Financial Statements
Page(s)
Consolidated Financial Statements:
Management's Reports on Responsibility for Financial Statements and Internal Control over Financial Reporting F-2
Report of Independent Registered Public Accounting Firm F-3
Consolidated Income Statements for the years ended December 31, 2011, 2010 and 2009 F-4
Consolidated Balance Sheets as of December 31, 2011 and December 31, 2010 F-5
Consolidated Statements of Equity for the years ended December 31, 2011, 2010 and 2009 F-6
Consolidated Statements of Cash Flows for the years ended December 31, 2011, 2010 and 2009 F-7
Notes to the Consolidated Financial Statements F-8
F-1
Table of Contents
Management's Reports on Responsibility for Financial Statements andInternal Control over Financial Reporting
Management's Report on Responsibility for Financial Statements
Management is responsible for the Consolidated Financial Statements and the other financial information contained in this Annual Report on Form 10-K. Thefinancial statements have been prepared in accordance with generally accepted accounting principles in the United States of America (GAAP) and areconsidered by management to present fairly the company's financial position, results of operations and cash flows. The financial statements include someamounts that are based on management's best estimates and judgments. The financial statements have been audited by the company's independent registeredpublic accounting firm, PricewaterhouseCoopers LLP. The purpose of their audit is to express an opinion as to whether the Consolidated Financial Statementsincluded in this Annual Report on Form 10-K present fairly, in all material respects, the company's financial position, results of operations and cash flows inconformity with GAAP. Their report is presented on the following page.
Management's Report on Internal Control over Financial Reporting
Management is responsible for establishing and maintaining an adequate system of internal control over financial reporting as defined in Rules 13a-15(f) and15d-15(f) under the Securities Exchange Act of 1934. The company's internal control over financial reporting is a process designed to provide reasonableassurance regarding the reliability of financial reporting and the preparation of financial statements for external purposes in accordance with GAAP. Thecompany's internal control over financial reporting includes those policies and procedures that:
i. pertain to the maintenance of records that, in reasonable detail, accurately and fairly reflect the transactions and dispositions of the assets of thecompany;
ii. provide reasonable assurance that transactions are recorded as necessary to permit preparation of financial statements in accordance withgenerally accepted accounting principles and that receipts and expenditures of the company are being made only in accordance withauthorization of management and directors of the company; and
iii. provide reasonable assurance regarding prevention or timely detection of unauthorized acquisitions, use or disposition of the company's assetsthat could have a material effect on the financial statements.
Internal control over financial reporting has certain inherent limitations which may not prevent or detect misstatements. In addition, changes in conditions andbusiness practices may cause variation in the effectiveness of internal controls.
Management assessed the effectiveness of the company's internal control over financial reporting as of December 31, 2011, based on criteria set forth by theCommittee of Sponsoring Organizations of the Treadway Commission (COSO) in Internal Control-Integrated Framework. Based on its assessment and thosecriteria, management concluded that the company maintained effective internal control over financial reporting as of December 31, 2011.
PricewaterhouseCoopers LLP, an independent registered public accounting firm, has audited the effectiveness of the company's internal control over financialreporting as of December 31, 2011, as stated in their report, which is presented on the following page.
Ellen J. KullmanChair of the Board andChief Executive Officer
Nicholas C. FanandakisExecutive Vice Presidentand Chief Financial Officer
February 8, 2012
F-2
Table of Contents
Report of Independent Registered Public Accounting Firm
To the Stockholders and the Board of Directors ofE. I. du Pont de Nemours and Company:
In our opinion, the accompanying consolidated balance sheets and the related consolidated statements of income, equity and cash flows present fairly, in allmaterial respects, the financial position of E. I. du Pont de Nemours and Company and its subsidiaries at December 31, 2011 and 2010, and the results of theiroperations and their cash flows for each of the three years in the period ended December 31, 2011 in conformity with accounting principles generally acceptedin the United States of America. In addition, in our opinion, the financial statement schedule listed in the index appearing under Item 15(a) (2) presents fairly,in all material respects, the information set forth therein when read in conjunction with the related consolidated financial statements. Also in our opinion, theCompany maintained, in all material respects, effective internal control over financial reporting as of December 31, 2011, based on criteria established inInternal Control – Integrated Framework issued by the Committee of Sponsoring Organizations of the Treadway Commission (COSO). The Company'smanagement is responsible for these financial statements and financial statement schedule, for maintaining effective internal control over financial reportingand for its assessment of the effectiveness of internal control over financial reporting, included in "Management's Report on Internal Control over FinancialReporting" appearing on page F-2. Our responsibility is to express opinions on these financial statements, on the financial statement schedule and on theCompany's internal control over financial reporting based on our integrated audits. We conducted our audits in accordance with the standards of the PublicCompany Accounting Oversight Board (United States). Those standards require that we plan and perform the audits to obtain reasonable assurance aboutwhether the financial statements are free of material misstatement and whether effective internal control over financial reporting was maintained in allmaterial respects. Our audits of the financial statements included examining, on a test basis, evidence supporting the amounts and disclosures in the financialstatements, assessing the accounting principles used and significant estimates made by management, and evaluating the overall financial statementpresentation. Our audit of internal control over financial reporting included obtaining an understanding of internal control over financial reporting, assessingthe risk that a material weakness exists, and testing and evaluating the design and operating effectiveness of internal control based on the assessed risk. Ouraudits also included performing such other procedures as we considered necessary in the circumstances. We believe our audits provide a reasonable basis forour opinions.
A company's internal control over financial reporting is a process designed to provide reasonable assurance regarding the reliability of financial reporting andthe preparation of financial statements for external purposes in accordance with generally accepted accounting principles. A company's internal control overfinancial reporting includes those policies and procedures that (i) pertain to the maintenance of records that, in reasonable detail, accurately and fairly reflectthe transactions and dispositions of the assets of the company; (ii) provide reasonable assurance that transactions are recorded as necessary to permitpreparation of financial statements in accordance with generally accepted accounting principles, and that receipts and expenditures of the company are beingmade only in accordance with authorizations of management and directors of the company; and (iii) provide reasonable assurance regarding prevention ortimely detection of unauthorized acquisition, use, or disposition of the company's assets that could have a material effect on the financial statements.
Because of its inherent limitations, internal control over financial reporting may not prevent or detect misstatements. Also, projections of any evaluation ofeffectiveness to future periods are subject to the risk that controls may become inadequate because of changes in conditions, or that the degree of compliancewith the policies or procedures may deteriorate.
PricewaterhouseCoopers LLPPhiladelphia, PennsylvaniaFebruary 8, 2012
F-3
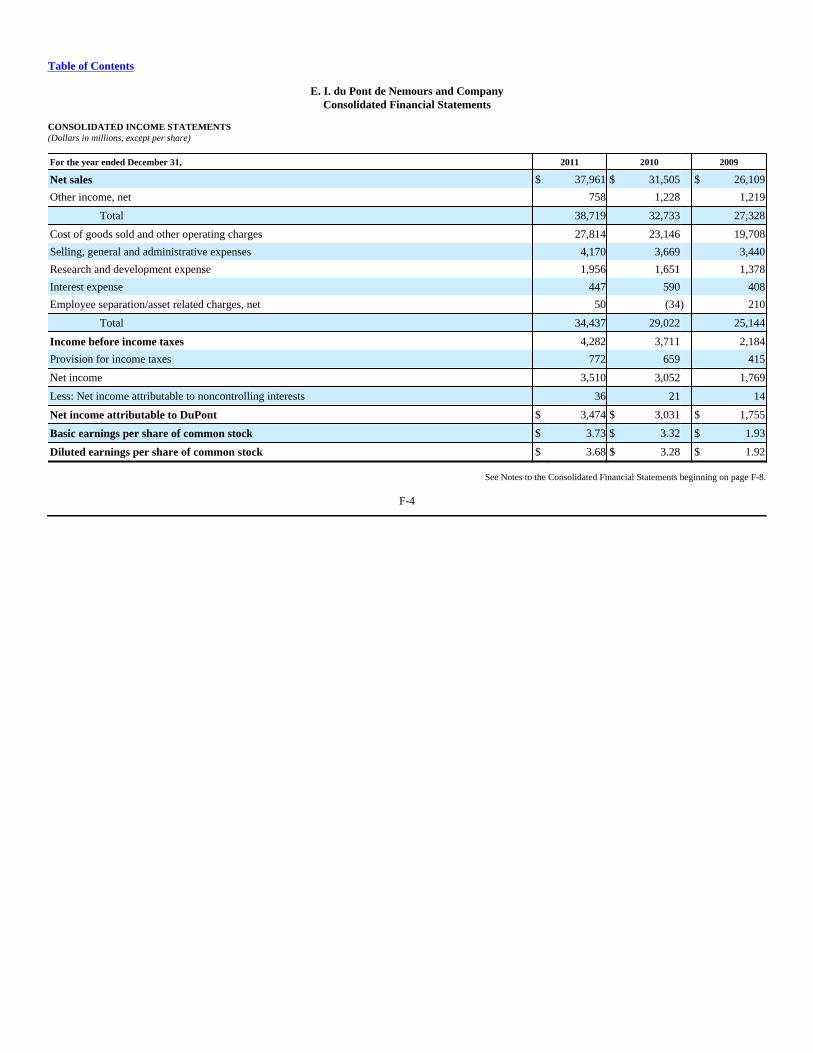
Table of Contents
E. I. du Pont de Nemours and CompanyConsolidated Financial Statements
CONSOLIDATED INCOME STATEMENTS(Dollars in millions, except per share)
For the year ended December 31, 2011 2010 2009
Net sales $ 37,961 $ 31,505 $ 26,109
Other income, net 758 1,228 1,219
Total 38,719 32,733 27,328
Cost of goods sold and other operating charges 27,814 23,146 19,708
Selling, general and administrative expenses 4,170 3,669 3,440
Research and development expense 1,956 1,651 1,378
Interest expense 447 590 408
Employee separation/asset related charges, net 50 (34) 210
Total 34,437 29,022 25,144
Income before income taxes 4,282 3,711 2,184
Provision for income taxes 772 659 415
Net income 3,510 3,052 1,769
Less: Net income attributable to noncontrolling interests 36 21 14
Net income attributable to DuPont $ 3,474 $ 3,031 $ 1,755
Basic earnings per share of common stock $ 3.73 $ 3.32 $ 1.93
Diluted earnings per share of common stock $ 3.68 $ 3.28 $ 1.92
See Notes to the Consolidated Financial Statements beginning on page F-8.
F-4
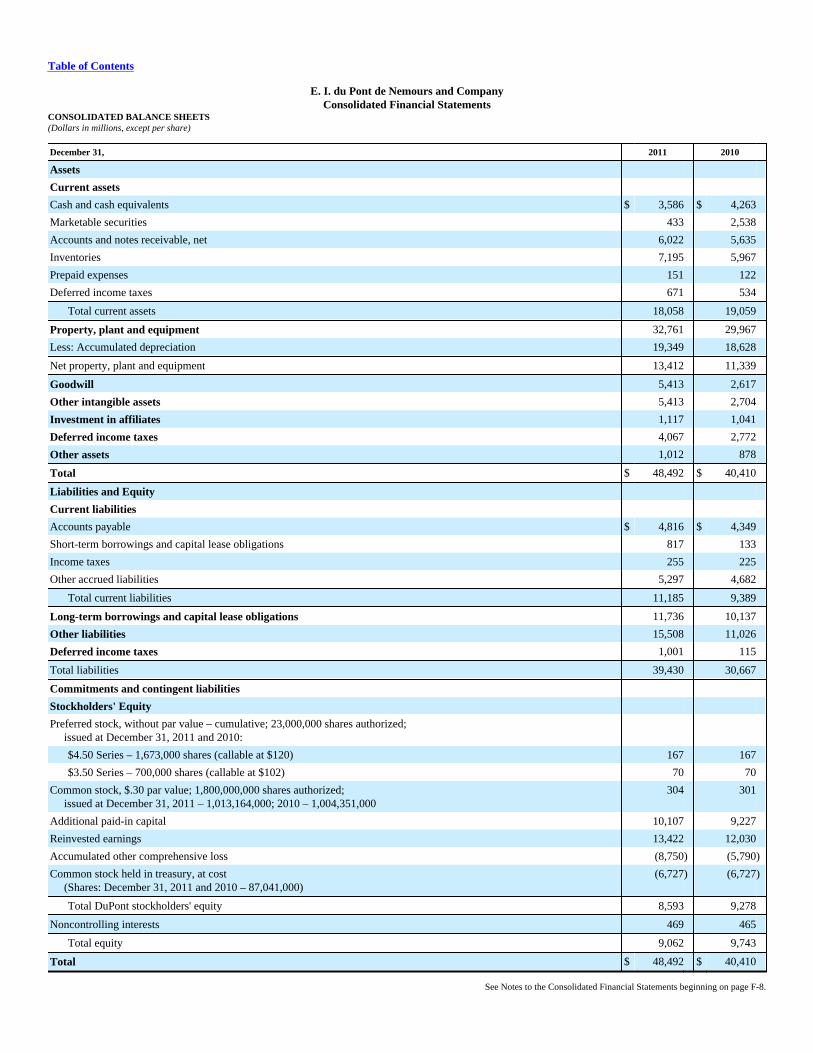
Table of Contents
E. I. du Pont de Nemours and CompanyConsolidated Financial Statements
CONSOLIDATED BALANCE SHEETS(Dollars in millions, except per share)
December 31, 2011 2010
Assets
Current assets
Cash and cash equivalents $ 3,586 $ 4,263
Marketable securities 433 2,538
Accounts and notes receivable, net 6,022 5,635
Inventories 7,195 5,967
Prepaid expenses 151 122
Deferred income taxes 671 534
Total current assets 18,058 19,059
Property, plant and equipment 32,761 29,967
Less: Accumulated depreciation 19,349 18,628
Net property, plant and equipment 13,412 11,339
Goodwill 5,413 2,617
Other intangible assets 5,413 2,704
Investment in affiliates 1,117 1,041
Deferred income taxes 4,067 2,772
Other assets 1,012 878
Total $ 48,492 $ 40,410
Liabilities and Equity
Current liabilities
Accounts payable $ 4,816 $ 4,349
Short-term borrowings and capital lease obligations 817 133
Income taxes 255 225
Other accrued liabilities 5,297 4,682
Total current liabilities 11,185 9,389
Long-term borrowings and capital lease obligations 11,736 10,137
Other liabilities 15,508 11,026
Deferred income taxes 1,001 115
Total liabilities 39,430 30,667
Commitments and contingent liabilities
Stockholders' Equity
Preferred stock, without par value – cumulative; 23,000,000 shares authorized; issued at December 31, 2011 and 2010:
$4.50 Series – 1,673,000 shares (callable at $120) 167 167
$3.50 Series – 700,000 shares (callable at $102) 70 70
Common stock, $.30 par value; 1,800,000,000 shares authorized; issued at December 31, 2011 – 1,013,164,000; 2010 – 1,004,351,000
304 301
Additional paid-in capital 10,107 9,227
Reinvested earnings 13,422 12,030
Accumulated other comprehensive loss (8,750) (5,790)
Common stock held in treasury, at cost (Shares: December 31, 2011 and 2010 – 87,041,000)
(6,727) (6,727)
Total DuPont stockholders' equity 8,593 9,278
Noncontrolling interests 469 465
Total equity 9,062 9,743
Total $ 48,492 $ 40,410
See Notes to the Consolidated Financial Statements beginning on page F-8.

F-5
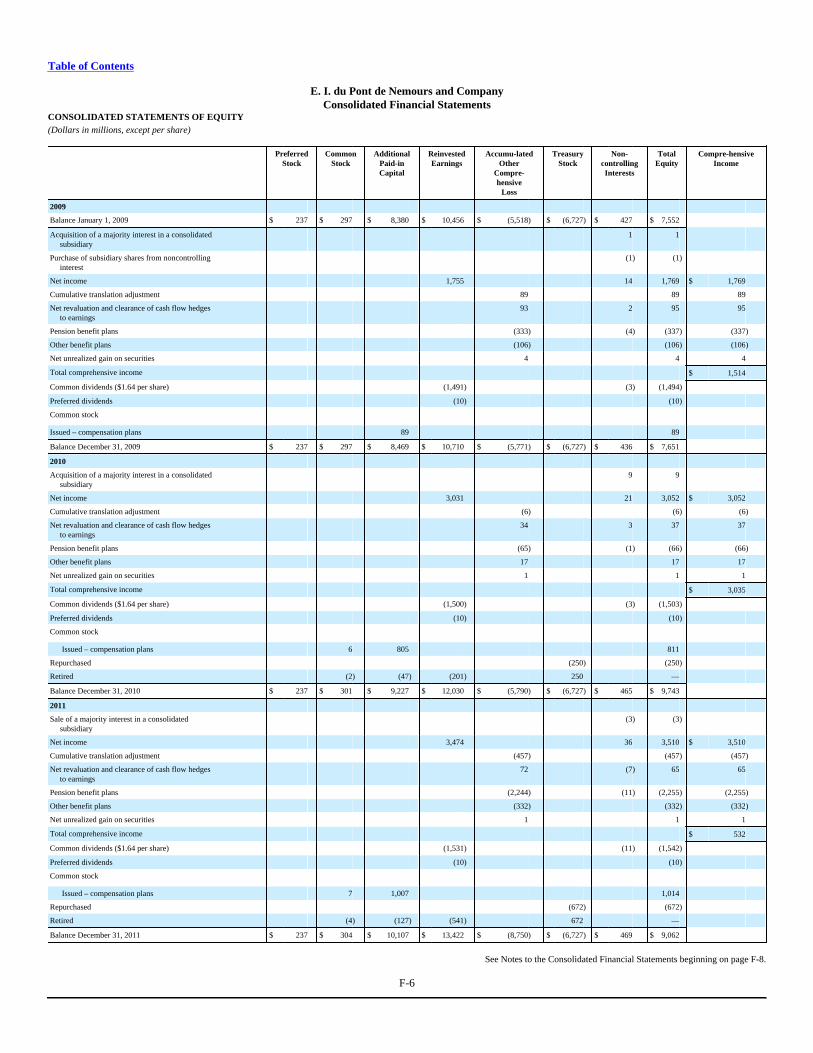
Table of Contents
E. I. du Pont de Nemours and CompanyConsolidated Financial Statements
CONSOLIDATED STATEMENTS OF EQUITY(Dollars in millions, except per share)
PreferredStock
CommonStock
AdditionalPaid-inCapital
ReinvestedEarnings
Accumu-latedOther
Compre-hensive
Loss
TreasuryStock
Non-controllingInterests
TotalEquity
Compre-hensiveIncome
2009
Balance January 1, 2009 $ 237 $ 297 $ 8,380 $ 10,456 $ (5,518) $ (6,727) $ 427 $ 7,552
Acquisition of a majority interest in a consolidated subsidiary
1 1
Purchase of subsidiary shares from noncontrolling interest
(1) (1)
Net income 1,755 14 1,769 $ 1,769
Cumulative translation adjustment 89 89 89
Net revaluation and clearance of cash flow hedges to earnings
93 2 95 95
Pension benefit plans (333) (4) (337) (337)
Other benefit plans (106) (106) (106)
Net unrealized gain on securities 4 4 4
Total comprehensive income $ 1,514
Common dividends ($1.64 per share) (1,491) (3) (1,494)
Preferred dividends (10) (10)
Common stock
Issued – compensation plans 89 89
Balance December 31, 2009 $ 237 $ 297 $ 8,469 $ 10,710 $ (5,771) $ (6,727) $ 436 $ 7,651
2010
Acquisition of a majority interest in a consolidated subsidiary
9 9
Net income 3,031 21 3,052 $ 3,052
Cumulative translation adjustment (6) (6) (6)
Net revaluation and clearance of cash flow hedges to earnings
34 3 37 37
Pension benefit plans (65) (1) (66) (66)
Other benefit plans 17 17 17
Net unrealized gain on securities 1 1 1
Total comprehensive income $ 3,035
Common dividends ($1.64 per share) (1,500) (3) (1,503)
Preferred dividends (10) (10)
Common stock
Issued – compensation plans 6 805 811
Repurchased (250) (250)
Retired (2) (47) (201) 250 —
Balance December 31, 2010 $ 237 $ 301 $ 9,227 $ 12,030 $ (5,790) $ (6,727) $ 465 $ 9,743
2011
Sale of a majority interest in a consolidated subsidiary
(3) (3)
Net income 3,474 36 3,510 $ 3,510
Cumulative translation adjustment (457) (457) (457)
Net revaluation and clearance of cash flow hedges to earnings
72 (7) 65 65
Pension benefit plans (2,244) (11) (2,255) (2,255)
Other benefit plans (332) (332) (332)
Net unrealized gain on securities 1 1 1
Total comprehensive income $ 532
Common dividends ($1.64 per share) (1,531) (11) (1,542)
Preferred dividends (10) (10)
Common stock
Issued – compensation plans 7 1,007 1,014
Repurchased (672) (672)
Retired (4) (127) (541) 672 —
Balance December 31, 2011 $ 237 $ 304 $ 10,107 $ 13,422 $ (8,750) $ (6,727) $ 469 $ 9,062
See Notes to the Consolidated Financial Statements beginning on page F-8.
F-6
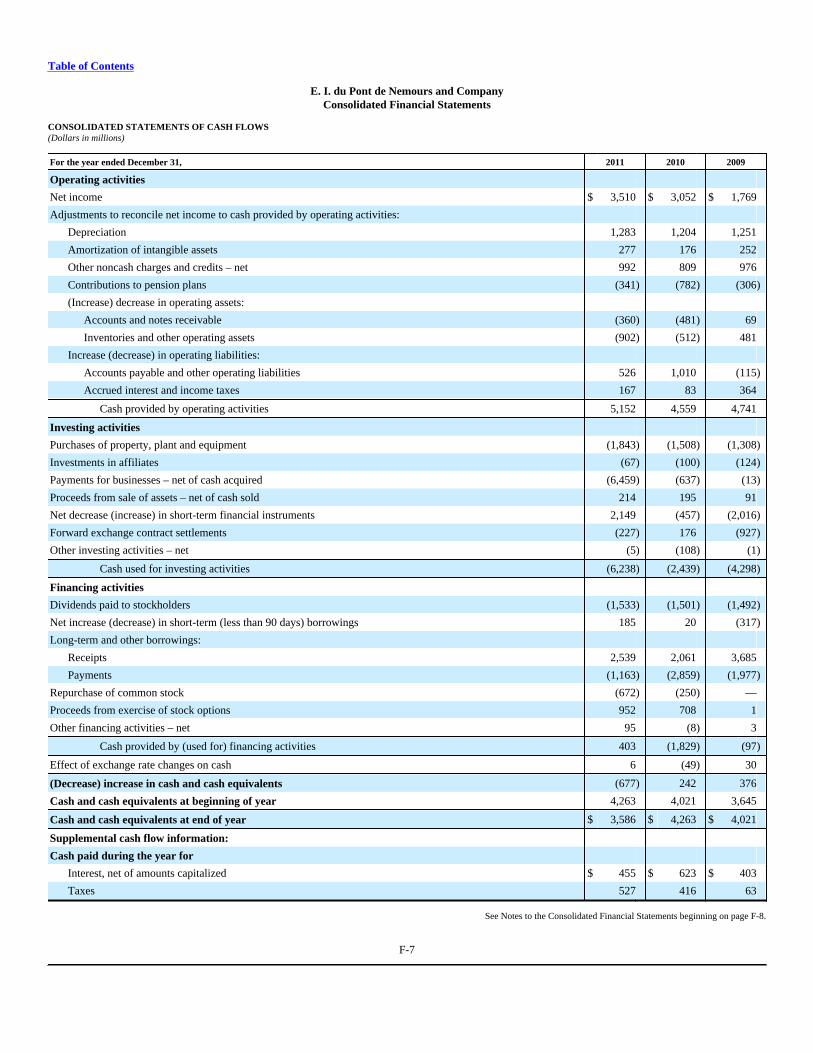
Table of Contents
E. I. du Pont de Nemours and CompanyConsolidated Financial Statements
CONSOLIDATED STATEMENTS OF CASH FLOWS(Dollars in millions)
For the year ended December 31, 2011 2010 2009
Operating activities
Net income $ 3,510 $ 3,052 $ 1,769
Adjustments to reconcile net income to cash provided by operating activities:
Depreciation 1,283 1,204 1,251
Amortization of intangible assets 277 176 252
Other noncash charges and credits – net 992 809 976
Contributions to pension plans (341) (782) (306)
(Increase) decrease in operating assets:
Accounts and notes receivable (360) (481) 69
Inventories and other operating assets (902) (512) 481
Increase (decrease) in operating liabilities:
Accounts payable and other operating liabilities 526 1,010 (115)
Accrued interest and income taxes 167 83 364
Cash provided by operating activities 5,152 4,559 4,741
Investing activities
Purchases of property, plant and equipment (1,843) (1,508) (1,308)
Investments in affiliates (67) (100) (124)
Payments for businesses – net of cash acquired (6,459) (637) (13)
Proceeds from sale of assets – net of cash sold 214 195 91
Net decrease (increase) in short-term financial instruments 2,149 (457) (2,016)
Forward exchange contract settlements (227) 176 (927)
Other investing activities – net (5) (108) (1)
Cash used for investing activities (6,238) (2,439) (4,298)
Financing activities
Dividends paid to stockholders (1,533) (1,501) (1,492)
Net increase (decrease) in short-term (less than 90 days) borrowings 185 20 (317)
Long-term and other borrowings:
Receipts 2,539 2,061 3,685
Payments (1,163) (2,859) (1,977)
Repurchase of common stock (672) (250) —
Proceeds from exercise of stock options 952 708 1
Other financing activities – net 95 (8) 3
Cash provided by (used for) financing activities 403 (1,829) (97)
Effect of exchange rate changes on cash 6 (49) 30
(Decrease) increase in cash and cash equivalents (677) 242 376
Cash and cash equivalents at beginning of year 4,263 4,021 3,645
Cash and cash equivalents at end of year $ 3,586 $ 4,263 $ 4,021
Supplemental cash flow information:
Cash paid during the year for
Interest, net of amounts capitalized $ 455 $ 623 $ 403
Taxes 527 416 63
See Notes to the Consolidated Financial Statements beginning on page F-8.
F-7
Table of Contents
E. I. du Pont de Nemours and CompanyNotes to the Consolidated Financial Statements
(Dollars in millions, except per share)
1. SUMMARY OF SIGNIFICANT ACCOUNTING POLICIESThe company follows generally accepted accounting principles in the United States of America (GAAP). The significant accounting policies described below,together with the other notes that follow, are an integral part of the Consolidated Financial Statements.
Preparation of Financial StatementsThe preparation of financial statements in conformity with GAAP requires management to make estimates and assumptions that affect the reported amountsof assets and liabilities and disclosure of contingent assets and liabilities at the date of the financial statements and the reported amounts of revenues andexpenses during the reporting period. Actual results could differ from those estimates.
Basis of ConsolidationThe Consolidated Financial Statements include the accounts of the company, subsidiaries in which a controlling interest is maintained and variable interestentities (VIEs) for which DuPont is the primary beneficiary. For those consolidated subsidiaries in which the company's ownership is less than 100 percent,the outside stockholders' interests are shown as noncontrolling interests. Investments in affiliates over which the company has significant influence but not acontrolling interest are carried on the equity basis. At December 31, 2011, the assets, liabilities and operations of VIEs for which DuPont is the primarybeneficiary were not material to the Consolidated Financial Statements of the company.
The company is also involved with certain joint ventures accounted for under the equity method of accounting that are VIEs. The company is not the primarybeneficiary, as the nature of the company's involvement with the VIEs does not provide it the power to direct the VIEs significant activities. Future eventsmay require these VIEs to be consolidated if the company becomes the primary beneficiary. At December 31, 2011, the maximum exposure to loss related tothe unconsolidated VIEs is not considered material to the Consolidated Financial Statements of the company.
Revenue RecognitionThe company recognizes revenue when the earnings process is complete. The company's revenues are from the sale of a wide range of products to adiversified base of customers around the world. Revenue for product sales is recognized upon delivery, when title and risk of loss have been transferred,collectability is reasonably assured and pricing is fixed or determinable. Substantially all product sales are sold FOB (free on board) shipping point or, withrespect to non United States of America (U.S.) customers, an equivalent basis. Accruals are made for sales returns and other allowances based on thecompany's experience. The company accounts for cash sales incentives as a reduction in sales and noncash sales incentives as a charge to cost of goods sold orselling expense, depending on the nature of the incentive. Amounts billed to customers for shipping and handling fees are included in net sales and costsincurred by the company for the delivery of goods are classified as cost of goods sold and other operating charges in the Consolidated Income Statements.Taxes on revenue-producing transactions are excluded from net sales.
The company periodically enters into prepayment contracts with customers in the Agriculture segment and receives advance payments for product to bedelivered in future periods. These advance payments are recorded as deferred revenue (classified as other accrued liabilities) or debt, depending on the natureof the program. Revenue associated with advance payments is recognized as shipments are made and title, ownership and risk of loss pass to the customer.
Licensing and royalty income is recognized in accordance with agreed upon terms, when performance obligations are satisfied, the amount is fixed ordeterminable and collectability is reasonably assured.
Cash and Cash EquivalentsCash equivalents represent investments with maturities of three months or less from time of purchase. They are carried at cost plus accrued interest, whichapproximates fair value because of the short-term maturity of these instruments.
Marketable SecuritiesMarketable securities represent investments in fixed and floating rate financial instruments with maturities greater than three months and up to twelve monthsat time of purchase. They are classified as held-to-maturity and recorded at amortized cost. The carrying value approximates fair value due to the short-termnature of the investments.
Fair Value MeasurementsUnder the accounting for fair value measurements and disclosures, a fair value hierarchy was established that prioritizes the inputs to valuation techniquesused to measure fair value. The hierarchy gives the highest priority to unadjusted quoted prices in active
F-8
Table of ContentsE. I. du Pont de Nemours and Company
Notes to the Consolidated Financial Statements (continued)(Dollars in millions, except per share)
markets for identical assets or liabilities (level 1 measurements) and the lowest priority to unobservable inputs (level 3 measurements). A financialinstrument's level within the fair value hierarchy is based on the lowest level of any input that is significant to the fair value measurement.
The company uses the following valuation techniques to measure fair value for its assets and liabilities:
Level 1 – Quoted market prices in active markets for identical assets or liabilities;
Level 2 – Significant other observable inputs (e.g. quoted prices for similar items in active markets, quoted prices for identical or similaritems in markets that are not active, inputs other than quoted prices that are observable such as interest rate and yield curves, andmarket-corroborated inputs);
Level 3 – Unobservable inputs for the asset or liability, which are valued based on management's estimates of assumptions that marketparticipants would use in pricing the asset or liability.
InventoriesThe majority of the company's inventories are valued at cost, as determined by the last-in, first-out (LIFO) method; in the aggregate, such valuations are not inexcess of market. Seed, certain food-ingredient and enzyme inventories are valued at the lower of cost, as determined by the first-in, first-out (FIFO) method,or market.
Elements of cost in inventories include raw materials, direct labor and manufacturing overhead. Stores and supplies are valued at cost or market, whichever islower; cost is generally determined by the average cost method.
Property, Plant and EquipmentProperty, plant and equipment is carried at cost and is depreciated using the straight-line method. Property, plant and equipment placed in service prior to1995 is depreciated under the sum-of-the-years' digits method or other substantially similar methods. Substantially all equipment and buildings aredepreciated over useful lives ranging from 15 to 25 years. Capitalizable costs associated with computer software for internal use are amortized on a straight-line basis over 5 to 7 years. When assets are surrendered, retired, sold or otherwise disposed of, their gross carrying values and related accumulateddepreciation are removed from the accounts and included in determining gain or loss on such disposals.
Maintenance and repairs are charged to operations; replacements and improvements are capitalized.
Goodwill and Other Intangible AssetsGoodwill represents costs in excess of fair values assigned to underlying net assets of acquired companies. Goodwill and indefinite-lived intangible assets aretested for impairment at least annually; however, these tests are performed more frequently when events or changes in circumstances indicate that the assetmay be impaired. The company's fair value methodology is based on prices of similar assets or other valuation methodologies including discounted cash flowtechniques. Impairment losses are included in cost of goods sold and other operating charges.
Definite-lived intangible assets, such as purchased and licensed technology, patents and customer lists are amortized over their estimated useful lives,generally for periods ranging from 1 to 20 years. The company continually evaluates the reasonableness of the useful lives of these assets. Once these assetsare fully amortized, they are removed from the Consolidated Balance Sheets.
Impairment of Long-Lived AssetsThe company evaluates the carrying value of long-lived assets to be held and used when events or changes in circumstances indicate the carrying value maynot be recoverable. The carrying value of a long-lived asset is considered impaired when the total projected undiscounted cash flows from the asset areseparately identifiable and are less than its carrying value. In that event, a loss is recognized based on the amount by which the carrying value exceeds the fairvalue of the long-lived asset. The company's fair value methodology is an estimate of fair market value which is made based on prices of similar assets orother valuation methodologies including present value techniques. Long-lived assets to be disposed of other than by sale are classified as held for use untiltheir disposal. Long-lived assets to be disposed of by sale are classified as held for sale and are reported at the lower of carrying amount or fair market valueless cost to sell. Depreciation is discontinued for long-lived assets classified as held for sale.
Research and DevelopmentResearch and development costs are expensed as incurred.
F-9
Table of ContentsE. I. du Pont de Nemours and Company
Notes to the Consolidated Financial Statements (continued)(Dollars in millions, except per share)
EnvironmentalAccruals for environmental matters are recorded in operating expenses when it is probable that a liability has been incurred and the amount of the liability canbe reasonably estimated. Accrued liabilities do not include claims against third parties and are not discounted.
Costs related to environmental remediation and restoration are charged to expense. Other environmental costs are also charged to expense unless they increasethe value of the property or reduce or prevent contamination from future operations, in which case, they are capitalized.
Asset Retirement ObligationsThe company records asset retirement obligations at fair value at the time the liability is incurred. Accretion expense is recognized as an operating expenseusing the credit-adjusted risk-free interest rate in effect when the liability was recognized. The associated asset retirement obligations are capitalized as part ofthe carrying amount of the long-lived asset and depreciated over the estimated remaining useful life of the asset, generally for periods ranging from 1 to25 years.
LitigationThe company accrues for liabilities related to litigation matters when the information available indicates that it is probable that a liability has been incurredand the amount of the liability can be reasonably estimated. Legal costs such as outside counsel fees and expenses are charged to expense in the periodincurred.
Insurance/Self-InsuranceThe company self-insures certain risks where permitted by law or regulation, including workers' compensation, vehicle liability and employee related benefits.Liabilities associated with these risks are estimated in part by considering historical claims experience, demographic factors and other actuarial assumptions.For other risks, the company uses a combination of insurance and self-insurance, reflecting comprehensive reviews of relevant risks. A receivable for aninsurance recovery is generally recognized when the loss has occurred and collection is considered probable.
Income TaxesThe provision for income taxes is determined using the asset and liability approach of accounting for income taxes. Under this approach, deferred taxesrepresent the future tax consequences expected to occur when the reported amounts of assets and liabilities are recovered or paid. The provision for incometaxes represents income taxes paid or payable for the current year plus the change in deferred taxes during the year. Deferred taxes result from differencesbetween the financial and tax basis of the company's assets and liabilities and are adjusted for changes in tax rates and tax laws when changes are enacted.Valuation allowances are recorded to reduce deferred tax assets when it is more likely than not that a tax benefit will not be realized. Provision has been madefor income taxes on unremitted earnings of subsidiaries and affiliates, except for subsidiaries in which earnings are deemed to be indefinitely invested.Investment tax credits or grants are accounted for in the period earned (the flow-through method). Interest accrued related to unrecognized tax benefits isincluded in miscellaneous income and expenses, net, under other income, net. Income tax related penalties are included in the provision for income taxes.
Foreign Currency TranslationThe U.S. dollar (USD) is the functional currency of most of the company's worldwide operations. For subsidiaries where the USD is the functional currency,all foreign currency asset and liability amounts are remeasured into USD at end-of-period exchange rates, except for inventories, prepaid expenses, property,plant and equipment, goodwill and other intangible assets, which are remeasured at historical rates. Foreign currency income and expenses are remeasured ataverage exchange rates in effect during the year, except for expenses related to balance sheet amounts remeasured at historical exchange rates. Exchangegains and losses arising from remeasurement of foreign currency-denominated monetary assets and liabilities are included in income in the period in whichthey occur.
For subsidiaries where the local currency is the functional currency, assets and liabilities denominated in local currencies are translated into USD at end-of-period exchange rates and the resultant translation adjustments are reported, net of their related tax effects, as a component of accumulated othercomprehensive income (loss) in equity. Assets and liabilities denominated in other than the local currency are remeasured into the local currency prior totranslation into USD and the resultant exchange gains or losses are included in income in the period in which they occur. Income and expenses are translatedinto USD at average exchange rates in effect during the period.
F-10
Table of ContentsE. I. du Pont de Nemours and Company
Notes to the Consolidated Financial Statements (continued)(Dollars in millions, except per share)
Hedging and Trading ActivitiesDerivative instruments are reported in the Consolidated Balance Sheets at their fair values. For derivative instruments designated as fair value hedges, changesin the fair values of the derivative instruments will generally be offset in the income statement by changes in the fair value of the hedged items. For derivativeinstruments designated as cash flow hedges, the effective portion of any hedge is reported in accumulated other comprehensive income (loss) until it is clearedto earnings during the same period in which the hedged item affects earnings. The ineffective portion of all hedges is recognized in current period earnings.Changes in the fair values of derivative instruments that are not designated as hedges are recorded in current period earnings.
In the event that a derivative designated as a hedge of a firm commitment or an anticipated transaction is terminated prior to the maturation of the hedgedtransaction, gains or losses realized at termination are deferred and included in the measurement of the hedged transaction. If a hedged transaction matures, oris sold, extinguished, or terminated prior to the maturity of a derivative designated as a hedge of such transaction, gains or losses associated with thederivative through the date the transaction matured are included in the measurement of the hedged transaction and the derivative is reclassified as for tradingpurposes. Derivatives designated as a hedge of an anticipated transaction are reclassified as for trading purposes if the anticipated transaction is no longerprobable.
Cash flows from derivative instruments accounted for as either fair value hedges or cash flow hedges are reported in the same category as the cash flows fromthe items being hedged. Cash flows from all other derivative instruments are generally reported as investing activities in the Consolidated Statements of CashFlows. See Note 19 for additional discussion regarding the company's objectives and strategies for derivative instruments.
ReclassificationsCertain reclassifications of prior years' data have been made to conform to 2011 classifications.
Recent Accounting PronouncementsIn May 2011, the Financial Accounting Standards Board (FASB) issued authoritative guidance on fair value measurements and disclosures which becomeseffective for interim and annual periods beginning after December 15, 2011. The new guidance enhances disclosures and refines certain aspects of fair valuemeasurement that primarily affect financial instruments. The adoption of this guidance is not expected to have a material effect on the company's financialposition or results of operations.
In June 2011, the FASB issued amendments to the presentation of comprehensive income which becomes effective for interim and annual periods beginningafter December 15, 2011. The amendments eliminate the current reporting option of displaying components of other comprehensive income within thestatement of changes in stockholders' equity. Under the new guidance, the company expects to present an income statement immediately followed by astatement of comprehensive income.
2. DANISCO ACQUISTIONIn January 2011, DuPont and its wholly owned subsidiary, DuPont Denmark Holding ApS (DDHA), entered into a definitive agreement with Danisco A/S(Danisco), a global enzyme and specialty food ingredients company, for DDHA to make a public tender offer for all of Danisco's outstanding shares at a priceof 665 Danish Kroner (DKK) in cash per share. On April 29, 2011, DDHA increased the price of its tender offer to acquire all of the outstanding shares ofDanisco to DKK 700 in cash per share.
On May 19, 2011, the company acquired approximately 92.2 percent of Danisco's outstanding shares, excluding treasury shares, pursuant to the previouslyannounced tender offer. From May 19, 2011 to September 22, 2011, DuPont acquired all of Danisco's remaining outstanding shares. This acquisition hasestablished DuPont as a leader in industrial biotechnology with science-intensive innovations that address global challenges in food production and reducedfossil fuel consumption. The Danisco acquisition was valued at $6,417 , plus net debt assumed of $617 .
As part of the Danisco acquisition, DuPont incurred $85 in transaction related costs during 2011, which were recorded in costs of goods sold and otheroperating charges. In 2011, Danisco contributed net sales of $1,713 and net income attributable to DuPont of $(7), which excludes $30 after-tax ($39 pre-tax)of additional interest expense related to the debt issued to finance the acquisition. Danisco's contributions included a $125 after-tax ($175 pre-tax) chargerelated to the fair value step-up of inventories acquired and sold during 2011.
F-11
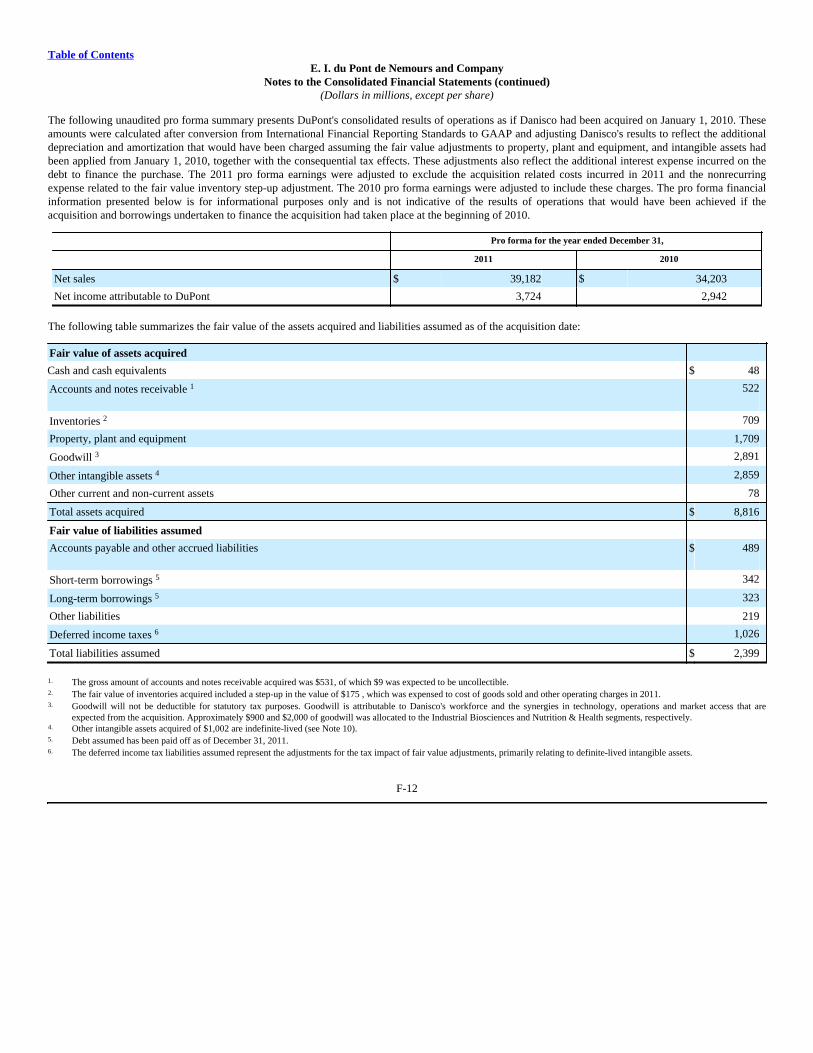
Table of ContentsE. I. du Pont de Nemours and Company
Notes to the Consolidated Financial Statements (continued)(Dollars in millions, except per share)
The following unaudited pro forma summary presents DuPont's consolidated results of operations as if Danisco had been acquired on January 1, 2010. Theseamounts were calculated after conversion from International Financial Reporting Standards to GAAP and adjusting Danisco's results to reflect the additionaldepreciation and amortization that would have been charged assuming the fair value adjustments to property, plant and equipment, and intangible assets hadbeen applied from January 1, 2010, together with the consequential tax effects. These adjustments also reflect the additional interest expense incurred on thedebt to finance the purchase. The 2011 pro forma earnings were adjusted to exclude the acquisition related costs incurred in 2011 and the nonrecurringexpense related to the fair value inventory step-up adjustment. The 2010 pro forma earnings were adjusted to include these charges. The pro forma financialinformation presented below is for informational purposes only and is not indicative of the results of operations that would have been achieved if theacquisition and borrowings undertaken to finance the acquisition had taken place at the beginning of 2010.
Pro forma for the year ended December 31,
2011 2010
Net sales $ 39,182 $ 34,203
Net income attributable to DuPont 3,724 2,942
The following table summarizes the fair value of the assets acquired and liabilities assumed as of the acquisition date:
Fair value of assets acquired
Cash and cash equivalents $ 48
Accounts and notes receivable 1 522
Inventories 2 709
Property, plant and equipment 1,709
Goodwill 3 2,891
Other intangible assets 4 2,859
Other current and non-current assets 78
Total assets acquired $ 8,816
Fair value of liabilities assumed
Accounts payable and other accrued liabilities $ 489
Short-term borrowings 5 342
Long-term borrowings 5 323
Other liabilities 219
Deferred income taxes 6 1,026
Total liabilities assumed $ 2,399
1. The gross amount of accounts and notes receivable acquired was $531, of which $9 was expected to be uncollectible.2. The fair value of inventories acquired included a step-up in the value of $175 , which was expensed to cost of goods sold and other operating charges in 2011.3. Goodwill will not be deductible for statutory tax purposes. Goodwill is attributable to Danisco's workforce and the synergies in technology, operations and market access that are
expected from the acquisition. Approximately $900 and $2,000 of goodwill was allocated to the Industrial Biosciences and Nutrition & Health segments, respectively.4. Other intangible assets acquired of $1,002 are indefinite-lived (see Note 10).5. Debt assumed has been paid off as of December 31, 2011.6. The deferred income tax liabilities assumed represent the adjustments for the tax impact of fair value adjustments, primarily relating to definite-lived intangible assets.
F-12
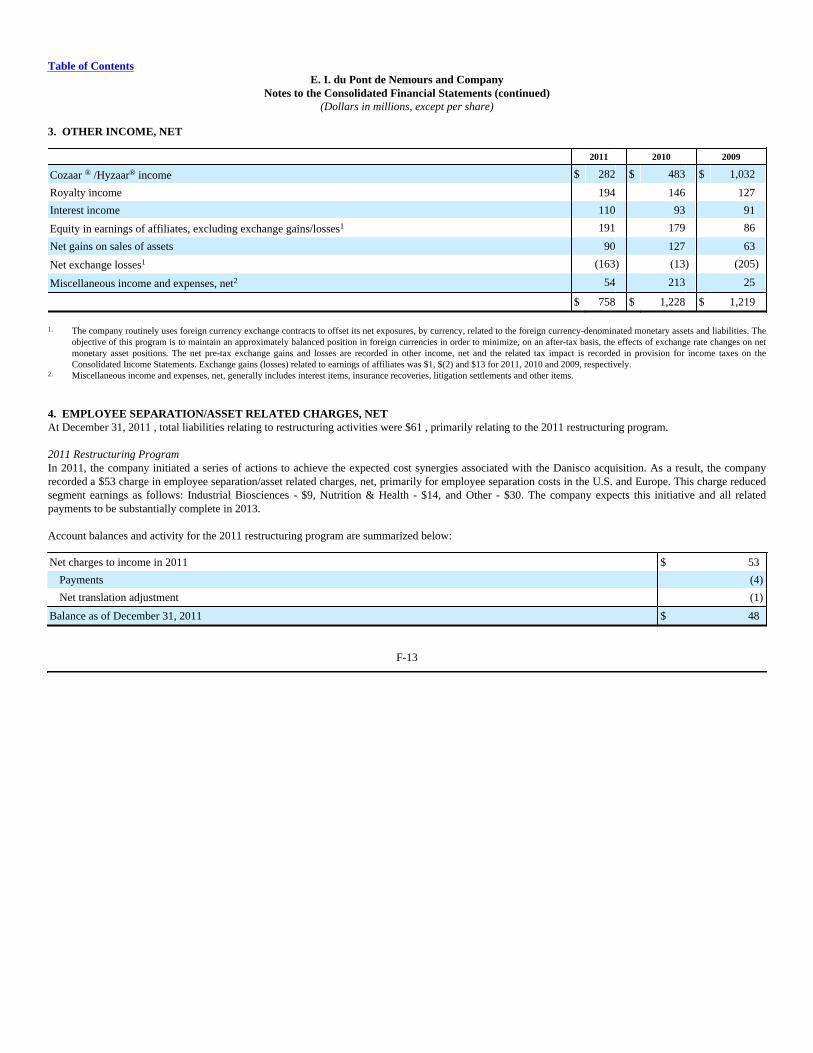
Table of ContentsE. I. du Pont de Nemours and Company
Notes to the Consolidated Financial Statements (continued)(Dollars in millions, except per share)
3. OTHER INCOME, NET
2011 2010 2009
Cozaar ® /Hyzaar® income $ 282 $ 483 $ 1,032
Royalty income 194 146 127
Interest income 110 93 91
Equity in earnings of affiliates, excluding exchange gains/losses1 191 179 86
Net gains on sales of assets 90 127 63
Net exchange losses1 (163) (13) (205)
Miscellaneous income and expenses, net2 54 213 25
$ 758 $ 1,228 $ 1,219
1. The company routinely uses foreign currency exchange contracts to offset its net exposures, by currency, related to the foreign currency-denominated monetary assets and liabilities. Theobjective of this program is to maintain an approximately balanced position in foreign currencies in order to minimize, on an after-tax basis, the effects of exchange rate changes on netmonetary asset positions. The net pre-tax exchange gains and losses are recorded in other income, net and the related tax impact is recorded in provision for income taxes on theConsolidated Income Statements. Exchange gains (losses) related to earnings of affiliates was $1, $(2) and $13 for 2011, 2010 and 2009, respectively.
2. Miscellaneous income and expenses, net, generally includes interest items, insurance recoveries, litigation settlements and other items.
4. EMPLOYEE SEPARATION/ASSET RELATED CHARGES, NETAt December 31, 2011 , total liabilities relating to restructuring activities were $61 , primarily relating to the 2011 restructuring program.
2011 Restructuring ProgramIn 2011, the company initiated a series of actions to achieve the expected cost synergies associated with the Danisco acquisition. As a result, the companyrecorded a $53 charge in employee separation/asset related charges, net, primarily for employee separation costs in the U.S. and Europe. This charge reducedsegment earnings as follows: Industrial Biosciences - $9, Nutrition & Health - $14, and Other - $30. The company expects this initiative and all relatedpayments to be substantially complete in 2013.
Account balances and activity for the 2011 restructuring program are summarized below:
Net charges to income in 2011 $ 53
Payments (4)
Net translation adjustment (1)
Balance as of December 31, 2011 $ 48
F-13
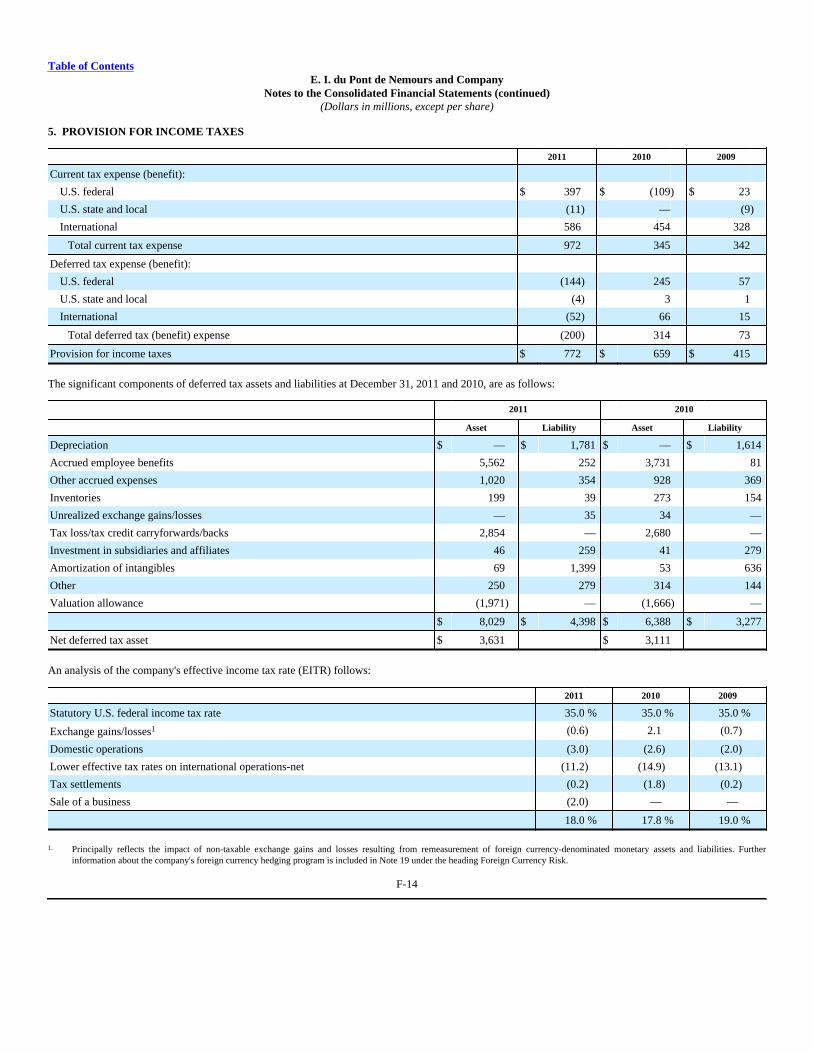
Table of ContentsE. I. du Pont de Nemours and Company
Notes to the Consolidated Financial Statements (continued)(Dollars in millions, except per share)
5. PROVISION FOR INCOME TAXES
2011 2010 2009
Current tax expense (benefit):
U.S. federal $ 397 $ (109) $ 23
U.S. state and local (11) — (9)
International 586 454 328
Total current tax expense 972 345 342
Deferred tax expense (benefit):
U.S. federal (144) 245 57
U.S. state and local (4) 3 1
International (52) 66 15
Total deferred tax (benefit) expense (200) 314 73
Provision for income taxes $ 772 $ 659 $ 415
The significant components of deferred tax assets and liabilities at December 31, 2011 and 2010, are as follows:
2011 2010
Asset Liability Asset Liability
Depreciation $ — $ 1,781 $ — $ 1,614
Accrued employee benefits 5,562 252 3,731 81
Other accrued expenses 1,020 354 928 369
Inventories 199 39 273 154
Unrealized exchange gains/losses — 35 34 —
Tax loss/tax credit carryforwards/backs 2,854 — 2,680 —
Investment in subsidiaries and affiliates 46 259 41 279
Amortization of intangibles 69 1,399 53 636
Other 250 279 314 144
Valuation allowance (1,971) — (1,666) —
$ 8,029 $ 4,398 $ 6,388 $ 3,277
Net deferred tax asset $ 3,631 $ 3,111
An analysis of the company's effective income tax rate (EITR) follows:
2011 2010 2009
Statutory U.S. federal income tax rate 35.0 % 35.0 % 35.0 %
Exchange gains/losses1 (0.6) 2.1 (0.7)
Domestic operations (3.0) (2.6) (2.0)
Lower effective tax rates on international operations-net (11.2) (14.9) (13.1)
Tax settlements (0.2) (1.8) (0.2)
Sale of a business (2.0) — —
18.0 % 17.8 % 19.0 %
1. Principally reflects the impact of non-taxable exchange gains and losses resulting from remeasurement of foreign currency-denominated monetary assets and liabilities. Furtherinformation about the company's foreign currency hedging program is included in Note 19 under the heading Foreign Currency Risk.
F-14
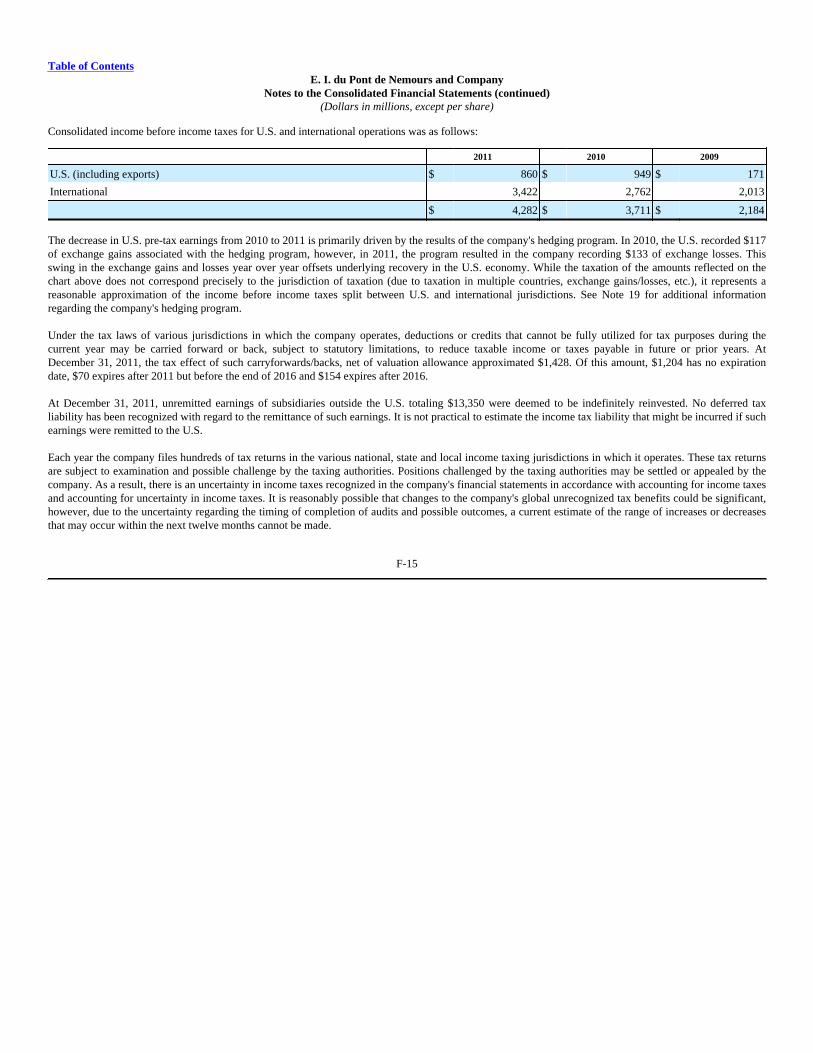
Table of ContentsE. I. du Pont de Nemours and Company
Notes to the Consolidated Financial Statements (continued)(Dollars in millions, except per share)
Consolidated income before income taxes for U.S. and international operations was as follows:
2011 2010 2009
U.S. (including exports) $ 860 $ 949 $ 171
International 3,422 2,762 2,013
$ 4,282 $ 3,711 $ 2,184
The decrease in U.S. pre-tax earnings from 2010 to 2011 is primarily driven by the results of the company's hedging program. In 2010, the U.S. recorded $117of exchange gains associated with the hedging program, however, in 2011, the program resulted in the company recording $133 of exchange losses. Thisswing in the exchange gains and losses year over year offsets underlying recovery in the U.S. economy. While the taxation of the amounts reflected on thechart above does not correspond precisely to the jurisdiction of taxation (due to taxation in multiple countries, exchange gains/losses, etc.), it represents areasonable approximation of the income before income taxes split between U.S. and international jurisdictions. See Note 19 for additional informationregarding the company's hedging program.
Under the tax laws of various jurisdictions in which the company operates, deductions or credits that cannot be fully utilized for tax purposes during thecurrent year may be carried forward or back, subject to statutory limitations, to reduce taxable income or taxes payable in future or prior years. AtDecember 31, 2011, the tax effect of such carryforwards/backs, net of valuation allowance approximated $1,428. Of this amount, $1,204 has no expirationdate, $70 expires after 2011 but before the end of 2016 and $154 expires after 2016.
At December 31, 2011, unremitted earnings of subsidiaries outside the U.S. totaling $13,350 were deemed to be indefinitely reinvested. No deferred taxliability has been recognized with regard to the remittance of such earnings. It is not practical to estimate the income tax liability that might be incurred if suchearnings were remitted to the U.S.
Each year the company files hundreds of tax returns in the various national, state and local income taxing jurisdictions in which it operates. These tax returnsare subject to examination and possible challenge by the taxing authorities. Positions challenged by the taxing authorities may be settled or appealed by thecompany. As a result, there is an uncertainty in income taxes recognized in the company's financial statements in accordance with accounting for income taxesand accounting for uncertainty in income taxes. It is reasonably possible that changes to the company's global unrecognized tax benefits could be significant,however, due to the uncertainty regarding the timing of completion of audits and possible outcomes, a current estimate of the range of increases or decreasesthat may occur within the next twelve months cannot be made.
F-15
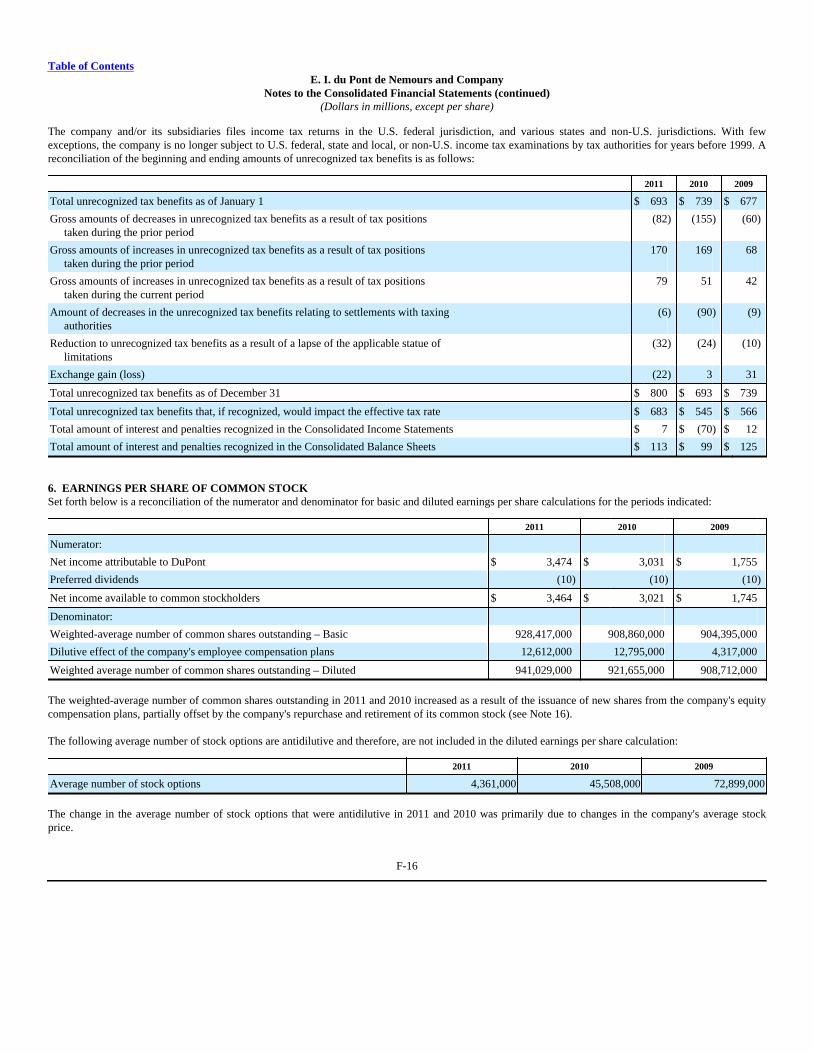
Table of ContentsE. I. du Pont de Nemours and Company
Notes to the Consolidated Financial Statements (continued)(Dollars in millions, except per share)
The company and/or its subsidiaries files income tax returns in the U.S. federal jurisdiction, and various states and non-U.S. jurisdictions. With fewexceptions, the company is no longer subject to U.S. federal, state and local, or non-U.S. income tax examinations by tax authorities for years before 1999. Areconciliation of the beginning and ending amounts of unrecognized tax benefits is as follows:
2011 2010 2009
Total unrecognized tax benefits as of January 1 $ 693 $ 739 $ 677
Gross amounts of decreases in unrecognized tax benefits as a result of tax positions taken during the prior period
(82) (155) (60)
Gross amounts of increases in unrecognized tax benefits as a result of tax positions taken during the prior period
170 169 68
Gross amounts of increases in unrecognized tax benefits as a result of tax positions taken during the current period
79 51 42
Amount of decreases in the unrecognized tax benefits relating to settlements with taxing authorities
(6) (90) (9)
Reduction to unrecognized tax benefits as a result of a lapse of the applicable statue of limitations
(32) (24) (10)
Exchange gain (loss) (22) 3 31
Total unrecognized tax benefits as of December 31 $ 800 $ 693 $ 739
Total unrecognized tax benefits that, if recognized, would impact the effective tax rate $ 683 $ 545 $ 566
Total amount of interest and penalties recognized in the Consolidated Income Statements $ 7 $ (70) $ 12
Total amount of interest and penalties recognized in the Consolidated Balance Sheets $ 113 $ 99 $ 125
6. EARNINGS PER SHARE OF COMMON STOCKSet forth below is a reconciliation of the numerator and denominator for basic and diluted earnings per share calculations for the periods indicated:
2011 2010 2009
Numerator:
Net income attributable to DuPont $ 3,474 $ 3,031 $ 1,755
Preferred dividends (10) (10) (10)
Net income available to common stockholders $ 3,464 $ 3,021 $ 1,745
Denominator:
Weighted-average number of common shares outstanding – Basic 928,417,000 908,860,000 904,395,000
Dilutive effect of the company's employee compensation plans 12,612,000 12,795,000 4,317,000
Weighted average number of common shares outstanding – Diluted 941,029,000 921,655,000 908,712,000
The weighted-average number of common shares outstanding in 2011 and 2010 increased as a result of the issuance of new shares from the company's equitycompensation plans, partially offset by the company's repurchase and retirement of its common stock (see Note 16).
The following average number of stock options are antidilutive and therefore, are not included in the diluted earnings per share calculation:
2011 2010 2009
Average number of stock options 4,361,000 45,508,000 72,899,000
The change in the average number of stock options that were antidilutive in 2011 and 2010 was primarily due to changes in the company's average stockprice.
F-16
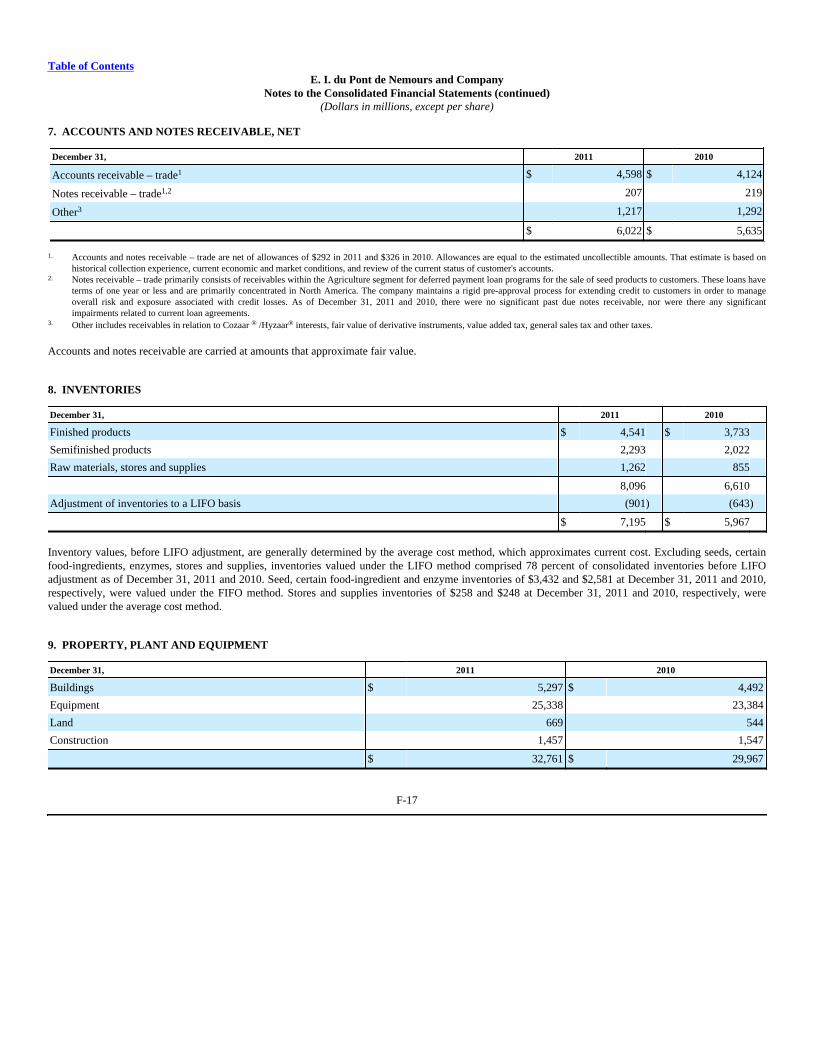
Table of ContentsE. I. du Pont de Nemours and Company
Notes to the Consolidated Financial Statements (continued)(Dollars in millions, except per share)
7. ACCOUNTS AND NOTES RECEIVABLE, NET
December 31, 2011 2010
Accounts receivable – trade1 $ 4,598 $ 4,124
Notes receivable – trade1,2 207 219
Other3 1,217 1,292
$ 6,022 $ 5,635
1. Accounts and notes receivable – trade are net of allowances of $292 in 2011 and $326 in 2010. Allowances are equal to the estimated uncollectible amounts. That estimate is based onhistorical collection experience, current economic and market conditions, and review of the current status of customer's accounts.
2. Notes receivable – trade primarily consists of receivables within the Agriculture segment for deferred payment loan programs for the sale of seed products to customers. These loans haveterms of one year or less and are primarily concentrated in North America. The company maintains a rigid pre-approval process for extending credit to customers in order to manageoverall risk and exposure associated with credit losses. As of December 31, 2011 and 2010, there were no significant past due notes receivable, nor were there any significantimpairments related to current loan agreements.
3. Other includes receivables in relation to Cozaar ® /Hyzaar® interests, fair value of derivative instruments, value added tax, general sales tax and other taxes.
Accounts and notes receivable are carried at amounts that approximate fair value.
8. INVENTORIES
December 31, 2011 2010
Finished products $ 4,541 $ 3,733
Semifinished products 2,293 2,022
Raw materials, stores and supplies 1,262 855
8,096 6,610
Adjustment of inventories to a LIFO basis (901) (643)
$ 7,195 $ 5,967
Inventory values, before LIFO adjustment, are generally determined by the average cost method, which approximates current cost. Excluding seeds, certainfood-ingredients, enzymes, stores and supplies, inventories valued under the LIFO method comprised 78 percent of consolidated inventories before LIFOadjustment as of December 31, 2011 and 2010. Seed, certain food-ingredient and enzyme inventories of $3,432 and $2,581 at December 31, 2011 and 2010,respectively, were valued under the FIFO method. Stores and supplies inventories of $258 and $248 at December 31, 2011 and 2010, respectively, werevalued under the average cost method.
9. PROPERTY, PLANT AND EQUIPMENT
December 31, 2011 2010
Buildings $ 5,297 $ 4,492
Equipment 25,338 23,384
Land 669 544
Construction 1,457 1,547
$ 32,761 $ 29,967
F-17
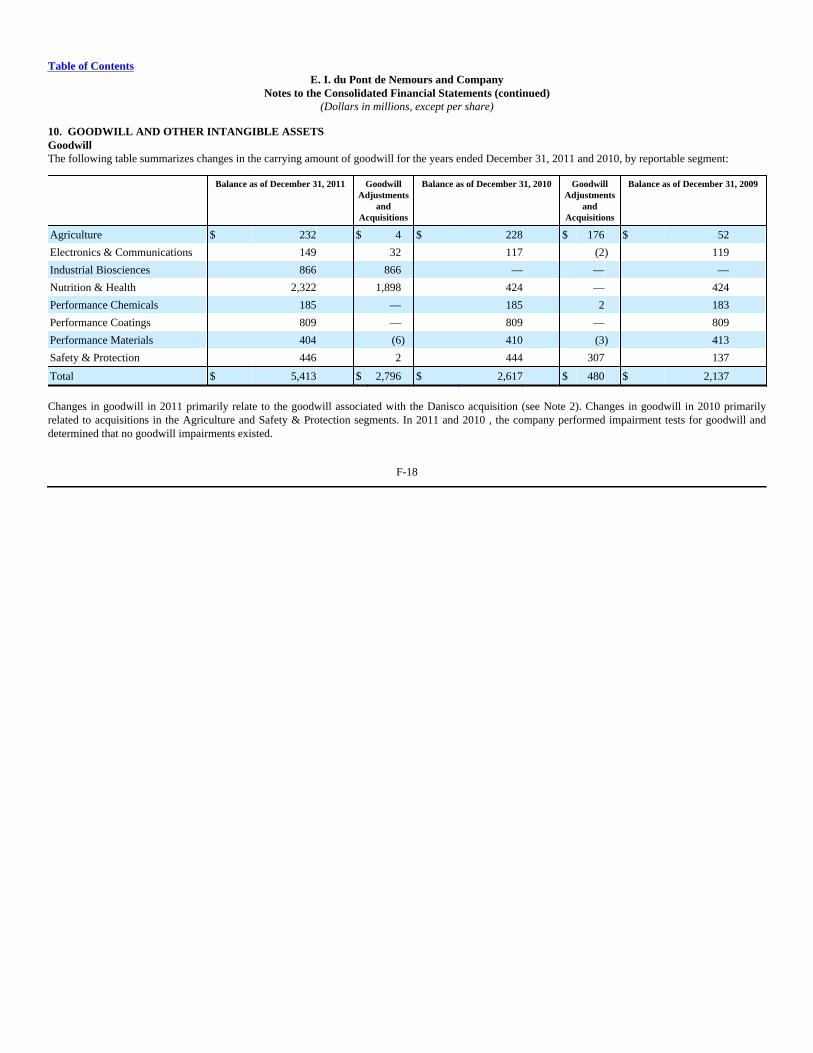
Table of ContentsE. I. du Pont de Nemours and Company
Notes to the Consolidated Financial Statements (continued)(Dollars in millions, except per share)
10. GOODWILL AND OTHER INTANGIBLE ASSETSGoodwillThe following table summarizes changes in the carrying amount of goodwill for the years ended December 31, 2011 and 2010, by reportable segment:
Balance as of December 31, 2011 GoodwillAdjustments
andAcquisitions
Balance as of December 31, 2010 GoodwillAdjustments
andAcquisitions
Balance as of December 31, 2009
Agriculture $ 232 $ 4 $ 228 $ 176 $ 52
Electronics & Communications 149 32 117 (2) 119
Industrial Biosciences 866 866 — — —
Nutrition & Health 2,322 1,898 424 — 424
Performance Chemicals 185 — 185 2 183
Performance Coatings 809 — 809 — 809
Performance Materials 404 (6) 410 (3) 413
Safety & Protection 446 2 444 307 137
Total $ 5,413 $ 2,796 $ 2,617 $ 480 $ 2,137
Changes in goodwill in 2011 primarily relate to the goodwill associated with the Danisco acquisition (see Note 2). Changes in goodwill in 2010 primarilyrelated to acquisitions in the Agriculture and Safety & Protection segments. In 2011 and 2010 , the company performed impairment tests for goodwill anddetermined that no goodwill impairments existed.
F-18
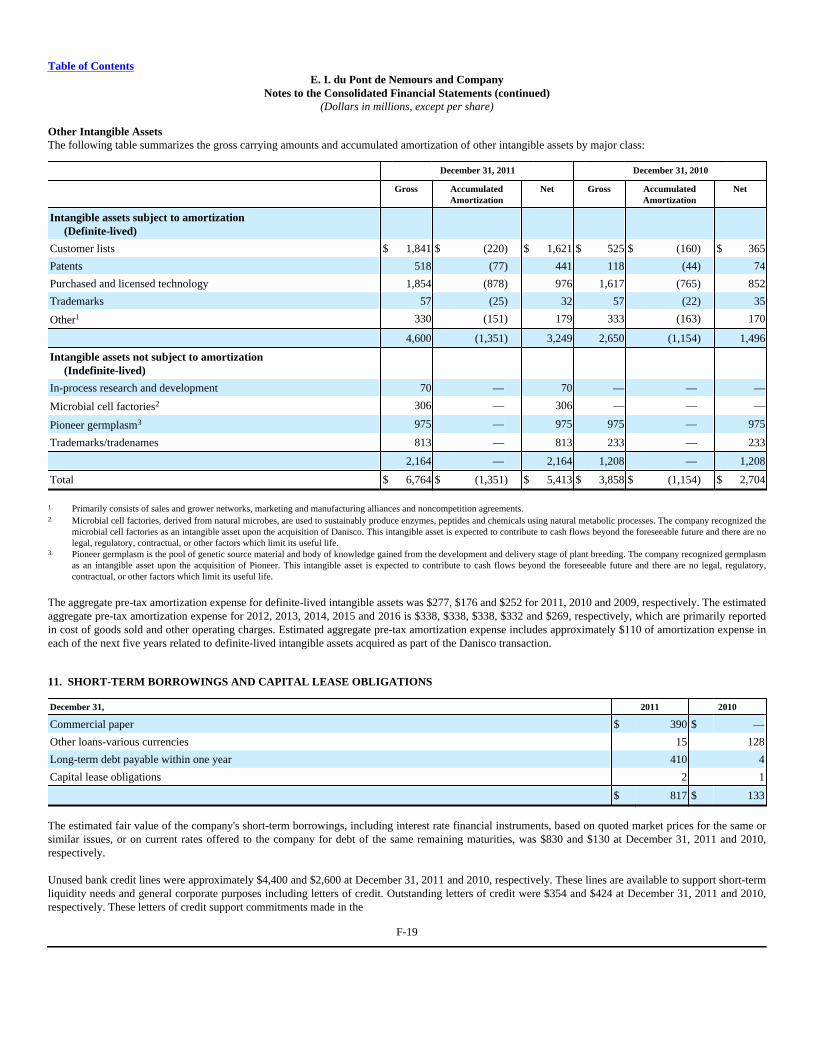
Table of ContentsE. I. du Pont de Nemours and Company
Notes to the Consolidated Financial Statements (continued)(Dollars in millions, except per share)
Other Intangible AssetsThe following table summarizes the gross carrying amounts and accumulated amortization of other intangible assets by major class:
December 31, 2011 December 31, 2010
Gross AccumulatedAmortization
Net Gross AccumulatedAmortization
Net
Intangible assets subject to amortization (Definite-lived)
Customer lists $ 1,841 $ (220) $ 1,621 $ 525 $ (160) $ 365
Patents 518 (77) 441 118 (44) 74
Purchased and licensed technology 1,854 (878) 976 1,617 (765) 852
Trademarks 57 (25) 32 57 (22) 35
Other1 330 (151) 179 333 (163) 170
4,600 (1,351) 3,249 2,650 (1,154) 1,496
Intangible assets not subject to amortization (Indefinite-lived)
In-process research and development 70 — 70 — — —
Microbial cell factories2 306 — 306 — — —
Pioneer germplasm3 975 — 975 975 — 975
Trademarks/tradenames 813 — 813 233 — 233
2,164 — 2,164 1,208 — 1,208
Total $ 6,764 $ (1,351) $ 5,413 $ 3,858 $ (1,154) $ 2,704
1. Primarily consists of sales and grower networks, marketing and manufacturing alliances and noncompetition agreements.2. Microbial cell factories, derived from natural microbes, are used to sustainably produce enzymes, peptides and chemicals using natural metabolic processes. The company recognized the
microbial cell factories as an intangible asset upon the acquisition of Danisco. This intangible asset is expected to contribute to cash flows beyond the foreseeable future and there are nolegal, regulatory, contractual, or other factors which limit its useful life.
3. Pioneer germplasm is the pool of genetic source material and body of knowledge gained from the development and delivery stage of plant breeding. The company recognized germplasmas an intangible asset upon the acquisition of Pioneer. This intangible asset is expected to contribute to cash flows beyond the foreseeable future and there are no legal, regulatory,contractual, or other factors which limit its useful life.
The aggregate pre-tax amortization expense for definite-lived intangible assets was $277, $176 and $252 for 2011, 2010 and 2009, respectively. The estimatedaggregate pre-tax amortization expense for 2012, 2013, 2014, 2015 and 2016 is $338, $338, $338, $332 and $269, respectively, which are primarily reportedin cost of goods sold and other operating charges. Estimated aggregate pre-tax amortization expense includes approximately $110 of amortization expense ineach of the next five years related to definite-lived intangible assets acquired as part of the Danisco transaction.
11. SHORT-TERM BORROWINGS AND CAPITAL LEASE OBLIGATIONS
December 31, 2011 2010
Commercial paper $ 390 $ —
Other loans-various currencies 15 128
Long-term debt payable within one year 410 4
Capital lease obligations 2 1
$ 817 $ 133
The estimated fair value of the company's short-term borrowings, including interest rate financial instruments, based on quoted market prices for the same orsimilar issues, or on current rates offered to the company for debt of the same remaining maturities, was $830 and $130 at December 31, 2011 and 2010,respectively.
Unused bank credit lines were approximately $4,400 and $2,600 at December 31, 2011 and 2010, respectively. These lines are available to support short-termliquidity needs and general corporate purposes including letters of credit. Outstanding letters of credit were $354 and $424 at December 31, 2011 and 2010,respectively. These letters of credit support commitments made in the
F-19
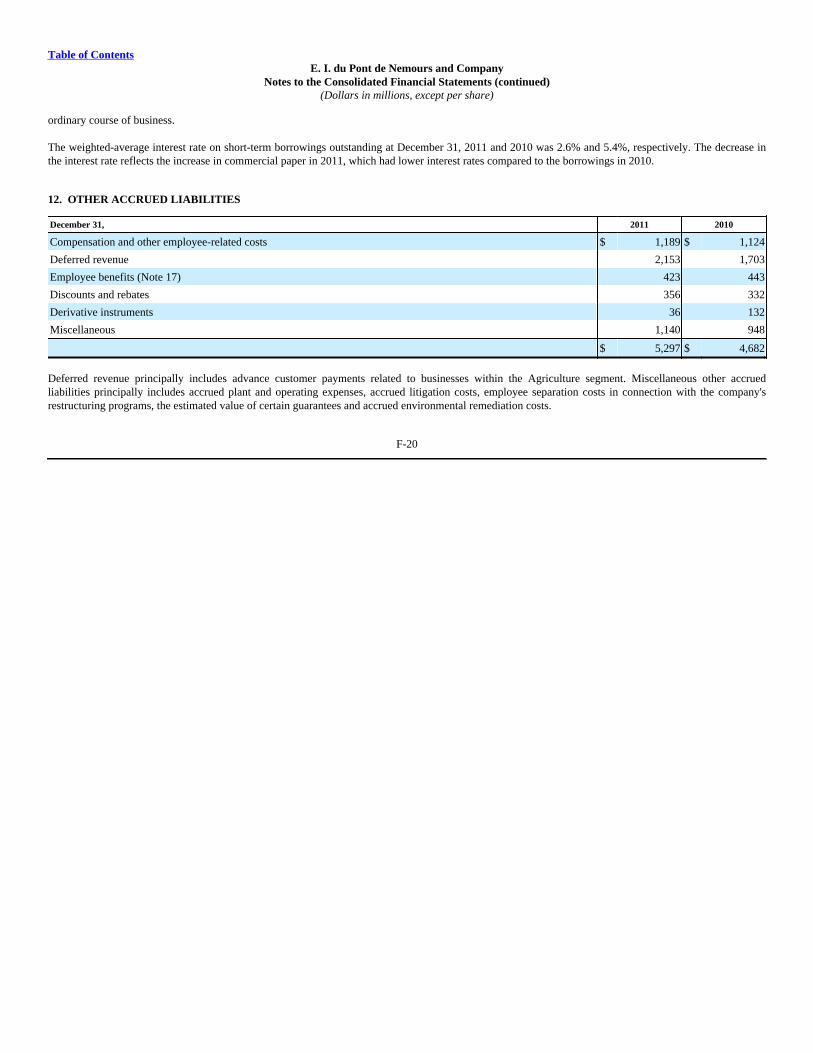
Table of ContentsE. I. du Pont de Nemours and Company
Notes to the Consolidated Financial Statements (continued)(Dollars in millions, except per share)
ordinary course of business.
The weighted-average interest rate on short-term borrowings outstanding at December 31, 2011 and 2010 was 2.6% and 5.4%, respectively. The decrease inthe interest rate reflects the increase in commercial paper in 2011, which had lower interest rates compared to the borrowings in 2010.
12. OTHER ACCRUED LIABILITIES
December 31, 2011 2010
Compensation and other employee-related costs $ 1,189 $ 1,124
Deferred revenue 2,153 1,703
Employee benefits (Note 17) 423 443
Discounts and rebates 356 332
Derivative instruments 36 132
Miscellaneous 1,140 948
$ 5,297 $ 4,682
Deferred revenue principally includes advance customer payments related to businesses within the Agriculture segment. Miscellaneous other accruedliabilities principally includes accrued plant and operating expenses, accrued litigation costs, employee separation costs in connection with the company'srestructuring programs, the estimated value of certain guarantees and accrued environmental remediation costs.
F-20
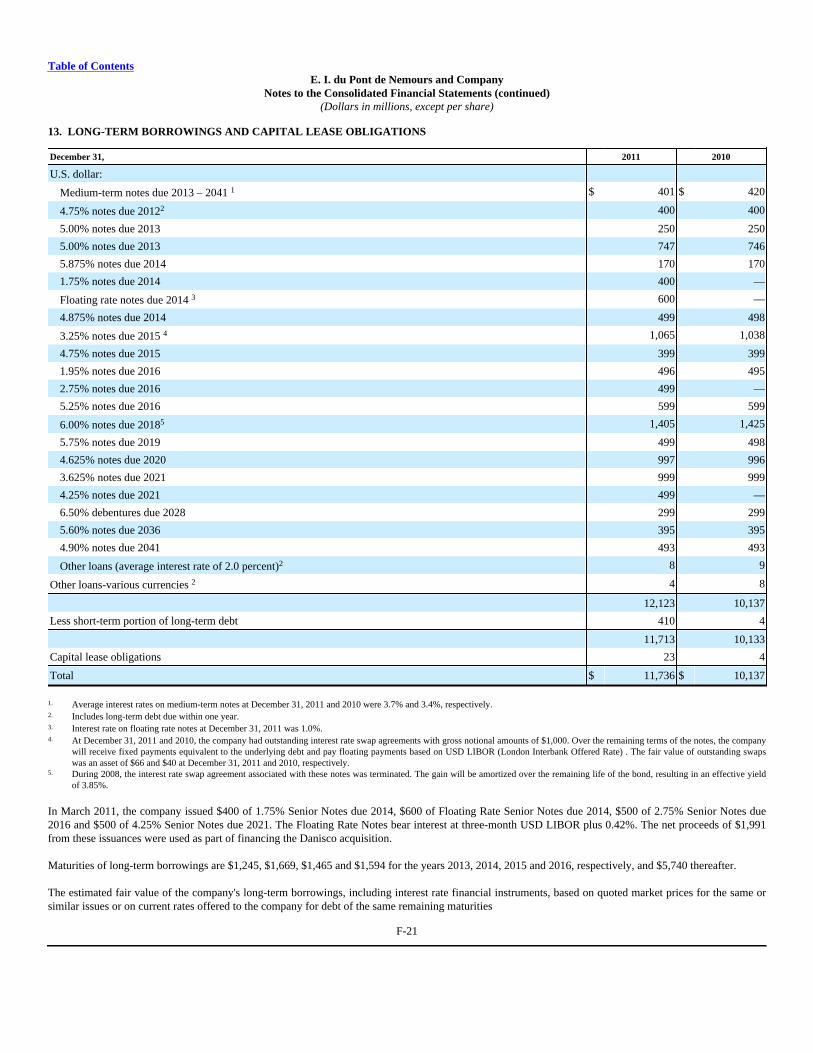
Table of ContentsE. I. du Pont de Nemours and Company
Notes to the Consolidated Financial Statements (continued)(Dollars in millions, except per share)
13. LONG-TERM BORROWINGS AND CAPITAL LEASE OBLIGATIONS
December 31, 2011 2010
U.S. dollar:
Medium-term notes due 2013 – 2041 1 $ 401 $ 420
4.75% notes due 20122 400 400
5.00% notes due 2013 250 250
5.00% notes due 2013 747 746
5.875% notes due 2014 170 170
1.75% notes due 2014 400 —
Floating rate notes due 2014 3 600 —
4.875% notes due 2014 499 498
3.25% notes due 2015 4 1,065 1,038
4.75% notes due 2015 399 399
1.95% notes due 2016 496 495
2.75% notes due 2016 499 —
5.25% notes due 2016 599 599
6.00% notes due 20185 1,405 1,425
5.75% notes due 2019 499 498
4.625% notes due 2020 997 996
3.625% notes due 2021 999 999
4.25% notes due 2021 499 —
6.50% debentures due 2028 299 299
5.60% notes due 2036 395 395
4.90% notes due 2041 493 493
Other loans (average interest rate of 2.0 percent)2 8 9
Other loans-various currencies 2 4 8
12,123 10,137
Less short-term portion of long-term debt 410 4
11,713 10,133
Capital lease obligations 23 4
Total $ 11,736 $ 10,137
1. Average interest rates on medium-term notes at December 31, 2011 and 2010 were 3.7% and 3.4%, respectively.2. Includes long-term debt due within one year.3. Interest rate on floating rate notes at December 31, 2011 was 1.0%.4. At December 31, 2011 and 2010, the company had outstanding interest rate swap agreements with gross notional amounts of $1,000. Over the remaining terms of the notes, the company
will receive fixed payments equivalent to the underlying debt and pay floating payments based on USD LIBOR (London Interbank Offered Rate) . The fair value of outstanding swapswas an asset of $66 and $40 at December 31, 2011 and 2010, respectively.
5. During 2008, the interest rate swap agreement associated with these notes was terminated. The gain will be amortized over the remaining life of the bond, resulting in an effective yieldof 3.85%.
In March 2011, the company issued $400 of 1.75% Senior Notes due 2014, $600 of Floating Rate Senior Notes due 2014, $500 of 2.75% Senior Notes due2016 and $500 of 4.25% Senior Notes due 2021. The Floating Rate Notes bear interest at three-month USD LIBOR plus 0.42%. The net proceeds of $1,991from these issuances were used as part of financing the Danisco acquisition.
Maturities of long-term borrowings are $1,245, $1,669, $1,465 and $1,594 for the years 2013, 2014, 2015 and 2016, respectively, and $5,740 thereafter.
The estimated fair value of the company's long-term borrowings, including interest rate financial instruments, based on quoted market prices for the same orsimilar issues or on current rates offered to the company for debt of the same remaining maturities
F-21
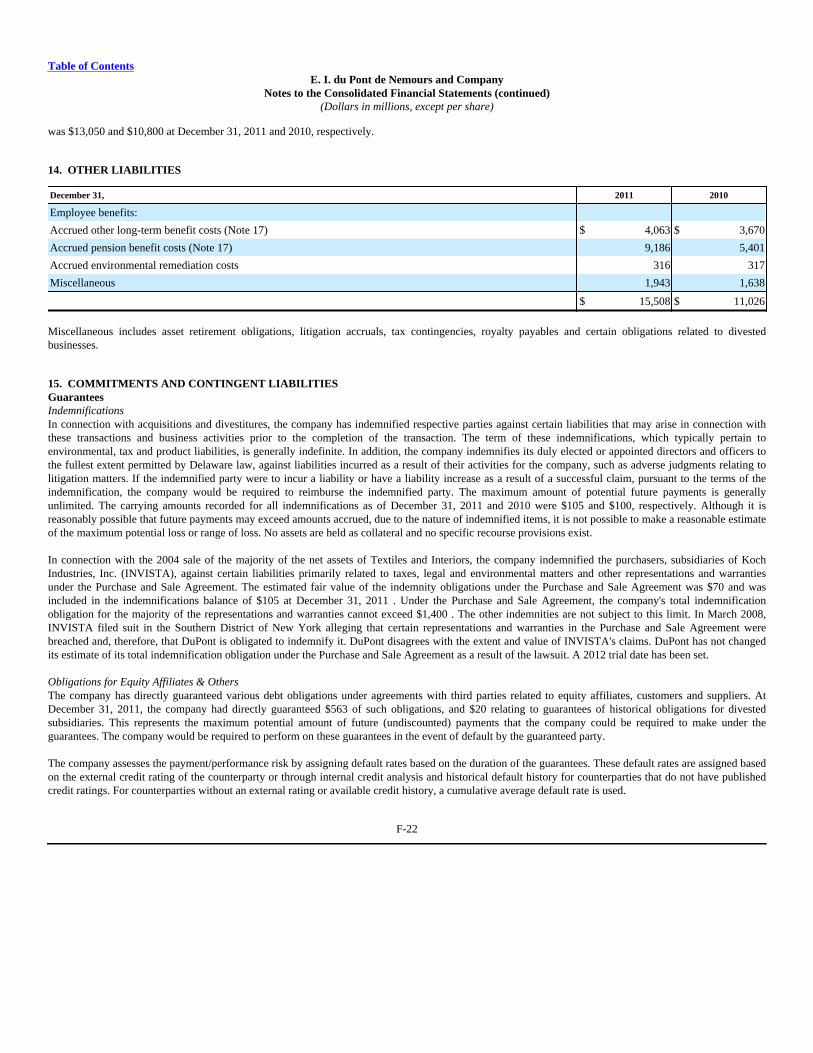
Table of ContentsE. I. du Pont de Nemours and Company
Notes to the Consolidated Financial Statements (continued)(Dollars in millions, except per share)
was $13,050 and $10,800 at December 31, 2011 and 2010, respectively.
14. OTHER LIABILITIES
December 31, 2011 2010
Employee benefits:
Accrued other long-term benefit costs (Note 17) $ 4,063 $ 3,670
Accrued pension benefit costs (Note 17) 9,186 5,401
Accrued environmental remediation costs 316 317
Miscellaneous 1,943 1,638
$ 15,508 $ 11,026
Miscellaneous includes asset retirement obligations, litigation accruals, tax contingencies, royalty payables and certain obligations related to divestedbusinesses.
15. COMMITMENTS AND CONTINGENT LIABILITIESGuaranteesIndemnificationsIn connection with acquisitions and divestitures, the company has indemnified respective parties against certain liabilities that may arise in connection withthese transactions and business activities prior to the completion of the transaction. The term of these indemnifications, which typically pertain toenvironmental, tax and product liabilities, is generally indefinite. In addition, the company indemnifies its duly elected or appointed directors and officers tothe fullest extent permitted by Delaware law, against liabilities incurred as a result of their activities for the company, such as adverse judgments relating tolitigation matters. If the indemnified party were to incur a liability or have a liability increase as a result of a successful claim, pursuant to the terms of theindemnification, the company would be required to reimburse the indemnified party. The maximum amount of potential future payments is generallyunlimited. The carrying amounts recorded for all indemnifications as of December 31, 2011 and 2010 were $105 and $100, respectively. Although it isreasonably possible that future payments may exceed amounts accrued, due to the nature of indemnified items, it is not possible to make a reasonable estimateof the maximum potential loss or range of loss. No assets are held as collateral and no specific recourse provisions exist.
In connection with the 2004 sale of the majority of the net assets of Textiles and Interiors, the company indemnified the purchasers, subsidiaries of KochIndustries, Inc. (INVISTA), against certain liabilities primarily related to taxes, legal and environmental matters and other representations and warrantiesunder the Purchase and Sale Agreement. The estimated fair value of the indemnity obligations under the Purchase and Sale Agreement was $70 and wasincluded in the indemnifications balance of $105 at December 31, 2011 . Under the Purchase and Sale Agreement, the company's total indemnificationobligation for the majority of the representations and warranties cannot exceed $1,400 . The other indemnities are not subject to this limit. In March 2008,INVISTA filed suit in the Southern District of New York alleging that certain representations and warranties in the Purchase and Sale Agreement werebreached and, therefore, that DuPont is obligated to indemnify it. DuPont disagrees with the extent and value of INVISTA's claims. DuPont has not changedits estimate of its total indemnification obligation under the Purchase and Sale Agreement as a result of the lawsuit. A 2012 trial date has been set.
Obligations for Equity Affiliates & OthersThe company has directly guaranteed various debt obligations under agreements with third parties related to equity affiliates, customers and suppliers. AtDecember 31, 2011, the company had directly guaranteed $563 of such obligations, and $20 relating to guarantees of historical obligations for divestedsubsidiaries. This represents the maximum potential amount of future (undiscounted) payments that the company could be required to make under theguarantees. The company would be required to perform on these guarantees in the event of default by the guaranteed party.
The company assesses the payment/performance risk by assigning default rates based on the duration of the guarantees. These default rates are assigned basedon the external credit rating of the counterparty or through internal credit analysis and historical default history for counterparties that do not have publishedcredit ratings. For counterparties without an external rating or available credit history, a cumulative average default rate is used.
F-22
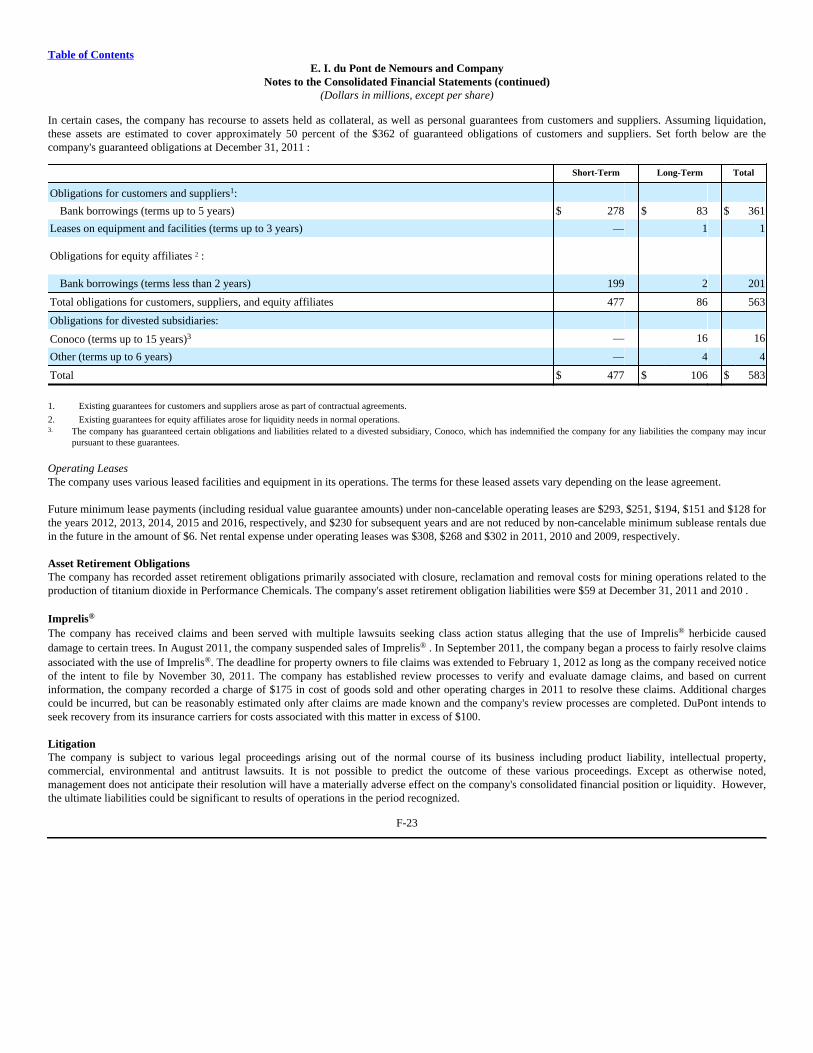
Table of ContentsE. I. du Pont de Nemours and Company
Notes to the Consolidated Financial Statements (continued)(Dollars in millions, except per share)
In certain cases, the company has recourse to assets held as collateral, as well as personal guarantees from customers and suppliers. Assuming liquidation,these assets are estimated to cover approximately 50 percent of the $362 of guaranteed obligations of customers and suppliers. Set forth below are thecompany's guaranteed obligations at December 31, 2011 :
Short-Term Long-Term Total
Obligations for customers and suppliers1:
Bank borrowings (terms up to 5 years) $ 278 $ 83 $ 361
Leases on equipment and facilities (terms up to 3 years) — 1 1
Obligations for equity affiliates 2 :
Bank borrowings (terms less than 2 years) 199 2 201
Total obligations for customers, suppliers, and equity affiliates 477 86 563
Obligations for divested subsidiaries:
Conoco (terms up to 15 years)3 — 16 16
Other (terms up to 6 years) — 4 4
Total $ 477 $ 106 $ 583
1. Existing guarantees for customers and suppliers arose as part of contractual agreements.
2. Existing guarantees for equity affiliates arose for liquidity needs in normal operations.3. The company has guaranteed certain obligations and liabilities related to a divested subsidiary, Conoco, which has indemnified the company for any liabilities the company may incur
pursuant to these guarantees.
Operating LeasesThe company uses various leased facilities and equipment in its operations. The terms for these leased assets vary depending on the lease agreement.
Future minimum lease payments (including residual value guarantee amounts) under non-cancelable operating leases are $293, $251, $194, $151 and $128 forthe years 2012, 2013, 2014, 2015 and 2016, respectively, and $230 for subsequent years and are not reduced by non-cancelable minimum sublease rentals duein the future in the amount of $6. Net rental expense under operating leases was $308, $268 and $302 in 2011, 2010 and 2009, respectively.
Asset Retirement ObligationsThe company has recorded asset retirement obligations primarily associated with closure, reclamation and removal costs for mining operations related to theproduction of titanium dioxide in Performance Chemicals. The company's asset retirement obligation liabilities were $59 at December 31, 2011 and 2010 .
Imprelis® The company has received claims and been served with multiple lawsuits seeking class action status alleging that the use of Imprelis® herbicide causeddamage to certain trees. In August 2011, the company suspended sales of Imprelis® . In September 2011, the company began a process to fairly resolve claimsassociated with the use of Imprelis®. The deadline for property owners to file claims was extended to February 1, 2012 as long as the company received noticeof the intent to file by November 30, 2011. The company has established review processes to verify and evaluate damage claims, and based on currentinformation, the company recorded a charge of $175 in cost of goods sold and other operating charges in 2011 to resolve these claims. Additional chargescould be incurred, but can be reasonably estimated only after claims are made known and the company's review processes are completed. DuPont intends toseek recovery from its insurance carriers for costs associated with this matter in excess of $100.
LitigationThe company is subject to various legal proceedings arising out of the normal course of its business including product liability, intellectual property,commercial, environmental and antitrust lawsuits. It is not possible to predict the outcome of these various proceedings. Except as otherwise noted,management does not anticipate their resolution will have a materially adverse effect on the company's consolidated financial position or liquidity. However,the ultimate liabilities could be significant to results of operations in the period recognized.
F-23
Table of ContentsE. I. du Pont de Nemours and Company
Notes to the Consolidated Financial Statements (continued)(Dollars in millions, except per share)
PFOADuPont uses PFOA (collectively, perfluorooctanoic acids and its salts, including the ammonium salt), as a processing aid to manufacture fluoropolymer resinsand dispersions at various sites around the world including its Washington Works plant in West Virginia. At December 31, 2011, DuPont has accruals of $16related to the PFOA matters discussed below.
The accrual includes charges related to DuPont's obligations under agreements with the U.S. Environmental Protection Agency and voluntary commitments tothe New Jersey Department of Environmental Protection. These obligations include surveying, sampling and testing drinking water in and around thecompany's Washington Works site and offer treatment or an alternative supply of drinking water if tests indicate the presence of PFOA in drinking water at orgreater than the national Provisional Health Advisory.
Drinking Water ActionsIn August 2001, a class action, captioned Leach v DuPont, was filed in West Virginia state court alleging that residents living near the Washington Worksfacility had suffered, or may suffer, deleterious health effects from exposure to PFOA in drinking water.
DuPont and attorneys for the class reached a settlement in 2004 that binds about 80,000 residents. In 2005, DuPont paid the plaintiffs’ attorneys’ fees andexpenses of $23 and made a payment of $70, which class counsel designated to fund a community health project. The company is also funding a series ofhealth studies by an independent science panel of experts (the “C8 Science Panel”) in the communities exposed to PFOA to evaluate available scientificevidence on whether any probable link exists between exposure to PFOA and human disease. The company expects the C8 Science Panel to complete thesehealth studies through July 2012 at a total estimated cost of $33.
In December 2011, the C8 Science Panel announced that on the basis of epidemiologic and other scientific data available to it, the panel has concluded thatthere is a probable link, as defined in the settlement agreement, between exposure to PFOA and pregnancy-induced hypertension, which includespreeclampsia. A panel of medical experts will determine an appropriate medical monitoring protocol, if any, as a result of this finding. If a medical monitoringprotocol is defined, DuPont is required to fund a medical monitoring program to pay for such medical testing. Plaintiffs may pursue personal injury claimsagainst DuPont only for those human disease(s) for which the C8 Science Panel determines a probable link exists once the C8 Science Panel completes itswork. In January 2012, the company put $1 in an escrow account as required by the settlement agreement. The company will reassess its liability based on themedical monitoring panel's determination since costs are not reasonably estimable until a medical monitoring protocol, if any, is identified. The company willcontinue to reassess its liability based on the C8 Science Panel's future probable link findings, if any, and associated medical monitoring protocols, if any.Under the settlement agreement, the company's total obligation to pay for medical monitoring cannot exceed $235. In addition, the company must continue toprovide state-of-the-art water treatment systems designed to reduce the level of PFOA in water to six area water districts, including the Little Hocking WaterAssociation (LHWA), and private well users.
During the fourth quarter 2011, the company reached final resolution of three actions brought by or on behalf of water district customers. The West Virginiaaction was resolved in DuPont's favor when the U.S. Supreme Court refused in October to hear plaintiffs' appeal. The two consolidated New Jersey actionswere finally resolved with the settlement payment of $8.3 in October 2011. The pending Ohio action was brought by the LHWA and is currently in discovery.In addition to general claims of PFOA contamination of drinking water, the action claims “imminent and substantial endangerment to health and or theenvironment” under the Resource Conservation and Recovery Act (RCRA). DuPont denies these claims and is defending itself vigorously. While DuPont believes that it is reasonably possible that it could incur losses related to PFOA matters in addition to those matters discussed above for whichit has established accruals, a range of such losses, if any, cannot be reasonably estimated at this time.
Environmental The company is also subject to contingencies pursuant to environmental laws and regulations that in the future may require the company to take further actionto correct the effects on the environment of prior disposal practices or releases of chemical or petroleum substances by the company or other parties. Thecompany accrues for environmental remediation activities consistent with the policy set forth in Note 1. Much of this liability results from the ComprehensiveEnvironmental Response, Compensation and Liability Act (CERCLA, often referred to as Superfund), RCRA and similar state and global laws. These lawsrequire the company to undertake certain investigative, remediation and restoration activities at sites where the company conducts or once conductedoperations or at sites where company-generated waste was disposed. The accrual also includes estimated costs related to a number of sites identified by thecompany for which it is probable that environmental remediation will be required, but which are not currently the subject of enforcement activities.
F-24
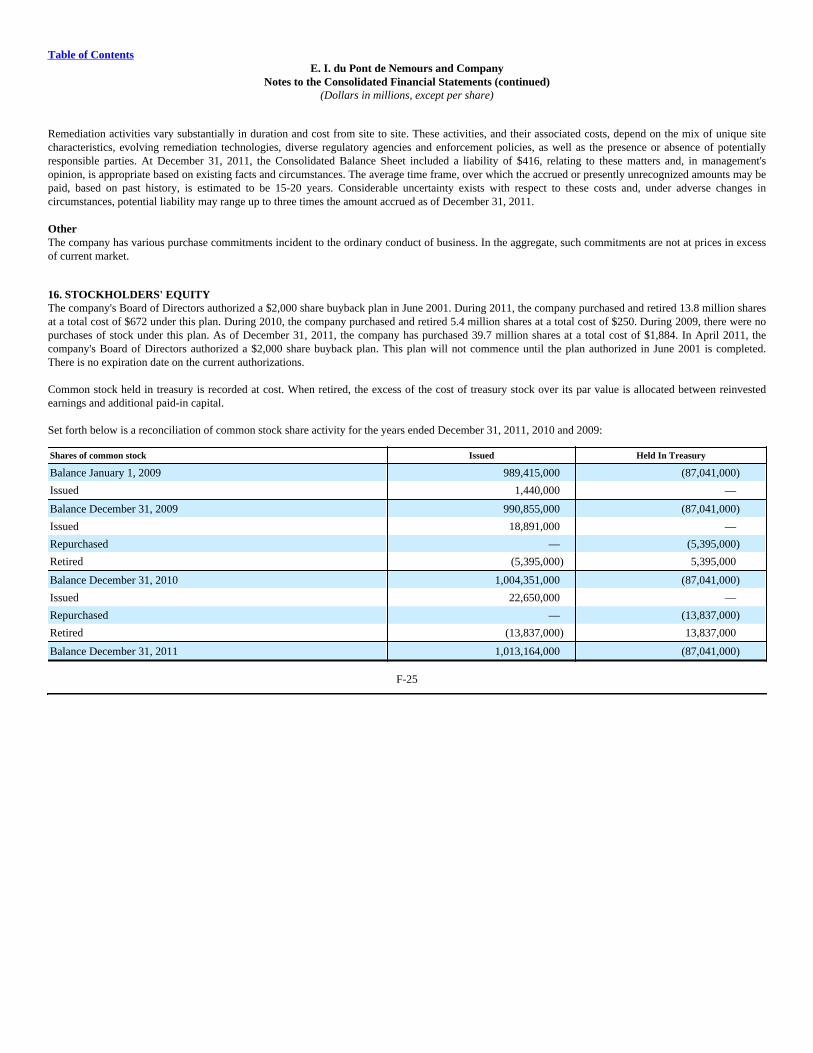
Table of ContentsE. I. du Pont de Nemours and Company
Notes to the Consolidated Financial Statements (continued)(Dollars in millions, except per share)
Remediation activities vary substantially in duration and cost from site to site. These activities, and their associated costs, depend on the mix of unique sitecharacteristics, evolving remediation technologies, diverse regulatory agencies and enforcement policies, as well as the presence or absence of potentiallyresponsible parties. At December 31, 2011, the Consolidated Balance Sheet included a liability of $416, relating to these matters and, in management'sopinion, is appropriate based on existing facts and circumstances. The average time frame, over which the accrued or presently unrecognized amounts may bepaid, based on past history, is estimated to be 15-20 years. Considerable uncertainty exists with respect to these costs and, under adverse changes incircumstances, potential liability may range up to three times the amount accrued as of December 31, 2011.
Other The company has various purchase commitments incident to the ordinary conduct of business. In the aggregate, such commitments are not at prices in excessof current market.
16. STOCKHOLDERS' EQUITYThe company's Board of Directors authorized a $2,000 share buyback plan in June 2001. During 2011, the company purchased and retired 13.8 million sharesat a total cost of $672 under this plan. During 2010, the company purchased and retired 5.4 million shares at a total cost of $250. During 2009, there were nopurchases of stock under this plan. As of December 31, 2011, the company has purchased 39.7 million shares at a total cost of $1,884. In April 2011, thecompany's Board of Directors authorized a $2,000 share buyback plan. This plan will not commence until the plan authorized in June 2001 is completed.There is no expiration date on the current authorizations.
Common stock held in treasury is recorded at cost. When retired, the excess of the cost of treasury stock over its par value is allocated between reinvestedearnings and additional paid-in capital.
Set forth below is a reconciliation of common stock share activity for the years ended December 31, 2011, 2010 and 2009:
Shares of common stock Issued Held In Treasury
Balance January 1, 2009 989,415,000 (87,041,000)
Issued 1,440,000 —
Balance December 31, 2009 990,855,000 (87,041,000)
Issued 18,891,000 —
Repurchased — (5,395,000)
Retired (5,395,000) 5,395,000
Balance December 31, 2010 1,004,351,000 (87,041,000)
Issued 22,650,000 —
Repurchased — (13,837,000)
Retired (13,837,000) 13,837,000
Balance December 31, 2011 1,013,164,000 (87,041,000)
F-25
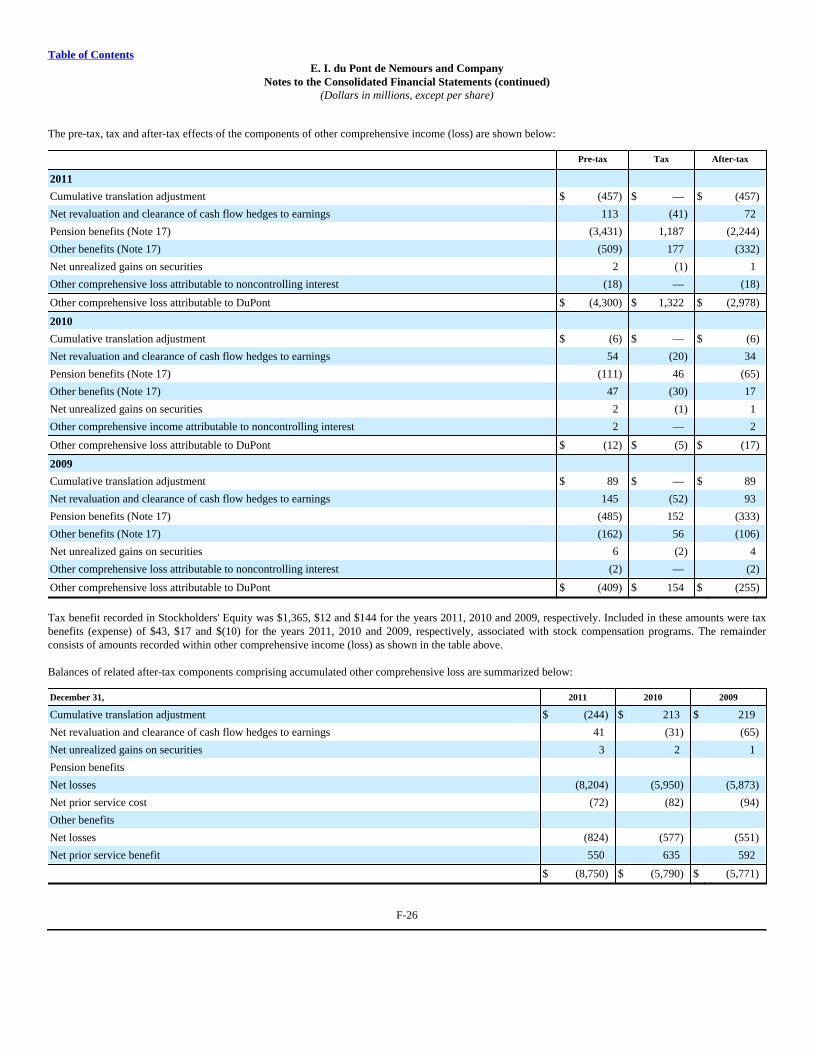
Table of ContentsE. I. du Pont de Nemours and Company
Notes to the Consolidated Financial Statements (continued)(Dollars in millions, except per share)
The pre-tax, tax and after-tax effects of the components of other comprehensive income (loss) are shown below:
Pre-tax Tax After-tax
2011
Cumulative translation adjustment $ (457) $ — $ (457)
Net revaluation and clearance of cash flow hedges to earnings 113 (41) 72
Pension benefits (Note 17) (3,431) 1,187 (2,244)
Other benefits (Note 17) (509) 177 (332)
Net unrealized gains on securities 2 (1) 1
Other comprehensive loss attributable to noncontrolling interest (18) — (18)
Other comprehensive loss attributable to DuPont $ (4,300) $ 1,322 $ (2,978)
2010
Cumulative translation adjustment $ (6) $ — $ (6)
Net revaluation and clearance of cash flow hedges to earnings 54 (20) 34
Pension benefits (Note 17) (111) 46 (65)
Other benefits (Note 17) 47 (30) 17
Net unrealized gains on securities 2 (1) 1
Other comprehensive income attributable to noncontrolling interest 2 — 2
Other comprehensive loss attributable to DuPont $ (12) $ (5) $ (17)
2009
Cumulative translation adjustment $ 89 $ — $ 89
Net revaluation and clearance of cash flow hedges to earnings 145 (52) 93
Pension benefits (Note 17) (485) 152 (333)
Other benefits (Note 17) (162) 56 (106)
Net unrealized gains on securities 6 (2) 4
Other comprehensive loss attributable to noncontrolling interest (2) — (2)
Other comprehensive loss attributable to DuPont $ (409) $ 154 $ (255)
Tax benefit recorded in Stockholders' Equity was $1,365, $12 and $144 for the years 2011, 2010 and 2009, respectively. Included in these amounts were taxbenefits (expense) of $43, $17 and $(10) for the years 2011, 2010 and 2009, respectively, associated with stock compensation programs. The remainderconsists of amounts recorded within other comprehensive income (loss) as shown in the table above.
Balances of related after-tax components comprising accumulated other comprehensive loss are summarized below:
December 31, 2011 2010 2009
Cumulative translation adjustment $ (244) $ 213 $ 219
Net revaluation and clearance of cash flow hedges to earnings 41 (31) (65)
Net unrealized gains on securities 3 2 1
Pension benefits
Net losses (8,204) (5,950) (5,873)
Net prior service cost (72) (82) (94)
Other benefits
Net losses (824) (577) (551)
Net prior service benefit 550 635 592
$ (8,750) $ (5,790) $ (5,771)
F-26
Table of ContentsE. I. du Pont de Nemours and Company
Notes to the Consolidated Financial Statements (continued)(Dollars in millions, except per share)
17. LONG-TERM EMPLOYEE BENEFITSThe company offers various long-term benefits to its employees. Where permitted by applicable law, the company reserves the right to change, modify ordiscontinue the plans.
Defined Benefit PensionsThe company has both funded and unfunded noncontributory defined benefit pension plans covering a majority of the U.S. employees hired prior to January1, 2007. The benefits under these plans are based primarily on years of service and employees' pay near retirement. The company's funding policy isconsistent with the funding requirements of federal laws and regulations. Pension coverage for employees of the company's non-U.S. consolidatedsubsidiaries is provided, to the extent deemed appropriate, through separate plans. Obligations under such plans are funded by depositing funds with trustees,covered by insurance contracts, or remain unfunded.
Other Long-term Employee BenefitsThe parent company and certain subsidiaries provide medical, dental and life insurance benefits to pensioners and survivors, and disability and life insuranceprotection to employees. The associated plans for retiree benefits are unfunded and the cost of the approved claims is paid from company funds. Essentiallyall of the cost and liabilities for these retiree benefit plans are attributable to the U.S. parent company plans. The retiree medical plan is contributory withpensioners and survivors' contributions adjusted annually to achieve a 50/50 target sharing of cost increases between the company and pensioners andsurvivors. In addition, limits are applied to the company's portion of the retiree medical cost coverage. The majority of U.S. employees hired on or afterJanuary 1, 2007 are not eligible to participate in the post retirement medical, dental and life insurance plans.
Employee life insurance and disability benefit plans are insured in many countries. However, primarily in the U.S., such plans are generally self-insured or arefully experience-rated. Obligations and expenses for self-insured and fully experience-rated plans are reflected in the figures below.
F-27
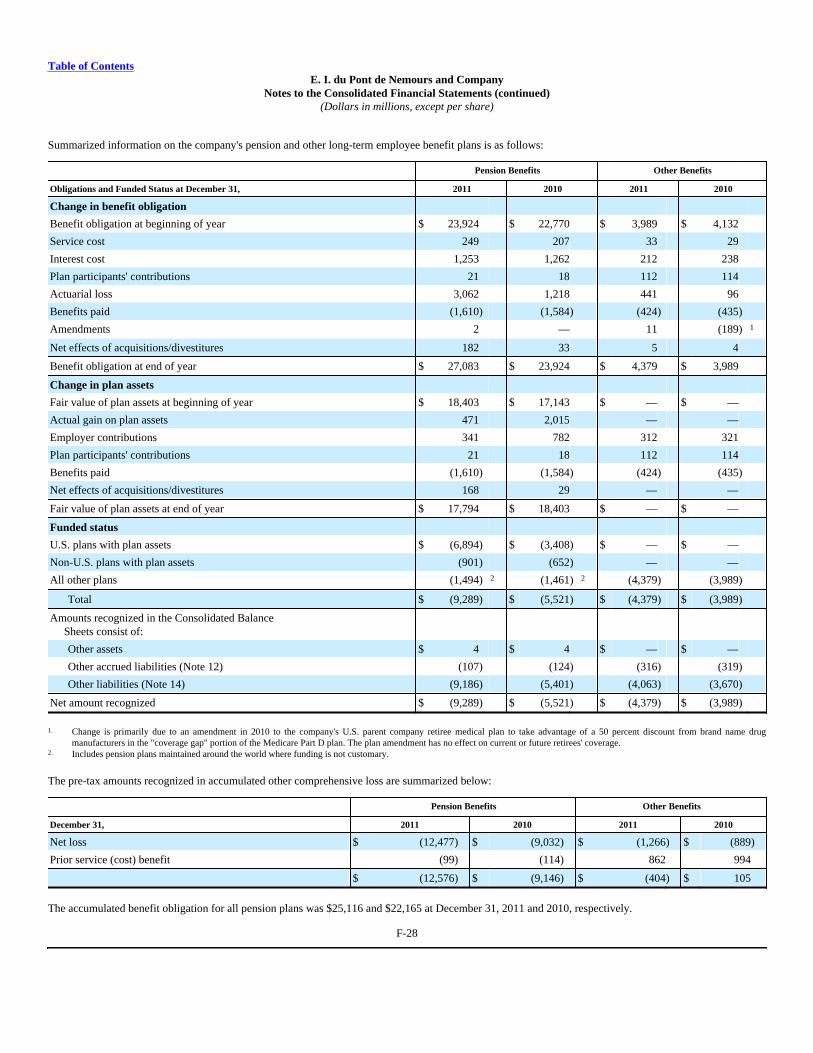
Table of ContentsE. I. du Pont de Nemours and Company
Notes to the Consolidated Financial Statements (continued)(Dollars in millions, except per share)
Summarized information on the company's pension and other long-term employee benefit plans is as follows:
Pension Benefits Other Benefits
Obligations and Funded Status at December 31, 2011 2010 2011 2010
Change in benefit obligation
Benefit obligation at beginning of year $ 23,924 $ 22,770 $ 3,989 $ 4,132
Service cost 249 207 33 29
Interest cost 1,253 1,262 212 238
Plan participants' contributions 21 18 112 114
Actuarial loss 3,062 1,218 441 96
Benefits paid (1,610) (1,584) (424) (435)
Amendments 2 — 11 (189) 1
Net effects of acquisitions/divestitures 182 33 5 4
Benefit obligation at end of year $ 27,083 $ 23,924 $ 4,379 $ 3,989
Change in plan assets
Fair value of plan assets at beginning of year $ 18,403 $ 17,143 $ — $ —
Actual gain on plan assets 471 2,015 — —
Employer contributions 341 782 312 321
Plan participants' contributions 21 18 112 114
Benefits paid (1,610) (1,584) (424) (435)
Net effects of acquisitions/divestitures 168 29 — —
Fair value of plan assets at end of year $ 17,794 $ 18,403 $ — $ —
Funded status
U.S. plans with plan assets $ (6,894) $ (3,408) $ — $ —
Non-U.S. plans with plan assets (901) (652) — —
All other plans (1,494) 2 (1,461) 2 (4,379) (3,989)
Total $ (9,289) $ (5,521) $ (4,379) $ (3,989)
Amounts recognized in the Consolidated Balance Sheets consist of:
Other assets $ 4 $ 4 $ — $ —
Other accrued liabilities (Note 12) (107) (124) (316) (319)
Other liabilities (Note 14) (9,186) (5,401) (4,063) (3,670)
Net amount recognized $ (9,289) $ (5,521) $ (4,379) $ (3,989)
1. Change is primarily due to an amendment in 2010 to the company's U.S. parent company retiree medical plan to take advantage of a 50 percent discount from brand name drugmanufacturers in the "coverage gap" portion of the Medicare Part D plan. The plan amendment has no effect on current or future retirees' coverage.
2. Includes pension plans maintained around the world where funding is not customary.
The pre-tax amounts recognized in accumulated other comprehensive loss are summarized below:
Pension Benefits Other Benefits
December 31, 2011 2010 2011 2010
Net loss $ (12,477) $ (9,032) $ (1,266) $ (889)
Prior service (cost) benefit (99) (114) 862 994
$ (12,576) $ (9,146) $ (404) $ 105
The accumulated benefit obligation for all pension plans was $25,116 and $22,165 at December 31, 2011 and 2010, respectively.
F-28
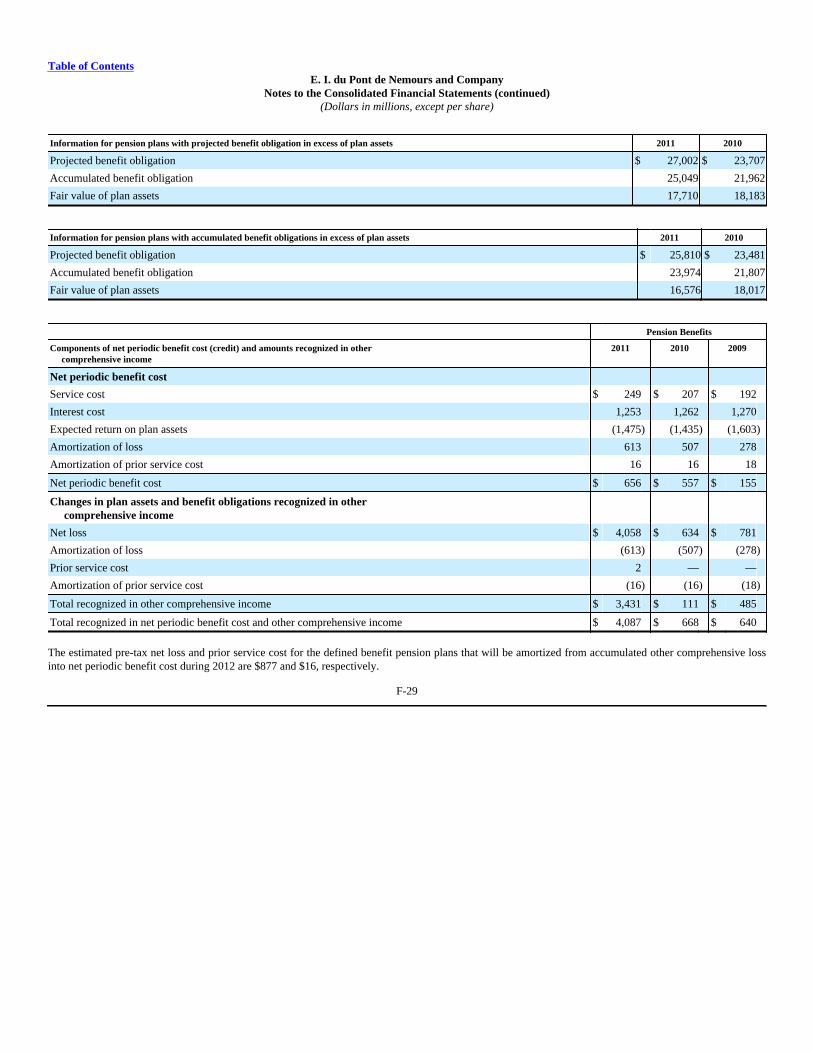
Table of ContentsE. I. du Pont de Nemours and Company
Notes to the Consolidated Financial Statements (continued)(Dollars in millions, except per share)
Information for pension plans with projected benefit obligation in excess of plan assets 2011 2010
Projected benefit obligation $ 27,002 $ 23,707
Accumulated benefit obligation 25,049 21,962
Fair value of plan assets 17,710 18,183
Information for pension plans with accumulated benefit obligations in excess of plan assets 2011 2010
Projected benefit obligation $ 25,810 $ 23,481
Accumulated benefit obligation 23,974 21,807
Fair value of plan assets 16,576 18,017
Pension Benefits
Components of net periodic benefit cost (credit) and amounts recognized in other comprehensive income
2011 2010 2009
Net periodic benefit cost
Service cost $ 249 $ 207 $ 192
Interest cost 1,253 1,262 1,270
Expected return on plan assets (1,475) (1,435) (1,603)
Amortization of loss 613 507 278
Amortization of prior service cost 16 16 18
Net periodic benefit cost $ 656 $ 557 $ 155
Changes in plan assets and benefit obligations recognized in other comprehensive income
Net loss $ 4,058 $ 634 $ 781
Amortization of loss (613) (507) (278)
Prior service cost 2 — —
Amortization of prior service cost (16) (16) (18)
Total recognized in other comprehensive income $ 3,431 $ 111 $ 485
Total recognized in net periodic benefit cost and other comprehensive income $ 4,087 $ 668 $ 640
The estimated pre-tax net loss and prior service cost for the defined benefit pension plans that will be amortized from accumulated other comprehensive lossinto net periodic benefit cost during 2012 are $877 and $16, respectively.
F-29
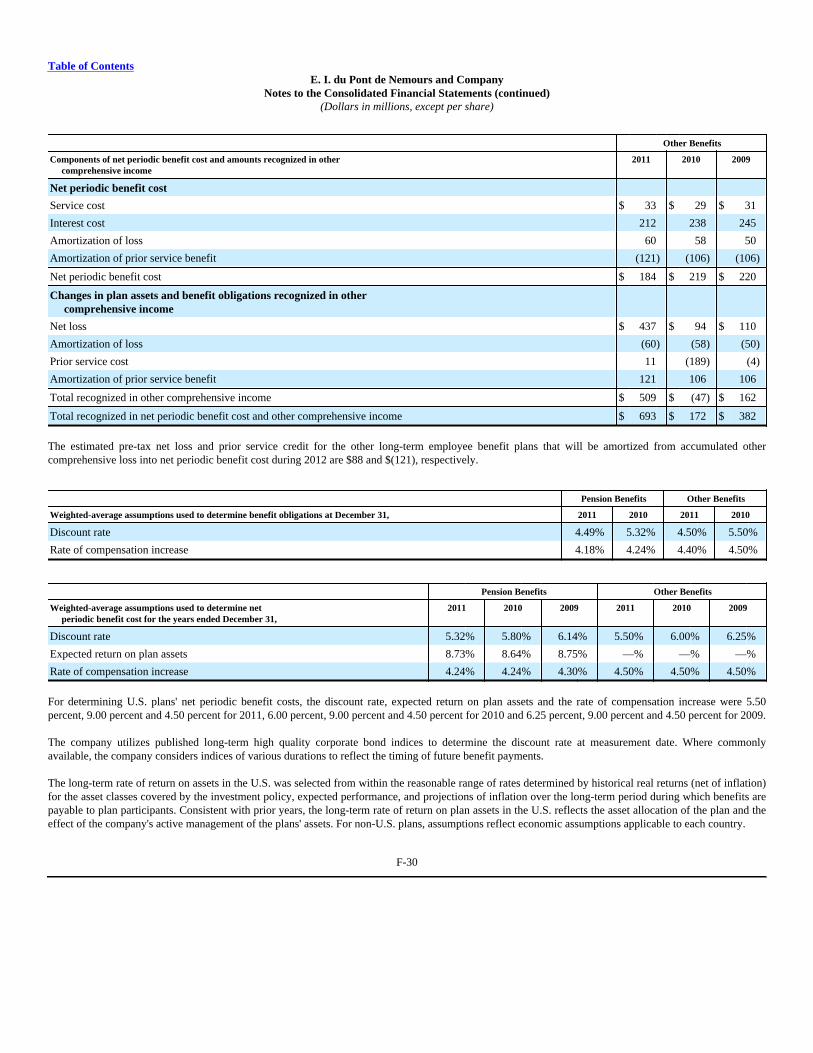
Table of ContentsE. I. du Pont de Nemours and Company
Notes to the Consolidated Financial Statements (continued)(Dollars in millions, except per share)
Other Benefits
Components of net periodic benefit cost and amounts recognized in other comprehensive income
2011 2010 2009
Net periodic benefit cost
Service cost $ 33 $ 29 $ 31
Interest cost 212 238 245
Amortization of loss 60 58 50
Amortization of prior service benefit (121) (106) (106)
Net periodic benefit cost $ 184 $ 219 $ 220
Changes in plan assets and benefit obligations recognized in other comprehensive income
Net loss $ 437 $ 94 $ 110
Amortization of loss (60) (58) (50)
Prior service cost 11 (189) (4)
Amortization of prior service benefit 121 106 106
Total recognized in other comprehensive income $ 509 $ (47) $ 162
Total recognized in net periodic benefit cost and other comprehensive income $ 693 $ 172 $ 382
The estimated pre-tax net loss and prior service credit for the other long-term employee benefit plans that will be amortized from accumulated othercomprehensive loss into net periodic benefit cost during 2012 are $88 and $(121), respectively.
Pension Benefits Other Benefits
Weighted-average assumptions used to determine benefit obligations at December 31, 2011 2010 2011 2010
Discount rate 4.49% 5.32% 4.50% 5.50%
Rate of compensation increase 4.18% 4.24% 4.40% 4.50%
Pension Benefits Other Benefits
Weighted-average assumptions used to determine net periodic benefit cost for the years ended December 31,
2011 2010 2009 2011 2010 2009
Discount rate 5.32% 5.80% 6.14% 5.50% 6.00% 6.25%
Expected return on plan assets 8.73% 8.64% 8.75% —% —% —%
Rate of compensation increase 4.24% 4.24% 4.30% 4.50% 4.50% 4.50%
For determining U.S. plans' net periodic benefit costs, the discount rate, expected return on plan assets and the rate of compensation increase were 5.50percent, 9.00 percent and 4.50 percent for 2011, 6.00 percent, 9.00 percent and 4.50 percent for 2010 and 6.25 percent, 9.00 percent and 4.50 percent for 2009.
The company utilizes published long-term high quality corporate bond indices to determine the discount rate at measurement date. Where commonlyavailable, the company considers indices of various durations to reflect the timing of future benefit payments.
The long-term rate of return on assets in the U.S. was selected from within the reasonable range of rates determined by historical real returns (net of inflation)for the asset classes covered by the investment policy, expected performance, and projections of inflation over the long-term period during which benefits arepayable to plan participants. Consistent with prior years, the long-term rate of return on plan assets in the U.S. reflects the asset allocation of the plan and theeffect of the company's active management of the plans' assets. For non-U.S. plans, assumptions reflect economic assumptions applicable to each country.
F-30
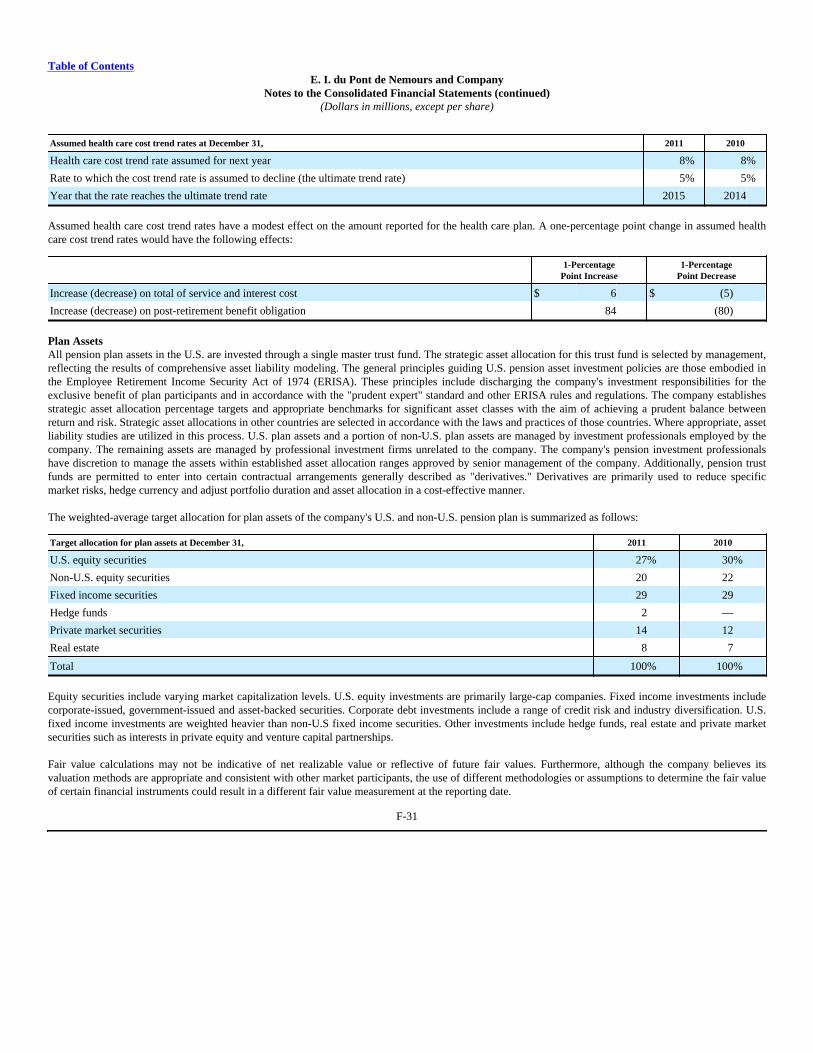
Table of ContentsE. I. du Pont de Nemours and Company
Notes to the Consolidated Financial Statements (continued)(Dollars in millions, except per share)
Assumed health care cost trend rates at December 31, 2011 2010
Health care cost trend rate assumed for next year 8% 8%
Rate to which the cost trend rate is assumed to decline (the ultimate trend rate) 5% 5%
Year that the rate reaches the ultimate trend rate 2015 2014
Assumed health care cost trend rates have a modest effect on the amount reported for the health care plan. A one-percentage point change in assumed healthcare cost trend rates would have the following effects:
1-PercentagePoint Increase
1-PercentagePoint Decrease
Increase (decrease) on total of service and interest cost $ 6 $ (5)
Increase (decrease) on post-retirement benefit obligation 84 (80)
Plan AssetsAll pension plan assets in the U.S. are invested through a single master trust fund. The strategic asset allocation for this trust fund is selected by management,reflecting the results of comprehensive asset liability modeling. The general principles guiding U.S. pension asset investment policies are those embodied inthe Employee Retirement Income Security Act of 1974 (ERISA). These principles include discharging the company's investment responsibilities for theexclusive benefit of plan participants and in accordance with the "prudent expert" standard and other ERISA rules and regulations. The company establishesstrategic asset allocation percentage targets and appropriate benchmarks for significant asset classes with the aim of achieving a prudent balance betweenreturn and risk. Strategic asset allocations in other countries are selected in accordance with the laws and practices of those countries. Where appropriate, assetliability studies are utilized in this process. U.S. plan assets and a portion of non-U.S. plan assets are managed by investment professionals employed by thecompany. The remaining assets are managed by professional investment firms unrelated to the company. The company's pension investment professionalshave discretion to manage the assets within established asset allocation ranges approved by senior management of the company. Additionally, pension trustfunds are permitted to enter into certain contractual arrangements generally described as "derivatives." Derivatives are primarily used to reduce specificmarket risks, hedge currency and adjust portfolio duration and asset allocation in a cost-effective manner.
The weighted-average target allocation for plan assets of the company's U.S. and non-U.S. pension plan is summarized as follows:
Target allocation for plan assets at December 31, 2011 2010
U.S. equity securities 27% 30%
Non-U.S. equity securities 20 22
Fixed income securities 29 29
Hedge funds 2 —
Private market securities 14 12
Real estate 8 7
Total 100% 100%
Equity securities include varying market capitalization levels. U.S. equity investments are primarily large-cap companies. Fixed income investments includecorporate-issued, government-issued and asset-backed securities. Corporate debt investments include a range of credit risk and industry diversification. U.S.fixed income investments are weighted heavier than non-U.S fixed income securities. Other investments include hedge funds, real estate and private marketsecurities such as interests in private equity and venture capital partnerships.
Fair value calculations may not be indicative of net realizable value or reflective of future fair values. Furthermore, although the company believes itsvaluation methods are appropriate and consistent with other market participants, the use of different methodologies or assumptions to determine the fair valueof certain financial instruments could result in a different fair value measurement at the reporting date.
F-31
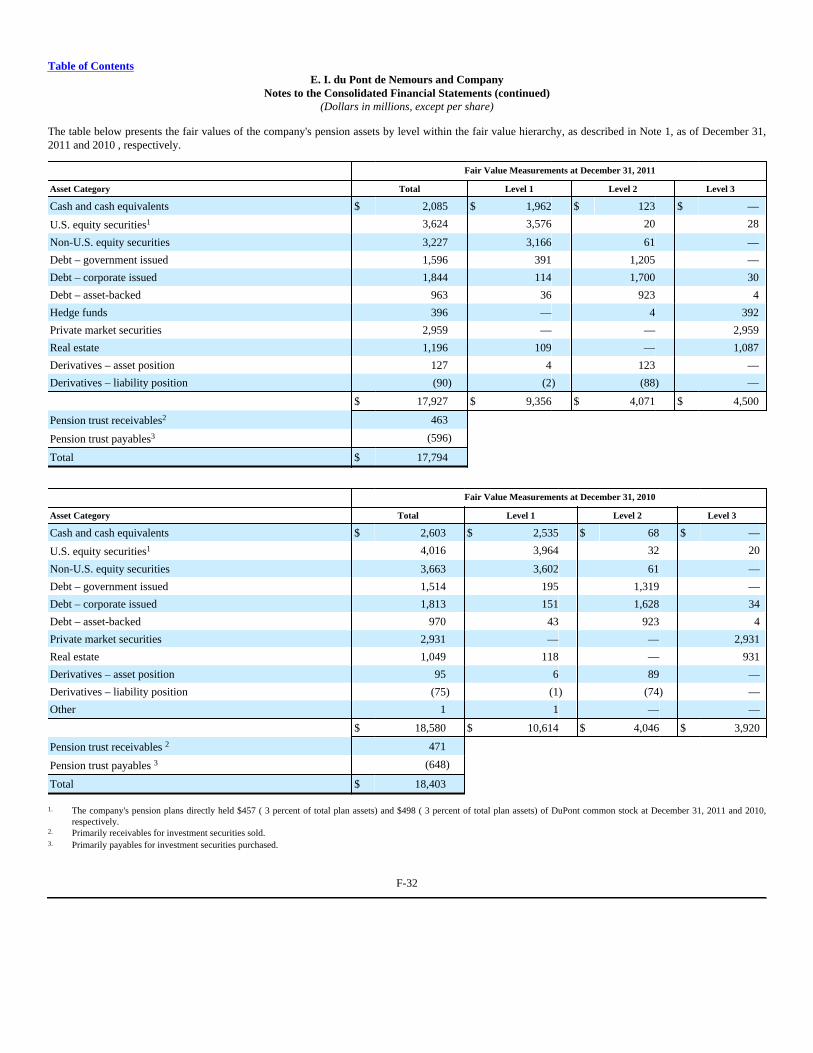
Table of ContentsE. I. du Pont de Nemours and Company
Notes to the Consolidated Financial Statements (continued)(Dollars in millions, except per share)
The table below presents the fair values of the company's pension assets by level within the fair value hierarchy, as described in Note 1, as of December 31,2011 and 2010 , respectively.
Fair Value Measurements at December 31, 2011
Asset Category Total Level 1 Level 2 Level 3
Cash and cash equivalents $ 2,085 $ 1,962 $ 123 $ —
U.S. equity securities1 3,624 3,576 20 28
Non-U.S. equity securities 3,227 3,166 61 —
Debt – government issued 1,596 391 1,205 —
Debt – corporate issued 1,844 114 1,700 30
Debt – asset-backed 963 36 923 4
Hedge funds 396 — 4 392
Private market securities 2,959 — — 2,959
Real estate 1,196 109 — 1,087
Derivatives – asset position 127 4 123 —
Derivatives – liability position (90) (2) (88) —
$ 17,927 $ 9,356 $ 4,071 $ 4,500
Pension trust receivables2 463
Pension trust payables3 (596)
Total $ 17,794
Fair Value Measurements at December 31, 2010
Asset Category Total Level 1 Level 2 Level 3
Cash and cash equivalents $ 2,603 $ 2,535 $ 68 $ —
U.S. equity securities1 4,016 3,964 32 20
Non-U.S. equity securities 3,663 3,602 61 —
Debt – government issued 1,514 195 1,319 —
Debt – corporate issued 1,813 151 1,628 34
Debt – asset-backed 970 43 923 4
Private market securities 2,931 — — 2,931
Real estate 1,049 118 — 931
Derivatives – asset position 95 6 89 —
Derivatives – liability position (75) (1) (74) —
Other 1 1 — —
$ 18,580 $ 10,614 $ 4,046 $ 3,920
Pension trust receivables 2 471
Pension trust payables 3 (648)
Total $ 18,403
1. The company's pension plans directly held $457 ( 3 percent of total plan assets) and $498 ( 3 percent of total plan assets) of DuPont common stock at December 31, 2011 and 2010,respectively.
2. Primarily receivables for investment securities sold.3. Primarily payables for investment securities purchased.
F-32
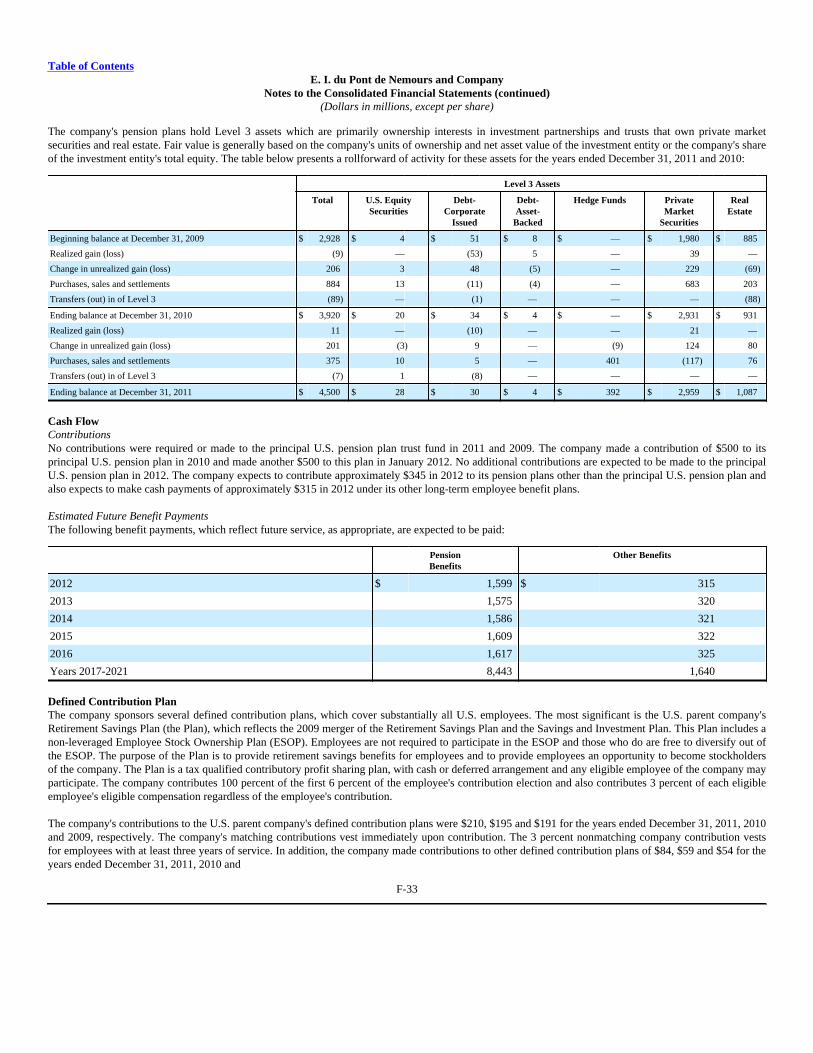
Table of ContentsE. I. du Pont de Nemours and Company
Notes to the Consolidated Financial Statements (continued)(Dollars in millions, except per share)
The company's pension plans hold Level 3 assets which are primarily ownership interests in investment partnerships and trusts that own private marketsecurities and real estate. Fair value is generally based on the company's units of ownership and net asset value of the investment entity or the company's shareof the investment entity's total equity. The table below presents a rollforward of activity for these assets for the years ended December 31, 2011 and 2010:
Level 3 Assets
Total U.S. EquitySecurities
Debt-Corporate
Issued
Debt-Asset-
Backed
Hedge Funds PrivateMarket
Securities
RealEstate
Beginning balance at December 31, 2009 $ 2,928 $ 4 $ 51 $ 8 $ — $ 1,980 $ 885
Realized gain (loss) (9) — (53) 5 — 39 —
Change in unrealized gain (loss) 206 3 48 (5) — 229 (69)
Purchases, sales and settlements 884 13 (11) (4) — 683 203
Transfers (out) in of Level 3 (89) — (1) — — — (88)
Ending balance at December 31, 2010 $ 3,920 $ 20 $ 34 $ 4 $ — $ 2,931 $ 931
Realized gain (loss) 11 — (10) — — 21 —
Change in unrealized gain (loss) 201 (3) 9 — (9) 124 80
Purchases, sales and settlements 375 10 5 — 401 (117) 76
Transfers (out) in of Level 3 (7) 1 (8) — — — —
Ending balance at December 31, 2011 $ 4,500 $ 28 $ 30 $ 4 $ 392 $ 2,959 $ 1,087
Cash FlowContributionsNo contributions were required or made to the principal U.S. pension plan trust fund in 2011 and 2009. The company made a contribution of $500 to itsprincipal U.S. pension plan in 2010 and made another $500 to this plan in January 2012. No additional contributions are expected to be made to the principalU.S. pension plan in 2012. The company expects to contribute approximately $345 in 2012 to its pension plans other than the principal U.S. pension plan andalso expects to make cash payments of approximately $315 in 2012 under its other long-term employee benefit plans.
Estimated Future Benefit PaymentsThe following benefit payments, which reflect future service, as appropriate, are expected to be paid:
PensionBenefits
Other Benefits
2012 $ 1,599 $ 315
2013 1,575 320
2014 1,586 321
2015 1,609 322
2016 1,617 325
Years 2017-2021 8,443 1,640
Defined Contribution PlanThe company sponsors several defined contribution plans, which cover substantially all U.S. employees. The most significant is the U.S. parent company'sRetirement Savings Plan (the Plan), which reflects the 2009 merger of the Retirement Savings Plan and the Savings and Investment Plan. This Plan includes anon-leveraged Employee Stock Ownership Plan (ESOP). Employees are not required to participate in the ESOP and those who do are free to diversify out ofthe ESOP. The purpose of the Plan is to provide retirement savings benefits for employees and to provide employees an opportunity to become stockholdersof the company. The Plan is a tax qualified contributory profit sharing plan, with cash or deferred arrangement and any eligible employee of the company mayparticipate. The company contributes 100 percent of the first 6 percent of the employee's contribution election and also contributes 3 percent of each eligibleemployee's eligible compensation regardless of the employee's contribution.
The company's contributions to the U.S. parent company's defined contribution plans were $210, $195 and $191 for the years ended December 31, 2011, 2010and 2009, respectively. The company's matching contributions vest immediately upon contribution. The 3 percent nonmatching company contribution vestsfor employees with at least three years of service. In addition, the company made contributions to other defined contribution plans of $84, $59 and $54 for theyears ended December 31, 2011, 2010 and
F-33
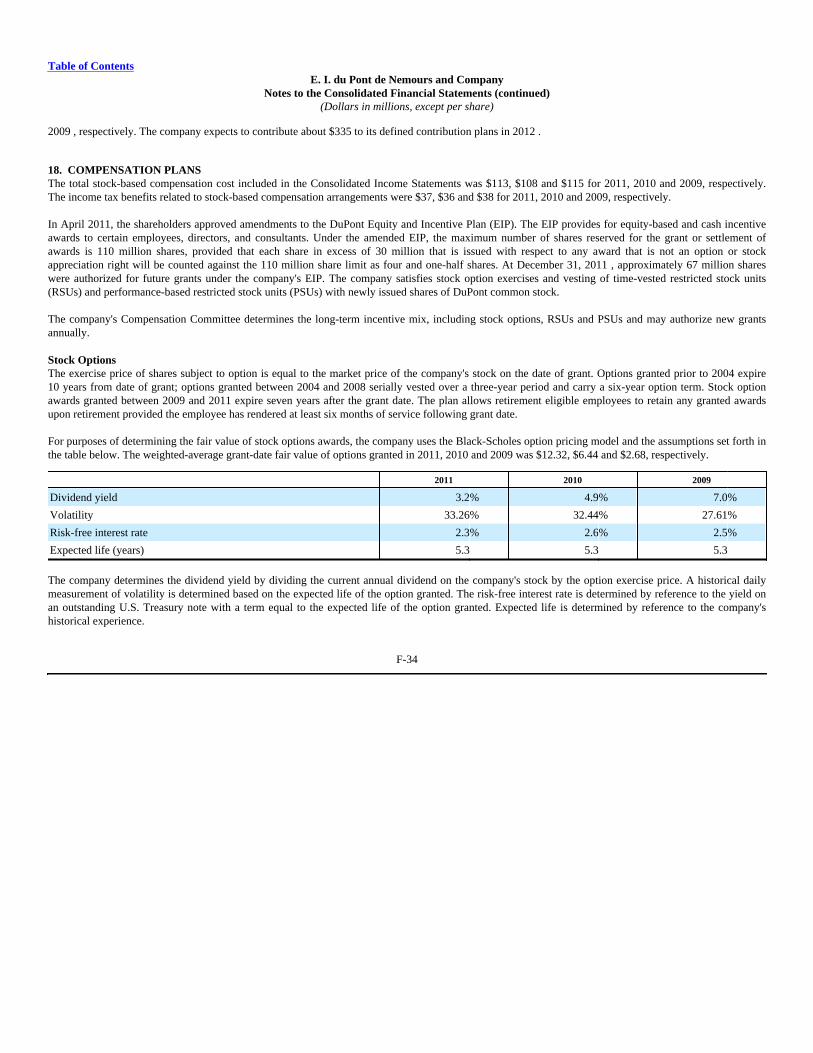
Table of ContentsE. I. du Pont de Nemours and Company
Notes to the Consolidated Financial Statements (continued)(Dollars in millions, except per share)
2009 , respectively. The company expects to contribute about $335 to its defined contribution plans in 2012 .
18. COMPENSATION PLANSThe total stock-based compensation cost included in the Consolidated Income Statements was $113, $108 and $115 for 2011, 2010 and 2009, respectively.The income tax benefits related to stock-based compensation arrangements were $37, $36 and $38 for 2011, 2010 and 2009, respectively.
In April 2011, the shareholders approved amendments to the DuPont Equity and Incentive Plan (EIP). The EIP provides for equity-based and cash incentiveawards to certain employees, directors, and consultants. Under the amended EIP, the maximum number of shares reserved for the grant or settlement ofawards is 110 million shares, provided that each share in excess of 30 million that is issued with respect to any award that is not an option or stockappreciation right will be counted against the 110 million share limit as four and one-half shares. At December 31, 2011 , approximately 67 million shareswere authorized for future grants under the company's EIP. The company satisfies stock option exercises and vesting of time-vested restricted stock units(RSUs) and performance-based restricted stock units (PSUs) with newly issued shares of DuPont common stock.
The company's Compensation Committee determines the long-term incentive mix, including stock options, RSUs and PSUs and may authorize new grantsannually.
Stock OptionsThe exercise price of shares subject to option is equal to the market price of the company's stock on the date of grant. Options granted prior to 2004 expire10 years from date of grant; options granted between 2004 and 2008 serially vested over a three-year period and carry a six-year option term. Stock optionawards granted between 2009 and 2011 expire seven years after the grant date. The plan allows retirement eligible employees to retain any granted awardsupon retirement provided the employee has rendered at least six months of service following grant date.
For purposes of determining the fair value of stock options awards, the company uses the Black-Scholes option pricing model and the assumptions set forth inthe table below. The weighted-average grant-date fair value of options granted in 2011, 2010 and 2009 was $12.32, $6.44 and $2.68, respectively.
2011 2010 2009
Dividend yield 3.2% 4.9% 7.0%
Volatility 33.26% 32.44% 27.61%
Risk-free interest rate 2.3% 2.6% 2.5%
Expected life (years) 5.3 5.3 5.3
The company determines the dividend yield by dividing the current annual dividend on the company's stock by the option exercise price. A historical dailymeasurement of volatility is determined based on the expected life of the option granted. The risk-free interest rate is determined by reference to the yield onan outstanding U.S. Treasury note with a term equal to the expected life of the option granted. Expected life is determined by reference to the company'shistorical experience.
F-34
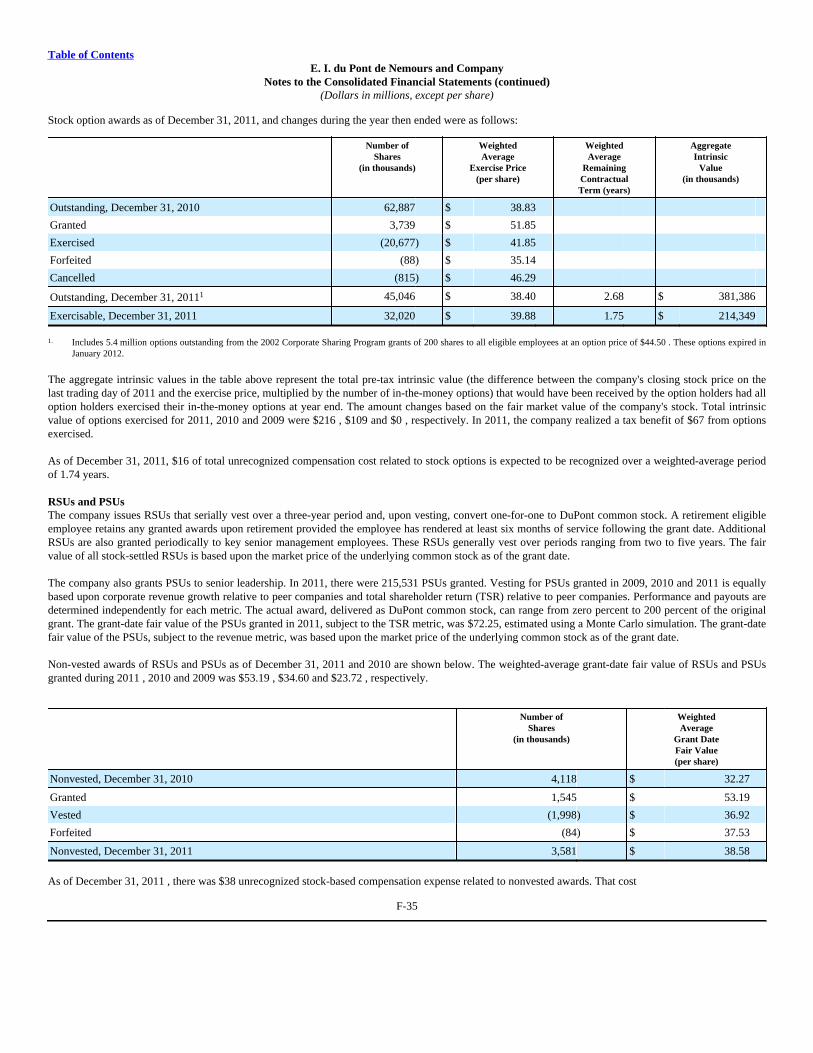
Table of ContentsE. I. du Pont de Nemours and Company
Notes to the Consolidated Financial Statements (continued)(Dollars in millions, except per share)
Stock option awards as of December 31, 2011, and changes during the year then ended were as follows:
Number ofShares
(in thousands)
WeightedAverage
Exercise Price(per share)
WeightedAverage
RemainingContractualTerm (years)
AggregateIntrinsic
Value(in thousands)
Outstanding, December 31, 2010 62,887 $ 38.83
Granted 3,739 $ 51.85
Exercised (20,677) $ 41.85
Forfeited (88) $ 35.14
Cancelled (815) $ 46.29
Outstanding, December 31, 20111 45,046 $ 38.40 2.68 $ 381,386
Exercisable, December 31, 2011 32,020 $ 39.88 1.75 $ 214,349
1. Includes 5.4 million options outstanding from the 2002 Corporate Sharing Program grants of 200 shares to all eligible employees at an option price of $44.50 . These options expired inJanuary 2012.
The aggregate intrinsic values in the table above represent the total pre-tax intrinsic value (the difference between the company's closing stock price on thelast trading day of 2011 and the exercise price, multiplied by the number of in-the-money options) that would have been received by the option holders had alloption holders exercised their in-the-money options at year end. The amount changes based on the fair market value of the company's stock. Total intrinsicvalue of options exercised for 2011, 2010 and 2009 were $216 , $109 and $0 , respectively. In 2011, the company realized a tax benefit of $67 from optionsexercised.
As of December 31, 2011, $16 of total unrecognized compensation cost related to stock options is expected to be recognized over a weighted-average periodof 1.74 years.
RSUs and PSUsThe company issues RSUs that serially vest over a three-year period and, upon vesting, convert one-for-one to DuPont common stock. A retirement eligibleemployee retains any granted awards upon retirement provided the employee has rendered at least six months of service following the grant date. AdditionalRSUs are also granted periodically to key senior management employees. These RSUs generally vest over periods ranging from two to five years. The fairvalue of all stock-settled RSUs is based upon the market price of the underlying common stock as of the grant date.
The company also grants PSUs to senior leadership. In 2011, there were 215,531 PSUs granted. Vesting for PSUs granted in 2009, 2010 and 2011 is equallybased upon corporate revenue growth relative to peer companies and total shareholder return (TSR) relative to peer companies. Performance and payouts aredetermined independently for each metric. The actual award, delivered as DuPont common stock, can range from zero percent to 200 percent of the originalgrant. The grant-date fair value of the PSUs granted in 2011, subject to the TSR metric, was $72.25, estimated using a Monte Carlo simulation. The grant-datefair value of the PSUs, subject to the revenue metric, was based upon the market price of the underlying common stock as of the grant date.
Non-vested awards of RSUs and PSUs as of December 31, 2011 and 2010 are shown below. The weighted-average grant-date fair value of RSUs and PSUsgranted during 2011 , 2010 and 2009 was $53.19 , $34.60 and $23.72 , respectively.
Number ofShares
(in thousands)
WeightedAverage
Grant DateFair Value(per share)
Nonvested, December 31, 2010 4,118 $ 32.27
Granted 1,545 $ 53.19
Vested (1,998) $ 36.92
Forfeited (84) $ 37.53
Nonvested, December 31, 2011 3,581 $ 38.58
As of December 31, 2011 , there was $38 unrecognized stock-based compensation expense related to nonvested awards. That cost
F-35
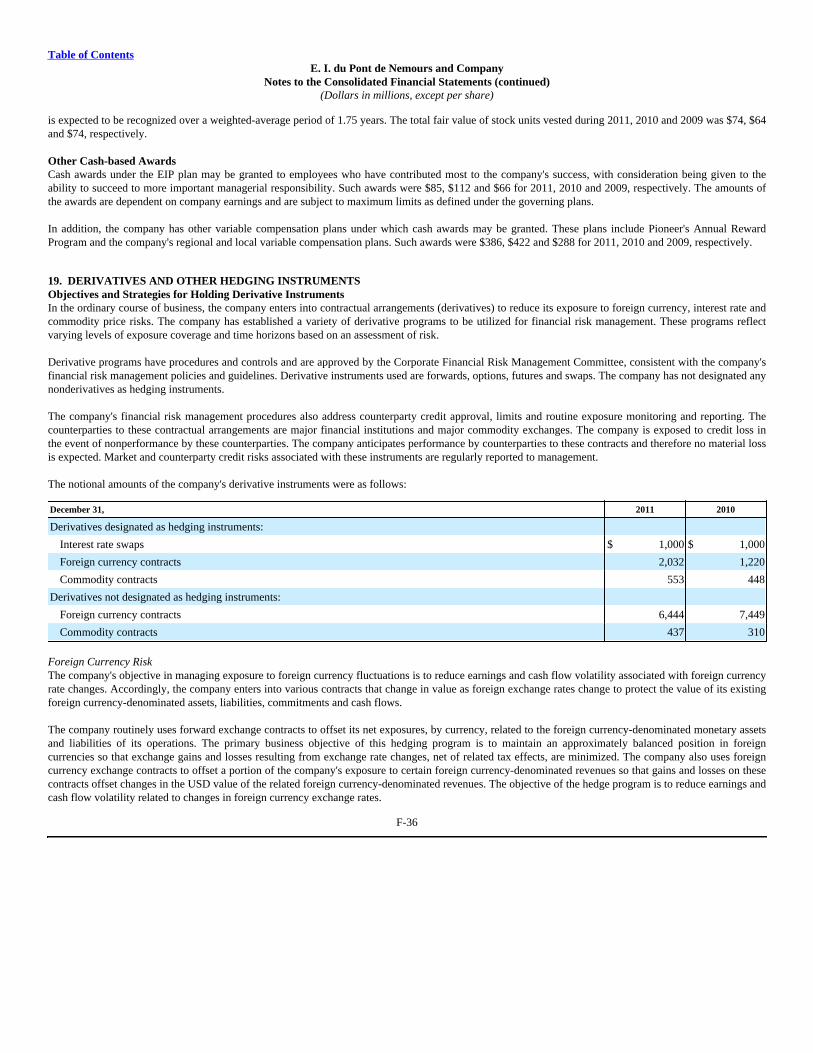
Table of ContentsE. I. du Pont de Nemours and Company
Notes to the Consolidated Financial Statements (continued)(Dollars in millions, except per share)
is expected to be recognized over a weighted-average period of 1.75 years. The total fair value of stock units vested during 2011, 2010 and 2009 was $74, $64and $74, respectively.
Other Cash-based AwardsCash awards under the EIP plan may be granted to employees who have contributed most to the company's success, with consideration being given to theability to succeed to more important managerial responsibility. Such awards were $85, $112 and $66 for 2011, 2010 and 2009, respectively. The amounts ofthe awards are dependent on company earnings and are subject to maximum limits as defined under the governing plans.
In addition, the company has other variable compensation plans under which cash awards may be granted. These plans include Pioneer's Annual RewardProgram and the company's regional and local variable compensation plans. Such awards were $386, $422 and $288 for 2011, 2010 and 2009, respectively.
19. DERIVATIVES AND OTHER HEDGING INSTRUMENTSObjectives and Strategies for Holding Derivative InstrumentsIn the ordinary course of business, the company enters into contractual arrangements (derivatives) to reduce its exposure to foreign currency, interest rate andcommodity price risks. The company has established a variety of derivative programs to be utilized for financial risk management. These programs reflectvarying levels of exposure coverage and time horizons based on an assessment of risk.
Derivative programs have procedures and controls and are approved by the Corporate Financial Risk Management Committee, consistent with the company'sfinancial risk management policies and guidelines. Derivative instruments used are forwards, options, futures and swaps. The company has not designated anynonderivatives as hedging instruments. The company's financial risk management procedures also address counterparty credit approval, limits and routine exposure monitoring and reporting. Thecounterparties to these contractual arrangements are major financial institutions and major commodity exchanges. The company is exposed to credit loss inthe event of nonperformance by these counterparties. The company anticipates performance by counterparties to these contracts and therefore no material lossis expected. Market and counterparty credit risks associated with these instruments are regularly reported to management.
The notional amounts of the company's derivative instruments were as follows:
December 31, 2011 2010
Derivatives designated as hedging instruments:
Interest rate swaps $ 1,000 $ 1,000
Foreign currency contracts 2,032 1,220
Commodity contracts 553 448
Derivatives not designated as hedging instruments:
Foreign currency contracts 6,444 7,449
Commodity contracts 437 310
Foreign Currency RiskThe company's objective in managing exposure to foreign currency fluctuations is to reduce earnings and cash flow volatility associated with foreign currencyrate changes. Accordingly, the company enters into various contracts that change in value as foreign exchange rates change to protect the value of its existingforeign currency-denominated assets, liabilities, commitments and cash flows.
The company routinely uses forward exchange contracts to offset its net exposures, by currency, related to the foreign currency-denominated monetary assetsand liabilities of its operations. The primary business objective of this hedging program is to maintain an approximately balanced position in foreigncurrencies so that exchange gains and losses resulting from exchange rate changes, net of related tax effects, are minimized. The company also uses foreigncurrency exchange contracts to offset a portion of the company's exposure to certain foreign currency-denominated revenues so that gains and losses on thesecontracts offset changes in the USD value of the related foreign currency-denominated revenues. The objective of the hedge program is to reduce earnings andcash flow volatility related to changes in foreign currency exchange rates.
F-36
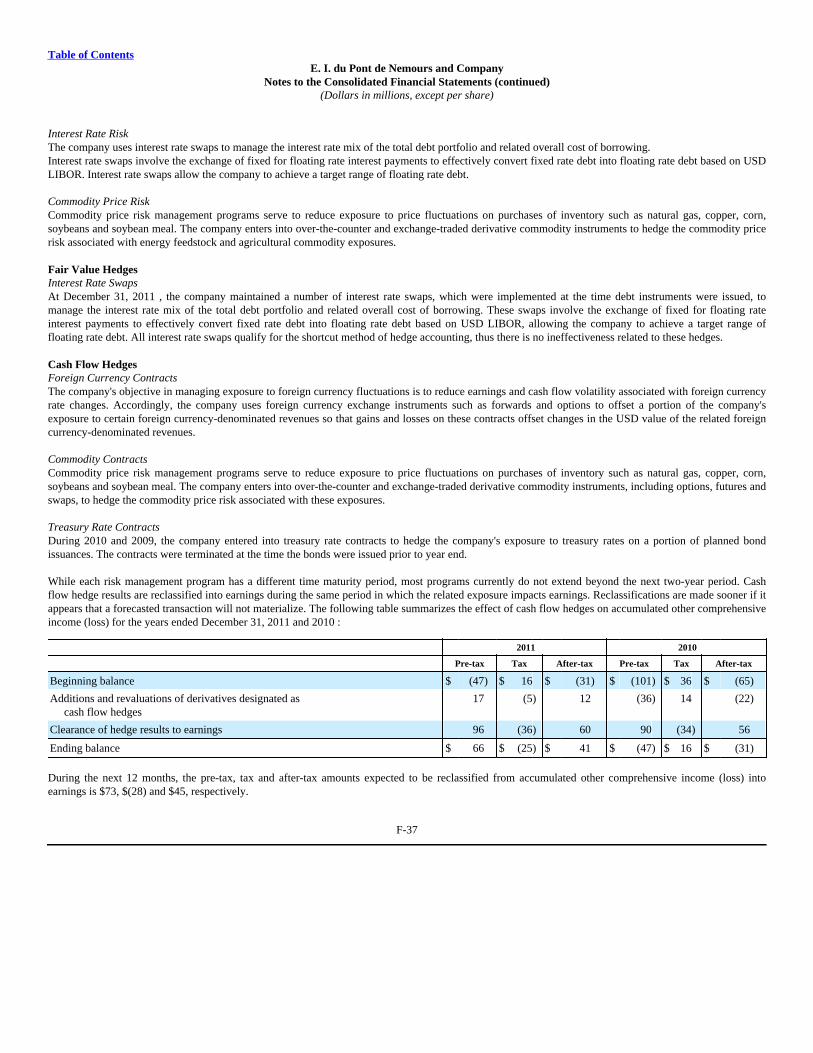
Table of ContentsE. I. du Pont de Nemours and Company
Notes to the Consolidated Financial Statements (continued)(Dollars in millions, except per share)
Interest Rate RiskThe company uses interest rate swaps to manage the interest rate mix of the total debt portfolio and related overall cost of borrowing.Interest rate swaps involve the exchange of fixed for floating rate interest payments to effectively convert fixed rate debt into floating rate debt based on USDLIBOR. Interest rate swaps allow the company to achieve a target range of floating rate debt.
Commodity Price RiskCommodity price risk management programs serve to reduce exposure to price fluctuations on purchases of inventory such as natural gas, copper, corn,soybeans and soybean meal. The company enters into over-the-counter and exchange-traded derivative commodity instruments to hedge the commodity pricerisk associated with energy feedstock and agricultural commodity exposures.
Fair Value HedgesInterest Rate SwapsAt December 31, 2011 , the company maintained a number of interest rate swaps, which were implemented at the time debt instruments were issued, tomanage the interest rate mix of the total debt portfolio and related overall cost of borrowing. These swaps involve the exchange of fixed for floating rateinterest payments to effectively convert fixed rate debt into floating rate debt based on USD LIBOR, allowing the company to achieve a target range offloating rate debt. All interest rate swaps qualify for the shortcut method of hedge accounting, thus there is no ineffectiveness related to these hedges.
Cash Flow HedgesForeign Currency ContractsThe company's objective in managing exposure to foreign currency fluctuations is to reduce earnings and cash flow volatility associated with foreign currencyrate changes. Accordingly, the company uses foreign currency exchange instruments such as forwards and options to offset a portion of the company'sexposure to certain foreign currency-denominated revenues so that gains and losses on these contracts offset changes in the USD value of the related foreigncurrency-denominated revenues.
Commodity ContractsCommodity price risk management programs serve to reduce exposure to price fluctuations on purchases of inventory such as natural gas, copper, corn,soybeans and soybean meal. The company enters into over-the-counter and exchange-traded derivative commodity instruments, including options, futures andswaps, to hedge the commodity price risk associated with these exposures.
Treasury Rate ContractsDuring 2010 and 2009, the company entered into treasury rate contracts to hedge the company's exposure to treasury rates on a portion of planned bondissuances. The contracts were terminated at the time the bonds were issued prior to year end.
While each risk management program has a different time maturity period, most programs currently do not extend beyond the next two-year period. Cashflow hedge results are reclassified into earnings during the same period in which the related exposure impacts earnings. Reclassifications are made sooner if itappears that a forecasted transaction will not materialize. The following table summarizes the effect of cash flow hedges on accumulated other comprehensiveincome (loss) for the years ended December 31, 2011 and 2010 :
2011 2010
Pre-tax Tax After-tax Pre-tax Tax After-tax
Beginning balance $ (47) $ 16 $ (31) $ (101) $ 36 $ (65)
Additions and revaluations of derivatives designated as cash flow hedges
17 (5) 12 (36) 14 (22)
Clearance of hedge results to earnings 96 (36) 60 90 (34) 56
Ending balance $ 66 $ (25) $ 41 $ (47) $ 16 $ (31)
During the next 12 months, the pre-tax, tax and after-tax amounts expected to be reclassified from accumulated other comprehensive income (loss) intoearnings is $73, $(28) and $45, respectively.
F-37
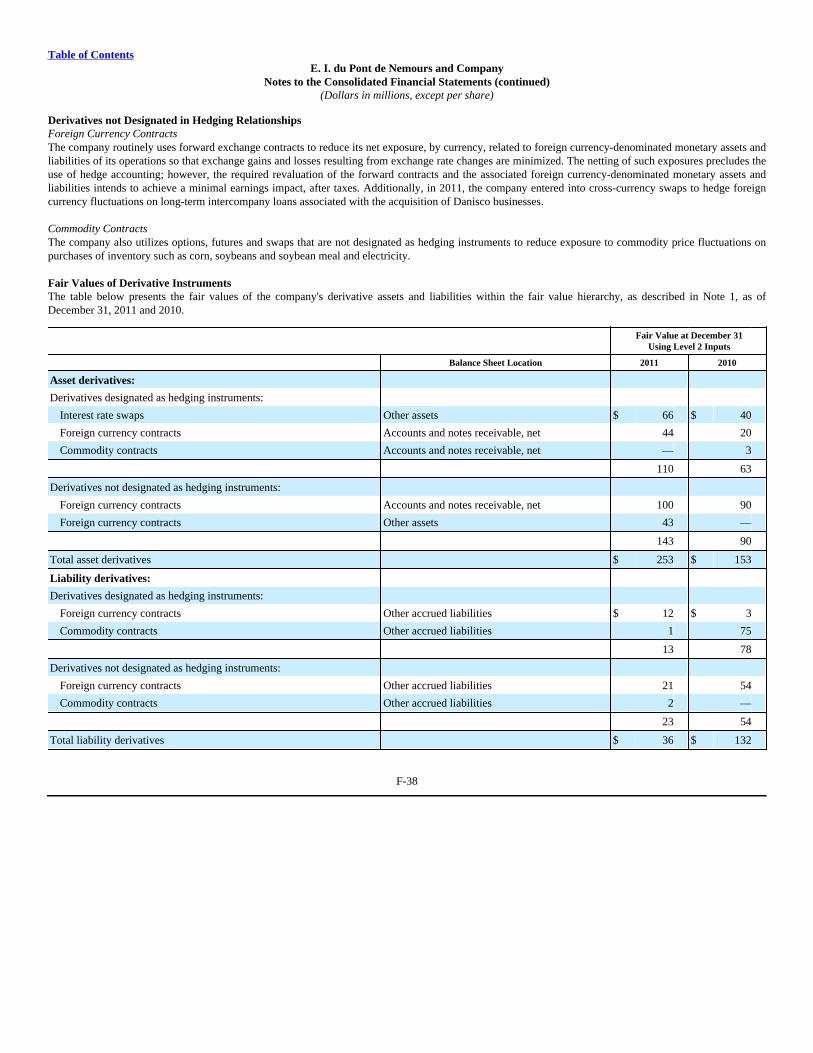
Table of ContentsE. I. du Pont de Nemours and Company
Notes to the Consolidated Financial Statements (continued)(Dollars in millions, except per share)
Derivatives not Designated in Hedging RelationshipsForeign Currency ContractsThe company routinely uses forward exchange contracts to reduce its net exposure, by currency, related to foreign currency-denominated monetary assets andliabilities of its operations so that exchange gains and losses resulting from exchange rate changes are minimized. The netting of such exposures precludes theuse of hedge accounting; however, the required revaluation of the forward contracts and the associated foreign currency-denominated monetary assets andliabilities intends to achieve a minimal earnings impact, after taxes. Additionally, in 2011, the company entered into cross-currency swaps to hedge foreigncurrency fluctuations on long-term intercompany loans associated with the acquisition of Danisco businesses.
Commodity ContractsThe company also utilizes options, futures and swaps that are not designated as hedging instruments to reduce exposure to commodity price fluctuations onpurchases of inventory such as corn, soybeans and soybean meal and electricity.
Fair Values of Derivative InstrumentsThe table below presents the fair values of the company's derivative assets and liabilities within the fair value hierarchy, as described in Note 1, as ofDecember 31, 2011 and 2010.
Fair Value at December 31Using Level 2 Inputs
Balance Sheet Location 2011 2010
Asset derivatives:
Derivatives designated as hedging instruments:
Interest rate swaps Other assets $ 66 $ 40
Foreign currency contracts Accounts and notes receivable, net 44 20
Commodity contracts Accounts and notes receivable, net — 3
110 63
Derivatives not designated as hedging instruments:
Foreign currency contracts Accounts and notes receivable, net 100 90
Foreign currency contracts Other assets 43 —
143 90
Total asset derivatives $ 253 $ 153
Liability derivatives:
Derivatives designated as hedging instruments:
Foreign currency contracts Other accrued liabilities $ 12 $ 3
Commodity contracts Other accrued liabilities 1 75
13 78
Derivatives not designated as hedging instruments:
Foreign currency contracts Other accrued liabilities 21 54
Commodity contracts Other accrued liabilities 2 —
23 54
Total liability derivatives $ 36 $ 132
F-38
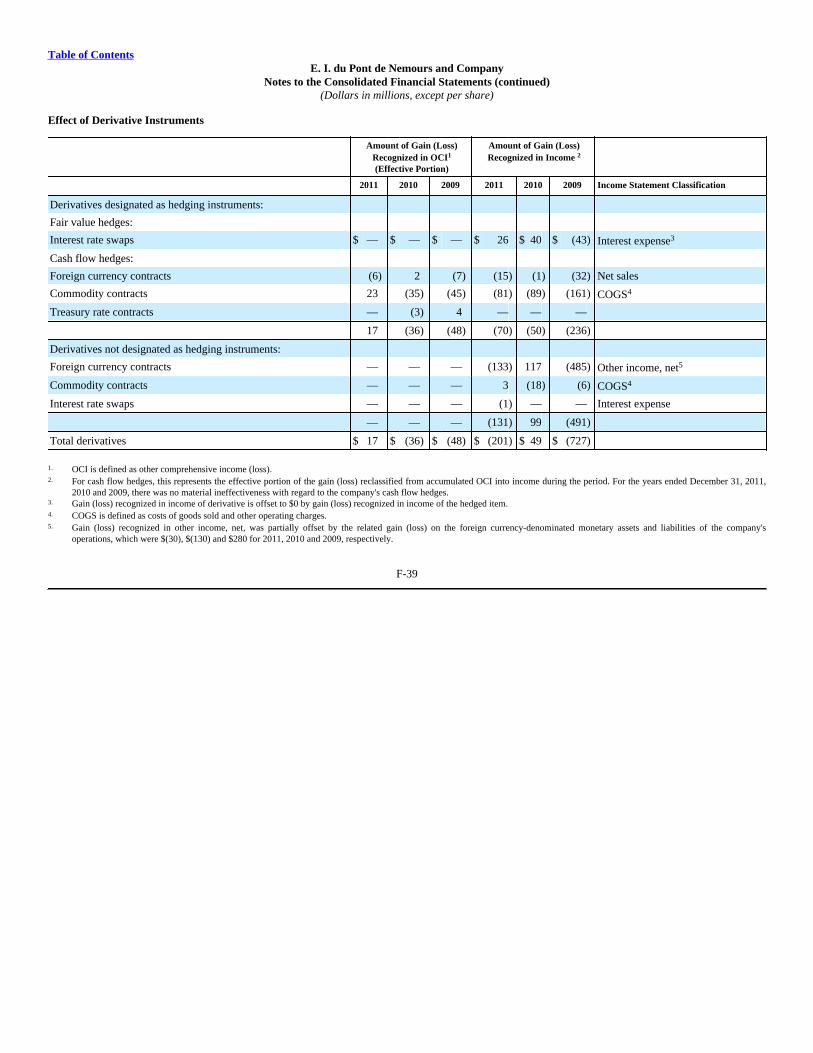
Table of ContentsE. I. du Pont de Nemours and Company
Notes to the Consolidated Financial Statements (continued)(Dollars in millions, except per share)
Effect of Derivative Instruments
Amount of Gain (Loss)Recognized in OCI1
(Effective Portion)
Amount of Gain (Loss)Recognized in Income 2
2011 2010 2009 2011 2010 2009 Income Statement Classification
Derivatives designated as hedging instruments:
Fair value hedges:
Interest rate swaps $ — $ — $ — $ 26 $ 40 $ (43) Interest expense3
Cash flow hedges:
Foreign currency contracts (6) 2 (7) (15) (1) (32) Net sales
Commodity contracts 23 (35) (45) (81) (89) (161) COGS4
Treasury rate contracts — (3) 4 — — —
17 (36) (48) (70) (50) (236)
Derivatives not designated as hedging instruments:
Foreign currency contracts — — — (133) 117 (485) Other income, net5
Commodity contracts — — — 3 (18) (6) COGS4
Interest rate swaps — — — (1) — — Interest expense
— — — (131) 99 (491)
Total derivatives $ 17 $ (36) $ (48) $ (201) $ 49 $ (727)
1. OCI is defined as other comprehensive income (loss).2. For cash flow hedges, this represents the effective portion of the gain (loss) reclassified from accumulated OCI into income during the period. For the years ended December 31, 2011,
2010 and 2009, there was no material ineffectiveness with regard to the company's cash flow hedges.3. Gain (loss) recognized in income of derivative is offset to $0 by gain (loss) recognized in income of the hedged item.4. COGS is defined as costs of goods sold and other operating charges.5. Gain (loss) recognized in other income, net, was partially offset by the related gain (loss) on the foreign currency-denominated monetary assets and liabilities of the company's
operations, which were $(30), $(130) and $280 for 2011, 2010 and 2009, respectively.
F-39
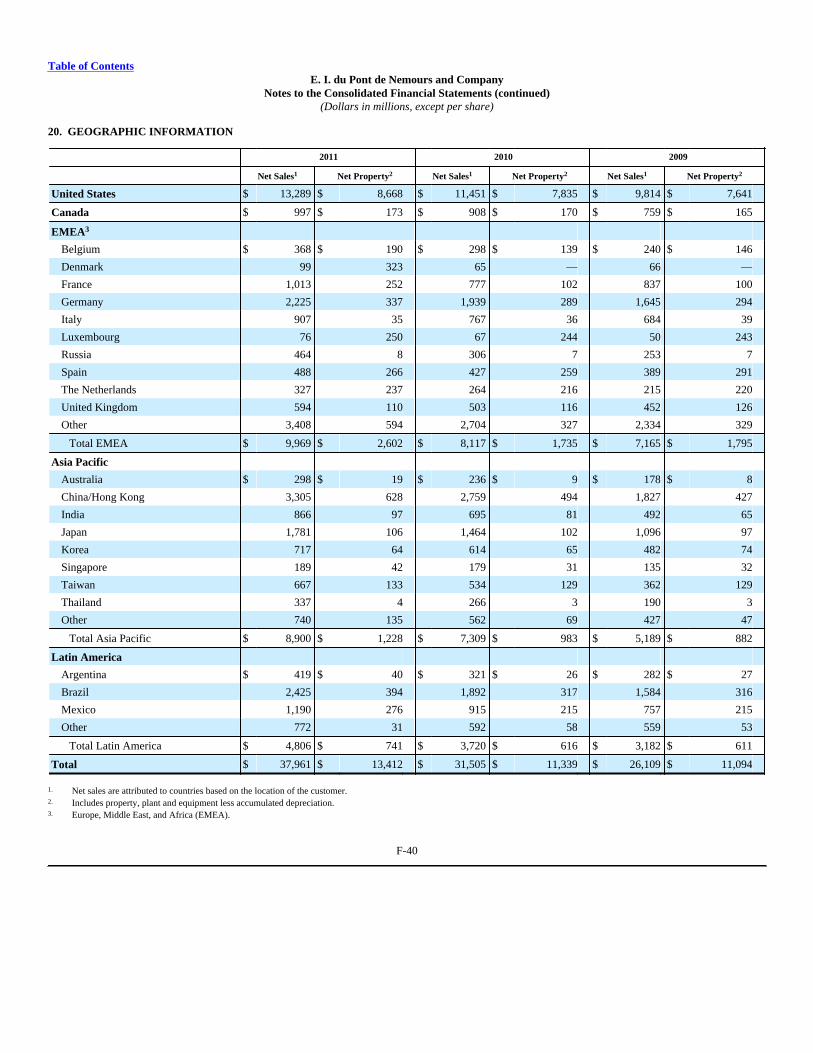
Table of ContentsE. I. du Pont de Nemours and Company
Notes to the Consolidated Financial Statements (continued)(Dollars in millions, except per share)
20. GEOGRAPHIC INFORMATION
2011 2010 2009
Net Sales1 Net Property2 Net Sales1 Net Property2 Net Sales1 Net Property2
United States $ 13,289 $ 8,668 $ 11,451 $ 7,835 $ 9,814 $ 7,641
Canada $ 997 $ 173 $ 908 $ 170 $ 759 $ 165
EMEA3
Belgium $ 368 $ 190 $ 298 $ 139 $ 240 $ 146
Denmark 99 323 65 — 66 —
France 1,013 252 777 102 837 100
Germany 2,225 337 1,939 289 1,645 294
Italy 907 35 767 36 684 39
Luxembourg 76 250 67 244 50 243
Russia 464 8 306 7 253 7
Spain 488 266 427 259 389 291
The Netherlands 327 237 264 216 215 220
United Kingdom 594 110 503 116 452 126
Other 3,408 594 2,704 327 2,334 329
Total EMEA $ 9,969 $ 2,602 $ 8,117 $ 1,735 $ 7,165 $ 1,795
Asia Pacific
Australia $ 298 $ 19 $ 236 $ 9 $ 178 $ 8
China/Hong Kong 3,305 628 2,759 494 1,827 427
India 866 97 695 81 492 65
Japan 1,781 106 1,464 102 1,096 97
Korea 717 64 614 65 482 74
Singapore 189 42 179 31 135 32
Taiwan 667 133 534 129 362 129
Thailand 337 4 266 3 190 3
Other 740 135 562 69 427 47
Total Asia Pacific $ 8,900 $ 1,228 $ 7,309 $ 983 $ 5,189 $ 882
Latin America
Argentina $ 419 $ 40 $ 321 $ 26 $ 282 $ 27
Brazil 2,425 394 1,892 317 1,584 316
Mexico 1,190 276 915 215 757 215
Other 772 31 592 58 559 53
Total Latin America $ 4,806 $ 741 $ 3,720 $ 616 $ 3,182 $ 611
Total $ 37,961 $ 13,412 $ 31,505 $ 11,339 $ 26,109 $ 11,094
1. Net sales are attributed to countries based on the location of the customer.2. Includes property, plant and equipment less accumulated depreciation.3. Europe, Middle East, and Africa (EMEA).
F-40
Table of ContentsE. I. du Pont de Nemours and Company
Notes to the Consolidated Financial Statements (continued)(Dollars in millions, except per share)
21. SEGMENT INFORMATIONThe company consists of 14 businesses which are aggregated into nine reportable segments based on similar economic characteristics, the nature of theproducts and production processes, end-use markets, channels of distribution and regulatory environment. The company's reportable segments are Agriculture,Electronics & Communications, Industrial Biosciences, Nutrition & Health, Performance Chemicals, Performance Coatings, Performance Materials, Safety &Protection and Pharmaceuticals. The company includes certain embryonic businesses not included in the reportable segments, such as pre-commercialprograms, and nonaligned businesses in Other.
Major products by segment include: Agriculture (corn hybrids and soybean varieties, herbicides, fungicides and insecticides); Electronics & Communications(photopolymers and electronic materials); Industrial Biosciences (enzymes); Nutrition & Health (cultures, emulsifiers, gums, natural sweeteners and soy-based food ingredients): Performance Chemicals (fluorochemicals, fluoropolymers, specialty and industrial chemicals, and white pigments); PerformanceCoatings (automotive finishes and industrial coatings); Performance Materials (engineering polymers, packaging and industrial polymers, films andelastomers); Safety & Protection (nonwovens, aramids and solid surfaces); and Pharmaceuticals (representing the company's interest in the collaborationrelating to Cozaar®/Hyzaar® antihypertensive drugs, which is reported as other income). The company operates globally in substantially all of its productlines.
In general, the accounting policies of the segments are the same as those described in Note 1. Exceptions are noted as follows and are shown in thereconciliations below. Prior years' data have been reclassified to reflect the current organizational structure. Segment sales include transfers to anotherbusiness segment. Products are transferred between segments on a basis intended to reflect, as nearly as practicable, the market value of the products. Segmentpre-tax operating income (loss) (PTOI) is defined as operating income (loss) before income taxes, exchange gains (losses), corporate expenses and interest.Segment net assets includes net working capital, net property, plant and equipment and other noncurrent operating assets and liabilities of the segment.Affiliate net assets (pro rata share) excludes borrowing and other long-term liabilities. Depreciation and amortization includes depreciation on research anddevelopment facilities and amortization of other intangible assets, excluding write-down of assets.
F-41
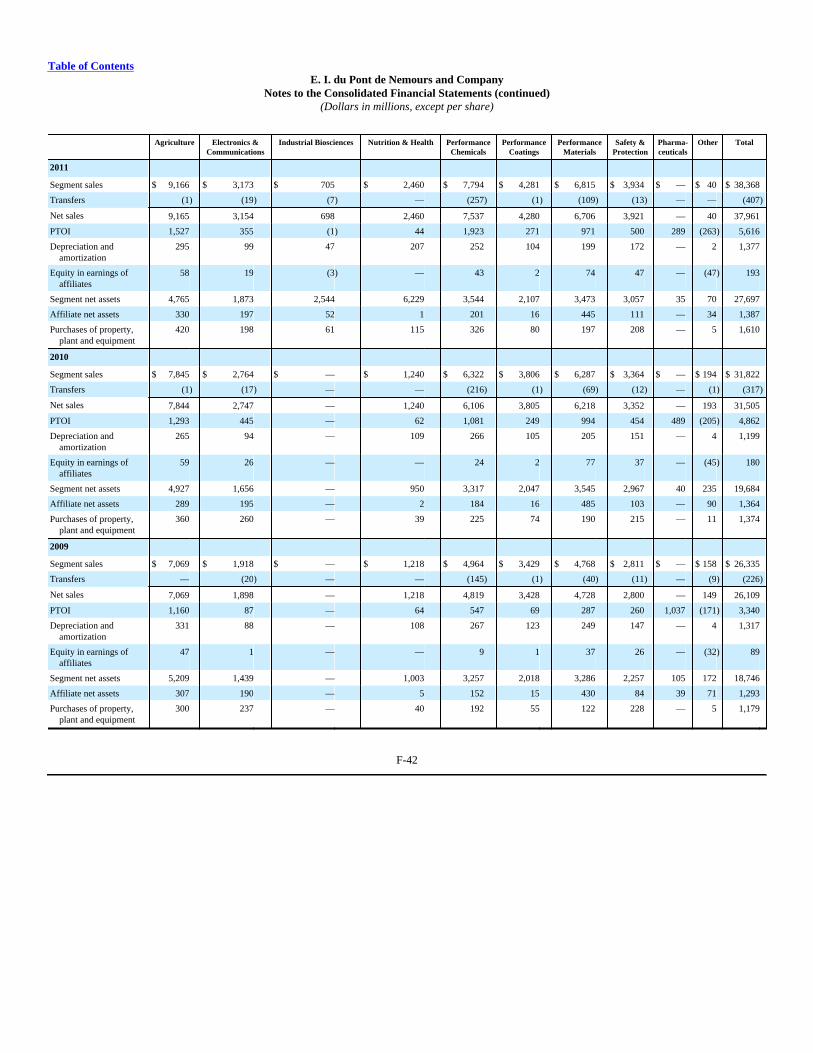
Table of ContentsE. I. du Pont de Nemours and Company
Notes to the Consolidated Financial Statements (continued)(Dollars in millions, except per share)
Agriculture Electronics &Communications
Industrial Biosciences Nutrition & Health PerformanceChemicals
PerformanceCoatings
PerformanceMaterials
Safety &Protection
Pharma-ceuticals
Other Total
2011
Segment sales $ 9,166 $ 3,173 $ 705 $ 2,460 $ 7,794 $ 4,281 $ 6,815 $ 3,934 $ — $ 40 $ 38,368
Transfers (1) (19) (7) — (257) (1) (109) (13) — — (407)
Net sales 9,165 3,154 698 2,460 7,537 4,280 6,706 3,921 — 40 37,961
PTOI 1,527 355 (1) 44 1,923 271 971 500 289 (263) 5,616
Depreciation and amortization
295 99 47 207 252 104 199 172 — 2 1,377
Equity in earnings of affiliates
58 19 (3) — 43 2 74 47 — (47) 193
Segment net assets 4,765 1,873 2,544 6,229 3,544 2,107 3,473 3,057 35 70 27,697
Affiliate net assets 330 197 52 1 201 16 445 111 — 34 1,387
Purchases of property, plant and equipment
420 198 61 115 326 80 197 208 — 5 1,610
2010 Segment sales $ 7,845 $ 2,764 $ — $ 1,240 $ 6,322 $ 3,806 $ 6,287 $ 3,364 $ — $ 194 $ 31,822
Transfers (1) (17) — — (216) (1) (69) (12) — (1) (317)
Net sales 7,844 2,747 — 1,240 6,106 3,805 6,218 3,352 — 193 31,505
PTOI 1,293 445 — 62 1,081 249 994 454 489 (205) 4,862
Depreciation and amortization
265 94 — 109 266 105 205 151 — 4 1,199
Equity in earnings of affiliates
59 26 — — 24 2 77 37 — (45) 180
Segment net assets 4,927 1,656 — 950 3,317 2,047 3,545 2,967 40 235 19,684
Affiliate net assets 289 195 — 2 184 16 485 103 — 90 1,364
Purchases of property, plant and equipment
360 260 — 39 225 74 190 215 — 11 1,374
2009 Segment sales $ 7,069 $ 1,918 $ — $ 1,218 $ 4,964 $ 3,429 $ 4,768 $ 2,811 $ — $ 158 $ 26,335
Transfers — (20) — — (145) (1) (40) (11) — (9) (226)
Net sales 7,069 1,898 — 1,218 4,819 3,428 4,728 2,800 — 149 26,109
PTOI 1,160 87 — 64 547 69 287 260 1,037 (171) 3,340
Depreciation and amortization
331 88 — 108 267 123 249 147 — 4 1,317
Equity in earnings of affiliates
47 1 — — 9 1 37 26 — (32) 89
Segment net assets 5,209 1,439 — 1,003 3,257 2,018 3,286 2,257 105 172 18,746
Affiliate net assets 307 190 — 5 152 15 430 84 39 71 1,293
Purchases of property, plant and equipment
300 237 — 40 192 55 122 228 — 5 1,179
F-42
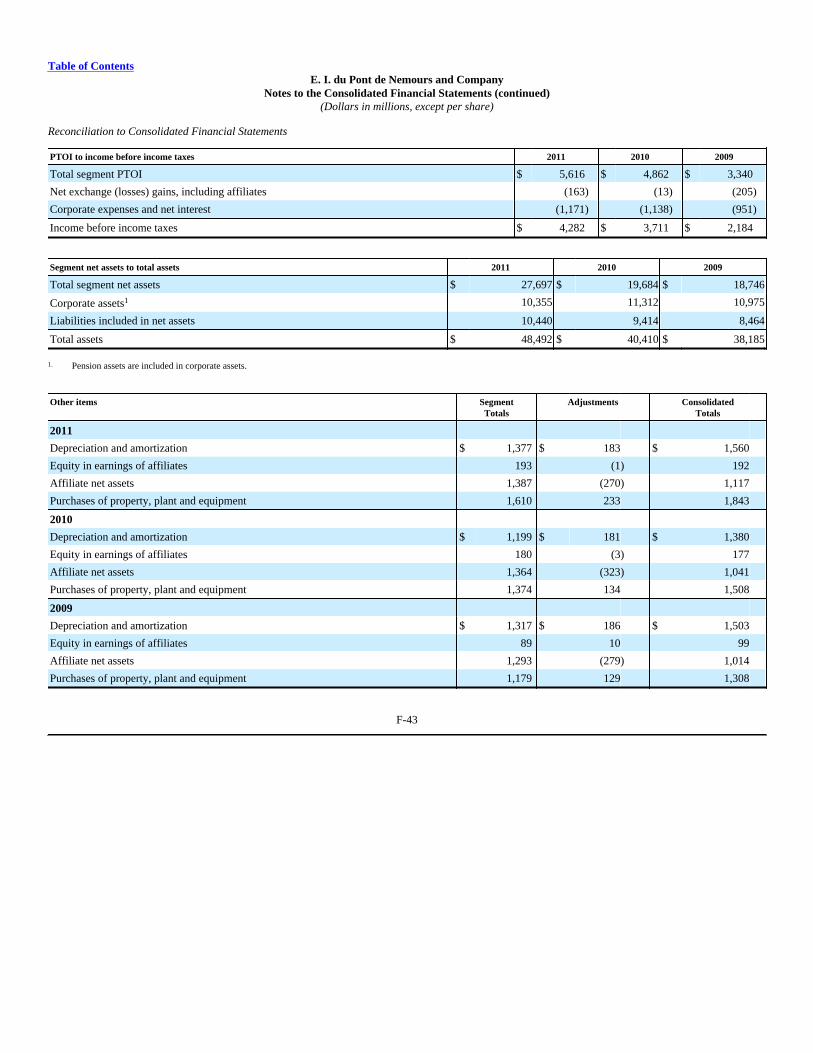
Table of ContentsE. I. du Pont de Nemours and Company
Notes to the Consolidated Financial Statements (continued)(Dollars in millions, except per share)
Reconciliation to Consolidated Financial Statements
PTOI to income before income taxes 2011 2010 2009
Total segment PTOI $ 5,616 $ 4,862 $ 3,340
Net exchange (losses) gains, including affiliates (163) (13) (205)
Corporate expenses and net interest (1,171) (1,138) (951)
Income before income taxes $ 4,282 $ 3,711 $ 2,184
Segment net assets to total assets 2011 2010 2009
Total segment net assets $ 27,697 $ 19,684 $ 18,746
Corporate assets1 10,355 11,312 10,975
Liabilities included in net assets 10,440 9,414 8,464
Total assets $ 48,492 $ 40,410 $ 38,185
1. Pension assets are included in corporate assets.
Other items SegmentTotals
Adjustments ConsolidatedTotals
2011
Depreciation and amortization $ 1,377 $ 183 $ 1,560
Equity in earnings of affiliates 193 (1) 192
Affiliate net assets 1,387 (270) 1,117
Purchases of property, plant and equipment 1,610 233 1,843
2010
Depreciation and amortization $ 1,199 $ 181 $ 1,380
Equity in earnings of affiliates 180 (3) 177
Affiliate net assets 1,364 (323) 1,041
Purchases of property, plant and equipment 1,374 134 1,508
2009
Depreciation and amortization $ 1,317 $ 186 $ 1,503
Equity in earnings of affiliates 89 10 99
Affiliate net assets 1,293 (279) 1,014
Purchases of property, plant and equipment 1,179 129 1,308
F-43
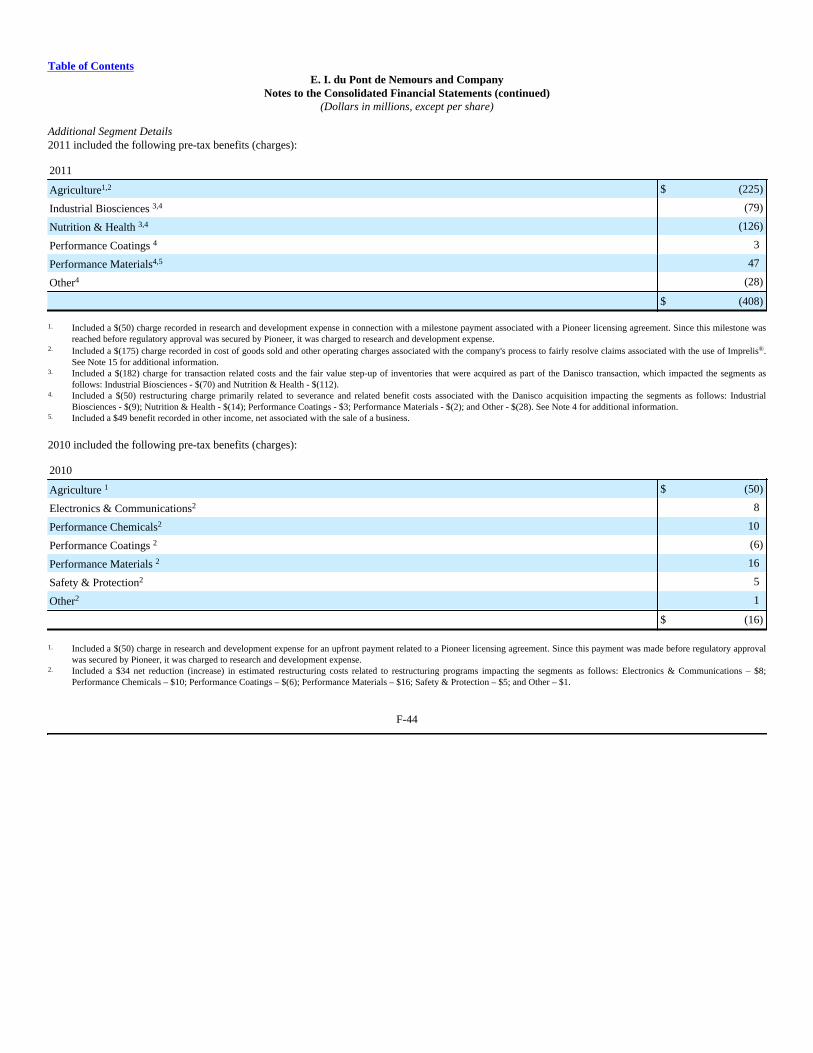
Table of ContentsE. I. du Pont de Nemours and Company
Notes to the Consolidated Financial Statements (continued)(Dollars in millions, except per share)
Additional Segment Details2011 included the following pre-tax benefits (charges):
2011
Agriculture1,2 $ (225)
Industrial Biosciences 3,4 (79)
Nutrition & Health 3,4 (126)
Performance Coatings 4 3
Performance Materials4,5 47
Other4 (28)
$ (408)
1. Included a $(50) charge recorded in research and development expense in connection with a milestone payment associated with a Pioneer licensing agreement. Since this milestone wasreached before regulatory approval was secured by Pioneer, it was charged to research and development expense.
2. Included a $(175) charge recorded in cost of goods sold and other operating charges associated with the company's process to fairly resolve claims associated with the use of Imprelis®.See Note 15 for additional information.
3. Included a $(182) charge for transaction related costs and the fair value step-up of inventories that were acquired as part of the Danisco transaction, which impacted the segments asfollows: Industrial Biosciences - $(70) and Nutrition & Health - $(112).
4. Included a $(50) restructuring charge primarily related to severance and related benefit costs associated with the Danisco acquisition impacting the segments as follows: IndustrialBiosciences - $(9); Nutrition & Health - $(14); Performance Coatings - $3; Performance Materials - $(2); and Other - $(28). See Note 4 for additional information.
5. Included a $49 benefit recorded in other income, net associated with the sale of a business.
2010 included the following pre-tax benefits (charges):
2010
Agriculture 1 $ (50)
Electronics & Communications2 8
Performance Chemicals2 10
Performance Coatings 2 (6)
Performance Materials 2 16
Safety & Protection2 5
Other2 1
$ (16)
1. Included a $(50) charge in research and development expense for an upfront payment related to a Pioneer licensing agreement. Since this payment was made before regulatory approvalwas secured by Pioneer, it was charged to research and development expense.
2. Included a $34 net reduction (increase) in estimated restructuring costs related to restructuring programs impacting the segments as follows: Electronics & Communications – $8;Performance Chemicals – $10; Performance Coatings – $(6); Performance Materials – $16; Safety & Protection – $5; and Other – $1.
F-44
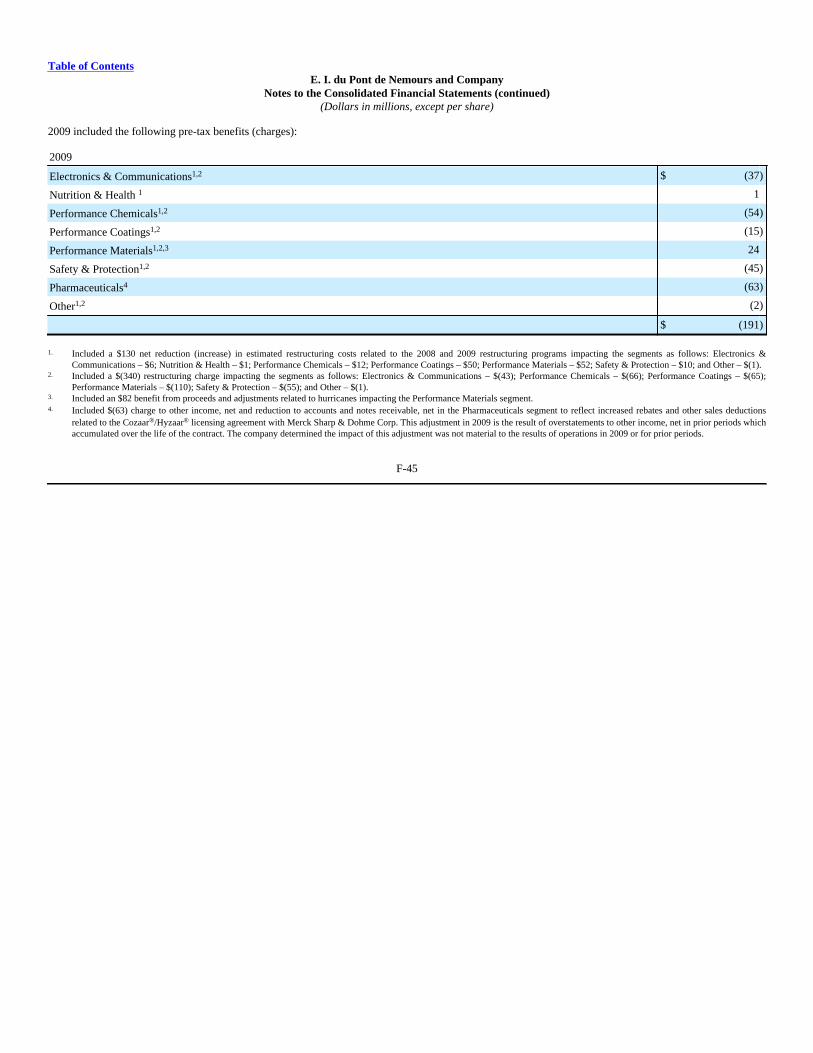
Table of ContentsE. I. du Pont de Nemours and Company
Notes to the Consolidated Financial Statements (continued)(Dollars in millions, except per share)
2009 included the following pre-tax benefits (charges):
2009
Electronics & Communications1,2 $ (37)
Nutrition & Health 1 1
Performance Chemicals1,2 (54)
Performance Coatings1,2 (15)
Performance Materials1,2,3 24
Safety & Protection1,2 (45)
Pharmaceuticals4 (63)
Other1,2 (2)
$ (191)
1. Included a $130 net reduction (increase) in estimated restructuring costs related to the 2008 and 2009 restructuring programs impacting the segments as follows: Electronics &Communications – $6; Nutrition & Health – $1; Performance Chemicals – $12; Performance Coatings – $50; Performance Materials – $52; Safety & Protection – $10; and Other – $(1).
2. Included a $(340) restructuring charge impacting the segments as follows: Electronics & Communications – $(43); Performance Chemicals – $(66); Performance Coatings – $(65);Performance Materials – $(110); Safety & Protection – $(55); and Other – $(1).
3. Included an $82 benefit from proceeds and adjustments related to hurricanes impacting the Performance Materials segment.4. Included $(63) charge to other income, net and reduction to accounts and notes receivable, net in the Pharmaceuticals segment to reflect increased rebates and other sales deductions
related to the Cozaar®/Hyzaar® licensing agreement with Merck Sharp & Dohme Corp. This adjustment in 2009 is the result of overstatements to other income, net in prior periods whichaccumulated over the life of the contract. The company determined the impact of this adjustment was not material to the results of operations in 2009 or for prior periods.
F-45
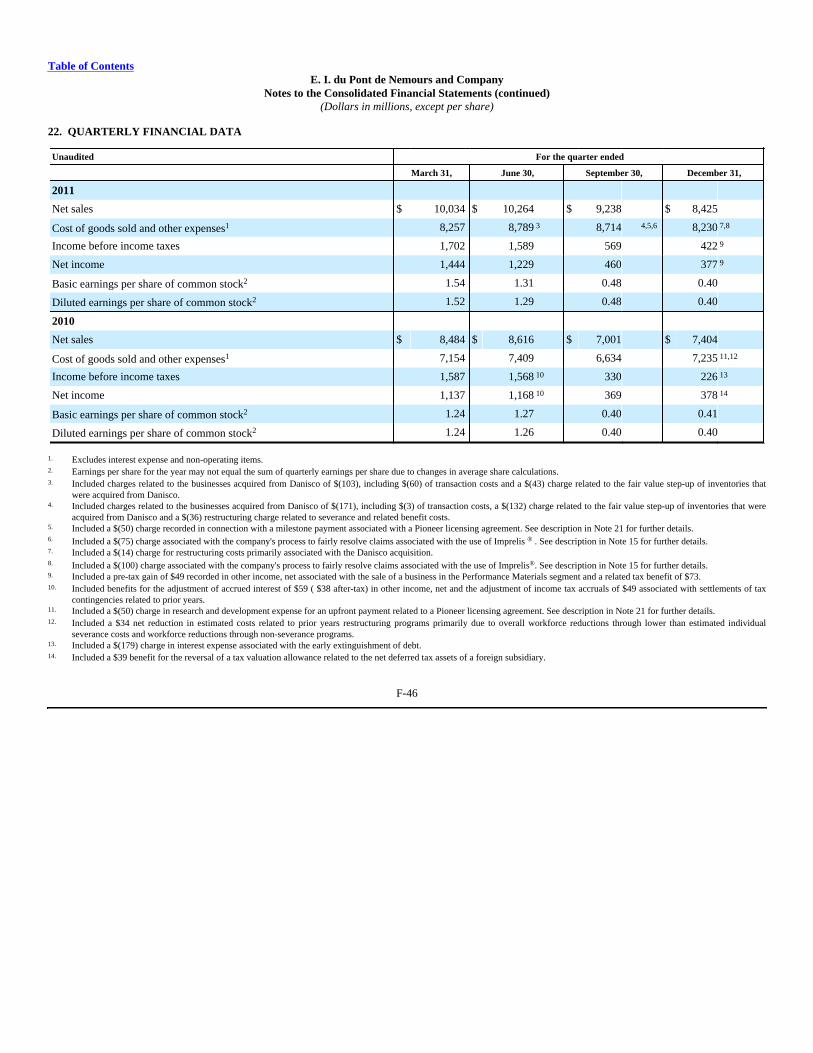
Table of ContentsE. I. du Pont de Nemours and Company
Notes to the Consolidated Financial Statements (continued)(Dollars in millions, except per share)
22. QUARTERLY FINANCIAL DATA
Unaudited For the quarter ended
March 31, June 30, September 30, December 31,
2011
Net sales $ 10,034 $ 10,264 $ 9,238 $ 8,425
Cost of goods sold and other expenses1 8,257 8,789 3 8,714 4,5,6 8,230 7,8
Income before income taxes 1,702 1,589 569 422 9
Net income 1,444 1,229 460 377 9
Basic earnings per share of common stock2 1.54 1.31 0.48 0.40
Diluted earnings per share of common stock2 1.52 1.29 0.48 0.40
2010
Net sales $ 8,484 $ 8,616 $ 7,001 $ 7,404
Cost of goods sold and other expenses1 7,154 7,409 6,634 7,235 11,12
Income before income taxes 1,587 1,568 10 330 226 13
Net income 1,137 1,168 10 369 378 14
Basic earnings per share of common stock2 1.24 1.27 0.40 0.41
Diluted earnings per share of common stock2 1.24 1.26 0.40 0.40
1. Excludes interest expense and non-operating items.2. Earnings per share for the year may not equal the sum of quarterly earnings per share due to changes in average share calculations.3. Included charges related to the businesses acquired from Danisco of $(103), including $(60) of transaction costs and a $(43) charge related to the fair value step-up of inventories that
were acquired from Danisco.4. Included charges related to the businesses acquired from Danisco of $(171), including $(3) of transaction costs, a $(132) charge related to the fair value step-up of inventories that were
acquired from Danisco and a $(36) restructuring charge related to severance and related benefit costs.5. Included a $(50) charge recorded in connection with a milestone payment associated with a Pioneer licensing agreement. See description in Note 21 for further details.6. Included a $(75) charge associated with the company's process to fairly resolve claims associated with the use of Imprelis ® . See description in Note 15 for further details.7. Included a $(14) charge for restructuring costs primarily associated with the Danisco acquisition.8. Included a $(100) charge associated with the company's process to fairly resolve claims associated with the use of Imprelis®. See description in Note 15 for further details.9. Included a pre-tax gain of $49 recorded in other income, net associated with the sale of a business in the Performance Materials segment and a related tax benefit of $73.10. Included benefits for the adjustment of accrued interest of $59 ( $38 after-tax) in other income, net and the adjustment of income tax accruals of $49 associated with settlements of tax
contingencies related to prior years.11. Included a $(50) charge in research and development expense for an upfront payment related to a Pioneer licensing agreement. See description in Note 21 for further details.12. Included a $34 net reduction in estimated costs related to prior years restructuring programs primarily due to overall workforce reductions through lower than estimated individual
severance costs and workforce reductions through non-severance programs.13. Included a $(179) charge in interest expense associated with the early extinguishment of debt.14. Included a $39 benefit for the reversal of a tax valuation allowance related to the net deferred tax assets of a foreign subsidiary.
F-46
Table of Contents
Information for Investors
Corporate Headquarters
E. I. du Pont de Nemours and Company1007 Market StreetWilmington, DE 19898Telephone: 302 774-1000
E-mail: [email protected]
2012 Annual MeetingThe annual meeting of the shareholders will be held at 10:30 a.m., on Wednesday, April25, in The DuPont Theatre in the DuPont Building, 1007 Market Street, Wilmington,Delaware.
Stock Exchange ListingsDuPont common stock (Symbol DD) is listed on the New York Stock Exchange, Inc.(NYSE) and on certain foreign exchanges. Quarterly high and low market prices areshown in Item 5 of the Form 10-K.DuPont preferred stock is listed on the New York Stock Exchange, Inc. (Symbol DDPrAfor $3.50 series and Symbol DDPrB for $4.50 series).
DividendsHolders of the company's common stock are entitled to receive dividends when they aredeclared by the Board of Directors. While it is not a guarantee of future conduct, thecompany has continuously paid a quarterly dividend since the fourth quarter 1904.Dividends on common stock and preferred stock are usually declared in January, April,July and October. When dividends on common stock are declared, they are usually paidmid March, June, September and December. Preferred dividends are paid on or about the25th of January, April, July and October.
Shareholder ServicesInquiries from shareholders about stock accounts, transfers, certificates, dividends(including direct deposit and reinvestment), name or address changes and electronicreceipt of proxy materials may be directed to DuPont's stock transfer agent:
Computershare Trust Company, N.A.P.O. Box 43078Providence, RI 02940-3078or call: in the United States and Canada
888 983-8766 (toll-free)other locations-781 575-2724for the hearing impaired-TDD: 800 952-9245 (toll-free)
or visit Computershare's home page at http://www.computershare.com
Independent Registered Public Accounting FirmPricewaterhouseCoopers LLPTwo Commerce Square, Suite 17002001 Market StreetPhiladelphia, PA 19103
Investor RelationsInstitutional investors and other representatives of financial institutions should contact:
E. I. du Pont de Nemours and CompanyDuPont Investor Relations1007 Market Street-D-11020Wilmington, DE 19898or call 302 774-4994
Bondholder RelationsE. I. du Pont de Nemours and CompanyDuPont Finance1007 Market Street-D-8028Wilmington, DE 19898or call 302 774-0564or 302 774-8802
DuPont on the InternetFinancial results, news and other information about DuPont can be accessed from the
company's website at http://www.dupont.com. This site includes important information
on products and services, financial reports, news releases, environmental information and
career opportunities. The company's periodic and current reports filed with the SEC are
available on its website, free of charge, as soon as reasonably practicable after being filed.
Product Information/ReferralFrom the United States and Canada:
800 441-7515 (toll-free)From other locations: 302 774-1000E-mail: [email protected] the Internet: http://www.dupont.com
Printed Reports Available to ShareholdersThe following company reports may be obtained, without charge:
1. 2011 Annual Report to the Securities and Exchange Commission, filed on Form 10-K;2. Proxy Statement for 2012 Annual Meeting of Stockholders; and3. Quarterly reports to the Securities and Exchange Commission, filed on Form 10-Q
Requests should be addressed to:DuPont Corporate Information CenterCRP705-GS38P.O. Box 80705Wilmington, DE 19880-0705or call 302 774-5991E-mail: [email protected]
Services for Shareholders
Online Account AccessRegistered shareholders may access their accounts and obtain online answers to stocktransfer questions by signing up for Internet account access. Call toll-free 888 983-8766(outside the United States and Canada, call 781 575-2724) to obtain by mail a temporarypersonal identification number and information on viewing your account over theInternet.
Dividend Reinvestment PlanAn automatic dividend reinvestment plan is available to all registered shareholders.Common or preferred dividends can be automatically reinvested in DuPont commonstock. Participants also may add cash for the purchase of additional shares. A detailedaccount statement is mailed after each investment. Your account can also be viewed overthe Internet if you have Online Account Access (see above). To enroll in the plan, pleasecontact Computershare (listed above).
Online Delivery of Proxy MaterialsStockholders may request their proxy materials electronically in 2012 by visiting http://
enroll.icsdelivery.com/dd.
Direct Deposit of DividendsRegistered shareholders who would like their dividends directly deposited in a U.S. bankaccount should contact Computershare (listed above).
Exhibit 10.2
SUPPLEMENTAL RETIREMENT INCOME
PLAN
Originally Adopted - August 21, 1978
Last Amended - December 18, 1996
E. I. duPont de Nemours and Company
SUPPLEMENTAL RETIREMENT INCOME PLAN
I. PURPOSE
The purpose of this Plan is to supplement an employee's pension payable under the Company's Pension and Retirement Plan toprovide Monthly Retirement Income which represents an appropriate percentage of Average Total Monthly Pay. Supplementalretirement income generally will be provided under the Plan to those eligible employees for whom awards under the VariableCompensation Plan, the Incentive Compensation Plan or the former Dividend Unit Plan of the Company are a significant part ofAverage Total Monthly Pay.
II. ELIGIBILITY
An employee whose effective date of retirement is after August 1, 1977 will participate in this Plan
1. to the extent of the benefits provided herein if he is eligible for an unreduced monthly pension payable underSection IV (the Normal, Incapability, Early or Optional Retirement provisions) of the Company's Pension andRetirement Plan; or
2. to the extent deemed appropriate by the Compensation and Benefits Committee or its delegate if he is eligiblefor a reduced monthly pension payable under Section IV (the Early or Optional Retirement provisions) of theCompany's Pension and Retirement Plan.
III. AMOUNT OF SUPPLEMENTAL RETIREMENT INCOME
A. The amount of monthly supplemental retirement income payable to an employee will be the excess, if any, of (1) theemployee's Monthly Retirement Income, as determined under paragraph B of this Section, over (2) the employee'smonthly pension under the Company's Pension and Retirement Plan, as determined under paragraph C of thisSection.
B. The amount of an employee's Monthly Retirement Income will be Average Total Monthly Pay multiplied by theapplicable percentage factor from the following table, minus 50% of Primary Social Security Benefit.
2
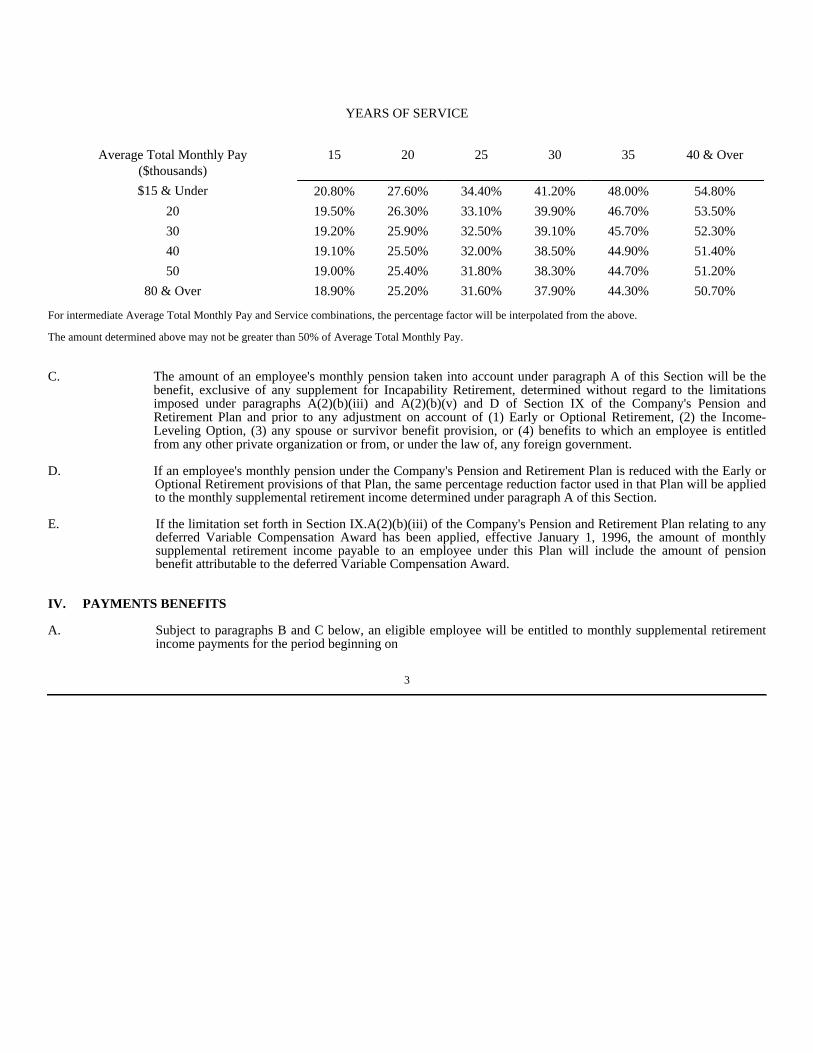
YEARS OF SERVICE
Average Total Monthly Pay($thousands)
15 20 25 30 35 40 & Over
$15 & Under 20.80% 27.60% 34.40% 41.20% 48.00% 54.80%
20 19.50% 26.30% 33.10% 39.90% 46.70% 53.50%
30 19.20% 25.90% 32.50% 39.10% 45.70% 52.30%
40 19.10% 25.50% 32.00% 38.50% 44.90% 51.40%
50 19.00% 25.40% 31.80% 38.30% 44.70% 51.20%
80 & Over 18.90% 25.20% 31.60% 37.90% 44.30% 50.70%
For intermediate Average Total Monthly Pay and Service combinations, the percentage factor will be interpolated from the above.
The amount determined above may not be greater than 50% of Average Total Monthly Pay.
C. The amount of an employee's monthly pension taken into account under paragraph A of this Section will be thebenefit, exclusive of any supplement for Incapability Retirement, determined without regard to the limitationsimposed under paragraphs A(2)(b)(iii) and A(2)(b)(v) and D of Section IX of the Company's Pension andRetirement Plan and prior to any adjustment on account of (1) Early or Optional Retirement, (2) the Income-Leveling Option, (3) any spouse or survivor benefit provision, or (4) benefits to which an employee is entitledfrom any other private organization or from, or under the law of, any foreign government.
D. If an employee's monthly pension under the Company's Pension and Retirement Plan is reduced with the Early orOptional Retirement provisions of that Plan, the same percentage reduction factor used in that Plan will be appliedto the monthly supplemental retirement income determined under paragraph A of this Section.
E. If the limitation set forth in Section IX.A(2)(b)(iii) of the Company's Pension and Retirement Plan relating to anydeferred Variable Compensation Award has been applied, effective January 1, 1996, the amount of monthlysupplemental retirement income payable to an employee under this Plan will include the amount of pensionbenefit attributable to the deferred Variable Compensation Award.
IV. PAYMENTS BENEFITS
A. Subject to paragraphs B and C below, an eligible employee will be entitled to monthly supplemental retirementincome payments for the period beginning on
3
the day after he retires under the Company's Pension and Retirement Plan and ending on the last day of the month in which he dies.
B. If the monthly supplemental retirement income is or becomes less than or equal to the minimum monthly paymentamount fixed by the Board of Benefits and Pensions, the actuarial equivalent of all such remaining monthly paymentsshall be paid in a lump sum.
C. An eligible employee may irrevocably elect under rules prescribed by the Board of Benefits and Pensions to receivethe actuarial equivalent of all or part of the monthly supplemental retirement income in a lump sum.
D. Except as otherwise provided, benefits under this Plan are determined based on the Plan in effect at the time ofretirement.
V. DEFINITIONS AND GENERAL CONDITIONS
A. Definitions
1. All terms used in this Plan which are defined in the Company's Pension and Retirement Plan will have thesame meaning for purposes of this Plan except as expressly provided herein.
2. (a) The term "Average Total Monthly Pay" means the higher of
(i) total pay for the thirty-six consecutive calendar months for which the employee's pay is the highest, divided by 36; or
(ii) average pay per month based on total pay over a number of calendar years, and a fraction of total pay for a calendar year if necessary,sufficient to obtain an aggregate amount of service equivalent to three full years. Such calendar years shall be selected beginning withthe calendar year in which average pay per month was the highest and taking in turn calendar years of successively lower average payper month. A fraction of total pay for a calendar year shall be by multiplying average pay per month for that year by the number ofmonths needed to yield an aggregate amount of service equivalent to three full years.
Only pay for the 120 calendar months up to and including the calendar month in which the employee retires under the Company'sPens1on Plan will be taken into account in computing Average Total Monthly Pay.
(b) The term "pay" includes variable pay and awards under the VariableCompensation Plan, the Incentive Compensation Plan and former
4
Dividend Unit Plan of the Company or similar plans of any of its affiliated companies, which are not forfeited, but does not include (i)allowances in connection with transfer of employment or termination of employment and other special payments, or (ii) awards, payunder a gain sharing program or payments under the Special Compensation Plan or Stock Option Plan of the Company or similarplans of the Company or any of its affiliated companies.
(c) The value of an award under the Company's Variable Compensation Plan, the Incentive Compensation Plan or former Dividend Unit Planfor any calendar year will be prorated over the length of an employee's service for that year which is used in computing his benefitunder this Plan to the extent the award is attributable to such service. The value of an award under the Variable Compensation Plan, orthe Incentive Compensation Plan will be the total award value approved by the Compensation and Benefits Committee. The value ofan award under the former Dividend Unit Plan will be the value used by the Compensation and Benefits Committee in determining thenumber of dividend units awarded to an employee.
(d) Where a retired employee is granted an award under the Variable Compensation Plan, the Incentive Compensation Plan or the formerDividend Unit Plan for the calendar year in which his retirement is effective, his Average Total Monthly Pay will be recomputed and,if applicable, his monthly supplemental retirement income will be increased beginning the month following that in which such awardis granted.
3. The term "Service" means the length, in years and fractions of a year, of an employee's period of "continuousservice" as determined under the Company's Continuity of Service Rules for computing the amount of a pensionand, to the extend prescribed in such Rules, recognition will be given for service which the employee hasrendered to an affiliated company or to a company whose assets have been acquired in whole or in part, by theCompany.
4. The term "Company" means E. I. du Pont de Nemours and Company, any wholly owned subsidiary or partthereof and any partnership or joint venture in which E. I. du Pont de Nemours and Company is joined whichadopts this Plan with the approval of the Company, or such person or persons as the Company may designate.
B. Payments Rounded to Next Higher Full Dollar
Each monthly payment which is computed in accordance with this Plan will, if not in whole dollars, be increased to the next higherwhole dollar. Such rounding shall be made after applying any applicable reduction factors.
5
C. Nonassignment
No assignment of the rights and interests under this Plan will be permitted or recognized under any circumstances, nor shall suchrights and interests be subject to attachment or other legal processes for debt.
D. Forfeiture of Benefits
If an employee forfeits all or part of an award under the Company's Variable Compensation Plan, the Incentive Compensation Plan orformer Dividend Unit Plan, all rights and interests of the employee under this Plan will be forfeited.
E. Administration
1. The administration of this Plan is vested in the Board of Benefits and Pensions appointed by the Company,except that the Compensation and Benefits Committee shall determine the discount rate to be used in calculatingthe lump sum payment described in Section N. The Board shall have the discretionary right to determineeligibility for benefits hereunder and to construe the terms and conditions of this Plan. The Board may adopt,subject to the approval of the Compensation and Benefits Committee, or its delegate, such rules as it may deemnecessary for the proper administration of the Plan, and its decision in all matters involving the interpretationand application of the Plan shall be final, conclusive and binding.
2. All expenses and costs in connection with the operation of this Plan shall be borne by the Company out of itsgeneral assets.
F. Amendment
The Company reserves the right to change this Plan in its discretion by action of the Compensation and Benefits Committee or itsdelegate, or to discontinue this Plan in its discretion by action of the Board of Directors, provided that the right to an amount payableto a person for any calendar year, calculated in accordance with the terms of this Plan at the time of benefit commencement, will notbe reduced or eliminated by an amendment or termination of this Plan.
6
Exhibit 10.5
STOCK PERFORMANCE PLAN
I. PURPOSES
The purposes of this Stock Performance Plan (the "Plan") are: (a) to provide greater incentive for employees who are or will be primarily responsible for thegrowth and success of the business to exert their best efforts on behalf of E. I. du Pont de Nemours and Company ("the Company"); and (b) to further theidentity of interests of such employees with those of the Company's stockholders generally by encouraging them to acquire stock ownership in the Company.
II. FORM OF GRANTS
1 Grants under this Plan may be made in the form of stock options, stock options accompanied by stock appreciation rights, restricted shares or units("restricted stock") or a combination of any of these forms and may be made in replacement of or as alternatives to salary or grants under any otherplan or program of a plan company.
2 Stock options to purchase shares of the Company's common stock granted under this Plan may be either incentive, performance or other stock optionsqualified under the Internal Revenue Code as in effect from time to time ("qualified stock options") or stock options that are not qualified under theInternal Revenue Code ("nonqualified stock options"), or a combination of qualified and nonqualified stock options.
3 Stock appreciation rights may be granted by the Company under this Plan upon such terms and conditions as the Compensation Committee maydetermine. Such rights may be granted only when they accompany the concurrent grant of stock options. Each stock appreciation right shall give thegrantee the right to receive a payment equal to the excess of the fair market value of a share of the Company's common stock on the date when suchright is exercised over the option price provided for in the accompanying stock option. Such rights may be exercised only if the grantee exercises theaccompanying stock option by purchasing one share of the Company's common stock for each stock appreciation right exercised. The number ofshares subject to exercise under an accompanying stock option shall be automatically reduced by one share for each stock appreciation right exercised.
4 Restricted stock granted under this Plan shall be subject to restriction, such as forfeiture and a minimum vesting period. A grantee of restricted sharesshall generally have all incidents of ownership in the restricted shares, including the right to dividends and to vote (unless otherwise restricted).Restricted shares may be evidenced by book-entry registration, a stock certificate registered in the grantee's name but held in the Company's custodyor issuance of an appropriate legended stock certificate, as determined by the Compensation Committee.
III. LIMITATIONS ON GRANTS
1 The aggregate number of shares of the Company's stock which may be made subject to stock options granted under this Plan shall not exceed72,000,000, or 5% of such number for any optionee, during any five consecutive years, of which only 12,000,000 shares may be subject to restrictedstock grants. The number of stock appreciation rights which may be granted to any optionee under this Plan shall not exceed 50% of the number ofshares made subject to an accompanying stock option.
2 If any stock option or restricted stock (without benefit of dividends) granted under this Plan shall terminate or expire for any reason without havingbeen exercised or vested in full, the shares not acquired under such grant shall become available again for further grants under this Plan; providedalso, that shares withheld by or tendered to the Company as payment fo exercise price or other consideration or satisfaction of withholding taxes shallbecome available again for further grants to employees who are not executive officers; provided, however, that the shares which become so availablefor further grants shall not include any shares as to which a stock option has been reduced by reason of receiving payments under accompanying stockappreciation rights. The limitations set forth above shall be subject to adjustment as provided in Article XII hereof.
IV. ADMINISTRATION
1 Except as otherwise specifically provided, the Plan shall be administered by the Compensation Committee of the Company's Board of Directors. TheCompensation Committee shall be elected pursuant to the Bylaws of the Company, and the members thereof shall be ineligible for grants while servingon said Committee.
2 The Compensation Committee is authorized, subject to the provisions of the Plan, from time to time to establish such rules and regulations as it deemsappropriate for the proper administration of the Plan, and to make such determinations and take such steps in connection therewith as it deemsnecessary or advisable.
3 The Compensation Committee shall, subject to the provisions of the Plan, determine the time or times when stock options will be granted, whichemployees, if any, shall be granted stock options, the types of stock options to be granted, whether they shall be granted singly or in combination,when they shall be exercisable, the number of shares to be covered by each stock option or options, and the terms and conditions of such stock options;which employees, if any, shall also be granted accompanying stock appreciation rights, the number of stock appreciation rights which shall be grantedto each of them, and the terms and conditions of such rights; and the time or times when restricted stock will be granted, which employees, if any, shallbe granted restricted stock, the number of restricted shares to be granted, the restrictions or conditions on the right to transfer or dispose of such shares,and the terms and conditions of such restricted stock, including the number, amount, and timing of vesting increments.
4The decision of the Compensation Committee with respect to any questions arising as to interpretation of this Plan, including the severability of anyand all of the provisions thereof, shall be final, conclusive and binding.
5 The Company's Board of Directors may elect a Special Stock Performance Committee pursuant to the Bylaws of the Company which shall have andmay exercise all the rights, powers and duties of the Compensation Committee specified in this Plan for purposes of making grants for significantachievements by employees who are not directors or executive officers of the Company. The Special Stock Performance Committee may also beauthorized by the Compensation Committee to assume certain administrative responsibilities under this Plan.
V. ELIGIBILITY FOR GRANTS
1 Grants under this Plan may be made to employees (including those who are directors or executive officers of the Company) as determined by theCompensation Committee (or Board of Directors, if the grantee is a director of the Company). In determining those employees to whom grants are tobe made, the Compensation Committee (or Board of Directors, if the grantee is a director of the Company) may take into consideration present andpotential contributions to the Company's success by such employees, and any other factors which the Compensation Committee (or Board of Directors,if the grantee is a director of the Company) may deem relevant in connection with accomplishing the purposes of the Plan.
2 The term "employee” may include an employee of a corporation or other business entity in which the Company shall directly or indirectly own fiftypercent or more of the outstanding voting stock or other ownership interest, but shall exclude any director who is not also an officer or a full-timeemployee of a plan company. The term "plan company" as used in this Plan shall mean a business entity whose employees are eligible for grants underthis Plan. The term "grantee" as used in this Plan means an employee to whom a grant has been made under this Plan or, where appropriate, his or hersuccessor in interest upon death.
VI. RECOMMENDATIONS AND GRANTS
1 Recommendations for grants to members of the Board of Directors shall be made by the Compensation Committee. Recommendations for grants toemployees who are not members of the Board of Directors shall be made to the Compensation Committee by the Office of the Chief Executive.
2 Any grant to a director shall be made in the sole discretion of the Board of Directors, a majority of whose members taking final action on any suchgrant shall be ineligible for grants under Article V. Any grant to an employee who is not a member of the Board of Directors shall be made by theCompensation Committee which shall take final action on any such grant.
3 Grants may be made at any time under this Plan and in any of the forms or combinations thereof provided in Article II hereof. A grantee may receiveand may hold more than one grant under this Plan.
4 The date on which a grant shall be deemed to have been made under this Plan shall be the date of the Compensation Committee (or Board of Directors,if the grantee is a director) authorization of the grant or such later date as may be determined by the Compensation Committee (or Board of Directors,if the grantee is a director) at the time the grant is authorized. Each grantee shall be advised in writing by the Company of a grant and the terms andconditions thereof, which terms and conditions, as the Compensation Committee from time to time shall determine, shall not be inconsistent with theprovisions of this Plan.
VII. OPTION PRICE
The price per share of the Company's common stock which may be purchased upon exercise of a stock option granted under this Plan shall be determined bythe Compensation Committee, but shall in no event be less than the fair market value of such share on the date the stock option is granted, and in no event lessthan the par value thereof. The price so determined also shall be applicable to any accompanying stock appreciation right. For purposes of this Plan, fairmarket value shall be the closing price of the Company's common stock as reported on the "NYSE-Composite Transactions Tape" on the date of grant of astock option or the date of exercise of a stock option or stock appreciation right, or if no sales of such stock were reported on said Tape on such date, theclosing price of such stock on the next preceding day on which sales were reported on said Tape. Such price shall be subject to adjustment as provided inArticle XII hereof.
VIII. OPTION TERM
The term of each stock option and each stock appreciation right granted under this Plan shall be for such period as the Compensation Committee shalldetermine, but not for more than ten years from date of grant.
IX. EXERCISE OF OPTIONS
1 Subject to the provisions of this Plan, each stock option and each stock appreciation right granted hereunder shall be exercisable on such date or datesand during such period and for such number of shares or stock appreciation rights as the Compensation Committee may determine. However, in noevent shall a stock option or stock appreciation right be exercisable prior to six months from date of grant. The Compensation Committee may fixfrom time to time a minimum number of shares which must be purchased at the time a stock option is exercised.
2 A grantee electing to exercise a stock option shall at the time of exercise pay the Company the full purchase price of the shares he or she has elected topurchase. Payment of the purchase price shall be made in cash, the Company's common stock (valued at fair market value on the date of exercise), ora combination thereof, as the Compensation Committee may determine from time to time. A grantee electing to exercise a stock appreciation rightgranted under this Plan shall so notify the Company at the same time he or she elects to exercise an accompanying stock option. Payment by theCompany for such stock appreciation right may be in cash, common stock (valued at fair market value on date of exercise), or a combination thereof,as the Compensation Committee may determine from time to time, but no fractional share of common stock shall be delivered. With respect to sharesof the Company's common stock to be delivered upon exercise of a stock option or a stock appreciation right, the Compensation Committee shallperiodically determine whether, and to what extent, such stock shall be in the form of new common stock issued for such purposes, or common stockacquired by the Company.
3 Notwithstanding any other provision of this Plan, when the fair market value of a share of the Company's common stock on the date a grantee elects toexercise a stock option is less than such amount per share as may be determined by the Compensation Committee from time to time, the Companymay at its election pay the grantee in cash for each share he or she elected to purchase an amount equal to the excess of such fair market value over theoption price provided for in the stock option. The Compensation Committee shall periodically determine whether the Company shall make such cashpayment upon exercise of a stock option. When the Company makes a payment to the grantee under this paragraph 3 of Article IX, it shall not requirethe grantee to tender the full purchase price of the shares he or she has elected to purchase, the Company's obligation to issue or deliver such sharesshall be null and void, and the right to purchase such number of shares subject to option shall be terminated. Such payment by the Company shall bedeemed to be an exercise of a stock option and the purchase of shares thereunder for purposes of paragraph 3 of Article II and Article III.
X. NONTRANSFERABILITY OF GRANTS
During a grantee's lifetime no stock option or stock appreciation right granted under this Plan shall be transferable, and stock options and stock appreciationrights may be exercised only by the grantee, except as may otherwise be provided in rules established by the Compensation Committee to permit transfers orto authorize a third party to act on behalf of the grantee with respect to any stock options or stock appreciation rights.
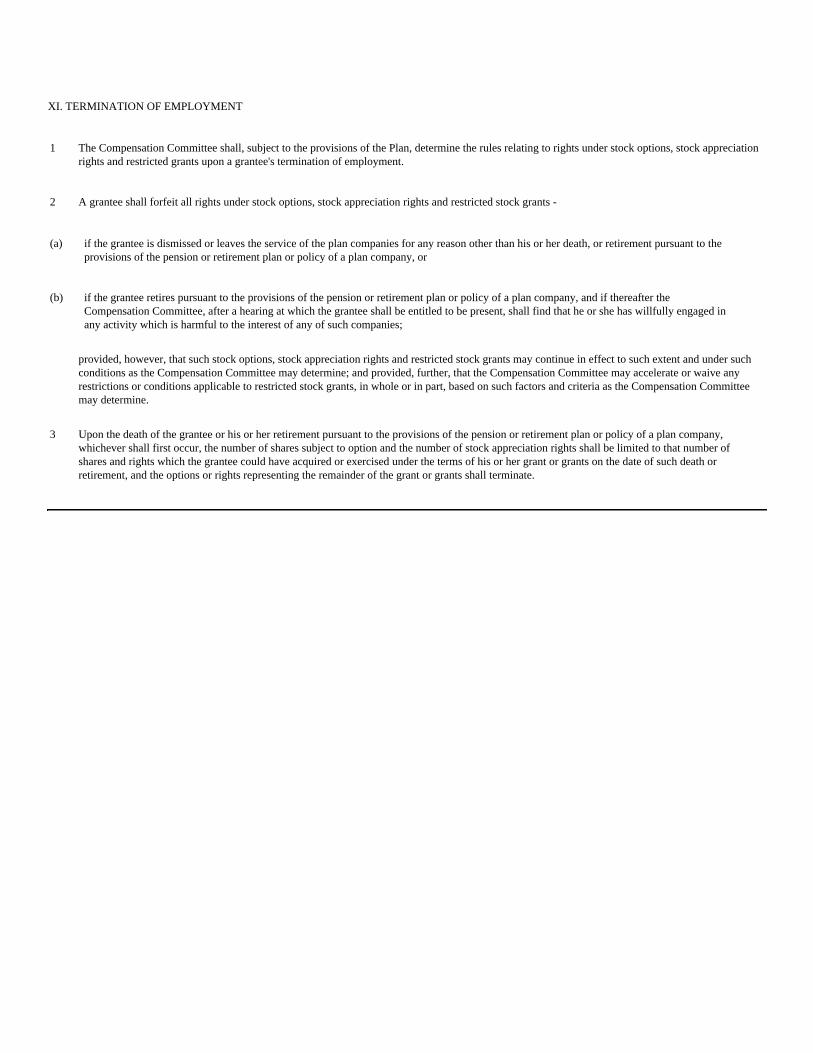
XI. TERMINATION OF EMPLOYMENT
1 The Compensation Committee shall, subject to the provisions of the Plan, determine the rules relating to rights under stock options, stock appreciationrights and restricted grants upon a grantee's termination of employment.
2 A grantee shall forfeit all rights under stock options, stock appreciation rights and restricted stock grants -
(a) if the grantee is dismissed or leaves the service of the plan companies for any reason other than his or her death, or retirement pursuant to theprovisions of the pension or retirement plan or policy of a plan company, or
(b) if the grantee retires pursuant to the provisions of the pension or retirement plan or policy of a plan company, and if thereafter theCompensation Committee, after a hearing at which the grantee shall be entitled to be present, shall find that he or she has willfully engaged inany activity which is harmful to the interest of any of such companies;
provided, however, that such stock options, stock appreciation rights and restricted stock grants may continue in effect to such extent and under suchconditions as the Compensation Committee may determine; and provided, further, that the Compensation Committee may accelerate or waive anyrestrictions or conditions applicable to restricted stock grants, in whole or in part, based on such factors and criteria as the Compensation Committeemay determine.
3 Upon the death of the grantee or his or her retirement pursuant to the provisions of the pension or retirement plan or policy of a plan company,whichever shall first occur, the number of shares subject to option and the number of stock appreciation rights shall be limited to that number ofshares and rights which the grantee could have acquired or exercised under the terms of his or her grant or grants on the date of such death orretirement, and the options or rights representing the remainder of the grant or grants shall terminate.
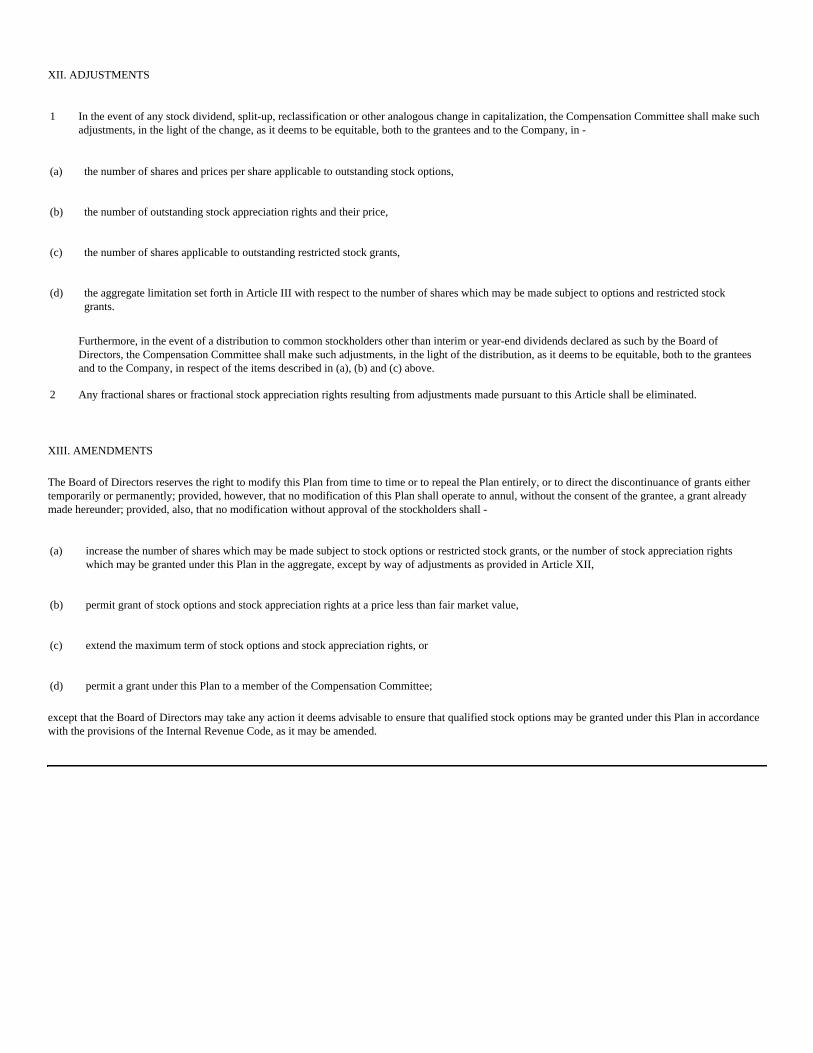
XII. ADJUSTMENTS
1 In the event of any stock dividend, split-up, reclassification or other analogous change in capitalization, the Compensation Committee shall make suchadjustments, in the light of the change, as it deems to be equitable, both to the grantees and to the Company, in -
(a) the number of shares and prices per share applicable to outstanding stock options,
(b) the number of outstanding stock appreciation rights and their price,
(c) the number of shares applicable to outstanding restricted stock grants,
(d) the aggregate limitation set forth in Article III with respect to the number of shares which may be made subject to options and restricted stockgrants.
Furthermore, in the event of a distribution to common stockholders other than interim or year-end dividends declared as such by the Board ofDirectors, the Compensation Committee shall make such adjustments, in the light of the distribution, as it deems to be equitable, both to the granteesand to the Company, in respect of the items described in (a), (b) and (c) above.
2 Any fractional shares or fractional stock appreciation rights resulting from adjustments made pursuant to this Article shall be eliminated.
XIII. AMENDMENTS
The Board of Directors reserves the right to modify this Plan from time to time or to repeal the Plan entirely, or to direct the discontinuance of grants eithertemporarily or permanently; provided, however, that no modification of this Plan shall operate to annul, without the consent of the grantee, a grant alreadymade hereunder; provided, also, that no modification without approval of the stockholders shall -
(a) increase the number of shares which may be made subject to stock options or restricted stock grants, or the number of stock appreciation rightswhich may be granted under this Plan in the aggregate, except by way of adjustments as provided in Article XII,
(b) permit grant of stock options and stock appreciation rights at a price less than fair market value,
(c) extend the maximum term of stock options and stock appreciation rights, or
(d) permit a grant under this Plan to a member of the Compensation Committee;
except that the Board of Directors may take any action it deems advisable to ensure that qualified stock options may be granted under this Plan in accordancewith the provisions of the Internal Revenue Code, as it may be amended.

XIV. MISCELLANEOUS
1 The Compensation Committee may adopt such modifications, procedures, and subplans as may be necessary or desirable to comply with provisions ofthe laws of countries other than the United States in which the Company or a plan company may operate to assure the viability of the benefits ofgrants made to employees in such countries and to meet the purposes of the Plan.
2 Grantees may use shares of the Company's common stock to satisfy withholding taxes relating to grants under this Plan to the extent provided in termsand conditions established by the Compensation Committee.
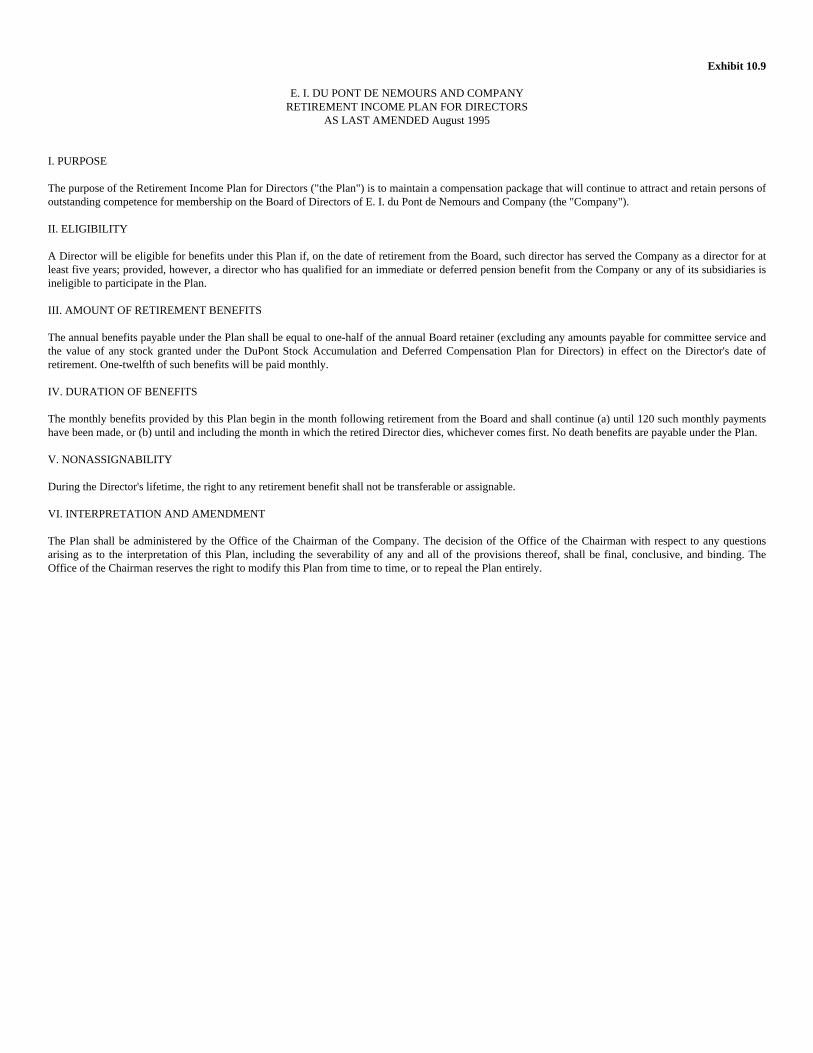
Exhibit 10.9
E. I. DU PONT DE NEMOURS AND COMPANYRETIREMENT INCOME PLAN FOR DIRECTORS
AS LAST AMENDED August 1995
I. PURPOSE
The purpose of the Retirement Income Plan for Directors ("the Plan") is to maintain a compensation package that will continue to attract and retain persons ofoutstanding competence for membership on the Board of Directors of E. I. du Pont de Nemours and Company (the "Company").
II. ELIGIBILITY
A Director will be eligible for benefits under this Plan if, on the date of retirement from the Board, such director has served the Company as a director for atleast five years; provided, however, a director who has qualified for an immediate or deferred pension benefit from the Company or any of its subsidiaries isineligible to participate in the Plan.
III. AMOUNT OF RETIREMENT BENEFITS
The annual benefits payable under the Plan shall be equal to one-half of the annual Board retainer (excluding any amounts payable for committee service andthe value of any stock granted under the DuPont Stock Accumulation and Deferred Compensation Plan for Directors) in effect on the Director's date ofretirement. One-twelfth of such benefits will be paid monthly.
IV. DURATION OF BENEFITS
The monthly benefits provided by this Plan begin in the month following retirement from the Board and shall continue (a) until 120 such monthly paymentshave been made, or (b) until and including the month in which the retired Director dies, whichever comes first. No death benefits are payable under the Plan.
V. NONASSIGNABILITY
During the Director's lifetime, the right to any retirement benefit shall not be transferable or assignable.
VI. INTERPRETATION AND AMENDMENT
The Plan shall be administered by the Office of the Chairman of the Company. The decision of the Office of the Chairman with respect to any questionsarising as to the interpretation of this Plan, including the severability of any and all of the provisions thereof, shall be final, conclusive, and binding. TheOffice of the Chairman reserves the right to modify this Plan from time to time, or to repeal the Plan entirely.
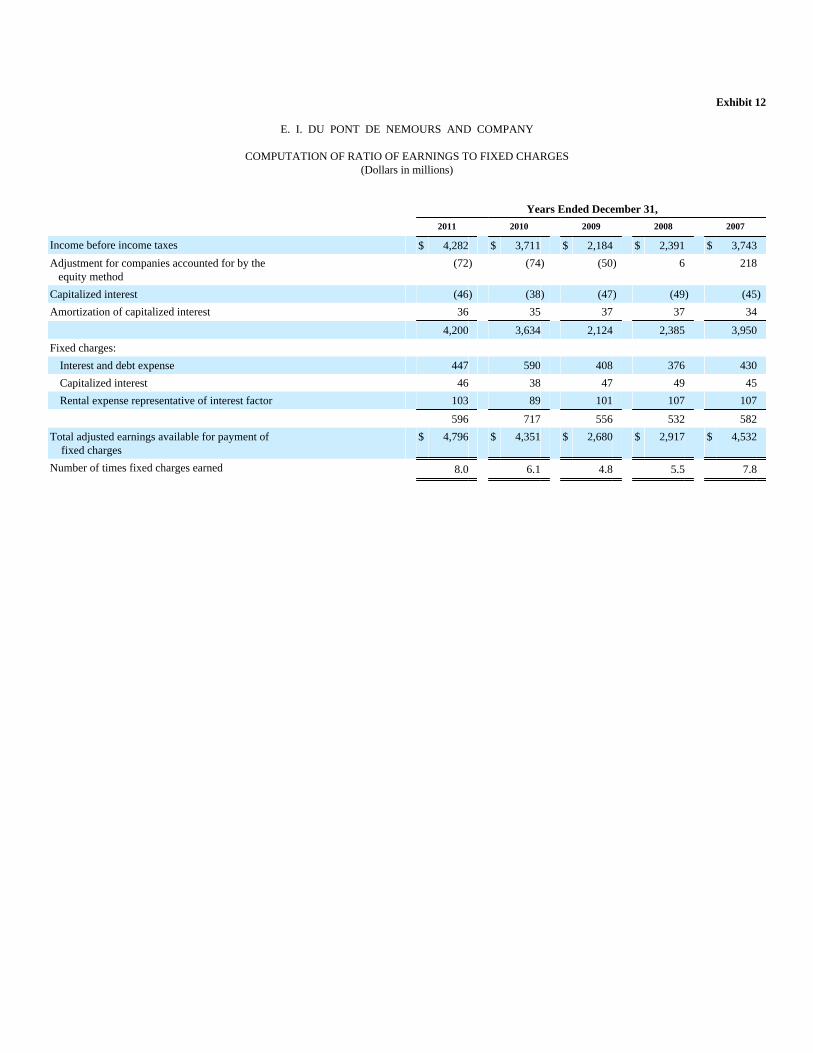
Exhibit 12
E. I. DU PONT DE NEMOURS AND COMPANY
COMPUTATION OF RATIO OF EARNINGS TO FIXED CHARGES(Dollars in millions)
Years Ended December 31,
2011 2010 2009 2008 2007
Income before income taxes $ 4,282 $ 3,711 $ 2,184 $ 2,391 $ 3,743
Adjustment for companies accounted for by the equity method
(72) (74) (50) 6 218
Capitalized interest (46) (38) (47) (49) (45)
Amortization of capitalized interest 36 35 37 37 34
4,200 3,634 2,124 2,385 3,950
Fixed charges:
Interest and debt expense 447 590 408 376 430
Capitalized interest 46 38 47 49 45
Rental expense representative of interest factor 103 89 101 107 107
596 717 556 532 582
Total adjusted earnings available for payment of fixed charges
$ 4,796 $ 4,351 $ 2,680 $ 2,917 $ 4,532
Number of times fixed charges earned 8.0 6.1 4.8 5.5 7.8
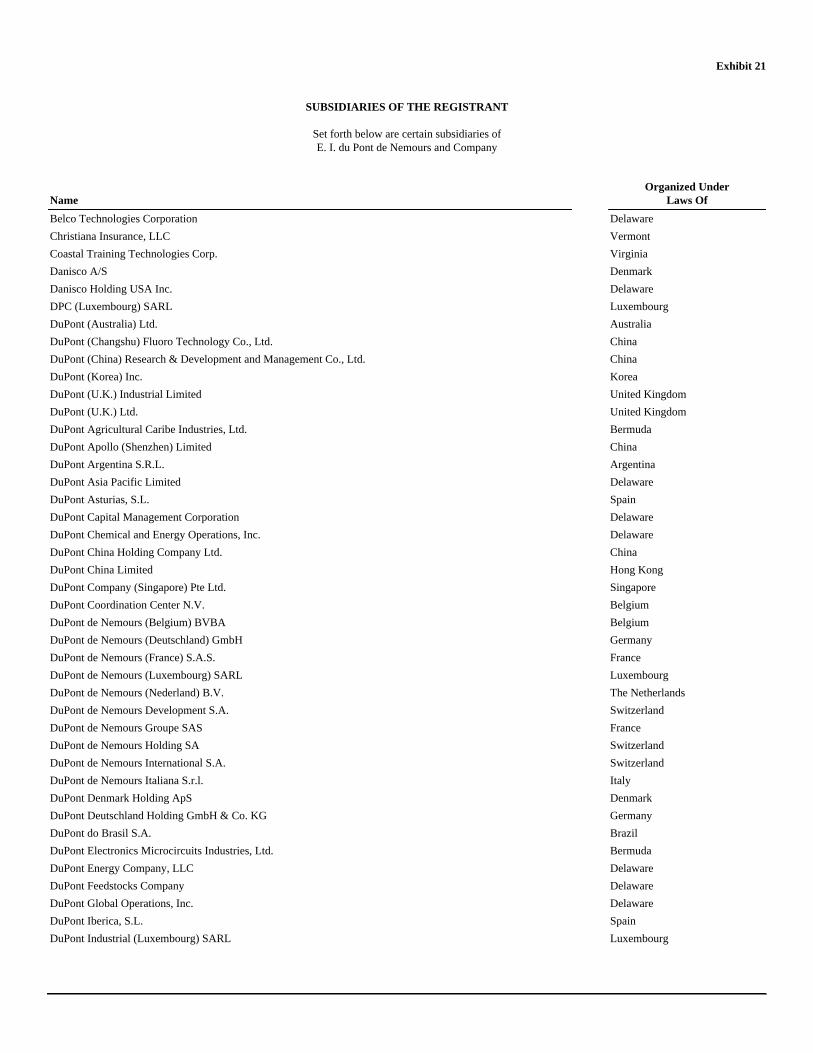
Exhibit 21
SUBSIDIARIES OF THE REGISTRANT
Set forth below are certain subsidiaries ofE. I. du Pont de Nemours and Company
Name Organized Under
Laws Of
Belco Technologies Corporation Delaware
Christiana Insurance, LLC Vermont
Coastal Training Technologies Corp. Virginia
Danisco A/S Denmark
Danisco Holding USA Inc. Delaware
DPC (Luxembourg) SARL Luxembourg
DuPont (Australia) Ltd. Australia
DuPont (Changshu) Fluoro Technology Co., Ltd. China
DuPont (China) Research & Development and Management Co., Ltd. China
DuPont (Korea) Inc. Korea
DuPont (U.K.) Industrial Limited United Kingdom
DuPont (U.K.) Ltd. United Kingdom
DuPont Agricultural Caribe Industries, Ltd. Bermuda
DuPont Apollo (Shenzhen) Limited China
DuPont Argentina S.R.L. Argentina
DuPont Asia Pacific Limited Delaware
DuPont Asturias, S.L. Spain
DuPont Capital Management Corporation Delaware
DuPont Chemical and Energy Operations, Inc. Delaware
DuPont China Holding Company Ltd. China
DuPont China Limited Hong Kong
DuPont Company (Singapore) Pte Ltd. Singapore
DuPont Coordination Center N.V. Belgium
DuPont de Nemours (Belgium) BVBA Belgium
DuPont de Nemours (Deutschland) GmbH Germany
DuPont de Nemours (France) S.A.S. France
DuPont de Nemours (Luxembourg) SARL Luxembourg
DuPont de Nemours (Nederland) B.V. The Netherlands
DuPont de Nemours Development S.A. Switzerland
DuPont de Nemours Groupe SAS France
DuPont de Nemours Holding SA Switzerland
DuPont de Nemours International S.A. Switzerland
DuPont de Nemours Italiana S.r.l. Italy
DuPont Denmark Holding ApS Denmark
DuPont Deutschland Holding GmbH & Co. KG Germany
DuPont do Brasil S.A. Brazil
DuPont Electronics Microcircuits Industries, Ltd. Bermuda
DuPont Energy Company, LLC Delaware
DuPont Feedstocks Company Delaware
DuPont Global Operations, Inc. Delaware
DuPont Iberica, S.L. Spain
DuPont Industrial (Luxembourg) SARL Luxembourg
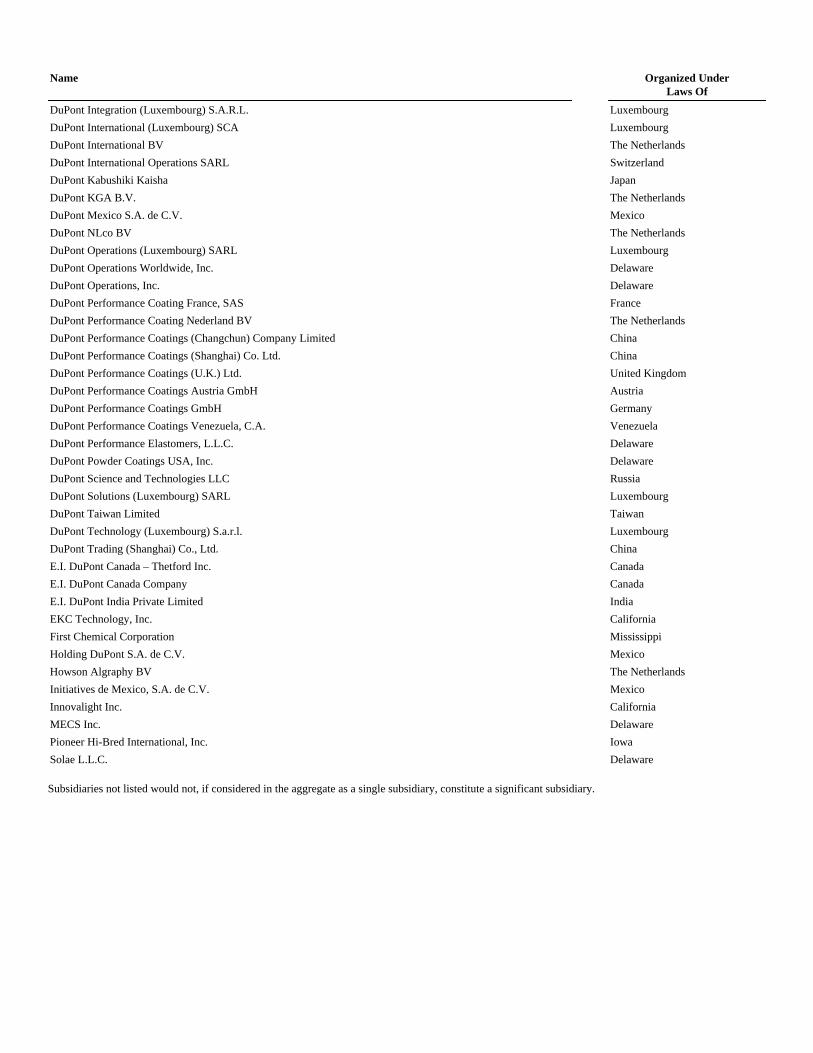
Name Organized UnderLaws Of
DuPont Integration (Luxembourg) S.A.R.L. Luxembourg
DuPont International (Luxembourg) SCA Luxembourg
DuPont International BV The Netherlands
DuPont International Operations SARL Switzerland
DuPont Kabushiki Kaisha Japan
DuPont KGA B.V. The Netherlands
DuPont Mexico S.A. de C.V. Mexico
DuPont NLco BV The Netherlands
DuPont Operations (Luxembourg) SARL Luxembourg
DuPont Operations Worldwide, Inc. Delaware
DuPont Operations, Inc. Delaware
DuPont Performance Coating France, SAS France
DuPont Performance Coating Nederland BV The Netherlands
DuPont Performance Coatings (Changchun) Company Limited China
DuPont Performance Coatings (Shanghai) Co. Ltd. China
DuPont Performance Coatings (U.K.) Ltd. United Kingdom
DuPont Performance Coatings Austria GmbH Austria
DuPont Performance Coatings GmbH Germany
DuPont Performance Coatings Venezuela, C.A. Venezuela
DuPont Performance Elastomers, L.L.C. Delaware
DuPont Powder Coatings USA, Inc. Delaware
DuPont Science and Technologies LLC Russia
DuPont Solutions (Luxembourg) SARL Luxembourg
DuPont Taiwan Limited Taiwan
DuPont Technology (Luxembourg) S.a.r.l. Luxembourg
DuPont Trading (Shanghai) Co., Ltd. China
E.I. DuPont Canada – Thetford Inc. Canada
E.I. DuPont Canada Company Canada
E.I. DuPont India Private Limited India
EKC Technology, Inc. California
First Chemical Corporation Mississippi
Holding DuPont S.A. de C.V. Mexico
Howson Algraphy BV The Netherlands
Initiatives de Mexico, S.A. de C.V. Mexico
Innovalight Inc. California
MECS Inc. Delaware
Pioneer Hi-Bred International, Inc. Iowa
Solae L.L.C. Delaware
Subsidiaries not listed would not, if considered in the aggregate as a single subsidiary, constitute a significant subsidiary.
Exhibit 23
CONSENT OF INDEPENDENT REGISTERED PUBLIC ACCOUNTING FIRM
We hereby consent to the incorporation by reference in the Registration Statements on Form S-3 (No. 333-173217); and Form S-8 (Nos. 033-51817,333-85599, 333-106527, 333-106585, 333-114330, 333-118042, 333-129494, 333-129495, 333-129496, 333-144083, 333-145038, 333-147452, 333-150605,333-164987, 333-164988 and 333-164989) of E. I. du Pont de Nemours and Company of our report dated February 8, 2012 relating to the financialstatements, financial statement schedule and the effectiveness of internal control over financial reporting, which appears in this Form 10-K.
/s/ PricewaterhouseCoopers LLP
PricewaterhouseCoopers LLPPhiladelphia, PennsylvaniaFebruary 8, 2012
Exhibit 31.1
CERTIFICATIONS
I, Ellen J. Kullman, certify that:
1. I have reviewed this report on Form 10-K for the period ended December 31, 2011 of E. I. du Pont de Nemours and Company;
2. Based on my knowledge, this report does not contain any untrue statement of a material fact or omit to state a material fact necessary to make thestatements made, in light of the circumstances under which such statements were made, not misleading with respect to the period covered by thisreport;
3. Based on my knowledge, the financial statements, and other financial information included in this report, fairly present in all material respects thefinancial condition, results of operations and cash flows of the registrant as of, and for, the periods presented in this report;
4. The registrant's other certifying officer and I are responsible for establishing and maintaining disclosure controls and procedures (as defined inExchange Act Rules 13a-15(e) and 15d-15(e)) and internal control over financial reporting (as defined in Exchange Act Rules 13a-15(f) and15d-15(f)) for the registrant and have:
a) Designed such disclosure controls and procedures, or caused such disclosure controls and procedures to be designed under our supervision, toensure that material information relating to the registrant, including its consolidated subsidiaries, is made known to us by others within thoseentities, particularly during the period in which this report is being prepared;
b) Designed such internal control over financial reporting, or caused such internal control over financial reporting to be designed under oursupervision, to provide reasonable assurance regarding the reliability of financial reporting and the preparation of financial statements forexternal purposes in accordance with generally accepted accounting principles;
c) Evaluated the effectiveness of the registrant's disclosure controls and procedures and presented in this report our conclusions about theeffectiveness of the disclosure controls and procedures, as of the end of the period covered by this report based on such evaluation; and
d) Disclosed in this report any change in the registrant's internal control over financial reporting that occurred during the registrant's most recentfiscal quarter (the registrant's fourth fiscal quarter in the case of an annual report) that has materially affected, or is reasonably likely tomaterially affect, the registrant's internal control over financial reporting; and
5. The registrant's other certifying officer and I have disclosed, based on our most recent evaluation of internal control over financial reporting, to theregistrant's auditors and the audit committee of the registrant's board of directors (or persons performing the equivalent functions):
a) All significant deficiencies and material weaknesses in the design or operation of internal control over financial reporting which arereasonably likely to adversely affect the registrant's ability to record, process, summarize and report financial information; and
b) Any fraud, whether or not material, that involves management or other employees who have a significant role in the registrant's internalcontrol over financial reporting.
Date: February 8, 2012
By: /s/ ELLEN J. KULLMAN
Ellen J. Kullman
Chief Executive Officer andChair of the Board
Exhibit 31.2
CERTIFICATIONS
I, Nicholas C. Fanandakis, certify that:
1. I have reviewed this report on Form 10-K for the period ended December 31, 2011 of E. I. du Pont de Nemours and Company;
2. Based on my knowledge, this report does not contain any untrue statement of a material fact or omit to state a material fact necessary to make thestatements made, in light of the circumstances under which such statements were made, not misleading with respect to the period covered by this report;
3. Based on my knowledge, the financial statements, and other financial information included in this report, fairly present in all material respects thefinancial condition, results of operations and cash flows of the registrant as of, and for, the periods presented in this report;
4. The registrant's other certifying officer and I are responsible for establishing and maintaining disclosure controls and procedures (as defined in ExchangeAct Rules 13a-15(e) and 15d-15(e)) and internal control over financial reporting (as defined in Exchange Act Rules 13a-15(f) and 15d-15(f)) for theregistrant and have:
a) Designed such disclosure controls and procedures, or caused such disclosure controls and procedures to be designed under our supervision, toensure that material information relating to the registrant, including its consolidated subsidiaries, is made known to us by others within thoseentities, particularly during the period in which this report is being prepared;
b) Designed such internal control over financial reporting, or caused such internal control over financial reporting to be designed under oursupervision, to provide reasonable assurance regarding the reliability of financial reporting and the preparation of financial statements for externalpurposes in accordance with generally accepted accounting principles;
c) Evaluated the effectiveness of the registrant's disclosure controls and procedures and presented in this report our conclusions about theeffectiveness of the disclosure controls and procedures, as of the end of the period covered by this report based on such evaluation; and
d) Disclosed in this report any change in the registrant's internal control over financial reporting that occurred during the registrant's most recent fiscalquarter (the registrant's fourth fiscal quarter in the case of an annual report) that has materially affected, or is reasonably likely to materially affect,the registrant's internal control over financial reporting; and
5. The registrant's other certifying officer and I have disclosed, based on our most recent evaluation of internal control over financial reporting, to theregistrant's auditors and the audit committee of the registrant's board of directors (or persons performing the equivalent functions):
a) All significant deficiencies and material weaknesses in the design or operation of internal control over financial reporting which are reasonablylikely to adversely affect the registrant's ability to record, process, summarize and report financial information; and
b) Any fraud, whether or not material, that involves management or other employees who have a significant role in the registrant's internal controlover financial reporting.
Date: February 8, 2012
By:
/s/ NICHOLAS C. FANANDAKIS
Nicholas C. Fanandakis
Executive Vice President andChief Financial Officer
Exhibit 32.1
Certification of CEO Pursuant to18 U.S.C. Section 1350,As Adopted Pursuant to
Section 906 of the Sarbanes-Oxley Act of 2002
In connection with the Annual Report of E. I. du Pont de Nemours and Company (the "Company") on Form 10-K for the period ending December 31, 2011 asfiled with the Securities and Exchange Commission on the date hereof (the "Report"), Ellen J. Kullman, as Chief Executive Officer of the Company, herebycertifies, pursuant to 18 U.S.C. Section 1350, as adopted pursuant to Section 906 of the Sarbanes-Oxley Act of 2002, that:
(1) The Report fully complies with the requirements of Section 13(a) of the Securities Exchange Act of 1934; and
(2) The information contained in the Report fairly presents, in all material respects, the financial condition and results of operations of the Company.
/s/ ELLEN J. KULLMAN
Ellen J. Kullman
Chief Executive Officer
February 8, 2012
Exhibit 32.2
Certification of CFO Pursuant to18 U.S.C. Section 1350,As Adopted Pursuant to
Section 906 of the Sarbanes-Oxley Act of 2002
In connection with the Annual Report of E. I. du Pont de Nemours and Company (the "Company") on Form 10-K for the period ending December 31, 2011 asfiled with the Securities and Exchange Commission on the date hereof (the "Report"), Nicholas C. Fanandakis, as Chief Financial Officer of the Company,hereby certifies, pursuant to 18 U.S.C. Section 1350, as adopted pursuant to Section 906 of the Sarbanes-Oxley Act of 2002, that:
(1) The Report fully complies with the requirements of Section 13(a) of the Securities Exchange Act of 1934; and
(2) The information contained in the Report fairly presents, in all material respects, the financial condition and results of operations of the Company.
/s/ NICHOLAS C. FANANDAKIS
Nicholas C. Fanandakis
Chief Financial Officer
February 8, 2012
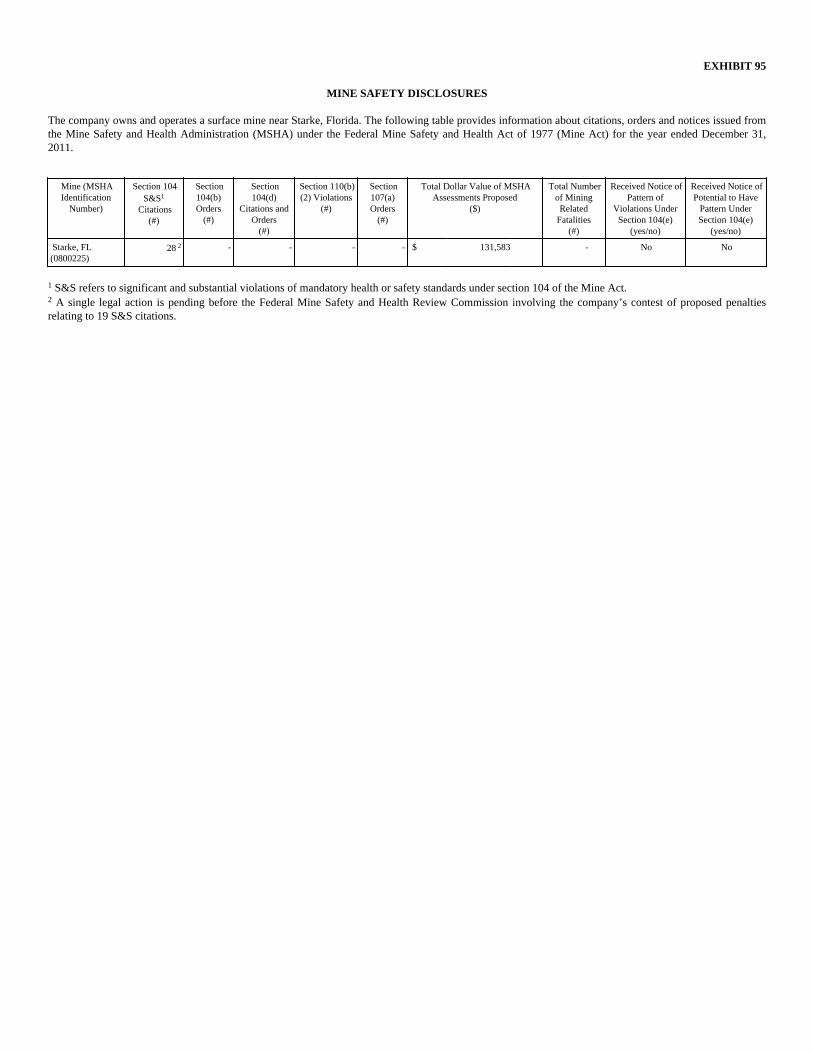
EXHIBIT 95
MINE SAFETY DISCLOSURES
The company owns and operates a surface mine near Starke, Florida. The following table provides information about citations, orders and notices issued fromthe Mine Safety and Health Administration (MSHA) under the Federal Mine Safety and Health Act of 1977 (Mine Act) for the year ended December 31,2011.
Mine (MSHAIdentification
Number)
Section 104S&S1
Citations(#)
Section104(b)Orders
(#)
Section104(d)
Citations andOrders
(#)
Section 110(b)(2) Violations
(#)
Section107(a)Orders
(#)
Total Dollar Value of MSHAAssessments Proposed
($)
Total Numberof MiningRelated
Fatalities(#)
Received Notice ofPattern of
Violations UnderSection 104(e)
(yes/no)
Received Notice ofPotential to Have
Pattern UnderSection 104(e)
(yes/no)
Starke, FL(0800225)
28 2 - - - - $ 131,583 - No No
1 S&S refers to significant and substantial violations of mandatory health or safety standards under section 104 of the Mine Act.2 A single legal action is pending before the Federal Mine Safety and Health Review Commission involving the company’s contest of proposed penaltiesrelating to 19 S&S citations.