10-q filed period 04/30/2011 filed on 06/08/2011...
TRANSCRIPT
SHUFFLE MASTER INC (SHFL)
10-Q Quarterly report pursuant to sections 13 or 15(d)
Filed on 06/08/2011Filed Period 04/30/2011

UNITED STATES
SECURITIES AND EXCHANGE COMMISSIONWashington, D.C. 20549
FORM 10-Q
x QUARTERLY REPORT PURSUANT TO SECTION 13 OR 15(d) OF THE SECURITIES EXCHANGE ACTOF 1934
For the quarterly period ended April 30, 2011OR
o TRANSITION REPORT PURSUANT TO SECTION 13 OR 15(d) OF THE SECURITIES EXCHANGE ACTOF 1934
For the transition period from to
Commission file number: 0-20820
SHUFFLE MASTER, INC.
(Exact name of registrant as specified in its charter)
Minnesota 41-1448495(State or Other Jurisdiction (IRS Employer Identification No.)
of Incorporation or Organization)
1106 Palms Airport Drive, Las Vegas NV 89119(Address of Principal (State) (Zip Code)
Executive Offices) Registrant’s Telephone Number, Including Area Code: (702) 897-7150
Indicate by check mark whether the registrant (1) has filed all reports required to be filed by Section 13 or 15(d) of the Securities Exchange Act of 1934during the preceding 12 months (or for such shorter period that the registrant was required to file such reports), and (2) has been subject to such filingrequirements for the past 90 days. Yes x No o Indicate by check mark whether the registrant has submitted electronically and posted on its corporate Web site, if any, every Interactive Data File required tobe submitted and posted pursuant to Rule 405 of Regulation S-T (§ 232.405 of this chapter) during the preceding 12 months (or for such shorter period thatthe registrant was required to submit and post such files). Yes o No o Indicate by check mark whether the registrant is a large accelerated filer, an accelerated filer, a non-accelerated filer, or a smaller reporting company. See thedefinitions of “large accelerated filer,” “accelerated filer” and “smaller reporting company” in Rule 12b-2 of the Exchange Act. (Check one): Large accelerated filer o Accelerated filer x Non-accelerated filer o
(Do not check if a smaller reporting company)Smaller reporting company o
Indicate by check mark whether the registrant is a shell company (as defined in Rule 12b-2 of the Exchange Act). Yes o No x As of June 2, 2011, there were 54,118,402 shares of our $.01 par value common stock outstanding.
SHUFFLE MASTER, INC.QUARTERLY REPORT ON FORM 10-Q FOR THE QUARTER ENDED APRIL 30, 2011
TABLE OF CONTENTS
Page
PART I•FINANCIAL INFORMATION Item 1. Financial Statements (unaudited): Condensed Consolidated Statements of Operations for the Three and Six Months ended April 30, 2011 and 2010 3 Condensed Consolidated Balance Sheets as of April 30, 2011 and October 31, 2010 4 Condensed Consolidated Statements of Cash Flows for the Six Months ended April 30, 2011 and 2010 5 Notes to Condensed Consolidated Financial Statements 6Item 2. Management’s Discussion and Analysis of Financial Condition and Results of Operations 19Item 3. Quantitative and Qualitative Disclosures About Market Risk 41Item 4. Controls and Procedures 41 PART II•OTHER INFORMATION Item 1. Legal Proceedings 42Item 1A. Risk Factors 42Item 2. Unregistered Sale of Equity Securities and Use of Proceeds 42Item 3. Defaults Upon Senior Securities 42Item 4. (Removed and Reserved) 42Item 5. Other Information 42Item 6. Exhibits 42Signatures
43
2
PART I
ITEM 1. FINANCIAL STATEMENTS
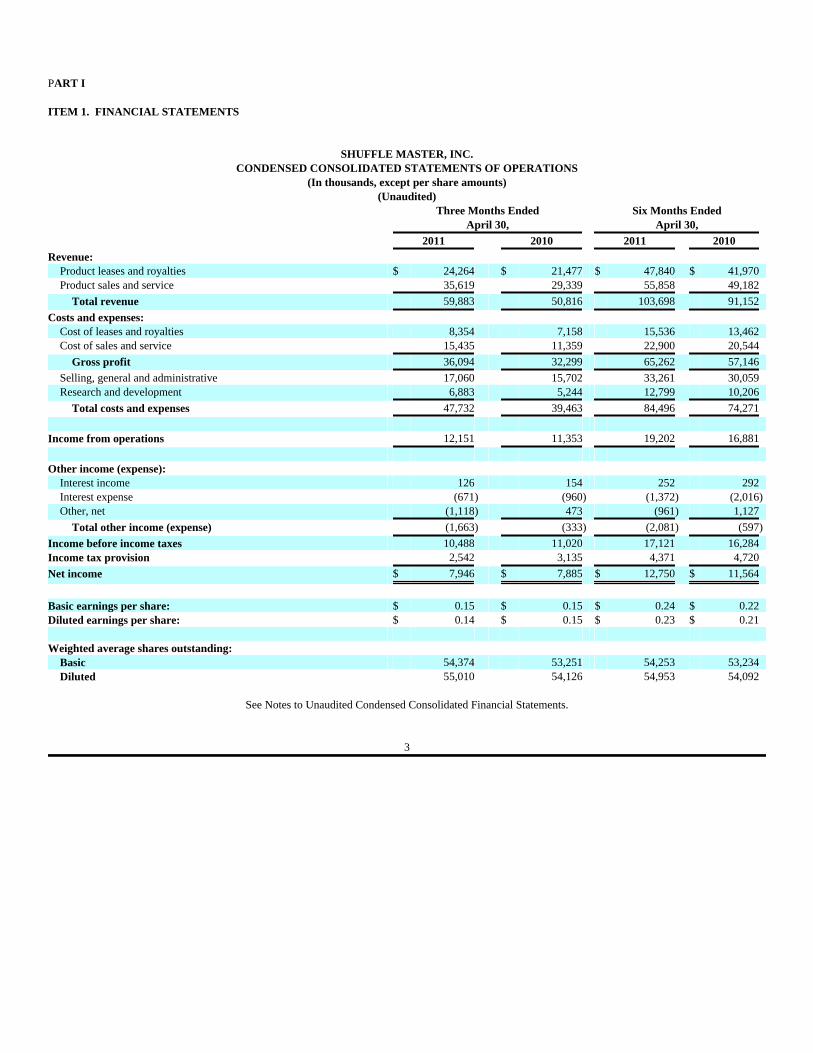
SHUFFLE MASTER, INC.CONDENSED CONSOLIDATED STATEMENTS OF OPERATIONS
(In thousands, except per share amounts)(Unaudited)
Three Months Ended Six Months Ended April 30, April 30,
2011 2010 2011 2010 Revenue:
Product leases and royalties $ 24,264 $ 21,477 $ 47,840 $ 41,970 Product sales and service 35,619 29,339 55,858 49,182
Total revenue 59,883 50,816 103,698 91,152
Costs and expenses: Cost of leases and royalties 8,354 7,158 15,536 13,462 Cost of sales and service 15,435 11,359 22,900 20,544
Gross profit 36,094 32,299 65,262 57,146
Selling, general and administrative 17,060 15,702 33,261 30,059 Research and development 6,883 5,244 12,799 10,206
Total costs and expenses 47,732 39,463 84,496 74,271
Income from operations 12,151 11,353 19,202 16,881
Other income (expense):
Interest income 126 154 252 292 Interest expense (671) (960) (1,372) (2,016)Other, net (1,118) 473 (961) 1,127
Total other income (expense) (1,663) (333) (2,081) (597)
Income before income taxes 10,488 11,020 17,121 16,284 Income tax provision 2,542 3,135 4,371 4,720
Net income $ 7,946 $ 7,885 $ 12,750 $ 11,564
Basic earnings per share: $ 0.15 $ 0.15 $ 0.24 $ 0.22 Diluted earnings per share: $ 0.14 $ 0.15 $ 0.23 $ 0.21 Weighted average shares outstanding:
Basic 54,374 53,251 54,253 53,234 Diluted 55,010 54,126 54,953 54,092
See Notes to Unaudited Condensed Consolidated Financial Statements.
3

SHUFFLE MASTER, INC.CONDENSED CONSOLIDATED BALANCE SHEETS
(In thousands, except per share amounts)(Unaudited)
April 30, October 31, 2011 2010
ASSETS Current assets:
Cash and cash equivalents $ 16,983 $ 9,988 Accounts receivable, net of allowance for bad debts of $521 and $466 43,538 41,176 Investment in sales-type leases and notes receivable, net of allowance for bad debts of $56 and $71 2,289 1,806 Inventories 33,549 27,351 Prepaid income taxes 4,802 7,086 Deferred income taxes 5,316 5,091 Other current assets 5,565 14,969
Total current assets 112,042 107,467 Investment in sales-type leases and notes receivable, net of current portion and net of allowance for bad debts of $14 and $42 564 1,104 Products leased and held for lease, net 33,097 31,975 Property and equipment, net 13,795 12,642 Intangible assets, net 72,069 64,144 Goodwill 87,517 75,932 Deferred income taxes 6,809 7,523 Other assets 2,999 3,173
Total assets $328,892 $ 303,960
LIABILITIES AND SHAREHOLDERS' EQUITY
Current liabilities: Accounts payable $ 5,609 $ 7,013 Accrued and other current liabilities 18,721 34,762 Deferred income taxes, current 124 116 Income tax payable 2,306 74 Customer deposits 3,273 2,973 Deferred revenue 4,314 3,901
Total current liabilities 34,347 48,839 Long-term debt 73,776 66,262 Other long-term liabilities 2,505 2,641 Deferred income taxes 75 70
Total liabilities 110,703 117,812
Commitments and contingencies (See Note 12) Shareholders' equity:
Common stock, $0.01 par value; 151,368 shares authorized; 54,061 and 53,650 shares issued and outstanding 541 536 Additional paid-in capital 111,890 108,705 Retained earnings 61,998 49,248 Accumulated other comprehensive income 43,760 27,659
Total shareholders' equity 218,189 186,148
Total liabilities and shareholders' equity $328,892 $ 303,960
See Notes to Unaudited Condensed Consolidated Financial Statements.
4

SHUFFLE MASTER, INC.CONDENSED CONSOLIDATED STATEMENTS OF CASH FLOWS
(In thousands, except per share amounts)(Unaudited)
Six Months Ended April 30,
2011 2010 Cash flows from operating activities: Net income $ 12,750 $ 11,564 Adjustments to reconcile net income to cash provided by operating activities: Depreciation and amortization 11,876 11,950 Amortization of debt issuance costs 238 515 Share-based compensation 1,478 1,855 Provision for bad debts 101 243 Write-down for inventory obsolescence 113 594 Gain on sale of leased assets (2,379) (3,346) Loss (Gain) on sale of assets 96 (37) Excess tax benefit from exercise of stock options (771) (8) Changes in operating assets and liabilities: Accounts receivable (1,761) 5,881 Investment in sales-type leases and notes receivable 540 (227) Inventories (5,668) 2,900 Accounts payable and accrued liabilities (16,533) 9,423 Customer deposits and deferred revenue 777 (2,270) Income taxes payable 2,404 571 Deferred income taxes 1,340 (16) Prepaid income taxes 2,305 1,253 Other 9,604 (13,324)
Net cash provided by operating activities 16,510 27,521
Cash flows from investing activities: Proceeds from sale of leased assets 3,810 4,953 Proceeds from sale of assets 76 38 Payments for products leased and held for lease (7,263) (13,139) Purchases of property and equipment (2,001) (2,553) Purchases of intangible assets (6,145) (2,171) Acquisition of business (6,499) - Other (446) (814)
Net cash used in investing activities (18,468) (13,686)
Cash flows from financing activities: Proceeds from Revolver 16,500 - Debt payments on Revolver (10,000) - Proceeds from Deutsche Bank Senior Secured Credit Facility - 8,245 Debt payments on Deutsche Bank Senior Secured Credit Facility - (7,365) Debt payments on Term Loan - (4,494) Proceeds from issuances of common stock, net 1,610 43 Excess tax benefit from exercise of stock options 771 8 Other (20) (97)
Net cash provided by (used in) financing activities 8,861 (3,660)
Effect of exchange rate changes on cash and cash equivalents 92 148
Net increase in cash and cash equivalents 6,995 10,323 Cash and cash equivalents, beginning of period 9,988 7,840
Cash and cash equivalents, end of period $ 16,983 $ 18,163
See Notes to Unaudited Condensed Consolidated Financial Statements.
5

SHUFFLE MASTER, INC.NOTES TO CONDENSED CONSOLIDATED FINANCIAL STATEMENTS
(In thousands, except unit/seat and per share amounts)(Unaudited)
1. DESCRIPTION OF BUSINESS AND INTERIM BASIS OF PRESENTATION Description of business. Unless the context indicates otherwise, references to “Shuffle Master, Inc.,” “we,” “us,” “our,” or the “Company,” include ShuffleMaster, Inc. and its consolidated subsidiaries. We develop, manufacture and market technology and entertainment-based products for the gaming industry for placement on the casino floor. We specializein providing licensed casino operators and other users with products and services that improve their speed, profitability, productivity and security. Ourbusiness is segregated into the following four operating segments: Utility, Proprietary Table Games (“PTG”), Electronic Table Systems (“ETS”) andElectronic Gaming Machines (“EGM”).
Utility. Our Utility segment develops products for licensed casino operators that enhance table game speed, productivity, profitability and security. Utilityproducts include automatic card shufflers and roulette chip sorters. This segment also includes our i-Shoe™ Auto card reading shoe that gathers data andenables casinos to track table game play and our i-Score™ baccarat viewer that displays current game results and trends. These products are intended to cost-effectively provide licensed casino operators and other users with data on table game play for security and marketing purposes, which in turn allows them toincrease their profitability.
Proprietary Table Games. Our PTG segment develops and delivers proprietary table games that enhance our casino customers' and other licensed operators'table game operations. Products in this segment include our proprietary table games as well as proprietary features added to public domain games such aspoker, baccarat, pai gow poker and blackjack table games.
We intend to broaden our PTG content through development and acquisition. By enhancing the value of our existing proprietary table games in themarketplace with side bets, add-ons and progressives and by increasing our footprint with new titles, we hope to increase our domestic market penetration andexpand further into international markets. We also intend to expand the domestic presence of our proprietary titles on electronic platforms such as TableMaster® and i-Table®. We also plan to continue to install proprietary progressives and side bets on public domain table games in addition to our proprietarytable games.
Electronic Table Systems. Our ETS segment develops and delivers various products involving popular table game content using e-Table game platforms.Our primary ETS products are i-Table®, Table Master®, Vegas Star® and Rapid Table Games®. Our i-Table® platform combines an electronic bettinginterface with a live dealer who deals the cards from a Shuffle Master, Inc. card reading shoe or shuffler that is designed to dramatically improve game speedand security while reducing many operating expenses associated with live tables. Our Table Master® and Vegas Star® feature a virtual dealer which enables usto offer table game content in both traditional gaming markets and in markets where live table games are not permitted, such as some racinos, video lotteryand arcade markets. Our Rapid Table Games® product enables the automation of certain components of traditional table games such as data collection,placement of bets, collection of losing bets and payment of winning bets combined with live dealer and game outcomes. This automation provides benefits toboth casino operators and players, including greater security and faster speed of play.
Electronic Gaming Machines. Our EGM segment develops and delivers our PC-based video slot machines into select markets, primarily in Australasia. Weoffer an extensive selection of video slot titles which include a range of bonus round options that can be configured as a network of machines or as stand-alone units. In addition to selling the full EGM complement, we sell software conversion kits that allow existing EGM terminals to be converted to othergames on the PC3 and PC4 platform. Popular titles for our EGMs include Rise of the Dragon™, Golden Fortunes™, Lucky Panda™, The Conqueror™,Emperor Guan™, Tiki Totems™, Drifting Sands™, Ninja™, iChing™, Kelly Country™, Deep Sea Dollars™, Cuba™, Galapagos Wild™, Sunset on theSerengeti™ and Lonesome George™, as well as the Pink Panther™ and Grand Central™ progressive links. In July 2010, we began initial deliveries ofEquinox™, our newest EGM product. Equinox™ offers widescreen displays and substantially improved graphics and user interfaces over older-style EGMmachines.
We lease, license and sell our products. When we lease or license our products, we generally negotiate a month-to-month operating lease or license fee. Whenwe sell our products, we often offer our customers long-term financing arrangements. We offer our products worldwide in markets that are highly regulated.We manufacture our products at our headquarters and manufacturing facility in Las Vegas, Nevada, as well as at our office and manufacturing facility inMilperra, New South Wales, Australia. In addition, we outsource the manufacturing of certain of our products and sub-assemblies in the United States, Europeand Australasia.
Basis of presentation. The accompanying Unaudited Condensed Consolidated Financial Statements include the results of operations, financial position andcash flows of Shuffle Master, Inc. and its consolidated subsidiaries. All material intercompany balances have been eliminated. All amounts are in thousandsexcept unit/seat and per share amounts. In the opinion of our management, the accompanying Unaudited Condensed Consolidated Financial Statements include all adjustments necessary to fairlystate, in all material respects, our results for the periods presented. These Condensed Consolidated Financial Statements have been prepared by us pursuant tothe rules and regulations of the Securities and Exchange Commission (“SEC”). Certain information and footnote disclosures normally included in financialstatements prepared in accordance with Generally Accepted Accounting Principles (“GAAP”) have been condensed or omitted pursuant to such rules andregulations. These Condensed Consolidated Financial Statements should be read in conjunction with the Consolidated Financial Statements and

accompanying notes included in our 2010 Annual Report on Form 10-K filed with the SEC on January 13, 2011. The results of operations for the three andsix months ended April 30, 2011 are not necessarily indicative of results to be expected for the entire fiscal year.
6

Use of estimates and assumptions. The preparation of our Condensed Consolidated Financial Statements in conformity with GAAP requires the use ofestimates and assumptions that affect the reported amounts of assets and liabilities, the disclosure of contingent assets and liabilities at the date of theCondensed Consolidated Financial Statements and the reported amounts of revenues and expenses during the reporting periods. Future events and their effectscannot be predicted with certainty; accordingly, our accounting estimates require the exercise of judgment. The accounting estimates used in the preparationof our Condensed Consolidated Financial Statements will change as new events occur, as more experience is acquired, as additional information is obtainedand as our operating environment changes. We evaluate and update our assumptions and estimates on an ongoing basis. Actual results could differ from thoseestimates.
Revenue recognition. We recognize revenues when all of the following have been satisfied:
• persuasive evidence of an arrangement exists;
• the price to the customer is fixed and determinable;
• delivery has occurred and any acceptance terms have been fulfilled; and
• collection is reasonably assured.
Revenues are reported net of incentive rebates, discounts and other taxes of a similar nature. Amounts billed prior to completing the earnings process aredeferred until revenue recognition criteria are met.
Product lease and royalty revenue • Lease and royalty revenue is earned from the leasing of our tangible products and the licensing of our intangible products,such as our proprietary table games. When we lease or license our products, we generally negotiate month-to-month fixed fee contracts, or to a lesser extent,enter into participation arrangements whereby casinos pay a fee to us based on a percentage of net win. Lease and royalty revenue commences upon thecompleted installation of the product. Lease terms are generally cancellable with 30 days’ notice. We recognize revenue from our leases and licenses uponinstallation of our product on a month-to-month basis.
Product sales and service revenue • We generate sales revenue through the sale of equipment in each product segment, including sales revenue from sales-type leases and the sale of lifetime licenses for our proprietary table games. Our credit sales terms are primarily 60 days or less. Financing for intangibleproperty and sales-type leases for tangible property have payment terms ranging generally from 24 to 36 months and are usually interest-bearing at marketinterest rates. Revenue from the sale of equipment is recorded in accordance with the contractual shipping terms. If a customer purchases existing leasedequipment, revenue is recorded on the effective date of the purchase agreement. Revenue on service and warranty contracts is recognized as the services areprovided over the term of the contracts. Revenue from the sale of lifetime licenses, under which we have no continuing obligation, is recorded on the effectivedate of the license agreement.
Our EGM, Table Master® and Vegas Star® products that contain both software and non-software components that function together to deliver the product’sessential functionality were previously subject to software revenue recognition rules. Under the new Accounting Standards Updates (“ASUs”) adopted fornew and materially modified arrangements entered into after the beginning of our first quarter of fiscal 2010, our EGM, Table Master® and Vegas Star®
products no longer fall under the scope of software revenue recognition rules and are generally recognized upon delivery and customer acceptance.
Multiple element arrangements • Some of our revenue arrangements contain multiple deliverables, such as a product sale combined with a service element orthe delivery of a future product. The new ASUs adopted provide for a more economically aligned model for allocating revenues among multiple deliverablesin a multi-element arrangement, based on relative selling prices. In order of preference, relative selling prices will be estimated based on vendor specificobjective evidence (“VSOE”), third-party evidence (“TPE”), or management’s best estimate of selling price (“BESP”), and the residual method is no longerallowed.
Most of our products and services qualify as separate units of accounting and the new guidance does not change this premise. When VSOE or TPE is notavailable, BESP is the amount we would sell the product or service for individually. The determination of BESP is made based on our normal pricing anddiscounting practices, which consider multiple factors, such as market conditions, competitive landscape, internal costs and profit objectives. Under the newguidance, revenues for certain products in our EGM and ETS segments and other software-enabled equipment in certain bundled arrangements previouslydeferred because VSOE was not available for undelivered elements will no longer be deferred. Generally, revenues allocated to future performanceobligations elements are deferred and will be recognized upon delivery and customer acceptance. Other recently adopted accounting standards. We adopted accounting standards related to the disclosure about the credit quality of financing receivables andallowances for credit losses which addresses concerns about the sufficiency, transparency and other robustness of credit risk disclosures for financingreceivables and the related allowance for credit losses. This update is designed to provide disclosures that enable a better understanding of:
1. the nature of credit risk inherent in our portfolio of financing receivables;
2. how credit risk is analyzed to determine the allowance for credit losses; and
3. changes in and reasons for changes in the allowances for credit losses.
7

Receivables, allowance for doubtful accounts and credit quality of financing receivables. Accounts receivable is stated at face value less an allowance fordoubtful accounts. We generally grant customers credit terms for periods of 30 to 90 days. Our investment in sales-type lease receivables is comprised ofcontracts. These contracts include extended payment terms granted to qualifying customers for periods from one to three years and are secured by the relatedproducts sold. We evaluate the credit quality of the receivables and establish an allowance for doubtful accounts based primarily upon collection history, using acombination of factors including, but not limited to, customer collection experience, economic conditions, and the customer’s financial condition. In additionto specific account identification, we utilize historic collection experience, where applicable, to establish an allowance for doubtful accounts receivable. Aspecific reserve is allocated when collectability becomes uncertain due to events and circumstances, such as bankruptcy and tax or legal issues that cause anadverse change in a customer’s cash flows or financial condition. Accounts placed on reserve are evaluated for probability of collection, which is used todetermine the amount of the specific reserve. All changes in the net carrying amount of our contracts are recorded as adjustments to bad debt expense. Theallowance for doubtful accounts related to accounts receivable as of April 30, 2011 and October 31, 2010 was $521 and $466, respectively. The allowance fordoubtful accounts related to investment in sales-type leases and notes receivable as of April 30, 2011 and October 31, 2010 was $70 and $113, respectively.
Uncollectible contracts are written off when it is determined that there is minimal chance of any kind of recovery, such as a customer property closure,bankruptcy restructuring or finalization, or other conditions that severely impact a customer’s ability to repay amounts owed.
Recently issued accounting standards or updates – not yet adopted
Fair value measurement disclosure – In May 2011, Financial Accounting Standards Board issued an ASU on fair value measurement on how to measure fairvalue and on what disclosures to provide about fair value measurements. The ASU expands disclosure requirements particularly for Level 3 inputs to includefollowing: • For fair value categorized in Level 3 of the fair value hierarchy: 1. a quantitative disclosure of the unobservable inputs and assumptions used in the measurement, 2. a description of the valuation processes in place (e.g., how the entity decides its valuation policies and procedures, as well as changes in its
analyses of fair value measurements, from period to period), and 3. a narrative description of the sensitivity of the fair value to changes in unobservable inputs and interrelationships between those inputs.
• The level in the fair value hierarchy of items that are not measured at fair value in the statement of financial position but whose fair value must bedisclosed.
This ASU will be effective for our second quarter of fiscal 2012 and is not expected to have a material impact on our financial statements.
2. SIGNIFICANT TRANSACTIONS
Newton Shuffler LLC. On November 15, 2010, we entered into a purchase agreement and related agreements (the “Purchase Agreement”) with NewtonShuffler LLC and related parties (“Newton”) whereby we acquired substantially all of the intellectual property assets of Newton. Under the terms of thePurchase Agreement, we paid Newton an upfront payment of $6,500. The Purchase Agreement also calls for approximately $1,400 to be paid over a 9 yearperiod. In connection with the Purchase Agreement, we also entered into non-competition agreements with Newton and the major owners of Newton for aperiod of 9 years.
We accounted for this acquisition as a business combination and allocated the total consideration of approximately $7,500 to the assets acquired based ontheir fair values. We recorded approximately $2,700 to intangible assets which will be amortized on a straight line basis over a 9 year period. The remaining$4,800 was recorded to goodwill. We also recorded a liability associated with future consideration of approximately $1,400 due in non-interest bearingpayments through 2019. The balance as of April 30, 2011 of $1,044 represents the discounted present value of the future payments, excluding imputedinterest of approximately $356, using an effective interest rate of 4.2%. The Newton acquisition enhances our Utility segment by adding to our intellectualproperty portfolio and providing for further revenue opportunities.
Prime Table Games, LLC. On December 21, 2010, we entered into a license and release agreement (the “License and Release Agreement”) with Prime TableGames, LLC and related parties (collectively “Prime Table Games”) to settle existing litigation between the parties and to acquire intellectual propertylicenses related to our PTG segment. Total consideration paid by us was $5,500. Accordingly, we recorded a legal settlement charge of approximately $2,200for the year ended October 31, 2010, which represented the fair value associated with the effective settlement of the then existing litigation. The remaining$3,300 was recorded as intangible assets which will be amortized on a straight line basis over a 9 year period.
On December 21, 2010, we also entered into a remote gambling intellectual property transfer agreement (the “Remote Gambling Agreement”) in which weacquired licenses to the "Three Card Poker™" internet rights in the British Isles for $1,500. The acquired internet rights include internet gambling andgambling via cell phones, in addition to certain social media uses such as play-for-fun applications on the internet. The $1,500 was recorded as intangibleassets which will be amortized on a straight line basis over a 9 year period.
8

3. SELECTED BALANCE SHEET DATA
The following provides additional disclosures for selected balance sheet accounts: April 30, October 31, 2011 2010 (In thousands) Net inventories: Raw materials and component parts $ 17,099 $ 17,322 Work-in-process 4,653 5,325 Finished goods 11,797 4,704
Total $ 33,549 $ 27,351
April 30, October 31, 2011 2010 (In thousands) Other current assets: Prepaid expenses $ 3,062 $ 2,483 Insurance receivables 27 10,840 Other receivables 2,130 845 Other 346 801
Total $ 5,565 $ 14,969
Insurance receivables of $27 and $10,840 as of April 30, 2011 and October 31, 2010, respectively, related to the settlement of our class action lawsuitsdiscussed in Note 12 and the shareholder derivative lawsuits. In February and May 2010, we entered into settlement agreements to settle the class actionlawsuits and shareholder derivative suits for $13,000 and $1,000, respectively. Under our Directors and Officers ("D&O") insurance policy, the settlementamounts totaling $14,000 are fully insured and reimbursable and our D&O insurance carriers paid the monetary settlement in full in accordance with courtinstructions which will be paid to beneficiaries as approved for payment by the court. As of April 30, 2011, $12,973 and $1,000 was approved for payment bythe court and paid to the beneficiaries of the class action lawsuits and shareholder derivative lawsuits, respectively.
April 30, October 31, 2011 2010 (In thousands) Products leased and held for lease: Utility $ 43,474 $ 41,262 Less: accumulated depreciation (26,455) (24,439)
Utility, net 17,019 16,823
Proprietary Table Games 6,418 3,997 Less: accumulated depreciation (2,700) (2,059)
Proprietary Table Games, net 3,718 1,938
Electronic Table Systems 26,020 25,437 Less: accumulated depreciation (13,660) (12,223)
Electronic Table Systems, net 12,360 13,214
Total, net $ 33,097 $ 31,975
9

April 30, October 31, 2011 2010 (In thousands) Accrued and other current liabilities: Accrued compensation $ 10,312 $ 13,148 Accrued taxes 1,862 1,896 Accrued legal fees 730 11,376 Other accrued liabilities 5,817 8,342
Total $ 18,721 $ 34,762
The decrease of $2,836 in accrued compensation is due to timing of compensation related payments. The decrease in other accrued liabilities primarilyrelated to the settlement of an existing litigation with Prime Table Games described in Note 2. The decrease in accrued legal fees is due to payment to thebeneficiaries of the class action lawsuits and shareholder derivative lawsuits described above.
4. INTANGIBLE ASSETS AND GOODWILL Amortizable intangible assets. All of our recorded intangible assets, excluding goodwill and the Stargames™ and CARD™ tradenames, are subject toamortization. We amortize certain of our intangible assets proportionate to the related actual revenue from the utilization of the intangible asset. We believethis method reflects the pattern in which the economic benefits of the intangible asset are consumed or otherwise used up. For all other intangibles, includingcovenants not to compete, we amortize on a straight-line basis over their useful lives. Amortization expense was $2,501 and $2,858 for the three monthsended April 30, 2011 and 2010, respectively, and $4,879 and $6,128 for the six months ended April 30, 2011 and 2010, respectively.
Amortizable intangible assets are comprised of the following: Weighted Average April 30, October 31, Useful Life 2011 2010 (In thousands) Amortizable intangible assets:
Patents, games and products 10 years $ 70,328 $ 64,344 Less: accumulated amortization (51,247) (46,925)
19,081 17,419
Customer relationships 10 years 26,138 24,299 Less: accumulated amortization (11,728) (9,563)
14,410 14,736
Licenses and other 6 - 9 years 18,560 13,328 Less: accumulated amortization (6,091) (4,667)
12,469 8,661
Total $ 45,960 $ 40,816
Tradenames. Intangibles with an indefinite life, consisting of the Stargames™ and CARD™ tradenames, are not amortized, and were $26,109 and $23,328 asof April 30, 2011 and October 31, 2010, respectively.
10
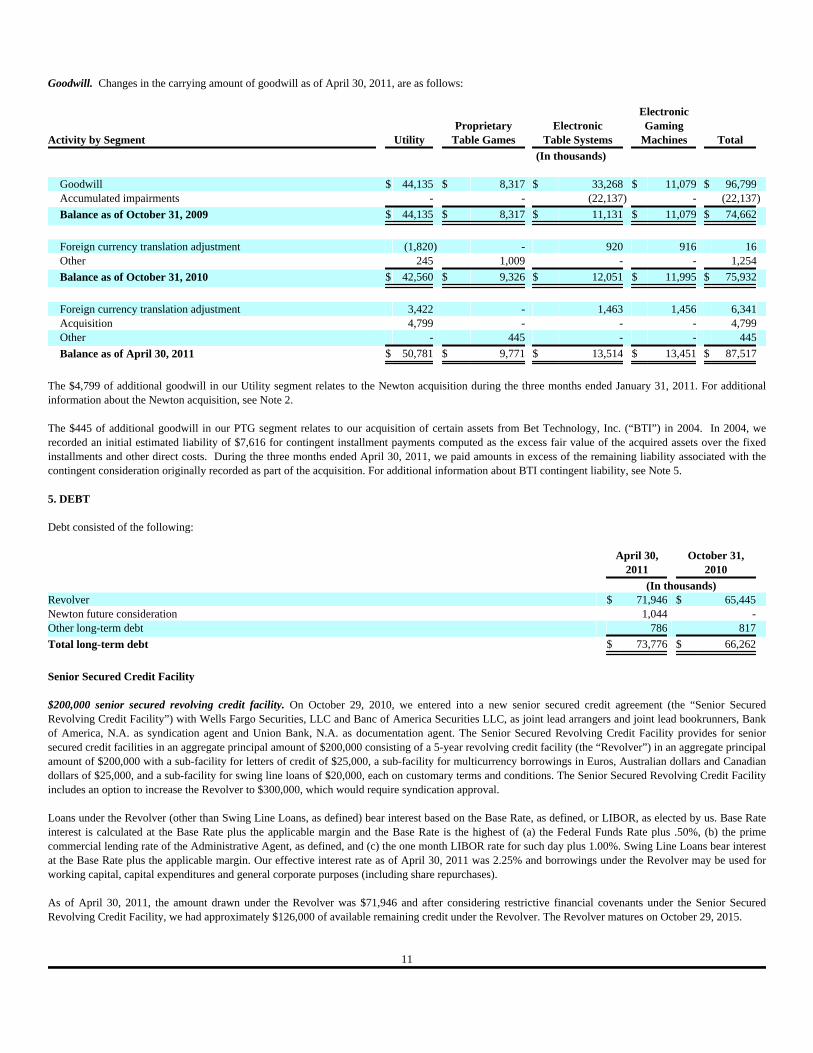
Goodwill. Changes in the carrying amount of goodwill as of April 30, 2011, are as follows: Electronic Proprietary Electronic Gaming Activity by Segment Utility Table Games Table Systems Machines Total (In thousands)
Goodwill $ 44,135 $ 8,317 $ 33,268 $ 11,079 $ 96,799 Accumulated impairments - - (22,137) - (22,137)
Balance as of October 31, 2009 $ 44,135 $ 8,317 $ 11,131 $ 11,079 $ 74,662
Foreign currency translation adjustment (1,820) - 920 916 16 Other 245 1,009 - - 1,254
Balance as of October 31, 2010 $ 42,560 $ 9,326 $ 12,051 $ 11,995 $ 75,932
Foreign currency translation adjustment 3,422 - 1,463 1,456 6,341 Acquisition 4,799 - - - 4,799 Other - 445 - - 445
Balance as of April 30, 2011 $ 50,781 $ 9,771 $ 13,514 $ 13,451 $ 87,517
The $4,799 of additional goodwill in our Utility segment relates to the Newton acquisition during the three months ended January 31, 2011. For additionalinformation about the Newton acquisition, see Note 2.
The $445 of additional goodwill in our PTG segment relates to our acquisition of certain assets from Bet Technology, Inc. (“BTI”) in 2004. In 2004, werecorded an initial estimated liability of $7,616 for contingent installment payments computed as the excess fair value of the acquired assets over the fixedinstallments and other direct costs. During the three months ended April 30, 2011, we paid amounts in excess of the remaining liability associated with thecontingent consideration originally recorded as part of the acquisition. For additional information about BTI contingent liability, see Note 5.
5. DEBT
Debt consisted of the following: April 30, October 31, 2011 2010 (In thousands) Revolver $ 71,946 $ 65,445 Newton future consideration 1,044 - Other long-term debt 786 817
Total long-term debt $ 73,776 $ 66,262
Senior Secured Credit Facility
$200,000 senior secured revolving credit facility. On October 29, 2010, we entered into a new senior secured credit agreement (the “Senior SecuredRevolving Credit Facility”) with Wells Fargo Securities, LLC and Banc of America Securities LLC, as joint lead arrangers and joint lead bookrunners, Bankof America, N.A. as syndication agent and Union Bank, N.A. as documentation agent. The Senior Secured Revolving Credit Facility provides for seniorsecured credit facilities in an aggregate principal amount of $200,000 consisting of a 5-year revolving credit facility (the “Revolver”) in an aggregate principalamount of $200,000 with a sub-facility for letters of credit of $25,000, a sub-facility for multicurrency borrowings in Euros, Australian dollars and Canadiandollars of $25,000, and a sub-facility for swing line loans of $20,000, each on customary terms and conditions. The Senior Secured Revolving Credit Facilityincludes an option to increase the Revolver to $300,000, which would require syndication approval.
Loans under the Revolver (other than Swing Line Loans, as defined) bear interest based on the Base Rate, as defined, or LIBOR, as elected by us. Base Rateinterest is calculated at the Base Rate plus the applicable margin and the Base Rate is the highest of (a) the Federal Funds Rate plus .50%, (b) the primecommercial lending rate of the Administrative Agent, as defined, and (c) the one month LIBOR rate for such day plus 1.00%. Swing Line Loans bear interestat the Base Rate plus the applicable margin. Our effective interest rate as of April 30, 2011 was 2.25% and borrowings under the Revolver may be used forworking capital, capital expenditures and general corporate purposes (including share repurchases).
As of April 30, 2011, the amount drawn under the Revolver was $71,946 and after considering restrictive financial covenants under the Senior SecuredRevolving Credit Facility, we had approximately $126,000 of available remaining credit under the Revolver. The Revolver matures on October 29, 2015.
11
Covenants. Our Senior Secured Revolving Credit Facility contains three financial maintenance covenants requiring us to maintain a Total Leverage Ratio, asdefined therein, of not more than 3.75 to 1.0, a Senior Leverage Ratio, as defined therein, of not more than 3.0 to 1.0 until October 31, 2013 and not more than2.75 to 1.00 after October 31, 2013 and Interest Expense Coverage Ratio, as defined therein, in excess of 3.0 to 1.0 at the end of any fiscal quarter. As of April30, 2011, our Total Leverage Ratio, Senior Leverage Ratio and Interest Expense Coverage Ratio were 1.12 to 1.0, 1.09 to 1.0 and 25.31 to 1.0, respectively.
Guarantors and collateral. The Revolver obligations under our Senior Secured Revolving Credit Facility are guaranteed by each existing and future wholly-owned domestic subsidiary of ours that is not an immaterial subsidiary and are secured by a first priority lien on substantially all of our and our guarantors’assets.
Newton future consideration. In connection with our acquisition of Newton on November 15, 2010, we recorded a liability associated with futureconsideration of approximately $1,400 due in non-interest bearing payments through 2019. The balance as of April 30, 2011 of $1,044 represents thediscounted present value of the future payments, excluding imputed interest of approximately $356, using an effective interest rate of 4.2%.
BTI contingent liability. In connection with our acquisition of certain assets from BTI in February 2004, we recorded an initial estimated liability of $7,616for contingent installment payments computed as the excess fair value of the acquired assets over the fixed installments and other direct costs. In November2004, we began paying monthly note installments based on a percentage of certain revenue from BTI games for a period of up to ten years, not to exceed$12,000. The remaining principal and interest payment of $98 related to our initial estimated liability of $7,616 was paid in February 2009 and therefore nooutstanding balance existed as of April 30, 2011. As of April 30, 2011, we have paid approximately $10,014 of the $12,000 maximum amount since February2004.
6. SHAREHOLDERS’ EQUITY Common stock repurchases. Our board of directors periodically authorizes us to repurchase shares of our common stock. However, we generally prioritizebank debt reduction over share repurchases. As of April 30, 2011, $21,077 remained outstanding under our board authorization. We cancel shares that arerepurchased. No shares were repurchased during the three and six months ended April 30, 2011. The timing of our common stock repurchases pursuant to our board of directors’ authorization is dependent on future opportunities and on our views, as theymay change from time to time, as to the most prudent uses of our capital resources, including cash and borrowing capacity.
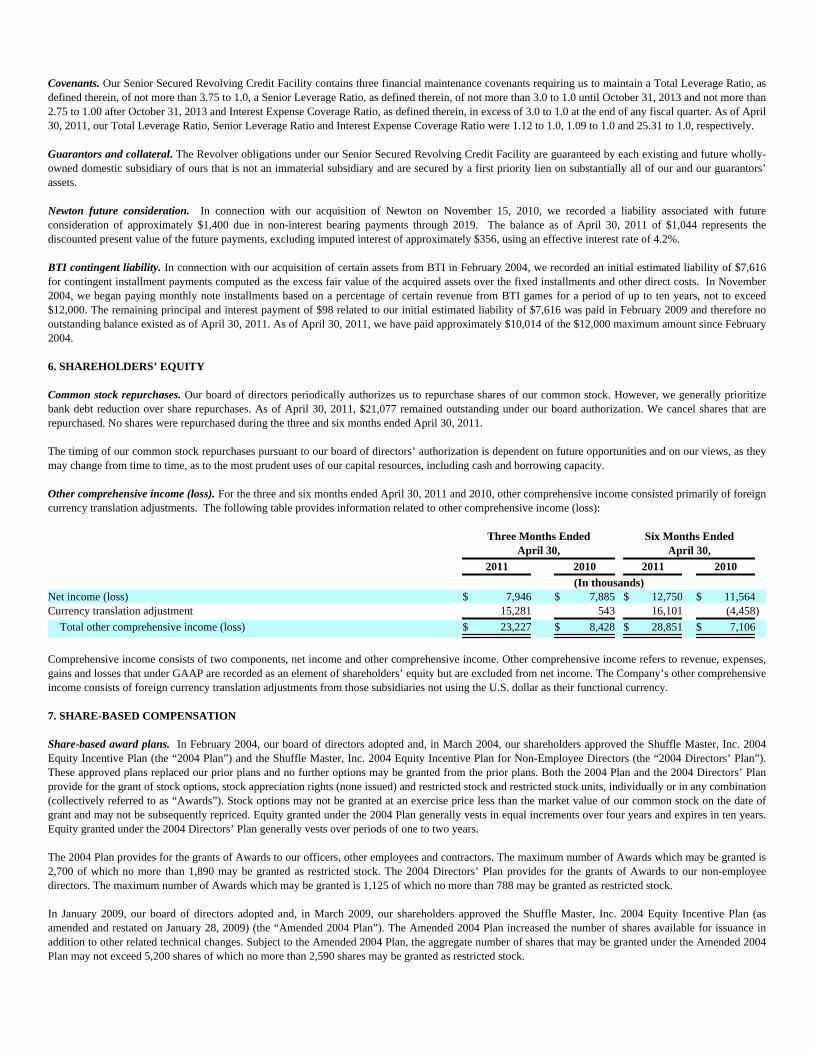
Other comprehensive income (loss). For the three and six months ended April 30, 2011 and 2010, other comprehensive income consisted primarily of foreigncurrency translation adjustments. The following table provides information related to other comprehensive income (loss): Three Months Ended Six Months Ended April 30, April 30,
2011 2010 2011 2010 (In thousands) Net income (loss) $ 7,946 $ 7,885 $ 12,750 $ 11,564 Currency translation adjustment 15,281 543 16,101 (4,458)
Total other comprehensive income (loss) $ 23,227 $ 8,428 $ 28,851 $ 7,106
Comprehensive income consists of two components, net income and other comprehensive income. Other comprehensive income refers to revenue, expenses,gains and losses that under GAAP are recorded as an element of shareholders’ equity but are excluded from net income. The Company’s other comprehensiveincome consists of foreign currency translation adjustments from those subsidiaries not using the U.S. dollar as their functional currency.
7. SHARE-BASED COMPENSATION Share-based award plans. In February 2004, our board of directors adopted and, in March 2004, our shareholders approved the Shuffle Master, Inc. 2004Equity Incentive Plan (the “2004 Plan”) and the Shuffle Master, Inc. 2004 Equity Incentive Plan for Non-Employee Directors (the “2004 Directors’ Plan”).These approved plans replaced our prior plans and no further options may be granted from the prior plans. Both the 2004 Plan and the 2004 Directors’ Planprovide for the grant of stock options, stock appreciation rights (none issued) and restricted stock and restricted stock units, individually or in any combination(collectively referred to as “Awards”). Stock options may not be granted at an exercise price less than the market value of our common stock on the date ofgrant and may not be subsequently repriced. Equity granted under the 2004 Plan generally vests in equal increments over four years and expires in ten years.Equity granted under the 2004 Directors’ Plan generally vests over periods of one to two years. The 2004 Plan provides for the grants of Awards to our officers, other employees and contractors. The maximum number of Awards which may be granted is2,700 of which no more than 1,890 may be granted as restricted stock. The 2004 Directors’ Plan provides for the grants of Awards to our non-employeedirectors. The maximum number of Awards which may be granted is 1,125 of which no more than 788 may be granted as restricted stock.
In January 2009, our board of directors adopted and, in March 2009, our shareholders approved the Shuffle Master, Inc. 2004 Equity Incentive Plan (asamended and restated on January 28, 2009) (the “Amended 2004 Plan”). The Amended 2004 Plan increased the number of shares available for issuance inaddition to other related technical changes. Subject to the Amended 2004 Plan, the aggregate number of shares that may be granted under the Amended 2004Plan may not exceed 5,200 shares of which no more than 2,590 shares may be granted as restricted stock.

12

As of April 30, 2011, under the Amended 2004 Plan and 2004 Directors’ Plan, there were 1,602 and 202 shares available for grant, respectively.
A summary of activity related to stock options is presented below: Weighted Weighted Average Average Remaining Aggregate Exercise Contractual Intrinsic Shares Price Term Value (In thousands, except per share amount) Outstanding at November 1, 2010 4,840 $ 13.56 Granted 527 10.87 Exercised (389) 4.14 Forfeited or expired (199) 17.22
Outstanding at April 30, 2011 4,779 $ 13.88 5.6 $ 8,243
Fully vested and expected to vest at April 30, 2011 4,738 $ 13.95 5.6 $ 8,165
Exercisable at April 30, 2011 3,382 $ 14.92 4.5 $ 5,300
For the three months ended April 30, 2011 and 2010, we issued 168 and 144 stock options, with an aggregate fair market value of $865 and $1,194,respectively. For the six months ended April 30, 2011 and 2010, we issued 527 and 691 stock options, with an aggregate fair market value of $2,984 and$5,217, respectively. For the three months ended April 30, 2011, 31 stock options were exercised and $342 of related tax provision was recognized and for thesix months ended April 30, 2011, 389 stock options were exercised and $42 of related tax benefit was recognized. As of April 30, 2011, there wasapproximately $4,760 of unamortized compensation expense related to stock options, which expense is expected to be recognized over a weighted-averageperiod of 1.9 years.
A summary of activity related to restricted stock is presented below: Weighted Average Remaining Aggregate Grant-Date Vesting Intrinsic Shares Fair Value Period Value (In thousands, except per share amount) Nonvested at November 1, 2010 356 $ 16.25 Granted 327 10.10 Vested (137) 15.94 Forfeited (27) 8.72
Nonvested at April 30, 2011 519 $ 12.86 1.52 $ 5,675
Expected to vest 498 $ 12.97 1.47 $ 5,444
The total value of each restricted stock grant, based on the fair market value of the stock on the date of grant, is amortized to compensation expense over therelated vesting period. As of April 30, 2011, there was approximately $3,488 of unamortized compensation expense related to restricted stock, which expenseis expected to be recognized over a weighted-average period of 2.1 years.
13
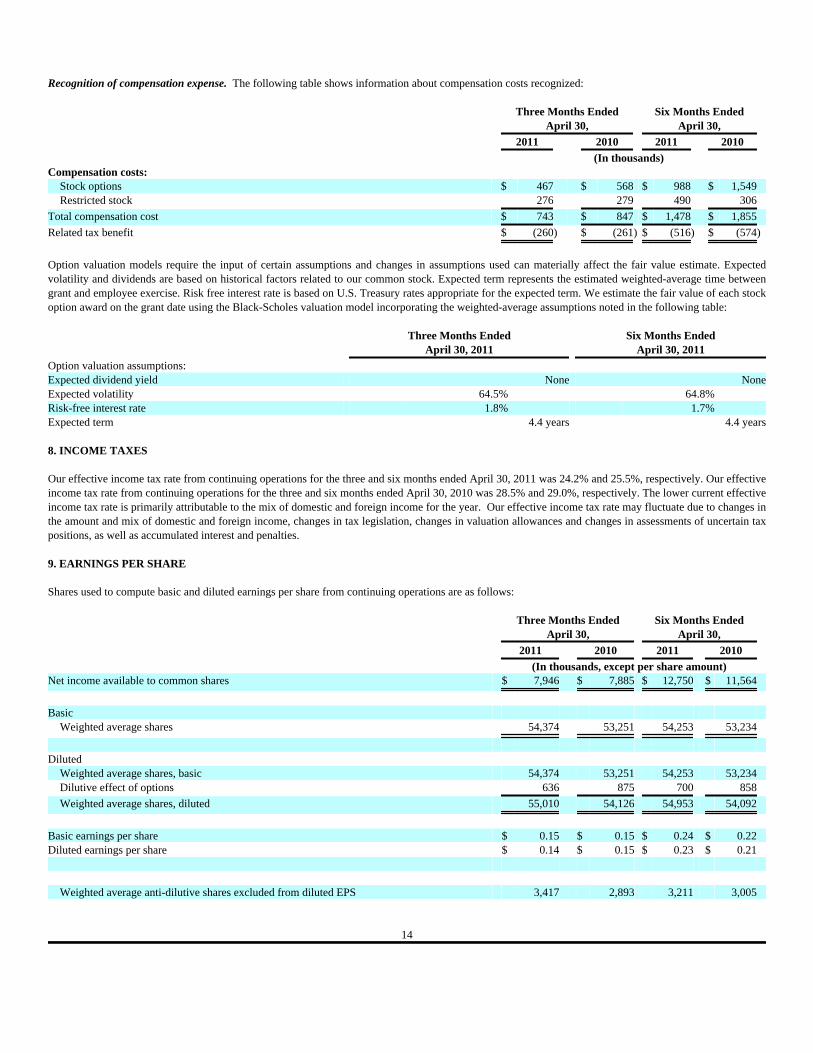
Recognition of compensation expense. The following table shows information about compensation costs recognized: Three Months Ended Six Months Ended April 30, April 30,
2011 2010 2011 2010 (In thousands) Compensation costs:
Stock options $ 467 $ 568 $ 988 $ 1,549 Restricted stock 276 279 490 306
Total compensation cost $ 743 $ 847 $ 1,478 $ 1,855
Related tax benefit $ (260) $ (261) $ (516) $ (574)
Option valuation models require the input of certain assumptions and changes in assumptions used can materially affect the fair value estimate. Expectedvolatility and dividends are based on historical factors related to our common stock. Expected term represents the estimated weighted-average time betweengrant and employee exercise. Risk free interest rate is based on U.S. Treasury rates appropriate for the expected term. We estimate the fair value of each stockoption award on the grant date using the Black-Scholes valuation model incorporating the weighted-average assumptions noted in the following table: Three Months Ended Six Months Ended April 30, 2011 April 30, 2011Option valuation assumptions: Expected dividend yield None NoneExpected volatility 64.5% 64.8%Risk-free interest rate 1.8% 1.7%Expected term 4.4 years 4.4 years 8. INCOME TAXES
Our effective income tax rate from continuing operations for the three and six months ended April 30, 2011 was 24.2% and 25.5%, respectively. Our effectiveincome tax rate from continuing operations for the three and six months ended April 30, 2010 was 28.5% and 29.0%, respectively. The lower current effectiveincome tax rate is primarily attributable to the mix of domestic and foreign income for the year. Our effective income tax rate may fluctuate due to changes inthe amount and mix of domestic and foreign income, changes in tax legislation, changes in valuation allowances and changes in assessments of uncertain taxpositions, as well as accumulated interest and penalties.
9. EARNINGS PER SHARE Shares used to compute basic and diluted earnings per share from continuing operations are as follows: Three Months Ended Six Months Ended April 30, April 30,
2011 2010 2011 2010 (In thousands, except per share amount) Net income available to common shares $ 7,946 $ 7,885 $ 12,750 $ 11,564
Basic
Weighted average shares 54,374 53,251 54,253 53,234
Diluted
Weighted average shares, basic 54,374 53,251 54,253 53,234 Dilutive effect of options 636 875 700 858
Weighted average shares, diluted 55,010 54,126 54,953 54,092
Basic earnings per share $ 0.15 $ 0.15 $ 0.24 $ 0.22 Diluted earnings per share $ 0.14 $ 0.15 $ 0.23 $ 0.21
Weighted average anti-dilutive shares excluded from diluted EPS 3,417 2,893 3,211 3,005
14

10. FAIR VALUE MEASUREMENT We utilize a three level hierarchy that defines the assumptions used to measure certain assets and liabilities at fair value. Cash and cash equivalents, accounts receivable, the current portion of our investment in sales-type leases and notes receivable are not presented in the tablebelow as their carrying value approximates fair value due to their short term nature. It is impracticable to estimate the fair value of the long-term portion ofour investment in sales-type leases and notes receivable as it is comprised of many insignificant balances, customers with different credit profiles and variousinterest rates. The fair value of our Revolver as of April 30, 2011 has been calculated based on market borrowing rates available as of April 30, 2011 for debtwith similar terms and maturities. The fair value of our Revolver as of October 31, 2010 approximates the carrying value as of October 31, 2010 as we closedon the Senior Secured Revolving Credit Facility on October 29, 2010. The following table provides the fair value measurement information about theCompany’s long-term debt. Carrying Value Fair Value Carrying Value Fair Value Fair Value April 30, 2011 April 30, 2011 October 31, 2010 October 31, 2010 Hierarchy (In thousands)Revolver $ 71,946 $ 71,924 $ 65,445 $ 65,445 Level 2 11. OPERATING SEGMENTS The following provides financial information concerning our reportable segments of our operations: Three Months Ended Six Months Ended April 30, April 30,
2011 2010 2011 2010 (In thousands) Revenue:
Utility $ 19,172 $ 21,130 $ 36,533 $ 38,746 Proprietary Table Games 10,546 10,170 21,772 19,205 Electronic Table Systems 11,797 12,444 19,928 20,819 Electronic Gaming Machines 18,368 7,072 25,465 12,382
$ 59,883 $ 50,816 $ 103,698 $ 91,152
Gross profit (loss): Utility $ 11,584 $ 12,886 $ 22,432 $ 23,591 Proprietary Table Games 8,405 7,715 17,667 15,252 Electronic Table Systems 4,837 7,832 9,487 11,751 Electronic Gaming Machines 11,268 3,866 15,676 6,552
$ 36,094 $ 32,299 $ 65,262 $ 57,146
Operating income (loss): Utility $ 9,858 $ 11,242 $ 19,086 $ 20,145 Proprietary Table Games 7,385 7,148 15,760 14,078 Electronic Table Systems 1,719 5,377 3,532 6,900 Electronic Gaming Machines 8,393 1,978 10,157 3,085 Unallocated Corporate (15,204) (14,392) (29,333) (27,327)
$ 12,151 $ 11,353 $ 19,202 $ 16,881
Depreciation and amortization: Utility $ 1,947 $ 1,904 $ 3,199 $ 3,972 Proprietary Table Games 1,456 1,850 2,769 3,023 Electronic Table Systems 1,705 1,436 3,903 3,403 Electronic Gaming Machines 60 - 128 197 Unallocated Corporate 947 635 1,877 1,355
$ 6,115 $ 5,825 $ 11,876 $ 11,950
Capital expenditures: Utility $ 2,169 $ 5,744 $ 4,366 $ 8,796 Proprietary Table Games 746 329 6,175 952 Electronic Table Systems 1,516 2,671 3,077 5,015 Electronic Gaming Machines 67 - 67 878 Unallocated Corporate 794 1,788 1,724 2,222
$ 5,292 $ 10,532 $ 15,409 $ 17,863
15

REVENUE BY GEOGRAPHIC AREA
The following provides financial information concerning our revenues by geographic area: Three Months Ended Six Months Ended April 30, April 30,
2011 2010 2011 2010
(Dollars in thousands) Revenue:
United States $ 24,345 40.7% $ 24,988 49.2% $ 50,350 48.6% $ 47,478 52.1%Canada 1,882 3.1% 1,884 3.7% 3,274 3.2% 4,664 5.1%Other North America 1,592 2.7% 1,133 2.2% 2,360 2.3% 1,788 2.0%Europe 2,236 3.7% 2,437 4.8% 3,642 3.5% 4,579 5.0%Australia 24,563 41.0% 14,684 28.9% 35,514 34.2% 24,412 26.8%Asia 4,822 8.1% 5,564 11.0% 7,776 7.5% 7,395 8.1%Other 443 0.7% 126 0.2% 782 0.7% 836 0.9%
$ 59,883 100.0% $ 50,816 100.0% $ 103,698 100.0% $ 91,152 100.0%
12. COMMITMENTS AND CONTINGENCIES Employment agreements. We have entered into employment contracts with our corporate officers and certain other key employees with durations rangingfrom one to four years. Significant contract provisions include minimum annual base salaries, healthcare benefits, bonus compensation if performancemeasures are achieved and non-compete provisions. These contracts are primarily “at will” employment agreements, under which the employee or we mayterminate employment. If we terminate any of these employees without cause, we are obligated to pay the employee severance benefits as specified in theirindividual contract. As of April 30, 2011 and October 31, 2010, minimum aggregate severance benefits totaled $6,502 and $5,670, respectively.
Legal proceedings. In the ordinary course of business, we are involved in various legal proceedings and other matters that are complex in nature and haveoutcomes that are difficult to predict. We record accruals for such contingencies to the extent that we conclude that it is probable that a loss will be incurredand the amount of loss can be reasonably estimated. We have not recorded any loss accruals for these contingencies unless otherwise noted below. Ourassessment of each matter may change based on future unexpected events. An unexpected adverse judgment in any pending litigation could cause a materialimpact on our business operations, intellectual property, results of operations or financial position. Unless otherwise expressly stated, we believe costsassociated with litigation will not have a material impact on our financial position or liquidity, but may be material to the results of operations in any givenperiod. We assume no obligation to update the status of pending litigation, except as may be required by applicable law, statute or regulation.
GEI – In July 2004, we filed a patent infringement lawsuit against Gaming Entertainment, Inc. (“GEI”) and Yehia Awada (“Awada”) in the U.S. DistrictCourt for the District of Nevada, in Las Vegas, Nevada. The lawsuit alleges that GEI/Awada's 3-5-7 Poker™ game infringes one of our Three Card Poker®
patents and one of our Let-It-Ride® patents. We were seeking a permanent injunction and an undetermined amount of damages against GEI/Awada. On March 6, 2008, the Court ordered the Clerk to enter default against GEI/Awada, which default was entered on that same date. In accordance with theCourt's order of March 6, 2008, we sought appropriate damages, an injunction and costs to be included in a default judgment. On June 13, 2008, the Courtissued a default judgment against Awada and GEI for $792 and also issued a permanent injunction against their 3-5-7 Poker™ game, which judgment wasentered on July 8, 2008. The judgment is still outstanding. There is no assurance of collectability of all or any part of this judgment. In August 2008, we started certain proceedings to collect the judgment for $792 entered on July 8, 2008, including but not limited to, a lawsuit filed in theEighth Judicial District Court, Clark County, Nevada, related to the fraudulent transfer of certain intellectual property assets by Awada/GEI. The Courtentered an order on August 11, 2008, that in part required GEI/Awada to remove all 3-5-7 Poker™ games by August 12, 2008, with which they complied, ona later date, to the best of our knowledge. On October 29, 2009, Awada filed for bankruptcy, which stayed all collection activities against him, including thosearising from our judgment. On November 24, 2009, GEI joined Awada in filing for bankruptcy protection, and thus all collection activities with respect to ourjudgment against both GEI and Awada were stayed at that time. On August 16, 2010, the bankruptcy court dismissed Awada’s bankruptcy case. Collectionefforts with respect to our judgment against Awada may now be resumed. The stay of collection efforts as a result of bankruptcy protection remains in effectas to GEI.
16

Class Action Lawsuits –
a. Stocke Complaint•On June 1, 2007, a putative class action complaint for violation of the federal securities laws against the Company and our then ChiefExecutive Officer, Mark L. Yoseloff and our then Chief Financial Officer, Richard L. Baldwin, was filed in the U.S. District Court for the District of Nevadaon behalf of persons who purportedly purchased our stock between December 22, 2006 and March 12, 2007. The case is entitled Joseph Stocke vs. ShuffleMaster, Inc., Mark L. Yoseloff and Richard L. Baldwin (the “Stocke Complaint”). The Stocke Complaint asserts claims pursuant to Sections 10(b) and 20(a)of the Securities Exchange Act of 1934 and Rule 10b-5 promulgated thereunder. These claims allegedly relate to our March 12, 2007, announcement that wewould restate our fiscal fourth quarter and full year financial results. The Stocke Complaint sought compensatory damages in an unstated amount. On orabout August 4, 2007, four plaintiffs moved the Court for appointment as lead plaintiff.
b. Armistead Complaint•On June 12, 2007, a second putative class action complaint for violation of the federal securities laws against the Company and Dr.Yoseloff and Mr. Baldwin was filed in the U.S. District Court for the District of Nevada. The case is entitled Robert Armistead, Jr. vs. Shuffle Master, Inc.,Mark L. Yoseloff and Richard L. Baldwin. This lawsuit effectively mirrors the allegations in the Stocke Complaint, except that this complaint was filed onbehalf of persons who purchased our stock between March 20, 2006 and March 12, 2007.
c. Tempel Complaint•On June 25, 2007, a third putative class action complaint for violation of the federal securities laws against the Company, Dr. Yoseloffand Mr. Baldwin was filed in the U.S. District Court for the District of Nevada. The case is entitled Andrew J. Tempel vs. Shuffle Master, Inc., Mark L.Yoseloff and Richard L. Baldwin. This lawsuit is a “copycat” lawsuit of the Stocke Complaint.
d. Consolidation of Stocke, Armistead and Tempel Complaints - On June 22, 2007, a Joint Stipulation was filed in the U.S. District Court for the District ofNevada providing that all presently filed and any subsequently filed related class actions shall be consolidated and captioned In Re Shuffle Master, Inc.Securities Litigation. We were not required to answer, move against or otherwise respond to any class action complaints until a consolidated complaint wasfiled. On November 30, 2007, the Court appointed the “Shuffle Master Institutional Investor Group”, consisting of the Tulsa Municipal Employees' Retirement Planand the Oklahoma Firefighters Pension and Retirement System, as lead plaintiffs. Grant & Eisenhofer was the lead plaintiffs' counsel. A Consolidated Amended Class Action Complaint (“Consolidated Complaint”) was filed on February 5, 2008. The Consolidated Complaint asserted thesame causes of action for violation of federal securities law as the initial lawsuits and applies to a class period of February 1, 2006 to March 12, 2007. TheConsolidated Complaint contained essentially the same material allegations as in the initial lawsuits and also contains allegations arising out of the Company'sacquisition of Stargames and disclosures concerning the Company's internal controls. This Consolidated Complaint superseded all previously filed lawsuitscovering this class period. On March 25, 2008, the defendants filed a Motion to Dismiss. On March 23, 2009, the Court denied the defendants' Motion toDismiss. The defendants answered the Consolidated Complaint on April 29, 2009. On February 2, 2010, the lead plaintiffs filed a Motion for Preliminary Approval of Settlement. The Motion was granted on February 4, 2010, and the Courtset a hearing in May 2010, subsequently rescheduled to June 8, 2010, where the Court was to decide whether to give final approval for the settlement. OurD&O insurance carriers escrowed the monetary settlement in full, equal to $13,000 which, when obtained, was to be paid to plaintiffs in full by our D&Oinsurance carriers. At the June 8, 2010 hearing, the Court gave its final approval to this settlement. On June 9, 2010, the Court entered an order and final judgment concludingthe matter. No appeal has been filed from the order and final judgment. The period for appeal expired in July 2010. As of April 30, 2011, substantially theentire amount was approved for payment by the court and paid to the beneficiaries of the Class Action Lawsuits. See Note 3 for more information. Weconsider the matters to be materially concluded. TableMAX – On April 14, 2009, TableMAX IP Holdings, Inc. and TableMAX Gaming, Inc. filed a complaint (the “First Complaint”) against us in the UnitedStates District Court for the District of Nevada. This case is a patent infringement claim alleging that our Table Master® product infringes the following U.S.Patents: 5,688,174, 6,921,337 and 7,201,661. The First Complaint seeks injunctive relief and an unspecified amount of damages including claims forattorneys’ fees, costs, increased damages and disbursements. On August 13, 2009, TableMAX Holdings, Inc. and TableMAX Gaming, Inc. voluntarilydismissed the First Complaint. On the same date, TableMAX IP Holdings, Inc. and TableMAX Gaming, Inc. and Vegas Amusement, Inc. (the alleged ownerof U.S. Patents: 5,688,174, 6,921,337 and 7,201,661) (hereinafter collectively “TableMAX”) filed a new complaint (the “New Complaint”) makingallegations materially the same as the allegations in the First Complaint. On August 19, 2009, TableMAX filed an amended complaint (the “SecondComplaint”). The Second Complaint superseded and is materially the same as the New Complaint, except that the plaintiffs added a new claim that TableMaster® infringes U.S. Patent 7,575,512, which was issued on August 18, 2009. On August 19, 2009, the plaintiffs filed a Motion for Preliminary Injunctionin the Second Complaint that sought to enjoin future sales of our Table Master® product. On October 26, 2009, the Court denied the Motion for PreliminaryInjunction without hearing oral argument. The Court also denied without prejudice various motions for summary judgment that we filed. During thediscovery process, TableMAX had made new allegations that certain of our Vegas Star® products infringe one of the patents in the Second Complaint. Wedeny these allegations and believe that these allegations are untrue. On January 15, 2010, TableMAX filed a Second Amended Complaint (the "ThirdComplaint") which has materially the same allegations as the Second Complaint, except that it now alleges that our Vegas Star® allegedly infringes all of thepatents in suit, which allegations we believe to be completely without merit. A document produced in the discovery process appears to limit TableMAX'sallegations of infringement regarding our Vegas Star® product to one of TableMAX's patents in suit.
17

The Court set the Markman hearing for December 15, 2010. On September 29, 2010, we filed a Motion to Stay pending the reexamination of all of thepatents in suit. On November 16, 2010, the Court granted our Motion to Stay and the case is presently stayed. We believe that the claim is entirely withoutmerit and we intend to vigorously defend this matter. Macau Rapid Baccarat® Patent Issue – On or about June 3, 2009, at the G2E Asia Gaming Show, customs officials from Macau SAR seized a RapidBaccarat® unit related to an alleged claim of patent infringement by a Macau patent owner. There is a possibility of future legal proceedings beingcommenced against our subsidiary, Shuffle Master Asia Limited (“SMAL”) and its directors in Macau relating to this patent, although, at this time, no suchproceedings have been commenced. Such proceedings, if initiated, would be for patent infringement, which is a criminal matter in Macau. On October 27,2009, the governmental official in charge of the investigation elected to dismiss the investigation based on a finding that no patent infringement existed basedupon the report of the Macau customs officials. In November 2010, the patent holder appealed this finding to the Macau Courts. On or about January 20,2010, over our objection, the judge considering the patent holder’s appeal found that his appeal was timely filed. The judge made no ruling on the patentholder’s appeal itself and thus no decision has yet been reached on whether a proceeding against our subsidiary SMAL will be opened. If the patent holder’sappeal to the Macau Courts is successful, then a criminal case for patent infringement against SMAL and its directors could be instituted. No proceedingagainst either SMAL or any of its directors has yet been commenced. On or about February 3, 2010, we filed an appeal (the “First SMAL Appeal”) to the judge’s decision of January 20, 2010 that the patent holder’s appeal wastimely. On or about March 4, 2010, the judge declined to forward the First SMAL Appeal to a higher Macau Court. We filed a further appeal (the “SecondSMAL Appeal”) to have the higher Macau court hear the First SMAL Appeal. On June 2, 2010 the Judge denied the patent holder’s request to open acriminal proceeding and decided that the investigation should remain dismissed against SMAL and its directors. The patent holder subsequently appealed theJune 2, 2010, decision to a higher Macau court. We believe that the claim is entirely without merit and we intend to defend this matter vigorously. Wright Matter – On November 7, 2009, Sam Wright was playing a Vegas Star® craps machine at the Harrah’s Casino New Orleans. Mr. Wright played agame that ended in a losing result. After the game concluded, as a result of a malfunction, a false credit meter value of approximately $42,000 appeared onthe machine. On April 26, 2010, we received notice for the first time that Mr. Wright had purported to file a patron dispute with the Louisiana State PoliceGaming Division. The purported patron dispute requests that Harrah’s New Orleans Casino and/or we acknowledge the gaming debt of $42,000 to Mr.Wright. If Mr. Wright is successful in this purported patron dispute, we may have potential indemnity obligations to Harrah’s New Orleans Casino in theamount of approximately $42,000 plus attorneys’ fees and costs or we may be liable directly to Mr. Wright for approximately $42,000.
On October 14, 2010, the Louisiana State Police Gaming Division concluded in regard to the patron dispute that there was no violation of state law, sectionrule or internal controls.
On November 5, 2010, Mr. Wright filed a Petition for Damages with the Civil District Court for the Parish of Orleans, State of Louisiana. The defendants inthe lawsuit are the Company, Jazz Casino Company, LLC d/b/a Harrah’s New Orleans Casino and Harrah’s New Orleans Management Company. ThePetition claims damages of approximately $43,000 plus possible treble damages, attorneys’ fees and costs. The Company may have potential indemnityobligations to defendants Jazz Casino Company, LLC d/b/a Harrah’s New Orleans Casino and Harrah’s New Orleans Management Company if a judgment isentered against these defendants. The Petition was served on us on January 11, 2011. On February 9, 2011, all defendants answered the Petition and removedthe case to the United States District Court for the Eastern District of Louisiana. We believe that the claim is entirely without merit and we intend to defendthis matter vigorously.
18

ITEM 2. MANAGEMENT’S DISCUSSION AND ANALYSIS OF FINANCIAL CONDITION AND RESULTS OF OPERATIONS (In thousands,except units/seats and per share amounts) Cautionary Statement for Purposes of “Safe Harbor Provisions” of the Private Securities Litigation Reform Act of 1995
There are statements herein that are forward-looking statements that are based on management’s beliefs, as well as on assumptions made by and informationavailable to management. We consider such statements to be made under the safe harbor created by the federal securities laws to which we are subject, and,other than as required by law, we assume no obligation to update or supplement such statements. These statements can be identified by the fact that they donot relate strictly to historical or current facts, and are based on management’s current beliefs and expectations about future events, as well as onassumptions made by and information currently available to management. These forward-looking statements include statements that reflect management’sbeliefs, plans, objectives, goals, expectations, anticipations and intentions with respect to our financial condition, results of operations, future performanceand business, including statements relating to our business strategy and our current and future development plans. When used in this report, words such as“anticipate,” “believe,” “estimate,” “expect,” “intend,” “project,” “plan,” “predict,” “might,” “may,” “could,” and similar expressions or the negativethereof, as they relate to us or our management, identify forward-looking statements. Factors that might cause such differences include, but are not limited to,those discussed in Part II, Item 1A, “Risk Factors.” The following discussion should be read in conjunction with “Item 8. Financial Statements andSupplementary Data” in the Annual Report on Form 10-K (“Form 10-K”) filed on January 13, 2011 and the Condensed Consolidated Financial Statementsand notes thereto included elsewhere in this Form 10-Q. All information presented herein is based on our fiscal calendar. Unless otherwise stated, referencesin this report to particular years or quarters refer to our fiscal years ended in October and the associated quarters of those fiscal years. We assume noobligation to revise or update any forward-looking statements for any reason, except as required by law. Overview We develop, manufacture and market technology and entertainment-based products for the gaming industry for placement on the casino floor. We specializein providing licensed casino operators and other users with products and services that improve their speed, profitability, productivity and security. Ourproducts are offered in highly regulated markets throughout the world. Our products are manufactured at our headquarters and manufacturing facility in LasVegas, Nevada, at our Australian headquarters in Milperra, New South Wales, Australia, as well as outsourced for certain sub-assemblies in the United States,Europe and Australasia.
Our business is segregated into the following four product segments: Utility, Proprietary Table Games (“PTG”), Electronic Table Systems (“ETS”) andElectronic Gaming Machines (“EGM”). Each segment's activities include the design, development, acquisition, manufacturing, marketing, distribution,installation and servicing of a distinct product line.
See Note 1 to our Condensed Consolidated Financial Statements for a more detailed discussion of our four segments. Strategy We believe we are enhancing our customer and shareholder value through our execution of the following strategic priorities:
• An unwavering commitment to create innovative solutions and services for casino operators and compelling gaming experiences for playersthrough enhanced customer centricity.
• Reinforce our true “strategic partner” relationships with our customers by providing enhanced efficiencies, security and profitability on the casinofloor. We will continue to work on developing innovative products that anticipate and respond to their needs.
• Maintain a cost-conscious mindset, promote a lean culture, and serve as prudent stewards of shareholder capital.
• Create long-term profitability and sustainability through our recurring revenue model. We have and will continue to invest capital in our leasebusiness to maximize our return and build on our economic engine.
• Foster the spirit of invention and the commitment to innovation that is at the heart of our success. With nearly 2,400 patents and trademarksgranted and pending, our pipeline for new intellectual property is robust. We believe our intellectual property collectively represents one of thestrongest portfolios in the industry and our success depends upon our ability to preserve and protect our core assets.
• Capitalize on emerging markets and the worldwide proliferation of gaming. A large part of our success in fiscal 2010 was turning opportunitiesinto achievements. As new markets continue to emerge across the globe and as existing gaming markets continue to evolve, we will be two stepsahead in making the most of every opportunity that arises.
• Sound balance sheet management will fuel growth and we will accomplish this in several ways:
o Internal organic growth through continued investment in our recurring revenue model, global intellectual property and R&D. This willprovide true growth on the Company’s top and bottom line without relying on the introduction of significant new markets.
o Continued examination of acquisitions. We are seeking opportunities that are accretive to earnings, have strong existing recurring
revenues, and merit our efforts of integration.
o Use of our financial resources to improve our return to shareholders through continued deleveraging.

19

• Promote and foster internal staff development, and deepen our bench strength. We know our success is directly attributable to the caliber of our
workforce and we remain committed to each and every employee’s development. We will continue to set the talent bar high.
• Drive margin improvement across all product categories. Our overall gross margin has shown continuous improvement over the past three fiscalyears. We will continue our process improvement initiatives and uncover greater operational efficiencies. Our overall gross margin increases aslease revenue rises. As we continue to grow these recurring revenues, we anticipate improved gross margins.
• Capitalize on opportunities created from existing online gaming markets and prepare ourselves for the potential legalization of internet gambling
in the U.S. The gaming landscape is quickly evolving and we will be proactive in ensuring we are a leading content-provider in this arena. Webelieve online gaming represents a significant opportunity for our future growth.
We are focused on our customers and on value-creation for our shareholders. We will maintain continuous improvement while keeping innovation at the coreof our success. We expect that with the continued execution of our strategic plan, our business will continue to grow in fiscal 2011.
Sources of Revenue We derive our revenue from the lease, license and sale of our products and by providing service to our leased and in some cases, previously sold units.Consistent with our strategy, we have a continuing emphasis on leasing or licensing our products. When we lease or license our products, we generallynegotiate month-to-month fixed fee contracts, or to a lesser extent, enter into participation arrangements whereby casinos pay us a fee based on a percentageof net win. Product lease contracts typically include parts and service. When we sell our products, we offer casinos a choice between a cash sale or to a lesserextent, long-term financing. We also offer a majority of our products for sale with an optional parts and service contract.
Currently, Utility segment revenue is derived substantially from our automatic card shufflers. In addition to leasing shufflers, we also sell and service them. Inthe PTG segment, the majority of games placed are licensed to our customers, which provides us with royalty revenue. In the ETS segment, we derive revenuefrom leases, sales and service contracts. In the EGM segment, we derive revenue from selling the full EGM complement, as well as game conversion kits.
The following points should be noted as they relate to each of our segments:
Utility
• We expect to continue increasing lease revenues in our Utility segment within the United States. One of the current growth drivers for this segmenthas been the Ace® shuffler replacement cycle. The i-Deal® shuffler is our next generation replacement for the Ace® specialty shuffler. As the Ace®
reaches its end of life where we cannot provide replacement parts, our strategy is to encourage our customers to replace the Ace® shufflers, bothleased and previously sold, with the i-Deal® shuffler. Approximately 80% of current i-Deal® shuffler placements (both sales and leases) have beendriven by the Ace® replacement cycle. The majority of these placements are leases.
• Our markets for shuffler lease and sale revenue have grown recently in the United States with the approval of live table gaming in severaljurisdictions such as Pennsylvania and Delaware.
• We expect to continue seeing volatility in sales revenue in our Utility segment outside the United States. While we encourage leasing outside theUnited States, a large majority of our international Utility product placements historically are sales. We are starting to see increased lease activityin international markets such as Australia, Asia and Latin America. Growth drivers for the Utility segment outside the United States are the newjurisdictional openings, such as the new openings in Singapore and the Philippines during fiscal 2010, as well as the expansion of existing marketssuch as Macau.
Proprietary Table Games
• Our lease model is strongest in our PTG segment with more than 90% of our total PTG revenue coming from royalties and leases. While we have astrong leasing presence in the United States, we are constantly looking to expand our proprietary table games in other parts of the world where thecurrent penetration of proprietary table games is lower. With the opening of new casino markets in Asia, we have recently seen some successeswith new lease placements of our premium table games as well as progressives and side bets.
• Although the majority of our PTG revenue comes from our premium table games, we also offer a number of progressive upgrades and sidebets. These products are available for our own proprietary table game titles as well as public domain games such as poker, blackjack, baccarat andpai gow poker. These progressives and side bets, offered almost exclusively through leases, are providing a growing share of our total PTGrevenue.
• We also aggressively pursue opportunities to place PTG products in new properties and jurisdictions in the United States. As noted above, severalstates have approved live table games over the past year, and we have seen significant placements of our table game products in those newjurisdictions.
20
Electronic Table Systems
• Although we continually pursue opportunities to increase lease revenues in our ETS segment within the United States, we have seen some of ourleased ETS products returned from those same markets as some states approve live table games. While this will cause some short-term setbacks inthe growth of our domestic ETS business, we have been able to return some of these products to service in other markets such as Mexico and SouthAmerica. However, the new placements are not yet performing to the same revenue and profitability levels as the units that were removed.
• Outside the United States, we continue to realize a large portion of our ETS revenues from sales rather than leases. Favorable regulatory changes inthe prior year in some Australian jurisdictions have allowed for significant placements of new Vegas Star® and Rapid Table Games® productsduring the current quarter. We have seen new opportunities for lease placements with the opening of new casino properties in Singapore in theprior year, and we intend to continue pursuing new lease placements whenever possible.
• During the current year we have begun generating revenue from placements of our new i-Table® product. We expect this product, which combinesan electronic betting interface with a live table game, to provide us with substantial growth opportunities as it achieves acceptance in the market.
Electronic Gaming Machines
• Our EGM segment is primarily a sales model and we expect to continue to realize substantially all of our EGM revenues from sales of EGMs in ourprimary market, Australia.
• Initial deliveries of Equinox™ began in July 2010, and we experienced record placements during the fourth quarter of fiscal 2010. We anticipatestrong demand in future periods as Equinox™ gains broader market acceptance and have seen this continue through the second quarter of 2011.
• A portion of our EGM revenue base comes from conversions of existing units to new game titles. We are continually developing new titles for ourexisting machines, and installation of these new titles provides us with an ongoing source of conversion revenue.
• In addition to our primary EGM market in Australia, we are pursuing opportunities for sales growth in Asia and Latin America.
Expenses Our direct expenses primarily include cost of products sold, depreciation of leased assets, and amortization of product-related intangible assets, service,manufacturing overhead, shipping and installation. Indirect expenses include other costs directly identified with each segment, such as R&D, productapproval costs, product-related litigation expenses, amortization of patents and other product-related intellectual property, sales commissions and otherdirectly-allocable sales expenses. We continue to expend significant R&D efforts on the development of our newer generation shuffler products, such as theMD2CR™ and one2six® Plus, our card recognition products, as well as other table accessories, such as the i-Shoe™ and i-Score™. With our expansion into thee-Table markets, we continue to spend significant R&D dollars on developing and implementing new gaming mediums, such as the i-Table®, our newest e-Table that combines a variety of our products to create an exciting new table game experience. We are also spending increased R&D dollars on the newEquinox™ EGM cabinets and related game content.
The amounts classified as unallocated corporate expenses consist primarily of costs related to overall corporate management and support functions. Theseinclude costs related to executive management, accounting and finance, general sales support, legal and compliance costs, office expenses and other amountsfor which allocation to specific segments is not practicable.
Gross Margin
The number and mix of products placed and the average lease or sales price are the most significant factors affecting our gross margins. Our continuingemphasis on leasing versus selling, the shift in product mix, timing of installations and related upfront installation charges, as well as changes in non-cashdepreciation and amortization expenses attributable to our acquisitions, impact our margins.
In general, lease gross margin is greater than the sales gross margin for the same products. However, total gross profit from leasing will be lower in a givenreporting period than those of a sale due to the much higher price of a sale versus a lease. A number of factors impact gross margins, including the numberand mix of products placed and the average lease or sales price of those products. For example, in our PTG segment, premium table games warrant a higheraverage lease price than a PTG add-on such as a felt side-bet or a progressive. For Utility products, when a new shuffler is introduced into the market, we useintroductory lease pricing. After the introductory pricing period expires, the price generally increases to the monthly “list” lease price, which we believe willincrease future revenues because most customers keep the products beyond the introductory pricing period. Accordingly, we anticipate that gross margins willincrease under our lease model.
21
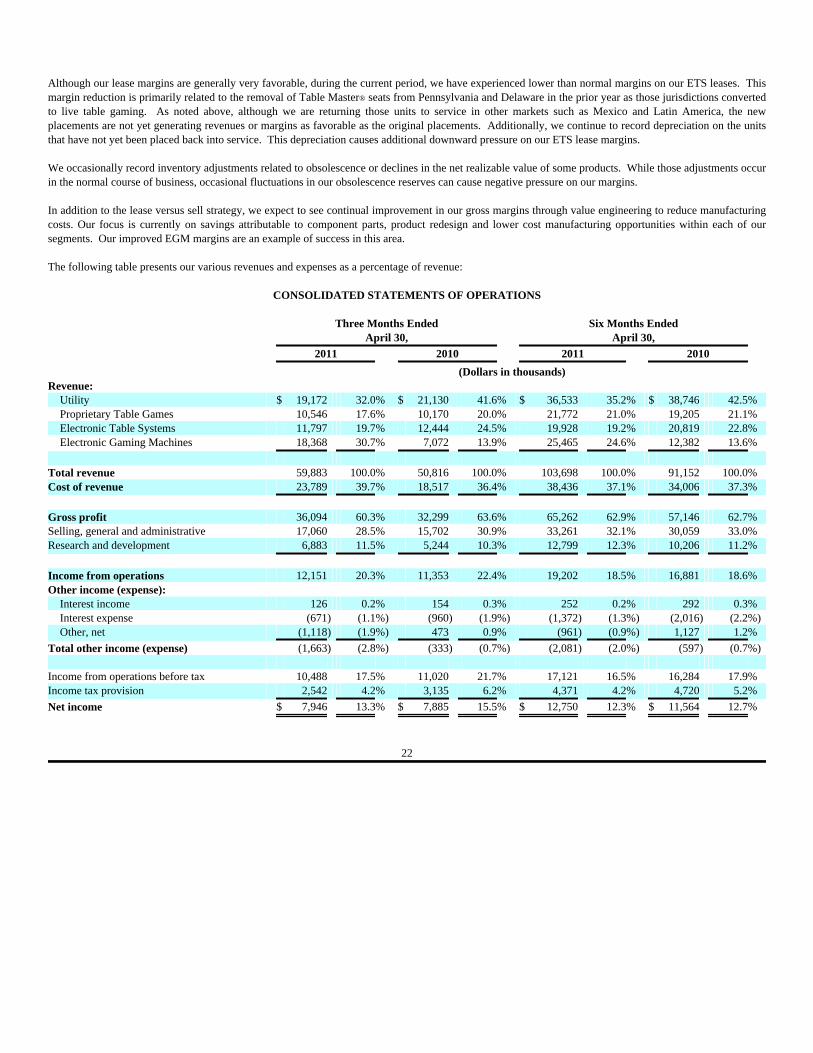
Although our lease margins are generally very favorable, during the current period, we have experienced lower than normal margins on our ETS leases. Thismargin reduction is primarily related to the removal of Table Master® seats from Pennsylvania and Delaware in the prior year as those jurisdictions convertedto live table gaming. As noted above, although we are returning those units to service in other markets such as Mexico and Latin America, the newplacements are not yet generating revenues or margins as favorable as the original placements. Additionally, we continue to record depreciation on the unitsthat have not yet been placed back into service. This depreciation causes additional downward pressure on our ETS lease margins.
We occasionally record inventory adjustments related to obsolescence or declines in the net realizable value of some products. While those adjustments occurin the normal course of business, occasional fluctuations in our obsolescence reserves can cause negative pressure on our margins.
In addition to the lease versus sell strategy, we expect to see continual improvement in our gross margins through value engineering to reduce manufacturingcosts. Our focus is currently on savings attributable to component parts, product redesign and lower cost manufacturing opportunities within each of oursegments. Our improved EGM margins are an example of success in this area.
The following table presents our various revenues and expenses as a percentage of revenue:
CONSOLIDATED STATEMENTS OF OPERATIONS
Three Months Ended Six Months Ended April 30, April 30,
2011 2010 2011 2010
(Dollars in thousands)
Revenue: Utility $ 19,172 32.0% $ 21,130 41.6% $ 36,533 35.2% $ 38,746 42.5%Proprietary Table Games 10,546 17.6% 10,170 20.0% 21,772 21.0% 19,205 21.1%Electronic Table Systems 11,797 19.7% 12,444 24.5% 19,928 19.2% 20,819 22.8%Electronic Gaming Machines 18,368 30.7% 7,072 13.9% 25,465 24.6% 12,382 13.6%
Total revenue 59,883 100.0% 50,816 100.0% 103,698 100.0% 91,152 100.0%Cost of revenue 23,789 39.7% 18,517 36.4% 38,436 37.1% 34,006 37.3%
Gross profit 36,094 60.3% 32,299 63.6% 65,262 62.9% 57,146 62.7%Selling, general and administrative 17,060 28.5% 15,702 30.9% 33,261 32.1% 30,059 33.0%Research and development 6,883 11.5% 5,244 10.3% 12,799 12.3% 10,206 11.2%
Income from operations 12,151 20.3% 11,353 22.4% 19,202 18.5% 16,881 18.6%Other income (expense):
Interest income 126 0.2% 154 0.3% 252 0.2% 292 0.3%Interest expense (671) (1.1%) (960) (1.9%) (1,372) (1.3%) (2,016) (2.2%)Other, net (1,118) (1.9%) 473 0.9% (961) (0.9%) 1,127 1.2%
Total other income (expense) (1,663) (2.8%) (333) (0.7%) (2,081) (2.0%) (597) (0.7%) Income from operations before tax 10,488 17.5% 11,020 21.7% 17,121 16.5% 16,284 17.9%Income tax provision 2,542 4.2% 3,135 6.2% 4,371 4.2% 4,720 5.2%
Net income $ 7,946 13.3% $ 7,885 15.5% $ 12,750 12.3% $ 11,564 12.7%
22
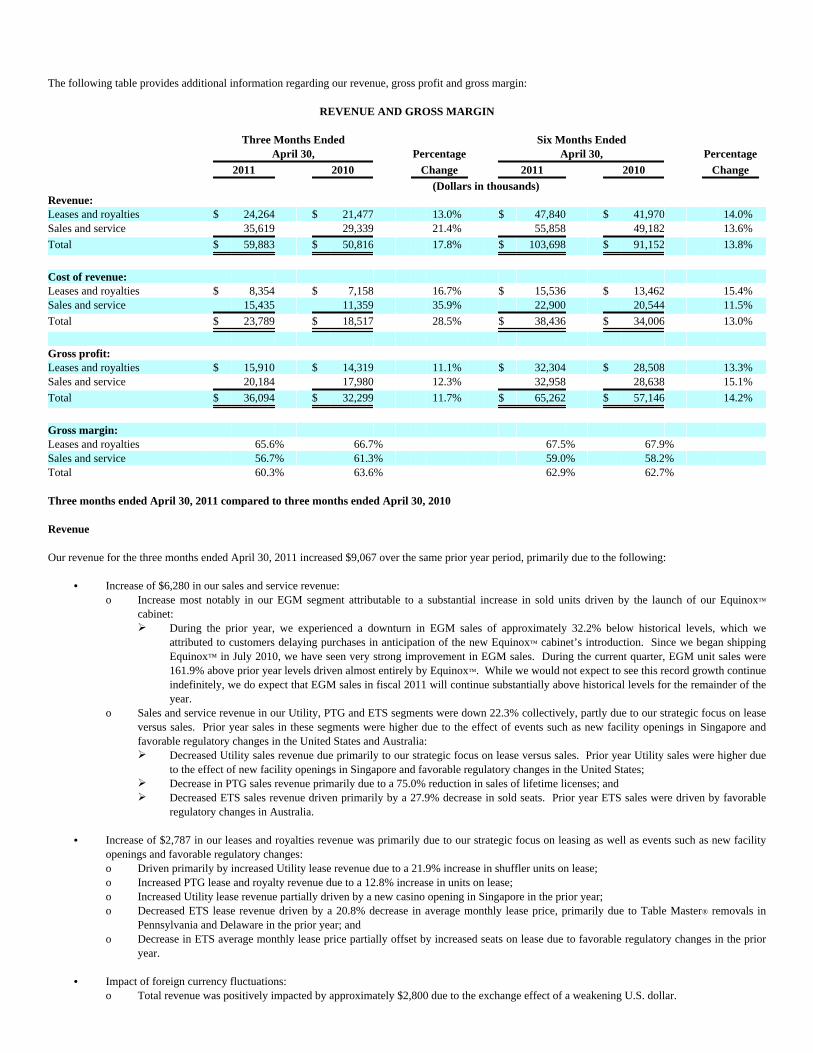
The following table provides additional information regarding our revenue, gross profit and gross margin:
REVENUE AND GROSS MARGIN
Three Months Ended Six Months Ended April 30, Percentage April 30, Percentage 2011 2010 Change 2011 2010 Change (Dollars in thousands) Revenue: Leases and royalties $ 24,264 $ 21,477 13.0% $ 47,840 $ 41,970 14.0% Sales and service 35,619 29,339 21.4% 55,858 49,182 13.6%
Total $ 59,883 $ 50,816 17.8% $ 103,698 $ 91,152 13.8%
Cost of revenue: Leases and royalties $ 8,354 $ 7,158 16.7% $ 15,536 $ 13,462 15.4% Sales and service 15,435 11,359 35.9% 22,900 20,544 11.5%
Total $ 23,789 $ 18,517 28.5% $ 38,436 $ 34,006 13.0%
Gross profit: Leases and royalties $ 15,910 $ 14,319 11.1% $ 32,304 $ 28,508 13.3% Sales and service 20,184 17,980 12.3% 32,958 28,638 15.1%
Total $ 36,094 $ 32,299 11.7% $ 65,262 $ 57,146 14.2%
Gross margin: Leases and royalties 65.6% 66.7% 67.5% 67.9% Sales and service 56.7% 61.3% 59.0% 58.2% Total 60.3% 63.6% 62.9% 62.7%
Three months ended April 30, 2011 compared to three months ended April 30, 2010
Revenue
Our revenue for the three months ended April 30, 2011 increased $9,067 over the same prior year period, primarily due to the following:
• Increase of $6,280 in our sales and service revenue: o Increase most notably in our EGM segment attributable to a substantial increase in sold units driven by the launch of our Equinox™
cabinet: Ø During the prior year, we experienced a downturn in EGM sales of approximately 32.2% below historical levels, which we
attributed to customers delaying purchases in anticipation of the new Equinox™ cabinet’s introduction. Since we began shippingEquinox™ in July 2010, we have seen very strong improvement in EGM sales. During the current quarter, EGM unit sales were161.9% above prior year levels driven almost entirely by Equinox™. While we would not expect to see this record growth continueindefinitely, we do expect that EGM sales in fiscal 2011 will continue substantially above historical levels for the remainder of theyear.
o Sales and service revenue in our Utility, PTG and ETS segments were down 22.3% collectively, partly due to our strategic focus on leaseversus sales. Prior year sales in these segments were higher due to the effect of events such as new facility openings in Singapore andfavorable regulatory changes in the United States and Australia:
Ø Decreased Utility sales revenue due primarily to our strategic focus on lease versus sales. Prior year Utility sales were higher dueto the effect of new facility openings in Singapore and favorable regulatory changes in the United States;
Ø Decrease in PTG sales revenue primarily due to a 75.0% reduction in sales of lifetime licenses; and Ø Decreased ETS sales revenue driven primarily by a 27.9% decrease in sold seats. Prior year ETS sales were driven by favorable
regulatory changes in Australia. • Increase of $2,787 in our leases and royalties revenue was primarily due to our strategic focus on leasing as well as events such as new facility
openings and favorable regulatory changes: o Driven primarily by increased Utility lease revenue due to a 21.9% increase in shuffler units on lease; o Increased PTG lease and royalty revenue due to a 12.8% increase in units on lease; o Increased Utility lease revenue partially driven by a new casino opening in Singapore in the prior year; o Decreased ETS lease revenue driven by a 20.8% decrease in average monthly lease price, primarily due to Table Master® removals in
Pennsylvania and Delaware in the prior year; and o Decrease in ETS average monthly lease price partially offset by increased seats on lease due to favorable regulatory changes in the prior
year. • Impact of foreign currency fluctuations: o Total revenue was positively impacted by approximately $2,800 due to the exchange effect of a weakening U.S. dollar.

23

Gross margin
Our gross margin for the three months ended April 30, 2011 decreased 330 basis points ("bps") to 60.3% as compared to the same prior year period, reflectingthe following:
• Decreased segment margin performance: o ETS was unfavorably impacted by reductions in average monthly lease prices and number of units sold. Sales in the prior year included
several large placements of Vegas Star® and Rapid Tables Games® seats in Australia at favorable margins; o Utility was unfavorably impacted by reduced number of units sold; and o PTG was favorably impacted by reduced costs related to prior year write-off of certain intangibles and related hardware. • Partially offset by improved EGM margins due to increases in average sales prices and reductions in manufacturing costs for our new Equinox™
cabinet. Prior year sales were composed entirely of eStar™ cabinets, which had a higher production cost and lower margin thanEquinox™. Current year sales are composed of approximately 90% Equinox™ cabinets.
• Impact of foreign currency fluctuations: o Total gross profit was positively impacted by approximately $1,200 due to the exchange effect of a weakening U.S. dollar. Six months ended April 30, 2011 compared to six months ended April 30, 2010
Our revenue for the six months ended April 30, 2011 increased $12,546 over the same prior year period, primarily due to the following:
• Increase in our sales and service revenue: o Increase most notably in our EGM segment driven by a substantial increase in sold units driven by the launch of our Equinox™ cabinet: Ø During the prior year, we experienced a downturn in EGM sales of approximately 22.0% below historical levels, which we
attributed to customers delaying purchases in anticipation of the new Equinox™ cabinet’s introduction. Since we began shippingEquinox™ in July 2010, we have seen very strong improvement in EGM sales. During the current quarter, EGM unit sales were119.7% above prior year levels driven almost entirely by Equinox™. While we would not expect to see this record growth continueindefinitely, we do expect that EGM sales in fiscal 2011 will continue substantially above historical levels for the remainder of theyear.
o Sales and service revenue in our Utility, PTG and ETS segments were down 17.1% collectively, partly due to our strategic focus on leaseversus sales. Prior year sales in these segments were higher due to the effect of events such as new facility openings in Singapore andfavorable regulatory changes in the United States and Australia:
Ø Decreased Utility sales revenue due primarily to our continued strategic focus on lease versus sales. Prior year Utility sales werehigh due to the effect of new facility openings in Singapore and favorable regulatory changes in the United States; and
Ø Decrease in ETS sales revenue driven by a 20.5% decrease in sold seats. Prior year ETS sales were driven by favorable regulatorychanges in Australia.
• Increase of $5,870 in our leases and royalties revenue was primarily due to our strategic focus on leasing as well as events such as new facility
openings and favorable regulatory changes: o Driven primarily by increased Utility lease revenue due to a 21.9% increase in shuffler units on lease; o Increased PTG lease and royalty revenue due to a 12.8% increase in units on lease; o Increased Utility lease revenue partially driven by new casino opening in Singapore in the prior year; o Decreased ETS lease revenue driven by a 21.6% reduction in average monthly lease price, primarily due to Table Master® removals in
Pennsylvania and Delaware in the prior year; and o Decrease in ETS average monthly lease price partially offset by increased seats on lease due to favorable regulatory changes in the prior
year. • Impact of foreign currency fluctuations: o Total revenue was positively impacted by approximately $3,500 due to the exchange effect of a weakening U.S. dollar. Gross margin Our gross margin for the six months ended April 30, 2011 increased 20 bps to 62.9% as compared to the same prior year period, reflecting the following: • Increased segment margin performance: o Improved EGM margins due to increases in average sales prices and reductions in manufacturing costs; o ETS was unfavorably impacted by reductions in average monthly lease prices and number of units sold. Sales in the prior year included
several large placements of Vegas Star® and Rapid Tables Games® seats in Australia at favorable margins; o Utility was unfavorably impacted by a reduced number of units sold; and o PTG was favorably impacted by reduced costs related to prior year write-off of certain intangibles and related hardware. • Impact of foreign currency fluctuations: o Total gross profit was positively impacted by approximately $2,100 due to the exchange effect of a weakening U.S. dollar.

24

The following table provides additional information regarding our operating expenses:
OPERATING EXPENSES
Three Months Ended Six Months Ended April 30, Percentage April 30, Percentage 2011 2010 Change 2011 2010 Change (Dollars in thousands) Selling, general and administrative $ 17,060 $ 15,702 8.6% $ 33,261 $ 30,059 10.7%
Percentage of revenue 28.5% 30.9% 32.1% 33.0% Research and development $ 6,883 $ 5,244 31.3% $ 12,799 $ 10,206 25.4%
Percentage of revenue 11.5% 10.3% 12.3% 11.2% Total operating expenses $ 23,943 $ 20,946 14.3% $ 46,060 $ 40,265 14.4%
Percentage of revenue 40.0% 41.2% 44.4% 44.2%
Three months ended April 30, 2011 compared to three months ended April 30, 2010
Selling, general & administrative (“SG&A”) expenses:
SG&A expenses increased $1,358 for the three months ended April 30, 2011, as compared to the same prior year period. This increase primarily reflects thefollowing:
• Patents and trademark expenses: o Increase of approximately $680 in trademark, copyright and patent expenses related to new products and expansion into new markets. • Impact of foreign currency fluctuations: o Net increase of approximately $570 at our foreign subsidiaries due to the exchange effect of a weakening U.S. dollar. • Office expense: o Increase in depreciation expense of approximately $300 driven by improvements to our information technology infrastructure during the
prior year. Research & development (“R&D”) expenses:
R&D expenses increased $1,639 for the three months ended April 30, 2011, as compared to the same prior year period. This increase primarily reflects thefollowing:
• Impact of foreign currency fluctuations: o Net increase of approximately $440 at our foreign subsidiaries due to the exchange effect of a weakening of U.S. dollar.
The following projects have been the focus of our R&D efforts during the three months ended April 30, 2011:
• EGM: o Additional R&D efforts were spent on developing additional EGM games for the new Equinox™ cabinet and to support ongoing business
growth and demand for new games. • ETS: o Expenses primarily related to the further development of the i-Table® and Rapid Table Games®, including the development of proprietary
titles for our i-Table® and i-Table Roulette™. • Utility: o Expenses primarily related to development of the next generation MD2® shuffler, the MD2CR™, as well as continuing development of our
other Utility products. • PTG: o Ongoing enhancements to the successful progressive offering to our table game titles.
25

We believe that one of our strengths is identifying new product opportunities, developing new products and refining current products. We expect our R&Dexpense as a percentage of revenue to remain at current levels.
Six months ended April 30, 2011 compared to six months ended April 30, 2010 SG&A expenses: SG&A expenses increased $3,202 for the six months ended April 30, 2011, as compared to the same prior year period. This increase primarily reflects thefollowing: • Sales and profit-driven compensation expense: o Increase of approximately $980 in compensation and related expenses driven by improved revenue and profitability at our United States,
Australian and Macau locations. • Patents and trademark expenses: o Increase of approximately $890 in trademark, copyright and patent expenses related to new products and expansion into new markets. • Impact of foreign currency fluctuations: o Net increase of approximately $810 at our foreign subsidiaries due to the exchange effect of a weakening of U.S. dollar. • Office expense: o Increase in depreciation expense of approximately $600 driven by improvements to our information technology infrastructure during the
prior year.
R&D expenses:
R&D expenses increased $2,593 for the six months ended April 30, 2011, as compared to the same prior year period. This increase primarily reflects thefollowing:
• Impact of foreign currency fluctuations: o Net increase of approximately $700 at our foreign subsidiaries due to the exchange effect of a weakening of U.S. dollar. The following projects have been the focus of our R&D efforts during the six months ended April 30, 2011:
• EGM: o Additional R&D efforts were spent on developing additional EGM games for the new Equinox™ cabinets and to support ongoing business
growth. • ETS: o Expenses primarily related to the further development of the i-Table® and Rapid Table Games®, including the development of proprietary
titles for our i-Table® and i-Table Roulette™. • Utility: o Expenses primarily related to development of the next generation MD2® shuffler, the MD2CR™, as well as continuing development of our
other Utility products. • PTG: o Ongoing enhancements to the successful progressive offering to our table game titles.
26

The following table provides additional information regarding our depreciation and amortization expenses:
DEPRECIATION AND AMORTIZATION EXPENSES
Three Months Ended Six Months Ended April 30, Percentage April 30, Percentage
2011 2010 Change 2011 2010 Change
(Dollars in thousands) Gross margin:
Depreciation $ 2,597 $ 2,304 12.7% $ 5,007 $ 4,459 12.3% Amortization 1,722 2,173 (20.8%) 3,349 4,774 (29.8%)
Total 4,319 4,477 (3.5%) 8,356 9,233 (9.5%) Operating expenses:
Depreciation 1,017 663 53.4% 1,990 1,363 46.0% Amortization 779 685 13.7% 1,530 1,354 13.0%
Total 1,796 1,348 33.2% 3,520 2,717 29.6% Total:
Depreciation 3,614 2,967 21.8% 6,997 5,822 20.2% Amortization 2,501 2,858 (12.5%) 4,879 6,128 (20.4%)
Total $ 6,115 $ 5,825 5.0% $ 11,876 $ 11,950 (0.6%)
Depreciation expense is primarily comprised of depreciation associated with products leased and held for lease and to a lesser extent depreciation of property,plant and equipment. Amortization expense is primarily comprised of amortization associated with intellectual property, acquired developed technology andcustomer relationships.
Three months ended April 30, 2011 compared to three months ended April 30, 2010
Total depreciation and amortization included in gross margin decreased 3.5% in the three months ended April 30, 2011, as compared to the same prior yearperiod. Increased depreciation in gross margin is attributable to increases in leased assets. Decreased amortization in gross margin is due to reducedamortization of intangible assets in our Utility segment as the underlying intangible assets reached the end of their estimated useful lives.
Total depreciation and amortization included in operating expenses increased 33.2% in the three months ended April 30, 2011, as compared to the same prioryear period. Increased depreciation related to additions of property, plant and equipment in the normal course of business. The increase in amortizationexpense relates primarily to amortization of the intellectual property acquired from Newton.
Six months ended April 30, 2011 compared to six months ended April 30, 2010
Total depreciation and amortization included in gross margin decreased 9.5% in the six months ended April 30, 2011, as compared to the same prior yearperiod. Increased depreciation in gross margin is attributable to increases in leased assets. Decreased amortization in gross margin is due to reducedamortization of intangible assets in our Utility, ETS and EGM segments as the underlying intangible assets reached the end of their estimated useful lives.
Total depreciation and amortization included in operating expenses increased 29.6% in the six months ended April 30, 2011, as compared to the same prioryear period. Increased depreciation related to additions of property, plant and equipment in the normal course of business. The increase in amortizationexpense relates primarily to amortization of the intellectual property acquired from Newton.
27

SEGMENT OPERATING RESULTS
Utility Segment Operating Results
Three months ended April 30, 2011 compared to three months ended April 30, 2010 Three Months Ended April 30, Increase Percentage
2011 2010 (Decrease) Change
(In thousands, except for units/seats and per unit/seat amounts) Utility Segment Revenue: Lease $ 10,275 $ 8,295 $ 1,980 23.9%
Sales - Shuffler 5,252 9,183 (3,931) (42.8)Sales - Chipper 360 543 (183) (33.7)Service 1,684 1,751 (67) (3.8)Other 1,601 1,358 243 17.9
Total sales and service 8,897 12,835 (3,938) (30.7)
Total Utility segment revenue $ 19,172 $ 21,130 $ (1,958) (9.3%)
Utility segment gross profit $ 11,584 $ 12,886 $ (1,302) (10.1%)Utility segment gross margin 60.4% 61.0% Utility segment operating income $ 9,858 $ 11,242 $ (1,384) (12.3%)Utility segment operating margin 51.4% 53.2% Shuffler unit information: Lease units, end of quarter 7,391 6,062 1,329 21.9%Average monthly lease price $ 463 $ 456 $ 7 1.5% Sold units during the period 355 674 (319) (47.3%)Average sales price $ 14,794 $ 13,625 $ 1,169 8.6% Chipper unit information: Lease units, end of quarter 200 125 75 60.0% Sold during quarter 18 25 (7) (28.0%)Average sales price $ 20,000 $ 21,720 $ (1,720) (7.9%) Our Utility segment revenue for the three months ended April 30, 2011 decreased $1,958 as compared to the same prior year period, primarily due to thefollowing: • A 42.8% decrease in shuffler sales revenue: o A decrease of 47.3% in the number of units sold, driven primarily by our strategic focus on leasing versus sales. The prior year period
also included a large sale of shufflers related to the opening of a new casino in Singapore; and o Partially offset by an 8.6% increase in average sales price, driven primarily by increases on MD2® and one2six® shufflers. • A 33.7% decrease in chipper sales revenue: o A decrease of 28.0% in the number of units sold, also reflecting the focus on leasing versus sales; and o A 7.9% decrease in the average sale price of units sold. These decreases were offset by: • A 23.9% increase in lease revenue: o An increase in the number of units on lease, driven primarily by our focus on leasing versus sales, and partly by new lease placements in
Singapore and the Philippines in the prior year. We are starting to see increased lease activity in international markets such as Asia andLatin America; and
o Lease placements in the United States continue to be enhanced by the Ace® shuffler replacement cycle: Ø The i-Deal® shuffler is our next generation replacement for the Ace® specialty shuffler. As the Ace® reaches its end of life where
we cannot provide replacement parts, our strategy is to encourage our customers to replace the Ace® shufflers (both leased andsold) with the i-Deal® shuffler. The Ace® shuffler replacement cycle is beginning to slow down as we exhaust the supply of Ace®
units available to be replaced.

28

• A 17.9% increase in other Utility revenue: o Driven primarily by increased sales of parts and peripherals and i-Shoe™ Auto and i-Score™ products. Utility gross profit decreased 10.1% for the three months ended April 30, 2011, as compared to the same prior year period. Utility gross margin also decreased60 bps to 60.4% for the three months ended April 30, 2011, as compared to the same prior year period. The decreases in gross profit and gross margin primarily relate to the following: • The overall decrease in total revenues as noted above; and • Partially offset by a decrease in non-cash charges•a reduction of approximately $410 in amortization expense associated with the one2six®
shuffler and Easy Chipper C® as the underlying intangible assets approach the end of their original estimated lives. Utility operating income decreased 12.3% for the three months ended April 30, 2011, as compared to the same prior year period. Utility margin also decreased180 bps to 51.4% for the three months ended April 30, 2011, as compared to the same prior year period. The decreases in operating income and operatingmargin primarily relate to the following: • The overall decreases in gross profits as discussed above.
29

Six months ended April 30, 2011 compared to six months ended April 30, 2010 Six Months Ended April 30, Increase Percentage 2011 2010 (Decrease) Change (In thousands, except for units/seats and per unit/seat amounts) Utility Segment Revenue: Lease $ 20,281 $ 16,241 $ 4,040 24.9%
Sales - Shuffler 9,692 15,812 (6,120) (38.7)Sales - Chipper 473 1,079 (606) (56.2)Service 3,312 3,496 (184) (5.3)Other 2,775 2,118 657 31.0
Total sales and service 16,252 22,505 (6,253) (27.8)
Total Utility segment revenue $ 36,533 $ 38,746 $ (2,213) (5.7%)
Utility segment gross profit $ 22,432 $ 23,591 $ (1,159) (4.9%)Utility segment gross margin 61.4% 60.9% Utility segment operating income $ 19,086 $ 20,145 $ (1,059) (5.3%)Utility segment operating margin 52.2% 52.0% Shuffler unit information: Lease units, end of period 7,391 6,062 1,329 21.9%Average monthly lease price $ 457 $ 447 $ 10 2.2% Sold units during the period 619 1,127 (508) (45.1%)Average sales price $ 15,658 $ 14,030 $ 1,628 11.6% Chipper unit information: Lease units, end of period 200 125 75 60.0% Sold during period 23 42 (19) (45.2%)Average sales price $ 20,565 $ 25,690 $ (5,125) (19.9%) Our Utility segment revenue for the six months ended April 30, 2011 decreased $2,213 as compared to the same prior year period, primarily due to thefollowing: • A 38.7% decrease in shuffler sales revenue: o A decrease of 45.1% in the number of units sold, driven primarily by our strategic focus on leasing versus sales. The prior year period
also included a large sale of shufflers related to the opening of a new casino in Singapore; and o Partially offset by a 11.6% increase in average sales price, driven primarily by increases on MD2® and one2six® shufflers. • A 56.2% decrease in chipper sales revenue: o A decrease of 45.2% in the number of units sold, also reflecting the focus on leasing versus sales; and o A 19.9% decrease in the average sale price of units sold. The prior year period included several sales of Chipmaster™ units, which have a
higher average sales price than our Easy Chipper® units. These decreases were offset by: • A 24.9% increase in lease revenue: o An increase in the number of units on lease, driven primarily by our focus on leasing versus sales, and partly by new lease placements in
Singapore and the Philippines in the prior year. We are starting to see increased lease activity in international markets such as Asia andLatin America; and
o Lease placements in the United States continue to be enhanced by the Ace® shuffler replacement cycle: Ø The i-Deal® shuffler is our next generation replacement for the Ace® specialty shuffler. As the Ace® reaches its end of life where
we cannot provide replacement parts, our strategy is to encourage our customers to replace the Ace® shufflers (both leased andsold) with the i-Deal® shuffler. Current year i-Deal® placements totaled approximately 490 units, leading to a net revenue increaseof approximately $1,330.
• A 31.0% increase in other Utility revenue: o Driven primarily by increased sales of i-Shoe™ Auto and i-Score™ products.

30

Utility gross profit decreased 4.9% for the six months ended April 30, 2011, as compared to the same prior year period. Utility gross margin increased 50 bpsto 61.4% for the six months ended April 30, 2011, as compared to the same prior year period. The decrease in gross profit primarily relate to the following: • The overall decrease in total revenues as noted above; and • Partially offset by a decrease in non-cash charges•a reduction of approximately $910 in amortization expense associated with the one2six®
shuffler and Easy Chipper C® as the underlying intangible assets approach the end of their original estimated lives. The increase in gross margin primarily relates to: • The increases in shuffler average monthly lease and average sale prices; and • The decrease in non-cash charges noted above. Utility operating income decreased 5.3% for the six months ended April 30, 2011, as compared to the same prior year period, although Utility operatingmargin remained relatively flat. The decrease in operating income primarily relate to the following: • The overall decrease in gross profits as discussed above.
31

Proprietary Table Games Segment Operating Results
Three months ended April 30, 2011 compared to three months ended April 30, 2010 Three Months Ended April 30, Increase Percentage 2011 2010 (Decrease) Change (In thousands, except for units/seats and per unit/seat amounts) PTG segment revenue: Royalties and leases $ 10,370 $ 9,228 $ 1,142 12.4%
Sales 73 854 (781) (91.5)Service 30 30 - - Other 73 58 15 25.9
Total sales and service revenue 176 942 (766) (81.3)
Total PTG segment revenue $ 10,546 $ 10,170 $ 376 3.7%
PTG segment gross profit $ 8,405 $ 7,715 $ 690 8.9%PTG segment gross margin 79.7% 75.9% PTG segment operating income $ 7,385 $ 7,148 $ 237 3.3%PTG segment operating margin 70.0% 70.3% PTG unit information:
Premium units, end of quarter 2,425 2,288 137 6.0% Side bet units, end of quarter 1,935 1,769 166 9.4% Progressive units, end of quarter 724 513 211 41.1% Add-on units, end of quarter 155 74 81 109.5%
Total revenue generating lease base 5,239 4,644 595 12.8%
Average monthly lease/license price $ 660 $ 662 $ (2) (0.3%) Sold during quarter 6 24 (18) (75.0%)Average sales price $ 12,167 $ 35,583 $ 23,416 65.8%
Total PTG segment revenue increased $376 for the three months ended April 30, 2011, as compared to the same prior year period. The PTG segment revenueincrease was primarily due to the following: • A 12.4% increase in royalties and leases revenue: o Increased placements of premium table games, progressive units and side bets in the United States, primarily Ultimate Texas Hold ‘em®,
Mississippi Stud®, Blackjack Switch®, Dragon Bonus® and Three Card Poker Progressive®. These placements were largely driven byfavorable regulatory changes in Pennsylvania and Delaware that took effect during the prior fiscal year; and
o New placements of premium table games and progressives in Singapore drove increased revenues of approximately $200. • Partially offset by a 91.5% decrease in PTG sales revenue: o Driven by a 75.0% decrease in sold units. The prior year period included conversions of leased to sold lifetime licenses of premium table
games in the United States, primarily Three Card Poker® and Let it Ride Bonus®. PTG gross profit increased 8.9% for the three months ended April 30, 2011, as compared to the same prior year period. PTG gross margin also increased 380bps, to 79.7% for the three months ended April 30, 2011, as compared to the same prior year period. The increases in gross profit and gross margin primarilyrelated to the following: • The overall increase in total revenues; and • The prior year period included the write-off of certain intangible licenses and related equipment totaling approximately $500. PTG operating income increased 3.3% year over year, although operating margin remained relatively flat. The increase in operating income primarily relatedto the following: • The overall increase in gross profit; and • Partially offset by an increase in amortization of intangible assets.

32

Six months ended April 30, 2011 compared to six months ended April 30, 2010 Six Months Ended April 30, Increase Percentage 2011 2010 (Decrease) Change (In thousands, except for units/seats and per unit/seat amounts) PTG segment revenue: Royalties and leases $ 20,661 $ 18,110 $ 2,551 14.1%
Sales 894 879 15 1.7 Service 57 72 (15) (20.8)Other 160 144 16 11.1
Total sales and service revenue 1,111 1,095 16 1.5
Total PTG segment revenue $ 21,772 $ 19,205 $ 2,567 13.4%
PTG segment gross profit $ 17,667 $ 15,252 $ 2,415 15.8%PTG segment gross margin 81.1% 79.4% PTG segment operating income $ 15,760 $ 14,078 $ 1,682 11.9%PTG segment operating margin 72.4% 73.3% PTG unit information:
Premium units, end of period 2,425 2,288 137 6.0% Side bet units, end of period 1,935 1,769 166 9.4% Progressive units, end of period 724 513 211 41.1% Add-on units, end of period 155 74 81 109.5%
Total revenue generating lease base 5,239 4,644 595 12.8%
Average monthly lease/license price $ 657 $ 650 $ 7 1.1% Sold during period 19 26 (7) (26.9%)Average sales price $ 47,053 $ 33,808 $ 13,245 39.2% Total PTG segment revenue increased $2,567 for the six months ended April 30, 2011, as compared to the same prior year period. The PTG segment revenueincrease was primarily due to the following: • A 14.1% increase in royalties and leases revenue: o Increased placements of premium table games, progressive units and side bets in the United States, primarily Ultimate Texas Hold ‘em®,
Mississippi Stud®, Blackjack Switch®, Dragon Bonus® and Three Card Poker Progressive®. These placements were largely driven byfavorable regulatory changes in Pennsylvania and Delaware that took effect during the prior fiscal year; and
o New placements of premium table games and progressives in Singapore drove increased revenues of approximately $400. • Increase in PTG sales revenue: o Driven by placements of premium table games in the United States, primarily Three Card Poker® and Let it Ride Bonus® lifetime licenses
related to a new casino opening in Las Vegas in the first quarter. PTG gross profit increased 15.8% for the six months ended April 30, 2011, as compared to the same prior year period. PTG gross margin also increased 170bps, to 81.1% for the six months ended April 30, 2011, as compared to the same prior year period. The increases in gross profit and gross margin primarilyrelated to the following: • The overall increase in total revenues; and • The prior year period included the write-off of certain intangible licenses and related equipment totaling approximately $500. PTG operating income increased 11.9% year over year, although operating margin decreased 90 bps to 72.4% as compared to the same prior year period. Theincrease in operating income primarily related to the following: • The increase in gross profit referred to above. The decrease in operating margin is primarily related to the following: • Increase in amortization of intangible assets.

33
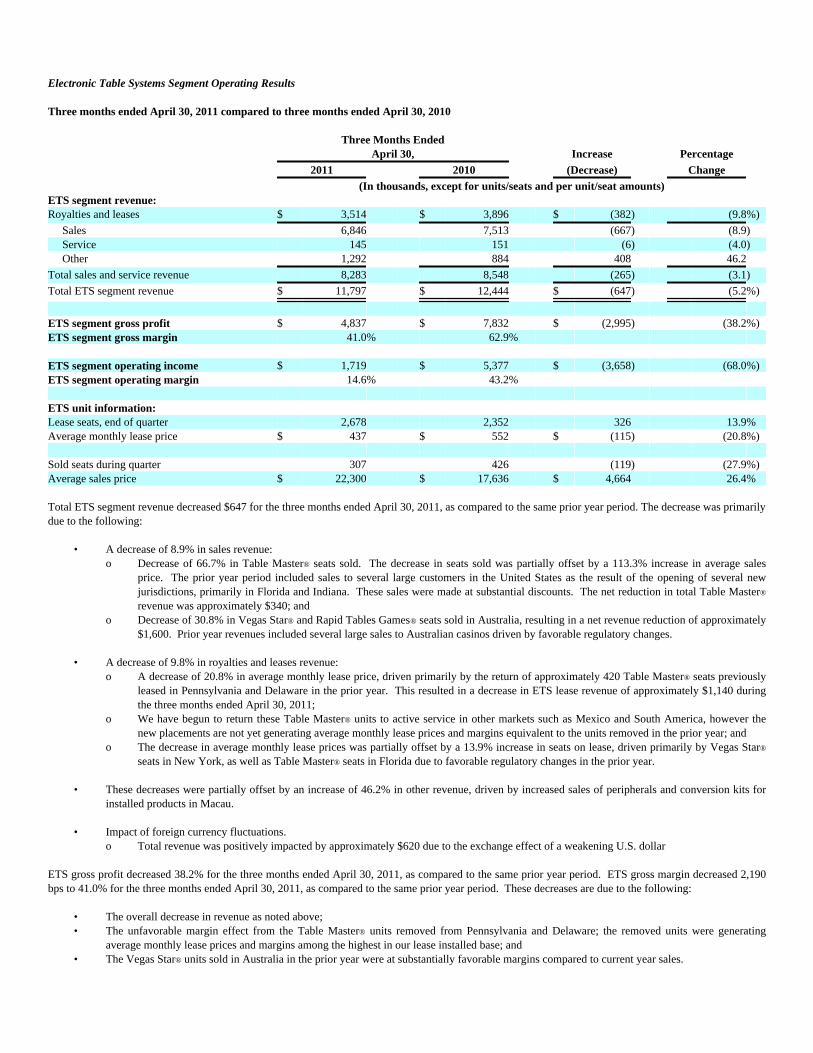
Electronic Table Systems Segment Operating Results
Three months ended April 30, 2011 compared to three months ended April 30, 2010 Three Months Ended April 30, Increase Percentage 2011 2010 (Decrease) Change (In thousands, except for units/seats and per unit/seat amounts) ETS segment revenue: Royalties and leases $ 3,514 $ 3,896 $ (382) (9.8%)
Sales 6,846 7,513 (667) (8.9)Service 145 151 (6) (4.0)Other 1,292 884 408 46.2
Total sales and service revenue 8,283 8,548 (265) (3.1)
Total ETS segment revenue $ 11,797 $ 12,444 $ (647) (5.2%)
ETS segment gross profit $ 4,837 $ 7,832 $ (2,995) (38.2%)ETS segment gross margin 41.0% 62.9% ETS segment operating income $ 1,719 $ 5,377 $ (3,658) (68.0%)ETS segment operating margin 14.6% 43.2% ETS unit information: Lease seats, end of quarter 2,678 2,352 326 13.9%Average monthly lease price $ 437 $ 552 $ (115) (20.8%) Sold seats during quarter 307 426 (119) (27.9%)Average sales price $ 22,300 $ 17,636 $ 4,664 26.4% Total ETS segment revenue decreased $647 for the three months ended April 30, 2011, as compared to the same prior year period. The decrease was primarilydue to the following: • A decrease of 8.9% in sales revenue: o Decrease of 66.7% in Table Master® seats sold. The decrease in seats sold was partially offset by a 113.3% increase in average sales
price. The prior year period included sales to several large customers in the United States as the result of the opening of several newjurisdictions, primarily in Florida and Indiana. These sales were made at substantial discounts. The net reduction in total Table Master®
revenue was approximately $340; and o Decrease of 30.8% in Vegas Star® and Rapid Tables Games® seats sold in Australia, resulting in a net revenue reduction of approximately
$1,600. Prior year revenues included several large sales to Australian casinos driven by favorable regulatory changes. • A decrease of 9.8% in royalties and leases revenue: o A decrease of 20.8% in average monthly lease price, driven primarily by the return of approximately 420 Table Master® seats previously
leased in Pennsylvania and Delaware in the prior year. This resulted in a decrease in ETS lease revenue of approximately $1,140 duringthe three months ended April 30, 2011;
o We have begun to return these Table Master® units to active service in other markets such as Mexico and South America, however thenew placements are not yet generating average monthly lease prices and margins equivalent to the units removed in the prior year; and
o The decrease in average monthly lease prices was partially offset by a 13.9% increase in seats on lease, driven primarily by Vegas Star®
seats in New York, as well as Table Master® seats in Florida due to favorable regulatory changes in the prior year. • These decreases were partially offset by an increase of 46.2% in other revenue, driven by increased sales of peripherals and conversion kits for
installed products in Macau. • Impact of foreign currency fluctuations. o Total revenue was positively impacted by approximately $620 due to the exchange effect of a weakening U.S. dollar ETS gross profit decreased 38.2% for the three months ended April 30, 2011, as compared to the same prior year period. ETS gross margin decreased 2,190bps to 41.0% for the three months ended April 30, 2011, as compared to the same prior year period. These decreases are due to the following: • The overall decrease in revenue as noted above; • The unfavorable margin effect from the Table Master® units removed from Pennsylvania and Delaware; the removed units were generating
average monthly lease prices and margins among the highest in our lease installed base; and • The Vegas Star® units sold in Australia in the prior year were at substantially favorable margins compared to current year sales.

34
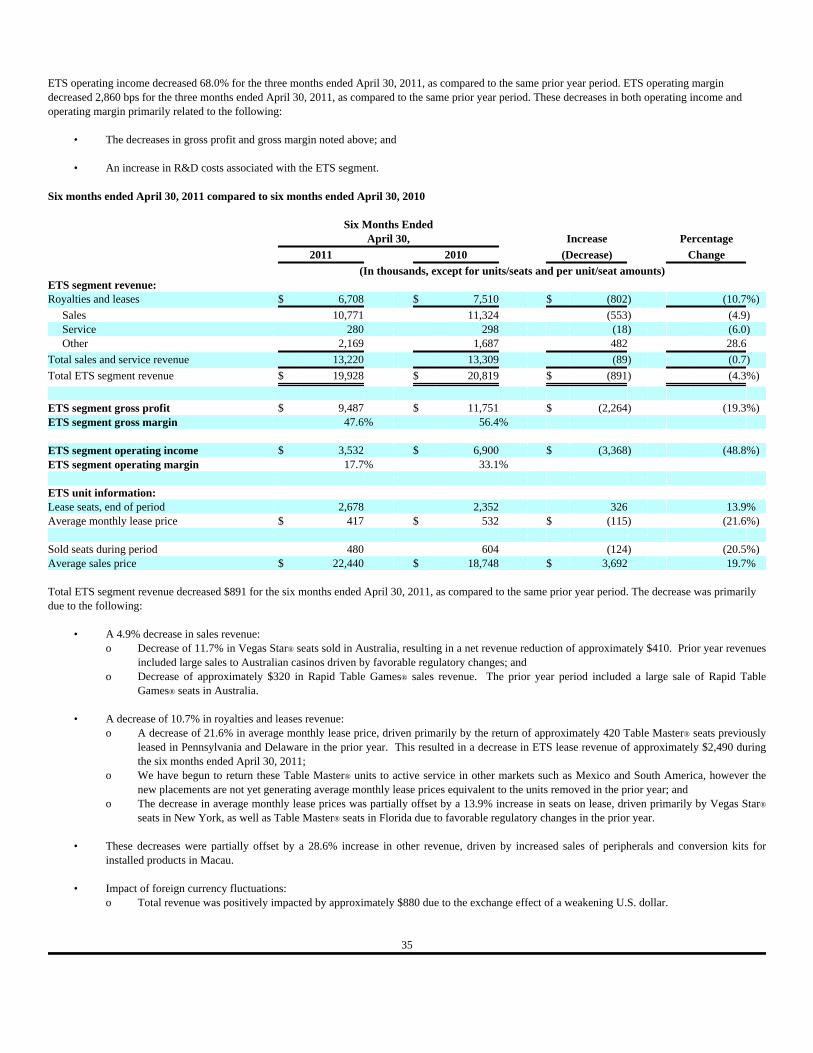
ETS operating income decreased 68.0% for the three months ended April 30, 2011, as compared to the same prior year period. ETS operating margindecreased 2,860 bps for the three months ended April 30, 2011, as compared to the same prior year period. These decreases in both operating income andoperating margin primarily related to the following: • The decreases in gross profit and gross margin noted above; and • An increase in R&D costs associated with the ETS segment. Six months ended April 30, 2011 compared to six months ended April 30, 2010 Six Months Ended April 30, Increase Percentage 2011 2010 (Decrease) Change (In thousands, except for units/seats and per unit/seat amounts) ETS segment revenue: Royalties and leases $ 6,708 $ 7,510 $ (802) (10.7%)
Sales 10,771 11,324 (553) (4.9)Service 280 298 (18) (6.0)Other 2,169 1,687 482 28.6
Total sales and service revenue 13,220 13,309 (89) (0.7)
Total ETS segment revenue $ 19,928 $ 20,819 $ (891) (4.3%)
ETS segment gross profit $ 9,487 $ 11,751 $ (2,264) (19.3%)ETS segment gross margin 47.6% 56.4% ETS segment operating income $ 3,532 $ 6,900 $ (3,368) (48.8%)ETS segment operating margin 17.7% 33.1% ETS unit information: Lease seats, end of period 2,678 2,352 326 13.9%Average monthly lease price $ 417 $ 532 $ (115) (21.6%) Sold seats during period 480 604 (124) (20.5%)Average sales price $ 22,440 $ 18,748 $ 3,692 19.7% Total ETS segment revenue decreased $891 for the six months ended April 30, 2011, as compared to the same prior year period. The decrease was primarilydue to the following: • A 4.9% decrease in sales revenue: o Decrease of 11.7% in Vegas Star® seats sold in Australia, resulting in a net revenue reduction of approximately $410. Prior year revenues
included large sales to Australian casinos driven by favorable regulatory changes; and o Decrease of approximately $320 in Rapid Table Games® sales revenue. The prior year period included a large sale of Rapid Table
Games® seats in Australia. • A decrease of 10.7% in royalties and leases revenue: o A decrease of 21.6% in average monthly lease price, driven primarily by the return of approximately 420 Table Master® seats previously
leased in Pennsylvania and Delaware in the prior year. This resulted in a decrease in ETS lease revenue of approximately $2,490 duringthe six months ended April 30, 2011;
o We have begun to return these Table Master® units to active service in other markets such as Mexico and South America, however thenew placements are not yet generating average monthly lease prices equivalent to the units removed in the prior year; and
o The decrease in average monthly lease prices was partially offset by a 13.9% increase in seats on lease, driven primarily by Vegas Star®
seats in New York, as well as Table Master® seats in Florida due to favorable regulatory changes in the prior year. • These decreases were partially offset by a 28.6% increase in other revenue, driven by increased sales of peripherals and conversion kits for
installed products in Macau. • Impact of foreign currency fluctuations: o Total revenue was positively impacted by approximately $880 due to the exchange effect of a weakening U.S. dollar.
35

ETS gross profit decreased 19.3% for the six months ended April 30, 2011, as compared to the same prior year period. ETS gross margin decreased 880 bpsto 47.6% for the six months ended April 30, 2011, as compared to the same prior year period. These decreases are due to the following: • The overall decrease in revenue as noted above; • The unfavorable margin effect from the Table Master® units removed from Pennsylvania and Delaware; the removed units were generating
average monthly lease prices and margins among the highest in our lease installed base; • The Vegas Star® units sold in Australia in the prior year were at substantially favorable margins compared to current year sales; and • Partially offset by a decrease of approximately $500 in amortization expense associated with Vegas Star® and Rapid Table Games® product lines
as the underlying intangible assets became fully amortized during the three months ended January 31, 2010. ETS operating income decreased 48.8% for the six months ended April 30, 2011, as compared to the same prior year period. ETS operating margin decreased1,540 bps for the six months ended April 30, 2011, as compared to the same prior year period. These decreases in both operating income and operating marginprimarily related to the following:
• The decreases in gross profit and gross margin noted above; and • An increase in R&D costs associated with the ETS segment. Electronic Gaming Machines Segment Operating Results
Three months ended April 30, 2011 compared to three months ended April 30, 2010 Three Months Ended April 30, Increase Percentage
2011 2010 (Decrease) Change
(In thousands, except for units/seats and per unit/seat amounts) EGM segment revenue: Lease revenue $ 103 $ 58 $ 45 77.6%
Sales 17,158 5,222 11,936 228.6 Other 1,107 1,792 (685) (38.2)
Total sales and service revenue 18,265 7,014 11,251 160.4
Total EGM segment revenue $ 18,368 $ 7,072 $ 11,296 159.7%
EGM segment gross profit $ 11,268 $ 3,866 $ 7,402 191.5%EGM segment gross margin 61.3% 54.7% EGM segment operating income $ 8,393 $ 1,978 $ 6,415 324.3%EGM segment operating margin 45.7% 28.0% EGM unit information: Lease seats, end of quarter 17 18 (1) (5.6%) Sold during quarter 969 370 599 161.9%Average sales price $ 17,707 $ 14,114 $ 3,593 25.5% Total EGM segment revenue increased $11,296 for the three months ended April 30, 2011, as compared to the same prior year period, primarily due to thefollowing: • A 228.6% increase in sales revenue: o Driven by the 161.9% increase in units sold; o The increase in units sold is the result of the introduction of our new Equinox™ cabinet. Equinox™ offers widescreen displays and
substantially improved graphics and user interfaces over older-style EGM machines. Placements of Equinox™ units began in July 2010and totaled approximately 920 units in the current quarter;
o Prior year sales revenue was down from historical levels due to market anticipation of the new Equinox™ cabinet; and o The 25.5% increase in average sales price was partially due to foreign exchange effects; the average sales price in Australian dollars
increased 11.3%, reflecting higher sales prices for Equinox™ units. • Impact of foreign exchange fluctuations: o Total revenue was positively impacted by approximately $2,100 due to the exchange effect of a weakening U.S. dollar. • The increases above were partially offset by a decrease of 38.2% in other revenue, driven by a decrease in sales of conversion kits and other parts
and peripherals. The prior year period included a large sale of conversion kits to a single customer.

36

EGM gross profit increased 191.5% for the three months ended April 30, 2011, as compared to the same prior year period. EGM gross margin increased 660bps to 61.3% for the three months ended April 30, 2011, as compared to the same prior year period. The increases in gross profit and gross margin primarilyrelated to the following: • The increase in EGM sales revenues as noted above, driven primarily by the increase in units sold and in average sales price for the new
Equinox™ cabinet; • Prior year sales were composed entirely of eStar™ cabinets, which had a higher production cost and lower margin than Equinox™. Current year
sales are composed of approximately 95% Equinox™ cabinets; and • Improvements in material and production costs, due primarily to value engineering on the new Equinox™ cabinet. EGM operating income increased 324.3% for the three months ended April 30, 2011, as compared to the same prior year period. EGM operating margin alsoincreased 1,770 bps for the three months ended April 30, 2011, as compared to the same prior year period. The increases in operating income and operatingmargin primarily related to the following: • The increases in total EGM revenue and gross profit as noted above; and • Partially offset by increased R&D costs related to the development of the new Equinox™ cabinet and related game content. Six months ended April 30, 2011 compared to six months ended April 30, 2010 Six Months Ended April 30, Increase Percentage 2011 2010 (Decrease) Change (In thousands, except for units/seats and per unit/seat amounts) EGM segment revenue: Lease revenue $ 189 $ 109 $ 80 73.4%
Sales 23,294 8,678 14,616 168.4 Other 1,982 3,595 (1,613) (44.9)
Total sales and service revenue 25,276 12,273 13,003 105.9
Total EGM segment revenue $ 25,465 $ 12,382 $ 13,083 105.7%
EGM segment gross profit $ 15,676 $ 6,552 $ 9,124 139.3%EGM segment gross margin 61.6% 52.9% EGM segment operating income $ 10,157 $ 3,085 $ 7,072 229.2%EGM segment operating margin 39.9% 24.9% EGM unit information: Lease seats, end of period 17 18 (1) (5.6%) Sold during period 1,292 588 704 119.7%Average sales price $ 18,029 $ 14,759 $ 3,270 22.2% Total EGM segment revenue increased $13,083 for the six months ended April 30, 2011, as compared to the same prior year period, primarily due to thefollowing: • A 168.4% increase in sales revenue: o Driven by the 119.7% increase in units sold; o The increase in units sold is the result of the introduction of our new Equinox™ cabinet. Equinox™ offers widescreen displays and
substantially improved graphics and user interfaces over older-style EGM machines. Placements of Equinox™ units began in July 2010and totaled approximately 1,170 units in the current period;
o Prior year sales revenue was down from historical levels due to market anticipation of the new Equinox™ cabinet; and o The 22.2% increase in average sales price was partially due to foreign exchange effects; the average sales price in Australian dollars
increased 9.8%, reflecting higher sales prices for Equinox™ units. • Impact of foreign exchange fluctuations: o Total revenue was positively impacted by approximately $2,600 due to the exchange effect of a weakening U.S. dollar. • A decrease of 44.9% in other revenue, driven by a decrease in sales of conversion kits and other parts and peripherals. The prior year period
included large sales of conversion kits.

37

EGM gross profit increased 139.3% for the six months ended April 30, 2011, as compared to the same prior year period. EGM gross margin increased 870bps to 61.6% for the six months ended April 30, 2011, as compared to the same prior year period. The increases in gross profit and gross margin primarilyrelated to the following: • The increase in EGM sales revenues as noted above, driven primarily by the increase in units sold and in average sales price for the new
Equinox™ cabinet; • Prior year sales were composed entirely of eStar™ cabinets, which had a higher production cost and lower margin than Equinox™. Current year
sales are composed of approximately 90% Equinox™ cabinets; and • Improvements in material and production costs, due primarily to value engineering on the new Equinox™ cabinet. EGM operating income increased 229.2% for the six months ended April 30, 2011, as compared to the same prior year period. EGM operating marginalso increased 1,500 bps for the six months ended April 30, 2011, as compared to the same prior year period. The increases in operating income and operatingmargin primarily related to the following: • The increases in total EGM revenue and gross profit as noted above; • Partially offset by increased R&D costs related to the development of the new Equinox™ cabinet and related game content.
38
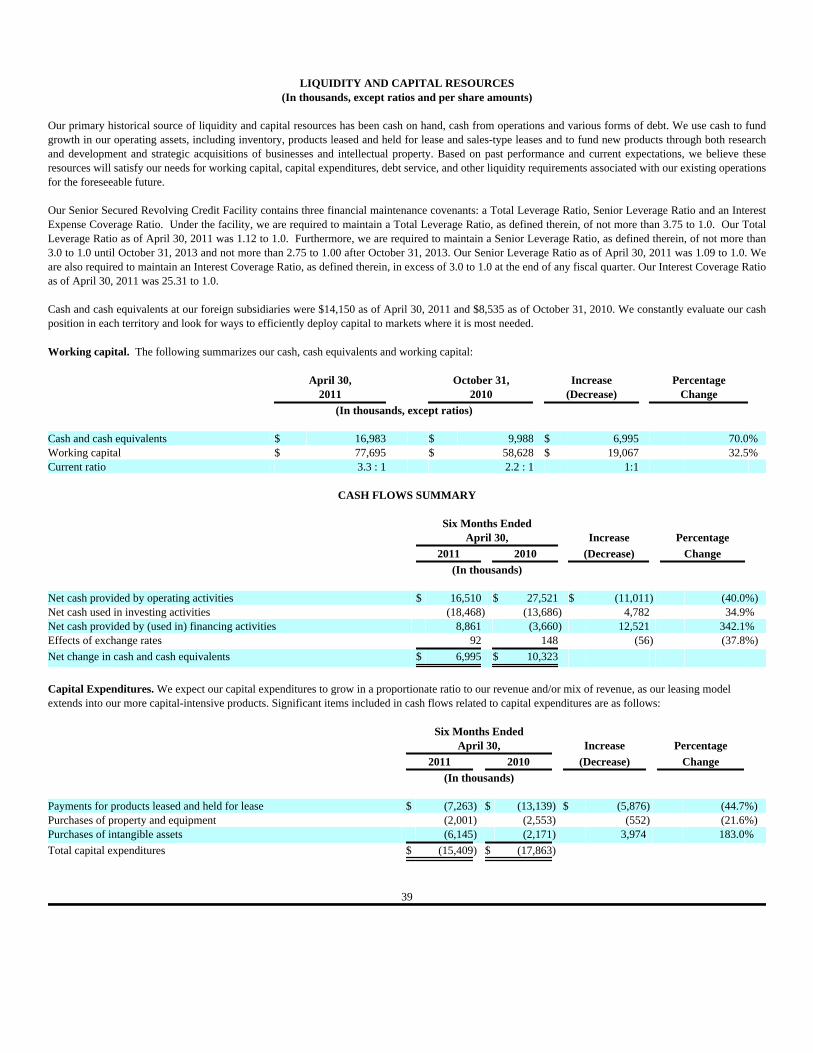
LIQUIDITY AND CAPITAL RESOURCES
(In thousands, except ratios and per share amounts) Our primary historical source of liquidity and capital resources has been cash on hand, cash from operations and various forms of debt. We use cash to fundgrowth in our operating assets, including inventory, products leased and held for lease and sales-type leases and to fund new products through both researchand development and strategic acquisitions of businesses and intellectual property. Based on past performance and current expectations, we believe theseresources will satisfy our needs for working capital, capital expenditures, debt service, and other liquidity requirements associated with our existing operationsfor the foreseeable future.
Our Senior Secured Revolving Credit Facility contains three financial maintenance covenants: a Total Leverage Ratio, Senior Leverage Ratio and an InterestExpense Coverage Ratio. Under the facility, we are required to maintain a Total Leverage Ratio, as defined therein, of not more than 3.75 to 1.0. Our TotalLeverage Ratio as of April 30, 2011 was 1.12 to 1.0. Furthermore, we are required to maintain a Senior Leverage Ratio, as defined therein, of not more than3.0 to 1.0 until October 31, 2013 and not more than 2.75 to 1.00 after October 31, 2013. Our Senior Leverage Ratio as of April 30, 2011 was 1.09 to 1.0. Weare also required to maintain an Interest Coverage Ratio, as defined therein, in excess of 3.0 to 1.0 at the end of any fiscal quarter. Our Interest Coverage Ratioas of April 30, 2011 was 25.31 to 1.0.
Cash and cash equivalents at our foreign subsidiaries were $14,150 as of April 30, 2011 and $8,535 as of October 31, 2010. We constantly evaluate our cashposition in each territory and look for ways to efficiently deploy capital to markets where it is most needed.
Working capital. The following summarizes our cash, cash equivalents and working capital: April 30, October 31, Increase Percentage 2011 2010 (Decrease) Change (In thousands, except ratios) Cash and cash equivalents $ 16,983 $ 9,988 $ 6,995 70.0%Working capital $ 77,695 $ 58,628 $ 19,067 32.5%Current ratio 3.3 : 1 2.2 : 1 1:1
CASH FLOWS SUMMARY Six Months Ended April 30, Increase Percentage 2011 2010 (Decrease) Change (In thousands) Net cash provided by operating activities $ 16,510 $ 27,521 $ (11,011) (40.0%)Net cash used in investing activities (18,468) (13,686) 4,782 34.9%Net cash provided by (used in) financing activities 8,861 (3,660) 12,521 342.1%Effects of exchange rates 92 148 (56) (37.8%)
Net change in cash and cash equivalents $ 6,995 $ 10,323
Capital Expenditures. We expect our capital expenditures to grow in a proportionate ratio to our revenue and/or mix of revenue, as our leasing modelextends into our more capital-intensive products. Significant items included in cash flows related to capital expenditures are as follows: Six Months Ended April 30, Increase Percentage 2011 2010 (Decrease) Change (In thousands) Payments for products leased and held for lease $ (7,263) $ (13,139) $ (5,876) (44.7%)Purchases of property and equipment (2,001) (2,553) (552) (21.6%)Purchases of intangible assets (6,145) (2,171) 3,974 183.0%
Total capital expenditures $ (15,409) $ (17,863)
39

Operating Cash flow provided by operating activities decreased $11,011 for the six months ended April 30, 2011 compared to the same prior year period, primarily dueto following:
• An increase in cash used for inventory of approximately $8,600. Inventory increased by approximately $1,300 due to the exchange effect of aweakening U.S. dollar. The remaining increase in inventory is related to our expansion into new markets, pending installations across all segmentsglobally, and an increase in trial inventory. As a result, inventory turns decreased from 3.2 times for the six months ended April 30, 2010 to 2.5times as of April 30, 2011;
• The decrease in accrued liabilities related to settlement of our class action lawsuits and shareholder derivative suit that was offset by a decrease in
other current assets representing payment to the beneficiaries, see Note 12 to our Condensed Consolidated Financial Statements for moreinformation;
• A decrease in cash provided by accounts receivable of approximately $7,600. Average days sales outstanding (“DSO”) for the six months endedApril 30, 2011 increased to approximately 74 days from approximately 60 days in the same prior year period, due primarily to heavy sales volumein the last month of the quarter;
• Offset by stronger operating performance that led to an increase in net income of approximately $1,200; and
• Offset by an increase in customer deposits and deferred revenue of approximately $3,000, primarily due to prior year period balance whichincluded the recognition of revenue on a large transaction for which revenue was deferred until regulatory approval was granted.
Investing Cash used in investing activities increased $4,782 for the six months ended April 30, 2011 compared to the same prior year period, primarily due to following:
• Increased cash used for the acquisition of a business of approximately $6,500 related to the Newton acquisition, see Note 2 of our CondensedConsolidated Financial Statements for more information;
• Increased cash used for purchases of intangible assets of approximately $4,000 primarily related to the acquisition of intellectual property fromPrime Table Games, see Note 2 to our Condensed Consolidated Financial Statements for more information; and
• Offset by a decrease in payments for products leased and held for lease of approximately $5,900. The prior balance was primarily driven by theopening of two casinos in Singapore.
Financing
Cash flows provided by financing activities increased $12,521 for the six months ended April 30, 2011 compared to the same prior year period, primarily dueto following:
• For the six months ended April 30, 2011, we received approximately $16,500 proceeds from our Revolver which was primarily used for Newtonand Prime Table Games acquisition, as described above, compared to prior period where we received approximately $8,200 from our $100,000senior secured credit facility (the “Deutsche Bank Senior Secured Credit Facility”). Our Deutsche Bank Senior Secured Credit Facility was satisfiedand terminated in October 2010; and
• Offset by decrease in cash used for debt payments of approximately $1,900. Debt payments during current period primarily related to the paymenton our Revolver of $10,000. Debt payments during prior year period related primarily to partial repayment of amounts outstanding under ourDeutsche Bank Senior Secured Credit Facility and our $65,000 term loan facility, which were satisfied and terminated in October 2010.
Indebtedness (See Note 5 of our Notes to Condensed Consolidated Financial Statements)
$200,000 senior secured revolving credit facility. On October 29, 2010, we entered into a new senior secured credit agreement (the “Senior SecuredRevolving Credit Facility”) with Wells Fargo Securities, LLC and Banc of America Securities LLC, as joint lead arrangers and joint lead bookrunners, Bankof America, N.A. as syndication agent and Union Bank, N.A. as documentation agent. The Senior Secured Revolving Credit Facility provides for seniorsecured credit facilities in an aggregate principal amount of $200,000 consisting of a 5-year revolving credit facility (the “Revolver”) in an aggregate principalamount of $200,000 with a sub-facility for letters of credit of $25,000, a sub-facility for multicurrency borrowings in Euros, Australian dollars and Canadiandollars of $25,000, and a sub-facility for swing line loans of $20,000, each on customary terms and conditions. The Senior Secured Revolving Credit Facilityincludes an option to increase the Revolver to $300,000, which would require syndication approval.
40

Loans under the Revolver (other than Swing Line Loans, as defined) bear interest based on the Base Rate, as defined, or LIBOR, as elected by us. Base Rateinterest is calculated at the Base Rate plus the applicable margin and the Base Rate is the highest of (a) the Federal Funds Rate plus .50%, (b) the primecommercial lending rate of the Administrative Agent, as defined, and (c) the one month LIBOR rate for such day plus 1.00%. Swing Line Loans bear interestat the Base Rate plus the applicable margin. Our effective interest rate as of April 30, 2011 was 2.25% and borrowings under the Revolver may be used forworking capital, capital expenditures and general corporate purposes (including share repurchases).
The amount drawn under the Revolver was $71,946 as of April 30, 2011, after considering restrictive financial covenants under the Senior Secured RevolvingCredit Facility, we had approximately $126,000 of available remaining credit under the Revolver as of April 30, 2011. The Revolver matures on October 29,2015.
CAPITAL RESOURCES Excluding any significant acquisitions of businesses, we believe our existing cash, investments, debt financing and projected cash flow from future operationswill be sufficient to fund our operations, long-term obligations, capital expenditures, and new product development for at least the next twelve months.Projected cash flows from operations are based on our estimates of revenue and expenses and the related timing of cash receipts and disbursements. If actualperformance differs from estimated performance, projected cash flows could be positively or negatively impacted. DEBT, OTHER LONG-TERM LIABILITIES AND CONTRACTUAL OBLIGATIONS
Our contractual obligations have not changed materially from the amounts disclosed in our Form 10-K as of October 31, 2010. We do not have material off-balance sheet arrangements.
CRITICAL ACCOUNTING POLICIES AND ESTIMATES
We prepare our Condensed Consolidated Financial Statements in conformity with accounting principles generally accepted in the United States. Our criticalaccounting policies are discussed in “Item 7. Management’s Discussion and Analysis of Financial Condition and Results of Operations; Critical AccountingPolicies and Estimates” in our Form 10-K for the year ended October 31, 2010. ITEM 3. QUANTITATIVE AND QUALITATIVE DISCLOSURES ABOUT MARKET RISK We are exposed to market risks, which arise during the normal course of business from changes in interest rates and foreign exchange rates. A discussion ofour primary market risks is presented below.
Interest rate risk. As of April 30, 2011, we had approximately $72,000 of variable rate debt. Assuming a 1% change in the average interest rate as of April30, 2011, our annual interest cost would change by approximately $720.
Foreign currency risk. We are exposed to foreign currency exchange rate risk inherent in our leases and sales commitments, anticipated leases and sales,anticipated purchases and assets, liabilities and debt denominated in currencies other than the U.S. dollar. We transact business in numerous countries aroundthe world using numerous currencies, of which the most significant to our operations for the three and six months ended April 30, 2011and 2010, were theAustralian dollar and the Euro. We settle inter-company trade balances, which results in the recognition of foreign currency fluctuations. We expect that asignificant portion of the volume of our business will continue to be denominated in foreign currencies. As such, we expect our cash flows and earnings tocontinue to be exposed to the risks that may arise from fluctuations in foreign currency exchange rates.
ITEM 4. CONTROLS AND PROCEDURES
Evaluation of Disclosure Controls and Procedures
We maintain disclosure controls and procedures that are designed to provide reasonable assurance that information required to be disclosed in our reports filedor submitted under the Securities Exchange Act of 1934 is recorded, processed, summarized, and reported within the time period specified in the Securitiesand Exchange Commission’s rules and forms and that such information is accumulated and communicated to our management, including our Chief ExecutiveOfficer and Chief Financial Officer, as appropriate, to allow timely decisions regarding required disclosure.
As required by Rule 13a-15(b) promulgated under the Exchange Act, our management, with the participation of our Chief Executive Officer and ChiefFinancial Officer, evaluated the design and operating effectiveness as of April 30, 2011, of our disclosure controls and procedures, as defined inRule 13a-15(e) promulgated under the Exchange Act. Based on this evaluation our Chief Executive Officer and Chief Financial Officer concluded that ourdisclosure controls and procedures were effective at the reasonable assurance level as of April 30, 2011. Changes in Internal Control Over Financial Reporting There have been no changes in our internal control over financial reporting that occurred during the six months ended April 30, 2011, that have materiallyaffected, or are reasonably likely to materially affect, our internal control over financial reporting.
41
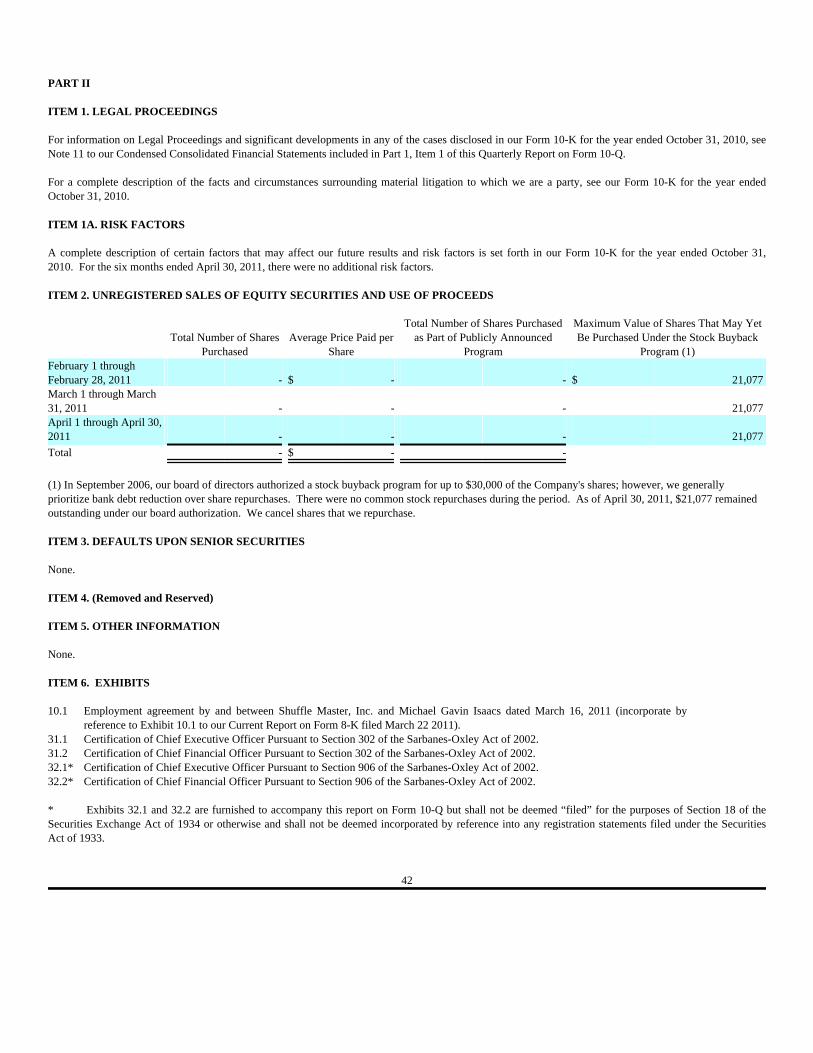
PART II ITEM 1. LEGAL PROCEEDINGS For information on Legal Proceedings and significant developments in any of the cases disclosed in our Form 10-K for the year ended October 31, 2010, seeNote 11 to our Condensed Consolidated Financial Statements included in Part 1, Item 1 of this Quarterly Report on Form 10-Q. For a complete description of the facts and circumstances surrounding material litigation to which we are a party, see our Form 10-K for the year endedOctober 31, 2010. ITEM 1A. RISK FACTORS A complete description of certain factors that may affect our future results and risk factors is set forth in our Form 10-K for the year ended October 31,2010. For the six months ended April 30, 2011, there were no additional risk factors.
ITEM 2. UNREGISTERED SALES OF EQUITY SECURITIES AND USE OF PROCEEDS
Total Number of Shares
Purchased Average Price Paid per
Share
Total Number of Shares Purchasedas Part of Publicly Announced
Program
Maximum Value of Shares That May YetBe Purchased Under the Stock Buyback
Program (1) February 1 throughFebruary 28, 2011 - $ - - $ 21,077 March 1 through March31, 2011 - - - 21,077 April 1 through April 30,2011 - - - 21,077
Total - $ - -
(1) In September 2006, our board of directors authorized a stock buyback program for up to $30,000 of the Company's shares; however, we generallyprioritize bank debt reduction over share repurchases. There were no common stock repurchases during the period. As of April 30, 2011, $21,077 remainedoutstanding under our board authorization. We cancel shares that we repurchase. ITEM 3. DEFAULTS UPON SENIOR SECURITIES None. ITEM 4. (Removed and Reserved) ITEM 5. OTHER INFORMATION None.
ITEM 6. EXHIBITS 10.1 Employment agreement by and between Shuffle Master, Inc. and Michael Gavin Isaacs dated March 16, 2011 (incorporate by
reference to Exhibit 10.1 to our Current Report on Form 8-K filed March 22 2011).31.1 Certification of Chief Executive Officer Pursuant to Section 302 of the Sarbanes-Oxley Act of 2002.31.2 Certification of Chief Financial Officer Pursuant to Section 302 of the Sarbanes-Oxley Act of 2002.32.1* Certification of Chief Executive Officer Pursuant to Section 906 of the Sarbanes-Oxley Act of 2002. 32.2* Certification of Chief Financial Officer Pursuant to Section 906 of the Sarbanes-Oxley Act of 2002.
* Exhibits 32.1 and 32.2 are furnished to accompany this report on Form 10-Q but shall not be deemed “filed” for the purposes of Section 18 of theSecurities Exchange Act of 1934 or otherwise and shall not be deemed incorporated by reference into any registration statements filed under the SecuritiesAct of 1933.
42

SIGNATURES
Pursuant to the requirements of Securities Exchange Act of 1934, the registrant has duly caused this report to be signed on its behalf by the undersignedthereunto duly authorized. SHUFFLE MASTER, INC.(Registrant) Date: June 8, 2011 /s/ MICHAEL GAVIN ISAACS Michael Gavin IsaacsChief Executive Officer(Principal Executive Officer) /s/ LINSTER W. FOX Linster W. FoxChief Financial Officer(Principal Financial Officer)
43

EXHIBIT 31.1
CERTIFICATION PURSUANT TOSECTION 302 OF THE SARBANES-OXLEY ACT OF 2002
CERTIFICATION I, Michael Gavin Isaacs, certify that:
1. I have reviewed this Quarterly Report on Form 10-Q of Shuffle Master, Inc.;
2. Based on my knowledge, this report does not contain any untrue statement of a material fact or omit to state a material factnecessary to make the statements made, in light of the circumstances under which such statements were made, not misleading with respect to theperiod covered by this report;
3. Based on my knowledge, the financial statements, and other financial information included in this report, fairly present in all
material respects the financial condition, results of operations and cash flows of the registrant as of, and for, the periods presented in this report;
4. The registrant’s other certifying officer and I are responsible for establishing and maintaining disclosure controls and procedures(as defined in Exchange Act Rules 13a-15(e) and 15d-15(e)) and internal control over financial reporting (as defined in Exchange ActRules 13a-15(f) and 15d-15(f)) for the registrant and have:
a) Designed such disclosure controls and procedures, or caused such disclosure controls and procedures to be designed
under our supervision, to ensure that material information relating to the registrant, including its consolidated subsidiaries, is madeknown to us by others within those entities, particularly during the period in which this report is being prepared;
b) Designed such internal control over financial reporting, or caused such internal control over financial reporting to be
designed under our supervision, to provide reasonable assurance regarding the reliability of financial reporting and the preparation offinancial statements for external purposes in accordance with generally accepted accounting principles;
c) Evaluated the effectiveness of the registrant’s disclosure controls and procedures and presented in this report our
conclusions about the effectiveness of the disclosure controls and procedures, as of the end of the period covered by this report based onsuch evaluation; and
d) Disclosed in this report any change in the registrant’s internal control over financial reporting that occurred during
the registrant’s most recent fiscal quarter (the registrant’s fourth fiscal quarter in the case of an annual report) that has materiallyaffected, or is reasonably likely to materially affect, the registrant’s internal control over financial reporting; and
5. The registrant’s other certifying officer and I have disclosed, based on our most recent evaluation of internal control over
financial reporting, to the registrant’s auditors and the audit committee of registrant’s board of directors (or persons performing the equivalentfunction):
a) All significant deficiencies and material weaknesses in the design or operation of internal control over financial
reporting which are reasonably likely to adversely affect the registrant’s ability to record, process, summarize and report financialinformation; and
b) Any fraud, whether or not material, that involves management or other employees who have a significant role in the
registrant’s internal control over financial reporting. Date: June 8, 2011 /s/ MICHAEL GAVIN ISAACS Michael Gavin IsaacsChief Executive Officer
EXHIBIT 31.2
CERTIFICATION PURSUANT TOSECTION 302 OF THE SARBANES-OXLEY ACT OF 2002
CERTIFICATION I, Linster W. Fox, certify that:
1. I have reviewed this Quarterly Report on Form 10-Q of Shuffle Master, Inc.;
2. Based on my knowledge, this report does not contain any untrue statement of a material fact or omit to state a material factnecessary to make the statements made, in light of the circumstances under which such statements were made, not misleading with respect to theperiod covered by this report;
3. Based on my knowledge, the financial statements, and other financial information included in this report, fairly present in all
material respects the financial condition, results of operations and cash flows of the registrant as of, and for, the periods presented in this report;
4. The registrant’s other certifying officer and I are responsible for establishing and maintaining disclosure controls and procedures(as defined in Exchange Act Rules 13a-15(e) and 15d-15(e)) and internal control over financial reporting (as defined in Exchange ActRules 13a-15(f) and 15d-15(f)) for the registrant and have:
a) Designed such disclosure controls and procedures, or caused such disclosure controls and procedures to be designed
under our supervision, to ensure that material information relating to the registrant, including its consolidated subsidiaries, is madeknown to us by others within those entities, particularly during the period in which this report is being prepared;
b) Designed such internal control over financial reporting, or caused such internal control over financial reporting to be
designed under our supervision, to provide reasonable assurance regarding the reliability of financial reporting and the preparation offinancial statements for external purposes in accordance with generally accepted accounting principles;
c) Evaluated the effectiveness of the registrant’s disclosure controls and procedures and presented in this report our
conclusions about the effectiveness of the disclosure controls and procedures, as of the end of the period covered by this report based onsuch evaluation; and
d) Disclosed in this report any change in the registrant’s internal control over financial reporting that occurred during
the registrant’s most recent fiscal quarter (the registrant’s fourth fiscal quarter in the case of an annual report) that has materiallyaffected, or is reasonably likely to materially affect, the registrant’s internal control over financial reporting; and
5. The registrant’s other certifying officer and I have disclosed, based on our most recent evaluation of internal control over
financial reporting, to the registrant’s auditors and the audit committee of registrant’s board of directors (or persons performing the equivalentfunction):
a) All significant deficiencies and material weaknesses in the design or operation of internal control over financial
reporting which are reasonably likely to adversely affect the registrant’s ability to record, process, summarize and report financialinformation; and
b) Any fraud, whether or not material, that involves management or other employees who have a significant role in the
registrant’s internal control over financial reporting. Date: June 8, 2011 /s/ LINSTER W. FOX Linster W. FoxChief Financial Officer
EXHIBIT 32.1
CERTIFICATION PURSUANT TOSECTION 906 OF THE SARBANES-OXLEY ACT OF 2002
(18 U.S.C. SECTION 1350)
In connection with the Quarterly Report of Shuffle Master, Inc. (the “Company”) on Form 10-Q for the period ended April 30, 2011, as filed withthe Securities and Exchange Commission on the date hereof (the “Report”), I, Michael Gavin Isaacs, Chief Executive Officer, certify, pursuant to section 906of the Sarbanes-Oxley Act of 2002 (18 U.S.C. section 1350), that to the best of my knowledge:
(1) The Report fully complies with the requirements of section 13(a) or 15(d) of the Securities Exchange Act of 1934; and
(2) The information contained in the Report fairly presents, in all material respects, the financial condition and results ofoperations of the Company.
Date: June 8, 2011 /s/ MICHAEL GAVIN ISAACS Michael Gavin IsaacsChief Executive Officer

EXHIBIT 32.2
CERTIFICATION PURSUANT TOSECTION 906 OF THE SARBANES-OXLEY ACT OF 2002
(18 U.S.C. SECTION 1350)
In connection with the Quarterly Report of Shuffle Master, Inc. (the “Company”) on Form 10-Q for the period ended April 30, 2011, as filed withthe Securities and Exchange Commission on the date hereof (the “Report”), I, Linster W. Fox, Chief Financial Officer, certify, pursuant to section 906 of theSarbanes-Oxley Act of 2002 (18 U.S.C. section 1350), that to the best of my knowledge:
(1) The Report fully complies with the requirements of section 13(a) or 15(d) of the Securities Exchange Act of 1934; and
(2) The information contained in the Report fairly presents, in all material respects, the financial condition and results ofoperations of the Company.
Date: June 8, 2011 /s/ LINSTER W. FOX Linster W. FoxChief Financial Officer