10-year follow-up of intensive glucose control in type 2...
TRANSCRIPT
T h e n e w e ngl a nd j o u r na l o f m e dic i n e
n engl j med 359;15 www.nejm.org october 9, 2008 1577
original article
10-Year Follow-up of Intensive Glucose Control in Type 2 Diabetes
Rury R. Holman, F.R.C.P., Sanjoy K. Paul, Ph.D., M. Angelyn Bethel, M.D., David R. Matthews, F.R.C.P., and H. Andrew W. Neil, F.R.C.P.
From the Diabetes Trials Unit (R.R.H., S.K.P., M.A.B.), the Division of Public Health and Primary Health Care (H.A.W.N.), and the National Institute of Health Re-search (NIHR) School for Primary Care Research (H.A.W.N.), Oxford Centre for Diabetes, Endocrinology, and Metabo-lism (R.R.H., S.K.P., M.A.B., D.R.M., H.A.W.N.); and the NIHR Oxford Bio-medical Research Centre (R.R.H., D.R.M., H.A.W.N.) — both in Oxford, United Kingdom. Address reprint requests to Dr. Holman at the Diabetes Trials Unit, Ox-ford Centre for Diabetes, Endocrinology, and Metabolism, Churchill Hospital, Head-ington, Oxford OX3 7LJ, United Kingdom, or at [email protected].
This article (10.1056/NEJMoa0806470) was published at www.nejm.org on September 10, 2008.
N Engl J Med 2008;359:1577-89.Copyright © 2008 Massachusetts Medical Society.
A bs tr ac t
Background
During the United Kingdom Prospective Diabetes Study (UKPDS), patients with type 2 diabetes mellitus who received intensive glucose therapy had a lower risk of microvascular complications than did those receiving conventional dietary therapy. We conducted post-trial monitoring to determine whether this improved glucose con-trol persisted and whether such therapy had a long-term effect on macrovascular outcomes.
Methods
Of 5102 patients with newly diagnosed type 2 diabetes, 4209 were randomly assigned to receive either conventional therapy (dietary restriction) or intensive therapy (either sulfonylurea or insulin or, in overweight patients, metformin) for glucose control. In post-trial monitoring, 3277 patients were asked to attend annual UKPDS clinics for 5 years, but no attempts were made to maintain their previously assigned thera-pies. Annual questionnaires were used to follow patients who were unable to attend the clinics, and all patients in years 6 to 10 were assessed through questionnaires. We examined seven prespecified aggregate clinical outcomes from the UKPDS on an intention-to-treat basis, according to previous randomization categories.
Results
Between-group differences in glycated hemoglobin levels were lost after the first year. In the sulfonylurea–insulin group, relative reductions in risk persisted at 10 years for any diabetes-related end point (9%, P = 0.04) and microvascular disease (24%, P = 0.001), and risk reductions for myocardial infarction (15%, P = 0.01) and death from any cause (13%, P = 0.007) emerged over time, as more events occurred. In the metformin group, significant risk reductions persisted for any diabetes-relat-ed end point (21%, P = 0.01), myocardial infarction (33%, P = 0.005), and death from any cause (27%, P = 0.002).
Conclusions
Despite an early loss of glycemic differences, a continued reduction in microvascu-lar risk and emergent risk reductions for myocardial infarction and death from any cause were observed during 10 years of post-trial follow-up. A continued benefit after metformin therapy was evident among overweight patients. (UKPDS 80; Current Controlled Trials number, ISRCTN75451837.)
Copyright © 2008 Massachusetts Medical Society. All rights reserved. Downloaded from www.nejm.org on August 16, 2009 . For personal use only. No other uses without permission.
T h e n e w e ngl a nd j o u r na l o f m e dic i n e
n engl j med 359;15 www.nejm.org october 9, 20081578
The United Kingdom Prospective Dia-betes Study (UKPDS), a randomized, pro-spective, multicenter trial, showed that in-
tensive glucose therapy in patients with newly diagnosed type 2 diabetes mellitus was associ-ated with a reduced risk of clinically evident mi-crovascular complications and a nonsignificant reduction of 16% in the relative risk of myocar-dial infarction (P = 0.052).1 In patients whose body weight was more than 120% of their ideal weight2 and who primarily received metformin, reductions in the risk of myocardial infarction of 39% (P = 0.01) and of death from any cause of 36% (P = 0.01) were observed. The results of the UKPDS, which were published in 1998, have appeared to be influential in subsequent diabetes management.3,4
In patients with type 1 diabetes, the Diabetes Control and Complications Trial/Epidemiology of Diabetes Interventions and Complications (DCCT/EDIC) study reported a postinterventional micro-vascular benefit and the emergence of macrovas-cular risk reduction from earlier improved glyce-mic control during an 8-year period.5 The Steno-2 Study reported a similar outcome during a 5.5-year period after earlier multifactorial risk reduction among patients with type 2 diabetes.6 In both trials, enhanced risk reductions occurred despite the loss of within-trial differences in glucose levels and, in the Steno-2 Study, diminished dif-ferences in blood pressure and lipid levels, sug-gesting the persistence of effects of earlier im-proved metabolic management.
We report here the results of a 10-year, post-interventional follow-up of the UKPDS survivor cohort that examined whether a continued micro-vascular benefit from earlier improved glucose control was evident and whether such therapy had a long-term effect on macrovascular outcomes.
Me thods
Patients
The recruitment of patients, study protocol, and methods for the UKPDS have been reported pre-viously.7,8 Approval was obtained from the ethics committees at all 23 clinical centers, and the study conformed to the Declarations of Helsinki guidelines. Briefly, 5102 of 7616 patients who un-derwent screening were enrolled from 1977 to 1991. All patients provided written informed con-sent. Patients were between the ages of 25 and 65 years and had a fasting plasma glucose level of
more than 108 mg per deciliter (6.0 mmol per li-ter) on two occasions after their general practitio-ners had diagnosed type 2 diabetes. By self-report, 81% of the patients were white, 10% Asian Indi-an, and 9% Afro-Caribbean. A total of 2514 patients were excluded because of the following condi-tions: ketonuria, a serum creatinine level of more than 175 μmol per liter (2.0 mg per deciliter), myo-cardial infarction in the previous year, current angina or heart failure, more than one major vas-cular event, retinopathy requiring laser treatment, malignant hypertension, uncorrected endocrine disorder, occupations precluding insulin therapy, severe concurrent illness limiting life expectancy, inadequate understanding of the study protocol, or unwillingness to enter the study.
After a 3-month dietary run-in period, patients with a fasting plasma glucose level of more than 108 mg per deciliter but less than 270 mg per deciliter (15.0 mmol per liter) were randomly as-signed to receive conventional glucose control (diet) or intensive glucose control (sulfonylurea or insulin or, if more than 120% of ideal body weight, metformin2). All patients were seen quar-terly in UKPDS clinics.7 The median follow-up for the sulfonylurea–insulin and metformin groups was 10.0 years1 and 10.7 years,9 respectively.
Post-Trial Monitoring
All surviving patients entered the post-trial mon-itoring program after the intervention trial closed on September 30, 1997. A 10-year follow-up was planned to coincide with a projected death rate of 50%. In September 1998, when the UKPDS results were published,10,11 patients and clinicians were advised that it was necessary to lower levels of blood glucose and blood pressure as much as pos-sible. Patients returned to community or hospital-based diabetes care according to their clinical needs, with no attempt to maintain previously randomized therapies. They were seen annually for 5 years in UKPDS clinics, with continued standardized collection of outcome data; mea-surements of blood pressure, fasting plasma glu-cose, glycated hemoglobin, plasma creatinine, and the ratio of albumin to creatinine; and results on two questionnaires, the European Quality of Life–5 Dimensions (EQ-5D)12 and a questionnaire on the use of health resources.
Clinical examinations every 3 years were con-tinued. Patients who were unable to attend clinics were sent EQ-5D and health-resource question-
Copyright © 2008 Massachusetts Medical Society. All rights reserved. Downloaded from www.nejm.org on August 16, 2009 . For personal use only. No other uses without permission.
10-Year Follow-up of Intensive Glucose Control
n engl j med 359;15 www.nejm.org october 9, 2008 1579
naires, and additional questionnaires were sent to their general practitioners to capture possible clinical outcomes. In years 6 to 10, these ques-tionnaires were used to follow patients remotely, since funding for clinic visits was not available. Final questionnaires were sent to all remaining patients after the cutoff for the censoring of post-trial data on September 30, 2007.
Clinical Outcomes
The study administrator obtained full documen-tation for all putative outcomes from hospitals and general practitioners, whether reported at clinic visits or by means of questionnaires. The vital status for all patients who were still living in the United Kingdom was obtained from the Of-
fice of National Statistics. Members of the UKPDS end-point committee, who were unaware of as-signments to study groups, adjudicated outcomes exactly as they had during the original trial. The seven prespecified UKPDS aggregate clinical out-comes7 were any diabetes-related end point (sud-den death, death from hyperglycemia or hypogly-cemia, fatal or nonfatal myocardial infarction, angina, heart failure, fatal or nonfatal stroke, re-nal failure, amputation, vitreous hemorrhage, retinal photocoagulation, blindness in one eye, or cataract extraction), diabetes-related death (sud-den death or death from myocardial infarction, stroke, peripheral vascular disease, renal disease, hyperglycemia, or hypoglycemia), death from any cause, myocardial infarction (sudden death or fa-
39p6
4209 Were randomly assigned to receiveeither intensive or conventional therapy
5102 Patients with newly diagnosedtype 2 diabetes were enrolled
2729 Were assigned to receiveintensive therapy withsulfonylurea or insulin
342 Were assigned toreceive intensive
therapy with metformin
50 Died7 Emigrated6 Had no final-
year data
2118 Were available forpost-trial monitoring
279 Were available forpost-trial monitoring
1138 Were assigned to receiveconventional therapy
primarily with diet
880 Were available forpost-trial monitoring
489 Died57 Emigrated65 Had no final-
year data
213 Died19 Emigrated26 Had no final-
year data
102 Died6 Emigrated
35 Had no final-year data
1010 Completed post-trialmonitoring
136 Completed post-trialmonitoring
379 Completed post-trialmonitoring
674 Died44 Emigrated
390 Had no final-year data
324 Died13 Emigrated
164 Had no final-year data
AUTHOR:
FIGURE:
JOB: ISSUE:
4-CH/T
RETAKE
SIZE
ICM
CASE
EMail LineH/TCombo
Revised
AUTHOR, PLEASE NOTE: Figure has been redrawn and type has been reset.
Please check carefully.
REG F
Enon
1st
2nd
3rd
Holman
1 of 4
10-09-08
ARTIST: ts
35915
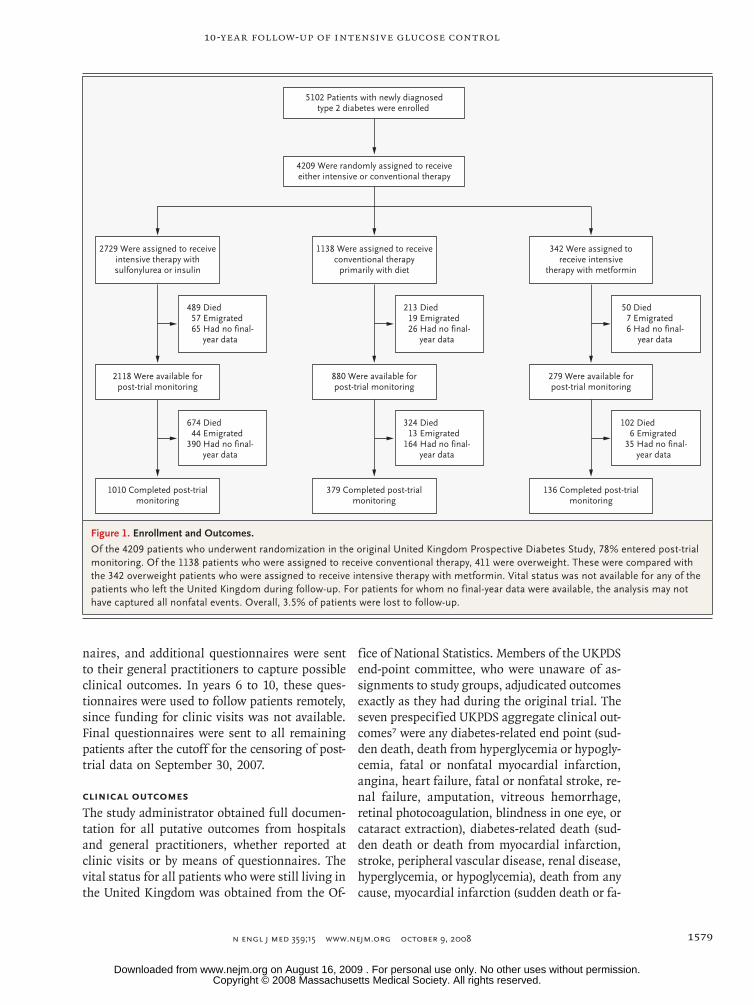
Figure 1. Enrollment and Outcomes.
Of the 4209 patients who underwent randomization in the original United Kingdom Prospective Diabetes Study, 78% entered post-trial monitoring. Of the 1138 patients who were assigned to receive conventional therapy, 411 were overweight. These were compared with the 342 overweight patients who were assigned to receive intensive therapy with metformin. Vital status was not available for any of the patients who left the United Kingdom during follow-up. For patients for whom no final-year data were available, the analysis may not have captured all nonfatal events. Overall, 3.5% of patients were lost to follow-up.
Copyright © 2008 Massachusetts Medical Society. All rights reserved. Downloaded from www.nejm.org on August 16, 2009 . For personal use only. No other uses without permission.

T h e n e w e ngl a nd j o u r na l o f m e dic i n e
n engl j med 359;15 www.nejm.org october 9, 20081580
Tabl
e 1.
Bas
elin
e C
hara
cter
istic
s of
the
Patie
nts.
*
Var
iabl
eD
ata
Ava
ilabl
e in
Fin
al Y
ear
of P
ost-
Tria
l M
onito
ring
Sulfo
nylu
rea–
Insu
lin G
roup
M
etfo
rmin
Gro
up
Yes
(N =
152
5)N
o (N
= 7
05)
P V
alue
†
Con
vent
iona
l Th
erap
y (N
= 8
80)
Inte
nsiv
e Th
erap
y (N
= 2
118)
P V
alue
†
Con
vent
iona
l Th
erap
y (N
= 3
09)
Inte
nsiv
e Th
erap
y (N
= 2
79)
P V
alue
†
Age
— y
r62
±860
±90.
002
63±9
63±9
0.78
63±9
64±9
0.56
Mal
e se
x —
no.
(%
)89
2 (5
8.5)
391
(55.
5)0.
2253
2 (6
0.5)
1248
(58
.9)
0.44
142
(46.
0)12
7 (4
5.5)
0.92
Rac
e or
eth
nic
grou
p —
no.
(%
)‡<0
.001
0.59
0.42
Whi
te11
61 (
76.1
)56
4 (8
0.0)
710
(80.
7)17
17 (
81.1
)26
2 (8
4.8)
235
(84.
2)
Afr
o-C
arib
bean
143
(9.4
)51
(7.
2)58
(6.
6)15
9 (7
.5)
23 (
7.4)
28 (
10.0
)
Asi
an In
dian
209
(13.
7)84
(11
.9)
105
(11.
9)23
0 (1
0.9)
21 (
6.8)
12 (
4.3)
Oth
er12
(0.
8)6
(0.8
)7
(0.8
)12
(0.
6)3
(1.0
)4
(1.4
)
Wei
ght —
kg
0.97
0.01
0.42
Med
ian
81.0
81.0
079
.080
.087
.086
.0
Inte
rqua
rtile
ran
ge71
.00–
92.0
070
.00–
91.0
069
.0–9
0.0
71.0
–92.
076
.0–9
7.0
75.0
–95.
8
Bod
y-m
ass
inde
x29
.4±5
.529
.4±5
.40.
8628
.7±5
.629
.3±5
.50.
005
32.2
±5.7
31.7
±5.4
0.34
Blo
od p
ress
ure
— m
m H
g
Syst
olic
137±
1913
7±19
0.98
138±
2113
9±20
0.52
139±
2214
1±18
0.43
Dia
stol
ic77
±10
78±1
00.
2277
±10
77±1
00.
0677
±10
78±1
00.
22
Fast
ing
plas
ma
gluc
ose
— m
g/dl
164±
5916
8±61
0.34
178±
5816
1±61
<0.0
0118
2±55
177±
640.
12
Gly
cate
d he
mog
lobi
n —
%0.
25<0
.001
0.12
Med
ian
8.0
8.1
8.5
7.9
8.9
8.4
Inte
rqua
rtile
ran
ge6.
9–9.
47.
0–9.
67.
3–9.
76.
8–9.
27.
5–10
.07.
2–9.
7
Cho
lest
erol
— m
g/dl
Tota
l19
8±39
198±
370.
6619
7±37
197±
390.
6320
0±37
204±
410.
37
Low
-den
sity
lipo
prot
ein
127±
3412
7±32
0.81
126±
3212
6±34
0.92
129±
3213
0±36
0.98
Hig
h-de
nsity
lipo
prot
ein
42±1
243
±13
0.87
43±1
242
±13
0.23
40±1
242
±13
0.08
Copyright © 2008 Massachusetts Medical Society. All rights reserved. Downloaded from www.nejm.org on August 16, 2009 . For personal use only. No other uses without permission.
10-Year Follow-up of Intensive Glucose Control
n engl j med 359;15 www.nejm.org october 9, 2008 1581
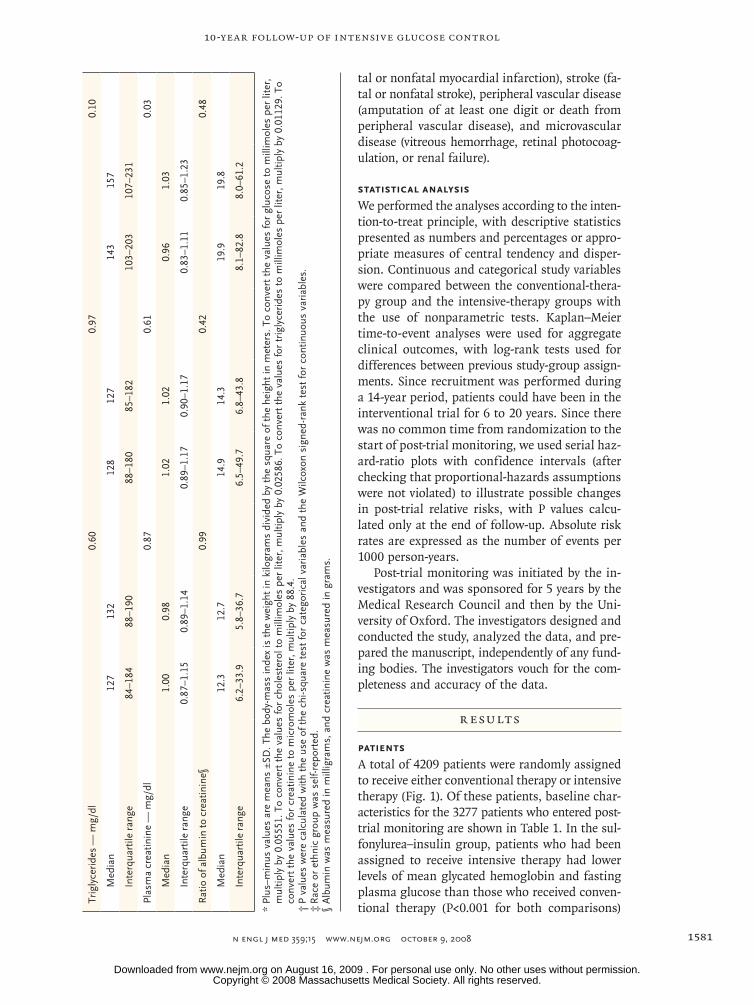
tal or nonfatal myocardial infarction), stroke (fa-tal or nonfatal stroke), peripheral vascular disease (amputation of at least one digit or death from peripheral vascular disease), and microvascular disease (vitreous hemorrhage, retinal photocoag-ulation, or renal failure).
Statistical Analysis
We performed the analyses according to the inten-tion-to-treat principle, with descriptive statistics presented as numbers and percentages or appro-priate measures of central tendency and disper-sion. Continuous and categorical study variables were compared between the conventional-thera-py group and the intensive-therapy groups with the use of nonparametric tests. Kaplan–Meier time-to-event analyses were used for aggregate clinical outcomes, with log-rank tests used for differences between previous study-group assign-ments. Since recruitment was performed during a 14-year period, patients could have been in the interventional trial for 6 to 20 years. Since there was no common time from randomization to the start of post-trial monitoring, we used serial haz-ard-ratio plots with confidence intervals (after checking that proportional-hazards assumptions were not violated) to illustrate possible changes in post-trial relative risks, with P values calcu-lated only at the end of follow-up. Absolute risk rates are expressed as the number of events per 1000 person-years.
Post-trial monitoring was initiated by the in-vestigators and was sponsored for 5 years by the Medical Research Council and then by the Uni-versity of Oxford. The investigators designed and conducted the study, analyzed the data, and pre-pared the manuscript, independently of any fund-ing bodies. The investigators vouch for the com-pleteness and accuracy of the data.
R esult s
Patients
A total of 4209 patients were randomly assigned to receive either conventional therapy or intensive therapy (Fig. 1). Of these patients, baseline char-acteristics for the 3277 patients who entered post-trial monitoring are shown in Table 1. In the sul-fonylurea–insulin group, patients who had been assigned to receive intensive therapy had lower levels of mean glycated hemoglobin and fasting plasma glucose than those who received conven-tional therapy (P<0.001 for both comparisons)
Trig
lyce
ride
s —
mg/
dl0.
600.
970.
10
Med
ian
127
132
128
127
143
157
Inte
rqua
rtile
ran
ge84
–184
88–1
9088
–180
85–1
8210
3–20
310
7–23
1
Plas
ma
crea
tinin
e —
mg/
dl0.
870.
610.
03
Med
ian
1.00
0.98
1.02
1.02
0.96
1.03
Inte
rqua
rtile
ran
ge0.
87–1
.15
0.89
–1.1
40.
89–1
.17
0.90
–1.1
70.
83–1
.11
0.85
–1.2
3
Rat
io o
f alb
umin
to c
reat
inin
e§0.
990.
420.
48
Med
ian
12.3
12.7
14.9
14.3
19.9
19.8
Inte
rqua
rtile
ran
ge6.
2–33
.95.
8–36
.76.
5–49
.76.
8–43
.88.
1–82
.88.
0–61
.2
* Pl
us–m
inus
val
ues
are
mea
ns ±
SD. T
he b
ody-
mas
s in
dex
is t
he w
eigh
t in
kilo
gram
s di
vide
d by
the
squ
are
of t
he h
eigh
t in
met
ers.
To
conv
ert
the
valu
es fo
r gl
ucos
e to
mill
imol
es p
er li
ter,
m
ultip
ly b
y 0.
0555
1. T
o co
nver
t th
e va
lues
for
chol
este
rol t
o m
illim
oles
per
lite
r, m
ultip
ly b
y 0.
0258
6. T
o co
nver
t th
e va
lues
for
trig
lyce
ride
s to
mill
imol
es p
er li
ter,
mul
tiply
by
0.01
129.
To
conv
ert
the
valu
es fo
r cr
eatin
ine
to m
icro
mol
es p
er li
ter,
mul
tiply
by
88.4
.†
P v
alue
s w
ere
calc
ulat
ed w
ith t
he u
se o
f the
chi
-squ
are
test
for
cate
gori
cal v
aria
bles
and
the
Wilc
oxon
sig
ned-
rank
tes
t fo
r co
ntin
uous
var
iabl
es.
‡ R
ace
or e
thni
c gr
oup
was
sel
f-rep
orte
d.§
Alb
umin
was
mea
sure
d in
mill
igra
ms,
and
cre
atin
ine
was
mea
sure
d in
gra
ms.
Copyright © 2008 Massachusetts Medical Society. All rights reserved. Downloaded from www.nejm.org on August 16, 2009 . For personal use only. No other uses without permission.
T h e n e w e ngl a nd j o u r na l o f m e dic i n e
n engl j med 359;15 www.nejm.org october 9, 20081582
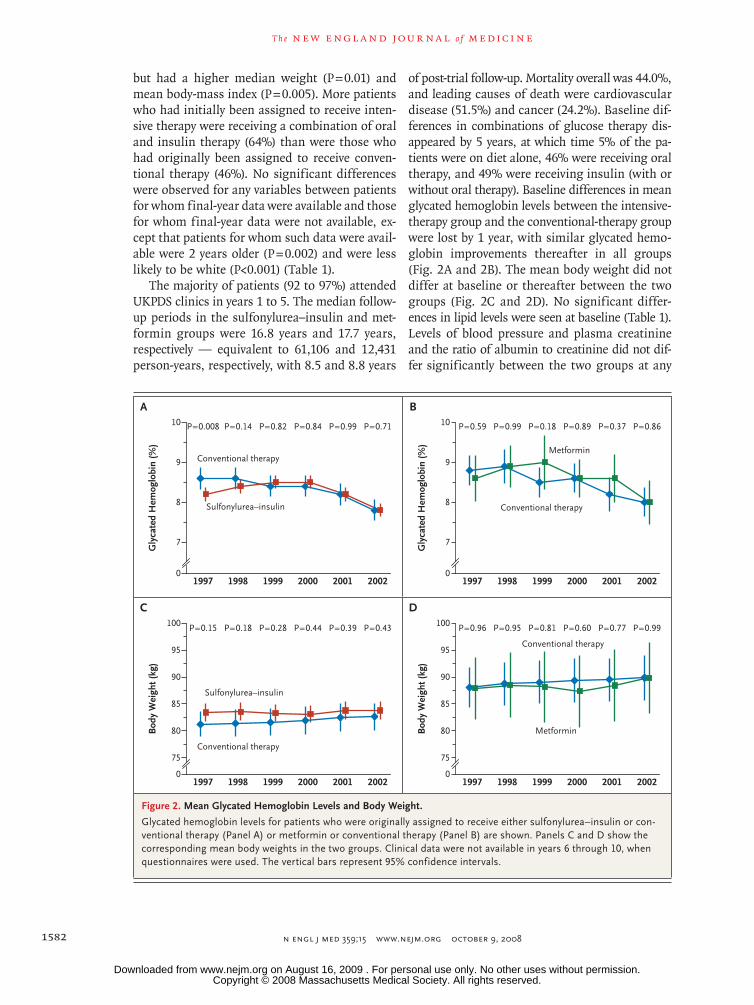
but had a higher median weight (P = 0.01) and mean body-mass index (P = 0.005). More patients who had initially been assigned to receive inten-sive therapy were receiving a combination of oral and insulin therapy (64%) than were those who had originally been assigned to receive conven-tional therapy (46%). No significant differences were observed for any variables between patients for whom final-year data were available and those for whom final-year data were not available, ex-cept that patients for whom such data were avail-able were 2 years older (P = 0.002) and were less likely to be white (P<0.001) (Table 1).
The majority of patients (92 to 97%) attended UKPDS clinics in years 1 to 5. The median follow-up periods in the sulfonylurea–insulin and met-formin groups were 16.8 years and 17.7 years, respectively — equivalent to 61,106 and 12,431 person-years, respectively, with 8.5 and 8.8 years
of post-trial follow-up. Mortality overall was 44.0%, and leading causes of death were cardiovascular disease (51.5%) and cancer (24.2%). Baseline dif-ferences in combinations of glucose therapy dis-appeared by 5 years, at which time 5% of the pa-tients were on diet alone, 46% were receiving oral therapy, and 49% were receiving insulin (with or without oral therapy). Baseline differences in mean glycated hemoglobin levels between the intensive-therapy group and the conventional-therapy group were lost by 1 year, with similar glycated hemo-globin improvements thereafter in all groups (Fig. 2A and 2B). The mean body weight did not differ at baseline or thereafter between the two groups (Fig. 2C and 2D). No significant differ-ences in lipid levels were seen at baseline (Table 1). Levels of blood pressure and plasma creatinine and the ratio of albumin to creatinine did not dif-fer significantly between the two groups at any
33p9
10
Gly
cate
d H
emog
lobi
n (%
)
8
9
7
01997 1998 1999 2000 2001 2002
P=0.008 P=0.14 P=0.82 P=0.84 P=0.99 P=0.71
AUTHOR:
FIGURE:
JOB:
4-CH/T
RETAKE
SIZE
ICM
CASE
EMail LineH/TCombo
Revised
AUTHOR, PLEASE NOTE: Figure has been redrawn and type has been reset.
Please check carefully.
REG F
Enon
1st2nd
3rd
Holman
2 of 4
10-09-08
ARTIST: ts
35915 ISSUE:
A
100
Bod
y W
eigh
t (kg
)
75
80
90
85
95
01997 1998 1999 2000 2001 2002
P=0.15 P=0.18 P=0.28 P=0.44 P=0.39 P=0.43
C
10G
lyca
ted
Hem
oglo
bin
(%)
8
9
7
01997 1998 1999 2000 2001 2002
P=0.59 P=0.99 P=0.18 P=0.89 P=0.37 P=0.86
B
100
Bod
y W
eigh
t (kg
)
75
80
90
85
95
01997 1998 1999 2000 2001 2002
P=0.96 P=0.95 P=0.81 P=0.60 P=0.77 P=0.99
D
Conventional therapy
Conventional therapy
Conventional therapy
Conventional therapy
Metformin
Metformin
Sulfonylurea–insulin
Sulfonylurea–insulin
Figure 2. Mean Glycated Hemoglobin Levels and Body Weight.
Glycated hemoglobin levels for patients who were originally assigned to receive either sulfonylurea–insulin or con-ventional therapy (Panel A) or metformin or conventional therapy (Panel B) are shown. Panels C and D show the corresponding mean body weights in the two groups. Clinical data were not available in years 6 through 10, when questionnaires were used. The vertical bars represent 95% confidence intervals.
Copyright © 2008 Massachusetts Medical Society. All rights reserved. Downloaded from www.nejm.org on August 16, 2009 . For personal use only. No other uses without permission.

10-Year Follow-up of Intensive Glucose Control
n engl j med 359;15 www.nejm.org october 9, 2008 1583
time, except that plasma creatinine levels in the metformin group were 15% higher on average than those in the conventional-therapy group (P<0.04) (Fig. 1 and 2 in the Supplementary Ap-pendix, available with the full text of this article at www.nejm.org).
Clinical Outcomes
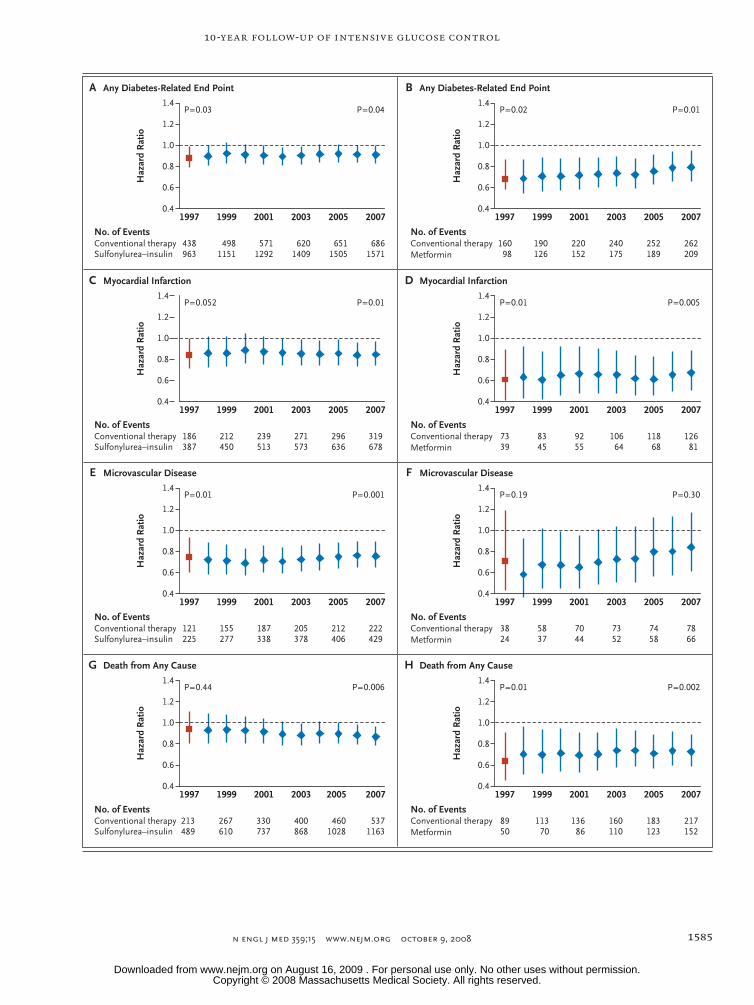
In the sulfonylurea–insulin group as compared with the conventional-therapy group, significant reductions in relative risk that had been observed during the interventional trial for any diabetes-related end point and microvascular disease were maintained. At 10 years, the risk reductions in the sulfonylurea–insulin group were 9% for any diabetes-related end point (0.04) and 24% for mi-crovascular disease (P = 0.001) (Table 2 and Fig. 3 and 4). In addition, post-trial risk reductions
emerged in the sulfonylurea–insulin group for diabetes-related death (17%, P = 0.01), myocardial infarction (15%, P = 0.01), and death from any cause (13%, P = 0.007). No significant risk reduc-tions were observed during or after the trial for stroke or peripheral vascular disease.
Among patients in the metformin group, as compared with overweight patients in the conven-tional-therapy group, significant reductions in relative risk that were observed during the inter-ventional trial for any diabetes-related outcome, diabetes-related death, myocardial infarction, and death from any cause were maintained. At 10 years, the risk reduction for any diabetes-related end point was 21% (P = 0.01), for diabetes-related death 30% (P = 0.01), for myocardial infarction 33% (P = 0.005), and for death from any cause 27% (P = 0.002) (Table 2 and Fig. 3 and 4). No sig-
Table 2. Aggregate Outcomes for Patients during Follow-up.*
Aggregate Outcome Patients with Clinical Outcome Absolute Risk† P Value‡
Risk Ratio for Intensive-Therapy Regimen (95% CI)
Intensive Therapy
Conventional Therapy
Intensive Therapy
Conventional Therapy
no. of patients
Sulfonyurea–insulin group 2729 1138
Any diabetes-related end point 1571 686 48.1 52.2 0.04 0.91 (0.83–0.99)
Diabetes-related death 618 297 14.5 17.0 0.01 0.83 (0.73–0.96)
Death from any cause 1162 537 26.8 30.3 0.007 0.87 (0.79–0.96)
Myocardial infarction 678 319 16.8 19.6 0.01 0.85 (0.74–0.97)
Stroke 260 116 6.3 6.9 0.39 0.91 (0.73–1.13)
Peripheral vascular disease 83 40 2.0 2.4 0.29 0.82 (0.56–1.19)
Microvascular disease 429 222 11.0 14.2 0.001 0.76 (0.64–0.89)
Metformin group 342 411
Any diabetes-related end point 209 262 45.7 53.9 0.01 0.79 (0.66–0.95)
Diabetes-related death 81 120 14.0 18.7 0.01 0.70 (0.53–0.92)
Death from any cause 152 217 25.9 33.1 0.002 0.73 (0.59–0.89)
Myocardial infarction 81 126 14.8 21.1 0.005 0.67 (0.51–0.89)
Stroke 34 42 6.0 6.8 0.35 0.80 (0.50–1.27)
Peripheral vascular disease 13 21 2.3 3.4 0.19 0.63 (0.32–1.27)
Microvascular disease 66 78 12.4 13.4 0.31 0.84 (0.60–1.17)
* Shown are the numbers of patients who were followed for up to 30 years, including up to 10 years of post-trial monitoring, with aggregate clinical outcomes after assignment in the interventional phase of the United Kingdom Prospective Diabetes Study to the sulfonylurea–insu-lin group or the metformin group or to the corresponding conventional-therapy group.
† The absolute risk is the number of events per 1000 patient-years.‡ P values were calculated with the use of the log-rank test.
Copyright © 2008 Massachusetts Medical Society. All rights reserved. Downloaded from www.nejm.org on August 16, 2009 . For personal use only. No other uses without permission.

T h e n e w e ngl a nd j o u r na l o f m e dic i n e
n engl j med 359;15 www.nejm.org october 9, 20081584
nificant risk reductions were observed during or after the trial for microvascular disease, stroke, or peripheral vascular disease.
Discussion
With more than 66,000 person-years of follow-up, this large post-trial study showed that bene-fits of an intensive strategy to control blood glu-cose levels in patients with type 2 diabetes were sustained for up to 10 years after the cessation of randomized interventions. Benefits persisted de-spite the early loss of within-trial differences in glycated hemoglobin levels between the inten-sive-therapy group and the conventional-therapy group — a so-called legacy effect. The trial showed the extended effects of improved glyce-mic control in patients with newly diagnosed type 2 diabetes, some of whom were followed for up to 30 years. The trial also showed that there were differences in outcomes between an inten-sive glucose-control strategy using sulfonylurea or insulin and that using metformin in overweight patients.
In the sulfonylurea–insulin group, the signifi-cant reduction of 25% in the risk of microvascu-lar disease that was observed during the inter-ventional trial in the intensive-therapy group1 was sustained throughout the post-trial period, de-spite the rapid convergence of glycated hemoglo-bin levels in the two groups and a similar use of glucose-lowering therapies, and the reduction in the risk of any diabetes-related end point was also sustained. Clinically relevant post-trial risk reductions emerged over time for myocardial in-farction (15%, P = 0.01) and death from any cause (13%, P = 0.007), although differences during the interventional phase of the trial were not sig-nificant.1
In the metformin group, which consisted of patients who were overweight, substantial risk reductions for myocardial infarction (39%, P = 0.01) and death from any cause (36%, P = 0.01) were observed in the intensive-therapy group during the original trial, even though the difference in glycated hemoglobin levels between the metformin group and the conventional-therapy group9 was smaller than the difference between the sulfo nyl-urea–insulin group and the conventional-therapy group.1 These risk reductions were sustained
throughout the post-trial period, despite simi-larities in glycated hemoglobin levels and in the use of glucose-lowering therapy. During the in-terventional phase of the trial and the post-trial period, microvascular risk reductions of 29% and 26%, respectively, were similar to those achieved in the sulfonylurea–insulin group, but neither dif-ference was significant, probably because there were relatively few patients in this randomized comparison.
Although the UKPDS conclusively showed the benefit of improved glycemic control in reducing the risk of microvascular disease, risk reductions for myocardial infarction and death from any cause were observed only with extended post-trial follow-up. Similarly, in the Action in Diabetes and Vascular Disease: Preterax and Diamicron Modified Release Controlled Evaluation (ADVANCE) trial (ClinicalTrials.gov number, NCT00145925),13 in which 11,140 patients with type 2 diabetes were randomly assigned to receive either intensive glu-cose control or standard glucose control, patients in the intensive-control group had a mean glycated hemoglobin level that was 0.8% lower than that in the standard-control group. However, at the same time, they had a reduction in major micro-vascular events of 14% (95% confidence interval [CI], 3 to 33) but a nonsignificant reduction in major macrovascular events of only 6% (95% CI, −6 to 16) after a median of 5 years of follow-up.
In the randomized Action to Control Cardio-vascular Risk in Diabetes (ACCORD) trial (NCT00000620),14 there was a nonsignificant
Figure 3 (facing page). Hazard Ratios for Four Prespecified Aggregate Clinical Outcomes.
Hazard ratios for patients in the United Kingdom Pro-spective Diabetes Study who had any diabetes-related end point (Panels A and B), myocardial infarction (Pan-els C and D), or microvascular disease (Panels E and F) or who died from any cause (Panels G and H) are shown for the sulfonylurea–insulin group versus the conven-tional-therapy group and for the metformin group ver-sus the conventional-therapy group. The overall values at the end of the study,1 in 1997, are shown (red squares), along with the annual values during the 10-year post-trial monitoring period (blue diamonds). Hazard ratios below unity indicate a favorable outcome from sulfonyl-urea or metformin therapy. Numbers of first events in an aggregate outcome that accumulated in each group are shown at 2-year intervals. The vertical bars repre-sent 95% confidence intervals.
Copyright © 2008 Massachusetts Medical Society. All rights reserved. Downloaded from www.nejm.org on August 16, 2009 . For personal use only. No other uses without permission.
10-Year Follow-up of Intensive Glucose Control
n engl j med 359;15 www.nejm.org october 9, 2008 1585
36p6
Haz
ard
Rat
io
1.4
1.2
1.0
0.8
0.4
0.6
1.4
1.2
1.0
0.8
0.4
0.6
1.4
1.2
1.0
0.8
0.4
0.6
1.4
1.2
1.0
0.8
0.4
0.6
1.4
1.2
1.0
0.8
0.4
0.6
1.4
1.2
1.0
0.8
0.4
0.6
1.4
1.2
1.0
0.8
0.4
0.6
1.4
1.2
1.0
0.8
0.4
0.6
1997 1999 2001 2003 2005 2007
A Any Diabetes-Related End Point
P=0.04P=0.03
No. of EventsConventional therapySulfonylurea–insulin
438963
4981151
5711292
6201409
6511505
6861571
1997 1999 2001 2003 2005 2007
B Any Diabetes-Related End Point
P=0.01P=0.02
No. of EventsConventional therapyMetformin
16098
190126
220152
240175
252189
262209
Haz
ard
Rat
io
Haz
ard
Rat
ioH
azar
d R
atio
1997 1999 2001 2003 2005 2007
C Myocardial Infarction
P=0.01P=0.052
No. of EventsConventional therapySulfonylurea–insulin
186387
212450
239513
271573
296636
319678
1997 1999 2001 2003 2005 2007
D Myocardial Infarction
P=0.005P=0.01
No. of EventsConventional therapyMetformin
7339
8345
9255
10664
11868
12681
Haz
ard
Rat
io
1997 1999 2001 2003 2005 2007
E Microvascular Disease
P=0.001P=0.01
No. of EventsConventional therapySulfonylurea–insulin
121225
155277
187338
205378
212406
222429
Haz
ard
Rat
ioH
azar
d R
atio
1997 1999 2001 2003 2005 2007
F Microvascular Disease
P=0.30P=0.19
No. of EventsConventional therapyMetformin
3824
5837
7044
7352
7458
7866
Haz
ard
Rat
io
1997 1999 2001 2003 2005 2007
G Death from Any Cause
P=0.006P=0.44
No. of EventsConventional therapySulfonylurea–insulin
213489
267610
330737
400868
4601028
5371163
1997 1999 2001 2003 2005 2007
H Death from Any Cause
P=0.002P=0.01
No. of EventsConventional therapyMetformin
8950
11370
13686
160110
183123
217152
AUTHOR:
FIGURE:
JOB:
4-CH/T
RETAKE
SIZE
ICM
CASE
EMail LineH/TCombo
Revised
AUTHOR, PLEASE NOTE: Figure has been redrawn and type has been reset.
Please check carefully.
REG F
Enon
1st
2nd3rd
Holman
3 of 4
10-09-08
ARTIST: ts
35915 ISSUE:
Copyright © 2008 Massachusetts Medical Society. All rights reserved. Downloaded from www.nejm.org on August 16, 2009 . For personal use only. No other uses without permission.

T h e n e w e ngl a nd j o u r na l o f m e dic i n e
n engl j med 359;15 www.nejm.org october 9, 20081586
reduction of 10% in the composite primary out-come of nonfatal myocardial infarction, nonfatal stroke, and death from cardiovascular causes among 10,251 patients with type 2 diabetes who were assigned either to a group with a target glycated hemoglobin level of less than 6.0% or to a group with a target level of 7.0 to 7.9% at the time the trial was stopped, after 3.5 years, because of an unexplained excess rate of death from any cause (22%, P = 0.04). Both the ADVANCE and ACCORD trials involved high-risk patients who were 8 and 12 years older, respectively, than the patients in the UKPDS. In addition, at randomiza-tion in the ADVANCE and ACCORD trials, patients had been treated for diabetes for 8 and 10 years, respectively, whereas patients in the UKPDS had newly diagnosed disease. About a third of the patients in the ADVANCE and ACCORD trials had a history of macrovascular disease, as compared with 7.5% in the UKPDS.7 Both the ADVANCE and ACCORD trials suggested that near-normal glycemia did not reduce cardiovascular events in the short term.
Our findings are consistent with those of the EDIC study,5 which was a follow-up study involv-ing a cohort of 1441 patients with type 1 diabe-tes in the DCCT.15 In the DCCT, patients between the ages of 13 and 39 years who did not have a history of cardiovascular disease were randomly assigned to receive either intensive insulin ther-apy or conventional insulin therapy for a mean of 6.5 years; subsequently, 93% of the patients were followed for 11 years. At the end of that trial, the mean glycated hemoglobin level was 7.4% in the intensive-therapy group and 9.1% in the conventional-therapy group. After all major cardiovascular and peripheral vascular events were combined, patients in the intensive-therapy group had a nonsignificant reduction in the risk of macrovascular disease of 41% (95% CI, −10 to 68).15 Nevertheless, by the end of the follow-up period, intensive therapy had significantly reduced the risk of any cardiovascular disease event by 42% (95% CI, 9 to 63; P = 0.02),5 and after 6 years, it had resulted in decreased progression of carotid intima–media thickness.16 The EDIC study also showed a sustained reduction in the risk of pro-gressive retinopathy 4 years after the end of the trial, despite increasing hyperglycemia,17 and showed persistent benefits with respect to albu-min excretion after 7 to 8 years.18 A comparison of the findings of the EDIC study and those of
the UKPDS suggest that improved glucose con-trol may result in a larger cardiovascular risk re-duction in patients with type 1 diabetes than among those with type 2 diabetes, which is con-sistent with the results of one meta-analysis.19
In the randomized Steno-2 Study, postinter-ventional benefits in patients with type 2 diabe-tes were reported after a 7.8-year multifactorial, intensive risk-reduction program with multiple drug combinations and behavior modification, with a follow-up of 13.3 years.6 An overall absolute reduction in the risk of death of 20% (P = 0.02) was observed, with a hazard ratio of 0.54 (95% CI, 0.32 to 0.89) for death in the intensive-therapy group, as compared with the conventional-ther-apy group. There was no evidence of a change in the hazard ratio once the formal intervention was stopped, but differences in glycated hemoglobin levels were maintained throughout the follow-up period. The Steno-2 Study also showed that the long-term effects of tight glycemic control and therapy with aspirin, antihypertensive agents, and lipid-lowering drugs appeared to be additive. Al-though persistent differences in risk-factor levels might have explained most of the benefit ob-served, a legacy effect could not be ruled out.
The pathophysiological mechanisms respon-sible for such a legacy effect of intensive glycemic control are unclear. A number of mechanisms have been proposed,5 including increased intra-cellular formation of advanced glycation end prod-ucts.20 Long-term hyperglycemia is associated with a slow onset of microvascular disease, which may be mediated by the gradual accumulation of ad-vanced glycation end products that are subse-quently slowly degraded with intensive glycemic control. This mechanism may also be implicated in the development of cardiovascular disease. Thus, the sustained postinterventional benefit in
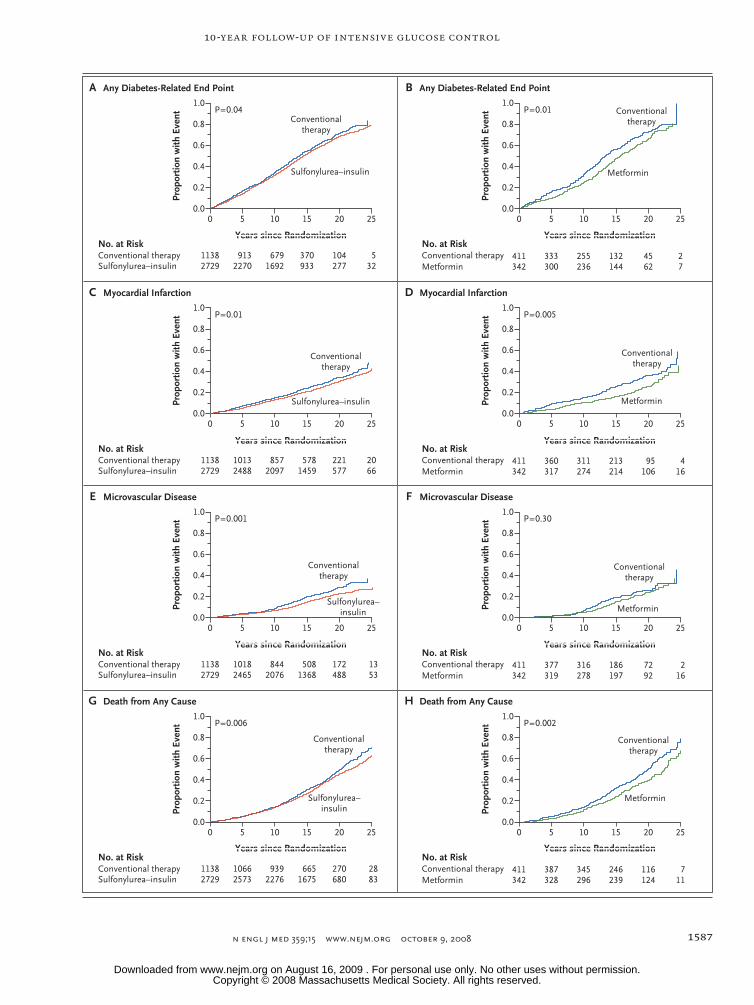
Figure 4 (facing page). Kaplan–Meier Curves for Four Prespecified Aggregate Clinical Outcomes.
The proportions of patients in the United Kingdom Prospective Diabetes Study who had any diabetes- related end point (Panels A and B), myocardial infarc-tion (Panels C and D), or microvascular disease (Pan-els E and F) or who died from any cause (Panels G and H) are shown for the sulfonylurea–insulin group versus the conventional-therapy group and for the metformin group versus the conventional-therapy group. Kaplan–Meier plots for cumulative incidence and log-rank P values are shown at 5-year intervals during a 25-year period from the start of the interventional trial.
Copyright © 2008 Massachusetts Medical Society. All rights reserved. Downloaded from www.nejm.org on August 16, 2009 . For personal use only. No other uses without permission.
10-Year Follow-up of Intensive Glucose Control
n engl j med 359;15 www.nejm.org october 9, 2008 1587
1.0
Prop
ortio
n w
ith E
vent
0.6
0.8
0.4
0.2
0.0
1.0
Prop
ortio
n w
ith E
vent
0.6
0.8
0.4
0.2
0.0
1.0
Prop
ortio
n w
ith E
vent
0.6
0.8
0.4
0.2
0.0
1.0
Prop
ortio
n w
ith E
vent
0.6
0.8
0.4
0.2
0.0
1.0
Prop
ortio
n w
ith E
vent
0.6
0.8
0.4
0.2
0.0
1.0
Prop
ortio
n w
ith E
vent
0.6
0.8
0.4
0.2
0.0
1.0
Prop
ortio
n w
ith E
vent
0.6
0.8
0.4
0.2
0.0
1.0
Prop
ortio
n w
ith E
vent
0.6
0.8
0.4
0.2
0.0
A Any Diabetes-Related End Point
P=0.04
No. at RiskConventional therapySulfonylurea–insulin
B Any Diabetes-Related End Point
P=0.01
No. at RiskConventional therapyMetformin
C Myocardial Infarction
P=0.01
No. at RiskConventional therapySulfonylurea–insulin
D Myocardial Infarction
P=0.005
No. at RiskConventional therapyMetformin
E Microvascular Disease
P=0.001
No. at RiskConventional therapySulfonylurea–insulin
F Microvascular Disease
P=0.30
No. at RiskConventional therapyMetformin
G Death from Any Cause
P=0.006
No. at RiskConventional therapySulfonylurea–insulin
H Death from Any Cause
P=0.002
No. at RiskConventional therapyMetformin
11382729
9132270
6791692
370933
104277
532
0 5 10 15 20 25
0 5 10 15 20 25
0 5 10 15 20 25
0 5 10 15 20 25
0 5 10 15 20 25
0 5 10 15 20 25
0 5 10 15 20 25
0 5 10 15 20 25
411342
333300
255236
132144
4562
27
11382729
10132488
8572097
5781459
221577
2066
411342
360317
311274
213214
95106
416
11382729
10182465
8442076
5081368
172488
1353
411342
377319
316278
186197
7292
216
11382729
10662573
9392276
6651675
270680
2883
411342
387328
345296
246239
116124
711
Years since Randomization Years since Randomization
Years since Randomization Years since Randomization
Years since Randomization Years since Randomization
Years since Randomization Years since Randomization
Conventionaltherapy
Sulfonylurea–insulin Metformin
Conventionaltherapy
Conventionaltherapy
Sulfonylurea–insulin Metformin
Conventionaltherapy
Conventionaltherapy
Sulfonylurea–insulin Metformin
Conventionaltherapy
Conventionaltherapy
Sulfonylurea–insulin
Metformin
Conventionaltherapy
36p6
AUTHOR:
FIGURE:
JOB:
4-CH/T
RETAKE
SIZE
ICM
CASE
EMail LineH/TCombo
Revised
AUTHOR, PLEASE NOTE: Figure has been redrawn and type has been reset.
Please check carefully.
REG F
Enon
1st
2nd
3rd
Holman
4 of 4
10-09-08
ARTIST: ts
35915 ISSUE:
Copyright © 2008 Massachusetts Medical Society. All rights reserved. Downloaded from www.nejm.org on August 16, 2009 . For personal use only. No other uses without permission.

T h e n e w e ngl a nd j o u r na l o f m e dic i n e
n engl j med 359;15 www.nejm.org october 9, 20081588
the UKPDS might be explained in part by a lag phase before a reduction in events could occur because of improved glycemic control in the con-ventional-therapy group after the implementation of guidelines for stricter control on the basis of the results of the UKPDS. At the same time, the benefit of previous improved glycemic control in the intensive-therapy group would be expected to diminish only slowly.
Our study has certain limitations. Question-naires may not have captured all nonfatal out-comes. Biochemical and clinical measurements were not collected after the fifth year, although after the first year it was already evident that dif-ferences in glycated hemoglobin levels had been lost. The absence of risk-factor information in the period between the sixth year and the 10th year precludes proportional-hazards analyses assess-ing possible effects of time-dependent covariates, such as microalbuminuria.
Our results show a sustained legacy effect of an intensive glucose-control strategy that appears to be longer than previously reported. These ob-servations indicate that intensive glucose control starting at the time of diagnosis is associated with a significantly decreased risk of myocardial infarction and death from any cause, in addition to the well-established reduction in the risk of microvascular disease. On the basis of extensive trial evidence, strategies for cardiovascular risk reduction in patients with type 2 diabetes empha-size the importance of lipid-lowering therapy with statins21 and of targeted antihypertensive treat-ment.22-24 (A companion article in this issue of the Journal reports the 10-year, postinterventional data on blood-pressure control from the UKPDS.25)
Our results highlight the added importance of glucose lowering in reducing the risk of coronary events and death from any cause. The findings strengthen the rationale for attaining optimal gly-cemic control and indicate emergent long-term benefits on cardiovascular risk.
Supported for the first 5 years of post-trial monitoring by the
U.K. Medical Research Council, U.K. Department of Health, Dia-betes UK, the British Heart Foundation, and the U.K. National Institute for Health and for the final 5 years by Bristol-Myers Squibb, GlaxoSmithKline, Merck Serono, Novartis, Novo Nordisk and Pfizer. The original UKDPS interventional trial was support-ed by the U.K. Medical Research Council, British Diabetic Asso-ciation, U.K. Department of Health, U.S. National Eye Institute, U.S. National Institute of Diabetes and Digestive and Kidney Dis-eases, British Heart Foundation, Wellcome Trust, Charles Wolf-son Charitable Trust, Clothworkers’ Foundation, Health Promo-tion Research Trust, Alan and Babette Sainsbury Trust, Oxford University Medical Research Fund Committee, Novo Nordisk, Bayer, Bristol-Myers Squibb, Hoechst, Lilly, Lipha, and Farmitalia Carlo Erba, with consumables or logistical support from Boeh-ringer Mannheim, Becton Dickinson, Owen Mumford, Securicor, Kodak, Cortecs Diagnostics, Glaxo Wellcome, SmithKline Bee-cham, Pfizer, Zeneca, Pharmacia, Upjohn, and Roche.
Dr. Holman reports receiving grant support from Asahi Kasei Pharma, Bayer Healthcare, Bayer Schering Pharma, Bristol- Myers Squibb, GlaxoSmithKline, Merck, Merck Serono, Novartis, Novo Nordisk, Pfizer, and Sanofi-Aventis, consulting fees from Amylin, Eli Lilly, GlaxoSmithKline, Merck, and Novartis, and lecture fees from Astella, Bayer, GlaxoSmithKline, King Phar-maceuticals, Eli Lilly, Merck, Merck Serono, Novo Nordisk, Takeda, and Sanofi-Aventis, and owning shares in Glyme Valley Technology, Glyox, and Oxtech; Dr. Paul, receiving consulting fees from Amylin; Dr. Bethel, receiving grant support from No-vartis and Sanofi-Aventis and lecture fees from Merck and Sanofi-Aventis; Dr. Matthews, receiving lecture and advisory fees from Novo Nordisk, GlaxoSmithKline, Servier, Merck, No-vartis, Novo Nordisk, Eli Lilly, Takeda, and Roche and owning shares in OSI Pharmaceuticals and Particle Therapeutics; and Dr. Neil, receiving consulting fees from Merck, Pfizer, Schering-Plough, and Solvay Healthcare. The Oxford Centre for Diabetes, Endocrinology and Metabolism (OCDEM) has a Partnership for the Foundation of OCDEM, with Novo Nordisk, Takeda and Servier. No other potential conflict of interest relevant to this article was reported.
We thank the patients and staff at the participating centers: Radcliffe Infirmary, Oxford; Royal Infirmary, Aberdeen; Selly Oak Hospital, Birmingham; St. George’s Hospital and Hammer-smith Hospital, London; City Hospital, Belfast; North Stafford-shire City General Hospital, Stoke-on-Trent; Royal Victoria Hos-pital, Belfast; St. Helier Hospital, Carshalton; Whittington Hospital, London; Norfolk and Norwich Hospital, Norwich; Lister Hospital, Stevenage; Ipswich Hospital, Ipswich; Ninewells Hospital, Dundee; Northampton Hospital, Northampton; Tor-bay Hospital, Torquay; Peterborough District Hospital, Peterbor-ough; Scarborough Hospital, Scarborough; Derbyshire Royal Infirmary, Derby; Manchester Royal Infirmary, Manchester; Hope Hospital, Salford; Leicester General Hospital, Leicester; and Royal Devon and Exeter Hospital, Exeter (all in the United Kingdom); and the Northern Ireland General Register Office for provision of vital-status data. We acknowledge the major contri-bution of the late Carole Cull and the efforts of members of the Endpoint Adjudication Committee (Charles Fox and Alex Wright).
ReferencesUK Prospective Diabetes Study 1.
(UKPDS) Group. Intensive blood-glucose control with sulphonylureas or insulin compared with conventional treatment and risk of complications in patients with type 2 diabetes (UKPDS 33). Lancet 1998; 352:837-53. [Erratum, Lancet 1999;354: 602.]
Metropolitan Life Insurance Compa-2. ny. New weight standards for men and
women. Stat Bull Metrop Insur Co 1959; 40:1-4.
Home PD. Impact of the UKPDS — an 3. overview. Diabet Med 2008;25:Suppl 2:2-8.
Genuth S. The UKPDS and its glob- 4. al impact. Diabet Med 2008;25:Suppl 2: 57-62.
Nathan DM, Cleary PA, Backlund JY, 5. et al. Intensive diabetes treatment and cardiovascular disease in patients with
type 1 diabetes. N Engl J Med 2005;22: 2643-53.
Gaede P, Lund-Andersen H, Parving 6. HH, Pedersen O. Effect of a multifactorial intervention on mortality in type 2 diabe-tes. N Engl J Med 2008;358:580-91.
UK Prospective Diabetes Study (UKPDS). 7. VIII. Study design, progress and perfor-mance. Diabetologia 1991;34:877-90.
UK Prospective Diabetes Study (UKPDS). 8.
Copyright © 2008 Massachusetts Medical Society. All rights reserved. Downloaded from www.nejm.org on August 16, 2009 . For personal use only. No other uses without permission.
10-Year Follow-up of Intensive Glucose Control
n engl j med 359;15 www.nejm.org october 9, 2008 1589
XI. Biochemical risk factors in type 2 dia-betic patients at diagnosis compared with age-matched normal subjects. Diabet Med 1994;11:534-44.
UK Prospective Diabetes Study (UKPDS) 9. Group. Effect of intensive blood-glucose control with metformin on complications in overweight patients with type 2 diabe-tes (UKPDS 34). Lancet 1998;352:854-65. [Erratum, Lancet 1998;352:1558.]
Turner RC, Milns H, Neil HA, et al. 10. Risk factors for coronary artery disease in non-insulin dependent diabetes mellitus: United Kingdom Prospective Diabetes Study (UKPDS: 23). BMJ 1998;316:823-8.
UK Prospective Diabetes Study Group. 11. Efficacy of atenolol and captopril in re-ducing risk of macrovascular and micro-vascular complications in type 2 diabetes: UKPDS 39. BMJ 1998;317:713-20.
The EuroQol Group. EuroQol — a new 12. facility for the measurement of health-related quality of life. Health Policy 1990;16:199-208.
The ADVANCE Collaborative Group. 13. Intensive blood glucose control and vas-cular outcomes in patients with type 2 diabetes. N Engl J Med 2008;358:2560-72.
The ACCORD Study Group. Effects of 14. intensive glucose lowering in type 2 dia-betes. N Engl J Med 2008;358:2545-59.
The Diabetes Control and Complica-15. tions Trial Research Group. The effect of intensive treatment of diabetes on the de-
velopment and progression of long-term complications of insulin-dependent dia-betes mellitus. N Engl J Med 1993;329: 997-86.
The Diabetes Control and Complica-16. tions Trial/Epidemiology of Diabetes In-terventions and Complications Research Group. Intensive diabetes therapy and ca-rotid intima–media thickness in type 1 dia-betes mellitus. N Engl J Med 2003;348: 2294-303.
The Diabetes Control and Complica-17. tions Trial/Epidemiology of Diabetes In-terventions and Complications Research Group. Retinopathy and nephropathy in patients with type 1 diabetes four years after a trial of intensive therapy. N Engl J Med 2000;342:381-9. [Erratum, N Engl J Med 2000;342:1376.]
Sustained effect of intensive treat-18. ment of type 1 diabetes mellitus on devel-opment and progression of diabetic neph-ropathy: the Epidemiology of Diabetes Interventions and Complications (EDIC) study. JAMA 2003;290:2159-67.
Stettler C, Alleman S, Jüni P, et al. 19. Glycemic control and macrovascular dis-eases in types 1 and 2 diabetes mellitus: meta-analysis of randomized trials. Am Heart J 2006;152:27-38.
Goh SY, Cooper ME. The role of ad-20. vance glycation end products in progres-sion and complications of diabetes. J Clin Endocrinol Metab 2008;93:1143-52.
Baigent C, Keech A, Kearney PM, et al. 21. Efficacy and safety of cholesterol-lower-ing treatment: prospective meta-analysis of data from 90,056 participants in 14 ran-domised trials of statins. Lancet 2005;366: 1267-78. [Errata, Lancet 2005;366:1358, 2008;371:2084.]
UK Prospective Diabetes Study Group. 22. Tight blood pressure control and risk of macrovascular and microvascular compli-cations in type 2 diabetes: UKPDS 38. BMJ 1998;317:703-13. [Erratum, BMJ 1999; 318:29.]
Hansson L, Zanchetti A, Carruthers 23. SG, et al. Effects of intensive blood-pres-sure lowering and low-dose aspirin in pa-tients with hypertension: principal results of the Hypertension Optimal Treatment (HOT) randomised trial. Lancet 1998;351: 1755-62.
Yusuf S, Sleight P, Pogue J, Bosch J, 24. Davies R, Dagenais G. Effect of an an-giotensin-converting–enzyme inhibitor, ramipril, on cardiovascular events in high-risk patients. N Engl J Med 2000; 342:145-53. [Errata, N Engl J Med 2000; 342:748, 1376.]
Holman RR, Paul SK, Bethel MA, Neil 25. HAW, Matthews DR. Long-term follow-up after tight control of blood pressure in type 2 diabetes. N Engl J Med 2008;359: 1565-76.Copyright © 2008 Massachusetts Medical Society.
receive immediate notification when a journal article is released early
To be notified when an article is released early on the Web and to receive the table of contents
of the Journal by e-mail every Wednesday evening, sign up through our Web site at
www.nejm.org
Copyright © 2008 Massachusetts Medical Society. All rights reserved. Downloaded from www.nejm.org on August 16, 2009 . For personal use only. No other uses without permission.