10 year foundation for growth
TRANSCRIPT
1
10 year foundation for growth March 2015
Minotaur Exploration Limited | ASX: MEP

2
Minotaur’s growth strategy stays the course…
§ Minotaur has 10 years of experience as an ASX listed company
‒ and 20 years experience as an exploration group
§ Our strategy for continued growth is underpinned by our focus on copper, gold and nickel
‒ and our ambition to progress exploration success into viable mining operations
Conversion of copper, gold and nickel exploration assets into mineable deposits
Nickel-Gold (WA) Leinster Scotia
Copper-Gold Eloise JV
JOGMEC JV
Copper-Gold GRV deep targeting

3
…focusing on the right commodities…
§ Australian projects benefit from a lower Australian dollar as commodity prices rise
Copper, gold and nickel have strong mid-term commodity fundamentals
50
100
150
200
Current 2015E 2016E 2017E 2018E 2019E
Commodity price forecasts1
Copper Nickel Gold
Source: Broker reports Notes: 1 Commodity prices are rebased to 100. Based on spot prices of US$2.69/lb Cu, US$6.26/lb Ni and US$1,155/oz Au as of 17 March 2015

4
18.0 6.2
11.8 0.8 4.8
4.3
1.9
Market value @ A$0.10
Net cash (31-Dec-14)
EV Listed investments Gypsum sale value Other industrial minerals
Adjusted EV
...though little value currently ascribed to our business
§ By subtracting the market valuation of Minotaur’s listed investments and the book value of Minotaur’s non-core assets, the current market implied Enterprise Valuation (EV) for Minotaur’s core copper-gold and nickel assets is only A$1.9m
§ Minotaur’s track record of realising above book value for non-core assets is instructive (for example, sale of Roxby Downs tenements to BHP Billiton (FY2012) realised A$9.5m cash compared to A$1.0m book value)
Exploration is presently considered unfashionable by many sophisticated investors
Source: IRESS, company filings Notes: 1 Listed investments: includes shares held in Mungana Goldmines, Petratherm, Thomson Resources and Mithril Resources with valuations based on market data as at ASX close on 12-Mar-15 2 Gypsum sale value: cash payments agreed to be made upon completion of conditions precedent as per Minotaur announcement on 20-Oct-14 3 Other industrial minerals: book value as at 31-Dec-14 after A$4.1m impairment of Exploration Assets
NON-CORE ASSETS
Market implied value for
Minotaur's core copper-gold and
nickel assets
1 2
3

5
Minotaur will stay the course
§ In mid 2014 Minotaur’s share price out performed
§ Since late August, despite a record of acute operational and corporate success, the price benet has entirely eroded
§ Achievements since August 2014 include: ü Sep – successful EM conrms Artemis down-dip extension; body
projected to 235m depth
ü Oct – agreed sale of Gypsum project (A$4.8m)
ü Oct – funding certainty achieved with successful A$3m SPP plus A$1m placement
ü Dec – continued Artemis drill success; 20m @ 2.7% Cu, 12.3g/t Au, 5.3% Zn, 2.3% Pb, 170g/t Ag from 154m
ü Jan – down plunge extended at Artemis — 19.9m @ 1.4% Cu, 0.8g/t Au, 1.8% Zn from 225m
§ Drilling at Artemis yet to test down-plunge repetitions of massive sulphide mineralisation
Even though the share price declined in the face of positive news ow from the Artemis Cu-Au-Zn discovery
Source: IRESS Notes: 1 ASX Small Resources Index rebased to the Minotaur share price as at 13-Mar-14
(13%) (29%)
-
5.0
10.0
15.0
20.0
25.0
30.0
Mar-14 Jun-14 Sep-14 Dec-14 Mar-15
Minotaur 12 month share price performance (Acps)1
Minotaur ASX Small Resources (rebased)
6
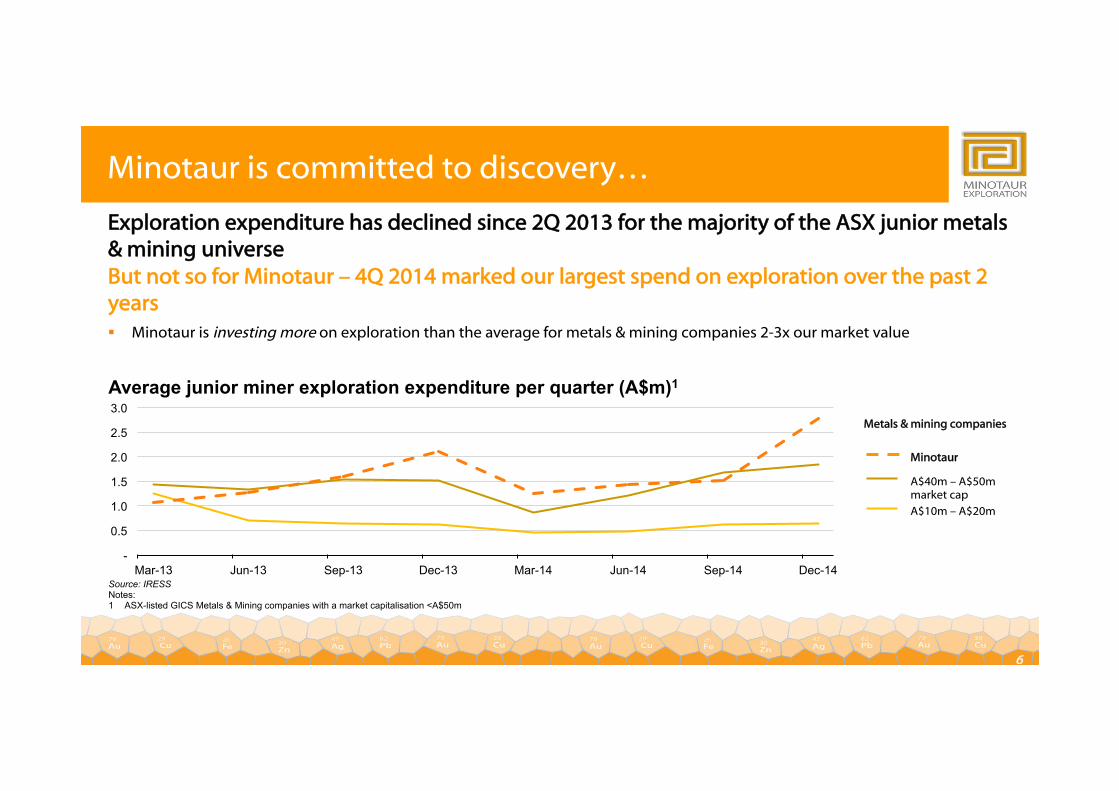
Minotaur is committed to discovery…
But not so for Minotaur – 4Q 2014 marked our largest spend on exploration over the past 2 years § Minotaur is investing more on exploration than the average for metals & mining companies 2-3x our market value
Exploration expenditure has declined since 2Q 2013 for the majority of the ASX junior metals & mining universe
Source: IRESS Notes: 1 ASX-listed GICS Metals & Mining companies with a market capitalisation <A$50m
Metals & mining companies
Minotaur
A$10m – A$20m
A$40m – A$50m market cap
-
0.5
1.0
1.5
2.0
2.5
3.0
Mar-13 Jun-13 Sep-13 Dec-13 Mar-14 Jun-14 Sep-14 Dec-14
Average junior miner exploration expenditure per quarter (A$m)1

7
…and is one of very few well capitalised juniors…
Minotaur is well capitalised relative to most other junior metals & mining companies
Source: IRESS Notes: 1 ASX-listed GICS Metals & Mining companies with a market capitalisation <A$50m
- 1.0 2.0 3.0 4.0 5.0 6.0 7.0 8.0 9.0 10.0+
junior metals & mining cash balance distribution (A$m)1 as at 31 Dec 2014
Median = A$0.8m A$6.7m
§ The median cash balance of 546 junior metals & mining companies decreased to A$0.8m through 2014
§ Minotaur continues to maintain a strong balance sheet despite signicant ongoing exploration expenditure
273 junior mining companies 273
8
Minotaur Exploration 0.0
0.5
1.0
1.5
2.0
2.5
3.0
3.5
0.0 0.5 1.0 1.5 2.0 2.5 3.0 3.5 4.0 4.5 5.0
Adm
inis
tratio
n (A
$m)
Exploration (A$m)
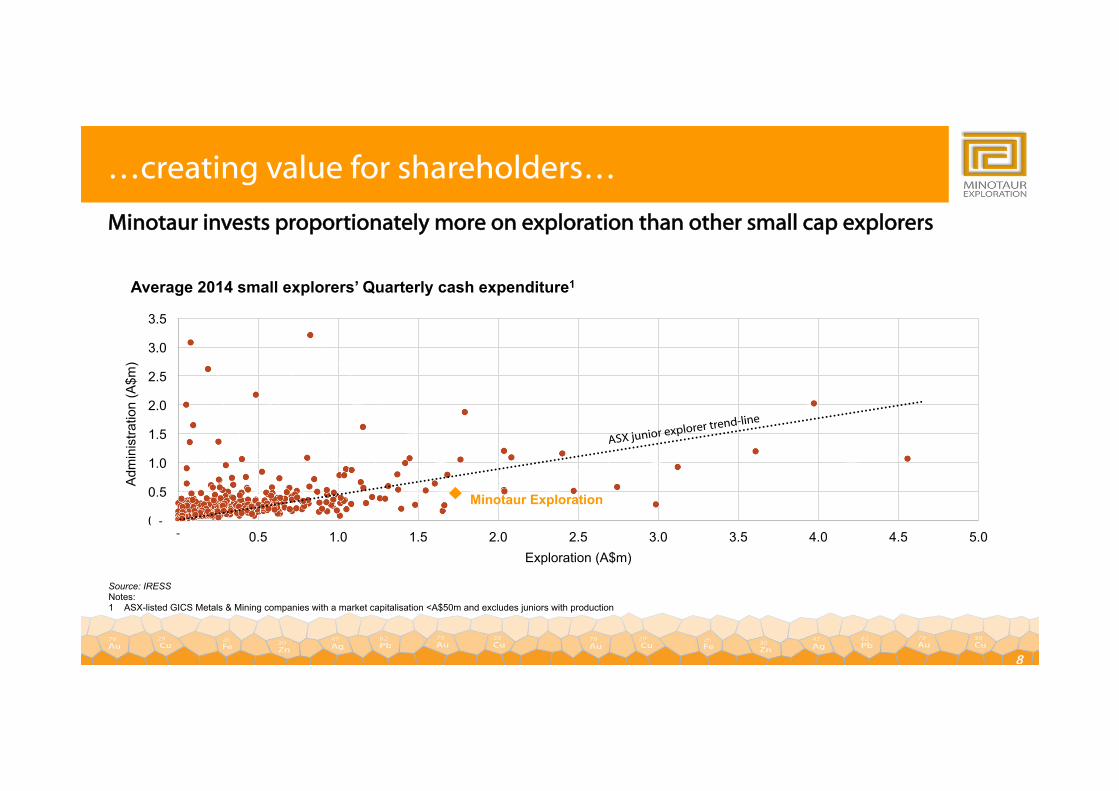
Average 2014 small explorers’ Quarterly cash expenditure1
…creating value for shareholders…
Minotaur invests proportionately more on exploration than other small cap explorers
Source: IRESS Notes: 1 ASX-listed GICS Metals & Mining companies with a market capitalisation <A$50m and excludes juniors with production
ASX junior explorer trend-line
- -

9
…while innovating through minerals focussed R&D
Minotaur maintains an active research and development program
§ Minotaur leverages its intellectual property through active R&D directed towards new discovery
methodologies and product development, such as;
‒ Geophysical anomaly discrimination (‘seeing through’) ultra conductive cover (overburden)
‒ Product innovation from kaolin and halloysite stocks
‒ Discovery tools for iron sulphide copper-gold mineralised systems
‒ Mineral systems mapping using new technologies
§ Annual refunds from ATO for R&D investment typically range A$0.6m to A$1.1m

10
Minotaur continues to believe in exploration
§ Base metal supplies forecast to tighten over next few years
§ as grades drop and mines are depleted
§ and the search for deeper, blind deposits intensifies…
§ the perceived value of exploration will return
§ Australian dollar returning to trend
§ Putting upward pressure on AUD commodity prices
§ and widening margins for high-grade deposits…
§ giving more impetus to the search for new ore bodies
§ Exploration success can translate into spectacular value creation
§ We’ve seen cyclical downturns come and go before, and…
§ this time it is NOT different
11
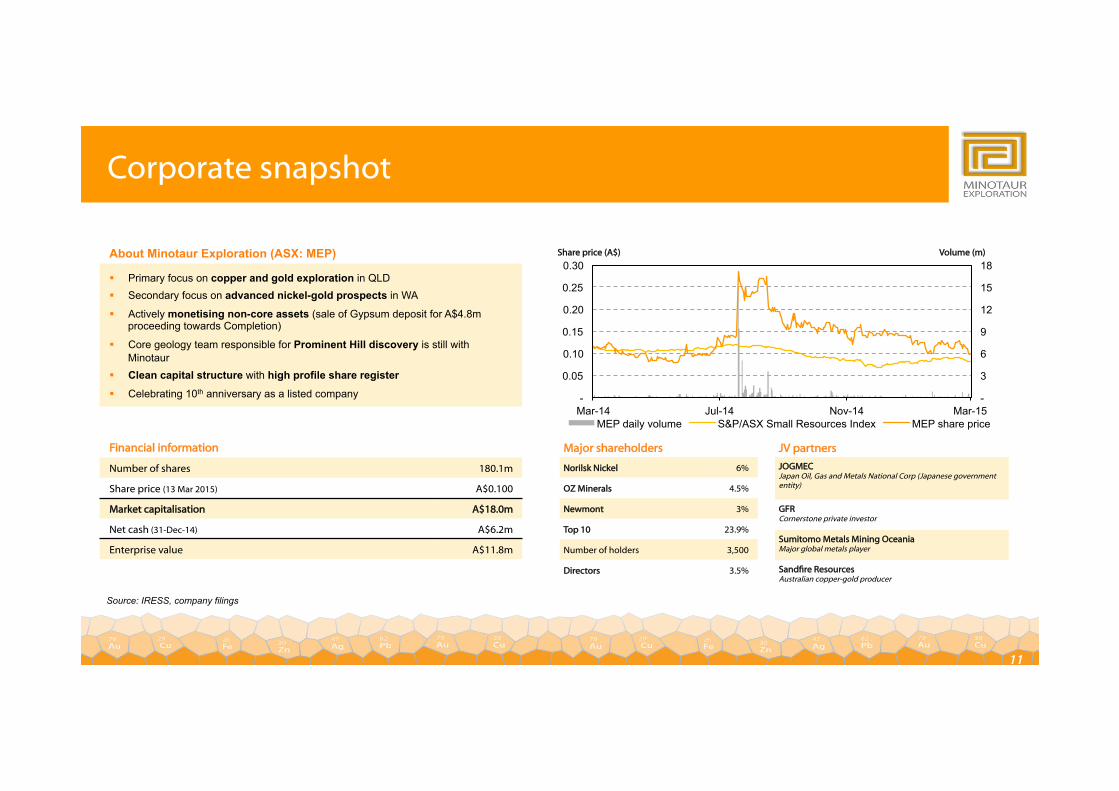
Corporate snapshot
Financial information
Number of shares 180.1m
Share price (13 Mar 2015) A$0.100
Market capitalisation A$18.0m
Net cash (31-Dec-14) A$6.2m
Enterprise value A$11.8m
About Minotaur Exploration (ASX: MEP)
§ Primary focus on copper and gold exploration in QLD § Secondary focus on advanced nickel-gold prospects in WA
§ Actively monetising non-core assets (sale of Gypsum deposit for A$4.8m proceeding towards Completion)
§ Core geology team responsible for Prominent Hill discovery is still with Minotaur
§ Clean capital structure with high profile share register
§ Celebrating 10th anniversary as a listed company
Source: IRESS, company filings
-
3
6
9
12
15
18
-
0.05
0.10
0.15
0.20
0.25
0.30
Mar-14 Jul-14 Nov-14 Mar-15 MEP daily volume S&P/ASX Small Resources Index MEP share price
Share price (A$) Volume (m)
JV partners
JOGMEC Japan Oil, Gas and Metals National Corp (Japanese government entity)
GFR Cornerstone private investor
Sumitomo Metals Mining Oceania Major global metals player
Sandre Resources Australian copper-gold producer
Major shareholders
Norilsk Nickel 6%
OZ Minerals 4.5%
Newmont 3%
Top 10 23.9%
Number of holders 3,500
Directors 3.5%

12
This presentation has been prepared by the management of Minotaur Exploration Limited (“Minotaur”, ASX: MEP) for the general benefit of analysts, brokers and investors and does not constitute specific advice to any particular party or persons. Information herein is based on publicly available information, internally developed data and other sources. Where an opinion, projection or forward looking statement is expressed in this presentation, it is based on the assumptions and limitations mentioned herein and is an expression of present opinion only. No warranties or representations are made or implied as to origin, validity, accuracy, completeness, currency or reliability of the information. Minotaur specifically disclaims and excludes all liability (to the extent permitted by law) for losses, claims, damages, demands, costs and expenses of whatever nature arising in any way out of or in connection with the information, its accuracy, completeness or by reason of reliance by any person on any of it. Where Minotaur expresses or implies an expectation or belief as to the success of future exploration and the economic viability of future project evaluations, such expectation or belief is expressed in good faith and is believed to have a reasonable basis. However, such projected outcomes are subject to risks, uncertainties and other factors which could cause actual results to differ materially from projected future results. Such risks include, but are not limited to, exploration success, metal price volatility, changes to current mineral resource estimates or targets, changes to assumptions for capital and operating costs as well as political and operational risks and government regulatory outcomes. MEP disclaims any obligation to advise any person if it becomes aware of any inaccuracy in or omission from any forecast or to update such forecast.
Disclaimer