100% for turkey 2020 ck edited - linking renewable energy ... · how is 100% renewable energy...
TRANSCRIPT

How is 100% Renewable Energy Possible for Turkey by 2020?
July 2011
Christopher Kick
Research Associate, Global Energy Network Institute (GENI)
Under the supervision of and edited by
Peter Meisen
President, Global Energy Network Institute (GENI)
www.geni.org
[email protected] (619) 595-0139
Turkey

2
Table of Contents
Table of Figures............................................................................................................................. 3
List of Abbreviations .................................................................................................................... 4
Abstract .......................................................................................................................................... 5
1. Key Facts ................................................................................................................................ 6
1.1 History, Current Energy Situation and Energy Prediction........................................................ 8 1.2 Electricity ............................................................................................................................. 9
1.3 Energy Demand Forecast and Current Government Energy Policies ................................ 11
2. Assessment of the Renewable Energy Potential in Turkey .............................................. 15
2.1 Hydropower ....................................................................................................................... 15
2.2 Solar Energy....................................................................................................................... 20
2.3 Present Situation and Outlook ........................................................................................... 22 2.4 Wind Energy ...................................................................................................................... 23
2.5 Geothermal Potential ......................................................................................................... 27 2.6 Biomass Potential............................................................................................................... 29 2.7 Comparison of Electricity Potential for Renewable Energies ........................................... 30
3. Electricity Grid and Cross-border Interconnections ....................................................... 32
4. Conclusion and Outlook ...................................................................................................... 35
5. Bibliography ......................................................................................................................... 38

3
Table of Figures Figure 1: General Statistics of Turkey Compared to Germany ...................................................... 7 Figure 2: Turkey’s Primary Energy Consumption 1970 – 2006 and Share of Renewable Energy. 9
Figure 3: Electricity and Fuel Break Down of the Total Primary Energy Supply in 2010 .......... 10
Figure 4: Distribution of Primary Energy Sources in Electricity Production. .............................. 11 Figure 5: Projection of Distribution Development for Domestic Energy Resources in Total Primary Energy Consumption....................................................................................................... 12
Figure 6: Incentives Enacted by the Turkish Government to Foster Electricity Production from Renewable Energy ........................................................................................................................ 13
Figure 7: Natural hydropower potential in TWh/Year ................................................................. 16 Figure 8: Main Rivers of Turkey .................................................................................................. 17
Figure 9: Turkey’s Economically Feasible Hydropower Potential Broken Down by Main River Basins ............................................................................................................................................ 18
Figure 10: Irradiation Map of Turkey with Average Annual Energy in kWh/m2 2004 – 2010 ... 20 Figure 11: Average Sunshine Per Year and Average Annual Sun Intensity ................................ 21
Figure 12: Total area Needed to Meet Electricity Demand in 2010 and 2020. ............................ 22
Figure 13: Breakdown of Turkey’s Wind Power Potential, Total Installed Capacity and Regional Distribution – 2010 ...................................................................................................................... 24 Figure 14: Projection of Development of the Share of Domestic Energy Sources in Overall Primary Energy Consumption....................................................................................................... 24
Figure 15: Turkey’s Technical Wind Power Potential ............. Error! Bookmark not defined. 25
Figure 16: Development of Wind Power Capacity 2005 –2011. .................................................. 26 Figure 17: Map of Turkey with Geothermal Felds, Volcanoes, Faults, Main Power and Heating Plants ............................................................................................................................................. 28
Figure 18: Geothermal Potential – Share of Use and Development of Installed 2001 – 2020 .... 29
Figure 19: Biomass Electricity Potential and Share of Use .......................................................... 29 Figure 20:Biomass Gasification Machine for Solid Fuels ........................................................... 30
Figure 21: Assessment of Minimum/Maximum Electricity Produced From Renewable Energy Sources 2010 ................................................................................................................................. 31
Figure 22: Turkey’s 2010 Electricity Grid in 2010 and Existing/Planned Thermal and Hydro Power Plants y. Source: International Energy Agency, Turkey 2009 Review (modified by author)....................................................................................................................................................... 33
Figure 23: Map of Turkey with Primary Areas for Renewable Energy Resource. ....................... 34
Figure 24: Primary Energy and Electricity Demand for 2010 and 2020 (Predicted) ................... 36
Figure 25: Total Electricity Cost Including Construction, Production and Decommissioning for Renewal Energy ............................................................................................................................ 37

4
List of Abbreviations
Organizations
DSI – State Hydraulic Works Company (Devlet Su İşleri) ENTESO-E – European Network of Transmission System Operators for Electricity IEA – International Energy Agency IMF – International Monetary Fund SPO – State Planning Organization TEUAS – Turkish Power Generation Company TEIAS – Turkish Electricity Transmission Corporation TETTAS – Turkish Electricity Trading and Contracting Company MEMR – Ministry of Energy and Natural Resources TEK – Turkey Electricity Authority
Power Terminology
Power is the rate at which energy is generated or consumed. Watts per hour properly refers to the change of power per hour.
GWh – GigaWatt hour: The gigawatt is equal to one billion (109) watts or 1 gigawatt = 1000 megawatts. kV – kiloVolt KW – Kilowatt kWh – kiloWatt hour kWh/m – Kilowatt hours per meter squared kWp – Kilowatt peak Mtoe – Megatons of Oil equivalent: One megaton is a value based on the amount of energy released by burning one ton of crude oil or 6.6 – actual barrels of oil to produce 11.63 MWh of electricity. MV –MegaVolt: A megavolt is 1 million volts in electronics and physics. MW – MegaWatt: a megawatt is equal to one million (106) watts MWe – MegaWatt electrical MW t – Megawatt thermal PV – Photovoltaic TPES – Total primary energy supply – the total amount of energy to meet the country’s basic utility needs TWh – Terawatt hours: one terawatt is equal to one trillion (1012) watts

5
Abstract
Located between 36 – 42 north latitude and 26 – 45 east longitude, bordering the
Mediterranean, Aegean and Black Seas, Turkey is blessed with renewable resources. Among the
European Union, it has the highest hydropower, wind and geothermal energy potentials, which
equals 150 TWh, 200 TWh, and 15 TWh respectively1. It also has an abundant annual solar
energy potential equivalent to 1.3 mega tons of oil equivalent (Mtoe) or 15,120 TWh
respectively2. The annual biomass potential is projected at around 372 TWh.1 However, the
country has become more dependent on foreign countries in order to cover its day-to-day energy
demands. While 77% of the total primary energy consumption in 1970 was met by indigenous
energy sources, this percentage decreased to 28% in 2003.
There are various reasons for this development. The main one is the uneven growth of new
installed energy capacity in relation to the much faster growth of total energy demand, mostly
attributed to Turkey’s rapidly growing population and economy. Another major reason is cheap
access to fossil fuels, primarily natural gas and oil, as a result of Turkey’s role as a transit
country for fossil fuels. According to the government’s most probable scenarios, Turkey’s
primary energy supply is expected to double within a decade, reaching 2,442 TWh in 2020.3
In order to decrease carbon dioxide (CO2) emissions, fight climate change, and increase
energy security while decreasing its dependences on foreign countries, the Turkish government
took actions to exploit its indigenous resources and raise the share of the renewable energies in
the electricity production. For this reason, several incentives to foster electricity generation from
renewable energy sources have been developed and finally enacted in various laws (namely Law
No.5346, which was enacted in 2005 and restructured by Law No.6094 in 2010). The goal of this
report is to assess the renewable energy potential of Turkey to better understand realistically a
100% renewable energy scenario by 2020. Starting with the current energy situation and
electricity grid infrastructure, the report also serves as a guideline, giving well investigated facts
and future predictions of energy and energy potential in Turkey.
1 Kemal Baris and Sherhat Kucukali, December 2010 2 Farkan Dinçer, July 2011 3 Euracoal, Key Facts of Turkey, 2011

6
1. Key Facts
Turkey is a country with an area of 783.562 km2 and a population of 74,724,269 people.
Located at the border between Europe and Asia it acts as a transit country for fossil fuels. The
Turkish economy is defined as a largely developed, emerging market by the IMF, making it one
of the world’s newly industrialized countries. The country is one of the leading producers of
agricultural products, motor vehicles, textiles, ships and other transportation equipment,
consumer electronics, construction materials and home appliances. With a gross domestic
product (GDP) of $1.116 trillion in 2010, it is the 15th largest economy in the world4. With an
annual population growth over 10%, Turkey is expected to have 80.2 million people by 2020. At
the same time, the IMF5 predicts an average economic growth of 5.4% per year until 2015.
These developments are expected to continue in the coming years and will inevitably lead to
increased energy demand. In order to understand Turkey on a global scale, a comparative
visualization of the current general statistics of Turkey and Germany are shown in Figure 1.
Despite an area more than twice the size of Germany and a similar number of people, the 2011
GDP was only about one-third that of Germany. Therefore, the energy consumption and the C02
emission are also one-third those of Germany.
4 International Monetary Fund, World Economic Outlook, 2011 5 Ibid.

7
Turkey Germany
Population in 2011 74,724,269
Area 783,562 km2
Density in 2011 97/km2
GDP in 2011 1.073 trillion $
GDP per capita in 2011 14.5 $
Total energy consumption 2010 1218 TWh
Total energy consumption per capita 2010 16.3 MWh
C02 emissions in 2009 253 million tones
C02 emissions per capita in 2009 3.6 tonnes
Figure 1: General Statistics of Turkey Compared to Germany Source: Author with data from the International Monetary Fund, World Economic Outlook, 2011

8
Overview
In 2010
Primary energy demand:
1,221 TWh.
90% of this mostly imported fossil
fuels; the rest provided by
renewable energies (mostly
biomass).
Electricity demand: 211 TWh
73.5% of this fossil fuels; the rest
mainly provided by hydro power.
Installed capacity: 50 GW.
Prediction for 2020:
Primary energy demand:
2587 TWh.
About 91% of this mostly
imported fossil fuels, rest
1.1 History, Current Energy Situation and Energy Prediction
In 1970, Turkey’s primary energy consumption was
19 Mtoe (221 TWh), whereas in 2010, it reached 105 Mtoe
(1221 TWh). For 2020, it is predicted to increase to 222.4 Mtoe
(2587 TWh)6. However, the share of renewable energy sources
in primary energy consumption decreased steadily in the years
from 1980 – 2006, as shown in Figure 2. While in 1970, the
renewable energies could meet about 35%; in 2010, they only
covered around 10%7. Biomass and, in recent years, hydro
energy produced almost all energy within the renewable
energy. At the same time, the primary energy production-
consumption coverage decreased constantly from 76.9% to
29%.8 The energy gap between demand and domestic
production is covered by imports of natural gas, oil and hard
coal, making Turkey highly dependent on foreign countries.
Today’s shares of fuels in total energy supply are given in Figure 3.
6 Op cite, note 1 7 International Energy Agency, IEA Energy Statistics – Energy Balances for Turkey, 2010 8 Op cite, note 2

9
Figure 2: Turkey’s Primary Energy Consumption 1970 – 2006 and Share of Renewable Energy. Source: International Energy Agency, IEA Energy Statistics – Energy Balances for Turkey, 2010
1.2 Electricity
Since 1902, when a 2 kW hydropower system started generating electricity in Turkey, the
renewable share within the overall energy consumption has been increasing constantly at an
annual average growth of 8% to 210 kWh, a total share of 27% within the primary energy
consumption. From 1971 to 2009, the electricity consumption per capita rose from 268 kWh to
2296 kWh, about one-third of the consumption of Germany. In 2002, 99.9% of the Turkish
people had access to the electricity grid, and the total installed power generation capacity
reached 31,845.8MW9. According to several studies, the electricity demand is expected to be
between 440 and 485 TWh in 2020.10 To meet the predicted demand, the current installed energy
capacity of about 50 GW has to be extended to 80 – 96 GW.
9 Kemal, Yilanci, and Atalay, “ 2007 10 Op cit., note 1.

10
Figure 3: Electricity and Fuel Break Down of the Total Primary Energy Supply in 2010 Source: International Energy Agency, Key Statistics, 2011
As shown in Figure 3 for 2010, fossil fuels like natural gas, coal and oil provided almost 90%
of Turkey’s total primary energy supply. In terms of electricity supply, 73.5% is covered by
those CO2 intensive fuels. The rest is met by renewable energy resources, of which 92.8% is
provided by hydro power. Only about 7% of the electricity is provided by wind, geothermal,
biomass and solar currently.
The distribution of fuels in Turkey’s electricity production has shifted tremendously toward
natural gas, making it the main contributor to electricity supply. According to Figure 3, Turkey
imported an average of 95.7% of its used natural gas in the years of 1988-2003. The
development of the fuel distribution in the years of 1940-2009 is shown in Figure 4. As it can be
seen in the chart, coal covered 86% of the energy demand in 1940. The remaining part was met
by renewable energies (8% mostly hydroelectric power) and natural gas (6%). Through the
years, a constant increase in use of natural gas can be observed. Particularly after 1990, the
increased use of imported natural gas altered the shares, leading to a fuel distribution of 19%
renewable, 52% natural gas and 29% coal in 2009.

11
Figure 4: Distribution of Primary Energy Sources in Electricity Production. Source: Mehmet Çapik, Ali Yılmaz, and Ibrahim Çavuşoğlu, “Present situation and potential role of renewable energy in Turkey,” Renewal Energy, 2011
1.3 Energy Demand Forecast and Current Government Energy Policies
The majority of well-researched energy surveys for Turkey predict the total primary energy
demand is expected double by 2020, reaching 222.4 Mtoe (2586 TWh). Figure 4 above shows
the distribution of the energy according to energy reports published by the Ministry of Energy
and Natural Resources in 2006 and 2010. This survey assumes a constant dependence on
imported fuels for the years to come. According to the report, about 70% of the energy demand
will be covered by fossil fuels from foreign countries. The remaining 30% will be met by
domestic resources, whereas about 60% will be covered by hard coal and lignite, about 30% by
renewable resources and about 10% by other indigenous resources.

12
Figure 5: Projection of Distribution Development for Domestic Energy Resources in Total Primary Energy Consumption. Source: Yılmaz, A. O., Renewable Energy and Coal Use in Turkey, 2010.
Rising energy demand, holding on to the current energy mix, inevitably leads to a rise in the
CO2 emissions of the country. Although Turkey is a party to the United Nations Framework
Convention on Climate Change and became a member to the Kyoto Protocol in 2009, it decided
not to set any quantitative targets to limit CO2 emissions. Nevertheless, recently Turkey
determined its commitments to reduce green house gases by setting up a unilateral quantitative
target for CO2 emissions in the energy sector.
The development of the CO2 emissions has been investigated by many scientists around the
world. The majority of them, however, predict a strong increase in the CO2 emissions by 2025.
According to the Turkey Review 200 published by the International Energy Agency, the CO2
emissions of the country will reach 604 metric tonnes (Mt) in 2020, almost 5 times the emissions
of the year 1990. In order to fight the CO2 emission levels, the Ministry of Environment and
Forestry set up a National Climate Change Strategy, which provides an increase in energy
efficiency as an increase of the share of renewable energy.

13
In terms of the electricity, Turkey intends to meet 30% of predicted demand with renewable
energies by 2023. Therefore, different laws to foster renewable energies have been enacted. The
principle points of these laws are a variety of incentives for individuals and corporate entities
producing electricity out of renewable energy, which are explained in detail in Figure 6.
Mechanism Incentives
Licensing
• Individuals and corporate entities granting an exemption from licensing and setting up a company with a capacity less than 500 kW for building electricity generation facilities out of renewable energy sources.
• Corporate entities applying for a license only will pay 1% of the licensing cost. Furthermore, they do not pay licensing costs for the first 8 years.
• Priority is given for system connection.
Land
Appropriation
• Real properties, which are either regarded as forest or the private property of Treasury, are leased or right of easement or usage permits are given to such properties.
• Forest Villagers Development Revenue, Forestation and Erosion Control Revenues are not demanded during the first 10 years: 85% discount is granted for rent, right of easement and usage permits.
Purchase
Guarantee
• The Turkish government guarantees, via a feed-in tariff, to buy electricity out of renewable energy plants, built or to be built between 18.05.2005 and 31.12.2015, for 10 years for a fixed price depending on the used renewable energy.
• The government also promotes domestic manufacturing of the equipment to be used in power plants through additional feed-in tariff.
• Feed-in-tariff amounts and duration for renewable power plants to be built after 31.12.2015 will be decided by Turkish Council of Ministers
Figure 6: Incentives enacted by the Turkish Government to Foster Electricity Production from Renewable Energy Source: Author with data from Yılmaz, A. O., Renewable Energy and Coal Use in Turkey, 2010
The predicted development of the Turkish CO2 emissions seems to be inadequate in terms of the
climate change, one the major future global problems.

14
The pivotal question is: How is it possible for Turkey to mitigate its CO2 emissions to the
smallest feasible level? One answer would be to use the abundant renewable energy potential to
produce electricity and, therefore, replace the fossil fuels currently used for its production.
Depending on the economic feasibility of generating electricity from renewable energy
resources, industrial processes, as well as transportation, could be transformed from fossil fuel
intensive sectors into electricity intensive, using power produced from renewable energies with a
CO2 footprint far less then out of fossil fuels. In addition, electricity cross-border connections
could function as a buffer to stabilize the grid and provide access to electricity whenever it is
needed. Further advantages of this energy transition would be increased energy independence,
leading to greater energy security and price stability.

15
Overview Hydropower
Economically feasible potential: ~168 TWh
In 2010 Predicted in 2020
Prod. energy: 48 TWh 155 TWh Inst. capacity: 14 GW 63 GW
Solar power
Natural potential outweighs electricity demand by 68 (31) times in 2010 (2020). Economically feasible potential depends on the available area. 1.1 (2.5) times the size of Istanbul is enough to cover the electricity demand in 2010 (2020)
Wind power
Economically feasible potential: ~35-70 TWh
In 2010 Predicted in 2020
Prod. energy: 2.9 TWh n.a. Inst. capacity: 1.8 GW n.a.
Geothermal power
Economically feasible potential: ~4.5 GWe
In 2010 Predicted in 2020
Prod. energy: 0.67 TWh n.a. Inst. Capacity : 0.1 GW n.a.
Biomass
Economically feasible potential:
~200 TWh
In 2010 Predicted in 2020
Prod. energy: 0.45 TWh n.a. Inst. capacity: n.a. n.a.
2. Assessment of the Renewable Energy Potential in Turkey This section focuses on the assessment of the different
renewable energy resources in the country. For most of the
renewable energies analyzed, an assessment of the natural,
technical and economically feasible potential of the
producible energy or installed capacity is made. The natural
potential refers to the theoretical natural potential; the
technical potential equals the current technical exploitable
potential (without attention to the entailed price) whereas the
economically feasible potential describes the remaining
renewable potential which can be exploited for a price,
acceptable to the economy.
2.1 Hydropower
Turkey has an overall natural hydropower potential of
430 terawatt hours (TWh), which is about 1.1% of the
worldwide and 13.75% of the European potential.11
However, only about 30% (130 TWh) of the potential is
deemed to be economically feasible.
11 Dursun and Gokcol, 2011

16
1%
7%
100%
Turkey Europe World
Natural hydropower potential
0 50 100 150 200 250 300 350 400 450
Natural potential Technical potential
Economically feasible potential Additional potential through small HEPP
Breakdown of Turkey's hydropower potential in TWh/year
130Used
potential in 2010
38
215 57
430
Figure 7: Natural hydropower potential in TWh/Year Source: Author with data from Dursun and Gokcol, “The Role of Hydroelectric Power and Contribution of Small Hydropower Plants for Sustainable Development in Turkey,” Renewable Energy, April 2011
Recent investigations of small hydroelectric power plants assume an additional economical
energy potential of 38 TWh per year. Ninety-sever percent (97%) of this economic potential is
located in 14 of Turkeys 26 river basins. Figure 7 summarizes these facts, allowing a quick and
easy understanding. The main rivers in Turkey are shown in Figure 8. Most of them are located
in Turkey’s eastern regions. Basically, the Euphrates and the Tigris River with their far ranging
watershed area and higher elevation contribute to the country’s abundant potential, allowing
people to build large power plants. In addition, small power plants on rivers with a lower
elevation range and drainage area, mostly situated in the western areas, are suitable to produce
electricity.
17
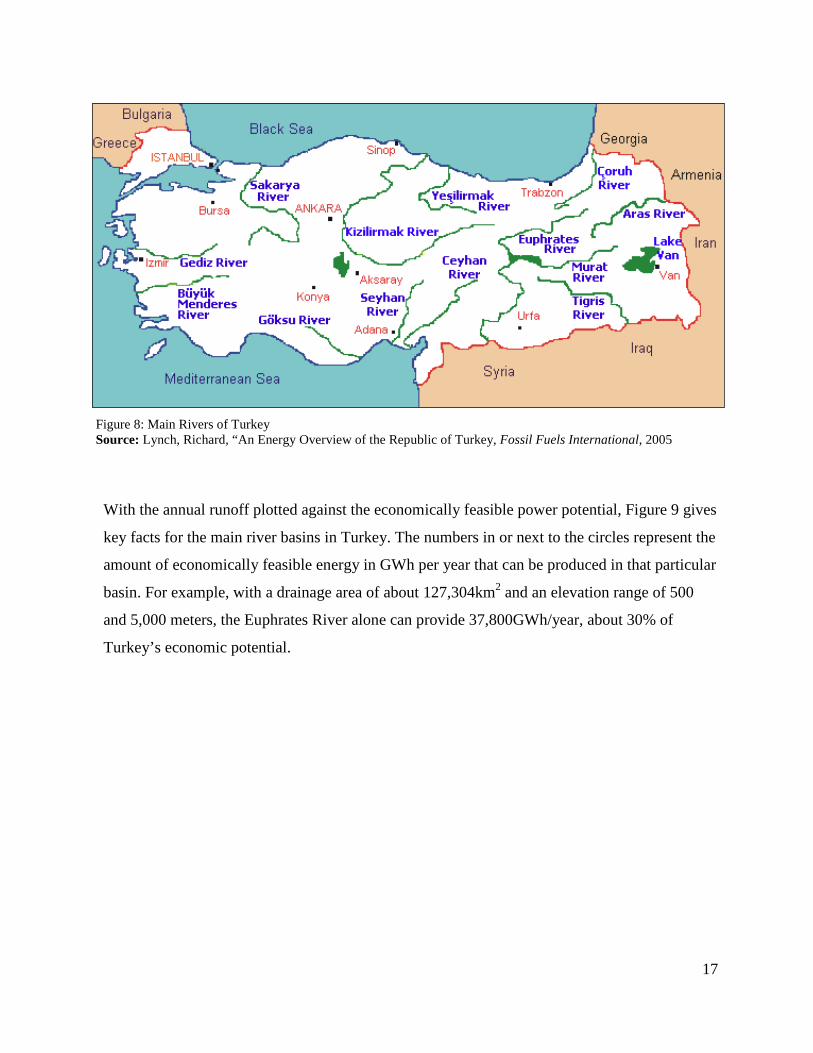
Figure 8: Main Rivers of Turkey Source: Lynch, Richard, “An Energy Overview of the Republic of Turkey, Fossil Fuels International, 2005
With the annual runoff plotted against the economically feasible power potential, Figure 9 gives
key facts for the main river basins in Turkey. The numbers in or next to the circles represent the
amount of economically feasible energy in GWh per year that can be produced in that particular
basin. For example, with a drainage area of about 127,304km2 and an elevation range of 500
and 5,000 meters, the Euphrates River alone can provide 37,800GWh/year, about 30% of
Turkey’s economic potential.

18
0
5
10
15
20
25
30
35
40
0.5 5
Run
off i
n T
m3 /
yea
r
Power potential in GW
Euphrates Tigris East Black Sea
Coruh Seyhan East Mediterranean
Kizilirmak Ceyhan Antalya
Yesilirmak West Sakarya
West Black Sea Aras
1 2 3 4 10
37,8
2,1
16,6
13,2
11,0
6,7
6,46,0
5,0
2,62,7
7,0
3,2
5,3
Figure 9: Turkey’s Economically Feasible Hydropower Potential Broken Down by Main River Basins Source: Baris and Kucukali, “Availibility of Renewable Energy Sources in Turkey: Current Situation, Potential, Government Policies and the EU Perspective” Energy Policy, December, 2010
The economically feasible power potential (GW) is a function of the runoff (Tm3/year) of the
main river basins in Turkey. The number inside/next to the circle represents the economically
feasible energy potential in GWh/year.

19
2.1.1 Current Situation, Main Projects and Predicted Hydropower Energy by 2020
Since 2009, 172 hydroelectric power plants, with a total installed capacity of 13.7 GW and an
annual energy production of 47.8 TWh, are in operation. Another 94 HEPPs, with a total
capacity of 5, 2 GW and an annual energy potential of around 17,560 GWh, are under
construction. An additional 542 hydroelectric plants will be constructed in the future, reaching a
total installed capacity of 63.24 GW and an annual production of about 155 TWh in 202012.
Based on a recently released study by the State Hydraulics Company on small hydro power
plants, about 5 TWh/year of additional technical energy potential could be gained, whereas 3
TWh of that potential is deemed to be economically feasible. Exploiting all of its economic
potential, 32 – 035% of the predicted electricity demand ranging between 440 and 480 TWh can
be met by electricity from hydro power plants.
2.1.2 Southeastern Anatolian Project
The Southeastern Anatolian Project (Güneydoğu Anadolu Projesi or GAP), one of the largest
power generation, irrigation and development projects of its kind in the world, is being
constructed by DSI. This project affects 7.4 million acres of agricultural land and about 7.35
million people in 9 cities. The main advantages for the region will be to expand access to power
for residents and the possibility of irrigating about 10% of the cultivable land in Turkey. The
undertaking includes 13 projects, seven (7) in the Euphrates and six (6) in the Tigris basin, and
includes 22 dams, 19 hydroelectric power plants and irrigation schemes in an area extending
over 4.4 million acres. The total cost of the project is estimated to be $32 billion. The total
installed capacity of its power plants will be 7490 MW, which implies an annual energy
production of 27 TWh.
2.1.3 The Coruh Project
DSI is building the Coruth River Project. It will have a capacity of 8,260 GWh/year. This
hydro power project, located in the Coruh River basis will provide 6.4% of Turkey’s total
electricity generated by hydro power plants.
12 Ibid
20
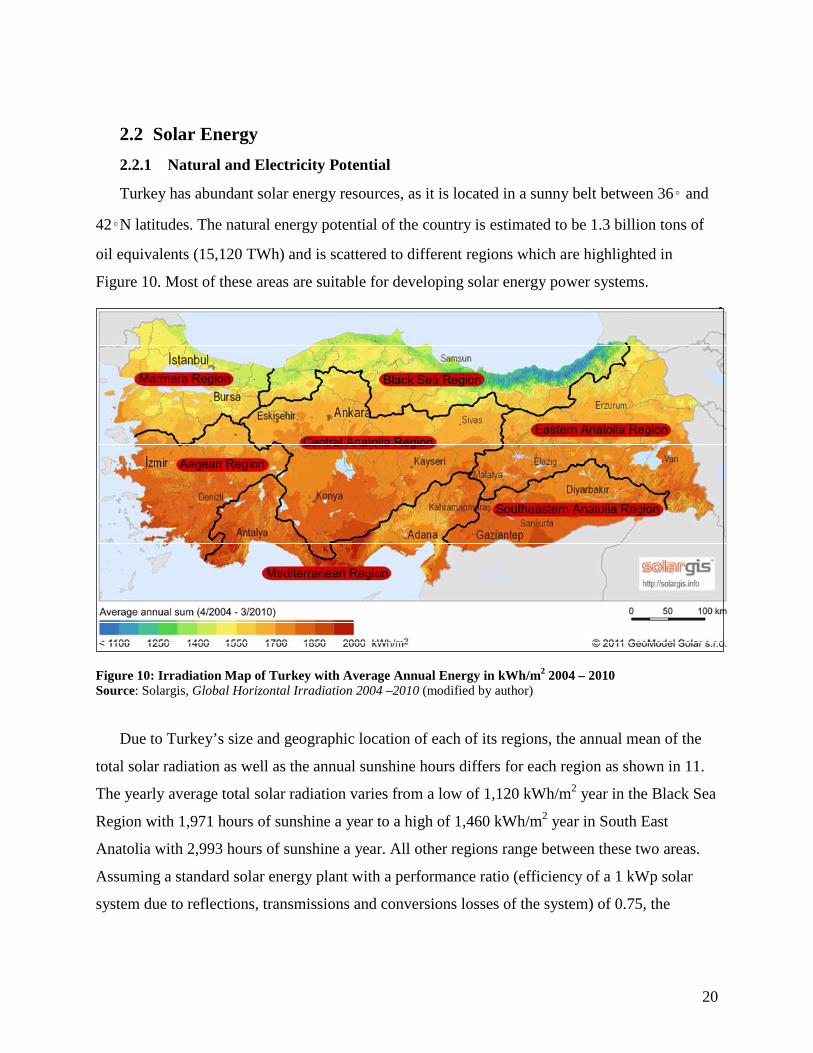
2.2 Solar Energy
2.2.1 Natural and Electricity Potential
Turkey has abundant solar energy resources, as it is located in a sunny belt between 36◦ and
42◦N latitudes. The natural energy potential of the country is estimated to be 1.3 billion tons of
oil equivalents (15,120 TWh) and is scattered to different regions which are highlighted in
Figure 10. Most of these areas are suitable for developing solar energy power systems.
Figure 10: Irradiation Map of Turkey with Average A nnual Energy in kWh/m2 2004 – 2010 Source: Solargis, Global Horizontal Irradiation 2004 –2010 (modified by author)
Due to Turkey’s size and geographic location of each of its regions, the annual mean of the
total solar radiation as well as the annual sunshine hours differs for each region as shown in 11.
The yearly average total solar radiation varies from a low of 1,120 kWh/m2 year in the Black Sea
Region with 1,971 hours of sunshine a year to a high of 1,460 kWh/m2 year in South East
Anatolia with 2,993 hours of sunshine a year. All other regions range between these two areas.
Assuming a standard solar energy plant with a performance ratio (efficiency of a 1 kWp solar
system due to reflections, transmissions and conversions losses of the system) of 0.75, the
21
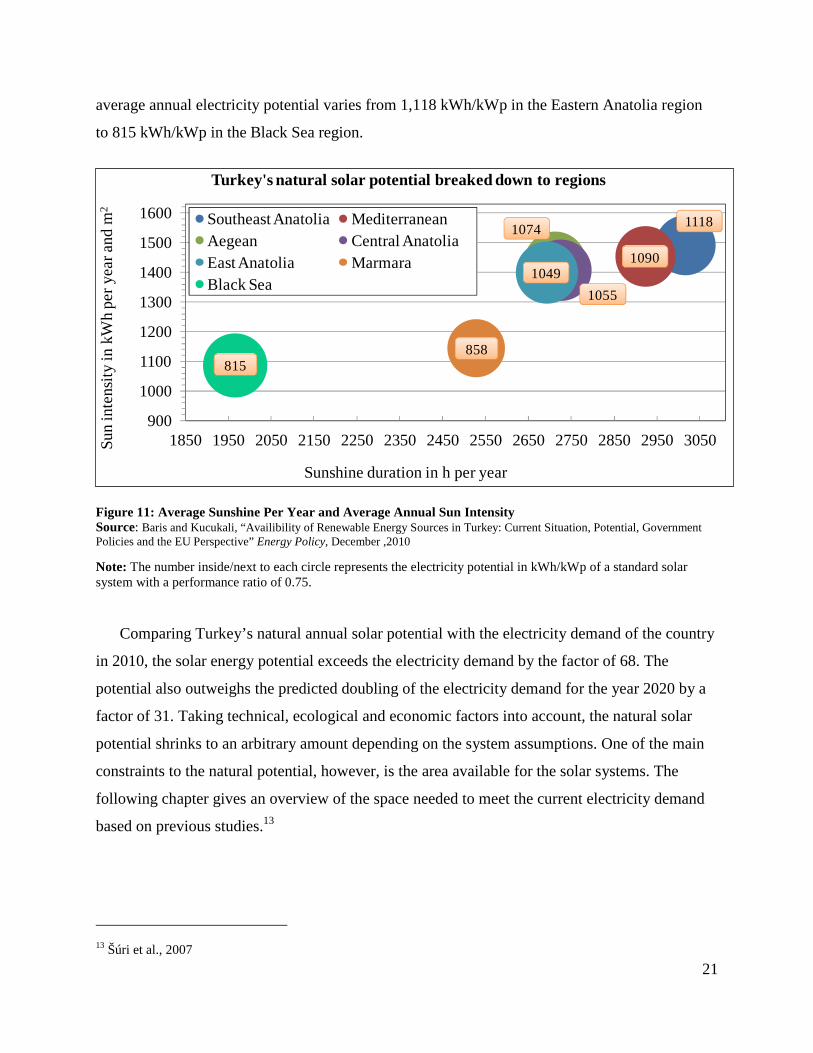
average annual electricity potential varies from 1,118 kWh/kWp in the Eastern Anatolia region
to 815 kWh/kWp in the Black Sea region.
900
1000
1100
1200
1300
1400
1500
1600
1850 1950 2050 2150 2250 2350 2450 2550 2650 2750 2850 2950 3050Sun
inte
nsity
in k
Wh
per
yea
r a
nd m2
Sunshine duration in h per year
Turkey's natural solar potential breaked down to regions
Southeast Anatolia MediterraneanAegean Central AnatoliaEast Anatolia MarmaraBlack Sea
858815
1049
1055
1074
1090
1118
Figure 11: Average Sunshine Per Year and Average Annual Sun Intensity Source: Baris and Kucukali, “Availibility of Renewable Energy Sources in Turkey: Current Situation, Potential, Government Policies and the EU Perspective” Energy Policy, December ,2010
Note: The number inside/next to each circle represents the electricity potential in kWh/kWp of a standard solar system with a performance ratio of 0.75.
Comparing Turkey’s natural annual solar potential with the electricity demand of the country
in 2010, the solar energy potential exceeds the electricity demand by the factor of 68. The
potential also outweighs the predicted doubling of the electricity demand for the year 2020 by a
factor of 31. Taking technical, ecological and economic factors into account, the natural solar
potential shrinks to an arbitrary amount depending on the system assumptions. One of the main
constraints to the natural potential, however, is the area available for the solar systems. The
following chapter gives an overview of the space needed to meet the current electricity demand
based on previous studies.13
13 Šúri et al., 2007

22
2.2.2 Area Needed to Cover Current Electricity Demand
Based on studies done by the EIE, Turkey’s average annual total sunshine duration is 2,640
hours (a total of 7.2 hours per day); the average total solar radiation is estimated to 1,311kWh/m2
year (daily total of 3.6 kWh/m2) which provides an annual energy potential of about 1,512 TWh.
With a size of 783,562 km2 and an electricity demand of 211.2 TWh in 2010, the area necessary
to meet the demand is less than 0.26% of the total size of Turkey. This is about 1.1 times the size
of Istanbul or 0.8 times the size of Ankara, the capital of Turkey. To cover the predicted
electricity demand for 2020, 0.6% of the total area of Turkey, an area with a size of about 2.5
times of Istanbul would be needed.14 Figure 12 visualizes these facts.
In 2010 1.1the size of
In 2020 2.5the size of
Area needed to cover 100 % of the electricity demand of Turkey
Figure 12: Total Area Needed to Meet Electricity Demand in 2010 and 2020. Source: International Monetary Fund, World Economic Outlook, 2011
2.3 Present Situation and Outlook
The total installed capacity of solar panels in 2011 was 7 MWp. It is estimated that 4 to 5 MW
will be installed in 2012, 50 to 100 MW in 2013, and as much as 1000 MW in 2014. It is not
expected that any large, utility scale projects will be constructed before 2014. Therefore, it is not
likely that solar power will play a major role in Turkey’s electricity supply in the near future.
14 General Directorate of Electrical Power Resources Survey 2010

23
2.4 Wind Energy
Due to its geographic location, Turkey is under the influence of different pressure systems. In
winter, the Island High Pressure system expands its impact area to southern latitudes of Turkey,
causing strong, gusting winds from the north and especially north eastern directions. Anatolia,
especially the western side, is under the influence of western and north western winds. In
summer, Turkey is influenced by the Azores High Pressure center, causing constant winds from
the north, especially in the western regions of Turkey. The strong gradient of the Azores High
Pressure center and the Basra Low Pressure center in the east creates gusting north eastern winds
in the eastern region. Southern, as well as eastern regions are generally under the impact of
winds from the south and south-eastern direction.
2.4.1 Natural and Electricity Potential
The technical wind energy potential is estimated to be about 114 GW of capacity in regions
where the wind speed is higher than 7.0 meters above the ground at 50 meters height.15
Approximately 20GW of this potential is estimated to be economically feasible in Turkey, as
shown in Figure 13. Assuming a capacity factor, which represents the share of actual produced
power by a wind power plant compared to the theoretical maximal energy production over the
year of the same wind power plant, between 20 and 40% the annual energy production is
estimated. Turkey’s technically feasible electricity potential from wind power plants ranges
between 200 and 400 TWh. However, the economically feasible potential lies between 35 and 70
TWh. As shown in Figure 13, only 1.8GW (about 9%) of the economically feasible potential has
been exploited at the end of 2011. The main installed wind power plant capacity in 2009
however, is distributed to only 3 regions – Aegean, Marmara and Mediterranean, which is shown
in Figure 14.
15 General Directorate of Electrical Power Resources Survey,Turkey Energy Efficiency Report, 2011

24
0 20 40 60 80 100 120
Breakdown of Turkey's wind power potential in GW
Technical potential Economically feasible potential
Used potentialin 2011
(1.8 GW)
114
20
Marmara Region31%
Aegean Region43%
Mediterranean Region26%
Distribution of installed wind power capacity in 2009
Figure 13: Breakdown of Turkey’s Wind Power Potential, Total Installed Capacity and Regional Distribution – 2010 Source: Gencer, et. al, Wind Energy Potential In Turkey, 2010
Figure 14: Projection of Development of the Share of Domestic Energy Sources in Overall Primary Energy Consumption. Source: İsmet Akova, “Development of Wind Energy in Turkey,: EcoGeo, 201,

25
The reason for the distribution can be understood by looking at Figure 14, which shows the
wind speed and the associated wind power at 50 m. The main wind potentials are located at the
coastlines of the Marmara and Aegean regions, as well the coast of the Black sea region. Just
these three (3) regions contain about 74% of the technical potential.
Note: The calculation of the final energy product (y-axis) assumes an average capacity factor of 0.25.
Figure 15: Turkey’s Technical Wind Power Potential Source: Baris, Kemal and Kucukali, Sherhat, “Availibility of Renewable Energy Sources in Turkey: Current Situation, Potential, Government Policies and the EU Perspective” Energy Policy, December 2010 (modified by author)
26
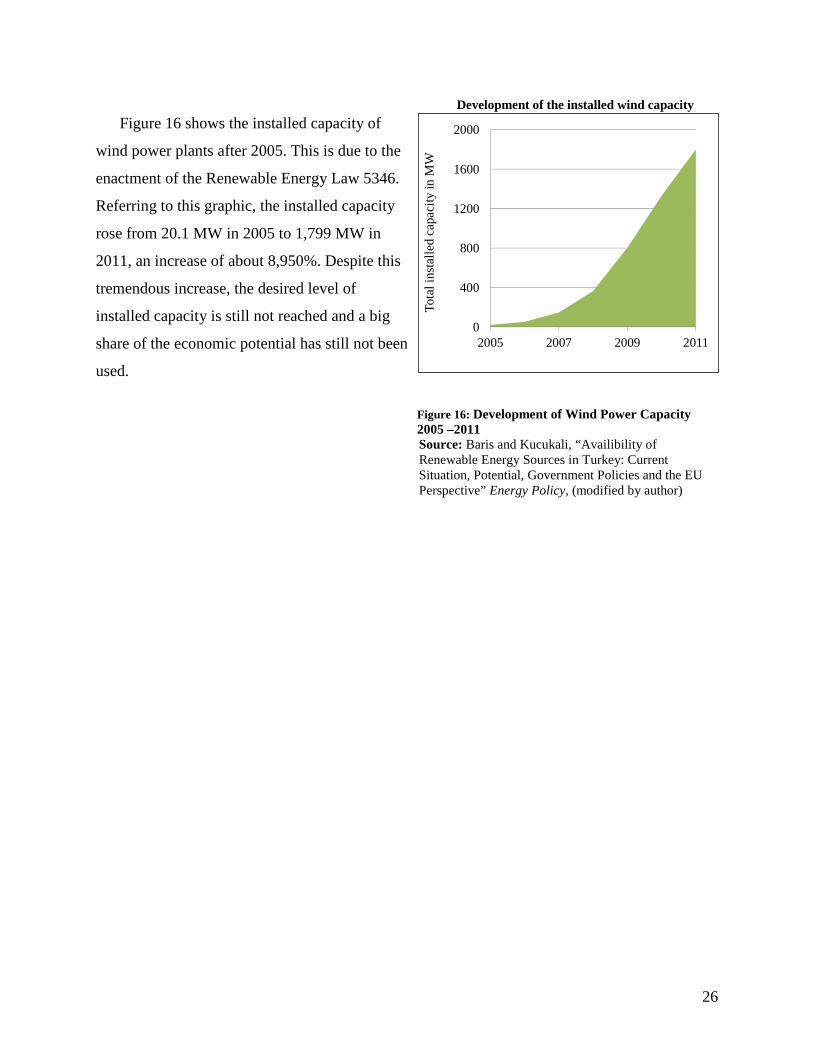
Figure 16 shows the installed capacity of
wind power plants after 2005. This is due to the
enactment of the Renewable Energy Law 5346.
Referring to this graphic, the installed capacity
rose from 20.1 MW in 2005 to 1,799 MW in
2011, an increase of about 8,950%. Despite this
tremendous increase, the desired level of
installed capacity is still not reached and a big
share of the economic potential has still not been
used.
Source: Baris and Kucukali, “Availibility of Renewable Energy Sources in Turkey: Current Situation, Potential, Government Policies and the EU Perspective” Energy Policy, (modified by author)
Figure 16: Development of Wind Power Capacity 2005 –2011
0
400
800
1200
1600
2000
2005 2007 2009 2011
Tota
l ins
talle
d c
apa
city
in M
W
Development of the installed wind capacity
27
2.5 Geothermal Potential
Turkey’s geothermal potential is estimated to be 31.5GWt and 4.5GWe, with the total
installed power generation capacity in 2010 of 795 MW t (directly thermal used) and 100 MWe
(converted to electricity). Thermal energy is mainly used for district and greenhouse heating.16, 17
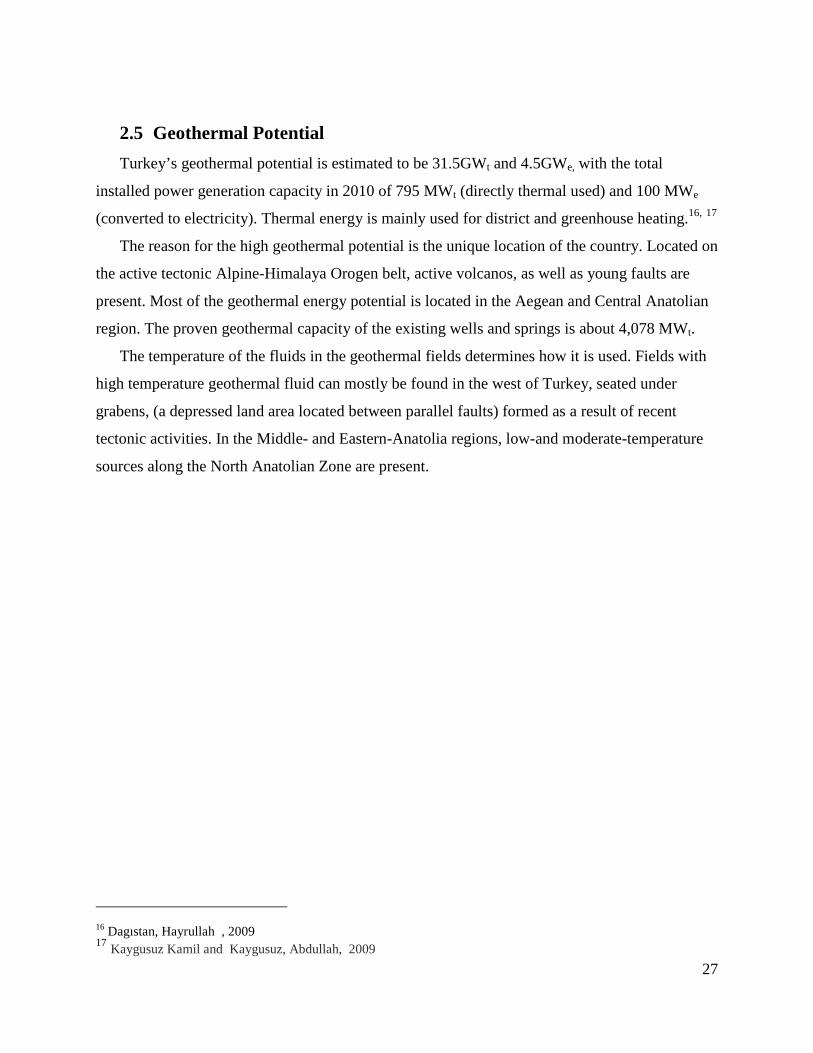
The reason for the high geothermal potential is the unique location of the country. Located on
the active tectonic Alpine-Himalaya Orogen belt, active volcanos, as well as young faults are
present. Most of the geothermal energy potential is located in the Aegean and Central Anatolian
region. The proven geothermal capacity of the existing wells and springs is about 4,078 MWt.
The temperature of the fluids in the geothermal fields determines how it is used. Fields with
high temperature geothermal fluid can mostly be found in the west of Turkey, seated under
grabens, (a depressed land area located between parallel faults) formed as a result of recent
tectonic activities. In the Middle- and Eastern-Anatolia regions, low-and moderate-temperature
sources along the North Anatolian Zone are present.
16 Dagıstan, Hayrullah , 2009 17 Kaygusuz Kamil and Kaygusuz, Abdullah, 2009
28
,
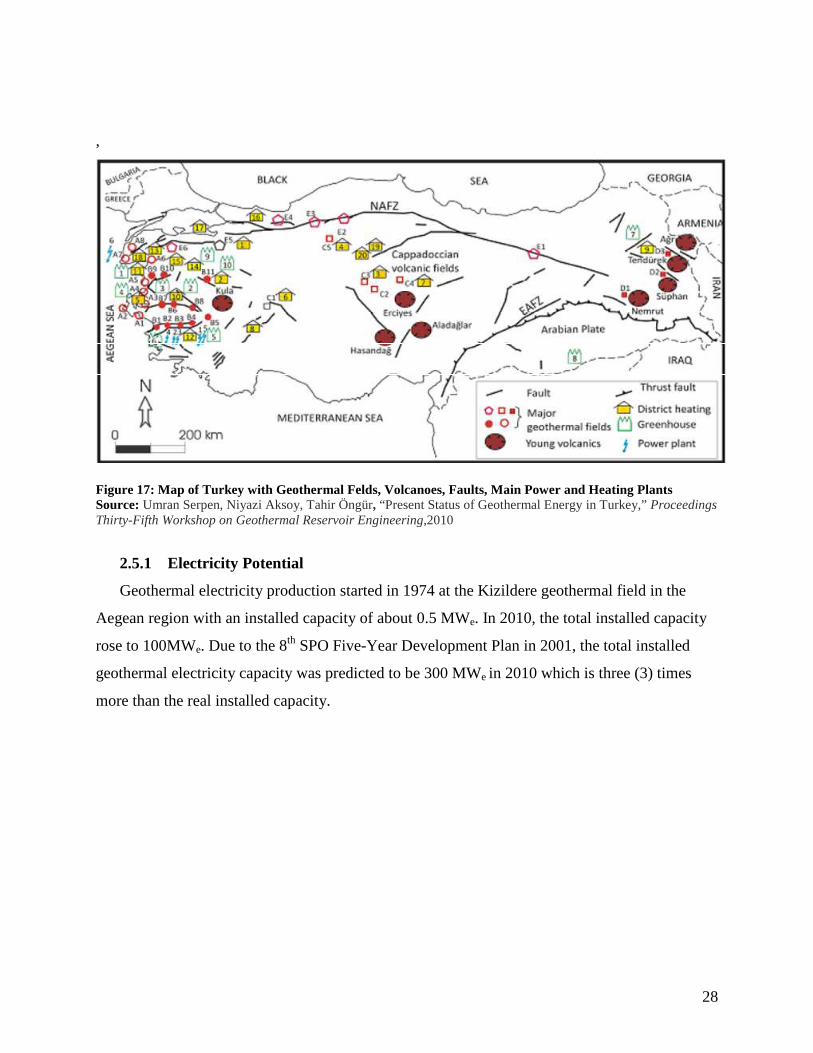
Figure 17: Map of Turkey with Geothermal Felds, Volcanoes, Faults, Main Power and Heating Plants Source: Umran Serpen, Niyazi Aksoy, Tahir Öngür, “Present Status of Geothermal Energy in Turkey,” Proceedings Thirty-Fifth Workshop on Geothermal Reservoir Engineering,2010
2.5.1 Electricity Potential
Geothermal electricity production started in 1974 at the Kizildere geothermal field in the
Aegean region with an installed capacity of about 0.5 MWe. In 2010, the total installed capacity
rose to 100MWe. Due to the 8th SPO Five-Year Development Plan in 2001, the total installed
geothermal electricity capacity was predicted to be 300 MWe in 2010 which is three (3) times
more than the real installed capacity.

29
0
200
400
600
800
2002 2004 2007 2010 2020
Tota
l in
stal
led
cap
acity
in M
We
Development of the installed geothermal capacity
Figure 18: Geothermal Potential – Share of Use and Development of Installed 2001 – 2020 Source: Kaygusuz, K. and Kaygusuz, A., “Geothermal Energy in Turkey: The Sustainable Future,” Renewable and Sustainable Energy Reviews, August 2004
2.6 Biomass Potential
The natural biomass potential of the
country is estimated to be 372 TWh.18 The
energy resource includes various
agricultural residues such as grain dust,
wheat straw, hazelnut and different wastes.
About 53% of the natural potential, about
198 TWh, is suitable for electricity
production, whereas only 0.45TWh were
used in 2010 as shown in Figure 19.
Figure 19: Biomass Electricity Potential and Share of Use Source: Ayhan Demirbaş, “Production Potential of Electricity from Biomass in Turkey,” Biotechnology 2006
18 Çapik, Yılmaz, and Çavuşoğlu, 2011
0 1 2 3 4 5
Theoretical potential in GW
4.5Used potential
in 2010(0.1 GW)
Breakdown of Turkey's geothermal electricity potential
0 100 200 300 400
Breakdown of Turkey's biomass potential in TWh/year
Natural potential Economically feasible potential
Used potentialin 2010
(0.45 TWh)

30
The method used to convert biomass to electricity is
converting biomass to hydrogen and carbon dioxide and
the subsequently burning these gases to run a steam
turbine. The process of the producing synthetic gas is
shown in Figure 20. Due to the complex process and the
need for cost intensive purification of the produced gas,
commercial use is not readily available. Therefore, very
little of this potential is used, and it is not anticipated that
it will be used in the near future.
Figure 20: Biomass Gasification Machine for Solid Fuels Source: Thomas Spaven, Gasification, 2011
Due to a low volatility, electricity from biomass and geothermal resources are suitable for
base load (the basic level of energy a power plant must produce for its customers), making it a
major player in electricity security and stability in a 100% renewable energy scenario.
2.7 Comparison of Electricity Potential for Renewable Energies
The economically feasible electricity potentials of the analyzed renewable energy resources
are visualized in Figure 21. The graph also shows the electricity demand in 2010 as well as that
predicted for 2020. As can be seen, 0.6% of the total area of the country covered with solar
panels will meet the predicted demand. With an expanded area even more electricity could be
produced. The economically feasible electricity production from wind energy ranges between 35
– 75TWh. Therefore, at least 8% of the future electricity demand could be covered.
Water energy has been used since 1902; however, only about 3% of the economically
feasible potential was exploited in 2010. Even if the geothermal electricity potential is behind the
potential of the other renewable energies, almost 15 – 26 TWh could be produced if it were fully
exploited. The biomass potential with about 190 TWh per year is about the same amount as the
wind potential and is suitable for base load power.

31
0
40
80
120
160
200
240
280
320
360
400
440
480
520
min. electricity production
max. electricity production
Economically feasible energy production of different renewable resources in TWh/yearTWh
electricity demand in 2010
predicted electricity demand of different surveys in 2020
51.80 TWhin 2010
electricity demand will double
0.46 TWhin 2010
2.92 TWhin 2010
0.67 TWhin 2010
0.4 TWh in 2010
Figure 21: Assessment of Minimum/Maximum Electricity Produced From Renewable Energy Sources 2010 Source: Author

32
Overview
The electricity grid evolved from the
major electricity consumer in 2001 to
a well controlled and maintained
network.
In 2010
The three (3) state owned public
enterprises responsible for electricity
production, transmission and trading,
namely TEUAS, TEIAS and TETTAS.
In October they joined in the
European Network of Transmission
System Operators for Electricity.
Grid adaption and upgrades may be
necessary to ensure minimal losses
in a 100 % renewable energy
3. Electricity Grid and Cross-border
Interconnections
In 1926, the first electricity company, the Kayseri ve Civarı
Elektrik Turk Elektrik Inc. was founded. In 1935, several
government institutions with authority relating to electricity
production were established. In addition to electricity production
and distribution, these companies were given the task of identifying
the renewable energy potential, mainly focused on the hydro
potential for the country. In December 1963, the Ministry of
Energy and Natural Resources of Turkey was founded to control
the energy policy. All generation assets were passed to TEK,
except those belonging to Cukurova Elektrik T.A.S. and Kepez ve
Antalya Havalisi Elektrik Santralleri T.A.S. The transmission and distribution operations were
handed to the local governments.
Due to the increasing electricity demand, growing power consumption and the government’s
electrification plans required more coherent organization of the power industry. For that reason,
TEK was founded in 1970, and is a fully state-owned and state run entity. Since 1971, it has been
responsible for the generation and distribution of electricity throughout the country. In
November 1984, with enactment of the Law 3096 –“Respecting Authorization to Institutions
other than the TEK for Generation, Transmission, Distribution and Trade of Electricity,” private
sector firms were allowed to build and operate the electricity generation, transmission and
distribution systems. In addition, the country put effort into expanding the grid in a sustainable
and reasonable way to meet the rapid and steady electricity demand in Turkey to support its rapid
and steady economic growth. This led to a fast and uncontrolled expansion of the electricity grid
in the year between 1985 and 2001. Therefore, the transmission and distribution losses increased
from 15.9% to 19.3% (about 23 TWh in 2001), becoming the biggest share of consumption.
In 2001, the Electricity Market Law, which paved the way for a free market in power
generation and distribution, was enacted. As a result, TEAS was restructured to form three state-
owned public enterprises, namely Turkish Electricity Transmission Co. (TEIAS), Turkish

33
Electricity Generation Co. (TEUAS) and Turkish Electricity Trading and Contracting Co.
(TETTAS). In order to be accepted in the European Energy Grid, Turkey improved frequency
control, operation and maintenance performance in recent years19. Finally, since September
2010, Turkey has been included in the European Network of Transmission System Operators for
Electricity (ENTSO-E). The actual physical connection consists of 2 lines with Bulgaria and one
with Greece. The net transfer capacity for export ranges from 1.0 to 1.1 GW, whereas the
imports vary from 0.8 to 1.3 GW. Figure 22 shows the actual electricity transfer of Turkey due to
data provided by ENTSO-E in 2010.
Figure 22: Turkey’s 2010 Electricity Grid in 2010 and Existing/Planned Thermal and Hydro Power Plants y. Source: International Energy Agency, Turkey 2009 Review (modified by author)
Only 14GWh has been exported to Bulgaria, whereas 592 GWh has been imported. Also,
926GWh were delivered to Greece. Joining the European Network and opening Turkey’s
internal electricity market creates a convenient position for all parties granting each of them to
trade power at every moment. The near-term synchronization with unsynchronized eastern and
south-eastern neighbors is unlikely due to the ENTESO-E’s technical requirements. However,
19 Kemal, Yilanci, and Atalay, 2007

34
power transmission between Turkey and these countries is possible and practiced in the
following two ways depending on the signing date of the contract. Contracts signed before the
introduction of the 2001 Electricity Market Law must be completed as “island” operations. This
means that the importing areas have to be isolated from the Turkish electricity grid and run
synchronously with the grid of the exporting country. For contracts signed after the enactment of
2001 the method of “unit direction” can also be used. This offers the possibility of operating a
power generating facility or a unit of a generating facility in the electricity system of another
country in parallel with the national electricity system. According to the 2009 Electricity Market
and Security of Supply Strategy, direct current (DC) lines will be the main option for
interconnections with non-ENTSO-E countries. In order to extend the exploitation as well as the
electricity production of renewable energy resources in Turkey, the electrical grid will have to be
upgraded in specific areas to provide the capacity needed for power delivery. The primary choice
for the location of electricity production from the main renewable energy resources based on
their natural potential is shown in Figure 23. The numbers in the graph represent an assessment
of the economically feasible total installed capacity in the marked area and can be used to
estimate the needed electricity grid in that area.
Primary choice of location for electricityproduction out of different renewablesources due to their natural potential
Figure 23: Map of Turkey with Primary Areas for Renewable Energy Resource. Source: International Energy Agency, “Turkey 2009 Review” (modified by author)

35
Overview
Current and even future electricity
demand for 2020 could easily be met
with renewable energies for an
economically feasible situation.
Even the primary energy demand
could be covered by renewable
energies, if sufficiently exploited!
The transition from a fossil fuel based
energy system to a renewable energy
system is possible, if more
commitment is shown.
4. Conclusion and Outlook
Turkey has abundant renewable energy potential. If
sufficiently exploited and efficiently distributed, this potential
would easily be enough to meet the current electricity demand and
even the predicted demand for 2020, as can be seen in Figure 23.
Solar energy has the highest potential among the renewable energy
resources. Furthermore, regions like South Anatolia and the
Mediterranean Regions have high solar radiation and are predicted
to produce electricity from solar energy. The estimated potential is
about 125 times greater than the electricity demand in 2010 and
only limited by the area provided. In fact, 1.1 times the area of
Istanbul (about 0.3% of Turkey’s total area) would be enough to
meet the current electricity demand and only 2.5 times the area of Istanbul to cover it in 2020.
The wind potential, which is over 50%, located in the Marmara and Aegean Regions, can
cover at least 17% of the today’s electricity demand. The actual electricity production varies
depending on the use of the right turbines on the right place. Therefore, the economically
feasible electricity potential varies on a larger scale between 35 and 75 TWh per year.
Approximately 150 to 160 TWh, (74%) of the current electricity demand can be provided
through hydro power, the initial technology in Turkey used to produce electricity, starting in
1902. Only about 30% of this potential, which is up to 50% provided through the Euphrates and
the Tigris River, is used. The geothermal electricity potential, mostly located at the Alpine-
Himalaya Orogen belt in Turkey’s west regions is estimated to about 15 to 25TWh per year. This
potential may appear low; however, geothermal electricity potential out of other renewable
energy resources, like biomass generated electricity, is less volatile than electricity and can be
used to cover the base load in a 100% renewable energy scenario. Biomass electricity potential is
about 200 TWh per year. However, this potential has not been exploited in a significant way due
to the high cost and technologically difficult process of converting biomass to the gases needed
for the actual electricity production. The total amount of renewable energy potential will
generate a minimum annual electricity potential of 870 TWh per year. This is 4.1 times more
than the electricity demand in 2010 and about 1.8 times more than the maximum predicted in

36
2020. If it comes to the primary energy demand, the minimum estimated renewable energy
potential cannot cover the total demand, as shown in Figure 24.
0250500750
1,0001,2501,5001,7502,0002,2502,5002,7503,000
2010 2020
Primary energy and electricity demand as well as production out of renewable energy
primary energy demand
electricity demand
could be met by biomass and an increased area of
solar panels
min. economically feasible electricity
production (resources 100% exploited)
TWh
Figure 24: Primary Energy and Electricity Demand for 2010 and 2020 (Predicted)
Source: Author Note: The dashed green line represents the minimum economically feasible electricity potential.
The national electricity grid was improved in recent years, transitioning from the major
consumer (due to high losses) in 2001 to a frequency controlled, loss reduced and well
maintained grid, which in September 2010 became part of in the European Network of
Transmission System Operators for Electricity.
Taking all facts into account, the question, “Is possible to be 100% renewable in 2020 in
terms of electricity,” can be easily answered with yes, as there is no lack of the renewable energy
resources. When it comes to the question, “how is 100% renewable possible for Turkey by
2020,” the answer is more complicated as different issues in the means of transition of the energy
system have to be discussed.
To the question: How is it possible to be 100% renewable by 2020 in terms of the electricity
demand in a country which has an abundant renewable energy resources, enough to over produce
for today’s and the future’s total energy demand, depending on the exploitation level of the

37
resources? As a matter of fact, the will of the Turkish government, its people, companies and
investors must pave the way for implementing renewable energy strategies. Compared to
subsidies of other European countries, those offered by Turkey (listed on page 8) are lower, and,
therefore, less attractive to investors. Furthermore, there is the common belief that electricity
from renewable energies is still more expensive then from fossil energy fuels. This does not
apply in every case, as shown in Figure 25.
Figure 25: Total Electricity Cost Including Construction, Production and Decommissioning for Renewal Energy Source: Jason Morgan, “Comparing Energy Costs of Nuclear, Coal, Gas, Wind and Solar,” Nuclear Fissionary, 2010
Published in April 2010, the chart shows that electricity from hydro power is already more cost
effective than electricity from other fuels. Even the price for electricity from wind power is
becoming competitive in some cases with that of natural gas and almost with that of coal
generated energy. The price of power from solar panels is still higher; but the cost differences
decrease day-by-day due to more efficient panels, mass production and rising fossil fuel costs
and will finally reach a lower level. Many studies indicate that the transition cost of the energy
system will be far less than the long term cost for continuing to use fossil fuels. The main
reasons for this are higher adaptation costs due to climate change impacts attributed to high
38
carbon dioxide emissions as well as energy and economic security due to high dependence on
foreign countries for fuel imports.
5. Bibliography
1. Ayhan Demirbaş, “Production Potential of Electricity from Biomass in Turkey,” Biotechnology, 2006, http://www.eolss.net/Sample-Chapters/C17/E6-58-06-16.pdf
2. Baris, Kemal and Kucukali, Sherhat, “Availibility of Renewable Energy Sources in Turkey: Current Situation, Potential, Government Policies and the EU Perspective” Energy Policy, December 2010.
3. Dinçer, Furkan, “Overview of the photovoltaic technology status and perspective in Turkey” Renewable and Sustainable Energy, July 2011, http://econpapers.repec.org/article/eeerensus/v_3a15_3ay_3a2011_3ai_3a8_3ap_3a3768-3779.htm
4. Çapik, Mehmet, Yılmaz, Ali, and Çavuşoğlu, Ibrahim “Present Situation and Potential Role of Renewable Energy in Turkey,” Renewal Energy, 2011
5. Yılmaz, A. O., Renewable Energy and Coal Use in Turkey, 2010
6. European Association for Coal and Lights. Key facts of Turket, 2011 http://www.euracoal.be/pages/layout1sp.php?idpage=475
7. Dagıstan, Hayrullah “New Developments and Investment Opportunities.” Geothermal Energy in ECA Countries, 2009 https://pangea.stanford.edu/ERE/pdf/IGAstandard/GeoFund/Turkey2009/2._dagistan.pdf
8. Dursun, B. and Gokcol,C. “The Role of Hydroelectric Power and Contribution of Small Hydropower Plants for Sustainable Development in Turkey,” Renewable Energy, April 2011
9. Akova, Ismet, “Development Potential of Wind Energy in Turkey, EchoGeo, 2011 http://echogeo.revues.org/12457
10. Lynch, Richard, “An Energy Overview of the Republic of Turkey, Fossil Fuels International, 2005, http://www.geni.org/globalenergy/library/national_energy_grid/turkey/EnergyOverviewofTurkey.shtml
11. General Directorate of Electrical Power Resources Survey and Development Administration, Facts and News from EIE/TU, March, 2007 – February, 2010 http://www.enr-network.org/assets/files/enr_management/facts_and_news/M48_facts_and_news/EIE_Facts&News_M48.pdf
12. General Directorate of Electrical Power Resources Survey and Development Administration,Turkey Energy Efficiency Report – 20% Reduction in Primary Intensity by 2023, 2011

39
13. International Energy Agency, Turkey 2009 Review, http://www.iea.org/publications/freepublications/publication/turkey2009-1.pdf
14. International Energy Agency, IEA Energy Statistics – Energy Balances for Turkey, 2010, http://www.iea.org/stats/index.asp International Monetary Fund, World Economic Outlook, April 2011, International Monetary Fund, World Economic Outlook, 2011, http://www.imf.org/external/pubs/ft/weo/2011/01/weodata/index.aspx
15. Kaygusuz, K. and Kaygusuz, A., “Geothermal Energy in Turkey: the Sustainable Future.” Renewable and Sustainable Energy Reviews, August 2004, http://www.inference.phy.cam.ac.uk/sustainable/refs/geothermal/sdarticle.pdf
16. Kemal Ozturk, Yilanci, Ahme and Atalay, Oner “Past, Present and Future Status of Electricity in Turkey and the Share of Energy Sources,” Econ Papers, 2007
17. Serpen, Aksoy, and Öngür, “2010 Present Status of Geothermal Energy in Turkey.”
18. Spaven Thomson, Gasification, 2011 http://www.thompsonspaven.com/acatalog/gasification.html
19. Marcel Suri, Thomas A. Huld, Ewan D. Dunlop, Heinz A. Ossenbrink., “Potential of Solar Electricity Generation in the European Union Member States and Candidate Countries,” Solar Energy 2007
20. Yılmaz, A. O. “Renewable Energy and Coal Use in Turkey,” 2010, http://cdn.intechweb.org/pdfs/24426.pdf
21. Çetin GENÇER a, * Sibel Akkayab Serkan GÜRKAN, Wind Energy Potential In Turkey, 2010, http://iats09.karabuk.edu.tr/press/bildiriler_pdf/IATS09_03-01_1454.pdf
22. Jason Morgan, “Comparing Energy Costs of Nuclear, Coal, Gas, Wind and Solar,” Nuclear Fissionary, 2010, http://nuclearfissionary.com/2010/04/02/comparing-energy-costs-of-nuclear-coal-gas-wind-and-solar/