10/15/20151 fy2011 budget presentation for watertown town council watertown public schools may 25,...
TRANSCRIPT

04/20/23 1
FY2011 Budget Presentationfor Watertown Town Council
Watertown Public SchoolsMay 25, 2010

04/20/23 2
Budget Context Continue to Support School District Goals
Support High Academic Achievement Foster Self-Actualization Promote Global and Local Citizenship
Amidst Difficult Fiscal and Economic Times Declining State Financial Support Last Year of Federal Stimulus Funding Town Budget Constraints Negotiating Union Contracts

04/20/23 3
Budget Process October – December
School Department Budget Development and Workshops January – February
Presentations (4) to Budget/Finance & Curriculum Subcommittees March – April
Administrative Forums with Faculty, PTO & Site Council Leaders Budget Subcommittee and Town Council Subcommittee Meeting Budget and Finance Subcommittee Meetings Superintendent’s Budget Presentation to School Committee – April 5 Public Hearing and Vote by School Committee – April 12 Town Manager Presents Budget Recommendation – April 27 Presentation to Town Council – May 25
June Town Council Vote

FY2010 Revenues – All Sources Town Appropriation $32,928,000 88% Technology Support – Town 500,000 1% Federal Stimulus 500,000 1% State – Circuit Breaker 679,000 2% Other Fed. And State Grants 2,100,000 6% Pre-K and Pre-School 348,000 1% Other Fees and Receipts 185,000 <1%
Total $37,240,000
04/20/23 4
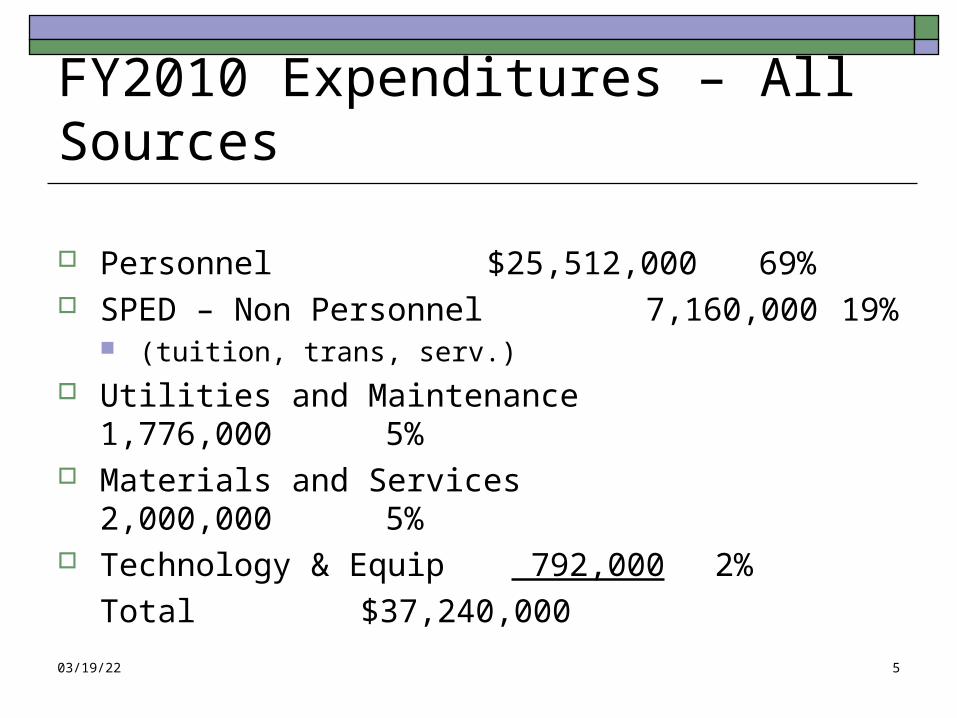
FY2010 Expenditures – All Sources
Personnel $25,512,000 69% SPED – Non Personnel 7,160,000 19%
(tuition, trans, serv.) Utilities and Maintenance 1,776,000 5% Materials and Services 2,000,000 5% Technology & Equip 792,000
2%
Total $37,240,00004/20/23 5

FY2011 – Budget Scenarios
Increase from FY2010 Town Appropriation: Program Proposals – 5.66% Increase Superintendent’s Report – 3.84% Increase Level Services – 3.36% Increase School Committee Recommendation – 2.0% Increase Town Manager’s Recommendation – 1.65% Increase Level Dollar Budget – 0% Increase

FY2011 – Key Budget Challenges Special Education
Providing In-District Services
Academic Enhancement Providing Critical Teaching and Curriculum Support
Technology Maintaining Technology Initiative
Enrollments Adjusting to Projected Enrollment Increases
Targeted Reductions Across All Areas To Accommodate Program Changes and General Cost Increases

04/20/23 8
Budget Challenge – Special Education – In-District and Out-of-District
In-District Out-of-District
YearNo. of
Students BudgetNo. of
Students Budget
FY2003 382 $5,250,000 54 $2,600,000
FY2010 373 $6,400,000 72 $5,100,000
Percent Change
22% 96%

04/20/23 9
Budget Challenge – Special Education – In-District Programming
Language-Based Classes Grades 2 to12 (72 students)
Autism Spectrum Classes Grades PreK to 7 (24 students)
Social- Emotional Support Grades PreK to 12 (45 students)
Neurodevelopmental Learning Support Grades K to 12 (28 students)

Budget Challenge – Special Education – Example of Cost Avoidance in FY2010
Investment in WMS Integrated Emotional Support Programming
Cost of Out-of-District Savings
Integrated Social – Emotional Program at WMS served 10 students
2 FTE special education teachers
2 FTE instructional assistants
.65 FTE licensed social workers
.8 FTE mental health counselors
(.4 professionals and .4
interns)
Private Out-of-District Program (Dearborn Academy in Arlington used in calculations)
Tuition
$52,380 x 10 =
$523,800
Transportation
$5,400 x 10 =
$ 54,000
500 additional students have used the services of the IES program this year
Totals $242,248 $577,800 $335,552

Budget Challenge – Critical Academic Enhancements
Reading Teachers
Curriculum Development and Coordination
Additional Instructional Materials
04/20/23 11

04/20/23 12
Budget Challenge – Technology – Sustain Implementation
0
100000
200000
300000
400000
500000
600000
FY07 FY08 FY09 FY10 FY11 FY12 FY13 FY14 FY15
Repair & Maintenance Hardware

04/20/23 13
Budget Challenge -- Enrollment Trend
24122433
24002424
2469
2521
2300
2350
2400
2450
2500
2550
FY06 FY07 FY08 FY09 FY10 FY11Projected
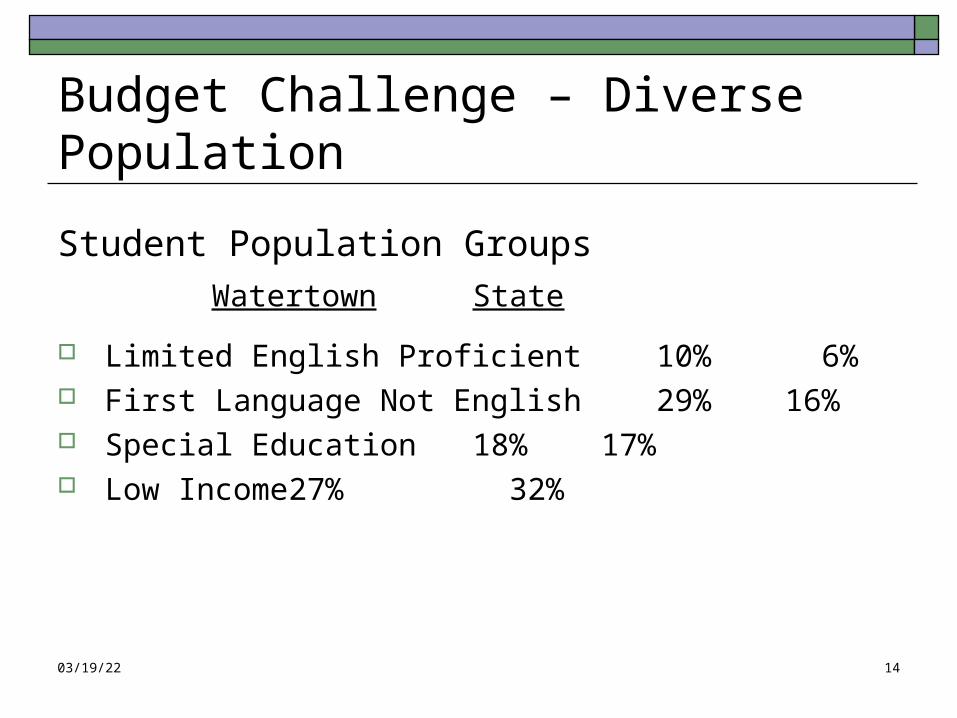
Budget Challenge – Diverse Population
Student Population Groups
Watertown State
Limited English Proficient 10% 6% First Language Not English 29% 16% Special Education 18% 17% Low Income 27% 32%
04/20/23 14

Budget Challenge – Elementary Maximum Class Size
CUNNIFF HOSMER LOWELL ALL ELEM
FY10 FY11 FY10 FY11 FY10 FY11 FY10 FY11
K 18 22 20 25 18 22 191 232
1 19 22 21 22 18 18 239 185
2 16 22 23 23 18 20 180 212
3 22 19 22 22 21 18 187 180
4 24 22 25 21 25 27 194 188
5 21 24 25 25 20 27 169 194
TOTAL 1160 1191
04/20/23 15

FY2011 Operating BudgetMajor Changes
FY2010 Town Appropriation $32,928,000
Base Level and Other Adjustments 293,000 Special Education 530,000 Academic Enhancement 243,000 Technology Support 225,000 Reductions – Staff and Services (748,000)
FY2011 Mgr. Recommended Appropriation $33,471,000
04/20/23 16

FY2011 Budget – Base Level and Other Adjustments
Personnel Set-Aside 533,000 Program and Revenue Adjustments (110,000) Retirement/Turnover Savings (165,000) Minuteman Tuitions (75,000) Facilities Repair and Maintenance 50,000 High School Athletics 60,000
Total $ 293,000
04/20/23 17

FY2011 Budget – Special Education
In-District Services 460,000 5.6 FTE Teachers; 9.0 FTE Inst. Assistants
Contract Services – Testing 100,000 Summer Tuition 20,000 Inclusion Instructional Assistants (50,000)
Reduce by 2.5 FTE Inst. Assistants
Total $ 530,000
04/20/23 18

FY2011 Budget – Critical Academic Enhancements
Reading Teachers 100,000 2.0 FTE Teachers
English Language Learner Support 20,000 .4 FTE Teacher
Elementary Curriculum Coordinator 43,000 1.0 FTE
Instructional Materials 80,000
Total $ 243,000
04/20/23 19

FY2011 Budget – Technology Support
Technology Consultant 20,000 Technical Support 50,000
1.0 FTE
Education Technology Leader - Stipend 5,000 Technology Repair and Maintenance 25,000 Technology Hardware 125,000
Total $ 225,000
04/20/23 20

FY2011 Budget – Reductions
Classroom Teachers (98,000) Specialist Teachers (110,000) Coordinators & Administrators (302,000) Support Staff (178,000) Athletics (60,000)
Total $ (748,000)
04/20/23 21

Ongoing Budget Strategies
Budget Reallocations/Program Changes
Contractual Changes with Unions
Fees
Other Federal, State and Local Revenues