102 water audits and loss control programs
TRANSCRIPT
©
102 WATER AUDITS AND LOSS CONTROL PROGRAMS
AWWA Manual M36
a check box to the right of the Variable Production Cost cell, which the auditor should select if he or she desires to apply the Customer Retail Unit Cost to the valuation of Real (leakage) Losses.
Enter the Variable Production Cost on the Reporting Worksheet shown in Figure 3-5. The auditor for CWC obtains this value from the accounting unit of the company, which is $190/mil gal.
Step 5-7A. Determine the appropriate Data Grading value for the Variable Production Cost. The criteria listed in the Grading Matrix worksheet of the Audit Software should be consulted. Factors affecting data grading for this input include the cost accounting system format (paper vs. electronic), the extent of pertinent costs that are included in the calculation, and the extent and frequency by which the cost information is audited. CWC maintains a highly robust financial and cost accounting computer appli-cation, which includes routine monthly and annual reporting of all data. CWC includes pertinent indirect costs for liability, residuals management, and equipment degradation. A CPA conducts an audit of the finances every other year. CWC is managing its finances with a high degree of rigor, and the auditor assigns a Data Grading of 9 for this parame-ter. CWC need only increase the frequency of its CPA financial audit to yearly to qualify for a Data Grading of 10 for this cost component. Although CWC is located in a semi-arid region, it has a reliable long-term water supply from a mountain reservoir system operated by a regional water authority. Thus the auditor does not believe that the long-term water supply outlook is constrained, and the variable production cost should be applied to Real Losses rather than the Customer Unit Retail Cost.
Task 6—Determine System AttributesStep 6-1. Calculating Unavoidable Annual Real Losses (UARL). The UARL is a refer-ence value and does not refer to a specific type of leakage occurring in the water distri-bution system. The UARL represents the minimum level of leakage that is calculated in a system-specific manner for a water utility. It represents the theoretical low limit of leakage that could be achieved in a system that is well managed and in good condition, at a given average pressure level.
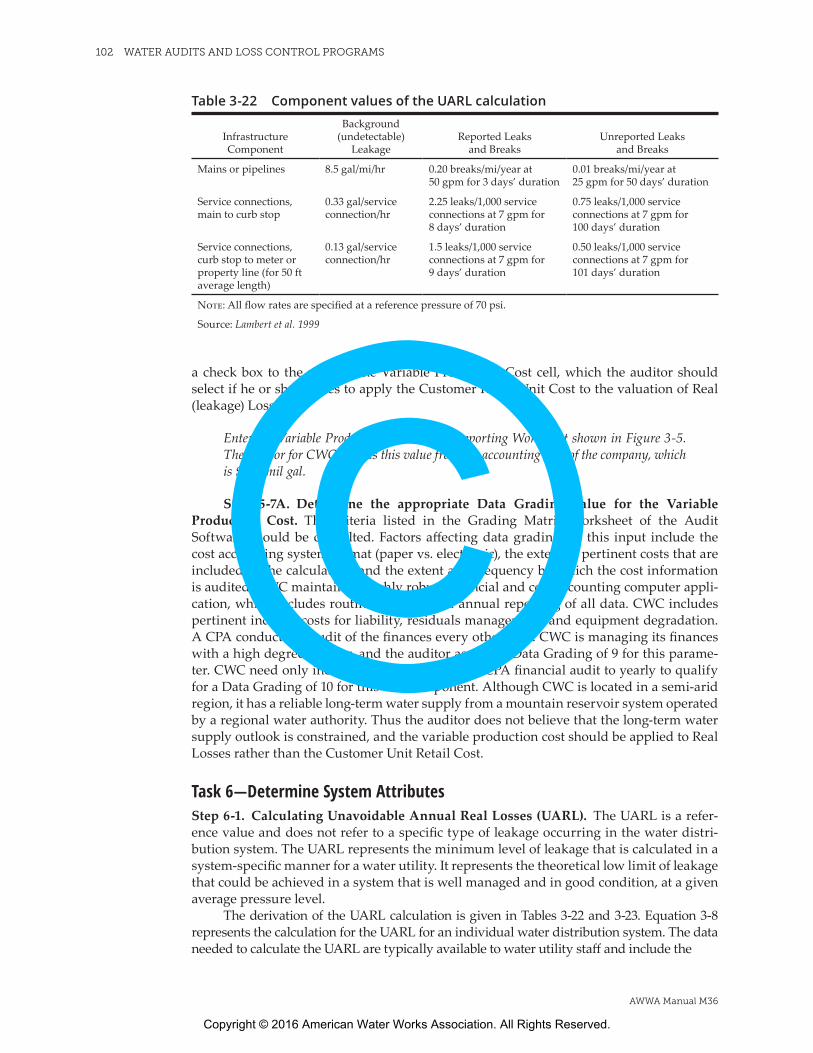
The derivation of the UARL calculation is given in Tables 3-22 and 3-23. Equation 3-8 represents the calculation for the UARL for an individual water distribution system. The data needed to calculate the UARL are typically available to water utility staff and include the
Table 3-22 Component values of the UARL calculation
Infrastructure Component
Background (undetectable)
LeakageReported Leaks
and BreaksUnreported Leaks
and Breaks
Mains or pipelines 8.5 gal/mi/hr 0.20 breaks/mi/year at 50 gpm for 3 days’ duration
0.01 breaks/mi/year at 25 gpm for 50 days’ duration
Service connections, main to curb stop
0.33 gal/service connection/hr
2.25 leaks/1,000 service connections at 7 gpm for 8 days’ duration
0.75 leaks/1,000 service connections at 7 gpm for 100 days’ duration
Service connections, curb stop to meter or property line (for 50 ft average length)
0.13 gal/service connection/hr
1.5 leaks/1,000 service connections at 7 gpm for 9 days’ duration
0.50 leaks/1,000 service connections at 7 gpm for 101 days’ duration
Note: All flow rates are specified at a reference pressure of 70 psi.
Source: Lambert et al. 1999
©Copyright © 2016 American Water Works Association. All Rights Reserved.
CONDUCTING THE WATER AUDIT 103
AWWA Manual M36
• total length of water main piping in the distribution system;• average operating pressure across the distribution system;• number of active and inactive customer service connections; and• miles of service connection piping maintained by the water customer, taken as
the average length of customer service line, Lp (see Step 5-3), multiplied by the number of customer service connections (see Step 5-2).
The UARL calculation was devised by the IWA Water Loss Specialist Group (formerly the Water Loss Task Force) during its development of the water audit method. In conduct-ing work to develop a reliable benchmarking performance indicator (the Infrastructure Leakage Index, or ILI), the Water Loss Specialist Group determined to devise a means to evaluate the technical low limit of leakage that could be expected to be achieved in a given water distribution system. It is recognized that leakage in any water distribution system can never be totally eliminated, and there is no reasonable expectation that such is possible. However, several water utilities have been successful in driving leakage down to extremely low levels and maintaining very low-loss operations.
The Water Loss Specialist Group obtained data from dozens of water utilities with strong leakage control practices and observed the rate at which new leaks arise despite having comprehensive leakage controls in place. From this information, data allowances were created for various leak types according to response times typical of strong leak-age management operations. The allowances were developed for the three leak types: background leakage, reported leakage, and unreported leakage. These types are defined and discussed in chapters 6 and 7. An allowance for each leakage type was assigned for key infrastructure components, such as water mains, customer service connection piping maintained by the water utility, and customer service piping typically maintained by the customer.
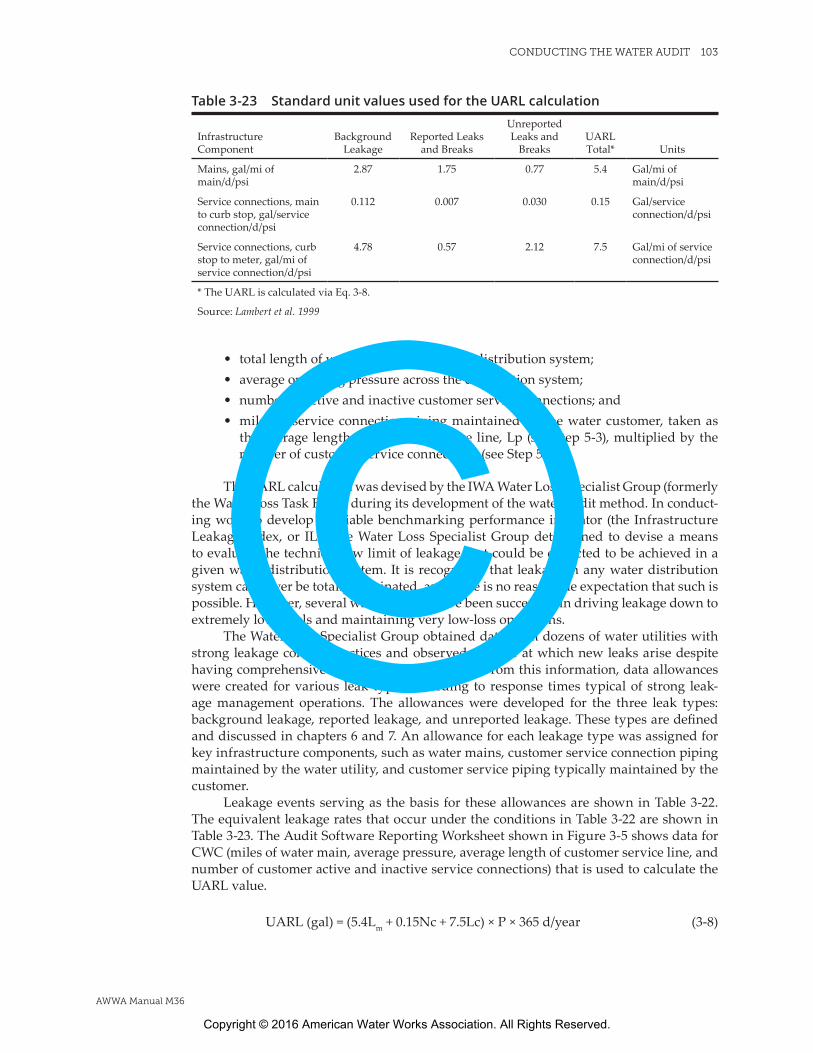
Leakage events serving as the basis for these allowances are shown in Table 3-22. The equivalent leakage rates that occur under the conditions in Table 3-22 are shown in Table 3-23. The Audit Software Reporting Worksheet shown in Figure 3-5 shows data for CWC (miles of water main, average pressure, average length of customer service line, and number of customer active and inactive service connections) that is used to calculate the UARL value.
UARL (gal) = (5.4Lm + 0.15Nc + 7.5Lc) × P × 365 d/year (3-8)
Table 3-23 Standard unit values used for the UARL calculation
Infrastructure Component
Background Leakage
Reported Leaks and Breaks
Unreported Leaks and
BreaksUARL Total* Units
Mains, gal/mi of main/d/psi
2.87 1.75 0.77 5.4 Gal/mi of main/d/psi
Service connections, main to curb stop, gal/service connection/d/psi
0.112 0.007 0.030 0.15 Gal/service connection/d/psi
Service connections, curb stop to meter, gal/mi of service connection/d/psi
4.78 0.57 2.12 7.5 Gal/mi of service connection/d/psi
* The UARL is calculated via Eq. 3-8.
Source: Lambert et al. 1999
©Copyright © 2016 American Water Works Association. All Rights Reserved.
104 WATER AUDITS AND LOSS CONTROL PROGRAMS
AWWA Manual M36
Where:Lm = length of water mains (miles; including hydrant lead length)Nc = number of customer service connectionsLc = total length of customer service connection line (miles)
(Nc × Lp)/5,280 ft/mi, where Lp = average length of customer service line (ft, see Figures 3-13 through 3-15)
P = average operating pressure in the system (psi) In Eq. 3-8, 365 d/year is included given that water distribution systems in developed countries operate with continuous service for all 365 days in the audit year. For systems that operate with intermittent service, the number of days that the system was operated should be used instead of 365 days.
Note: The UARL calculation is not valid for small systems that meet the following condition:
• in gallons per day: (Lm × 32) + Nc < 3,000 or P < 35 psi• in litres per day: (Lm × 20) + Nc < 3,000 or P < 25 m
Systems at or below these levels can rely on the Real Losses performance indicator, in gallons per mile of main per day, as a measure of their real loss standing.
For CWC, the UARL is calculated by the Audit Software to be 83.69 mil gal for the audit year. This is shown in the System Attributes and Performance Indicators work-sheet shown in Figure 3-6.
Step 6-2. Calculating the Cost Impact of Apparent and Real Losses. The process of compiling a water audit is effective in tracing the water supplied by a drinking water utility to its various destinations; primarily customers but also including losses. Of equal importance, however, the method detailed in this publication also assesses the cost impact of all water audit components. Water utilities, like any business entity, cannot operate efficiently without knowing their costs and impacts on budgeting, operations, revenue collection, capital financing, and all other financial aspects of utility management. The Audit Software provides a means to calculate costs for each of the pertinent components in the water audit calculated on the System Attributes and Performance Indicators worksheet (Figure 3-6).
The nature of the valuation process of the water audit is compelling in the stark difference between apparent and real losses. Because apparent losses are quantified by the amount of water improperly recorded at the customer’s delivery point, this water is valued at the retail cost that is charged to the customer. Apparent losses cost water utilities a portion of their revenue. Often, the cost impact of apparent losses is higher than that of real losses, which are typically valued at the variable production costs to treat and deliver the water (however, if water resources are constrained, the utility might also be justified in valuing real losses at the customer retail rate). For most water suppliers, the retail rate charged to customers is notably higher than the variable production costs to provide the water. Therefore, apparent losses can have a dramatic financial impact to the water utili-ty’s revenue stream.
Step 6-2A. Cost impact of Apparent Loss components. To determine the total cost impact of apparent losses, the Audit Software multiplies the Apparent Losses volume by the Customer Retail Unit Cost (which is converted to $/mil gal by the Audit Software if gallons units are selected on the Reporting Worksheet by the auditor.)
©Copyright © 2016 American Water Works Association. All Rights Reserved.
CONDUCTING THE WATER AUDIT 105
AWWA Manual M36
The System Attributes and Performance Indicators worksheet shown in Figure 3-6 dis-plays the calculated Annual Cost of Apparent Losses, which for CWC is $821,449 for the audit year.
Step 6-2B. Cost impact of Real Loss components. To determine the total cost of real losses, the Audit Software multiplies the Real Losses volume by the Variable Production Cost. If the auditor deemed it justified to assess the cost of real losses at the Customer Retail Unit Rate, the total cost of real losses would be determined by multiplying the Real Losses volume by the Customer Retail Unit Cost in $/mil gal.
The System Attributes and Performance Indicators worksheet shown in Figure 3-6 dis-plays the calculated Annual Cost of Real Losses, which for CWC is $139,934 for the audit year.
Task 7—Performance IndicatorsThe IWA/AWWA Water Audit Method published in Performance Indicators for Water Supply Services (Alegre et al. 2000) includes a highly useful array of performance indicators, which represent one of the greatest strengths of the method. With this methodology, multiple indicators of varying detail became available to water utilities, allowing a realistic assess-ment of water loss standing. The performance indicators published in 2000 are defined in Table 3-24 and are endorsed by the AWWA Water Loss Control Committee. These perfor-mance indicators appear throughout this manual and within the AWWA Free Water Audit Software.
Prior to 2000, the sole performance indicator used in many parts of the world had been the imprecise “unaccounted-for” water percentage, which usually took some form of the amount of water losses over system input volume. Several flaws existed in this approach, including the following:
• Practices to define the volume of unaccounted-for water varied widely; therefore, the calculation of this percentage has been widely inconsistent, eliminating any meaning for reliable performance comparisons.
• This indicator is highly sensitive to the level of customer consumption in the water utility. If consumption increases or decreases noticeably, the percentage can change, despite that no change in loss levels may have occurred.
• This indicator does not segregate apparent and real losses. Also, it includes no information on water volumes and costs, the two most important parameters in assessing water loss.
Some have used the inverse of the unaccounted-for water percentage or the metered water ratio as the amount of billed water over the system input volume. Even the name of this indicator is misleading, as some drinking water utilities do not meter their cus-tomers. The concept behind both of these expressions was reviewed in the development of the method detailed in this manual, and led to the creation of a specifically defined performance indicator of NRW by volume. This new indicator has some value but only as a high-level financial indicator, and it is not sufficiently detailed to be useful as an opera-tional indicator. NRW is the sum of Unbilled Metered Consumption, Unbilled Unmetered Consumption, Apparent Losses, and Real Losses. This indicator is calculated by the Audit Software as the NRW volume divided by the Water Supplied volume.
The method includes performance indicators in financial and operational areas of water supply functions. The performance indicators were also established in three levels of detail—labeled 1, 2, and 3—representing high level, broad indicators (1) down to very
©Copyright © 2016 American Water Works Association. All Rights Reserved.
106 WATER AUDITS AND LOSS CONTROL PROGRAMS
AWWA Manual M36
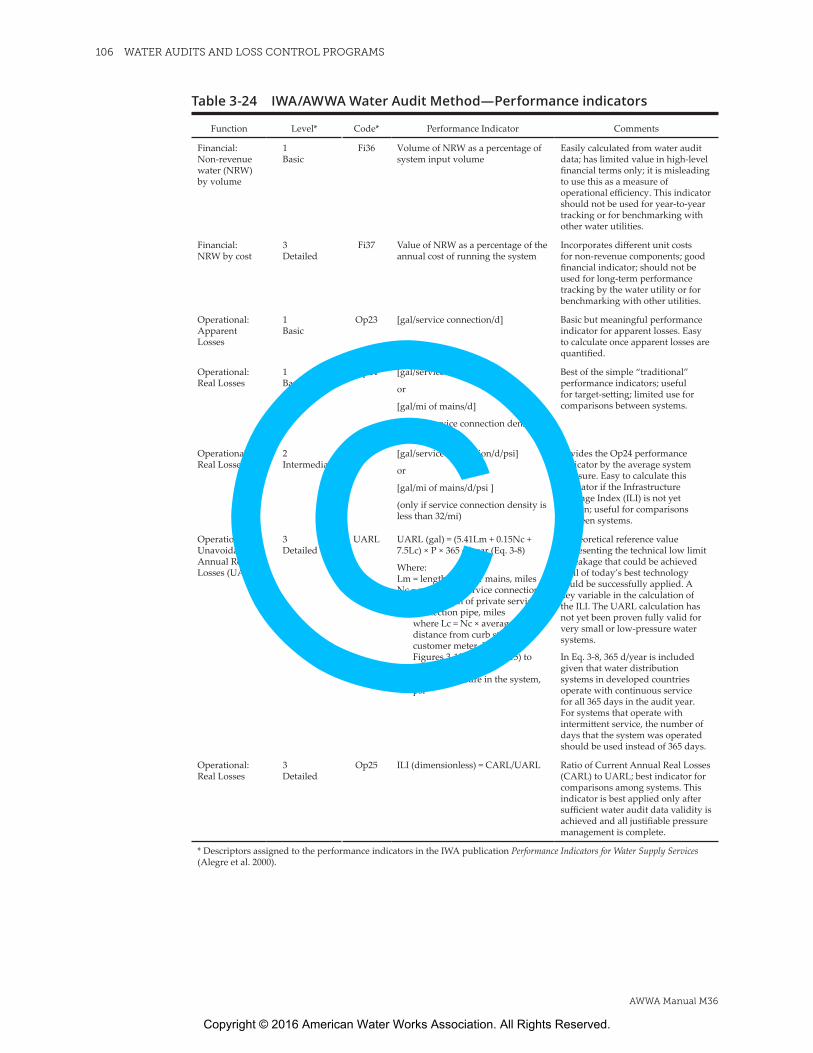
Table 3-24 IWA/AWWA Water Audit Method—Performance indicators
Function Level* Code* Performance Indicator Comments
Financial: Non-revenue water (NRW) by volume
1 Basic
Fi36 Volume of NRW as a percentage of system input volume
Easily calculated from water audit data; has limited value in high-level financial terms only; it is misleading to use this as a measure of operational efficiency. This indicator should not be used for year-to-year tracking or for benchmarking with other water utilities.
Financial: NRW by cost
3 Detailed
Fi37 Value of NRW as a percentage of the annual cost of running the system
Incorporates different unit costs for non-revenue components; good financial indicator; should not be used for long-term performance tracking by the water utility or for benchmarking with other utilities.
Operational: Apparent Losses
1 Basic
Op23 [gal/service connection/d] Basic but meaningful performance indicator for apparent losses. Easy to calculate once apparent losses are quantified.
Operational: Real Losses
1 Basic
Op24 [gal/service connection/d]
or
[gal/mi of mains/d]
(only if service connection density is less than 32/mi)
Best of the simple “traditional” performance indicators; useful for target-setting; limited use for comparisons between systems.
Operational: Real Losses
2 Intermediate
— [gal/service connection/d/psi]
or
[gal/mi of mains/d/psi ]
(only if service connection density is less than 32/mi)
Divides the Op24 performance indicator by the average system pressure. Easy to calculate this indicator if the Infrastructure Leakage Index (ILI) is not yet known; useful for comparisons between systems.
Operational: Unavoidable Annual Real Losses (UARL)
3 Detailed
UARL UARL (gal) = (5.41Lm + 0.15Nc + 7.5Lc) × P × 365 d/year (Eq. 3-8)
Where:Lm = length of water mains, milesNc = number of service connectionsLc = total length of private service
connection pipe, miles where Lc = Nc × average distance from curb stop to customer meter, Lp (see Figures 3-13 through 3-15) to determine Lp
P = average pressure in the system, psi
A theoretical reference value representing the technical low limit of leakage that could be achieved if all of today’s best technology could be successfully applied. A key variable in the calculation of the ILI. The UARL calculation has not yet been proven fully valid for very small or low-pressure water systems.
In Eq. 3-8, 365 d/year is included given that water distribution systems in developed countries operate with continuous service for all 365 days in the audit year. For systems that operate with intermittent service, the number of days that the system was operated should be used instead of 365 days.
Operational: Real Losses
3 Detailed
Op25 ILI (dimensionless) = CARL/UARL Ratio of Current Annual Real Losses (CARL) to UARL; best indicator for comparisons among systems. This indicator is best applied only after sufficient water audit data validity is achieved and all justifiable pressure management is complete.
* Descriptors assigned to the performance indicators in the IWA publication Performance Indicators for Water Supply Services (Alegre et al. 2000).
©Copyright © 2016 American Water Works Association. All Rights Reserved.
CONDUCTING THE WATER AUDIT 107
AWWA Manual M36
detailed indicators (3). The method includes performance indicators at each of these levels as shown in Table 3-24.
The full array of performance indicators is automatically calculated by the Audit Software after entering all the input data. Individually, these performance indicators give good insight to the loss standing in particular functional areas. Collectively, they give a very realistic, objective assessment of overall loss standing in the water utility and are viewed as the current best practice means to assess water loss standing in water utilities.
Step 7-1. Financial performance indicators. The water audit method includes two financial performance indicators that are useful in assessing a water utility’s fiscal stand-ing regarding water losses.
Step 7-1A. Non-Revenue Water by Volume. The first indicator is expressed as a percentage of the volume of NRW over the Water Supplied volume and labeled as Fi36 on Table 3-24. This performance indicator is closest in its definition to the conceptual unaccounted-for water percentage used inconsistently in the past. However, by employ-ing the specifically defined NRW in the numerator, this performance indicator avoids the inconsistencies that have crippled the interpretation of unaccounted-for-water percent-ages. This indicator has some usefulness but only on a high-level financial basis to assess overall water supply management. Because it does not provide specific insight to the level of apparent loss or real loss management and is skewed by varying levels of customer consumption, it is not useful as an operational performance indicator. Thus, the perfor-mance indicator Non-Revenue Water by Volume should not be used for year-to-year operational performance tracking by water utilities nor by water utilities to compare or benchmark their operational performance with other water utilities. This performance indicator should not be used in any type of regulatory rulemaking.
As shown in the System Attributes and Performance Indicators worksheet in Figure 3-6, the financial performance indicator for CWC known as Non-Revenue Water as Percent by Volume of Water Supplied, is calculated to be 26.0 percent.
Step 7-1B. Non-Revenue Water by Cost. The second financial performance indica-tor is very revealing by quantifying the financial impact to the water utility from losses. This indicator is expressed as the cost of non-revenue water over the total annual cost of running the water supply system, or non-revenue water by cost. These latter costs include those for operations, maintenance, and any annually incurred costs for long-term upkeep of the system, such as repayment of capital bonds for infrastructure expansion or improvement. Typical costs include employee salaries and benefits, materials, equipment, insurance, fees, administrative costs, and all other costs that exist to sustain the drinking water supply. Depending on water utility accounting procedures or regulatory agency requirements, it may be appropriate to include depreciation in the total of this cost. The annual costs of operating the water supply system should not include any costs to operate wastewater, biosolids, or other systems outside of drinking water.
This performance indicator gives important insight to water utility managers, the financial community, regulators, customers, and advocacy groups about the overall finan-cial impact of losses on the water utility. It is an important indicator that could be refer-enced when issuing bonds, setting water rates, communicating to customers, or employing other financial or public relations functions typically undertaken by water utilities. A water utility can use this indicator to assess their ongoing financial performance, but for only a short-term horizon unless the time value of money is factored into the costs assem-bled during the water audit. The performance indicator Non-Revenue Water by Cost should not be used for long-term operational performance tracking by water utilities nor by water utilities to compare or benchmark their operational performance with other water utilities.
©Copyright © 2016 American Water Works Association. All Rights Reserved.
108 WATER AUDITS AND LOSS CONTROL PROGRAMS
AWWA Manual M36
As shown in the System Attributes and Performance Indicators worksheet in Figure 3-6, the financial performance indicator for CWC known as Non-Revenue Water as Percent by Cost is calculated to be 10.4 percent. Because this is a more detailed indicator than Non-Revenue Water as Percent by Volume of Water Supplied, its value of 10.4 percent is a better reflection of the financial impact of losses occurring in CWC. On its own, Non-Revenue Water as Percent by Volume of Water Supplied appears to overstate the impact of losses on CWC.
Step 7-2. Operational performance indicators. The method also includes five oper-ational performance indicators. These indicators include basic (1), intermediate (2), and detailed (3) levels of representation. As shown in Table 3-24, one performance indicator exists for Apparent Losses and four indicators exist for Real Losses.
Step 7-2A. Apparent Losses normalized (Op23 basic indicator). This performance indicator, measured in gallons of apparent losses per service connection per day, is effec-tive in assessing apparent loss standing and is useful to track year-by-year improvements as apparent loss controls are implemented. It is important to recognize that the cost impact of apparent losses is also an important parameter to track, particularly because the valu-ation of apparent losses at the retail customer rate is typically substantial. Apparent loss costs represent revenue that can be potentially recovered, a portion of which can often occur with very modest recovery effort. Also, it is highly important to note that whenever the water utility enacts a water rate increase, the cost impact of apparent losses increases at a commensurate level.
As shown in the System Attributes and Performance Indicators worksheet in Figure 3-6, Apparent Losses per Service Connection per Day for CWC is calculated to be 46.78 gal-lons per service connection per day. The cost impact of apparent losses is $821,449 for the audit year.
Step 7-2B. Real Losses normalized. Two normalized performance indicators exist for real losses: a basic indicator and an intermediate indicator.
Step 7-2B1. Real Losses normalized (Op24 basic indicator). The basic indicator has two versions. For most North American water utilities, it is measured in units of gallons of real losses per service connection per day. However, for water utilities with a low density of service connections (such as rural systems), this indicator is measured in gallons per mile of main per day. Those systems that have a systemwide average density of less than 32 service connections per mile of main should apply the latter indicator.
As shown in the System Attributes and Performance Indicators worksheet in Figure 3-6, Real Losses per Service Connection per Day for CWC is calculated to be 165.45 gallons per service connection per day. The cost impact of real losses is $139,934 for the audit year.
In the Audit Software, the appropriate version of the Real Losses indicator is auto-matically calculated based on system attributes.
The basic performance indicator is effective for trending the status of real losses in a water utility and for basic target-setting. As leakage management controls are successfully implemented, the downward trend in this measure should be observed.
Step 7-2B2. Real Losses normalized (Op24 intermediate indicator). The interme-diate indicator is the same form as the basic indicator, but it is divided by the average operating pressure in the system. It also has two versions: gallons of real losses per service connection per day per psi except for water utilities with a low density of service connec-tions (such as rural systems) wherein this indicator is measured in gallons per mile of
©Copyright © 2016 American Water Works Association. All Rights Reserved.
CONDUCTING THE WATER AUDIT 109
AWWA Manual M36
main per day per psi. Those systems that have a systemwide average density of less than 32 service connections per mile of main should apply the latter indicator. Note: the Audit Software does not calculate the low-density-system version of this performance indicator.
As shown in the System Attributes and Performance Indicators worksheet in Figure 3-6, Real Losses per Service Connection per Day per psi for CWC is calculated to be 2.55 gallons per service connection per day per psi of pressure.
Step 7-2B3. Unavoidable Annual Real Losses (UARL). This is a reference value used to calculate the ILI. The derivation and calculation of the UARL are described in Step 6-1. The use of the UARL to calculate the ILI is described in Step 7-2B4.
Step 7-2B4. Infrastructure Leakage Index (ILI). The ILI is a performance indicator designed for benchmarking of leakage standing among water utilities over a certain size (see Step 6-1 for UARL limitations). For water utilities that are just starting to audit their supply, the ILI can also be used as a preliminary target-setting mechanism (see chap-ter 7). Setting targets via the ILI carries a caveat, however: Because average pressure is included in the UARL and ILI calculations, changes in pressure (as might be performed in pressure management strategies) will alter the UARL and ILI. It is possible that leakage reductions might be achieved via improved pressure management, yet the ILI may remain unchanged, or even rise. Once a water utility has moved past its initial water auditing and loss control efforts, with the DVS falling at least in the Level III criteria, the ILI should serve only as a benchmarking indicator. Real losses reduction can then be tracked via the Op24 basic performance indicator.
The ILI is calculated as the ratio of the level of CARL (Step 3-3) to the UARL (Step 6-1).
For CWC, the CARL is 736.49 mil gal and the UARL is calculated to be 83.69 mil gal for the year. The ILI is calculated as the ratio of CARL over UARL and is determined to be 8.8, or a current level of real losses 8.8 times greater than the technical low level that could be achieved, in theory, if all possible leakage interventions were successfully applied.
Water audit data and performance indicators are reported for several water utilities and included in appendix E.
Task 8—Compile the Water BalanceAfter all data is entered into the Audit Software, quantities from the key consumption and loss components can be shown on the water balance. The completed water balance for CWC is shown in Figure 3-2 and is automatically populated in the Audit Software. It can be seen that the summation of the component volumes in each column moving left to right is 4,402.16 mil gal; hence all flows “balance.” The water balance reflects that all water managed by the drinking water utility is accounted for in the various categories of con-sumption and loss. Hence, no water is “unaccounted for,” and no such term exists in the recommended water audit method.
It is recognized that by quantifying the amount of real losses as the residual volume that is left after subtracting authorized consumption and apparent losses from water sup-plied, the data is forced to balance. The discussion under Step 3-3 notes that this does not necessarily represent a wholly accurate quantification of the real losses because inaccura-cies in the quantities reported for water supplied, authorized consumption, or apparent losses could induce a degree of error in the real loss value. The reader is referred to the “Leakage Component Analysis” section in chapter 7 to learn of the methods and tools to
©Copyright © 2016 American Water Works Association. All Rights Reserved.