harvard 1045-6333 harvard john m. olin center for law, economics, and business the effect of...
TRANSCRIPT
ISSN 1045-6333
HARVARD John M. Olin Center for Law, Economics, and Business
THE EFFECT OF AUTOMOBILE INSURANCE
AND ACCIDENT LIABILITY LAWS ON TRAFFIC FATALITIES
Alma Cohen and Rajeev Dehejia
Discussion Paper No. 479 6/2004
Harvard Law School Cambridge, MA 02138
The Center for Law, Economics, and Business is supported by a grant from the John M. Olin Foundation.
This paper can be downloaded without charge from:
The Harvard John M. Olin Discussion Paper Series: http://www.law.harvard.edu/programs/olin_center/
The Social Science Research Network Electronic Paper Collection:
http://ssrn.com/abstract=363700

Forthcoming, Journal of Law and Economics __ (2004)
THE EFFECT OF AUTOMOBILE INSURANCE AND ACCIDENT LIABILITY LAWS ON TRAFFIC FATALITIES *
Alma Cohen* and Rajeev Dehejia**
Abstract
This paper investigates the incentive effects of automobile
insurance, compulsory insurance laws, and no-fault liability laws on driver behavior and traffic fatalities. We analyze a panel of 50 U.S. states and the District of Columbia from 1970-1998, a period in which many states adopted compulsory insurance regulations and/or no-fault laws. Using an instrumental variables approach, we find evidence that automobile insurance has moral hazard costs, leading to an increase in traffic fatalities. We also find that reductions in accident liability produced by no-fault liability laws have led to an increase in traffic fatalities (estimated to be on the order of 6%). Overall, our results indicate that, whatever other benefits they might produce, increases in the incidence of automobile insurance and moves to no-fault liability systems have significant negative effects on traffic fatalities.
JEL Codes: G22, J28, K13 Keywords: No-fault laws, compulsory insurance, moral hazard
* John M. Olin Center for Law, Economics and Business, National Bureau of Economic Research, and Analysis Group; Email: [email protected] ** Columbia University and National Bureau of Economic Research; Email: [email protected] An earlier version of this paper was circulated as NBER Working Paper No. 9602. We are grateful to Austan Goolsbee for detailed comments, and to Kenneth Abraham, Lucian Bebchuk, Liran Einav, Amy Finkelstein, Sam Peltzman, Jack Porter, Steven Shavell, an anonymous referee, and participants at the Harvard labor economics seminar for their valuable suggestions. We are also grateful to Richard Derrig for helping us with some of the data. All remaining errors are our own. Cohen thanks the NBER Postdoctoral Fellowship in Aging and Health Economics for financial support. Dehejia thanks the NBER and the Industrial Relations Section, Princeton University, for their kind hospitality while working on this project. © Alma Cohen and Rajeev Dehejia 2004. All rights reserved.

1
In the United States today, we are at the threshold of a great experiment in social
insurance – one of the most far-reaching in consequence of any that has been yet attempted in the New World. Probably within the next decade or two, most of the states will pass laws, the purposes of which will be the financial assistance of some or all of the victims of automobile accidents, and the prevention of such accidents in so far as is possible. --Edison L. Bowers, Selected Articles on Compulsory Automobile Insurance. New York: The W.H. Wilson Company, 1929.
I. Introduction This paper examines how economic incentives and liability regulation influence driver
behavior and, in turn, traffic fatalities. We use the introduction of compulsory insurance and
no-fault liability regulation to examine the moral hazard effects of automobile insurance,
compulsory insurance laws, and no-fault liability laws. We analyze a panel of 50 U.S. states
and the District of Columbia from 1970-1998, a period in which many states adopted
compulsory insurance regulations and/or no-fault laws. Using compulsory insurance as an
instrument for the proportion of uninsured motorists, we find that automobile insurance has
significant moral hazard costs, namely reducing precautions and increasing traffic fatalities.
We also find that limiting motor vehicle liability through no-fault liability laws leads to an
increase in traffic fatalities. Overall our results indicate that, whatever benefits flow from
increasing the incidence of automobile insurance and from moves to a no-fault system, there
are also significant moral hazard costs to doing so.
Traffic accidents have very large costs which merit substantial attention by
economists.1 These accidents claim over 40,000 lives each year in the United States, roughly
the same as the number of Americans killed during the Vietnam War. Americans spend
roughly $100 billion each year on automobile insurance premia, and they bear over $250
billion in uninsured accident costs each year. The incidence of motor vehicle crashes and
traffic fatalities is likely to be influenced significantly by choices made by drivers (including
whether to use seat belts or air bags, how carefully to drive, whether to drink alcohol, and
how much to drive). Accordingly, economists have long been interested in how these choices
2
are influenced by agents’ economic incentives and by various legal rules and policy
measures.2
Beginning in 1970, most U.S. states adopted compulsory automobile insurance
requirements. Over the same period, 16 states adopted no-fault automobile insurance. The
impact of these policy shifts on traffic fatalities is of interest for two reasons. First,
identifying this effect – which we shall see is significant – is necessary for assessing the
social desirability of these policies. Second, these changes in automobile insurance
regulations provide a large-scale natural experiment through which we can examine the
moral hazard effects of automobile insurance and the incentive effects of liability exposure.
In this sense, the changes in laws that we examine offer an interesting window on a larger set
of phenomena.
Specifically, we investigate two related issues. First, we examine whether having
automobile insurance (empirically, we examine the proportion of uninsured motorists) has a
moral-hazard effect on traffic fatalities. As a theoretical matter, insurance does have the
moral hazard cost of reducing the policyholder’s incentives to take precautions against the
insured loss.3 This is also theoretically the case for the particular type of insurance that we
examine, namely insurance for automobile accidents.4 However, the question is whether the
reduction in precautions against automobile accidents produced by automobile insurance –
which theory predicts – is empirically significant. For example, it might be that drivers’
concern for their own safety and health provide sufficient incentives for them to take
precautions (to the extent that taking precautions is affected at all by incentives) and that the
presence of insurance makes little difference on the margin. Although there has been much
1 See for example, Aaron Edlin, Per-Mile Premiums for Auto Insurance, (Working paper No. 6934, NBER 1999); Steven D. Levitt & Jack Porter, How Dangerous are Drinking Drivers?, 109 J. Pol. Econ. 1198 (2001). 2 For the seminal work, see Sam Peltzman, The Effects of Automobile Safety Regulation, 83 J. Pol. Econ. 667 (1975); Sam Peltzman, Regulation of Automobile Safety (1975). 3 Classic references analyzing this effect include Mark Pauly, The Economics of Moral Hazard: Comment, 58 Am. Econ. Rev. 531 (1968); A. Michael Spence & Richard Zeckhauser, Insurance, Information and Individual Action, 61 Am. Econ. Rev. 380 (1971); Steven Shavell, On Moral Hazard and Insurance, 93 Q. J. Econ. 541 (1979). For a comprehensive recent survey of models investigating the moral hazard costs of insurance, see A. Ralph Winter, Moral Hazard, in Handbook of Insurance (G. Dionne ed. 2000). 4 See Steven Shavell, On Liability and Insurance, 13 Bell J. Econ. 120 (1982); Steven Shavell, Economic Analysis of Accident Law (1987); Steven Shavell, On the Social Function and Regulation of Liability Insurance, 25 Gen. Pap. Risk & Ins. 166 (2000).
3
interest in the incidence of automobile insurance and uninsured motorists,5 whether
automobile insurance leads to moral hazard costs is an open question that has not been
addressed by existing research.
Our strategy for examining this issue is to look at the consequences of a natural
experiment: the adoption of compulsory insurance regulations in some states governed by
tort law. Because this change produces a reduction in uninsured motorists not attributable to
other confounding factors, we are able to test the consequences of a reduction in uninsured
motorists on traffic fatalities. Although some work on compulsory insurance has been done,6
none of these papers make the connection between such regulations and traffic fatalities.
Derrig et al.,7 who do connect the two, find insignificant effects on fatalities rates. Our
results indicate that a reduction in the incidence of uninsured motorists produces an increase
in traffic fatalities.
The second issue we examine is the effect on traffic fatalities of the reduction in
liability brought about by no-fault laws. Earlier work8 suggested that, by reducing incentives
to drive carefully, such laws have led to an increase in traffic fatalities in the United States.
Subsequently, Zador and Lund9 re-ran Landes’s regressions using a longer data set and found
the opposite effect; Kochanowski and Young10 and Derrig et al.11 found no significant effect;
and Cummins, Phillips, and Weiss12 recently found a significant positive effect of no-fault on
5 Edlin, supra note 1, documents the congestion externalities of driving, but these are distinct from the moral hazard costs of insurance. 6 See Yu-Luen Ma & Joan T. Schmidt, Factors Affecting the Relative Incidence of Uninsured Motorists Claims, 67 J. Risk & Ins. 81 (2000); Cassandra R. Cole, Randy E. Dumm, & Kathleen A. McCullough, The Uninsured Motorist Problem: An Investigation of the Impact of Enforcement and Penalty Severity on Compliance, 19 J. Ins. Reg. 613 (2001). 7 A. Richard Derrig et al., The Effect of Population Safety Belt Usage Rates on Motor Vehicle-Related Fatalities, 34 Acc. Anal. & Prev. 101 (2002). 8 M. Elisabeth Landes, Insurance Liability and Accidents: A Theoretical and Empirical Investigation of the Effect of No-Fault Accidents, 25 J. Law & Econ. 49 (1982). 9 Paul Zador & Adrian Lund, Re-Analysis of the Effects of No-Fault Auto Insurance on Fatal Crashes, 53 J. Risk & Ins. 226 (1986). 10 S. Paul Kochanowski & Madelyn V. Young, Deterrents Aspects of No-Fault Automobile Insurance: Some Empirical Findings, 52 J. Risk & Ins. 269 (1985). 11 See note 7 supra. 12 J. David Cummins, Richard D. Phillips, & Mary A. Weiss, The Incentive Effects of No-Fault Automobile Insurance, 44 J. Law & Econ. 427 (2001).
4
traffic fatalities.13 However, all states that adopted no-fault limitations on liability also
adopted compulsory insurance requirements at the same time, and these earlier studies did
not attempt to separate the effects of the two elements of the legislation. Thus, they did not
isolate the effect of limitations on liability as distinct from the effects of the accompanying
adoption of compulsory insurance requirements. We consider the two elements of legislation
simultaneously, and in this way are able to identify the effect of no-fault limitations on
liability separately from the effect of compulsory insurance requirements. We find that no-
fault limitations on liability do increase fatalities. Specifically, we estimate that the effect of
such limitations is to increase fatalities by about 10%.
This paper is also related to, and seeks to contribute to, the broader literature on the
factors and policy measures that influence traffic fatalities. There is an extensive literature on
how the use of seat belts directly reduces fatalities and on whether it indirectly increases
fatalities by encouraging users to drive less carefully.14 There is also work on how traffic
fatalities are influenced by the consumption of alcohol, and in turn by some measures
discouraging the sale of alcohol.15 White16 investigates how comparative and contributory
negligence rules affect the levels of care used by drivers (as judged by jury determination in
accident cases). Vickery, Edlin, and Edlin and Mandic17 examine the effects of miles driven
on fatalities and how they could be influenced by appropriately designed taxes or insurance
premia.
This paper is organized as follows. Section II provides the necessary background by
discussing the laws regarding compulsory insurance and no-fault liability. Section III lays
13 In studies on other countries, Rose Anne Devlin, Liability versus No-Fault Automobile Insurance Regimes: An Analysis of the Experience of Quebec, in Contributions to Insurance Economics (G. Dionne ed. 1992); and R. Ian McEwin, No-Fault and Road Accidents: Some Australasian Evidence, 9 Int. Rev. Law & Econ. 13 (1989), found that no-fault liability laws increased fatalities in Quebec and in Australia and New Zealand respectively. 14 See for example note 2 supra; Steven D. Levitt & Jack Porter, Sample Selection in the Estimation of Air Bag and Seat Belt Effectiveness (Working paper No. 7210, NBER 1999); Alma Cohen & Liran Einav, The Effect of Mandatory Seat Belt Laws on Driving Behavior and Traffic Fatalities, (Olin paper No. 341, Harvard Law School 2001). 15 See for example note 1 supra; A. Frank Sloan, Bridget A. Reilley, & Christoph M. Schenzler, Tort Liability versus Other Approaches for Deterring Careless Driving, 14 Int. Rev. Law & Econ. 53 (1994). 16 Michelle J. White, An Empirical Test of the Comparative and Contributory Negligence Rules in Accident Law, 20 RAND J. Econ. 308 (1989). 17 Edlin, supra note 1; Aaron Edlin & Pinar Karaca Mandic, The Accident Externality from Driving (unpublished manuscript, 1999).
5
out theoretical predictions and our approach to testing them. Section IV describes the data.
Section V presents our results. Section VI makes concluding remarks.
II . Automobile Insurance and Liability for Accidents We start with some background on automobile insurance and liability. There is a wide range
of regulation governing automobile insurance and liability. In this paper, we focus on two
aspects of regulation that directly affect drivers: compulsory insurance and no-fault systems.
A. Compulsory Insurance Regulation
Each year a large amount of insurance coverage for automobile accidents is purchased in the
US. Total automobile liability insurance premia are over $100 billion annually. A significant
amount of insurance would be bought without any regulation, simply because drivers are
risk-averse. However, current purchases might be influenced by the existence of compulsory
insurance regulations.
Compulsory automobile insurance means that all those operating a motor vehicle
must purchase insurance. Given the bounded nature of assets that individuals commonly
have, it is often rational for them to elect not to purchase insurance if they are free to do so.18
Compulsory insurance laws ensure some compensation to those injured in automobile
accidents.19 When drivers have limited assets, such laws also force drivers to at least partly
internalize some of the externality imposed on others by their driving.20
Compulsory insurance regulation was first introduced in Massachusetts in 1927. It
had been adopted by 22 states by 1975, and by 45 states by 1997, the end of the sample
period (see Table 1). Among these states, there is variation in the amount of each type of
insurance that individuals are required to purchase and in the methods used to enforce this
regulation. We observe two aspects of enforcement: 40 states require that a driver’s
18 See for example Gur Huberman, David Mayers, & Clifford W. Smith, Optimal Insurance Policy Indemnity Schedules, 14 Bell J. Econ. 415 (1983). 19 See Edward Stone, Compulsory Automobile Liability Insurance, 4 Pamp. Ins (1926) for an early work advocating compulsory insurance laws on this basis. 20 See Shavell, Econ. Anal. Acc. Law, supra note 4; R. William Keeton & Evan Kwerel, Externalities in Automobile Insurance and the Underinsured Driver Problem, 27 J. Law & Econ. 149 (1984).

6
insurance status be reported at the time of an accident, and 35 states require that insurance
companies notify the appropriate state authorities if a driver’s insurance policy lapses.
B. Accident Liability Systems: Tort vs. No-Fault
Historically the liability of drivers for accident losses was governed by tort principles.
Drivers were liable for losses to others that resulted from their negligent behavior. In theory,
a tort system with a negligence rule that functions perfectly – i.e., in which courts can always
costlessly and accurately determine whether behavior was negligent – provides optimal
incentives for care in driving and accident prevention. However, in practice, the tort system
has various flaws, such as the substantial administrative costs and delays involved in
adjudicating negligence and thus liability.
Perceived problems with the tort system have led reformers to propose no-fault
liability systems. As early as 1926, there was analysis of the idea that there are potential
benefits from limiting negligence-based suits and offering protection against injuries in
automobile insurance regardless of fault.21 In 1932, the Columbia University Counsel for
Research in Social Sciences proposed a scheme in which each motor vehicle owner would be
required to carry a policy covering him against liability arising from injury, economic loss, or
death, regardless of fault. In 1965, Keeton and O’Connell22 published an influential study
calling for a move to a no-fault system.
The first jurisdiction to adopt such a scheme was Saskatchewan (in Canada) in 1946.
In the US, the first state to adopt a no-fault system was Massachusetts in 1971. By 1975, 16
states had adopted a no-fault system. Most of these states (with the exception of
Massachusetts and New York) adopted compulsory insurance concurrently with no-fault
limitations on liability. The number of states with a no-fault system fell to 14 in 1997, with 6
states switching status in between.
There are two important elements of a no-fault system. First, (most) no-fault systems
require drivers to purchase insurance that provides first-party coverage for accident losses,
21 See P.T. Sherman, Compulsory Insurance of Compensation for Injuries by Automobile Accidents, 4 Pamp. Ins (1926). 22 Robert Keeton and Jeffrey O’Connell, Basic Protection for the Traffic Victim, 1965.

7
regardless of who was at fault. Second, no-fault systems limit the extent to which drivers can
be sued through negligence-based suits. In a pure no-fault system, victims do not have any
recourse to negligence-based suits. However, all states provide for thresholds beyond which
the parties to an accident have recourse to lawsuits. As outlined in Table 1, in 13 states
(Arizona, the District of Columbia, Delaware, Maryland, New Hampshire, Oregon,
Pennsylvania, South Carolina, South Dakota, Texas, Virginia, Washington, and Wisconsin)
no-fault exists in parallel with the traditional tort system. In these so-called add-on states,
there are no limitations to litigation. The remaining states provide either a monetary or verbal
(i.e., descriptive) threshold beyond which individuals have the right to sue.
Add-on regulations are a combination of the no-fault and tort systems, adding no-fault
protection to the tort system without imposing any limitations on the latter. Ten states
adopted add-on regulations. Because of its hybrid nature, it is difficult to predict the effects
of add-on regulation. Hence, in our analysis we focus on no-fault, but also examine the effect
of the threshold below which tort limitations are imposed, since no-fault systems with a low
threshold resemble add-on regulations.
III. THEORETICAL PREDICTIONS AND TESTING APPROACH
We begin by discussing the effect of compulsory insurance laws on uninsured motorists and
fatalities, both theoretically and empirically. Next, we discuss the effect of no-fault laws on
uninsured motorists and fatalities, and the issues that arise in identifying the effect of no-fault
laws as distinct from compulsory insurance laws. Finally, we discuss the direct effect of
uninsured motorists on traffic fatalities and the instrumental variables identification of this
effect.
A. The Effect of Compulsory Insurance Regulations
The effects of compulsory insurance regulation on drivers will vary depending on what
insurance choice they would have made in the absence of compulsory insurance. Figure 1
identifies four groups of individuals.
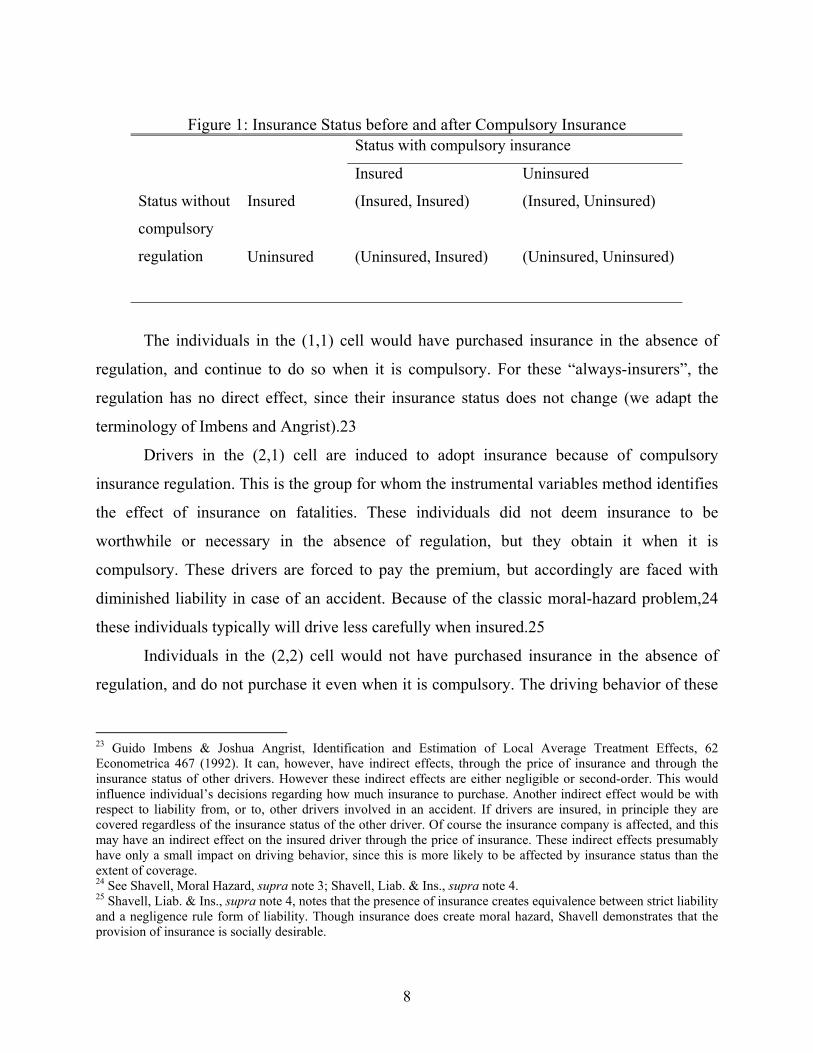
8
Figure 1: Insurance Status before and after Compulsory Insurance
Status with compulsory insurance
Insured Uninsured
Insured
(Insured, Insured) (Insured, Uninsured) Status without
compulsory
regulation Uninsured
(Uninsured, Insured) (Uninsured, Uninsured)
The individuals in the (1,1) cell would have purchased insurance in the absence of
regulation, and continue to do so when it is compulsory. For these “always-insurers”, the
regulation has no direct effect, since their insurance status does not change (we adapt the
terminology of Imbens and Angrist).23
Drivers in the (2,1) cell are induced to adopt insurance because of compulsory
insurance regulation. This is the group for whom the instrumental variables method identifies
the effect of insurance on fatalities. These individuals did not deem insurance to be
worthwhile or necessary in the absence of regulation, but they obtain it when it is
compulsory. These drivers are forced to pay the premium, but accordingly are faced with
diminished liability in case of an accident. Because of the classic moral-hazard problem,24
these individuals typically will drive less carefully when insured.25
Individuals in the (2,2) cell would not have purchased insurance in the absence of
regulation, and do not purchase it even when it is compulsory. The driving behavior of these
23 Guido Imbens & Joshua Angrist, Identification and Estimation of Local Average Treatment Effects, 62 Econometrica 467 (1992). It can, however, have indirect effects, through the price of insurance and through the insurance status of other drivers. However these indirect effects are either negligible or second-order. This would influence individual’s decisions regarding how much insurance to purchase. Another indirect effect would be with respect to liability from, or to, other drivers involved in an accident. If drivers are insured, in principle they are covered regardless of the insurance status of the other driver. Of course the insurance company is affected, and this may have an indirect effect on the insured driver through the price of insurance. These indirect effects presumably have only a small impact on driving behavior, since this is more likely to be affected by insurance status than the extent of coverage. 24 See Shavell, Moral Hazard, supra note 3; Shavell, Liab. & Ins., supra note 4. 25 Shavell, Liab. & Ins., supra note 4, notes that the presence of insurance creates equivalence between strict liability and a negligence rule form of liability. Though insurance does create moral hazard, Shavell demonstrates that the provision of insurance is socially desirable.
9
individuals is affected to the extent that compulsory insurance laws succeed in inducing
some individuals to switch from being uninsured to being insured. To the extent that
compulsory insurance laws are effective, those drivers who remain uninsured are induced to
drive more carefully, since their status as uninsured drivers is illegal under compulsory
insurance laws. If, however, compulsory insurance laws were ineffective and did not induce
drivers to switch into insurance, then there would be no effect on uninsured drivers. We
expect that the former case is empirically relevant.
Finally drivers in the (1,2) cells would be insured in the absence of compulsory
insurance, but choose not to insure themselves when it is required. Assuming that individuals
do not derive some benefit from defying compulsory insurance regulations, this cell will be
empty.
In summary, we have identified two critical groups: those who adopt insurance
because of regulation (who are likely to drive more and less carefully) and those who are
always uninsured (who are likely to drive less and more carefully because of regulation).
Hypothesis H1: Under compulsory insurance:
(i) The proportion of uninsured motorists decreases.
(ii) The decrease in uninsured motorists produces an increase in fatalities among
switchers.
(iii) Those who remain uninsured motorists drive more carefully, producing a
decrease in fatalities for this group.
We test these hypotheses by examining the direct effect of compulsory insurance laws
on uninsured motorists and fatalities. An issue that arises in identifying the effects of
compulsory as distinct from no-fault regulations is that both sets of laws often were
introduced together. In particular, states that adopted no-fault limitations on liability adopted
compulsory insurance regulations at the same time, and likewise for add-on regulations. As a
result, to identify the effect of compulsory insurance, we restrict attention to states and years
that have neither no-fault nor add-on provisions. We refer to this as the compulsory sample.
Table 2, column (1), presents the states and years that are included in this sample. All 50
10
states and regions are represented in the sample. In the Midwestern, Southern, and Western
states, approximately half are present for the entire sample period. The least represented
region is the Northeast, with New Hampshire, Rhode Island, and Vermont represented for the
full sample period, but many other Northeastern states represented only in the early 1970s.
B. The Effect of No-Fault Systems
The literature on no-fault systems has argued that motorists will drive less carefully under
no-fault than a tort system. Since a no-fault system limits drivers’ liability from their actions,
it weakens their incentives to take precautions when driving. By the same token, it also could
lead to increased driving.
However, this argument ignores the fact that the effects of no-fault limitations on
liability will be different for insured and uninsured drivers. The standard analysis applies to
the former group. Insured drivers are protected (by insurance) from liability if they are the
victims of an accident, and no-fault limits their liability if they cause an accident. In contrast,
for uninsured drivers the incentives differ in these two cases. If an uninsured driver causes an
accident, then he faces reduced liability under a no-fault scheme (even if the driver can be
sued under the monetary or verbal threshold the driver cannot be sued for pain and
suffering); this presumably leads to reduced precautions when driving. If an uninsured driver
is the victim of an accident, his recourse to compensation is also limited in a no-fault system
(because a victim under the no-fault system cannot sue for additional pain and suffering
compensation); this would lead to more cautious driving behavior. These two effects go in
opposite directions, as summarized in the following hypothesis.
Hypothesis H2: By adopting no-fault limitations on liability in addition to compulsory insurance
requirements:
(i) For insured drivers, liability decreases, leading to an increase in fatalities.
(ii) For uninsured drivers, if at fault, liability decreases, leading to an increase in
fatalities, but if not at fault, coverage decreases, possibly leading to a decrease in
fatalities. Therefore, the overall effect is ambiguous.
11
The overall effect is thus theoretically ambiguous, and an empirical investigation is needed.
As discussed above, one difficulty with identifying the effect of no-fault laws as distinct from
compulsory laws is that most states adopted these laws at the same time. To identify the effect of
no-fault limitations on liability, as distinct from compulsory insurance, we examine the effect of
no-fault among states that have either compulsory insurance or no-fault regulation, excluding
add-on states (we call this the no-fault sample). As we can see from column (2) of Table 2, this is
a somewhat more restrictive sample. All regions are represented, but for a reduced period. Many
states are present later in the sample period after they had adopted compulsory, no-fault and
compulsory, or had eliminated no-fault or add-on provisions.
We cannot (and do not) claim that this sample, and likewise the compulsory sample
discussed in Section III.A, corresponds to the full sample of U.S. states. However, both samples
are broadly representative. Further, we will allow for year fixed effects to address the issue that
the no-fault sample is more representative of the latter half of the sample period. Finally, the
samples represent the only sub-groups in which the effects of these policies can be identified, so
to that extent we have to accept this limitation.
C. The Effect of Insurance Status on Fatalities
To the extent that insurers cannot monitor the behavior of the policyholder perfectly and
make the policy conditional on optimal behavior, insurance coverage will tend to reduce the
care and precautions that drivers take while driving. This is the familiar moral hazard cost of
insurance. Thus, the prediction is that the higher the proportion of uninsured motorists, the
lower the number of accidents.
Hypothesis H3: A higher incidence of uninsured motorists leads to fewer traffic fatalities.
In the popular press and in the literature on uninsured motorists, the existence of such
motorists is viewed as unambiguously bad. We do not question that the presence of
automobile insurance produces risk-bearing and compensation benefits. Our interest,
however, is in exploring whether insurance also has a down side, a moral hazard cost, which
needs to be taken into account in any assessment of uninsured motorists and regulations
affecting their incidence.

12
We use an instrumental variable strategy to identify the effect of uninsured motorists
on traffic fatalities; because both of these outcomes are jointly determined, OLS estimation
of the relationship would be subject to simultaneity bias.26 As established in Imbens and
Angrist, and Angrist, Imbens, and Rubin,27 an instrumental variables strategy identifies the
effect of the instrument on those who are induced to change their “treatment assignment”
based on the instrument. In our case, the instrumental variables strategy thus identifies the
effect on those induced to join insurance as a result of compulsory insurance regulation. As
discussed in Section III.A, we expect the effect for this group to be negative: as the
proportion of uninsured motorists decreases, fatalities increase because of the moral hazard
effect on switchers.
The two candidates for instrumental variables are compulsory insurance and no-fault
liability laws. In Section V.A we argue that both sets of laws are exogenous conditional on a
range of controls, hence plausible candidates for instruments. But we must also consider
whether either of these variables satisfies the requirement that they affect the outcome
(fatalities) only through their effect on uninsured motorists.
As discussed in Section III.B, no-fault laws affect fatalities by influencing the liability
that drivers face from their actions. Even if the number of uninsured motorists were
unaffected by no-fault laws, the laws could have a significant effect on fatalities through
incentive effects on both motorists who are currently insured and those who are uninsured.
Instead, the direct effect of the adoption of compulsory insurance on fatalities is to
induce motorists to switch from being uninsured to insured. There is also potentially an
indirect effect, namely inducing drivers who remain uninsured to drive more carefully.
Despite the possibility of an indirect effect, we believe that an instrumental variable is a
reasonable strategy for two reasons. First to the extent that the indirect effect depends on the
number of uninsured motorists induced to drive more safely, the effect should be small.
Second, and more importantly, to the extent that the indirect effect of compulsory insurance
26 In particular, traffic fatalities depend on the number of insured drivers, but we can imagine a second equation in which drivers choose insurance status based on the rate of traffic fatalities. In this case, the OLS estimates of a single equation will be inconsistent. 27 See note 23 supra; Joshua Angrist, Guido Imbens, & Donald Rubin, Identification of Causal Effects Using Instrumental Variables, 91 J. Am. Stat. Ass. 444 (1994).

13
on fatalities will lead to a reduction in traffic fatalities (if uninsured motorists are induced to
drive more safely), any direct positive effect we find must be downward biased relative to the
true effect.28
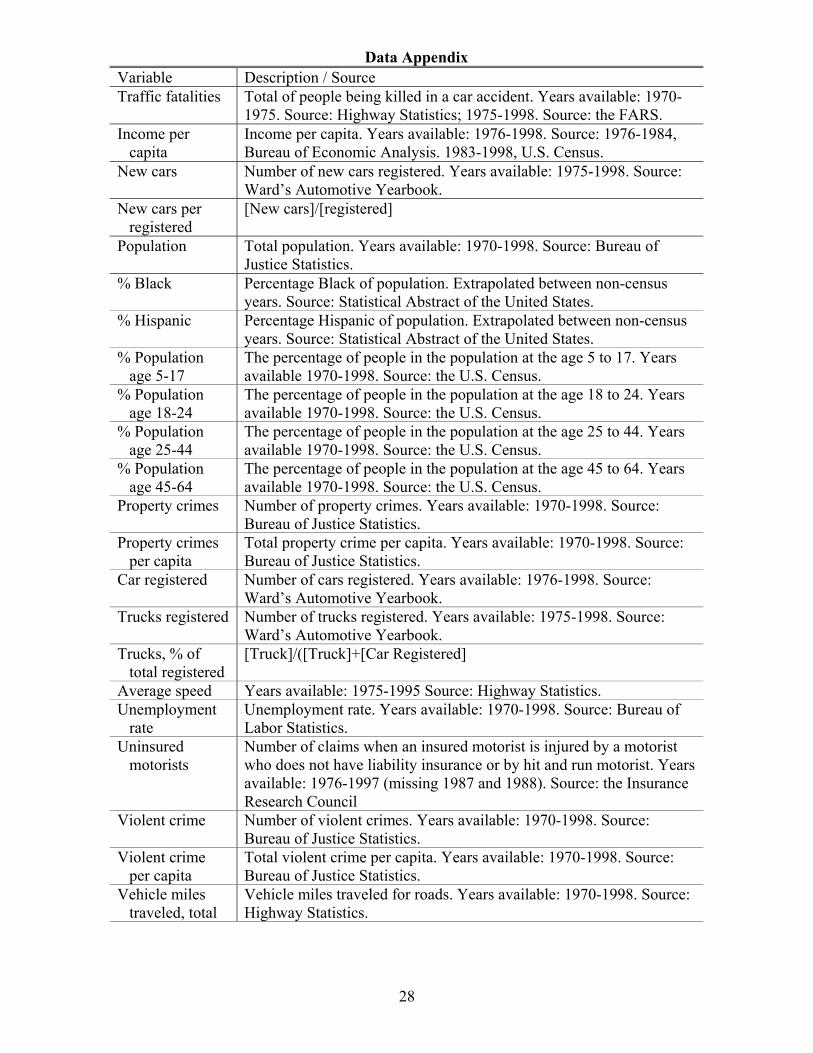
IV. Data Description We use a panel of annual state-level variables. The data cover all 50 U.S. states and the
District of Columbia for the years 1970-1998.29 The data include information about (1)
some components of automobile insurance law; (2) the level of uninsured motorists; (3)
states’ demographics characteristics; and (4) fatality rates.
We obtain information about automobile insurance regulations and accident liability
regulations from the American Insurance Association (AIA) for the years 1970 to 2001.30
The variables we use are: (1) whether a state has compulsory auto insurance – “yes” denotes
those states requiring minimum liability insurance or showing some proof of financial
responsibility; (2) which enforcement mechanisms a state uses for compulsory insurance
(including checking insurance status at the time of an accident, or verifying insurance status
at the time of vehicle registration); (3) whether a state adopted a no-fault or add-on system
instead of a tort liability system (the default), and (4) whether a no-fault state has a monetary
or verbal threshold (and the value of the threshold).
We obtain data on uninsured motorists from the Insurance Research Council (IRC)
for the years 1976-1998. Several methods have been used to estimate the proportion of
uninsured motorists.31 From these, we use the IRC’s estimates, because they are the most
comprehensive of those available.32 The incidence rates of uninsured motorists reported by
28 Thus, if the direct effect of uninsured on fatalities is negative, an indirect effect would bias our results toward zero. 29 Information on uninsured motorist is available only from 1976 on. 30 American Insurance Association, Summary of Selected State Laws and Regulations Relating to Automobile Insurance (1976-2000). 31 J. Daniel Kahzoom, 17 J. Ins. Reg. 59 (2000). 32 The IRC uses two variables to calculate the proportion of uninsured motorists: Uninsured Motorists Claim, which is the number of uninsured motorists claims for injuries caused to the insured by uninsured motorists and Bodily Injury Liability Claim (BI), which is the number of injuries caused by insured motorists. The ratio of Uninsured Motorists Claim frequency to Bodily Injury Liability Claim frequency is then used to measure the extent of the uninsured motorist problem. Under the null hypothesis of no moral hazard and equal probability of an accident for insured and uninsured motorists, it can be shown (using the model of Levitt and Porter, supra note 1) that the IRC measure is identical to the fraction of uninsured motorists in the population. Thus, this issue does undermine our

14
the IRC vary considerably across states, from 4% in Maine to 30% in Colorado and South
Carolina (for the year 1997). Our data on traffic fatalities is from the Fatality Analysis
Reporting System. We use fatalities per person as the outcome, rather than the more
commonly used fatalities per vehicle mile traveled, but as a robustness check, we present
results using fatalities per vehicle mile traveled.33
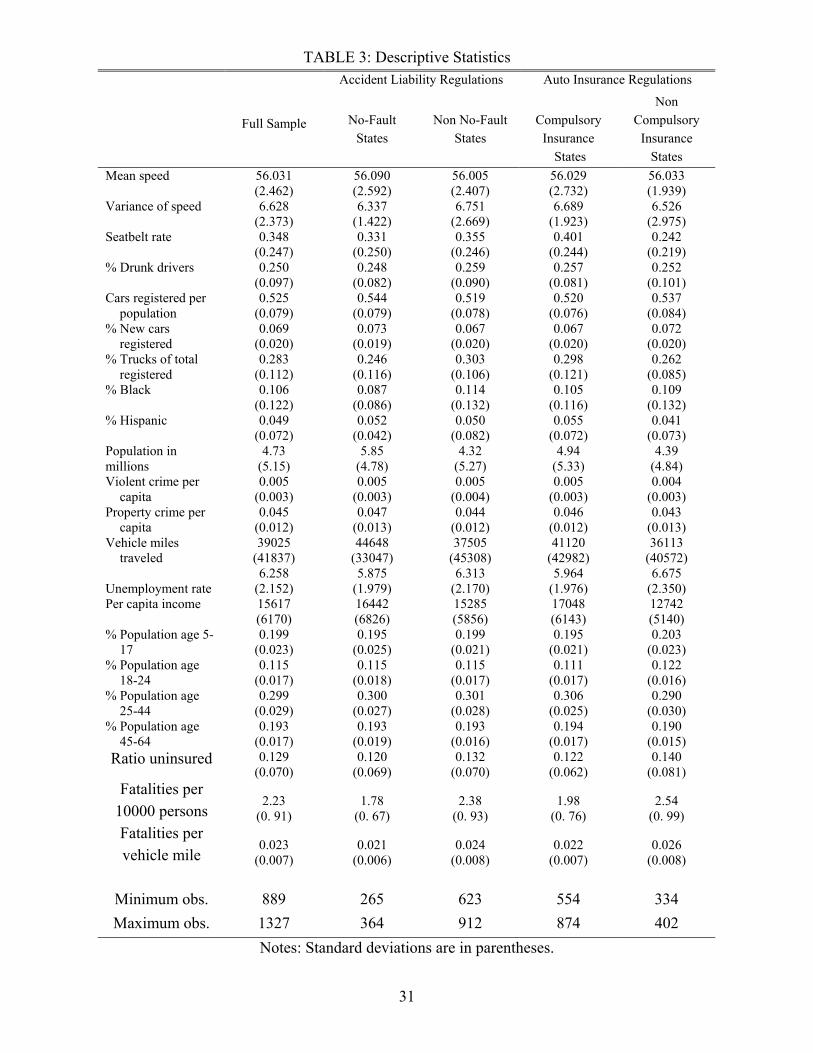
A description of our variables appears in Table 3, and their sources are outlined in the
Data Appendix.
V. The Results
A. The Conditional Exogeneity of the Laws
In studying the effect of compulsory insurance and no-fault regulation on the proportion of
uninsured motorists and driving fatalities, it is important to investigate first whether the laws
are plausibly exogenous (conditional on the covariates and time and year fixed effects in our
specification). The concern is a systematic selection of which states choose to adopt these
laws and when. There are three potential sources of selection.
First is selection on observables: states that choose to adopt may differ in terms of
age, ethnicity, income, etc. We will address this by including these variables as controls in
our subsequent specifications. Second, we are concerned with selection on the outcome, in
particular that states with a higher level of uninsured motorists or fatalities may be more
likely to enact automobile insurance legislation. This will be addressed by allowing for state
and year fixed effects. Third, there could be time-varying selection on the outcome. In
particular, states that experience a shock (for example a sudden increase) in one of the
outcomes may be more likely to adopt regulation. Since controlling for lagged dependent
conclusion that the possibility of no moral hazard can be rejected. Furthermore, as an empirical matter, we check the robustness of our results to using the log (rather than the level) of uninsured, since this variable is more robust to potential measurement error. 33 Though fatalities per vehicle mile traveled is perhaps appropriate for measuring the risk faced by motorists, it is problematic for measuring the effect of compulsory insurance and liability regulation on fatalities at the state level, which is the focus of this paper. The adoption of these laws can affect drivers’ behavior through multiple channels, including vehicle miles traveled. Thus, fatalities per vehicle mile traveled can increase because of an increase in fatalities or because of a decrease in vehicle miles traveled. Since the focus of this paper is the effect of states adopting compulsory insurance and no-fault, fatalities per person is a more appropriate outcome.

15
variables in a fixed-effects regression is challenging, this is a greater concern. We present
two tests of the exogeneity of the laws, one in Table 4 and the other in Section V.D below.
Table 4 examines whether selection into the laws is predicted by lagged outcomes.
We use the deviation of uninsured motorists and fatalities from state means, because our
subsequent specifications will take out non-time-varying state-specific effects using state
dummies. In columns (1) and (4) we present a probit regression of compulsory insurance and
no-fault regulation on a range of exogenous variables, including population, ethnic
composition, crime, per capita income, and the age profile of the population. Most are
statistically significant predictors of the laws. States with a lower proportion of blacks, more
violent crimes, and a higher proportion of drivers outside the 18-to-24 age range are more
likely to have compulsory insurance. For no-fault, the signs are largely reversed. This basic
set of variables predicts the laws with about 70 percent accuracy. Thus, controlling for these
observables will account for a significant proportion of selection into the laws. Of course, in
our subsequent specifications, we will also include an additional, powerful source of control,
namely state and year fixed effects.
In columns (2) and (3) we examine whether lagged outcomes predict the passage of
compulsory insurance, and in columns (5) and (6) we examine the impact of these variables
on no-fault. Neither the first nor the second lags of uninsured and fatalities is a significant
predictor of compulsory insurance or no-fault regulation. Furthermore, the increase in the
predictive power of the models is minimal, increasing from 68 to 71 percent for compulsory
and 77 to 78 percent for no-fault regulation. This suggests that lagged outcomes are not a
significant source of selection in our data.
This test, of course, has its limitations. In Table 4, selection into the laws could be
based on other functional forms of the outcome. Consequently in Section V.D we present
another test of the exogeneity of the laws.
B. The Effect of Compulsory Insurance
We begin by examining the impact of compulsory insurance laws on the proportion of
uninsured motorists and traffic fatalities. In addition to being of intrinsic interest, this will
serve as the first stage of our instrumental variables strategy, presented in the next section.
16
As indicated above, compulsory insurance was introduced by some states concurrently with
no-fault. In order to obtain an estimate of the effect of compulsory insurance, unconfounded
with the effects of no-fault, we restrict ourselves to the sample of states and years that were
not under a no-fault or add-on regime.
Table 5 presents our specifications. In addition to introducing a dummy for
compulsory insurance, we control for a range of variables including automobile registration
per capita, proportion of trucks among registered vehicles, the fraction black of the
population, violent and property crimes, unemployment, and per capita real income. In
column (1) we see that the direct effect compulsory is negative and statistically significant at
the one percent level. This confirms hypothesis H1(i). The magnitude is large as well.
Compared to a base level of 12.9 percent, compulsory insurance reduces uninsured motorists
by 2.4 percentage points.
The result in column (1) is important for two reasons. First, it establishes that
compulsory insurance achieved at least part of its mandate of reducing uninsured motorists.
Second, the size and significance of the effect will be helpful when using compulsory
insurance as an instrument for uninsured motorists.
In columns (2) and (3), we examine the robustness of this result. In column (2) we
estimate the effect of compulsory insurance within a four-year window of the passage of
compulsory insurance laws. Though this more than halves the number of observations, using
a narrower window reduces the effect that state-specific time trends might have on the
estimates. We note that the effect remains similar in sign, magnitude, and significance. In
column (3), we reestimate column (1) using log uninsured as the dependent variable. We
find that compulsory insurance remains negative and significant at the 1 percent level and
that the magnitude of the effect is very similar: the coefficient of –0.024 in column (1)
corresponds roughly to a 20 percent effect on uninsured, as does the effect in column (3).
In column (4) we examine the impact of two mechanisms used to enforce compulsory
insurance, namely checking insurance status at the time of an accident and requiring that
insurance is verified when the vehicle is registered. The former does not have a statistically
significant effect, but the latter is significant and negative, further reducing uninsured
motorists by 1.7 percentage points. Finally, in column (5) we confirm that our result is robust
17
to adding a wide range of additional controls (vehicle miles traveled per person, seat belt
laws, average speed of drivers, alcohol consumption per capita, and car registration per
person).
In columns (6) to (10) we see that the effect of compulsory insurance on fatalities per
person is somewhat equivocal. In column (6), the direct effect is negative, though not
statistically significant. When we estimate the effect within a four-year window of the
adoption of compulsory insurance, shown in column (7), we find a positive (and
insignificant) effect. In column (8) we use fatalities per vehicle mile traveled at the outcome,
and also find an insignificant positive effect. In column (9), we see that when we include
enforcement mechanisms for compulsory insurance (checking insurance status at the time of
an accident, verifying insurance status at the time of registration) the direct effect is positive
and significant, but the enforcement mechanisms have a negative (and significant) effect on
fatalities. Finally, in column (10) we confirm that the effect of no-fault remains significant
when we include additional control variables.
The fact that the effect on fatalities is not overwhelming is not surprising in light of
the discussion in Section III.A (hypothesis H1, ii and iii). Whereas individuals who switch
from being uninsured to insured might drive less carefully, thereby increasing fatalities, we
would expect the opposite effect for those individuals who remain uninsured.
C. The Effect of No-Fault Regulation
As discussed in the introduction, the literature has established that no-fault laws increased
traffic fatalities in conjunction with compulsory insurance. The literature has been confined
to examining this joint effect because it has examined no-fault regulation in isolation from
compulsory insurance. In this section, we identify the effect of no-fault, as distinct from
compulsory insurance, by confining ourselves to the states and years that had either
compulsory insurance or no-fault. Hence, the effect of no-fault is relative to the starting point
of compulsory insurance.34
34 Note, however, that the form of compulsory insurance under tort and no-fault systems differs. Under tort, compulsory insurance consists of third-party coverage. Under no-fault, compulsory insurance consists of first-party coverage. We examine the sensitivity of our results to this difference as follows: we compare the effect of
18
In Table 6, columns (1) to (5), we examine the effect on uninsured motorists. In
column (1), we see that no-fault increases uninsured motorists: the effect is both large (3.1
percentage points) and significant (at the one percent level). In column (2) we reestimate the
same specification in a four-year window of the passage of no-fault legislation. The effect is
somewhat larger in magnitude, and still statistically significant. In column (3), we run the log
specification and obtain similar results: the effect is significant at a 1 percent level and
corresponds to a magnitude of roughly 3 percent.35
In column (4) we examine the effect of the thresholds above which accident victims
can resort to tort claims. A no-fault system with a low threshold essentially should operate
like a tort system, since most claims exceed the threshold beyond which tort action is
permitted.36 A threshold of zero corresponds to an add-on system where victims have a
choice of whether to resort to no-fault or tort. The lowest threshold among pure no-fault
states is $200. As the threshold increases, the no-fault system becomes more stringent. We
incorporate this information into the categorical variable “level” which takes the value zero
for add-on states, one for no-fault states with low thresholds (less than $200), and two for
states with high thresholds (greater than $500). If the effect of no-fault on uninsured
motorists is robustly positive, then we expect this coefficient also to be positive: as the no-
fault system becomes more stringent, uninsured motorists increase. Our results confirm this:
the effect of the level variable is positive and significant.37 Of course, because the variable is
categorical, the magnitude of the effect is difficult to interpret.38 Finally, in column (5), we
compulsory insurance under a tort system with the effect of a no-fault system with a low threshold. The latter system imposes only a negligible degree of tort limitation, and thus we estimate the effect of the move from third- to first-party compulsory insurance. The effect is very small in magnitude, and not statistically significant. This suggests that our results are robust to this concern. 35 If we were to examine the effect of no-fault on uninsured in the full state-year sample the effect would be positive, but smaller in magnitude and not significant. This is because in the full sample the effects of no-fault and compulsory insurance are confounded (by the fact that they were typically introduced at the same time). 36 A result which is established theoretically in Yu-Ping Liao & Michelle White, No-Fault for Motor Vechicles: An Economic Analysis, (Working paper No. 99-016, Univ. Michigan, Dep’t Economics 1999). 37 John Rolph, James Hammitt, & Robert Houchens, Automobile Accident Compensation: How Pays How Much How Soon?, 52 J. Risk & Ins. 667 (1985) using a micro-level cross-section of insurance claims in 1977, show that that a positive threshold leads to a reduction in bodily injury insurance claims. Our result differs because it allows for state and year fixed effects, covers a much longer time horizon, and examines the impact of the threshold on fatalities. 38 An additional check would be to exclude low-threshold states from the no-fault group. Our results are robust to this specification.
19
confirm that our results are unchanged in sign, magnitude, and significance by including
additional control variables.
In columns (6) to (10) we examine the effect of no-fault on fatalities. In column (6)
we see that the direct effect is positive and significant. Thus, from hypothesis H2, the effect
of reduced liability dominates the effect of reduced insurance. The magnitude of the effect is
on the order of 10 percent. This corresponds to 5,160 to 6,450 lives in the United States
depending on the year.39 In column (7) we reestimate the effect in a four-year window of the
passage of no-fault legislation. Since the sample size is greatly reduced, it is not surprising
that the effect is no longer statistically significant. However, the sign of the effect remains
positive, although the magnitude is smaller. In column (8) we estimate the effect on fatalities
per vehicle mile traveled, and find a positive and significant effect. The magnitude of this
effect is on the order of 7 percent of fatalities per vehicle mile. In column (9) we observe that
the threshold effect for fatalities is also positive and statistically significant. In column (10)
we demonstrate the robustness of our estimate to additional controls. Overall, these results
provide strong evidence of the incentive effects of no-fault regulation. In Section III.C, we
observed that, though drivers who are uninsured might in principle drive more carefully
under no-fault, insured drivers experience a reduction in their exposure to liability and would
accordingly drive less carefully. Given the relative proportions of these two groups, it is
natural that the latter effect dominates for fatalities.40
While the effect of no-fault on traffic fatalities is important, we wish to stress again
that it is not the sole consideration in assessing such a system. Such a system has benefits in
terms of reducing administrative costs, and these benefits might make it worthwhile even if it
increases traffic fatalities. Whether this would be the case, of course, would depend on the
magnitude of the effect, if any, on traffic fatalities.
39 This is at the upper end of the range of estimates produced by Cummins, Phillips, and Weiss, supra note 12. One reason why our estimates are larger is that we are identifying the separate effects of no-fault and compulsory insurance, whereas Cummins, Phillips, and Weiss, supra note 12, estimate the joint effect of these laws. 40 In the full sample, the effect of no-fault on fatalities is smaller, though still statistically significant.
20
D. Exogeneity Revisited
In Table 7 we present another set of tests of the exogeneity of compulsory insurance and no-
fault laws. We examine whether leads and lags of the laws are able to predict the level of
uninsured motorists and fatalities. Since the specifications also include the contemporaneous
laws, the lead (lag) effect of the laws is identified from the period prior to their adoption
(after their repeal). If selection into compulsory insurance and no-fault were due to a feature
of the state for which we do not control (e.g., a shock just prior to the passage of the law),
then the laws should be significant predictors of uninsured or fatalities even when they were
not in effect. In columns (1) and (2), for uninsured motorists, we note that neither the lead
nor lag effects of compulsory insurance are significant, and that compulsory insurance itself
continues to enter with a negative and significant sign. For fatalities per person, the direct
effect of compulsory was not significant in Table 5. In Table 7, columns (3) and (4), this
remains true even after leads and lags of the law are introduced, and is also true of the leads
and lags themselves. In columns (5) to (8) we examine the effect of leads and lags of no-fault
laws. For both uninsured motorists and fatalities, the direct effect remains positive and
statistically significant. Neither the lead nor the lag of no-fault is a significant predictor of
uninsured or fatalities. Overall, Table 7 reconfirms our results in Table 4, suggesting that the
compulsory insurance and no-fault laws are plausibly exogenous with respect to our
outcomes of interest.
E. The Effect of Uninsured Motorists
In Table 8 we estimate the effect of uninsured motorists on fatalities using the compulsory
sample (see Section III.A and Table 2).41 Table 8, column (1), presents an OLS regression
of the effect of the ratio of uninsured motorists on fatalities per person. The coefficient is
positive, but not statistically significant. However, as discussed above, this estimate
41 The reason why we estimate the effect of uninsured on fatalities for the compulsory sample is that our instrumental variables strategy is valid only for this sample. For compulsory insurance we have a clear case that any indirect effect of compulsory on fatalities will bias our results toward zero. Instead, in the full sample we have to contend with the direct and indirect effects of no-fault regulation (since these cannot be distinguished from the effect of compulsory insurance, in the full sample). In particular, though the effect of no-fault regulation through uninsured may lead to a decrease in fatalities, the direct effect of no-fault leads to an increase in fatalities, as we show in Section V.C.
21
potentially suffers from simultaneity bias. In subsequent columns, we address this issue by
using an instrumental variables strategy.
Column (2) presents the estimated effect of uninsured on fatalities using compulsory
insurance as an instrumental variable. We see that effect is negative, and significant at the 10
percent level. This confirms hypothesis H3. The magnitude of the effect is such that a 0.01
increase in the ratio of uninsured motorists leads to a 2 percent decrease in fatalities per year
(16 fatalities relative to a per state and year average on the order of 1000). A one standard
deviation variation in uninsured would lead to a 10 percent decrease in fatalities.
In columns (3) to (7) we examine the sensitivity of our results. When we estimate the
effect in a four-year window of the passage of compulsory insurance regulations, column (3),
we still obtain a negative estimate. The fact that the coefficient is no longer significant is not
surprising given that we lose two thirds of our observations, and of course still allow for state
and year fixed effects. In column (4) we examine the effect for fatalities per vehicle mile
traveled, and in column (5) we use log uninsured as the dependent variable. In both cases, the
effect has the same sign, and remains statistically significant. The magnitude of the effects is
also similar.
In column (6) we examine the robustness of the result to controlling for vehicle miles
traveled per person (rather than including it as the denominator of dependent variable as in
column (5)). The coefficient on uninsured motorists remains statistically significant, and the
magnitude of the effect increases (a one standard deviation increase in uninsured motorists
leads to an 11 percent decrease in fatalities). Our results are also robust to controlling for a
range of additional variables, including automobile registration per person, average speed,
alcohol consumption per capita, and seatbelt laws (column (7)).
Because instrumental variables identify the effect of the dependent variable on the
outcome for those induced to switch as a result of the instrument,42 in Table 8 we are
estimating the effect on those individuals induced to switch insurance status as a result of
42 See note 23 supra.
22
compulsory insurance. Thus our results confirm the moral hazard story for this group.43 The
alternative explanation – a reduction of fatalities due to selection among drivers – is ruled out
as long as the instrument is valid. Of course, the additional controls in columns (6) and (7)
give added confidence in the validity of the instrument, since they rule out some possible
sources of omitted variable bias (that could invalidate the instrument).
It is important to stress that the purchase of insurance by motorists has effects other
than on fatalities, and these effects are clearly beneficial. Such insurance reduces the risk-
bearing costs of drivers and leads to compensation of some victims who otherwise would
receive less or no compensation. So, although interesting and important for its own sake, the
moral hazard costs of insurance are just one element in an overall evaluation of the incidence
of uninsured motorists.
VI. Conclusion
This paper has investigated the effect of compulsory insurance regulation and no-fault
limitations on the incidence of uninsured motorists and on traffic fatalities. Also, using
compulsory insurance laws as an instrumental variable, we have investigated the effect of
insurance on traffic fatalities.
The evidence indicates that compulsory insurance rules do deliver their intended
effect, which is a significant reduction in the incidence of uninsured motorists. The evidence
also indicates that increasing the incidence of insurance produces an increase in fatalities.
The magnitude of this moral hazard effect is potentially large: a two percent increase in
fatalities for each percentage point decrease in uninsured motorists. While the switch by
some motorists to become insured increases fatalities, this is at least partly offset by the
effect of compulsory insurance on those drivers who chose to remain uninsured. These
individuals drive more carefully, which works to reduce fatalities. Finally, we have been able
to isolate the effect of the reductions in liability brought about by moves to a no-fault system.
Such reductions in liability produce a significant increase in fatalities. Our analysis indicates
that drivers’ behavior, like the behavior of economic agents in other contexts, is influenced
43 As noted in Imbens and Angrist, supra note 23, even though the IV estimator identifies the effect of the endogenous variable on the outcome for those induced to switch by the instrument, we cannot specifically identify
23
by financial incentives. Reductions in the expected financial costs of accidents, produced by
reductions in liability or by the purchase of liability insurance, lead to more traffic
fatalities.44
It is interesting to note that the presence of uninsured motorists is generally regarded
as a severe problem.45 Assuming that it is undesirable to have uninsured motorists,
researchers examining this subject have focused on ways to reduce the incidence of such
motorists. We do not doubt that a reduction in the incidence of uninsured motorists will
produce some benefits by increasing the extent to which accident victims are compensated.
Indeed work by Grabowski, Viscusi, and Evans46 documents an increase in loss payments
and a reduction in legal and administrative expenses under no-fault regimes. However, our
analysis indicates that such reductions are not an unmitigated good. Automobile insurance
also has a costly side, reducing precautions and increasing fatalities.47 Indeed, our work
indicates that reducing the incidence of uninsured motorists might not make potential victims
better off. To be sure, when some uninsured motorists switch to purchasing insurance,
victims of accidents caused by these motorists might receive more compensation. However,
potential victims also would face a higher incidence of such accidents. And, as long as
victims cannot generally expect to be fully compensated for such accidents (which they
cannot, as insurance levels are often insufficient to cover damages fully), increasing the
number of accidents would be costly to potential victims. Whether or not potential victims
would benefit from reducing the incidence of uninsured motorists thus would depend on
which of these two effects is stronger, an issue which the present analysis cannot resolve.
which individuals these are in our data. 44 Our results in this paper contrast with those of Cohen and Einav, supra note 14. The latter study finds that mandatory seat belt laws are not associated with the moral hazard cost of increased fatalities. Whether this contrast in findings is due to differences in the type of payoff affected, or other institutional features of the laws, is an open question. 45 See Insurance Research Council, Uninsured Motorists (1999-2000); National Association of Independent Insurers, The Ineffectiveness of Compulsory Private Passenger Automobile Liability Insurance Laws (1999); Kahzzoom, supra note 31. 46 Henry Grabowski, W. Kip Viscusi, & William Evans, Price and Availability Tradeoffs of Automobile Insurance Regulation, 56 J. Risk & Ins. 275 (1989). 47 In a full cost-benefit analysis, the value of the additional loss of life would have to be assessed. For details, see the extensive survey in W. Kip Viscusi, Fatal Tradeoffs: Public and Private Responsibilities for Risk (1992), chapter 4.
24
Our analysis also indicates that, whatever the benefits of moving to no-fault liability,
such benefits involve a significant moral hazard cost. In particular, the evidence suggests that
such moves increase fatalities, and that this increase is larger than has been previously
recognized.
Of course, our evidence does not enable us to reach an overall assessment of the rules
governing accident liability and accident insurance. By focusing on traffic fatalities alone, we
ignore, among other things, the effect of such rules on risk-bearing costs or on administrative
costs. However, our analysis does highlight some of the unintended consequences of the
rules governing automobile insurance and liability. By identifying and estimating the moral
hazard costs of automobile insurance and no-fault arrangements, our analysis highlights
important effects that should be taken into account in an overall assessment of these policies.
25
References
American Insurance Association, Summary of Selected State Laws and Regulations Relating to Automobile Insurance. New York: American Insurance Association, 1970-2001.
Angrist, Joshua; Imbens, Guido; and Rubin, Donald. “Identification of Causal Effects Using
Instrumental Variables.” Journal of the American Statistical Association 91 (1994): 444-72.
Cohen, Alma; and Einav, Liran. “The Effect of Mandatory Seat Belt Laws on Driving
Behavior and Traffic Fatalities.” Harvard Law School Olin Paper No. 341 (2001), forthcoming Review of Economics and Statistics.
Cole, Cassandra R.; Dumm, Randy E.; and McCullough, Kathleen A. “The Uninsured
Motorist Problem: An Investigation of the Impact of Enforcement and Penalty Severity on Compliance.” Journal of Insurance Regulation 19 (2001): 613-37.
Cummins, J. David; Phillips, Richard D.; and Weiss, Mary A. “The Incentive Effects of No-
Fault Automobile Insurance.” Journal of Law and Economics, 44 (2001): 427-64. Derrig, A. Richard; Segui-Gomez, Maria; Abtahi, Ali; and Liu, Ling-Ling. “The Effect of
Population Safety Belt Usage Rates on Motor Vehicle-Related Fatalities.” Accidents Analysis and Prevention 34 (2002): 101-10.
Devlin, Rose Anne. “Liability versus No-Fault Automobile Insurance Regimes: An Analysis
of the Experience of Quebec.” In Contributions to Insurance Economics, edited by George Dionne, pp. 499-520. London: Kluwer Academic, 1992.
Edlin, Aaron. “Per-Mile Premiums for Auto Insurance.” National Bureau of Economic
Research Working Paper No. 6934 (1999). Edlin, Aaron; and Mandic, Pinar Karaca. “The Accident Externality from Driving.”
Unpublished manuscript. 1999. Grabowski, Henry; Viscusi, W. Kip; and Evans, William. “Price and Availability Tradeoffs
of Automobile Insurance Regulation.” The Journal of Risk and Insurance 56 (1989): 275-99.
Huberman, Gur; Mayers, David; and Smith, Clifford W. “Optimal Insurance Policy
Indemnity Schedules.” The Bell Journal of Economics 14 (1983): 415-26. Imbens, Guido; and Angrist, Joshua. “Identification and Estimation of Local Average
Treatment Effects.” Econometrica 62 (1992): 467-75.
26
Insurance Research Council. Uninsured Motorists. Malvern, PA: Insurance Research Council, 1999-2000.
Kahzzoom, J. Daniel. “What We Know about Uninsured Motorists and How Well We Know
What We Know.” Journal of Insurance Regulation 17 (2000a): 59-93. Keeton, Robert; and O’Connell, Jeffrey. Basic Protection for the Traffic Victim. Boston:
Little Brown, 1965. Keeton, R. William; and Kwerel, Evan. “Externalities in Automobile Insurance and the
Underinsured Driver Problem.” Journal of Law and Economics 27 (1984): 149-79. Kochanowski, S. Paul; and Young, Madelyn V. “Deterrent Aspects of No-Fault Automobile
Insurance: Some Empirical Findings.” Journal of Risk and Insurance 52 (1985): 269-88. Landes, M. Elisabeth. “Insurance Liability and Accidents: A Theoretical and Empirical
Investigation of the Effect of No-Fault Accidents.” Journal of Law and Economics 25 (1982): 49-65.
Liao, Yu-Ping; and White, Michelle. “No-Fault for Motor Vehicles: An Economic Analysis.”
Department of Economics, University of Michigan, Working Paper No. 99-016 (1999). Levitt, Steven D.; and Porter, Jack. “How Dangerous are Drinking Drivers?” Journal of
Political Economy 109 (2001): 1198-1237. Levitt, Steven D.; and Porter, Jack. “Sample Selection in the estimation of Air Bag and Seat
Belt Effectiveness.” National Bureau of Economic Research Working Paper No. 7210 (1999).
Ma, Yu-Luen; and Schmidt, Joan T. “Factors Affecting the Relative Incidence of Uninsured
Motorists Claims.” Journal of Risk and Insurance 67 (2000): 81-294. McEwin, R. Ian. “No-Fault and Road Accidents: Some Australasian Evidence.”
International Review of Law and Economics 9 (1989): 13-24. Medoff, H. Marshall; and Magaddino, Joseph P. “An Empirical Analysis of No-Fault
Insurance.” Evaluation Review 6 (1982): 373-92. National Association of Independent Insurers. The Ineffectiveness of Compulsory Private
Passenger Automobile Liability Insurance Laws (1999). Pauly, Mark. “The Economics of Moral Hazard: Comment.” American Economic Review 58
(1968): 531-36.
27
Peltzman, Sam. “The Effects of Automobile Safety Regulation.” Journal of Political Economy 83 (1975a): 667-725.
Peltzman, Sam. Regulation of Automobile Safety. Washington, DC: American Enterprise
Institute, 1975b. Rolph, John; Hammitt, James; and Houchens, Robert. “Automobile Accident Compensation:
How Pays How Much How Soon?” Journal of Risk and Insurance 52 (1985): 667-85. Sherman, P.T. “Compulsory Insurance of Compensation for Injuries by Automobile
Accidents.” Pamphlets on Insurance 4 (1926). Shavell, Steven. “On Moral Hazard and Insurance.” Quarterly Journal of Economics 93
(1979): 541-62. Shavell, Steven. “On Liability and Insurance.” Bell Journal of Economics 13 (1982): 120-32. Shavell, Steven. Economic Analysis of Accident Law. Cambridge: Harvard University Press,
1987. Shavell, Steven. “On the Social Function and Regulation of Liability Insurance.” Geneva
Papers on Risk and Insurance 25 (2000): 166-79. Sloan, A. Frank; Reilly, Bridget A.; and Schenzler, Christoph M. “Tort Liability versus
Other Approaches for Deterring Careless Driving.” International Review of Law and Economics 14 (1994): 53-72.
Stone, Edward. “Compulsory Automobile Liability Insurance.” Pamphlets on Insurance 4
(1926). Spence, A. Michael; and Zeckhauser, Richard. “Insurance, Information and Individual
Action.” American Economic Review 61 (1971): 380-87. Viscusi, W. Kip. Fatal Tradeoffs: Public and Private Responsibilities for Risk. New York,
NY: Oxford University Press, 1992. White, Michelle J. “An Empirical Test of the Comparative and Contributory Negligence
Rules in Accident Law.” RAND Journal of Economics 20 (1989): 308-30. Winter, A. Ralph. “Moral Hazard.” In Handbook of Insurance, edited by G. Dionne. Boston,
Kluwer Academic, 2000. Zador Paul; and Lund, Adrian. “Re-Analysis of the Effects of No-Fault Auto Insurance on
Fatal Crashes.” Journal of Risk and Insurance 53 (1986): 226-41.
28
Data Appendix Variable Description / Source Traffic fatalities Total of people being killed in a car accident. Years available: 1970-
1975. Source: Highway Statistics; 1975-1998. Source: the FARS. Income per
capita Income per capita. Years available: 1976-1998. Source: 1976-1984, Bureau of Economic Analysis. 1983-1998, U.S. Census.
New cars Number of new cars registered. Years available: 1975-1998. Source: Ward’s Automotive Yearbook.
New cars per registered
[New cars]/[registered]
Population Total population. Years available: 1970-1998. Source: Bureau of Justice Statistics.
% Black Percentage Black of population. Extrapolated between non-census years. Source: Statistical Abstract of the United States.
% Hispanic Percentage Hispanic of population. Extrapolated between non-census years. Source: Statistical Abstract of the United States.
% Population age 5-17
The percentage of people in the population at the age 5 to 17. Years available 1970-1998. Source: the U.S. Census.
% Population age 18-24
The percentage of people in the population at the age 18 to 24. Years available 1970-1998. Source: the U.S. Census.
% Population age 25-44
The percentage of people in the population at the age 25 to 44. Years available 1970-1998. Source: the U.S. Census.
% Population age 45-64
The percentage of people in the population at the age 45 to 64. Years available 1970-1998. Source: the U.S. Census.
Property crimes Number of property crimes. Years available: 1970-1998. Source: Bureau of Justice Statistics.
Property crimes per capita
Total property crime per capita. Years available: 1970-1998. Source: Bureau of Justice Statistics.
Car registered Number of cars registered. Years available: 1976-1998. Source: Ward’s Automotive Yearbook.
Trucks registered Number of trucks registered. Years available: 1975-1998. Source: Ward’s Automotive Yearbook.
Trucks, % of total registered
[Truck]/([Truck]+[Car Registered]
Average speed Years available: 1975-1995 Source: Highway Statistics. Unemployment
rate Unemployment rate. Years available: 1970-1998. Source: Bureau of Labor Statistics.
Uninsured motorists
Number of claims when an insured motorist is injured by a motorist who does not have liability insurance or by hit and run motorist. Years available: 1976-1997 (missing 1987 and 1988). Source: the Insurance Research Council
Violent crime Number of violent crimes. Years available: 1970-1998. Source: Bureau of Justice Statistics.
Violent crime per capita
Total violent crime per capita. Years available: 1970-1998. Source: Bureau of Justice Statistics.
Vehicle miles traveled, total
Vehicle miles traveled for roads. Years available: 1970-1998. Source: Highway Statistics.

29
TABLE 1: Automobile Liability Insurance Law, 1969-1998 State Compulsory Insurance No-fault Insurance Add-on Provision Alabama Alaska 1986- (except for year 1989) Arizona 1983- (except for years 1990-1995) Arkansas 1988- 1974- California 1975- (except for years 1990-1995) Colorado 1974- 1974- Connecticut 1973- 1973- Delaware 1972- 1972- District of Colombia 1984- 1984-1986 1987- Florida 1972-1977 1972- Georgia 1975- 1975-1991 Hawaii 1974- 1974- (except for year 1998) Idaho 1976- Illinois 1989- Indiana 1983- Iowa 1998- Kansas 1974- 1974- Kentucky 1975- 1975- Louisiana 1979- Maine 1988- Maryland 1973- 1973- Massachusetts Before 1969- 1971- Michigan 1973- 1973- Minnesota 1975- 1975- Mississippi Missouri 1987- Montana 1981- Nebraska 1986- Nevada 1974- 1974-1979 New Hampshire 1971- New Jersey 1973 - 1973- New Mexico 1984 - New York Before 1969- 1974- North Carolina Before 1969- North Dakota 1976 - 1976- Ohio 1984 - Oklahoma 1977- Oregon 1980- 1972- Pennsylvania 1975- 1976-1983; 1990 - 1984-1989 Rhode Island 1992- South Carolina 1974- 1974- (except for year 1990) South Dakota 1987- 1972- Tennessee Texas 1984- 1973- Utah 1974- (except for years 1990-1994) 1974 - Vermont 1986; 1988-1989; 1992- Virginia 1984- 1972- Washington 1991- 1978- West Virginia 1986- Wisconsin 1972- Wyoming 1980- Number of states 46 states 17 states 13 states
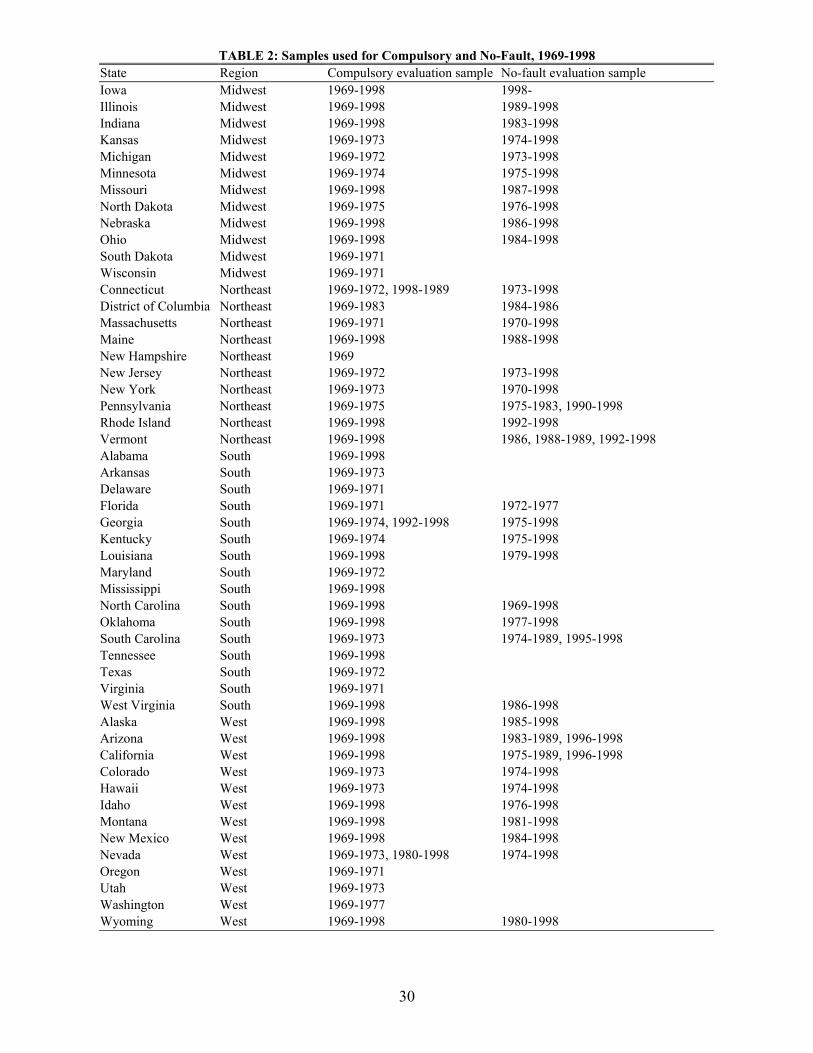
30
TABLE 2: Samples used for Compulsory and No-Fault, 1969-1998 State Region Compulsory evaluation sample No-fault evaluation sample Iowa Midwest 1969-1998 1998- Illinois Midwest 1969-1998 1989-1998 Indiana Midwest 1969-1998 1983-1998 Kansas Midwest 1969-1973 1974-1998 Michigan Midwest 1969-1972 1973-1998 Minnesota Midwest 1969-1974 1975-1998 Missouri Midwest 1969-1998 1987-1998 North Dakota Midwest 1969-1975 1976-1998 Nebraska Midwest 1969-1998 1986-1998 Ohio Midwest 1969-1998 1984-1998 South Dakota Midwest 1969-1971 Wisconsin Midwest 1969-1971 Connecticut Northeast 1969-1972, 1998-1989 1973-1998 District of Columbia Northeast 1969-1983 1984-1986 Massachusetts Northeast 1969-1971 1970-1998 Maine Northeast 1969-1998 1988-1998 New Hampshire Northeast 1969 New Jersey Northeast 1969-1972 1973-1998 New York Northeast 1969-1973 1970-1998 Pennsylvania Northeast 1969-1975 1975-1983, 1990-1998 Rhode Island Northeast 1969-1998 1992-1998 Vermont Northeast 1969-1998 1986, 1988-1989, 1992-1998 Alabama South 1969-1998 Arkansas South 1969-1973 Delaware South 1969-1971 Florida South 1969-1971 1972-1977 Georgia South 1969-1974, 1992-1998 1975-1998 Kentucky South 1969-1974 1975-1998 Louisiana South 1969-1998 1979-1998 Maryland South 1969-1972 Mississippi South 1969-1998 North Carolina South 1969-1998 1969-1998 Oklahoma South 1969-1998 1977-1998 South Carolina South 1969-1973 1974-1989, 1995-1998 Tennessee South 1969-1998 Texas South 1969-1972 Virginia South 1969-1971 West Virginia South 1969-1998 1986-1998 Alaska West 1969-1998 1985-1998 Arizona West 1969-1998 1983-1989, 1996-1998 California West 1969-1998 1975-1989, 1996-1998 Colorado West 1969-1973 1974-1998 Hawaii West 1969-1973 1974-1998 Idaho West 1969-1998 1976-1998 Montana West 1969-1998 1981-1998 New Mexico West 1969-1998 1984-1998 Nevada West 1969-1973, 1980-1998 1974-1998 Oregon West 1969-1971 Utah West 1969-1973 Washington West 1969-1977 Wyoming West 1969-1998 1980-1998
31
TABLE 3: Descriptive Statistics Accident Liability Regulations Auto Insurance Regulations
Full Sample
No-Fault
States
Non No-Fault
States
Compulsory
Insurance States
Non Compulsory
Insurance States
Mean speed
56.031 (2.462)
56.090 (2.592)
56.005 (2.407)
56.029 (2.732)
56.033 (1.939)
Variance of speed
6.628 (2.373)
6.337 (1.422)
6.751 (2.669)
6.689 (1.923)
6.526 (2.975)
Seatbelt rate
0.348 (0.247)
0.331 (0.250)
0.355 (0.246)
0.401 (0.244)
0.242 (0.219)
% Drunk drivers
0.250 (0.097)
0.248 (0.082)
0.259 (0.090)
0.257 (0.081)
0.252 (0.101)
Cars registered per population
0.525 (0.079)
0.544 (0.079)
0.519 (0.078)
0.520 (0.076)
0.537 (0.084)
% New cars registered
0.069 (0.020)
0.073 (0.019)
0.067 (0.020)
0.067 (0.020)
0.072 (0.020)
% Trucks of total registered
0.283 (0.112)
0.246 (0.116)
0.303 (0.106)
0.298 (0.121)
0.262 (0.085)
% Black
0.106 (0.122)
0.087 (0.086)
0.114 (0.132)
0.105 (0.116)
0.109 (0.132)
% Hispanic
0.049 (0.072)
0.052 (0.042)
0.050 (0.082)
0.055 (0.072)
0.041 (0.073)
Population in millions
4.73 (5.15)
5.85 (4.78)
4.32 (5.27)
4.94 (5.33)
4.39 (4.84)
Violent crime per capita
0.005 (0.003)
0.005 (0.003)
0.005 (0.004)
0.005 (0.003)
0.004 (0.003)
Property crime per capita
0.045 (0.012)
0.047 (0.013)
0.044 (0.012)
0.046 (0.012)
0.043 (0.013)
Vehicle miles traveled
39025 (41837)
44648 (33047)
37505 (45308)
41120 (42982)
36113 (40572)
Unemployment rate 6.258
(2.152) 5.875
(1.979) 6.313
(2.170) 5.964
(1.976) 6.675
(2.350) Per capita income
15617 (6170)
16442 (6826)
15285 (5856)
17048 (6143)
12742 (5140)
% Population age 5-17
0.199 (0.023)
0.195 (0.025)
0.199 (0.021)
0.195 (0.021)
0.203 (0.023)
% Population age 18-24
0.115 (0.017)
0.115 (0.018)
0.115 (0.017)
0.111 (0.017)
0.122 (0.016)
% Population age 25-44
0.299 (0.029)
0.300 (0.027)
0.301 (0.028)
0.306 (0.025)
0.290 (0.030)
% Population age 45-64
0.193 (0.017)
0.193 (0.019)
0.193 (0.016)
0.194 (0.017)
0.190 (0.015)
Ratio uninsured 0.129 (0.070)
0.120 (0.069)
0.132 (0.070)
0.122 (0.062)
0.140 (0.081)
Fatalities per 10000 persons
2.23 (0. 91)
1.78 (0. 67)
2.38 (0. 93)
1.98 (0. 76)
2.54 (0. 99)
Fatalities per vehicle mile
0.023 (0.007)
0.021 (0.006)
0.024 (0.008)
0.022 (0.007)
0.026 (0.008)
Minimum obs. 889 265 623 554 334 Maximum obs. 1327 364 912 874 402
Notes: Standard deviations are in parentheses.

32
TABLE 4: Are the Laws Predictable?
(1) (2) (3) (4) (5) (6) Dependent variable: Compulsory
insurance Compulsory
insurance Compulsory
insurance No fault
insurance No fault
insurance No fault
insurance Ratio uninsured, deviation -0.666 -0.460 0.334 0.382 from state mean, 1st lag (0.449) (0.458) (0.341) (0.363)
Fatalities p. person, dev. -3.694 -2.862 0.213 1.124 from state mean, 1st lag (2.293) (2.345) (2.386) (2.470) Ratio uninsured, deviation -0.240 0.134 from state mean, 1st lag (0.424) (0.396) Fatalities p. person, dev. -1.620 -1.257 from state mean, 2nd lag (2.265) (2.424) Percent unemployed -0.022** -0.014 -0.013 -0.006 -0.012 -0.012 (0.008) (0.009) (0.009) (0.007) (0.009) (0.009) Fraction of Blacks in -0.491`` -0.637** -0.611`` -0.299 -0.512`` -0.544`` Population (0.221) (0.244) (0.255) (0.214) (0.249) (0.262) Fraction of Hispanics in -0.142 -0.129 -0.052 -1.509** -1.692** -1.676** Population (0.276) (0.301) (0.314) (0.360) (0.398) (0.415) Population in millions -0.001 -0.004 -0.005 0.02** 0.02** 0.02** (0.003) (0.004) (0.004) (0.003) (0.004) (0.004) Violent crimes per 24.029`` 31.118`` 29.751`` -34.029** -32.025** -30.452`` Thousand (11.443) (12.338) (12.869) (10.500) (11.523) (12.042) Property crimes per 1.945 0.326 0.017 9.742** 9.013** 8.324** Thousand (1.849) (2.061) (2.163) (1.761) (1.960) (2.054) Real per capita income -0.002 0.007 0.013 0.083** 0.089** 0.093** (0.011) (0.012) (0.013) (0.009) (0.011) (0.011) % population between 4.661** 5.216** 5.863** -4.146** -4.018** -4.039** ages 5 and 17 (1.046) (1.268) (1.403) (0.955) (1.131) (1.251) % population between -3.852** -2.562+ -2.131 1.130 1.424 1.976 ages 18 and 24 (1.148) (1.528) (1.743) (1.070) (1.465) (1.710) % population between 6.299** 5.740** 5.528** -6.854** -7.054** -7.150** ages 25 and 44 (1.107) (1.185) (1.229) (1.002) (1.087) (1.134) % population between 7.243** 7.370** 7.295** -5.918** -6.266** -6.630** ages 45 and 64 (1.483) (1.610) (1.685) (1.346) (1.455) (1.528) Predictive accuracy 0.68 0.71 0.71 0.77 0.78 0.78 Observations 1221 910 808 1221 910 808
Notes: Marginal coefficients are present. Standard errors are in parentheses. +,``,** =significant at 10,5, and 1 percent respectively.

33
TABLE 5: The Effect of Compulsory Insurance (1) (2) (3) (4) (5) (6) (7) (8) (9) (10) Dependent variable: Ratio
uninsured Ratio uninsured
in 4-year window of
passage of law
log(ratio uninsured)
Ratio uninsured
Ratio uninsured
Fatalities per 10000 persons
Fatalities per 10000 persons
in 4-year window of
passage of law
Fatalities per vehicle mile
Fatalities per 10000 persons
Fatalities per 10000 persons
Compulsory insurance
-0.024** (0.004)
-0.031** (0.006)
-0.20** (0.032)
-0.025** (0.004)
-0.026** (0.004)
-0.0134 (0.0475)
0.0242 (0.0644)
1.51e-04 (5.95e-04)
8.65e-06+ (5.05e-06)
0.0152 (0.0486)
Require proof of insurance if accident
0.002 (0.003)
-0.118** (0.0401)
Verify insurance at vehicle registration
-0.017** (0.004)
-0.149** (0.0460)
Car registration per person
0.057 (0.040)
0.12+ (0.069)
0.73** (0.30)
0.049 (0.039)
0.037 (0.046)
2.18** (0.355)
0.363 (0.789)
0.016** (0.004)
2.60** (0.470)
2.18** (0.365)
Proportion of trucks
-0.004 (0.077)
0.22 (0.14)
1.17`` (0.59)
-0.005 (0.076)
-0.010 (0.079)
2.26** (0.576)
-0.0196 (1.48)
0.011 (0.007)
1.06 (0.920)
2.05** (0.769)
Fraction of blacks in population
-0.34 (0.24)
0.56 (0.43)
-5.79** (1.82)
-0.39+ (0.23)
-0.33 (0.25)
5.14** (1.51)
4.20 (4.91)
0.038`` (0.019)
3.35 (2.85)
4.78** (1.77)
Violent crime per thousand
1.71 (2.06)
-9.30`` (4.21)
-14.9 (15.7)
2.63 (2.05)
2.08 (2.18)
-28.6 (19.7)
-23.1 (45.7)
-0.031 (0.25)
-22.9 (22.9)
-22.5 (22.5)
Property crimes per thousand
-0.20 (0.36)
0.040 (0.74)
2.78 (2.75)
-0.35 (0.36)
-0.20 (0.40)
13.7** (3.50)
16.5`` (8.37)
9.94e-04 (0.044)
19.9** (4.29)
15.3** (4.10e)
Percent unemployed
5.52e-04 (0.001)
-8.73e-04 (0.002)
-0.012 (0.009)
0.001 (0.001)
1.08e-04 (0.001)
-0.0324** (0.0116)
-0.0437`` (0.0214)
-5.14e-04** (1.46e-04)
-0.0668** (0.0134)
-0.0384** (0.0117)
Real personal income in 1984 dollars
-1.33e-10 (9.27e-11)
-7.37e-10 (6.02e-10)
-1.11e-09 (7.06e-10)
-1.43e-10 (9.10e-11)
-1.04e-10 (1.02e-10)
3.93e-09** (8.23e-10)
9.00e-09+ (4.64e-09)
3.75e-11** (1.03e-11)
4.37e-09** (1.05e-09)
4.92e-09** (9.03e-10)
% population between 18 and 24
0.30 (0.26)
2.15** (0.66)
-3.82+ (1.98)
7.19e-04 (0.26)
0.20 (0.27)
19.1** (2.86)
29.5** (7.93)
0.14** (0.036)
19.2** (3.08)
17.4** (2.86)
Vehicle miles travel per person
0.99 (2.50)
71.3** (26.8)
Seatbelt laws
-0.009
(0.012) -0.151
(0.134) Alcohol consumption per capita
9.61e-05 (1.13e-04)
1.24e-03 (1.50e-03)
New car registration per person
-0.17 (0.15)
-1.11 (0.723)
Observations 489 183 489 489 489 803 315 803 565 803 R-squared 0.35 0.28 0.36 0.38 0.35 0.88 0.88 0.88 0.86 0.76
Notes: All specifications include state and year fixed effects. Standard errors in parentheses. +, *, and ** denote statistical significance at the 10, 5, and 1 percent levels.
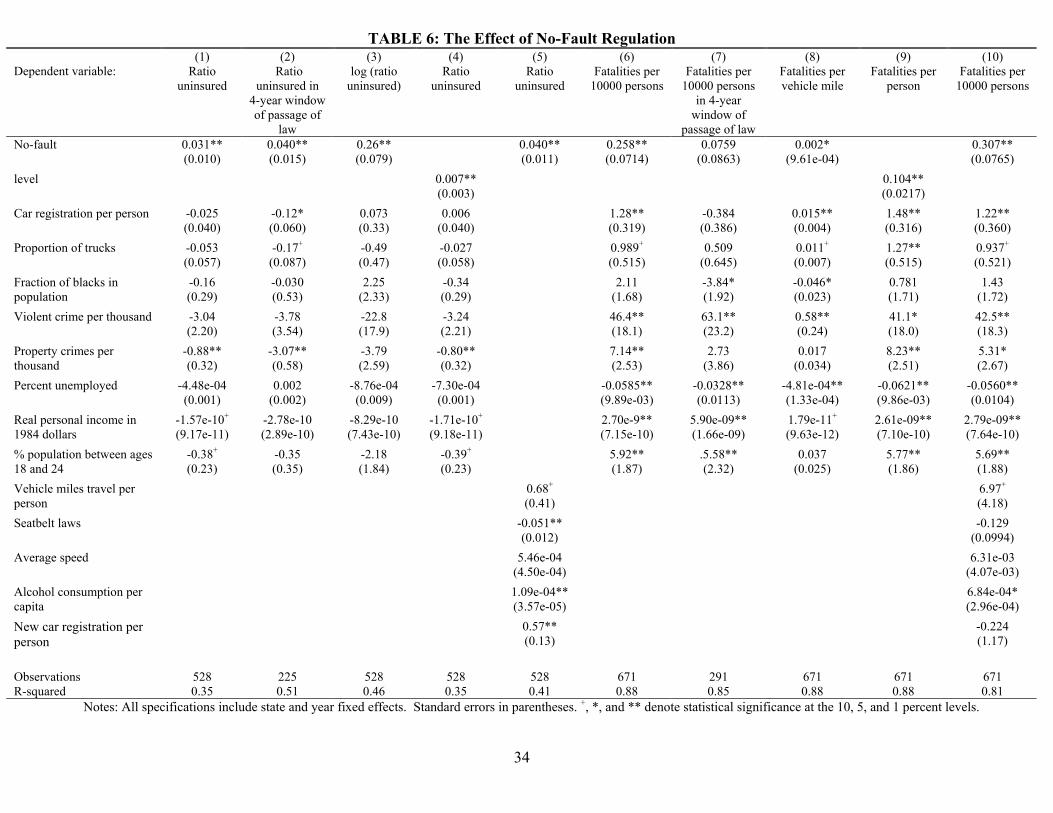
34
TABLE 6: The Effect of No-Fault Regulation (1) (2) (3) (4) (5) (6) (7) (8) (9) (10) Dependent variable: Ratio
uninsured Ratio
uninsured in 4-year window of passage of
law
log (ratio uninsured)
Ratio uninsured
Ratio uninsured
Fatalities per 10000 persons
Fatalities per 10000 persons
in 4-year window of
passage of law
Fatalities per vehicle mile
Fatalities per person
Fatalities per 10000 persons
No-fault
0.031** (0.010)
0.040** (0.015)
0.26** (0.079)
0.040** (0.011)
0.258** (0.0714)
0.0759 (0.0863)
0.002* (9.61e-04)
0.307** (0.0765)
level
0.007** (0.003)
0.104** (0.0217)
Car registration per person
-0.025 (0.040)
-0.12* (0.060)
0.073 (0.33)
0.006 (0.040)
1.28** (0.319)
-0.384 (0.386)
0.015** (0.004)
1.48** (0.316)
1.22** (0.360)
Proportion of trucks
-0.053 (0.057)
-0.17+ (0.087)
-0.49 (0.47)
-0.027 (0.058)
0.989+ (0.515)
0.509 (0.645)
0.011+ (0.007)
1.27** (0.515)
0.937+ (0.521)
Fraction of blacks in population
-0.16 (0.29)
-0.030 (0.53)
2.25 (2.33)
-0.34 (0.29)
2.11 (1.68)
-3.84* (1.92)
-0.046* (0.023)
0.781 (1.71)
1.43 (1.72)
Violent crime per thousand
-3.04 (2.20)
-3.78 (3.54)
-22.8 (17.9)
-3.24 (2.21)
46.4** (18.1)
63.1** (23.2)
0.58** (0.24)
41.1* (18.0)
42.5** (18.3)
Property crimes per thousand
-0.88** (0.32)
-3.07** (0.58)
-3.79 (2.59)
-0.80** (0.32)
7.14** (2.53)
2.73 (3.86)
0.017 (0.034)
8.23** (2.51)
5.31* (2.67)
Percent unemployed
-4.48e-04 (0.001)
0.002 (0.002)
-8.76e-04 (0.009)
-7.30e-04 (0.001)
-0.0585** (9.89e-03)
-0.0328** (0.0113)
-4.81e-04** (1.33e-04)
-0.0621** (9.86e-03)
-0.0560** (0.0104)
Real personal income in 1984 dollars
-1.57e-10+ (9.17e-11)
-2.78e-10 (2.89e-10)
-8.29e-10 (7.43e-10)
-1.71e-10+ (9.18e-11)
2.70e-9** (7.15e-10)
5.90e-09** (1.66e-09)
1.79e-11+ (9.63e-12)
2.61e-09** (7.10e-10)
2.79e-09** (7.64e-10)
% population between ages 18 and 24
-0.38+ (0.23)
-0.35 (0.35)
-2.18 (1.84)
-0.39+ (0.23)
5.92** (1.87)
.5.58** (2.32)
0.037 (0.025)
5.77** (1.86)
5.69** (1.88)
Vehicle miles travel per person
0.68+ (0.41)
6.97+ (4.18)
Seatbelt laws
-0.051** (0.012)
-0.129 (0.0994)
Average speed
5.46e-04 (4.50e-04)
6.31e-03 (4.07e-03)
Alcohol consumption per capita
1.09e-04** (3.57e-05)
6.84e-04* (2.96e-04)
New car registration per person
0.57** (0.13)
-0.224 (1.17)
Observations 528 225 528 528 528 671 291 671 671 671 R-squared 0.35 0.51 0.46 0.35 0.41 0.88 0.85 0.88 0.88 0.81
Notes: All specifications include state and year fixed effects. Standard errors in parentheses. +, *, and ** denote statistical significance at the 10, 5, and 1 percent levels.

35
TABLE 7: Lead and Lag Effects of the Laws (1) (2) (3) (4) (5) (6) (7) (8) Dependent variable: Ratio
uninsured Ratio
uninsured Fatalities per 10000 persons
Fatalities per 10000 persons
Ratio uninsured
Ratio uninsured
Fatalities per 10000 persons
Fatalities per 10000 persons
Compulsory insurance, -0.015* -0.015* -0. 07 0. 03 (0.006) (0.006) (0. 07) (0. 09) Compulsory insurance, -0.01 -0.008 0. 08 0. 08 one-year lead (0.006) (0.008) (0.06) (0. 06) Compulsory insurance, -0.006 -0. 13 one-year lag (0.006) (0. 08) No-fault 0.043** 0.050** 0. 35** 0. 24* (0.015) (0.019) (0. 10) (0. 12) No-fault, one-year lead -0.015 -0.015 -0. 13 -0. 13 (0.014) (0.014) (0. 10) (0. 10) No-fault, one-year lag -0.007 0. 13 (0.013) (0. 08) Observations 489 489 803 803 528 528 671 671 R-squared 0.36 0.36 0.88 0.88 0.35 0.35 0.88 0.88
Notes: All specifications include controls for car registration, truck registration, fraction of black population, violent crime per capita, property crime per capita, unemployment, real personal income, and state and year fixed effects. Robust standard errors in parentheses. +, *, and ** denote statistical significance at the 10, 5, and 1 percent levels.
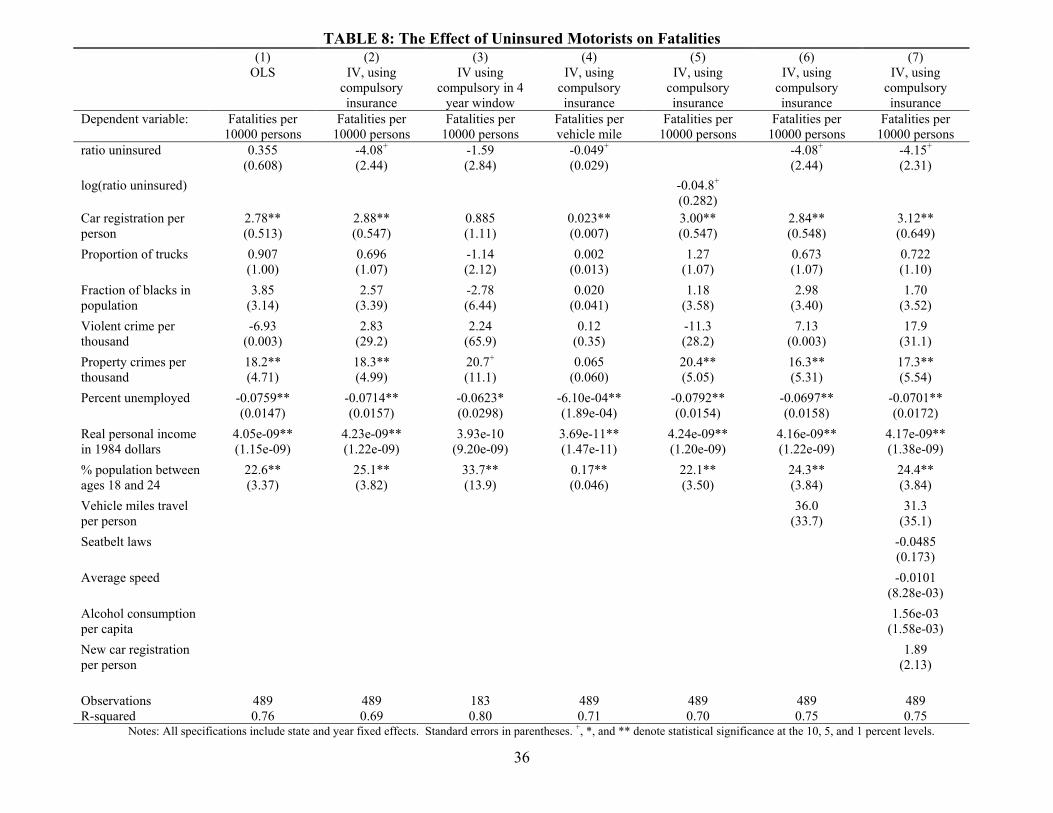
36
TABLE 8: The Effect of Uninsured Motorists on Fatalities (1) (2) (3) (4) (5) (6) (7) OLS IV, using
compulsory insurance
IV using compulsory in 4
year window
IV, using compulsory insurance
IV, using compulsory insurance
IV, using compulsory insurance
IV, using compulsory insurance
Dependent variable: Fatalities per 10000 persons
Fatalities per 10000 persons
Fatalities per 10000 persons
Fatalities per vehicle mile
Fatalities per 10000 persons
Fatalities per 10000 persons
Fatalities per 10000 persons
ratio uninsured
0.355 (0.608)
-4.08+ (2.44)
-1.59 (2.84)
-0.049+ (0.029)
-4.08+ (2.44)
-4.15+ (2.31)
log(ratio uninsured)
-0.04.8+ (0.282)
Car registration per person
2.78** (0.513)
2.88** (0.547)
0.885 (1.11)
0.023** (0.007)
3.00** (0.547)
2.84** (0.548)
3.12** (0.649)
Proportion of trucks
0.907 (1.00)
0.696 (1.07)
-1.14 (2.12)
0.002 (0.013)
1.27 (1.07)
0.673 (1.07)
0.722 (1.10)
Fraction of blacks in population
3.85 (3.14)
2.57 (3.39)
-2.78 (6.44)
0.020 (0.041)
1.18 (3.58)
2.98 (3.40)
1.70 (3.52)
Violent crime per thousand
-6.93 (0.003)
2.83 (29.2)
2.24 (65.9)
0.12 (0.35)
-11.3 (28.2)
7.13 (0.003)
17.9 (31.1)
Property crimes per thousand
18.2** (4.71)
18.3** (4.99)
20.7+ (11.1)
0.065 (0.060)
20.4** (5.05)
16.3** (5.31)
17.3** (5.54)
Percent unemployed
-0.0759** (0.0147)
-0.0714** (0.0157)
-0.0623* (0.0298)
-6.10e-04** (1.89e-04)
-0.0792** (0.0154)
-0.0697** (0.0158)
-0.0701** (0.0172)
Real personal income in 1984 dollars
4.05e-09** (1.15e-09)
4.23e-09** (1.22e-09)
3.93e-10 (9.20e-09)
3.69e-11** (1.47e-11)
4.24e-09** (1.20e-09)
4.16e-09** (1.22e-09)
4.17e-09** (1.38e-09)
% population between ages 18 and 24
22.6** (3.37)
25.1** (3.82)
33.7** (13.9)
0.17** (0.046)
22.1** (3.50)
24.3** (3.84)
24.4** (3.84)
Vehicle miles travel per person
36.0 (33.7)
31.3 (35.1)
Seatbelt laws
-0.0485 (0.173)
Average speed
-0.0101
(8.28e-03) Alcohol consumption per capita
1.56e-03 (1.58e-03)
New car registration per person
1.89 (2.13)
Observations 489 489 183 489 489 489 489 R-squared 0.76 0.69 0.80 0.71 0.70 0.75 0.75
Notes: All specifications include state and year fixed effects. Standard errors in parentheses. +, *, and ** denote statistical significance at the 10, 5, and 1 percent levels.