1062bdm03 big data mining - tamkang university
TRANSCRIPT

Big Data Mining������
1
1062DM03MI4 (M2244) (2995)
Wed, 9, 10 (16:10-18:00) (B206)
����(Association Analysis)
Min-Yuh Day��
Assistant Professor����
Dept. of Information Management, Tamkang University����������
http://mail. tku.edu.tw/myday/2018-03-21
Tamkang University
Tamkang University

1" (Week) �� (Date) �(Subject/Topics)1 2018/02/28 ��(��(����) (Peace Memorial Day) (Day off)
2 2018/03/07 �2/���.%�)(Course Orientation for Big Data Mining)
3 2018/03/14 ���AI����-#��,(Big Data, Artificial Intelligence and Deep Learning)
4 2018/03/21 30 (Association Analysis)5 2018/03/28 5-4$ (Classification and Prediction)6 2018/04/04 �&'(����)(Children's Day) (Day off)7 2018/04/11 + (Cluster Analysis)8 2018/04/18 �! -��� (SAS EM + )6
Case Study 1 (Cluster Analysis - K-Means using SAS EM)
.% * (Syllabus)
2

+� (Week) �� (Date) �� (Subject/Topics)
9 2018/04/25 �� (Midterm Project Presentation)
10 2018/05/02 ��#&+
11 2018/05/09 ���$��� (SAS EM ,*�).Case Study 2 (Association Analysis using SAS EM)
12 2018/05/16 ���$��� (SAS EM ������%�).Case Study 3 (Decision Tree, Model Evaluation using SAS EM)
13 2018/05/23 ���$��� (SAS EM )���-� "().Case Study 4 (Regression Analysis,
Artificial Neural Network using SAS EM)
14 2018/05/30 �� (Final Project Presentation)
15 2018/06/06 ��#&+
'��! (Syllabus)
3

A Taxonomy for Data Mining TasksData Mining
Prediction
Classification
Regression
Clustering
Association
Link analysis
Sequence analysis
Learning Method Popular Algorithms
Supervised
Supervised
Supervised
Unsupervised
Unsupervised
Unsupervised
Unsupervised
Decision trees, ANN/MLP, SVM, Rough sets, Genetic Algorithms
Linear/Nonlinear Regression, Regression trees, ANN/MLP, SVM
Expectation Maximization, Apriory Algorithm, Graph-based Matching
Apriory Algorithm, FP-Growth technique
K-means, ANN/SOM
Outlier analysis Unsupervised K-means, Expectation Maximization (EM)
Apriory, OneR, ZeroR, Eclat
Classification and Regression Trees, ANN, SVM, Genetic Algorithms
Source: Turban et al. (2011), Decision Support and Business Intelligence Systems 4

5
Transaction ID Items bought
T01 A, B, DT02 A, C, D T03 B, C, D, E T04 A, B, DT05 A, B, C, ET06 A, CT07 B, C, DT08 B, DT09 A, C, E T10 B, D
Transaction Database

Big Data Analytics Lifecycle
6

Key Roles for a Successful Analytics Project
7Source: EMC Education Services, Data Science and Big Data Analytics: Discovering, Analyzing, Visualizing and Presenting Data, Wiley, 2015

Overview of Data Analytics Lifecycle
8Source: EMC Education Services, Data Science and Big Data Analytics: Discovering, Analyzing, Visualizing and Presenting Data, Wiley, 2015

1. Discovery2. Data preparation3. Model planning4. Model building5. Communicate results6. Operationalize
9
Overview of Data Analytics Lifecycle
Source: EMC Education Services, Data Science and Big Data Analytics: Discovering, Analyzing, Visualizing and Presenting Data, Wiley, 2015

Key Outputs from a Successful Analytics Project
10Source: EMC Education Services, Data Science and Big Data Analytics: Discovering, Analyzing, Visualizing and Presenting Data, Wiley, 2015

Data Mining Process
11

Data Mining Process• A manifestation of best practices• A systematic way to conduct DM projects• Different groups has different versions• Most common standard processes:– CRISP-DM
(Cross-Industry Standard Process for Data Mining)– SEMMA
(Sample, Explore, Modify, Model, and Assess)– KDD
(Knowledge Discovery in Databases)
Source: Turban et al. (2011), Decision Support and Business Intelligence Systems 12

Data Mining Process(SOP of DM)
What main methodology are you using for your
analytics, data mining,
or data science projects ? 13Source: http://www.kdnuggets.com/polls/2014/analytics-data-mining-data-science-methodology.html

Data Mining Process
14Source: http://www.kdnuggets.com/polls/2014/analytics-data-mining-data-science-methodology.html

Data Mining: Core Analytics Process
The KDD Process for Extracting Useful Knowledge
from Volumes of Data
15Source: Fayyad, U., Piatetsky-Shapiro, G., & Smyth, P. (1996). The KDD Process for Extracting Useful Knowledge from Volumes of Data.
Communications of the ACM, 39(11), 27-34.

Fayyad, U., Piatetsky-Shapiro, G., & Smyth, P. (1996). The KDD Process for
Extracting Useful Knowledgefrom Volumes of Data.
Communications of the ACM, 39(11), 27-34.
16

Data Mining Knowledge Discovery in Databases (KDD) Process
(Fayyad et al., 1996)
17Source: Fayyad, U., Piatetsky-Shapiro, G., & Smyth, P. (1996). The KDD Process for Extracting Useful Knowledge from Volumes of Data.
Communications of the ACM, 39(11), 27-34.

Knowledge Discovery in Databases (KDD) Process
Cleaning and Integration
Selection and Transformation
Data Mining
Evaluation and Presentation
18Databases
Data Warehouse
Patterns
Knowledge
Flat files
Data mining: core of knowledge discovery process
Source: Jiawei Han and Micheline Kamber (2006), Data Mining: Concepts and Techniques, Second Edition, Elsevier
Task-relevant Data

Data Mining Process: CRISP-DM
Data Sources
Business Understanding
Data Preparation
Model Building
Testing and Evaluation
Deployment
Data Understanding
6
1 2
3
5
4
Source: Turban et al. (2011), Decision Support and Business Intelligence Systems 19

Data Mining Process: CRISP-DM
Step 1: Business UnderstandingStep 2: Data UnderstandingStep 3: Data Preparation (!)Step 4: Model BuildingStep 5: Testing and EvaluationStep 6: Deployment
• The process is highly repetitive and experimental (DM: art versus science?)
Accounts for ~85% of total project time
Source: Turban et al. (2011), Decision Support and Business Intelligence Systems 20
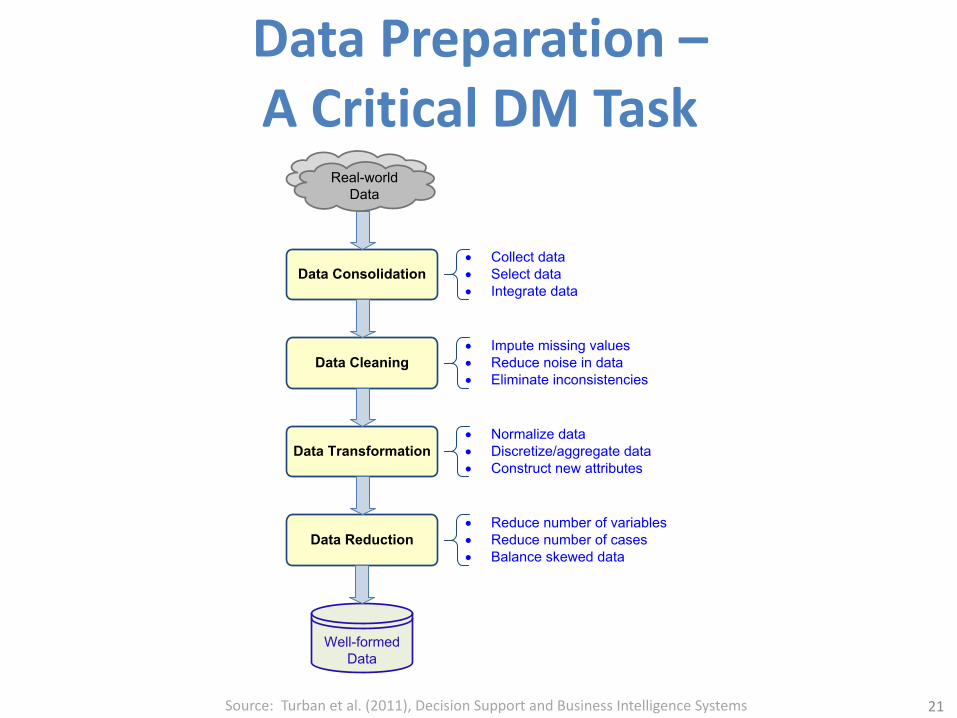
Data Preparation –A Critical DM Task
Data Consolidation
Data Cleaning
Data Transformation
Data Reduction
Well-formedData
Real-worldData
• Collect data• Select data• Integrate data
• Impute missing values• Reduce noise in data • Eliminate inconsistencies
• Normalize data• Discretize/aggregate data • Construct new attributes
• Reduce number of variables• Reduce number of cases • Balance skewed data
Source: Turban et al. (2011), Decision Support and Business Intelligence Systems 21

Data Mining Process: SEMMA
Sample
(Generate a representative sample of the data)
Modify(Select variables, transform
variable representations)
Explore(Visualization and basic description of the data)
Model(Use variety of statistical and machine learning models )
Assess(Evaluate the accuracy and usefulness of the models)
SEMMA
Source: Turban et al. (2011), Decision Support and Business Intelligence Systems 22

Data Mining Processing Pipeline(Charu Aggarwal, 2015)
23Source: Charu Aggarwal (2015), Data Mining: The Textbook Hardcover, Springer
Data Collection
Data Preprocessing Analytical ProcessingFeature
Extraction
Cleaning and
IntegrationBuilding Block 1
Building Block 2
Outputfor
Analyst
Feedback (Optional)
Feedback (Optional)
Data Mining
24

Why Data Mining?• More intense competition at the global scale • Recognition of the value in data sources• Availability of quality data on customers, vendors,
transactions, Web, etc. • Consolidation and integration of data repositories into
data warehouses• The exponential increase in data processing and
storage capabilities; and decrease in cost• Movement toward conversion of information
resources into nonphysical form
Source: Turban et al. (2011), Decision Support and Business Intelligence Systems 25

Definition of Data Mining• The nontrivial process of identifying valid, novel,
potentially useful, and ultimately understandable patterns in data stored in structured databases.- Fayyad et al., (1996)
• Keywords in this definition: Process, nontrivial, valid, novel, potentially useful, understandable.
• Data mining: a misnomer?• Other names:
– knowledge extraction, pattern analysis, knowledge discovery, information harvesting, pattern searching, data dredging,…
Source: Turban et al. (2011), Decision Support and Business Intelligence Systems 26
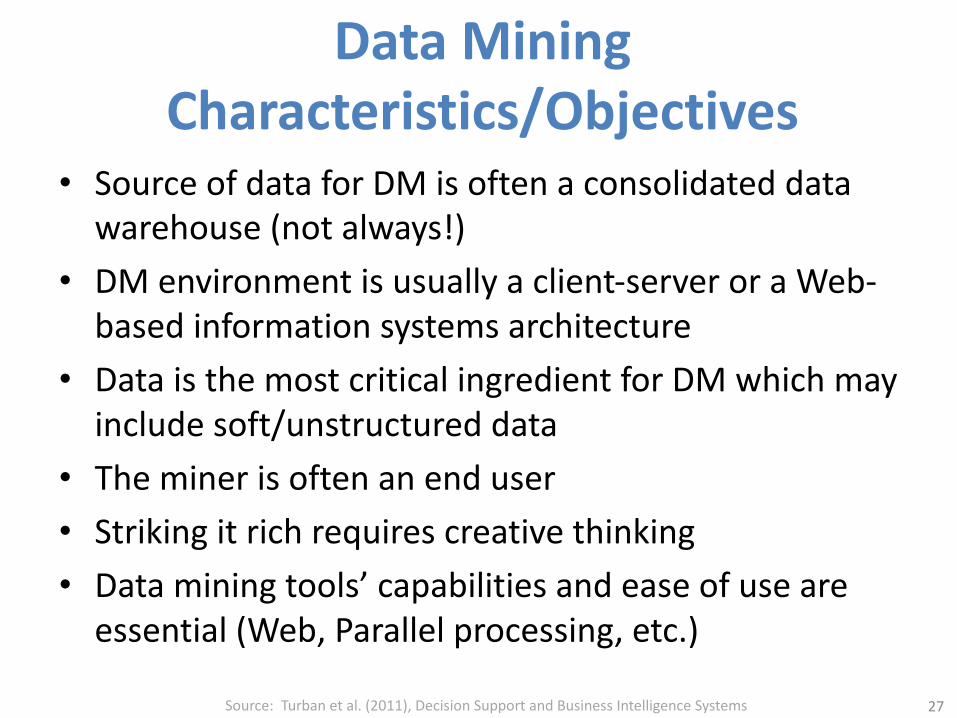
Data Mining Characteristics/Objectives
• Source of data for DM is often a consolidated data warehouse (not always!)
• DM environment is usually a client-server or a Web-based information systems architecture
• Data is the most critical ingredient for DM which may include soft/unstructured data
• The miner is often an end user• Striking it rich requires creative thinking• Data mining tools’ capabilities and ease of use are
essential (Web, Parallel processing, etc.)
Source: Turban et al. (2011), Decision Support and Business Intelligence Systems 27

Data in Data Mining
Data
Categorical Numerical
Nominal Ordinal Interval Ratio
• Data: a collection of facts usually obtained as the result of experiences, observations, or experiments
• Data may consist of numbers, words, images, …• Data: lowest level of abstraction (from which information and
knowledge are derived)
- DM with different data types?
- Other data types?
Source: Turban et al. (2011), Decision Support and Business Intelligence Systems 28

What Does DM Do?• DM extract patterns from data– Pattern?
A mathematical (numeric and/or symbolic) relationship among data items
• Types of patterns– Association– Prediction– Cluster (segmentation)– Sequential (or time series) relationships
Source: Turban et al. (2011), Decision Support and Business Intelligence Systems 29

Data Mining Applications• Customer Relationship Management– Maximize return on marketing campaigns– Improve customer retention (churn analysis)– Maximize customer value (cross-, up-selling)– Identify and treat most valued customers
• Banking and Other Financial – Automate the loan application process – Detecting fraudulent transactions– Optimizing cash reserves with forecasting
Source: Turban et al. (2011), Decision Support and Business Intelligence Systems 30

Data Mining Applications (cont.)• Retailing and Logistics– Optimize inventory levels at different locations– Improve the store layout and sales promotions– Optimize logistics by predicting seasonal effects– Minimize losses due to limited shelf life
• Manufacturing and Maintenance– Predict/prevent machinery failures – Identify anomalies in production systems to optimize the
use manufacturing capacity– Discover novel patterns to improve product quality
Source: Turban et al. (2011), Decision Support and Business Intelligence Systems 31

Data Mining Applications (cont.)• Brokerage and Securities Trading
– Predict changes on certain bond prices
– Forecast the direction of stock fluctuations
– Assess the effect of events on market movements
– Identify and prevent fraudulent activities in trading
• Insurance
– Forecast claim costs for better business planning
– Determine optimal rate plans
– Optimize marketing to specific customers
– Identify and prevent fraudulent claim activities
Source: Turban et al. (2011), Decision Support and Business Intelligence Systems 32

Data Mining Applications (cont.)• Computer hardware and software• Science and engineering• Government and defense• Homeland security and law enforcement• Travel industry • Healthcare• Medicine• Entertainment industry• Sports• Etc.
Highly popular application areas for data mining
Source: Turban et al. (2011), Decision Support and Business Intelligence Systems 33

Association Analysis
34

A Taxonomy for Data Mining TasksData Mining
Prediction
Classification
Regression
Clustering
Association
Link analysis
Sequence analysis
Learning Method Popular Algorithms
Supervised
Supervised
Supervised
Unsupervised
Unsupervised
Unsupervised
Unsupervised
Decision trees, ANN/MLP, SVM, Rough sets, Genetic Algorithms
Linear/Nonlinear Regression, Regression trees, ANN/MLP, SVM
Expectation Maximization, Apriory Algorithm, Graph-based Matching
Apriory Algorithm, FP-Growth technique
K-means, ANN/SOM
Outlier analysis Unsupervised K-means, Expectation Maximization (EM)
Apriory, OneR, ZeroR, Eclat
Classification and Regression Trees, ANN, SVM, Genetic Algorithms
Source: Turban et al. (2011), Decision Support and Business Intelligence Systems 35

36
Association Analysis: Mining Frequent Patterns,
Association and Correlations• Association Analysis• Mining Frequent Patterns• Association and Correlations• Apriori Algorithm
Source: Han & Kamber (2006)

37
Market Basket Analysis
Source: Han & Kamber (2006)

Association Rule Mining• Apriori Algorithm
Itemset(SKUs) SupportTransaction
NoSKUs
(Item No)
1
1
1
1
1
1
1, 2, 3, 4
2, 3, 4
2, 3
1, 2, 4
1, 2, 3, 4
2, 4
Raw Transaction Data
1
2
3
4
3
6
4
5
Itemset(SKUs) Support
1, 2
1, 3
1, 4
2, 3
3
2
3
4
3, 4
5
3
2, 4
Itemset(SKUs) Support
1, 2, 4
2, 3, 4
3
3
One-item Itemsets Two-item Itemsets Three-item Itemsets
Source: Turban et al. (2011), Decision Support and Business Intelligence Systems 38

Association Rule Mining• A very popular DM method in business
• Finds interesting relationships (affinities) between variables (items or events)
• Part of machine learning family
• Employs unsupervised learning
• There is no output variable
• Also known as market basket analysis
• Often used as an example to describe DM to ordinary people, such as the famous “relationship between diapers and beers!”
Source: Turban et al. (2011), Decision Support and Business Intelligence Systems 39

Association Rule Mining• Input: the simple point-of-sale transaction data• Output: Most frequent affinities among items • Example: according to the transaction data…
“Customer who bought a laptop computer and a virus protection software, also bought extended service plan 70 percent of the time."
• How do you use such a pattern/knowledge?– Put the items next to each other for ease of finding– Promote the items as a package (do not put one on sale if the
other(s) are on sale) – Place items far apart from each other so that the customer has to
walk the aisles to search for it, and by doing so potentially seeing and buying other items
Source: Turban et al. (2011), Decision Support and Business Intelligence Systems 40
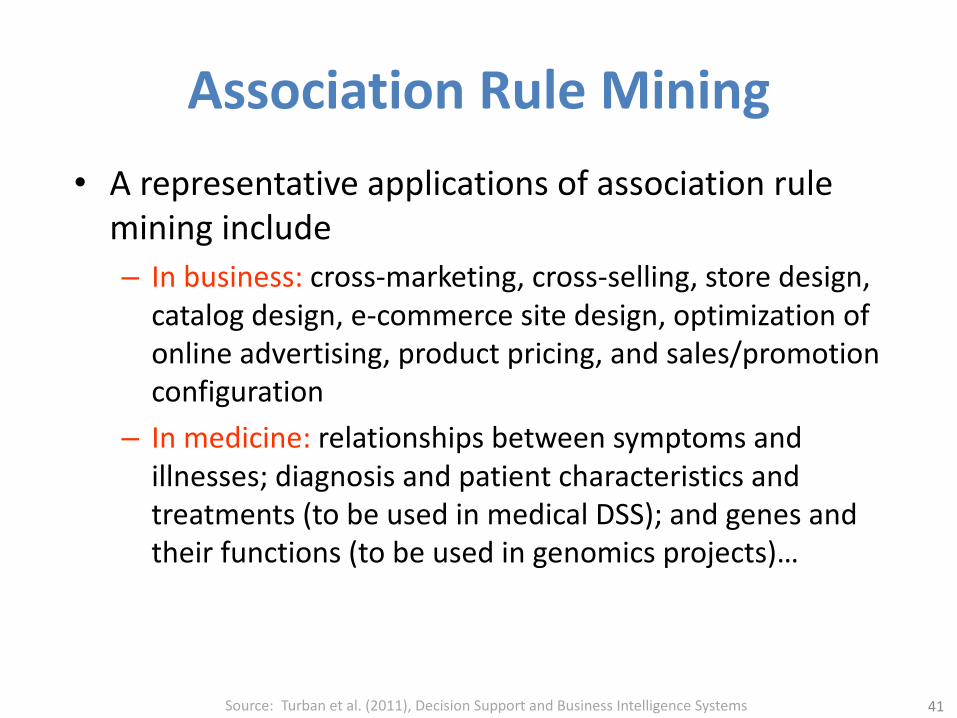
Association Rule Mining• A representative applications of association rule
mining include– In business: cross-marketing, cross-selling, store design,
catalog design, e-commerce site design, optimization of online advertising, product pricing, and sales/promotion configuration
– In medicine: relationships between symptoms and illnesses; diagnosis and patient characteristics and treatments (to be used in medical DSS); and genes and their functions (to be used in genomics projects)…
Source: Turban et al. (2011), Decision Support and Business Intelligence Systems 41

Association Rule Mining• Are all association rules interesting and useful?
A Generic Rule: X Þ Y [S%, C%]
X, Y: products and/or services X: Left-hand-side (LHS)Y: Right-hand-side (RHS)S: Support: how often X and Y go togetherC: Confidence: how often Y go together with the X
Example: {Laptop Computer, Antivirus Software} Þ{Extended Service Plan} [30%, 70%]
Source: Turban et al. (2011), Decision Support and Business Intelligence Systems 42

Association Rule Mining
• Algorithms are available for generating association rules– Apriori– Eclat– FP-Growth– + Derivatives and hybrids of the three
• The algorithms help identify the frequent item sets, which are, then converted to association rules
Source: Turban et al. (2011), Decision Support and Business Intelligence Systems 43

Association Rule Mining
• Apriori Algorithm– Finds subsets that are common to at least a
minimum number of the itemsets– uses a bottom-up approach• frequent subsets are extended one item at a time (the
size of frequent subsets increases from one-item subsets to two-item subsets, then three-item subsets, and so on), and • groups of candidates at each level are tested against the
data for minimum
Source: Turban et al. (2011), Decision Support and Business Intelligence Systems 44

45
Basic Concepts: Frequent Patterns and Association Rules
• Itemset X = {x1, …, xk}
• Find all the rules X à Y with minimum support and confidence
– support, s, probability that a transaction contains X È Y
– confidence, c, conditional probability that a transaction having X also contains Y
Let supmin = 50%, confmin = 50%Freq. Pat.: {A:3, B:3, D:4, E:3, AD:3}Association rules:
A à D (60%, 100%)D à A (60%, 75%)
Customerbuys diaper
Customerbuys both
Customerbuys beer
Transaction-id Items bought10 A, B, D20 A, C, D30 A, D, E40 B, E, F50 B, C, D, E, F
A à D (support = 3/5 = 60%, confidence = 3/3 =100%)D à A (support = 3/5 = 60%, confidence = 3/4 = 75%)
Source: Han & Kamber (2006)

Market basket analysis• Example– Which groups or sets of items are customers likely
to purchase on a given trip to the store?
• Association Rule– Computer à antivirus_software
[support = 2%; confidence = 60%]• A support of 2% means that 2% of all the transactions
under analysis show that computer and antivirus software are purchased together.• A confidence of 60% means that 60% of the customers
who purchased a computer also bought the software.
46Source: Han & Kamber (2006)

Association rules
• Association rules are considered interesting if they satisfy both – a minimum support threshold and – a minimum confidence threshold.
47Source: Han & Kamber (2006)

Frequent Itemsets, Closed Itemsets, and
Association Rules
48
Support (Aà B) = P(A È B)Confidence (Aà B) = P(B|A)
Source: Han & Kamber (2006)

Support (Aà B) = P(A È B)Confidence (Aà B) = P(B|A)
• The notation P(A È B) indicates the probability that a transaction contains the union of set A and set B – (i.e., it contains every item in A and in B).
• This should not be confused with P(A or B), which indicates the probability that a transaction contains either A or B.
49Source: Han & Kamber (2006)

Does diaper purchase predict beer purchase?
• Contingency tables
6 94
40 60
BeerYes No
No diapers
diapers
100
100
DEPENDENT (yes)
23 77
23 77
INDEPENDENT (no predictability)
BeerYes No
Source: Dickey (2012) http://www4.stat.ncsu.edu/~dickey/SAScode/Encore_2012.ppt

51
Support (Aà B) = P(A È B)
Confidence (Aà B) = P(B|A)Conf (A à B) = Supp (A È B)/ Supp (A)
Lift (A à B) = Supp (A È B) / (Supp (A) x Supp (B))Lift (Correlation)
Lift (AàB) = Confidence (AàB) / Support(B)
Source: Dickey (2012) http://www4.stat.ncsu.edu/~dickey/SAScode/Encore_2012.ppt

LiftLift = Confidence / Expected Confidence if Independent
52
CheckingSaving
No(1500)
Yes(8500) (10000)
No 500 3500 4000
Yes 1000 5000 6000
SVG=>CHKG Expect 8500/10000 = 85% if independentObserved Confidence is 5000/6000 = 83%Lift = 83/85 < 1. Savings account holders actually LESS likely than others to have checking account !!!
Source: Dickey (2012) http://www4.stat.ncsu.edu/~dickey/SAScode/Encore_2012.ppt

• Rules that satisfy both a minimum support threshold (min_sup) and a minimum confidence threshold (min_conf) are called strong.
• By convention, we write support and confidence values so as to occur between 0% and 100%, rather than 0 to 1.0.
53Source: Han & Kamber (2006)
Minimum Support andMinimum Confidence

• itemset– A set of items is referred to as an itemset.
• K-itemset– An itemset that contains k items is a k-itemset.
• Example:– The set {computer, antivirus software} is a 2-itemset.
54Source: Han & Kamber (2006)
K-itemset

Absolute Support andRelative Support
• Absolute Support – The occurrence frequency of an itemset is the
number of transactions that contain the itemset• frequency, support count, or count of the itemset
– Ex: 3• Relative support – Ex: 60%
55Source: Han & Kamber (2006)

• If the relative support of an itemset I satisfies a prespecified minimum support threshold, then I is a frequent itemset.– i.e., the absolute support of I satisfies the
corresponding minimum support count threshold • The set of frequent k-itemsets is commonly
denoted by LK
56Source: Han & Kamber (2006)
Frequent Itemset
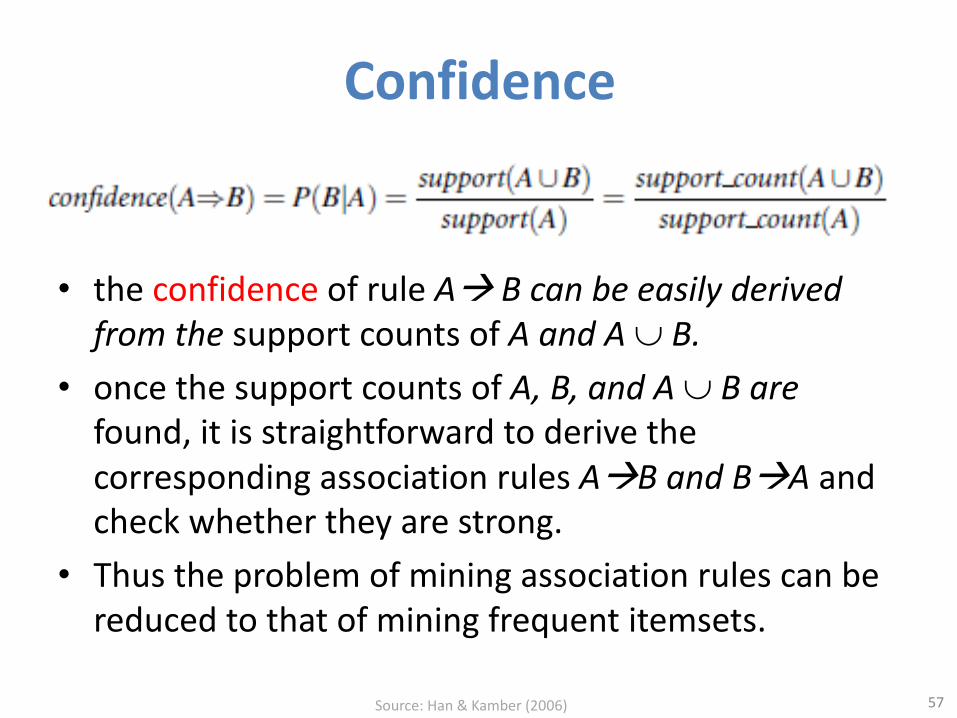
• the confidence of rule Aà B can be easily derived from the support counts of A and A È B.
• once the support counts of A, B, and A È B are found, it is straightforward to derive the corresponding association rules AàB and BàA and check whether they are strong.
• Thus the problem of mining association rules can be reduced to that of mining frequent itemsets.
57Source: Han & Kamber (2006)
Confidence

Association rule mining:Two-step process
1. Find all frequent itemsets– By definition, each of these itemsets will occur at
least as frequently as a predetermined minimum support count, min_sup.
2. Generate strong association rules from the frequent itemsets– By definition, these rules must satisfy minimum
support and minimum confidence.
58Source: Han & Kamber (2006)

Efficient and Scalable Frequent Itemset Mining Methods• The Apriori Algorithm– Finding Frequent Itemsets Using Candidate
Generation
59Source: Han & Kamber (2006)

Apriori Algorithm
• Apriori is a seminal algorithm proposed by R. Agrawal and R. Srikant in 1994 for mining frequent itemsets for Boolean association rules.
• The name of the algorithm is based on the fact that the algorithm uses prior knowledge of frequent itemset properties, as we shall see following.
60Source: Han & Kamber (2006)

Apriori Algorithm• Apriori employs an iterative approach known as a level-wise
search, where k-itemsets are used to explore (k+1)-itemsets. • First, the set of frequent 1-itemsets is found by scanning the
database to accumulate the count for each item, and collecting those items that satisfy minimum support. The resulting set is denoted L1.
• Next, L1 is used to find L2, the set of frequent 2-itemsets, which is used to find L3, and so on, until no more frequent k-itemsets can be found.
• The finding of each Lk requires one full scan of the database.
61Source: Han & Kamber (2006)

Apriori Algorithm
• To improve the efficiency of the level-wise generation of frequent itemsets, an important property called the Apriori property.
• Apriori property– All nonempty subsets of a frequent itemset must
also be frequent.
62Source: Han & Kamber (2006)

Apriori algorithm(1) Frequent Itemsets(2) Association Rules
63

64
Transaction ID Items bought
T01 A, B, DT02 A, C, D T03 B, C, D, E T04 A, B, DT05 A, B, C, ET06 A, CT07 B, C, DT08 B, DT09 A, C, E T10 B, D
Transaction Database

65
Table 1 shows a database with 10 transactions.Let minimum support = 20% and minimum confidence = 80%. Please use Apriori algorithm for generating association rulesfrom frequent itemsets.
Transaction ID
Items bought
T01 A, B, DT02 A, C, D T03 B, C, D, E T04 A, B, DT05 A, B, C, ET06 A, CT07 B, C, DT08 B, DT09 A, C, E T10 B, D
Table 1: Transaction Database

66
Transaction ID
Items bought
T01 A, B, DT02 A, C, D T03 B, C, D, E T04 A, B, DT05 A, B, C, ET06 A, CT07 B, C, DT08 B, DT09 A, C, E T10 B, D
Itemset Support Count
A 6B 7C 6D 7E 3
Itemset Support Count
A 6B 7C 6D 7E 3
C1 L1minimum support = 20%= 2 / 10Min. Support Count = 2
Apriori AlgorithmC1 à L1
Step 1-1

67
Itemset Support Count
A, B 3A, C 4A, D 3A, E 2B, C 3B, D 6B, E 2C, D 3C, E 3D, E 1
C2 L2
minimum support = 20%= 2 / 10Min. Support Count = 2
Apriori AlgorithmC2 à L2
Itemset Support Count
A 6
B 7
C 6
D 7
E 3
L1
Itemset Support Count
A, B 3A, C 4A, D 3A, E 2B, C 3B, D 6B, E 2C, D 3C, E 3
Transaction ID
Items bought
T01 A, B, DT02 A, C, D T03 B, C, D, E T04 A, B, DT05 A, B, C, ET06 A, CT07 B, C, DT08 B, DT09 A, C, E T10 B, D
Step 1-2

68
Transaction ID
Items bought
T01 A, B, DT02 A, C, D T03 B, C, D, E T04 A, B, DT05 A, B, C, ET06 A, CT07 B, C, DT08 B, DT09 A, C, E T10 B, D
Itemset Support Count
A, B, C 1A, B, D 2A, B, E 1A, C, D 1A, C, E 2B, C, D 2B, C, E 2
C3 L3
minimum support = 20%= 2 / 10Min. Support Count = 2
Apriori AlgorithmC3 à L3
Itemset Support Count
A, B 3
A, C 4
A, D 3
A, E 2
B, C 3
B, D 6
B, E 2
C, D 3
C, E 3
Itemset Support Count
A, B, D 2A, C, E 2B, C, D 2B, C, E 2
L2
Step 1-3

69
L2
Generating Association Rules
Itemset Support Count
A, B 3A, C 4A, D 3A, E 2B, C 3B, D 6B, E 2C, D 3C, E 3
L1AàB: 3/6 BàA: 3/7AàC: 4/6 CàA: 4/6AàD: 3/6 DàA: 3/7AàE: 2/6 EàA: 2/3BàC: 3/7 CàB: 3/6BàD: 6/7=85.7% * DàB: 6/7=85.7% *BàE: 2/7 EàB: 2/3CàD: 3/6 DàC: 2/7CàE: 3/6 EàC: 3/3=100% *
Association Rules Generated from L2
minimum confidence = 80%
Itemset Support Count
A 6
B 7
C 6
D 7
E 3
Transaction ID
Items bought
T01 A, B, DT02 A, C, D T03 B, C, D, E T04 A, B, DT05 A, B, C, ET06 A, CT07 B, C, DT08 B, DT09 A, C, E T10 B, D
Step 2-1

70
L2Itemset Support
Count
A, B 3
A, C 4
A, D 3
A, E 2
B, C 3
B, D 6
B, E 2
C, D 3
C, E 3
Itemset Support Count
A 6
B 7
C 6
D 7
E 3
L1
AàBD: 2/6 BàCD: 2/7BàAD: 2/7 CàBD: 2/6DàAB: 2/7 DàBC: 2/7ABàD: 2/3 BCàD: 2/3ADàB: 2/3 BDàC: 2/6BDàA: 2/6 CDàB: 2/3AàCE: 2/6 BàCE: 2/7CàAE: 2/6 CàBE: 2/6EàAC: 2/3 EàBC: 2/3ACàE: 2/4 BCàE: 2/3AEàC: 2/2=100%* BEàC: 2/2=100%*CEàA: 2/3 CEàB: 2/3
Association Rules Generated from L3
L3Itemset Support
CountA, B, D 2A, C, E 2B, C, D 2B, C, E 2
Transaction ID
Items bought
T01 A, B, DT02 A, C, D T03 B, C, D, E T04 A, B, DT05 A, B, C, ET06 A, CT07 B, C, DT08 B, DT09 A, C, E T10 B, D
Step 2-2Generating Association Rulesminimum confidence = 80%

71
L2Itemset Support
Count
A, B 3
A, C 4
A, D 3
A, E 2
B, C 3
B, D 6
B, E 2
C, D 3
C, E 3
Association Rules: minimum confidence = 80%
L3Itemset Support
CountA, B, D 2A, C, E 2B, C, D 2B, C, E 2
BàD (60%, 85.7%) (Sup.: 6/10, Conf.: 6/7) DàB (60%, 85.7%) (Sup.: 6/10, Conf.: 6/7)EàC (30%, 100%) (Sup.: 3/10, Conf.: 3/3)AEàC (20%, 100%) (Sup.: 2/10, Conf.: 2/2)BEàC (20%, 100%) (Sup.: 2/10, Conf.: 2/2)
Itemset Support Count
A 6
B 7
C 6
D 7
E 3
L1
minimum support = 20%
Transaction ID
Items bought
T01 A, B, DT02 A, C, D T03 B, C, D, E T04 A, B, DT05 A, B, C, ET06 A, CT07 B, C, DT08 B, DT09 A, C, E T10 B, D
Frequent Itemsets and Association Rules

72
Association Rules: BàD (60%, 85.7%) (Sup.: 6/10, Conf.: 6/7) DàB (60%, 85.7%) (Sup.: 6/10, Conf.: 6/7)EàC (30%, 100%) (Sup.: 3/10, Conf.: 3/3)AEàC (20%, 100%) (Sup.: 2/10, Conf.: 2/2)BEàC (20%, 100%) (Sup.: 2/10, Conf.: 2/2)
Transaction ID Items boughtT01 A, B, DT02 A, C, D T03 B, C, D, E T04 A, B, DT05 A, B, C, ET06 A, CT07 B, C, DT08 B, DT09 A, C, E T10 B, D
Table 1 shows a database with 10 transactions.Let minimum support = 20% and minimum confidence = 80%. Please use Apriori algorithm for generating association rules from frequent itemsets.

Summary• Big Data Analytics Lifecycle• Data Mining Process• Data Mining• Association Analysis• Apriori algorithm–Frequent Itemsets–Association Rules
73

References• Jiawei Han and Micheline Kamber, Data Mining: Concepts and
Techniques, Second Edition, Elsevier, 2006. • Jiawei Han, Micheline Kamber and Jian Pei, Data Mining:
Concepts and Techniques, Third Edition, Morgan Kaufmann 2011.
• Efraim Turban, Ramesh Sharda, Dursun Delen, Decision Support and Business Intelligence Systems, Ninth Edition, Pearson, 2011.
• EMC Education Services, Data Science and Big Data Analytics: Discovering, Analyzing, Visualizing and Presenting Data, Wiley, 2015
74