109 of, risk best - member | soa · pdf filesession 109 of, risk management best practices in...
TRANSCRIPT

Session 109 OF, Risk Management Best Practices in Investments
Moderator:
Peter H. Sun, FSA, MAAA
Presenters: Dariush A. Akhtari, FSA, FCIA, MAAA
Samir Mathur Charles Nevins, CFA, FRM
SOA Antitrust Disclaimer SOA Presentation Disclaimer

© 2016 The Capital Group Companies, Inc.
Risk Management Best Practices
Monitoring Investment Strategies An Investment Perspective
Samir Mathur
Capital Group/American Funds
October 2016
1For financial professionals only. Not for use with the public.
© The Capital Group Companies, Inc.
Managed risk funds strategy monitoring – investment perspective
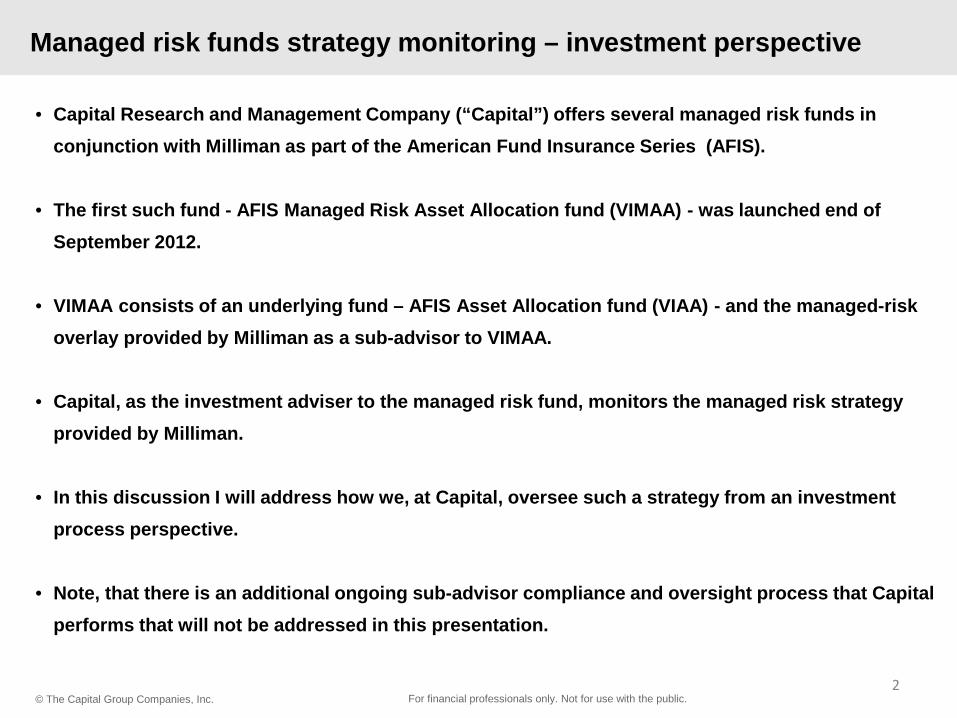
• Capital Research and Management Company (“Capital”) offers several managed risk funds in conjunction with Milliman as part of the American Fund Insurance Series (AFIS).
• The first such fund - AFIS Managed Risk Asset Allocation fund (VIMAA) - was launched end of September 2012.
• VIMAA consists of an underlying fund – AFIS Asset Allocation fund (VIAA) - and the managed-risk overlay provided by Milliman as a sub-advisor to VIMAA.
• Capital, as the investment adviser to the managed risk fund, monitors the managed risk strategy provided by Milliman.
• In this discussion I will address how we, at Capital, oversee such a strategy from an investment process perspective.
• Note, that there is an additional ongoing sub-advisor compliance and oversight process that Capital performs that will not be addressed in this presentation.
2For financial professionals only. Not for use with the public.

AFIS Managed Risk funds are designed for investors that seek to reduce their exposure to account fluctuations during periods of elevated equity market volatility. The managed risk funds pursue their investment objective by investing in shares of an underlying traditional AFIS funds and applying the managed risk strategy.
Managed Risk fund objectives:
• Seek to participate in the upside of the underlying traditional fund while lowering the risk of large account value drawdowns over equity market cycles. By the nature of the managed risk strategy and the cash component retained by the fund to implement the strategy, the managed risk fund will generally not participate in the full upside of the underlying fund and may not prevent large account value drawdowns in all market conditions.
Other considerations:
• The strategy should be scalable
• Only utilize highly liquid hedge instruments that trade under most market conditions
• Reduce the impact on the underlying AFIS funds
© The Capital Group Companies, Inc. For financial professionals only. Not for use with the public.
Managed Risk Strategy – objectives & trade-offs
Each of the American Funds Insurance Series (AFIS) Managed Risk funds has an investment objective consistent with that of its underlying fund, with the addition of “seeking to manage volatility and provide downside protection” – this leads to trade-offs which need to be kept in mind when analyzing the success of these funds
3

© The Capital Group Companies, Inc. For financial professionals only. Not for use with the public.
AFIS Managed Risk funds own shares in an underlying traditional fund, cash and hedge instruments.The AFIS managed risk strategy is designed to manage the risk associated with volatility and provide downside protection.
Managed risk funds – the basic structure
AFIS Managed Risk Funds own shares in the underlying traditional fund, cash and hedge instruments.
• The funds invest in an underlying traditional fund while maintaining a targeted level of cash to support the risk management strategy.
• The strategy incorporates two risk mitigation strategies; one to control volatility and the other to reduce downside account risk.
• Both risk management components are implemented using exchange-traded futures that are liquid, transparent and cash settle daily.
Managed risk fund
Shares of underlying traditional fund
Cash –5% to 10%
Hedge instruments
Volatility management
Capital protection
4

© The Capital Group Companies, Inc. For financial professionals only. Not for use with the public.
Source: Milliman Financial Risk Management. 1,000 stochastically generated scenarios . Each scenario contained thirty years of daily returns for indices and interest rates. The underlying portfolio consists of 58% S&P 500, 10% Russell 2000, 12% EAFE, 20% Barclays Aggregate, with 90 bps annual fee for both portfolios.
Traditional portfolio
Managed Risk portfolio
AverageReturn 9.3% 7.8%
AverageVolatility 18.7% 9.4%
Return/Vol 49.7% 83.6%
Managed risk strategy objective: more stable account values
The goal of the AFIS Managed Risk Strategy is to reduce the left tail and tighten the distribution of returns.
5
© The Capital Group Companies, Inc.
Managed risk funds strategy monitoring – investment perspective
6
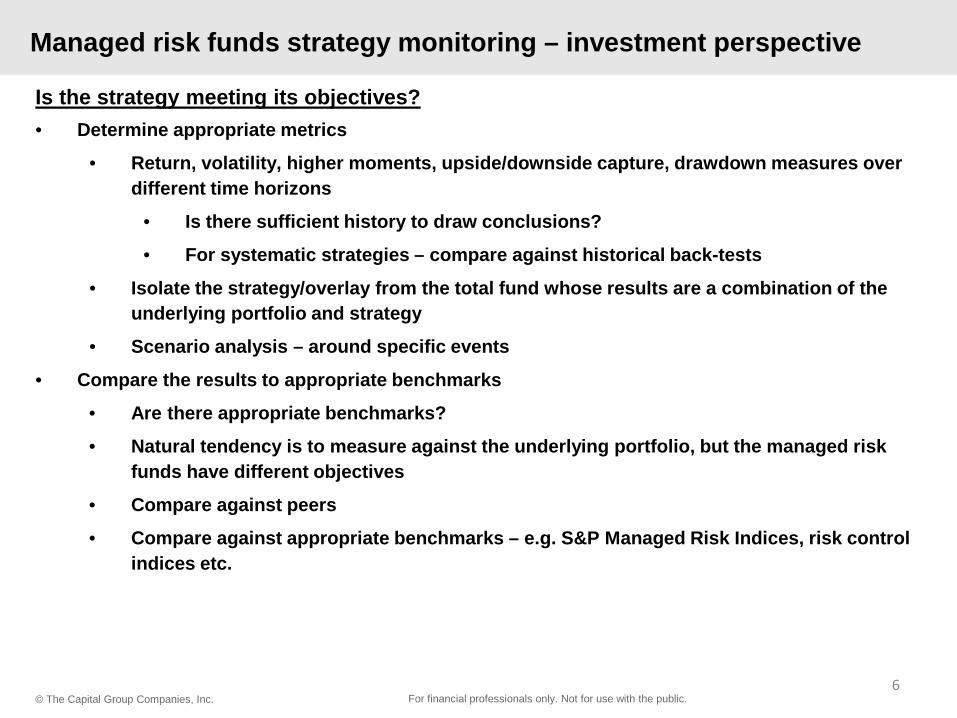
Is the strategy meeting its objectives?• Determine appropriate metrics
• Return, volatility, higher moments, upside/downside capture, drawdown measures over different time horizons
• Is there sufficient history to draw conclusions?
• For systematic strategies – compare against historical back-tests
• Isolate the strategy/overlay from the total fund whose results are a combination of the underlying portfolio and strategy
• Scenario analysis – around specific events
• Compare the results to appropriate benchmarks
• Are there appropriate benchmarks?
• Natural tendency is to measure against the underlying portfolio, but the managed risk funds have different objectives
• Compare against peers
• Compare against appropriate benchmarks – e.g. S&P Managed Risk Indices, risk control indices etc.
For financial professionals only. Not for use with the public.

© The Capital Group Companies, Inc.
Managed risk funds strategy monitoring – investment perspective
7
Is the strategy working as it is supposed to?For systematic strategies – it may be possible to replicate parts or the whole strategy
• Try to match the strategy components within tolerance bands
• Be careful about compounding the impact of strategy sub-components on the final results
• Resolve the input data issues – matching the data, dates, and pre-processing
• Determine the appropriate timing – daily/weekly/periodically
• Determine strategy advise incorporating intra-day market moves
• Address global timing considerations
• Whether to do this before the strategy trades or afterwards as a check
• Automated or manual
• Trading tolerances
• Internal and external reporting
• Determine the escalation process
• What happens when the strategy evolves?
For financial professionals only. Not for use with the public.

© The Capital Group Companies, Inc.
Managed risk funds strategy monitoring – organization & processes
8
How do you set up internal organization and processes?• Determine the multi-disciplinary group in charge of the monitoring process
• Set up regular monitoring and identify the resources
• Determine the points of contacts for regular dialog and escalation
• Set up periodic meetings with the larger group and the sub-advisor
• Have periodic internal meetings to discuss the results of the strategy and funds
• Have periodic due-diligence meetings
• Set up a process to investigate new ideas and evolution of the strategy
For financial professionals only. Not for use with the public.

Limitations and disclosures
Proprietary and confidential. Not for registered representative distribution.
Past performance is not indicative of future results. Recipients must make their own independent decisions regarding any strategies or securities or financial instruments mentioned herein.
Capital Group does not make any representations that products or services described or referenced herein are suitable or appropriate for the recipient. Many of the products and services described or referenced herein involve significant risks, and the recipient should not make any decision or enter into any transaction unless the recipient has fully understood all such risks and has independently determined that such decisions or transactions are appropriate for the recipient.
Any discussion of risks contained herein with respect to any product or service should not be considered to be a disclosure of all risks or a complete discussion of the risks involved. Investors should carefully consider investment objectives, risks, charges and expenses. This and other important information is contained in the fund prospectuses and summary prospectuses, which can be obtained from a financial professional and should be read carefully before investing.
The recipient should not construe any of the material contained herein as investment, hedging, trading, legal, regulatory, tax, accounting or other advice. The recipient should not act on any information in this document without consulting its investment, hedging, trading, legal, regulatory, tax, accounting and other advisors.
Capital Group does not ensure a profit or guarantee against loss.
© The Capital Group Companies, Inc. For financial professionals only. Not for use with the public.9

Chuck NevinsSenior Trader, Milliman Financial Risk Management LLCBest Practices in Investment ImplementationOCTOBER 25, 2016

FIDUCIARY: An individual in whom another has placed the utmost trust and confidence to manage and protect property or money. The relationship wherein one person has an obligation to act for another’s benefit.• Considerable Latitude• Judged by Prudence of the Process• Implementation is an Extension• Forms a Feedback Loop
2

3

Positive Impact of Technology
• Adds More Controls• Increases Speed• Lowers Transaction Costs• Allows Algorithmic Strategies• Assist in Compliance• Improves Data Dissemination
4

But Some Negative Repercussions
• Knight Capital software goes awry in 2012, results in $440m losses
• Michael Lewis bashes high-frequency trades in Flash Boys, released in 2014
• NYSE shuts down for four hours in July 2015 due to technology malfunction
5

Risk is a choice
• Effects of Prospect Theory
• The Black Swan viewpoint
• High Price of Gap Protection
• Willingness to endure the path
6

Product Choice Aligned with Strategy
• Cost• Liquidity • Collateral Requirements• Credit Risk• Tracking Error• Ability to Measure & Monitor Risk
7

8

Do you understand what it is and how it works?
9

10
Maybe it’s better than you think

BROKERS• Fees• Service (speed, completion, market impact)• Dedicated and Experienced Manpower• Purchasing Power• Assumption of Liability• Technology• Operational Efficiency• Financial Condition• Conclusion: It’s not all about explicit cost
11
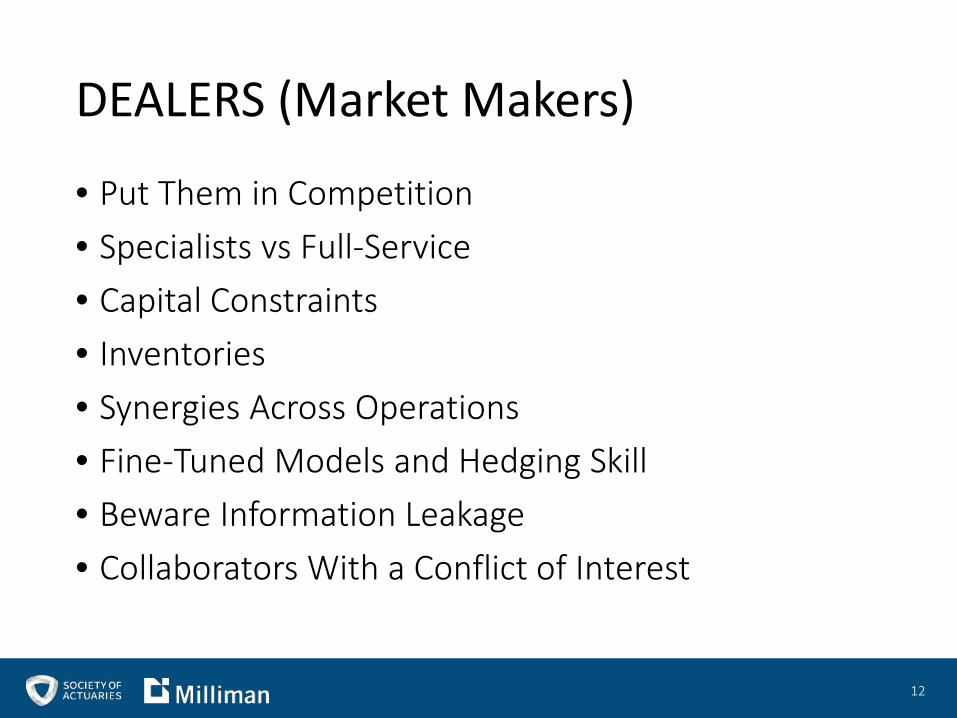
DEALERS (Market Makers)
• Put Them in Competition• Specialists vs Full-Service• Capital Constraints• Inventories• Synergies Across Operations• Fine-Tuned Models and Hedging Skill• Beware Information Leakage • Collaborators With a Conflict of Interest
12

BEST EX
• Impacts Portfolio Performance• Cannot Be Known With Certainty Ex Ante• Depends on Circumstances• Quality Assessed Over Time• Relationships and Practices Are Integral• Requires Ongoing Dedication to the Process• Provides Feedback For Strategy
13

Thank [email protected]

Session 109: Risk Management Best Practices in Investment
Dariush Akhtari
October 25, 2016

2
Agenda
Strategy
Execution/Implementation
Tracking
Governance

3
The Investment Strategy Is Determined at the Top of the House
Need to clearly define the objective of ALM
Capital appreciation
Capital preservation
• E.g., liability driven ALM in the low interest rate environment
Strategy Implementation Tracking Governance

4
An Insurance Liability-Driven Investment Strategy
Considerations for investment:
Liability characteristic
Embedded options in liabilities
Decision on hedging
Cash flows beyond liquid asset availability
What assets are used to back these?
Risk Constraints
Business Constraints
ALM
Firm’s Priority
Addressing Both Risk and Business Constraints The decision to match asset duration to that of liabilities depends on:
What is the goal?
Capital appreciation
Capital preservation
What duration to match to?
Effective duration or weighted average life?
What discount rate is used?
How are assets tagged to the insurance products?
Economic or statutory reserve
A
B
C
5
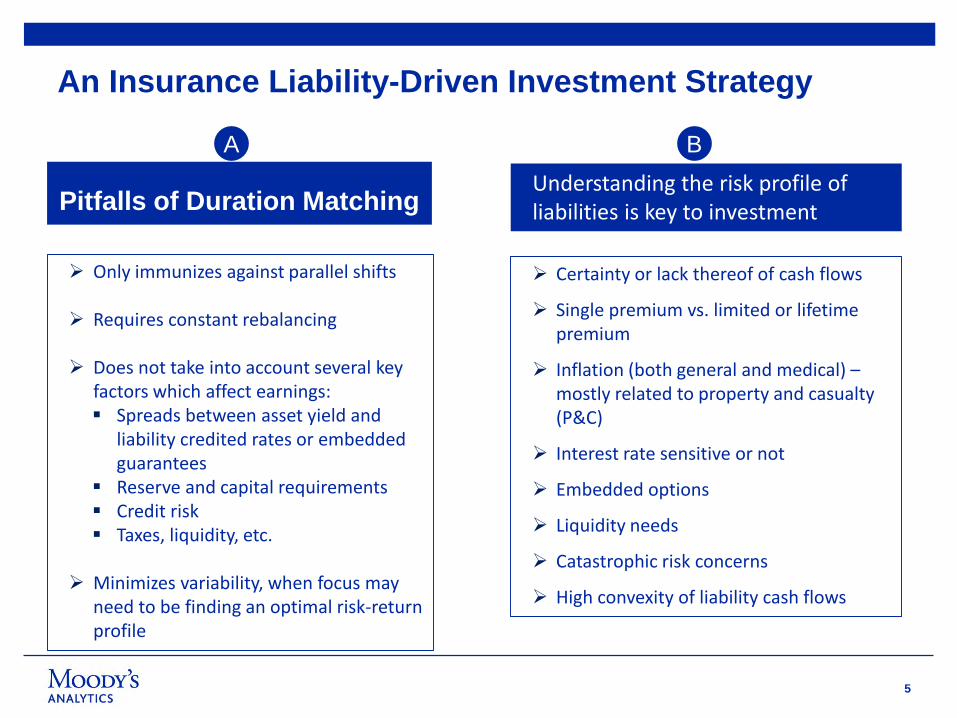
An Insurance Liability-Driven Investment Strategy
Pitfalls of Duration Matching
Only immunizes against parallel shifts
Requires constant rebalancing
Does not take into account several key factors which affect earnings: Spreads between asset yield and
liability credited rates or embedded guarantees
Reserve and capital requirements Credit risk Taxes, liquidity, etc.
Minimizes variability, when focus may need to be finding an optimal risk-return profile
A
Certainty or lack thereof of cash flows
Single premium vs. limited or lifetime premium
Inflation (both general and medical) –mostly related to property and casualty (P&C)
Interest rate sensitive or not
Embedded options
Liquidity needs
Catastrophic risk concerns
High convexity of liability cash flows
Understanding the risk profile of liabilities is key to investment
B

6
An Insurance Liability-Driven Investment Strategy
True ALM is about understanding and managing the volatility in the cash flow mismatch in all future periods (residual in the below graphs)
Common Practice Refinement
Independent discount rate
Time zero market value of asset (MVA0) (i.e., use assets’ ALM metrics for this portion of cash flows)
Independent discount rate
Eliminates the impact of the distortion of discount rate on liability’s ALM metrics
A > L A < L
Asse
t Cas
h Fl
ow (A
) Resid
ual
(L -
A)
Liab
illity
Cas
h Fl
ow (L
) Resid
ual
(L -
A)
Liab
illity
Cas
h Fl
ow (L
)
Asse
t Cas
h Fl
ow (A
)
A > L A < L
Asse
t Cas
h Fl
ow (A
) Resid
ual
(L -
A)
Liab
illity
Cas
h Fl
ow (L
) Resid
ual
(L -
A)
Liab
illity
Cas
h Fl
ow (L
)
Asse
t Cas
h Fl
ow (A
)
C
7
To Execute an Effective Strategy, One Needs to Consider the Organizational Alignment
Strategy Implementation Tracking Governance

8
Implementation Concern
In-force business
May not have an option
If possible, de-risk
Might be able through crediting rate, cost of insurance increase
Changing rider fees for VA (if possible)
New business
Not a clear cut situation – generally a bit of both
Consider competitive environment
Better to price based on available investment possibilities
Liability Investment?
9
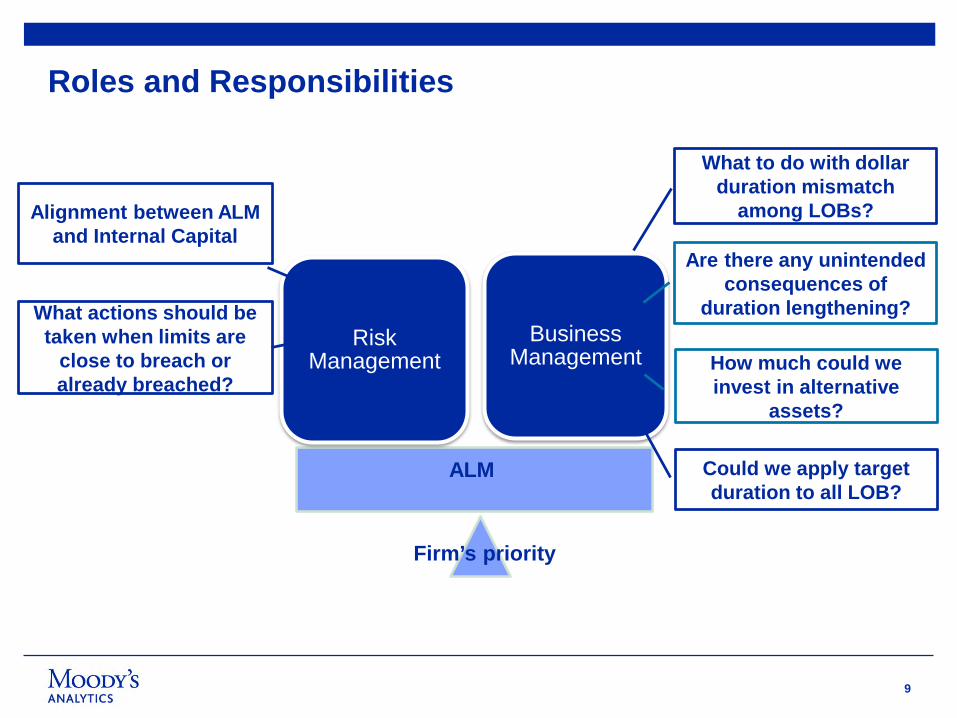
Roles and Responsibilities
Risk Management
Business Management
Firm’s priority
ALM
What to do with dollar duration mismatch
among LOBs?
Are there any unintended consequences of
duration lengthening?
How much could we invest in alternative
assets?
Could we apply target duration to all LOB?
What actions should be taken when limits are
close to breach or already breached?
Alignment between ALM and Internal Capital
10
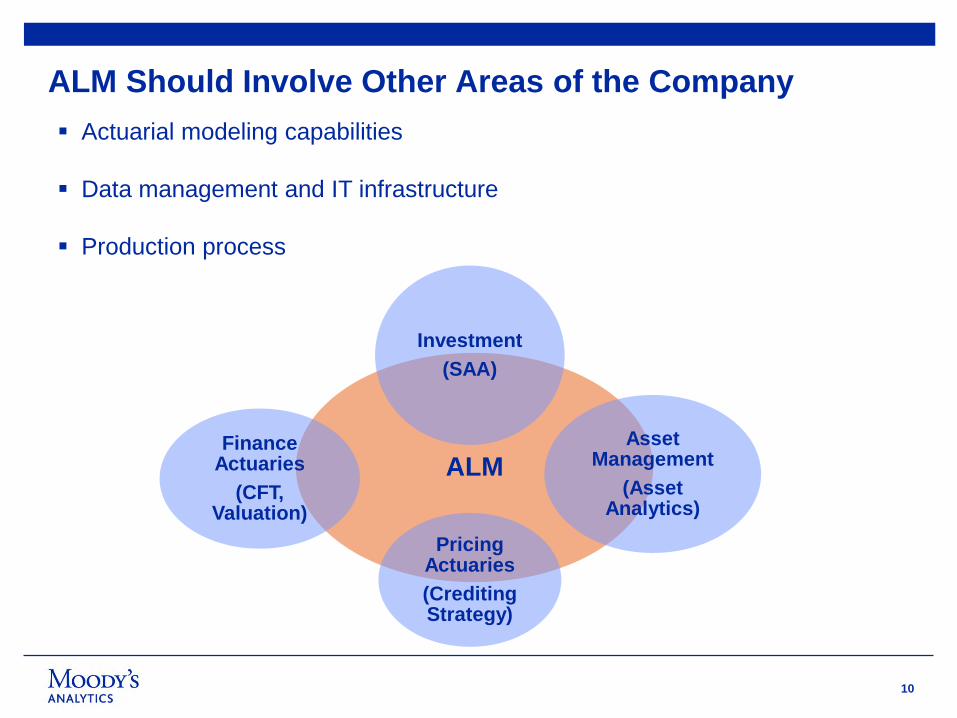
ALM Should Involve Other Areas of the Company
ALM
Investment(SAA)
Asset Management
(Asset Analytics)
Pricing Actuaries(Crediting Strategy)
Finance Actuaries
(CFT, Valuation)
Actuarial modeling capabilities
Data management and IT infrastructure
Production process

11
Strategic Asset Allocation (SAA)
Study (Brinson et al. 1986) concluded that asset allocation is the primary driver of a portfolio’s return variability1
Recent study (Vanguard 2012) found that active management has reduced a portfolio’s return and increased its volatility on average
Investment decision must take liability and other business requirements into consideration; this is an important component of ALM
SAA plays a key role in determining portfolio’s overall risk and return
Liability & Business
Requirements
SAA
Investment opportunity set; Expected return, variances, and correlation
across assets classes; Business constraints (liability cash flows) Risk constraints (duration, liquidity, and
diversification requirements) Investment return/risk target [e.g., total
return vs. net investment income (NII), book yield; variance vs value at risk (VAR)]
1 Determinants of Portfolio Performance

12
Efficient Frontier (EF) Analysis
Select investment strategy with the most attractive risk-return profileA point on the graph is superior to those below it,
which have lower returns, and those to its right, which have more risk
Select the portfolio on EF that allows for risk within the defined tolerance
Plot each strategy according to its risk-return profile
Return Measure: Average present value (PV) of distributable earnings (DE) across all scenarios
Risk Measure : Extreme percentile PV of DE among scenario results
Use ALM models to test various investment strategies
Strategy may include rebalancing current portfolio
For each investment strategy, run a set of stochastic real-world scenarios
Calculate PV of earnings for each scenario

13
Efficient Frontier Plot
1
3
4
56
7
10
11
12
15
20
30
650
700
750
800
850
900
950
1000
-50050100150200250300350400450500550600
Ret
urn
Mea
sure
Risk Measure
Average PV of distributable earnings (DE) (Y axis) vs. 5th Percentile (X axis) by Reinvestment Term
Unit of DE
Unit of DERisk Tolerance
Risk Increases
Accepted area
Min Return

14
Maintain Competitiveness While Matching Assets and Liabilities
Segment assets by insurance products
Define risk tolerance this is key
Use efficient frontier approach to allocate assets with optimal risk/reward profile
Consider various approaches to efficient frontier
Whole portfolio or a portion
Consider tax, deferred acquisition cost (DAC) unlocking, NII, etc.
Portfolio allocation vs. managing to the duration of optimal portfolio

15
Need to Timely Track and Report Dashboards, Informing Senior Managements in Both BU and Corporate
Strategy Implementation Tracking Governance
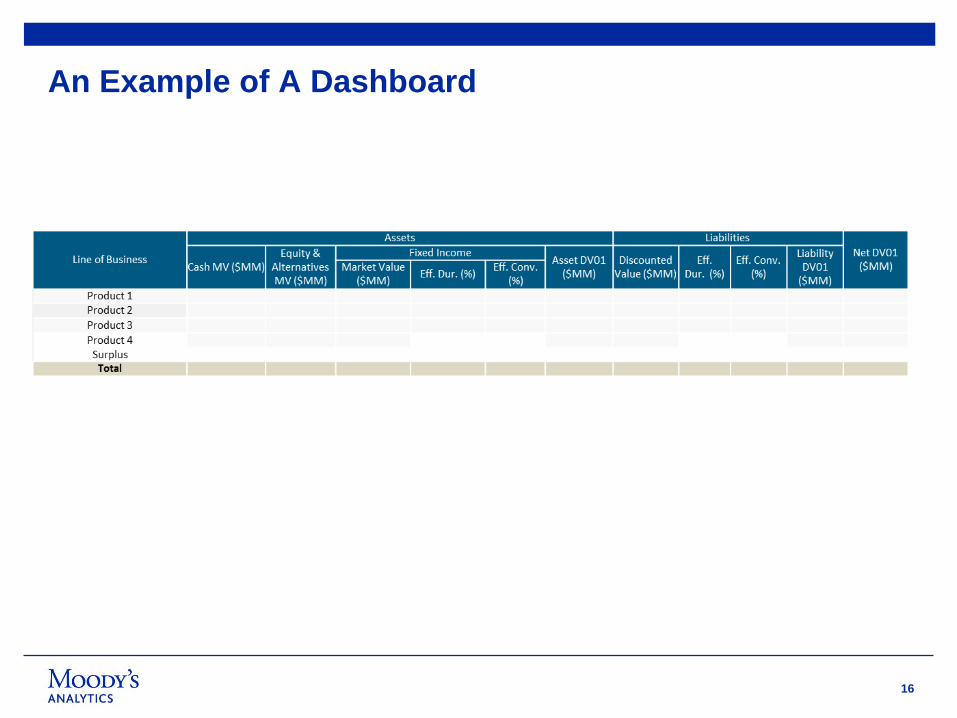
16
An Example of A Dashboard

17
Controls Start at Every Stage of the Process
Strategy Implementation Tracking Governance

18
An Example of ALM Governance Approach
Financial actuaries review and sign-off
ERM review and challenge
ALCO
Improve governance and control process
Manage internal (actuarial) and external (non-actuarial) review and sign off
Facilitate reporting and discussions between BUs and Corporate
Document and provide governance for the key ALM activities
Enhance insight into value creation
Quantify value creation by the businesses both at issue and over time Improve ability to make investment risk-return
trade-offs
ALM
Enhance information consistency and transparency
Improve communication among relevant parties
Ensure consistent and reliable information is used across functions
Enhance operational efficiency
Streamlining production Review Reporting Process
Leverage resources and knowledge

19
Appendix

20
Matched vs. Mismatched Duration
If the goal is to manage the business through maximizing the economic surplus,
Choice of duration: matched or mismatched
• A duration mismatched method is recommended, as it provides maximum accumulated economic surplus. In fact, a naked position is even more desired.
Choice of liability discounting rate: dependent on or independent of assets backing liabilities
• Regardless of the choice of duration, results suggest that the liabilities’ discount rate should be dependent on the assets backing them
The choice of duration methodology is ultimately dependent on how the business is managed

21
Dependent vs. Independent Discount Rate
Choice of duration: matched or mismatched
• A matched duration (assuming values of assets and liabilities are equal) is desired as it lowers the standard deviation of hedge errors
Choice of liability discounting rate: dependent on or independent of assets backing liabilities• A discount rate that is dependent on the
assets backing the liabilities method is recommended, as it produces the lowest standard deviation of hedge errors
• discounting liabilities independent of the asset backing them could result in inappropriate investment
The choice of duration methodology is ultimately dependent on how the business is managed
• With the difference being that market yields of assets are used in place of book yields
• Consistent with market value of liabilities calculation under some international accounting regimes
Generally consistent with CFT method:

22
The objective of ALM framework needs to be refined to achieve an alignment with senior leadership’s expectation
If the objective is to maximize surplus using a risk/reward approach Use efficient frontier (EF) to set Target Asset Duration (TAD) Monitor DV01 and change in surplus under stress environments
If the objective is to minimize surplus volatility Align discounting of liabilities with those of assets Set Target duration to achieve DV01 and stress level tolerances
Is there a happy medium to address the above concerns?
Ultimately ALM metrics provided to the Investment team need to line up with ALM paradigm that aligns with pricing

23
© 2016 Moody’s Analytics, Inc. and/or its licensors and affiliates (collectively, “MOODY’S”). All rights reserved.
ALL INFORMATION CONTAINED HEREIN IS PROTECTED BY LAW, INCLUDING BUT NOT LIMITED TO, COPYRIGHT LAW, AND NONE OF SUCH INFORMATION MAY BE COPIED OR OTHERWISE REPRODUCED, REPACKAGED, FURTHER TRANSMITTED, TRANSFERRED, DISSEMINATED, REDISTRIBUTED OR RESOLD, OR STORED FOR SUBSEQUENT USE FOR ANY SUCH PURPOSE, IN WHOLE OR IN PART, IN ANY FORM OR MANNER OR BY ANY MEANS WHATSOEVER, BY ANY PERSON WITHOUT MOODY’S PRIOR WRITTEN CONSENT.
All information contained herein is obtained by MOODY’S from sources believed by it to be accurate and reliable. Because of the possibility of human or mechanical error as well as other factors, however, all information contained herein is provided “AS IS” without warranty of any kind. Under no circumstances shall MOODY’S have any liability to any person or entity for (a) any loss or damage in whole or in part caused by, resulting from, or relating to, any error (negligent or otherwise) or other circumstance or contingency within or outside the control of MOODY’S or any of its directors, officers, employees or agents in connection with the procurement, collection, compilation, analysis, interpretation, communication, publication or delivery of any such information, or (b) any direct, indirect, special, consequential, compensatory or incidental damages whatsoever (including without limitation, lost profits), even if MOODY’S is advised in advance of the possibility of such damages, resulting from the use of or inability to use, any such information. The ratings, financial reporting analysis, projections, and other observations, if any, constituting part of the information contained herein are, and must be construed solely as, statements of opinion and not statements of fact or recommendations to purchase, sell or hold any securities.
NO WARRANTY, EXPRESS OR IMPLIED, AS TO THE ACCURACY, TIMELINESS, COMPLETENESS, MERCHANTABILITY OR FITNESS FOR ANY PARTICULAR PURPOSE OF ANY SUCH RATING OR OTHER OPINION OR INFORMATION IS GIVEN OR MADE BY MOODY’S IN ANY FORM OR MANNER WHATSOEVER.
Each rating or other opinion must be weighed solely as one factor in any investment decision made by or on behalf of any user of the information contained herein, and each such user must accordingly make its own study and evaluation of each security and of each issuer and guarantor of, and each provider of credit support for, each security that it may consider purchasing, holding, or selling.
Any publication into Australia of this document is pursuant to the Australian Financial Services License of Moody’s Analytics Australia Pty Ltd ABN 94 105 136 972 AFSL 383569. This document is intended to be provided only to “wholesale clients” within the meaning of section 761G of the Corporations Act 2001. By continuing to access this document from within Australia, you represent to MOODY’S that you are, or are accessing the document as a representative of, a “wholesale client” and that neither you nor the entity you represent will directly or indirectly disseminate this document or its contents to “retail clients” within the meaning of section 761G of the Corporations Act 2001.