1092 the dissolution procedure: development and …
TRANSCRIPT

á1092ñ THE DISSOLUTION PROCEDURE: DEVELOPMENT ANDVALIDATION
Change to read:
INTRODUCTION
Purpose
This chapter provides a comprehensive approach covering items to consider for developing and validating dissolutionprocedures and the accompanying analytical procedures. It addresses the use of automation throughout the test and providesguidance and criteria for validation. It also addresses the treatment of the data generated and the interpretation of acceptancecriteria for immediate- and modified-release solid oral dosage forms.
Scope
This chapter addresses the development and validation of dissolution procedures, with a focus on solid oral dosage forms.Many of the concepts presented, however, may be applicable to other dosage forms and routes of administration. ▲For productscontaining more than a single active ingredient, develop and validate the method(s) for each active ingredient.▲ (USP 1-Dec-2020)General recommendations are given with the understanding that modifications of the apparatus and procedures as given inUSP general chapters need to be justified.
The organization of this chapter follows the sequence of actions often performed in the development and validation of adissolution test. The sections appear in the following sequence.
1. PRELIMINARY ASSESSMENT (FOR EARLY STAGES OF PRODUCT DEVELOPMENT/DISSOLUTION METHODDEVELOPMENT)
1.1 Performing Filter Compatibility1.2 Determining Solubility and Stability of Drug Substance in Various Media
▲1.2.1 Solubility1.2.2 Stability▲ (USP 1-Dec-2020)
1.3 Choosing a Medium and Volume1.4 Choosing an Apparatus
2. METHOD DEVELOPMENT2.1 Deaeration2.2 Sinkers2.3 Agitation2.4 Study Design
2.4.1 Time Points2.4.2 Observations2.4.3 Sampling2.4.4 Cleaning
2.5 Data Handling2.6 Dissolution Procedure Assessment
3. ANALYTICAL FINISH3.1 Sample Processing3.2 Filters3.3 Centrifugation3.4 Analytical Procedure3.5 Spectrophotometric Analysis3.6 ▲Chromatography▲ (USP 1-Dec-2020)
4. AUTOMATION4.1 Medium Preparation4.2 Sample Introduction and Timing4.3 Sampling and Filtration4.4 Cleaning4.5 Operating Software and Computation of Results4.6 Common Deviations from the Compendial Procedures that May Require Validation
5. VALIDATION5.1 Specificity/Placebo Interference5.2 Linearity and Range5.3 Accuracy/Recovery
1
Printed on: Fri May 14 2021, 10:23:39 AM(EST)
Official Status: Currently Official on 14-May-2021 DocId: 1_GUID-CE0902BA-77AC-422D-8BF0-A221B5DE6012_5_en-US
Printed by: Deborah Nishikawa Official Date: Official as of 01-Dec-2020 Document Type: GENERAL CHAPTER @2021 USPC
https://online.uspnf.com/uspnf/document/1_GUID-CE0902BA-77AC-422D-8BF0-A221B5DE6012_5_en-US 1/23
Officia
l

5.4 Precision5.4.1 Repeatability of Analysis5.4.2 Intermediate Precision/Ruggedness5.4.3 Reproducibility
5.5 Robustness5.6 Stability of Standard and Sample Solutions5.7 Considerations for Automation
6. ACCEPTANCE CRITERIA6.1 Immediate-Release Dosage Forms6.2 Delayed-Release Dosage Forms6.3 Extended-Release Dosage Forms6.4 Multiple Dissolution Tests6.5 Interpretation of Dissolution Results
6.5.1 Immediate-Release Dosage Forms6.5.2 Delayed-Release Dosage Forms6.5.3 Extended-Release Dosage Forms
REFERENCES
Change to read:
1. PRELIMINARY ASSESSMENT (FOR EARLY STAGES OF PRODUCT DEVELOPMENT/DISSOLUTION METHOD DEVELOPMENT)
Before method development can begin, it is important to characterize the ▲drug substance▲ (USP 1-Dec-2020) so that the filter,▲dissolution▲ (USP 1-Dec-2020) medium, volume of medium, and apparatus can be chosen properly in order to evaluate theperformance of the dosage form. ▲Throughout the chapter, it is assumed that the drug substance is the analyte, unless otherwisestated. The analyte is the compound whose concentration is being measured. In some cases, however, the analyte may be adegradation product or a derivatized product whose concentration is reflective of the dissolution rate of the drugsubstance.▲ (USP 1-Dec-2020)
1.1 Performing Filter Compatibility
Filtration is a key sample preparation step in achieving accurate test results. The purpose of filtration is to remove undissolveddrug and excipients from the withdrawn solution. If not removed from the sample solution, particles of the drug ▲substance may▲ (USP 1-Dec-2020) continue to dissolve and can bias the results. Therefore, filtering the dissolution samples is usually necessaryand should be done immediately if the filter is not positioned on the cannula.
Filtration also removes insoluble excipients that may otherwise interfere with the analytical finish. Selection of the properfilter material is important and should be accomplished, and experimentally justified, early in the development of the dissolutionprocedure. Important characteristics to consider when choosing a filter ▲▲ (USP 1-Dec-2020) are ▲material,▲ (USP 1-Dec-2020) type, filtersize, and pore size. The filter that is selected based on evaluation during the early stages of dissolution procedure developmentmay need to be reconsidered at a later time point. Requalification ▲may need▲ (USP 1-Dec-2020) to be considered after a changein composition of the drug product ▲or dissolution medium▲ (USP 1-Dec-2020) or ▲after▲ (USP 1-Dec-2020) changes in the quality of theingredients ▲either of the drug product or the dissolution medium.▲ (USP 1-Dec-2020)
Examples of filters used in dissolution testing can be cannula filters, filter disks or frits, filter tips, or syringe filters. The filtermaterial ▲should▲ (USP 1-Dec-2020) be compatible with the media and the drug ▲substance.▲ (USP 1-Dec-2020) Common pore sizes rangefrom 0.20 to 70 µm, however, filters of other pore sizes ▲(such as 0.02 μm for nanomaterials)▲ (USP 1-Dec-2020) can be used asneeded. ▲In addition to pore size, filter design may affect effective particle size exclusion.▲ (USP 1-Dec-2020) If the drug substanceparticle size is very small (e.g., micronized or nanoparticles), it can be challenging to find a filter pore size that excludes thesesmall particles. ▲Consider ways to verify that drug particles have not passed through the filter.▲ (USP 1-Dec-2020)
Adsorption of the ▲drug substance(s)▲ (USP 1-Dec-2020) by the filter may occur and needs to be evaluated. Filter materials willinteract with dissolution media to affect the recovery of the individual solutes and must be considered on a case-by-case basis.Different filter materials exhibit different drug-binding properties. Percentage of drug loss from the filtrate due to binding maybe dependent on the drug concentration. Therefore the adsorptive interference should be evaluated on sample solutions atdifferent concentrations bracketing the expected concentration range. Where the drug adsorption is saturable, discarding aninitial volume of filtrate may allow the collection of a subsequent solution that approaches the original solution concentration.Alternative filter materials that minimize adsorptive interference can usually be found. Prewetting of the filter with the mediummay be necessary. In addition, it is important that leachables from the filter do not interfere with the ▲analyte.▲ (USP 1-Dec-2020)
This ▲condition▲ (USP 1-Dec-2020) can be evaluated by analyzing the filtered dissolution medium and comparing it with the unfilteredmedium.
The filter size should be based on the volume to be withdrawn and the amount of particles to be separated. Use of the▲appropriate▲ (USP 1-Dec-2020) filter dimensions will improve throughput and recovery, and also reduce clogging. Use of a largefilter for small-volume filtration can lead to loss of sample through hold-up volume, whereas filtration through small filter sizesneeds higher pressures and longer times, and the filters can clog quickly.
Filters used for USP Apparatus 4 need special attention because they are integrated in the flow-through process. Undissolvedparticles may deposit on the filters, creating resistance to the flow.
2
Printed on: Fri May 14 2021, 10:23:39 AM(EST)
Official Status: Currently Official on 14-May-2021 DocId: 1_GUID-CE0902BA-77AC-422D-8BF0-A221B5DE6012_5_en-US
Printed by: Deborah Nishikawa Official Date: Official as of 01-Dec-2020 Document Type: GENERAL CHAPTER @2021 USPC
https://online.uspnf.com/uspnf/document/1_GUID-CE0902BA-77AC-422D-8BF0-A221B5DE6012_5_en-US 2/23
Officia
l

In the case of automated systems, selection of the filter with regard to material and pore size can be done in a similar mannerto manual filtration. Flow rate through the filter and clogging may be critical for filters used in automated systems. Experimentalverification that a filter is appropriate may be accomplished by comparing the responses for filtered and unfiltered standardand sample solutions. ▲The acceptable recovery range for a filtered standard or sample solution when compared with theunfiltered solutions needs to be assessed.▲ (USP 1-Dec-2020) This is done by first preparing a suitable standard solution and a samplesolution. For example, prepare a typical dissolution sample in a beaker and stir vigorously with a magnetic stirrer to dissolvethe drug load completely. For standard solutions, compare the results for filtered solutions (after discarding the appropriatevolume) to those for the unfiltered solutions. For sample solutions, compare the results for filtered solutions (after discardingthe appropriate volume) to those for centrifuged, unfiltered solutions. ▲The qualified filter (types, pore size, filter size, etc.)should be recorded in detail as part of standard and sample preparation as the method is finalized.▲ (USP 1-Dec-2020)
1.2 Determining Solubility and Stability of Drug Substance in Various Media
▲1.2.1 SOLUBILITY▲ (USP 1-Dec-2020)
Physical and chemical characteristics of the drug substance need to be determined as part of the process of selecting theproper dissolution medium. When deciding the composition of the medium for dissolution testing, it is important to evaluatethe influence of buffers, pH, and if needed, different surfactants on the solubility and stability of the drug substance. Solubilityof the drug substance is usually evaluated by determining the saturation concentration of the drug in different media at 37°using the shake-flask solubility method (equilibrium solubility, ▲see Solubility Measurements á1236ñ).▲ (USP 1-Dec-2020) To level outpotential ion effects between the drug substance and the buffers used in the media, mixtures of hydrochloric acid and sodiumhydroxide are used to perform solubility investigations; this is in addition to the typical buffer solutions. In certain cases, it maybe necessary to evaluate the solubility of the drug substance at temperatures other than 37° (i.e., 25°). The pH of the clearsupernatant should be checked to determine whether the pH changes during the solubility test. Alternative approaches forsolubility determination may also be used ▲(such as dynamic solubility, potentiometric titration, or turbidity measurementmethods).▲ (USP 1-Dec-2020)
Typical media for dissolution may include the following (not listed in order of preference): diluted hydrochloric acid, buffers(phosphate or acetate) in the pH range of 1.2–▲7.2,▲ (USP 1-Dec-2020) simulated gastric or intestinal fluid (with or without enzymes),and water. For some ▲drug substances,▲ (USP 1-Dec-2020) incompatibility of the drug ▲substance▲ (USP 1-Dec-2020) with certain buffersor salts may influence the choice of buffer. The ▲concentration▲ (USP 1-Dec-2020) of the buffers and acids used can influence thesolubilizing effect, and this factor may be evaluated.
Aqueous solutions (acidic or buffer solutions) may contain a ▲▲ (USP 1-Dec-2020) surfactant ▲▲ (USP 1-Dec-2020) to enhance thesolubility of the drug substance. The surfactants selected for the solubility investigations should cover all common surfactanttypes, i.e., anionic, nonionic, and cationic. When a suitable surfactant has been identified, different concentrations of thatsurfactant should be investigated to identify the lowest concentration needed to achieve sink conditions. Typically, the surfactantconcentration is above its critical micellar concentration (CMC). Table 1 shows a list of some of the surfactants used in dissolutionmedia. Approximate CMC values are provided with references when available. ▲CMC values are dependent on medium andtemperature.▲ (USP 1-Dec-2020) The list is not comprehensive and is not intended to exclude surfactants that are not listed. Othersubstances, such as hydroxypropyl β-cyclodextrin, have been used as dissolution media additives to enhance dissolution of▲compounds with low solubility.▲ (USP 1-Dec-2020) The US FDA ▲and USP▲ (USP 1-Dec-2020) maintain databases of dissolution methods,including information on dissolution media that have been used (1▲,2). Ideally,▲ (USP 1-Dec-2020) the amount of surfactant addedis sufficient to achieve sink conditions in the desired volume of dissolution medium ▲(see 1.3 Choosing a Medium and Volumefor discussion of sink conditions). With some formulations, the use of surfactant concentrations that produce less than sinkconditions may be more suitable. Appropriate surfactant concentration is formulation dependent and should be verified bytesting the formulation.▲ (USP 1-Dec-2020)
It is important to control the grade and purity of surfactants because use of different grades could affect the solubility of thedrug. For example, sodium dodecyl sulfate (SDS) is available in both a technical grade and a high-purity grade. Obtainingpolysorbate 80 from different sources can affect its suitability when performing HPLC analysis.
There may be effects of counter-ions or pH on the solubility or solution stability of the surfactant solutions. For example, aprecipitate forms when the potassium salt of the phosphate buffer is used at a concentration of 0.5 M in combination with SDS.This can be avoided by using the sodium phosphate salt when preparing media with SDS.
Table 1. Commonly Used Surfactants with Critical Micelle Concentrations
SurfactantCMC
(% wt/volume) Reference
Anionic
SDS; sodium lauryl sulfate(SLS) 0.18–0.23 (3–5)
Taurocholic acid sodium salt 0.2 (4)
Cholic acid sodium salt 0.16 (4)
Desoxycholic acid sodium salt 0.12 (4)
Cationic
Cetyltrimethyl ammoniumbromide (CTAB,Hexadecyltrimethylammoni-um bromide)
0.033–0.036(0.92–1.0 mM) (6.7)
Benzethonium chloride (Hya-mine 1622) 0.18 (4 mM) (3)
3
Printed on: Fri May 14 2021, 10:23:39 AM(EST)
Official Status: Currently Official on 14-May-2021 DocId: 1_GUID-CE0902BA-77AC-422D-8BF0-A221B5DE6012_5_en-US
Printed by: Deborah Nishikawa Official Date: Official as of 01-Dec-2020 Document Type: GENERAL CHAPTER @2021 USPC
https://online.uspnf.com/uspnf/document/1_GUID-CE0902BA-77AC-422D-8BF0-A221B5DE6012_5_en-US 3/23
Officia
l

Table 1. Commonly Used Surfactants with Critical Micelle Concentrations (continued)
SurfactantCMC
(% wt/volume) Reference
Nonionic
Polysorbate 20 (Polyoxyethy-lene (20) sorbitanmonolaurate, Tween 20) 0.07–0.09 (4,8)
Polysorbate 80 (Polyoxyethy-lene (20) sorbitanmonooleate, Tween 80) 0.02–0.08 (4,8)
Caprylocaproyl polyoxyl-8glycerides (Labrasol) 0.01 (5)
Polyoxyl 35 castor oil (Cremo-phor EL) 0.02 (9)
Polyoxyethylene 23 laurylether (Brij 35) 0.013 (10)
Octoxinol (Triton X-100) 0.01–0.03 (4,11)
ZwitterionLauryldimethylamine N-oxide(LDAO) 0.023 (12)
Routinely, the dissolution medium is buffered; however, the use of purified water as the dissolution medium is suitable forproducts with a dissolution behavior independent of the pH of the medium. There are several reasons why purified water maynot be preferred. The water quality can vary depending on its source, and the pH of the water is not as strictly controlled asthe pH of buffer solutions. Additionally, the pH can vary from day to day and can also change during the run, depending onthe drug substance and excipients. Use of an aqueous–organic solvent mixture as a dissolution medium is discouraged; however,with proper justification this type of medium may be acceptable.
▲1.2.2 STABILITY
Investigations of the stability of the drug substance should be carried out in the selected dissolution medium alone and withexcipients present, at 37°. This elevated temperature has the potential to increase degradation. Stability should allow forsufficient time to complete or repeat the analytical procedure. In some cases, antioxidants may be used in the dissolutionmedium to improve the chemical stability of the drug substance in the dissolution medium.
The solution containing the drug substance is stored under conditions that ensure stability. The stability of this solution isanalyzed over a specified period of time (for at least the time of the entire dissolution procedure), using a freshly preparedsolution at each time interval for comparison. The acceptable range for solution stability is influenced by the drug concentrationand is typically between 98% and 102% of the expected final concentration.
The solution containing the drug substance in the presence of excipients is typically stored at room temperature. This solutionis analyzed over a specified period of time, using the original solution response for comparison. The typical acceptable rangefor solution stability may be between 98% and 102%, compared with the initial analysis of the solutions. If the solution is notstable, aspects to consider include temperature (refrigeration may be needed), light protection, and container material (plasticor glass). If degradation still occurs, refer to 3.4 Analytical Procedure for guidance on quantification of the drug substance anddegradation products.
The procedure may state that the solutions need to be analyzed within a time period demonstrating acceptable solutionstability.
Physical stability of the sample solution also may be of concern; any modifications should be justified. Precipitation may occurbecause of lower solubility at room temperature than at the temperature of the dissolution test.▲ (USP 1-Dec-2020)
1.3 Choosing a Medium and Volume
When developing a dissolution procedure, one goal is to have sink conditions, which are defined as having a volume ofmedium ▲(V) at least three times the volume required to form a saturated solution (Vsat) of the drug substance; that is, V/Vsat ≥3. On the other hand, if the V/Vsat ratio is too large, the dissolution test may not detect critical changes in the formulation andmanufacturing process. When the medium and volume chosen provide proper sink conditions, it is more likely that dissolutionresults will reflect the properties of the dosage form and will be able to discriminate between an acceptable and an unacceptablebatch. A medium that fails to provide sink conditions (V/Vsat < 3) may be acceptable if it is appropriately justified (see 1.2.1Solubility). The composition and volume of dissolution medium are guided by the solubility investigations. For example, thechoice and concentration of a surfactant needs to be justified from the solubility data and the dissolution profiles of the productcandidates. Appropriate surfactant concentration in the dissolution medium is formulation dependent and should be verifiedby testing the formulation. When the solid form of the drug substance is modified, typically to enhance solubility (e.g.,amorphous solid dispersion or modified crystal form), re-evaluate the solubility of the processed material in the proposeddissolution medium.▲ (USP 1-Dec-2020)
The use of enzymes in the dissolution medium is permitted, in accordance with Dissolution á711ñ, when dissolution failuresoccur as a result of cross-linking with gelatin capsules or gelatin-coated products. A discussion of the phenomenon ofcross-linking and method development using enzymes can be found in Capsules—Dissolution Testing and Related QualityAttributes á1094ñ. Validation should be performed with the method using enzymes according to 5. Validation.
Another option is to use media that follow more closely the composition of fluids in the stomach and intestinal tract. Thesemedia may contain physiological surface-active ingredients, such as taurocholates. The media also may contain emulsifiers
4
Printed on: Fri May 14 2021, 10:23:39 AM(EST)
Official Status: Currently Official on 14-May-2021 DocId: 1_GUID-CE0902BA-77AC-422D-8BF0-A221B5DE6012_5_en-US
Printed by: Deborah Nishikawa Official Date: Official as of 01-Dec-2020 Document Type: GENERAL CHAPTER @2021 USPC
https://online.uspnf.com/uspnf/document/1_GUID-CE0902BA-77AC-422D-8BF0-A221B5DE6012_5_en-US 4/23
Officia
l
(lecithin) and components such as saline solution that increase osmolality. Also, the ionic strength or molarity of the buffersolutions may be ▲adjusted.▲ (USP 1-Dec-2020) The media are designed to represent the fed and fasted state in the stomach andsmall intestine. These media may be very useful in modeling in vivo dissolution behavior of immediate-release (IR) dosage forms,in particular those containing lipophilic drug substances, and may help in understanding the dissolution kinetics of the productrelated to the physiological make-up of the digestive fluids. Results of successful modeling of dissolution kinetics have beenpublished, mainly for IR products. In the case of extended-release dosage forms with reduced effect of the drug substance ondissolution behavior, the use of such media needs to be evaluated differently. In vitro performance testing does not necessarilyrequire media modeling the fasted and postprandial states (13,14).
An acid stage is part of the testing of delayed-release products by Dissolution á711ñ, Procedure, Apparatus 1 and Apparatus 2,Delayed-Released Dosage Forms, Method A or Delayed-Released Dosage Forms, Method B. For drug ▲substances▲ (USP 1-Dec-2020) with▲solubility in acidic media▲ (USP 1-Dec-2020) less than 10% of the label claim or ▲those that degrade in acidic media,▲ (USP 1-Dec-2020)the usefulness of the acid stage in detecting a coating failure is compromised. This would be handled on a case-by-case basis.Possible resolutions include the addition of surfactant to the acid stage, or adjustment of the specifications ▲(see 6.5.2Delayed-Release Dosage Forms).▲ (USP 1-Dec-2020)
During selection of the dissolution medium, care should be taken to ensure that the drug substance is suitably stablethroughout the analysis. ▲For compounds that rapidly degrade to form a stable degradation product, monitoring thedegradation product alone or in combination with a drug substance may be more suitable than analyzing only the drugsubstance. Refer to 3.4 Analytical Procedure.▲ (USP 1-Dec-2020)
For compendial Apparatus 1 (basket) and Apparatus 2 (paddle), the volume of the dissolution medium can vary from 500 to1000 mL. Usually, the volume needed for the dissolution test can be determined in order to maintain sink conditions. In somecases, the volume can be increased to between 2 and 4 L, using larger vessels and depending on the concentration and sinkconditions of the drug; justification for this approach is expected. In practice, the volume of the dissolution medium is usuallymaintained within the compendial range given above. Alternatively, it may be preferable to switch to other compendialapparatus, such as a reciprocating cylinder (Apparatus 3), reciprocating holder (Apparatus 7), or flow-through cell (Apparatus4). Certain applications may require low volumes of dissolution media (e.g., 100–200 mL) when the use of a paddle or basketis preferred. In these cases, an alternative, noncompendial apparatus (e.g., small-volume apparatus) may be used.
1.4 Choosing an Apparatus
The choice of apparatus is based on knowledge of the formulation design and the practical aspects of dosage formperformance in the in vitro test system. In general, a compendial apparatus should be selected.
For solid oral dosage forms, Apparatus 1 and Apparatus 2 are used most frequently. When Apparatus 1 or Apparatus 2 is notappropriate, another official apparatus may be used. Apparatus 3 (reciprocating cylinder) has been found especially useful forchewable tablets, soft gelatin capsules, delayed-release dosage forms, and nondisintegrating-type products, such as coatedbeads. Apparatus 4 (flow-through cell) may offer advantages for modified-release dosage forms and immediate-release dosageforms that contain active ingredients with limited solubility. In addition, Apparatus 4 may have utility for multiple dosage formtypes such as soft gelatin capsules, beaded products, suppositories, or depot dosage forms, as well as suspension-typeextended-release dosage forms. Apparatus 5 (paddle over disk) and Apparatus 6 (rotating cylinder) are useful for evaluatingand testing transdermal dosage forms. Apparatus 7 (reciprocating holder) has application to non-disintegrating, oralmodified-release dosage forms, stents, and implants, as well as transdermal dosage forms. For semisolid dosage forms, thegenerally used apparatus include the vertical diffusion cell, immersion cell, and flow-through cell apparatus with the insert fortopical dosage forms (see Semisolid Drug Products—Performance Tests á1724ñ).
Some changes can be made to the compendial apparatus; for example, a basket mesh size other than the typical 40-meshbasket (e.g., 10-, 20-, or 80-mesh) may be used when the need is clearly documented by supporting data. Care must be takenthat baskets are uniform and meet the dimensional requirements specified in á711ñ.
A noncompendial apparatus may have some utility with proper justification, qualification, and documentation of superiorityover the standard equipment. For example, a small-volume apparatus with mini paddles and baskets may be considered forlow-dosage strength products. A rotating bottle or dialysis tubes may have utility for microspheres and implants,▲apex▲ (ERR 1-Dec-2020) vessels ▲may be useful to eliminate coning (mounding of material at the bottom of the vessel),▲ (USP 1-Dec-2020)
and modified flow-through cells ▲may be useful▲ (USP 1-Dec-2020) for special dosage forms including powders and stents.
Change to read:
2. METHOD DEVELOPMENT
A properly designed test should yield data that are not highly variable, and ▲ideally▲ (USP 1-Dec-2020) should be free of significantstability problems. High variability in the results can make it difficult to identify trends or effects of formulation changes. ▲Thenumber of dosage units tested▲ (USP 1-Dec-2020) can affect the observed variability. One guidance defines dissolution results ashighly variable if the relative standard deviation (RSD) is more than 20% at time points of 10 min or less and more than 10%at later time points for ▲12 dosage units tested (15).▲ (USP 1-Dec-2020) Most dissolution results, however, exhibit less variability. Inthe development of a dissolution procedure the source of the variability should be investigated, and attempts should be madeto reduce variability whenever possible. The two most likely causes are the formulation itself (e.g., drug substance, excipients,or manufacturing process) or artifacts associated with the test procedure (e.g., coning, tablets sticking to the vessel wall orbasket screen). Visual observations are often helpful for understanding the source of the variability and whether the dissolutiontest itself is contributing to the variability. Any time the dosage contents do not disperse freely throughout the vessel in a uniformfashion, aberrant results can occur. Depending on the problem, the usual remedies include changing any of the followingfactors: the apparatus type, speed of agitation, level of deaeration, sinker type, or composition of the medium.
5
Printed on: Fri May 14 2021, 10:23:39 AM(EST)
Official Status: Currently Official on 14-May-2021 DocId: 1_GUID-CE0902BA-77AC-422D-8BF0-A221B5DE6012_5_en-US
Printed by: Deborah Nishikawa Official Date: Official as of 01-Dec-2020 Document Type: GENERAL CHAPTER @2021 USPC
https://online.uspnf.com/uspnf/document/1_GUID-CE0902BA-77AC-422D-8BF0-A221B5DE6012_5_en-US 5/23
Officia
l

Many causes of variability can be found in the formulation and manufacturing process. For example, poor content uniformity,process inconsistencies, excipient interactions or interference, ▲▲ (USP 1-Dec-2020) coating, capsule shell aging, and hardening orsoftening of the dosage form ▲during storage▲ (USP 1-Dec-2020) may be sources of variability and interferences.
2.1 Deaeration
The significance of deaeration of the dissolution medium should be determined because air bubbles can act as a barrier tothe dissolution process if present on the dosage unit or basket mesh and can adversely affect the reliability of the test results.Furthermore, bubbles can cause particles to cling to the apparatus and vessel walls. Bubbles on the dosage unit may increasebuoyancy, leading to an increase in the dissolution rate, or may decrease the available surface area, leading to a decrease inthe dissolution rate. ▲Low-solubility drug substances▲ (USP 1-Dec-2020) are most sensitive to interference from air bubbles; therefore,deaeration may be needed when testing these types of products. A deaeration method is described in ▲footnote 5▲ (USP 1-Dec-2020)in Dissolution á711ñ, Procedure. Typical steps include heating the medium, filtering, and drawing a vacuum for a short periodof time. Other methods of deaeration are available and are in routine use throughout the industry. Once a suitable deaerationprocess is identified, it should be documented as part of the dissolution procedure. The extent of deaeration can be evaluatedby measuring the total dissolved gas pressure or by measuring the concentration of dissolved oxygen in water. For example,an oxygen concentration below 6 mg/L has been found effective as a marker for adequate deaeration of water for Dissolutioná711ñ, Apparatus, Apparatus Suitability, Performance verification test with USP Prednisone Tablets RS.
▲Typically,▲ (USP 1-Dec-2020) media containing surfactants usually are not deaerated because the process results in ▲foaming,and because▲ (USP 1-Dec-2020) the effect of dissolved air on the dissolution process is ▲usually▲ (USP 1-Dec-2020) mitigated by the reducedsurface tension of the medium. Sometimes, deaerating the medium before adding surfactants can be effective.
To determine whether deaeration of the medium is necessary, compare results from dissolution samples run in non-deaeratedmedium and medium deaerated using a compendial technique, as described above ▲(see footnote 5 in á711ñ).▲ (USP 1-Dec-2020)If no effect of deaeration is detected, this experiment could serve as justification that deaeration is not required in the future.If there is an effect, however, then it is necessary to carefully control this parameter, and ▲validate the deaeration process asdescribed in footnote 5 in á711ñ and 5.5 Robustness.▲ (USP 1-Dec-2020) The dissolved gas content of deaerated media underatmospheric pressure is unstable and will tend toward saturation. Manipulation of the deaerated medium such as stirring orpouring can increase the rate at which atmospheric gases are redissolved.
2.2 Sinkers
Sinkers are often used to adjust the buoyancy of dosage forms that would otherwise float during testing with Apparatus 2.When sinkers are used, a detailed description of the sinker must be provided in the written procedure. It may be useful toevaluate different sinker types, recognizing that sinkers can significantly influence the dissolution ▲behavior▲ (USP 1-Dec-2020) of adosage unit. When transferring the procedure, the same sinkers should be used, or if a different design is used, it should beshown to produce equivalent results. There are several types of commercially available sinkers. A harmonized sinker isdescribed in Dissolution á711ñ, Figure 2a.
A standard sinker can be made by using the appropriate length of wire and coiling it around a cylinder. For materials, use316 stainless steel wire, typically 0.032 inch/20 gauge, or other inert material, and wind the wire around cylinders of appropriatediameter (e.g., cork borers) for an appropriate number of turns to fit the ▲tablet or▲ (USP 1-Dec-2020) capsule shell type. Sizes areshown in Table 2. The ends of the coil can be curved to retain the ▲tablet or▲ (USP 1-Dec-2020) capsule within the sinker when theyare immersed. Because the ends of the wire may be rough, they may need to be filed. If the sinker is handmade, the sinkermaterial and construction procedure instructions should be documented (e.g., dimension, design, number of coils); if acommercial sinker is used, the vendor part number should be reported if available.
Table 2. Wire Sinkers Used With Common Capsule Shell Sizes
Capsule Shell SizeLength of Wire
(cm)Diameter Size
(cm) Cork Bore Number
#0, elongated 12 0.8 4
#1 and #2 10 0.7 3
#3 and #4 8 0.55 2
Although sinkers are typically used to keep the dosage form at the bottom of the vessel, they can also be used to keep dosageforms from sticking to the vessel (e.g., film-coated tablets). The sinker should be appropriate to the dosage form; therefore, thesame sinker size may not be suitable for all dosage-form sizes. The sinker should not be too tight around the dosage formbecause this may restrict interaction with the medium. Conversely, if wrapped too loosely, the dosage form may escape soonafter the test begins. The sinker should be small enough that the capsule does not change its orientation within the sinker. Careshould be taken when testing capsules that have some cross-linking present, to keep the sticky shell from attaching to the vesselbottom. In this case, the harmonized sinker design provided in Dissolution á711ñ, Figure 2a will be advantageous.
2.3 Agitation
For immediate-release capsule or tablet formulations, Apparatus 1 (baskets) at 50–100 rpm or Apparatus 2 (paddles) at 50 or75 rpm are commonly used. Other agitation speeds are acceptable with appropriate justification. Rates outside 25–150 rpmfor both the paddle and the basket are usually not appropriate because of mixing inconsistencies that can be generated bystirring too slow or too fast. Agitation rates between 25 and 50 rpm are generally acceptable for suspensions.
6
Printed on: Fri May 14 2021, 10:23:39 AM(EST)
Official Status: Currently Official on 14-May-2021 DocId: 1_GUID-CE0902BA-77AC-422D-8BF0-A221B5DE6012_5_en-US
Printed by: Deborah Nishikawa Official Date: Official as of 01-Dec-2020 Document Type: GENERAL CHAPTER @2021 USPC
https://online.uspnf.com/uspnf/document/1_GUID-CE0902BA-77AC-422D-8BF0-A221B5DE6012_5_en-US 6/23
Officia
l

For dosage forms that exhibit coning (mounding) under the paddle at 50 rpm, the coning can be reduced by increasing thepaddle speed to 75 rpm, thus reducing the artifact and ▲reducing variability in▲ (USP 1-Dec-2020) the data. If justified, 100 rpmmay be used with Apparatus 2, especially for extended-release products. Decreasing or increasing the apparatus rotation speedmay be justified if to achieve an in vitro–in vivo correlation (IVIVC) the resulting profiles better reflect in vivo performance, orif the method results in better discrimination without adversely affecting method variability.
Apparatus 3 (reciprocating cylinder) can be used at dip rates ranging from 5 to 30 dips/min. The hydrodynamics areinfluenced by the cylinder’s reciprocating motion and the resulting movement of the sample in the medium. The reciprocatingmotion of the cylinder and screen may cause foaming if the medium contains surfactants. Addition of an anti-foaming agentsuch as simethicone or n-octanol may be useful for avoiding foaming from surfactants.
Apparatus 4 (flow-through cell) is described in á711ñ with standard flow rates of 4, 8, and 16 mL/min. Other flow rates forApparatus 4 can be used if justified and if within the capacity of the pump to conform with the requirements in á711ñ. Agitationin Apparatus 4 is not only related to the pump speed but can also be affected by cell diameter. At a set flow rate, as measuredby volume, the 12-mm cell will develop a greater linear fluid velocity than is achieved in the 22.6-mm cell. Apparatus 4 can beconfigured with the addition of glass beads in the entry cone of the flow-through cell (packed column) or without glass beads(open column).
The flow characteristics of the flow-through cell are discussed in the scientific literature (16). The placement of the samplein the flow-through cell will influence the flow patterns that occur and thus should be a consideration in the attempt to reducevariability of the results.
2.4 Study Design
Selection of the agitation rate and other study design elements for the dosage form, whether immediate release or modifiedrelease, should conform to the requirements and specifications (i.e., apparatus, procedures, and interpretation) given in á711ñ.
2.4.1 TIME POINTS
For immediate-release dosage forms, the duration of the dissolution procedure is typically ▲15▲ (USP 1-Dec-2020)–60 min; in mostcases, a single time point specification is adequate for pharmacopeial purposes. For method development, however, a sufficientnumber of time points should be selected to adequately characterize the ascending and plateau phases of the dissolution curve.Industrial and regulatory concepts of product comparability and performance may require additional time points, which mayalso be required for product registration or approval. ▲▲ (USP 1-Dec-2020) Very rapidly dissolving products need not be subjectedto a profile comparison if they can be shown to release 85% or more of the drug substance within 15 min ▲(15).▲ (USP 1-Dec-2020)
For these types of products, a one-point test ▲▲ (USP 1-Dec-2020) will suffice. However, most products do not fall into this category.Dissolution profiles of immediate-release products typically show a gradual increase reaching 85%–100% at about 30–45 min.Thus, ▲based on the dissolution profile,▲ (USP 1-Dec-2020) sufficient dissolution time points are chosen to characterize theperformance for most immediate-release products ▲(see 6.1 Immediate-Release Dosage Forms).▲ (USP 1-Dec-2020) For some products,including suspensions, useful information may be obtained from earlier points, e.g., 5–10 min. For slower-dissolving products,time points later than 60 min may be useful. Dissolution test times for compendial tests are usually established on the basis ofan evaluation of the dissolution profile data.
The f2 similarity factor ▲is not▲ (USP 1-Dec-2020) useful when more than 85% is dissolved at 15 min. If the f2 similarity factor is tobe used, ▲for the dissolution test for profile comparison, at least three▲ (USP 1-Dec-2020) time points ▲▲ (USP 1-Dec-2020) are required.▲Specifically, the mean percent dissolved for 12 dosage units tested must be less than or equal to 85% dissolved for at leasttwo time points and no more than▲ (USP 1-Dec-2020) one point above 85% for both products (17). Therefore, the addition of earlytime points may be useful. ▲The use of the f2 similarity factor in the comparison of dissolution profiles is discussed in ▲Assessmentof Solid Oral Drug Product Performance and Interchangeability,▲ (ERR 1-Dec-2020) Bioavailability, Bioequivalence, and Dissolutioná1090ñ.▲ (USP 1-Dec-2020)
For testing an extended-release dosage form, at least three time points are chosen, to guard against dose dumping, to definethe in vitro release profile, and to show that essentially complete release (>80%) of the drug is achieved. Additional samplingtimes may be useful. Certain IVIVC criteria, such as Level B correlation (according to In Vitro and In Vivo Evaluation of DosageForms á1088ñ), require the experimental determination of the time to dissolve 100% of the label claim. Selection of the finaltime points is reflective of the drug release profile data that are generated during development. ▲▲ (USP 1-Dec-2020)
Delayed-release dosage forms usually require specifications for at least two time points; therefore, it is important duringdevelopment to evaluate the entire dissolution profile. In the case of enteric-coated dosage forms, the functionality of thecoating is usually proven by challenge in an acid medium, followed by a demonstration of dissolution in a higher-pH medium.Chapter á711ñ gives a standard buffer medium for that stage of testing but other media may be used if justified. The timing ofthe acid stage is typically 2 h, and release in the buffer is similar to the timing for immediate-release forms. For delayed-releasedosage forms that are not enteric-coated, the setting of specifications is different. ▲▲ (USP 1-Dec-2020) The onset of release is notdetermined by the experimental design, which is the pH change; multivariate specifications, therefore, may be needed to definetime ranges and corresponding percentage ranges.
▲Determining the amount of drug dissolved after vigorous agitation rate and/or long-time interval, also called▲ (USP 1-Dec-2020)
infinity points, can be useful during development studies. To obtain ▲this measurement,▲ (USP 1-Dec-2020) the paddle or basketspeed is increased at the end of the run (after the last time point) for a sustained period (typically, 15–60 min), after which timean additional sample is taken. ▲To verify that dissolution is complete, additional points may be needed.▲ (USP 1-Dec-2020) Althoughthere is no requirement for 100% dissolution in the profile, the infinity point can be compared to content uniformity data andmay provide useful information about formulation characteristics during initial development or about method bias.
7
Printed on: Fri May 14 2021, 10:23:39 AM(EST)
Official Status: Currently Official on 14-May-2021 DocId: 1_GUID-CE0902BA-77AC-422D-8BF0-A221B5DE6012_5_en-US
Printed by: Deborah Nishikawa Official Date: Official as of 01-Dec-2020 Document Type: GENERAL CHAPTER @2021 USPC
https://online.uspnf.com/uspnf/document/1_GUID-CE0902BA-77AC-422D-8BF0-A221B5DE6012_5_en-US 7/23
Officia
l

2.4.2 OBSERVATIONS
Visual observations and recordings of product dissolution and disintegration behavior are useful because dissolution anddisintegration patterns can be indicative of variables in the formulation or manufacturing process. For visual observation, properlighting (with appropriate consideration of photo-degradation) of the vessel contents and clear visibility ▲into thevessel▲ (USP 1-Dec-2020) are essential. Documenting observations by ▲taking photographs or videos and by drawingsketches▲ (USP 1-Dec-2020) can be instructive and helpful for those who are not able to observe the real-time dissolution test.Observations are especially useful during method development and formulation optimization. It is important to recordobservations of all ▲▲ (USP 1-Dec-2020) vessels to determine if the observation is seen in all ▲▲ (USP 1-Dec-2020) vessels, or just a few.▲▲ (USP 1-Dec-2020) Provide any unique observations to the formulator. Examples of typical observations include, but are not limited
to, the following:1. Uneven distribution of particles throughout the vessel. This can occur when particles cling to the sides of the vessel, when
there is coning or mounding directly under the apparatus (e.g., below the basket or paddle), when particles float at thesurface of the medium, when film-coated tablets stick to the vessel, and/or when off-center mounds are formed.
2. Air bubbles on the inside of the vessel or on the apparatus or dosage unit. Sheen on the apparatus is also a sign of airbubbles. This observation would typically be made when assessing the need to deaerate the medium.
3. Dancing or spinning of the dosage unit, or the dosage unit being hit by the paddle.4. Adhesion of particles to the paddle or the inside of the basket, which may be observed upon removal of the stirring device
at the end of the run.5. Pellicles or analogous formations, such as transparent sacs or rubbery, swollen masses surrounding the capsule contents.6. Presence of large floating particles or chunks of the dosage unit, especially at the surface of the media.7. Observation of the disintegration rate (e.g., percentage reduction in size of the dosage unit within a certain time frame).8. Complex disintegration of the coating of modified or enteric-coated products [e.g., the partial opening and splitting
apart (similar to a clamshell) or incomplete opening of the shell], accompanied by the release of air bubbles andexcipients.
9. Whether the dosage form lands in the vessel center or off-center, and if off-center, whether it sticks there.10. Time required for the complete dissolution of the capsule shell or for tablet disintegration.Observations also help to document that the proper procedure has been followed, or more importantly, that a deviation has
occurred. Examples include the confirmation that a dosage ▲unit▲ (USP 1-Dec-2020) is actually in the vessel during the test or thatmore than one dosage ▲unit▲ (USP 1-Dec-2020) are inadvertently in the same vessel, or that a filter from the autosampler has droppedinto the vessel.
2.4.3 SAMPLING
Manual: For manual sampling, use chemically inert devices (e.g., polymeric or glass syringes, and polymeric or stainless steelcannula), a filter, and/or a filter holder. The sampling site must conform to specifications in á711ñ. When the agitation conditionsare very slow, e.g., a 50-rpm basket, care should be taken to sample consistently in the same location in the vessel becausethere may be a concentration gradient; avoid sampling very close to the shaft or vessel wall. During method development, adecision should be made regarding whether to replace the media after each time point. Replacement is not preferred becausethe dosage unit may be disturbed during delivery of the media. However, replacement may be necessary if maintaining sinkconditions is a challenge. With replacement, the volume used in the calculations remains the same throughout the time points,but there is some drug substance withdrawn with each sample that will need to be accounted for in the calculations.
Metal surfaces may interact with the sample. For example, adsorption onto metal surfaces may occur, or the metal surfacesmay release metal ions into aqueous media. The ions can then catalyze degradation reactions, leading to artifacts during theanalytical procedures. The surfaces of stirring elements and metal locks of syringes may be sources of interference to accuratesampling.Autosampling: Autosampling is discussed in 4. Automation.
2.4.4 CLEANING
Importance is placed on evaluation of the cleaning process between tests. Changes of dissolution medium and/or productnecessitate the need for cleaning. Residues on the vessels can affect the results (e.g., adsorbed residues may dissolve and altersubsequent media properties or interfere with the sample analysis), and effective cleaning will return them to a suitable state.Automated systems are discussed in 4.4 Cleaning.
2.5 Data Handling
Dissolution rates are calculated from the change in drug concentration in the dissolution medium. For procedures in whichthe volume of medium is fixed, such as for Apparatus 1 and Apparatus 2 testing of immediate-release dosage forms with onlyone sampling time, the concentration of the sample is multiplied by the medium volume to arrive at the mass of drug dissolvedusually expressed as percentage of label claim. When multiple time points are taken, the total amount of drug removed at earliertime points should be assessed and may be part of the calculation of the amount dissolved, if considered important. Similarly,if the medium volume is not fixed, for example, when the sample volume is not replaced in testing extended-release products,the change in medium volume must be part of the calculation for successive sampling points. Dissolution tests performed withApparatus 4 in the closed-loop configuration with in situ detection provide a convenient control of the medium volume. Fortesting with Apparatus 4 in the open configuration, the test time and flow rate will determine the volume of medium used inthe dissolution calculations.
8
Printed on: Fri May 14 2021, 10:23:39 AM(EST)
Official Status: Currently Official on 14-May-2021 DocId: 1_GUID-CE0902BA-77AC-422D-8BF0-A221B5DE6012_5_en-US
Printed by: Deborah Nishikawa Official Date: Official as of 01-Dec-2020 Document Type: GENERAL CHAPTER @2021 USPC
https://online.uspnf.com/uspnf/document/1_GUID-CE0902BA-77AC-422D-8BF0-A221B5DE6012_5_en-US 8/23
Officia
l

Dissolution results can be evaluated as either cumulative rates or fractional rates. Cumulative rates represent the sum of alldrug dissolution that occurs during an interval (Figure 1). Fractional rates are assessed at a specific time point or during a portionof the total test time (Figure 2). Typically, the rate of release will be expressed as either mass or percentage of label claim perunit time. For most compendial dissolution testing, the dissolution rate is expressed as a percentage of the label claim dissolvedat the indicated test time.
Figure 1. An example of a plot of dissolution as a cumulative process. Concentration, C, is the amount of drug released pervolume of medium, and t represents time. This type of plot is readily observed in constant-volume dissolution systems, such as
Apparatus 1 or Apparatus 2, or Apparatus 4 in closed-loop configuration.
Figure 2. An example of a plot of the observed concentration of the sample taken for an interval that is negligibly small inrelation to the time of the overall dissolution process. This concentration is ▲proportional▲ (USP 1-Dec-2020) to the instantaneous orfractional dissolution rate (dc/dt). This type of plot is readily observed in continuous-flow dissolution systems, such as Apparatus
4 in ▲open▲ (USP 1-Dec-2020) configuration.
Cumulative dissolution profiles represent the total amount of drug dissolved from the formulation over time. Whencumulative dissolution is measured in a constant-volume system, no correction for the amount lost in sampling needs to bemade. If sample is removed from the system, the amount consumed in analysis must be accounted for in the calculation.Recirculated sampling with Apparatus 1 or Apparatus 2, or with Apparatus 4 in the closed-loop configuration (Figure 3), are allexamples of systems that will produce cumulative dissolution rates. With Apparatus 4 in the open configuration (Figure 4),cumulative rates accounting for the total amount of drug dissolved across the testing interval are obtained by collecting andanalyzing the entire outflow from each individual flow-through cell. With Apparatus 3 (Figure 5), the medium in each tube issampled at the end of the programmed interval, and the analyzed concentration represents the cumulative dissolution rateduring that interval.
9
Printed on: Fri May 14 2021, 10:23:39 AM(EST)
Official Status: Currently Official on 14-May-2021 DocId: 1_GUID-CE0902BA-77AC-422D-8BF0-A221B5DE6012_5_en-US
Printed by: Deborah Nishikawa Official Date: Official as of 01-Dec-2020 Document Type: GENERAL CHAPTER @2021 USPC
https://online.uspnf.com/uspnf/document/1_GUID-CE0902BA-77AC-422D-8BF0-A221B5DE6012_5_en-US 9/23
Officia
l

Figure 3. Apparatus 4 in the closed-loop configuration.
Figure 4. Apparatus 4 in the ▲open▲ (USP 1-Dec-2020) configuration. The sample can be collected in fractions, as shown at thetop. The medium can be changed by using successive reservoirs.
10
Printed on: Fri May 14 2021, 10:23:39 AM(EST)
Official Status: Currently Official on 14-May-2021 DocId: 1_GUID-CE0902BA-77AC-422D-8BF0-A221B5DE6012_5_en-US
Printed by: Deborah Nishikawa Official Date: Official as of 01-Dec-2020 Document Type: GENERAL CHAPTER @2021 USPC
https://online.uspnf.com/uspnf/document/1_GUID-CE0902BA-77AC-422D-8BF0-A221B5DE6012_5_en-US 10/23
Officia
l

Figure 5. The progression that is possible for one reciprocating cylinder from Apparatus 3. The reciprocating cylinder canmove from vessel to vessel. This feature facilitates changing the dissolution medium and testing for different intervals in
successive tubes.
Fractional dissolution rates are typically measured for a discrete interval. A series of such rates will produce a step functionas the dissolution profile. At any time, the cumulative dissolution rate from this type of profile is the sum of the precedingintervals. This type of profile is represented by Apparatus 3 using multiple tubes or Apparatus 4 in the ▲open▲ (USP 1-Dec-2020)configuration where the total outflow is collected and analyzed for successive intervals.
A number of algebraic and numerical methods exist for transforming cumulative and fractional dissolution results. Thedifference in amount released for successive time points can be calculated, and the average release rate is determined by theformula:
Result = (M2 − M1)/(t2 − t1)Where:
M = mass or percentage of label claimt = time
As the difference of t2 from t1 is reduced, the average rate can be considered to approach an instantaneous rate. Samplingconsiderations and physical constraints on measurement of the mass transfer at the medium interface of the dosage form makethe measurement of true instantaneous dissolution impractical for routine determination in the laboratory. Fractional dissolutionis measured for intervals where the difference between t2 and t1 is small, relative to the total test time. The design of Apparatus4 in the open configuration permits a direct measurement of the fractional dissolution over small time intervals. For example,if a 4-mL fraction of outflow for Apparatus 4 running 16 mL/min is sampled, either by in situ detection or offline, the amountof drug detected represents the dissolution occurring in a 15-s interval.
Pooled dissolution has been used in a number of monographs. The pooled dissolution procedure produces an average releaserate for the units tested by combining equal volumes from each vessel or cell and performing analysis of only the one resultingsolution. Because this approach uses only the average release rate for comparison with the acceptance table, the pooleddissolution procedure has been viewed as reducing the amount of data available from the dissolution test and, thus, reducingits value. However, it should be noted that the pooling of equal sample volumes is equivalent, from a calculation standpoint,to determining the arithmetic mean of the individual sample results.
▲▲ (USP 1-Dec-2020)
2.6 Dissolution Procedure Assessment
The dissolution procedure requires an apparatus, a dissolution medium, and test conditions that together provide a methodthat is sensitive to changes in critical quality attributes ▲of a drug product, yet it is▲ (USP 1-Dec-2020) sufficiently rugged andreproducible for day-to-day operation. The method should be ▲transferrable▲ (USP 1-Dec-2020) between laboratories.
The ideal dissolution procedure will not contribute an unacceptable degree of variability and will provide a profile withadequate points below 85% dissolved. ▲▲ (USP 1-Dec-2020)
There are many ways to challenge the sensitivity of the method. One option is to compare dissolution profiles of formulationsthat are intentionally manufactured with meaningful variations for the most relevant critical manufacturing variables, for
11
Printed on: Fri May 14 2021, 10:23:39 AM(EST)
Official Status: Currently Official on 14-May-2021 DocId: 1_GUID-CE0902BA-77AC-422D-8BF0-A221B5DE6012_5_en-US
Printed by: Deborah Nishikawa Official Date: Official as of 01-Dec-2020 Document Type: GENERAL CHAPTER @2021 USPC
https://online.uspnf.com/uspnf/document/1_GUID-CE0902BA-77AC-422D-8BF0-A221B5DE6012_5_en-US 11/23
Officia
l

example, ±10%–20% change to the ranges of these variables. Similarly, samples that have been stressed may be used todemonstrate sensitivity to changes ▲during storage.▲ (USP 1-Dec-2020) This concept may be used to establish the factors that aremost significant in their influence on the dissolution rate. These studies can focus on either the dissolution parameters (e.g.,media concentration, agitation rate, and deaeration) or the product attributes (e.g., excipient ratios, particle size, compression).The ultimate goal is to understand the release mechanisms and determine whether the dissolution procedure ▲discriminatesdeviations in the process and formulation parameters▲ (USP 1-Dec-2020) of a drug product.
Change to read:
3. ANALYTICAL FINISH
The dissolution step has been described as an involved sample preparation. The sample handling and analytical procedurethat are used to determine the amount of drug substance dissolved during the dissolution procedure are termed the “analyticalfinish”. Although spectrophotometric determinations and HPLC are used most commonly and are discussed in this chapter,any suitable analytical technology may be used. Section 5. Validation describes criteria for the methods.
3.1 Sample Processing
After the samples are withdrawn from the dissolution medium, they may require additional processing to make them suitablefor the analytical methodology used to determine the amount released. For example, filtration ▲is often▲ (USP 1-Dec-2020) used toremove undissolved particulate matter, or samples may need to be protected from exposure to light or may need refrigeratedstorage. In addition, samples may have to be diluted to a level that is within the linear range of the method. With analysis byHPLC, dilution of the sample with mobile phase may be necessary to reduce the effect on the separation of injecting thedissolution medium. Other types of treatment may be necessary depending on the product formulation, such as the inactivationor elimination of interference caused by components of the formulation by the addition of appropriate reagents. However,separation may not be possible or needed in all cases. In some cases, in situ measurements obtained with methods such as fiberoptics or electrochemical determination may be useful.
3.2 Filters
The topic of filtration is discussed in 1.1 Performing Filter Compatibility.
3.3 Centrifugation
Centrifugation of samples is not preferred, for several reasons: dissolution can continue to occur until the solids are removed, aconcentration gradient may form in the supernatant, and energy imparted may lead to increased dissolution of the drugsubstance particles. Possible exceptions, when centrifugation could be preferred, might include the use with compounds thatadsorb onto all common filters, or situations when the potential filter leachables and extractables might interfere in thequantitative step of the dissolution test (e.g., when fluorescence procedures are used in quantitation). Centrifugation may proveuseful during method development for evaluating the suitability of the filter material ▲and the filtration step.▲ (USP 1-Dec-2020)
3.4 Analytical Procedure
The usual assay for a dissolution sample employs either a spectrophotometric procedure or a liquid chromatographicprocedure. Spectrophotometric determination may be direct or may provide the detection for HPLC. Spectrophotometricdetermination is used often because results can be obtained faster, the analysis is simpler, it is easier to automate, and fewersolvents are needed. The use of direct spectrophotometric determination typically requires confirmation of specificity. HPLC ispreferred for a number of reasons such as providing a wide dynamic range that reduces the need to dilute some samples whilealso providing sensitivity in the analysis of dilute samples, and greater selectivity when excipients or multiple drugs in theformulation present a significant interference. Modern ▲chromatographic▲ (USP 1-Dec-2020) systems employ autosamplers thatprovide speed and simplicity advantages comparable to spectrophotometric analysis.
▲Ideally, the response of the drug substance is measured (see Figure 6, Case 1).
12
Printed on: Fri May 14 2021, 10:23:39 AM(EST)
Official Status: Currently Official on 14-May-2021 DocId: 1_GUID-CE0902BA-77AC-422D-8BF0-A221B5DE6012_5_en-US
Printed by: Deborah Nishikawa Official Date: Official as of 01-Dec-2020 Document Type: GENERAL CHAPTER @2021 USPC
https://online.uspnf.com/uspnf/document/1_GUID-CE0902BA-77AC-422D-8BF0-A221B5DE6012_5_en-US 12/23
Officia
l

Figure 6. Cases representing the analysis when degradation or derivatization occurs. RRF = relative response factor.
When degradation of the drug substance occurs, it is necessary to adjust the analysis in recognition of that fact. Whendegradation of the drug substance is quantitative in the standard and sample solutions (Case 2A) or when the drug substanceis quantitatively derivatized in the standard and sample solutions (Case 2B), measurement of the degraded or derivatizedmaterial is acceptable, and no correction for relative response factor (RRF) is needed. In cases in which the drug substance isnot stable in the sample solution and is stable in the standard solution (Cases 3A and 3B), chromatography is the preferredanalytical finish and response factors of the degradation product and drug substance must be used in the calculations. Ifspectrophotometry is chosen as the analytical finish, the analytical wavelength must be at the isosbestic point of the drugsubstance and degradation product.▲ (USP 1-Dec-2020)
3.5 Spectrophotometric Analysis
Direct spectrophotometric analysis may be performed on samples that are manually introduced to the cuvette. Alternatively,samples may be automatically introduced into the spectrophotometer using autosippers and flow cells. Routine performancechecks, cleaning, and maintenance, as described in the standard operating procedures (SOPs) or metrology documents, helpto ensure reliable operation of these instruments. Cells with path lengths ranging from 0.02 to 1 cm are typically used, andlonger path-length cuvettes can be used to increase the range for quantification of dilute samples. Cell alignment and air bubblescould be sources of error. The shorter path-length cells are used to avoid diluting the sample; in all cases, however, acceptablelinearity and standard error need to be demonstrated. ▲Fiber optics, as a sampling and determinative method, with propervalidation, is an option.▲ (USP 1-Dec-2020)
The choice of wavelength for the determination should be based on the spectrum of the drug in solution. In some cases,where the drug substance can degrade in the dissolution medium (e.g., dosage forms containing aspirin) ▲the measurementsmust be made▲ (USP 1-Dec-2020) at the isosbestic point. Excipients can also ▲interfere with the analytical finish,▲ (USP 1-Dec-2020) butperforming analysis at multiple wavelengths can minimize their effects. The contribution of the absorbance from an excipientat the analytical wavelength can sometimes be determined by ratio from its absorbance at a wavelength where the absorbanceof the drug substance is minimal.
Using a validated analytical finish, standard solutions are typically prepared in dissolution ▲medium▲ (USP 1-Dec-2020) andanalyzed at just one concentration, either at 100% of the dosage strength or the selected Q value because linearity of the
13
Printed on: Fri May 14 2021, 10:23:39 AM(EST)
Official Status: Currently Official on 14-May-2021 DocId: 1_GUID-CE0902BA-77AC-422D-8BF0-A221B5DE6012_5_en-US
Printed by: Deborah Nishikawa Official Date: Official as of 01-Dec-2020 Document Type: GENERAL CHAPTER @2021 USPC
https://online.uspnf.com/uspnf/document/1_GUID-CE0902BA-77AC-422D-8BF0-A221B5DE6012_5_en-US 13/23
Officia
l

analytical finish has been established ▲over the analytical range.▲ (USP 1-Dec-2020) Prior to validation, dissolution profile analysis, oranalysis of products of various strengths, requires using multiple standard solutions covering the expected range ofconcentration, ▲unless linearity has been established (linear across the required range, no significant intercept). In a typicalsequence, the medium blank and standard bracket the sample solutions, especially at the beginning and end of the analysis. Ifthe sample solution is analyzed in sequence with the blank and standard solutions, it may provide evidence of consistentanalytical conditions or may signal changes over the time course of the analysis that could affect quantification.▲ (USP 1-Dec-2020)The standard and sample solutions should both be prepared in the dissolution medium in the linear concentration range andmeasured at the same wavelength. However, small amounts of an organic solvent may be used in the preparation of thestandard, provided that the accuracy criteria can be met during validation.
The absorptivity is calculated by dividing the mean standard absorbance by the concentration, in mg/mL, ▲and▲ (USP 1-Dec-2020)by the cell path length in cm. A rearrangement of the Beer–Lambert expression gives the absorptivity, a, as:
a = A/bc
A = absorbanceb = path length (cm)c = concentration (mg/mL)
Typical units for absorptivity that are used for dissolution testing are in terms of AU ▲(cm × mg/mL)▲ (USP 1-Dec-2020) where AUis absorbance unit. Historical data may be used to provide an acceptable absorptivity range for the analyte (using the appropriate▲cell path length).▲ (USP 1-Dec-2020) This value may be useful in troubleshooting aberrant data.
▲▲ (USP 1-Dec-2020)
3.6 ▲Chromatography▲ (USP 1-Dec-2020)
For ▲chromatographic▲ (USP 1-Dec-2020) analysis, the effect on the chromatogram of peaks resulting from ▲▲ (USP 1-Dec-2020)
dissolution ▲medium and excipients▲ (USP 1-Dec-2020) requires enumeration. A large solvent disturbance may affect accuracy andprecision of response if it is poorly resolved from the peak of interest. This is even more important if large injection volumes(>100 µL) are needed. System suitability tests may evaluate peak shape; separation of the main peak from solvent disturbanceand from closely eluting peaks; and injection precision. At a minimum, the precision is critical.
Ideally, the standard solutions should be diluted with the dissolution ▲medium▲ (USP 1-Dec-2020) at a concentration within thelinear range of the method, e.g., 100%, or the selected Q value of the dosage strength. However, organic solvent may be usedin the preparation of the standard, provided that the accuracy criteria can be met during validation. In some cases, the samplemay be diluted with mobile phase to improve the peak shape. The standard and sample solutions should both be prepared inthe linear concentration range and measured at the same wavelength. ▲A similar sequencing of standard, sample, and blanksolutions described for spectrophotometric analysis in 3.5 Spectrophotometric Analysis can be used.▲ (USP 1-Dec-2020)
Change to read:
4. AUTOMATION
▲Depending on the design of the instrument, different parts of the dissolution process may be automated, e.g., the▲ (USP 1-Dec-2020) elements of test preparation, initiation, sampling and timing, ▲media preparation,▲ (USP 1-Dec-2020) and cleaning.▲▲ (USP 1-Dec-2020) Fully automated systems are available.▲▲ (USP 1-Dec-2020) This section will discuss operational steps that can be
automated. The level of complexity for automation depends on whether the instrument configuration is open or closed loopand also whether the analytical device is coupled online or offline. Online analysis returns the sample aliquot to the test system,as in the case of spectrophotometry with flow-through cuvettes. Offline analysis removes the sample aliquot from the dissolutionmedium for subsequent analysis, typically by HPLC, where the analysis consumes the sample. The decision on the configurationusually depends on the number of samples to be processed and the time required for their analysis.
Automation may require deviations from the pharmacopeial specifications of the instruments, such as incorporation of anintegrated outlet on the bottom of the vessel for cleaning and replacement of medium.
Operational steps that are not part of the compendial procedure should be validated. Deviations from the standard proceduredescribed in á711ñ, such as use of sampling probes or fiber-optic probes, should be validated against the standard procedure.
4.1 Medium Preparation
Automated media preparation generally is accomplished by diluting concentrates. Automated media preparation systemstypically dispense the volume of medium into the vessel by monitoring either the weight or volume. Chemical and physicalstability of the concentrates as well as homogeneity of the dilutions over the intended period of use are important issues andshould be understood. Concentrates of buffer solutions and surfactants may have stability issues, such as chemicaldegradation and pH change. Physical instability may manifest as precipitation, re-crystallization, or phase separation and shouldbe prevented.
If deaeration of the medium is required, the level of deaeration should be specified.The concentration of the dissolved oxygen can be used to evaluate the efficiency of deaeration procedures discussed in
2.1 Deaeration.
14
Printed on: Fri May 14 2021, 10:23:39 AM(EST)
Official Status: Currently Official on 14-May-2021 DocId: 1_GUID-CE0902BA-77AC-422D-8BF0-A221B5DE6012_5_en-US
Printed by: Deborah Nishikawa Official Date: Official as of 01-Dec-2020 Document Type: GENERAL CHAPTER @2021 USPC
https://online.uspnf.com/uspnf/document/1_GUID-CE0902BA-77AC-422D-8BF0-A221B5DE6012_5_en-US 14/23
Officia
l

4.2 Sample Introduction and Timing
Samples should be inserted in the vessel in a reproducible way. Automated sample introduction and aliquot withdrawalprovide an advantage over manual sampling because the automated techniques can reduce the variability in the vessel-to-vesseltiming of the test intervals. However, ▲in some automated systems,▲ (USP 1-Dec-2020) sample handling may impose timinglimitations that need to be considered. The pharmacopeial tolerance of ±2% of the specified dissolution test time may be difficultto meet for early time points.
4.3 Sampling and Filtration
Autosampling is a useful alternative to manual sampling, especially if the test includes several time points. The transfer andfiltration of sample solutions from the dissolution instrument to the analytical unit may be undertaken via tube connections orvia robotic devices operated in a stepwise procedure. Sample volumes may be removed from the dissolution medium and notreturned (consumptive sampling), or the sample volume may be returned to the dissolution medium (recirculated sampling).
There are many brands of autosamplers, including semi-automated and fully automated systems. Routine performancechecks, cleaning, and maintenance, as described in the pertinent SOPs or metrology documents, help to ensure reliableoperation of these devices.
Sampling probes may or may not remain in the vessel throughout the entire run. Sampling probes or fiber-optic probes candisturb the hydrodynamics of the vessel; therefore, adequate validation should be performed to ensure that the probes are notcausing a significant change in the dissolution rate. If filters are used that are different from those used for manual sampling,then these different filters should also be evaluated separately. The position of the pharmacopeial sampling zone for Apparatus1 and Apparatus 2 is midway from the top of the stirring element to the medium surface and depends on the medium volume.Sampling probes should pull the sample from the sampling zone. Instruments for which the sampling occurs through the hollowshaft should be designed with a means to adjust the depth of the inlet aperture to allow conformance with this requirement.The programmed sampling volume depends on the dead volume of the tubing, cuvettes, and other devices and has to beadjusted accordingly.
A recirculated sampling alignment can be operated either by discharging the tubing contents into the vessel after eachsampling or by allowing the tubing to remain filled with solution in the intervals between sampling points. In the latter case,the dead volume and carryover effects are important considerations.
The need for sample volume replacement should be considered. In consumptive sampling with multiple sampling timepoints, the withdrawn volume may be replaced with an equal volume of fresh medium. The sampling volume may be criticalif, in total, it exceeds 1% of the stated volume of dissolution medium required by the procedure. If it can be shown thatreplacement of the medium is not necessary, the volume change must be part of the calculation of results. See 2.5 Data Handling.
Carryover may occur when subsequent samples are affected by residues or conditions of previous samples; the effect of thefirst sample or condition “carries over” to the second. In liquid handling, residues of liquids previously in the sample solutionmay contaminate subsequent sample solutions. Dissolution media containing surfactants or lipids may present problems.Carryover may occur for successive samples taken over a multiple time-point test, as well as at the beginning of a new test dueto the cleaning solution. This topic is discussed in 4.4 Cleaning.
Interaction of dissolved drug substance with the sampling and transfer devices is an important consideration. Whenadsorption of the dissolved drug substance occurs, it most often involves surfaces of the dissolution apparatus or sampling filtersand tubing. Adsorption may be pH dependent in the case of charged, dissolved drug substance. Adsorption of the dissolveddrug to the parts of the sampling device should be assessed using a typical sample solution (dissolution sample from the productor drug substance with formulation matrix) with known concentration. The typical design is a cross-validation with aliquots ofthe same sample solution passing and bypassing the sampling device (including the sampling probe, filter, tubing, valves, andpump). There is no general recommendation that may give preference to any kind of material or equipment construction (e.g.,glass or specific polymers). See 5.7 Considerations for Automation for more information.
In addition to the information in 2.4.3 Sampling, connections of pumps and tubing may be sources of contamination inautomated systems. Interferences with the spectroscopic analytical procedures, which are commonly used for dissolutiontesting, are less of a concern. However, interferences must be evaluated if the product under investigation contains low-dosemetal salts, as do some dietary supplements.
Liquid transfer usually is undertaken via polymeric tubing. Inert materials such as polytetrafluoroethylene (PTFE) sometimescannot be used because of their mechanical properties. Where flexible tubes are required, for example, in peristaltic pumps orfor coiling in a small radius, polypropylene (PP) or high-density polyethylene (HDPE) may be the preferred materials. Dependingon the type of polymer and its crystallinity and density, leaching of constituents, mainly plasticizers, may occur. Leachables caninterfere with the analytical procedure. The concentration leached to the sample solution usually depends on the surface, thetemperature, the exposure time, the hydrodynamic conditions, and the composition of the media.
4.4 Cleaning
In addition to the information in 2.4.4 Cleaning, automated systems have specific cleaning issues. For example, evaluationof the effectiveness of purging and rinsing between sampling times and within-run condition of the tubing is recommended.Also it is important to evaluate the cleaning process between tests.
4.5 Operating Software and Computation of Results
The software systems for data evaluation and instrument operation must be validated as per 21 Code of Federal Regulations(CFR) 11 (18).
15
Printed on: Fri May 14 2021, 10:23:39 AM(EST)
Official Status: Currently Official on 14-May-2021 DocId: 1_GUID-CE0902BA-77AC-422D-8BF0-A221B5DE6012_5_en-US
Printed by: Deborah Nishikawa Official Date: Official as of 01-Dec-2020 Document Type: GENERAL CHAPTER @2021 USPC
https://online.uspnf.com/uspnf/document/1_GUID-CE0902BA-77AC-422D-8BF0-A221B5DE6012_5_en-US 15/23
Officia
l

4.6 Common Deviations from the Compendial Procedures that May Require Validation
Some common areas of deviation from compendial procedures include the following:• Sample introduction relative to start of spindle rotation• Residence time and positioning of sampling probes• Recirculated versus consumptive sampling• Sample volume replacement in consumptive sampling
Change to read:
5. VALIDATION
The validation topics described in this section are typical but not all-inclusive and can be viewed in the context of Validationof Compendial Procedures á1225ñ as well as the International Council for Harmonisation (ICH) document, Validation of AnalyticalProcedures: Text and Methodology (19). Validation for both parts of the dissolution procedure, the analytical finish and thedissolution step, will be discussed in this section. The dissolution step is the release of the drug ▲substance▲ (USP 1-Dec-2020) in thedissolution medium and sampling. The analytical finish ▲is the quantification of the analyte and▲ (USP 1-Dec-2020) is defined in 3.Analytical Finish. Validation of the ▲suitability of the▲ (USP 1-Dec-2020) analytical finish will evaluate the attributes, linearity and range,precision, specificity, accuracy/recovery, robustness, and stability of the sample and standard solutions. Validation of thedissolution step will include evaluation of precision and robustness of the dissolution sample preparation. Validation of theanalytical finish is performed either using a standard solution or spiked placebo or by the method of standard addition(▲▲ (USP 1-Dec-2020) as described in Validation of Compendial Procedures á1225ñ, Validation, Analytical Performance Characteristics,Accuracy), as specified in the sections below. Validation of the dissolution step requires the use of a well-characterized dosageform (e.g., having tight content uniformity and uniform performance). ▲See Table 3 for an overview guide.▲ (USP 1-Dec-2020)Depending on the parameter of interest, validation of the sample handling and analytical procedure can be performed in situ,e.g., within the dissolution vessel. The validation parameters addressed and the extent of the validation may vary, dependingon the phase of development or the intended use for the data.
The acceptance criteria are presented as guidelines only, and may differ for some products. Manufacturers should documentthe appropriate acceptance criteria for their products in pertinent SOPs or in validation protocols. Other considerations may beimportant for special dosage forms. Validation studies should be performed across the range of profile time points. For productscontaining more than a single active ingredient, the dissolution procedure needs to be validated for each active ingredient. Itis expected that investigations into filter suitability and the potential for glass adsorption will have been undertaken already (see1.1 Performing Filter Compatibility). Validation of these assessments may occur during spiked recovery experiments.
▲Table 3. Samples Used in the Assessment of Validation Attributes
Attribute Comment Analytical Finish Dissolution Procedure
Linearity — STD; a SP*b —
Range (linear, accuracy, precision) — STD; SP* —
Accuracy/recovery — SP* —
Repeatability Individual preparations STD; SP* WCDFc
Intermediate precision At least, two analysts/one laboratory SP* WCDF
Reproducibility At least, two analysts/two laboratories SP* WCDF
Robustness Deliberate changes to parameters SP* WCDF
a STD: Standard solution (preferred material).b SP*: Spiked placebo (standard addition method is acceptable).c WCDF: Well-characterized dosage form.▲ (USP 1-Dec-2020)
5.1 Specificity/Placebo Interference
It is necessary to demonstrate that the results are not unduly affected by ▲dissolution medium blank,▲ (USP 1-Dec-2020) placeboconstituents, other active ▲drug substances,▲ (USP 1-Dec-2020) or ▲potential degradation products from the dissolved drugsubstance in the dissolution medium.▲ (USP 1-Dec-2020) The placebo consists of all the excipients and coatings, with inks and capsuleshells included if appropriate, without the ▲drug substance.▲ (USP 1-Dec-2020) Placebo interference can be evaluated by using aspiked placebo that is prepared by weighing samples of the placebo blend, dissolving or dispersing them in dissolution mediumat concentrations that would be encountered during testing, and adding a known amount of the drug in solution. It may bepreferable to perform this experiment at 37°, comparing the solution to a standard solution at the concentration expected tobe encountered during testing, by using the formula:
Result = (AP/AS) × CS × (V/L) × 100Where:
AP = absorbance ▲or response▲ (USP 1-Dec-2020) of the placebo
16
Printed on: Fri May 14 2021, 10:23:39 AM(EST)
Official Status: Currently Official on 14-May-2021 DocId: 1_GUID-CE0902BA-77AC-422D-8BF0-A221B5DE6012_5_en-US
Printed by: Deborah Nishikawa Official Date: Official as of 01-Dec-2020 Document Type: GENERAL CHAPTER @2021 USPC
https://online.uspnf.com/uspnf/document/1_GUID-CE0902BA-77AC-422D-8BF0-A221B5DE6012_5_en-US 16/23
Officia
l

AS = absorbance ▲or response▲ (USP 1-Dec-2020) of the standardCS = concentration of the standard (mg/mL)V = volume of the medium (mL)L = label claim (mg)
▲The blank is the dissolution medium without dissolved sample, and it is treated in the same manner as the sample. Theeffect of the absorbance of the blank at the analytical wavelength should be evaluated. In most cases, the absorbance of thedissolution medium blank may not exceed 1% of the standard solution at the concentration used for analysis. Values >1%should be evaluated on a case-by-case basis.▲ (USP 1-Dec-2020)
The interference should not exceed 2%. Note that for extended-release products, a placebo version of the finished dosageform may be more appropriate than blends because this placebo formulation will release the various excipients in a mannermore nearly reflecting the product than will a simple blend of the excipients. In this case, it may be appropriate to evaluatepotential interference at multiple sampling points in the release profile, with worst-case interference expected at the latersampling points.
▲▲ (USP 1-Dec-2020)
If the placebo interference exceeds 2%, modification of the method may be necessary. Possible modifications includechoosing another wavelength, subtracting baseline using a longer wavelength, transforming absorbance values (e.g., firstderivative), and using an alternative analytical technique such as HPLC. Other means for minimizing the placebo interferencewould be acceptable with appropriate justification. When other ▲▲ (USP 1-Dec-2020) drug substances or ▲degradationproducts▲ (USP 1-Dec-2020) are present, it is necessary to show that these do not ▲interfere with the measurement.▲ (USP 1-Dec-2020)One procedure for doing this is to measure the matrix in the presence and absence of the other active drug substance or▲degradation product:▲ (USP 1-Dec-2020) any interference should not exceed 2%. Similar approaches may be used if othertechniques are used for the analytical finish.
5.2 Linearity and Range
Linearity is typically established by preparing solutions of the drug substance, ranging in concentration from less than thelowest expected concentration to more than the highest concentration during release. The solutions may be prepared eitherusing 1) a standard solution or spiked solution or 2) by the method of standard addition. A minimum of five concentrations isnormally used (see á1225ñ). Typically, solutions are made from a common stock if possible. The concentration range may notexceed the linearity limits of the method, including the instrumentation. Organic solvents may be used to enhance drugsolubility for the preparation of the linearity standard solutions. However, NMT 5% (v/v) of organic solvent should be presentin the final solution unless validated. Linearity is typically calculated by using an appropriate least-squares regression program.Typically, a square of the correlation coefficient (r2 ≥ 0.98) demonstrates linearity. In addition, the y-intercept must not beimportantly different from zero.
The range of the procedure is the interval between the upper and lower concentrations of the drug substance (includingthese levels) that has been demonstrated to have a suitable level of precision, accuracy, and linearity using the procedure aswritten.
5.3 Accuracy/Recovery
Accuracy/recovery is typically established by preparing multiple ▲sample solutions▲ (USP 1-Dec-2020) containing the drugsubstance and any other constituents present in the dosage form (e.g., excipients, coating materials, capsule shell) ranging inconcentration from less than the lowest expected concentration to more than the highest concentration during release.Accuracy/recovery may be done in conjunction with linearity determination. The method of standard addition can also be used.Before this activity, it is expected that filter assessment will already have been performed, and adsorption of drug onto the glasshas also been investigated and ruled out.
Individual solutions may be directly prepared in the dissolution medium. Alternatively, to enhance drug solubility it may beappropriate to prepare a stock solution by dissolving the drug substance ▲typically▲ (USP 1-Dec-2020) in a small amount of organicsolvent ▲▲ (USP 1-Dec-2020) and diluting to the final concentration with dissolution medium. ▲The amount of organic solvent shouldnot exceed 5% in the sample solution and should not interfere with the analysis.▲ (USP 1-Dec-2020) An amount of stock solutionequivalent to the targeted label claim may be used instead of the drug substance powder. Similarly, for very low strengths, itmay be more appropriate to prepare a stock solution than to attempt to weigh very small amounts. The measured recovery istypically 95%–105% of the amount added. Bracketing or matrixing of multiple strengths may be useful.
A special case for validation ▲are the Acid stage criteria described in Dissolution á711ñ, Acceptance Table 3.▲ (USP 1-Dec-2020)Thelimits of NMT 10% ▲and of NMT 25%▲ (USP 1-Dec-2020) need to be validated. Recovery experiments for drug▲substances▲ (USP 1-Dec-2020) that have low solubility in acidic media may be challenging or impossible to perform and may needto be addressed on a case-by-case basis. ▲If the drug substance degrades in acidic media, the degradation product(s) shouldbe used to quantify the dissolved drug and the validation experiment must address this fact. Two examples of dissolution of adelayed-release dosage form are provided to illustrate this case. In these examples, the Q value for the buffer phase is 80% at15 min; the B1 criterion is 85% label claim (LC). Please refer to 6.5.2 Delayed-Release Dosage Forms for further information onacceptance criteria.
Example 1: The analytical results from the acid stage of dissolution experiment of an individual unit indicated that 1% LC ofdrug substance (DSacid) and 5% LC of a degradant (DEGacid) were present after 2 h. The total amount of drug substance dissolvedin the acid stage is calculated:
DSacid + DEGacid = 6% LC
17
Printed on: Fri May 14 2021, 10:23:39 AM(EST)
Official Status: Currently Official on 14-May-2021 DocId: 1_GUID-CE0902BA-77AC-422D-8BF0-A221B5DE6012_5_en-US
Printed by: Deborah Nishikawa Official Date: Official as of 01-Dec-2020 Document Type: GENERAL CHAPTER @2021 USPC
https://online.uspnf.com/uspnf/document/1_GUID-CE0902BA-77AC-422D-8BF0-A221B5DE6012_5_en-US 17/23
Officia
l

which meets the A1 criterion of ≤10% LC that is specified in á711ñ. This calculation is repeated for each of the remaining 5individual units.
The unit was transferred to the buffer stage and the measured amount of drug substance (DSbuffer) is 82% LC after 15 min.The total amount of drug substance dissolved in both stages is calculated:
DSacid + DEGacid + DSbuffer = 88% LC
which meets the B1 criterion of 85% LC. This calculation is repeated for each of the remaining 5 individual units.Example 2: The analytical results from the acid stage of the dissolution experiment indicated that DSacid and DEGacid are 8%
and 20% LC, respectively, for an individual unit. The total amount of drug substance dissolved in the acid stage is:
DSacid + DEGacid = 28% LC,
This result does not meet the A1 criterion of NMT 10% LC. Furthermore, neither the A2 nor the A3 criterion is met becausethe calculated value exceeds the NMT 25% LC limit.▲ (USP 1-Dec-2020)
5.4 Precision
5.4.1 REPEATABILITY OF ANALYSIS
For the analytical finish, repeatability is evaluated by obtaining replicate measurements of standard and/or spiked placebo/standard addition solutions. It can be determined by calculating the RSD of the multiple injections or spectrophotometricreadings for each standard solution, or by using the accuracy or linearity data. The ICH guidance, ▲Q2(R1) Validation of AnalyticalProcedures: Text and Methodology,▲ (USP 1-Dec-2020)recommends that repeatability should be assessed using a minimum of ninedeterminations covering the specified range for the procedure (i.e., 3 concentrations and 3 replicates of each concentration)or using a minimum of 6 determinations at 100% of the test concentration ▲(19).▲ (USP 1-Dec-2020) A typical acceptance criterionis an RSD of <2%. The demonstration of the repeatability for the dissolution step is conducted by performing the dissolutionstep on separate units of a well-characterized dosage form or equivalent composite.
5.4.2 INTERMEDIATE PRECISION/RUGGEDNESS
Assuming that the major contributor to the variance is from the dissolution step, intermediate precision may be evaluatedto determine the effects of random events on the precision of the dissolution procedure. This evaluation is typically done laterin the development of the drug product and is required for full method validation. For many analytical procedures intermediateprecision is typically assessed by determination of contributions to variance and, possibly, by a comparison of means. The useof an experimental matrix design is encouraged for evaluation of intermediate precision because interaction effects may beobserved more clearly relative to a single variable experiment. In dissolution testing, a ruggedness approach that comparesmeans alone is often taken to investigate the factors that contribute to intermediate precision. The ruggedness can be evaluatedacross the range of product strengths. Typical variations to be studied include different days, analysts, and equipment. Ifpossible, ruggedness can be evaluated using a ▲well-characterized dosage form, but if this is not available, a premeasuredplacebo with drug substance(s)▲ (USP 1-Dec-2020) may be used to investigate the intermediate precision. The use of such a spikedplacebo would additionally support the assessment of the contribution of the analytical finish to the observed variability ofresults.
The dissolution procedure on the same lot of well-characterized dosage form may be run by at least two different analystsfrom the same laboratory, with each analyst preparing the standard solutions and the medium and following the definedextraction/quantification procedure. Typically, the analysts use different dissolution baths, spectrophotometers or HPLCequipment (including columns), and autosamplers, and they perform the test on different days. Full profiles are assessed whererelevant to the product. This procedure may not be necessary at each ▲dosage▲ (USP 1-Dec-2020) strength; instead, bracketing withhigh and low strengths may be acceptable.
Acceptance criteria for intermediate precision or for ruggedness are predetermined. A typical acceptance criterion forruggedness is that the difference in the mean value for dissolution results between any two conditions, using the same▲dosage▲ (USP 1-Dec-2020) strength, does not exceed an absolute 10% at time points with <85% dissolved and does not exceed5% for time points ▲NLT▲ (USP 1-Dec-2020) 85%. Acceptance criteria may be product specific, and other statistical tests and limitsmay be used.
5.4.3 REPRODUCIBILITY
Reproducibility follows the general concepts of intermediate precision, but is performed by, ▲at least,▲ (USP 1-Dec-2020) twodifferent analysts at different labs.
5.5 Robustness
Evaluation of robustness, which assesses the effect of making small, deliberate changes to the dissolution conditions, typicallyis done later in development of the drug product and is a requirement for full method validation. It is performed using awell-characterized lot of drug product. ▲▲ (USP 1-Dec-2020) The number of replicates (typically 3 or 6) is dependent on theintermediate precision. All profile points should be evaluated.
Selection of parameters to be varied depends on the dissolution procedure and analysis type. The parameters may includemedium composition (e.g., buffer or surfactant concentration, pH, deaeration), volume, agitation rate, sampling time, and
18
Printed on: Fri May 14 2021, 10:23:39 AM(EST)
Official Status: Currently Official on 14-May-2021 DocId: 1_GUID-CE0902BA-77AC-422D-8BF0-A221B5DE6012_5_en-US
Printed by: Deborah Nishikawa Official Date: Official as of 01-Dec-2020 Document Type: GENERAL CHAPTER @2021 USPC
https://online.uspnf.com/uspnf/document/1_GUID-CE0902BA-77AC-422D-8BF0-A221B5DE6012_5_en-US 18/23
Officia
l

temperature. Statistical analysis of the data generated will help determine the extent to which the parameters must be controlledin the method. The robustness assessment is well suited to Design of Experiments (DoE) methodologies to efficiently investigatethe impact of the individual parameters and/or their interaction.
Robustness of analytical finish is referenced in á1225ñ. HPLC analysis parameters may include mobile phase composition(percentage organic, buffer concentration, pH), flow rate, wavelength, column temperature, and multiple columns (of the sametype). For spectrophotometric analysis, the wavelength may be varied.
▲Robustness follows the general concepts of intermediate precision and uses similar acceptance criteria.▲ (USP 1-Dec-2020)
5.6 Stability of Standard and Sample Solutions
▲As part of method validation, the stability of the standard and sample solutions should be demonstrated (see 1.2.2Stability).▲ (USP 1-Dec-2020)
5.7 Considerations for Automation
Automated methods offer opportunities for increased precision and reproducibility; however, bias may be introduced. Inparticular, the sampling probe and the sample lines warrant attention as places where inaccuracies may occur. Deviations fromthe procedure described in á711ñ, such as resident sampling probes, sampling through the stirring element shaft (hollow-shaftsampling), or fiber-optic probes, should be validated. Other aspects of automation validation may include carryover of residualdrug, effect of an in-residence probe, adsorption of drug, and cleaning and/or rinse cycles. Validation is performed using theautomated dissolution system including materials. Therefore, any change in materials will require demonstration of suitabilitybased on the validation attributes that are impacted by the change.
Manual and automated procedures should be compared to evaluate the interchangeability of the procedures. This is doneby performing two automated runs at each dosage concentration, ▲(12 dosage units in total),▲ (USP 1-Dec-2020) using all samplingpoints, compared to ▲two▲ (USP 1-Dec-2020) manually sampled runs ▲(12 dosage units in total)▲ (USP 1-Dec-2020) of the same samples.The effect of the in-resident probe cannot be determined by sampling both ways from the same vessel. Results should beconsistent with the requirements for intermediate precision if the procedures are to be considered interchangeable. Thedifference in the mean value for dissolution results between any two conditions using the same ▲dosage▲ (USP 1-Dec-2020) strengthshould not exceed an absolute 10% at time points with <85% dissolved nor exceed 5% for time points >85%. Acceptancecriteria may be product specific, and other statistical tests and limits may be used.
Revalidation may be necessary when the automated system is used with different formulations because of the interactionwith excipients. Dissolution media containing surfactants or lipids may require additional validation efforts.
Change to read:
6. ACCEPTANCE CRITERIA
▲The selection of dissolution acceptance criterion/criteria should be consistent with the dissolution data generated from bio/pivotal or clinical batches at the point of release as well as from stability batches. Generally,▲ (USP 1-Dec-2020) there is an expectationthat acceptable batches will have results that fall within the acceptance ▲criterion/▲ (USP 1-Dec-2020) criteria and that allmanufactured batches should have similar dissolution behavior, thus highlighting the importance of having a ▲dissolutionspecification (method and acceptance criterion/criteria) which is optimal and discriminating for the drug product. The selectedacceptance criterion/criteria should, therefore,▲ (USP 1-Dec-2020) discriminate between an acceptable and an unacceptable batch.In addition, the dissolution test results are viewed as a link to the pivotal clinical trial batches. When changes in dissolution ratehave been shown to ▲significantly affect bioavailability, the dissolution acceptance criterion/criteria▲ (USP 1-Dec-2020) shoulddistinguish batches with unacceptable bioavailability (20). Likewise, when changes in the formulation and manufacturingprocess significantly affect dissolution and such changes are not controlled by another aspect of the ▲drug product’sspecification, the selected dissolution test should distinguish these changes. Additionally, if the dissolution characteristics of thedrug product change upon storage, whether or not the specifications should be revised will depend on demonstratingbioequivalence of the changed drug product to the original biobatch or pivotal batch.▲ (USP 1-Dec-2020)
6.1 Immediate-Release Dosage Forms
▲For immediate-release dosage forms, the dissolution acceptance criterion and test time are established by evaluating thedissolution profile data. The acceptance criterion for a dissolution test is a function of Q. The term Q is used to describe thecumulative percent of drug dissolved with respect to label claim at the selected time point of the dissolution test. A Q value of80% is generally recommended, except when a justification with adequate data are provided to support a lower Q value (e.g.,clinical or bioavailability/bioequivalence data) (15). Q values above 80% are not generally used.
During product development, the collection of complete dissolution profile data is recommended from biobatches andstability batches at specified intervals, such as 10, 15, 20, 30, 40, 50, and 60 min or 15, 20, 30, 45, and 60 min, because thesedata are used to establish the dissolution acceptance criterion/criteria. From the dissolution profile data, a Q value of 80% shouldbe set at the first time point where the average dissolution is at least 85%. However, this time point should not be less than15 min.
After registration, for routine batch release and on stability, the dissolution testing of immediate-release drug products usuallybecomes a single time-point test because dissolution data are collected at only the sampling time point(s) listed in the approvedregulatory dissolution test of the product. The collection of dissolution profile data is, in general, not required.▲ (USP 1-Dec-2020)
19
Printed on: Fri May 14 2021, 10:23:39 AM(EST)
Official Status: Currently Official on 14-May-2021 DocId: 1_GUID-CE0902BA-77AC-422D-8BF0-A221B5DE6012_5_en-US
Printed by: Deborah Nishikawa Official Date: Official as of 01-Dec-2020 Document Type: GENERAL CHAPTER @2021 USPC
https://online.uspnf.com/uspnf/document/1_GUID-CE0902BA-77AC-422D-8BF0-A221B5DE6012_5_en-US 19/23
Officia
l

6.2 Delayed-Release Dosage Forms
The discussion about dissolution of delayed-release dosage forms in á711ñ focuses on enteric-coated dosage forms, which is▲a pH-dependent release and▲ (USP 1-Dec-2020) the most common delayed-release dosage form. ▲Other types of delayed-releasedosage forms are discussed at the end of this section.▲ (USP 1-Dec-2020) A dissolution test for a delayed-release tablet or capsule is atwo-part test, and each part has acceptance ▲criterion/criteria. First, the dosage unit is▲ (USP 1-Dec-2020) exposed to an acid medium,followed by exposure to a buffer medium. To ensure that the enteric coating performs properly, a “NMT” acceptance criterionis indicated in Dissolution á711ñ, ▲Acceptance Table 3▲ (USP 1-Dec-2020) for the acid stage. The medium used for an acid stage isusually 0.1 N hydrochloric acid (HCl), and the duration of this stage is typically 2 h. The dosage ▲unit is▲ (USP 1-Dec-2020) thenexposed to a buffer medium, usually 0.05 M phosphate buffer at pH 6.8, but other buffers and pH targets may be used ifjustified. The duration of the buffer stage ▲will depend on whether the in vivo release of the drug substance in the intestinaltract is intended to be immediate or extended. When the release in the intestinal tract is immediate, the sampling in the bufferstage is usually 60 min for compendial tests. This duration may vary, however, depending on the drug product. As withimmediate-release dosage forms, the Q value and time point are determined by evaluating the entire dissolution profile in thebuffer stage (see 6.1 Immediate-Release Dosage Forms).
When the release in the intestinal tract is extended, the buffer stage time will depend on the extended release characteristics.In general, sampling should be done at 30 min, 1 h, 2 h, and after that every 2 h until complete drug release. As withextended-release dosage forms, the acceptance criteria limits and time points are determined by evaluating the entiredissolution profile in the buffer stage (see 6.3 Extended-Release Dosage Forms).
There are other delayed release dosage forms with a multistage pH-dependent mechanism, in order to ascertain drug releasein the distal region of the gastrointestinal (GI)-tract. For those, in vitro performance testing may need to be adapted tomultimedia at different pH values and a sequential test design with more than one switch at predefined time points. Thespecifications are adapted accordingly.
Beside these, delayed release dosage forms exist with release mechanisms, that are non-pH dependent. For those, the generaltesting procedure as outlined in USP for enteric-coated dosage forms does not apply. Instead, product-based testing proceduresin one dissolution medium with a defined pH are in place. As a consequence, the time to release may be part of the specifications(i.e., time, t ± min combined with NLT Q%).▲ (USP 1-Dec-2020)
6.3 Extended-Release Dosage Forms
A dissolution test for an extended-release dosage form is generally similar to that used for an immediate- or delayed-releasedrug product, except that the duration of the test is longer, and ▲the acceptance criteria include at least three time points (21).Additional time points may be required for drug product▲ (USP 1-Dec-2020) approval purposes. An early time point, usually 1–2 h,is chosen to show that dose dumping is not probable. An intermediate time point is chosen to define the in vitro release profileof the dosage form, and a final time point is chosen to show essentially complete release of the drug (21). ▲The acceptancecriteria time points for the test should be determined by evaluating the complete dissolution profile across the desired testduration.
During product development, it is recommended that sampling be conducted at 30 min, 1 h, 2 h, and every 2 h untilcomplete drug release, to aid with selection of the appropriate time points for the product’s dissolution acceptance criteria. Forroutine batch release and testing of stability samples after registration, the dissolution testing of extended-release drug productsusually becomes a test with at least 3 time points because dissolution data are collected at only the sampling time points listedin the approved regulatory dissolution test of the product. The collection of dissolution data at additional time points is, ingeneral, not required.▲ (USP 1-Dec-2020)
As with an immediate- or delayed-release drug product, the acceptance criteria and time points for an extended-release drugproduct should discriminate between an acceptable and an unacceptable batch. The acceptance criteria for the first stage oftesting (L1) should be established on the basis of available batch data (20,21). If human bioavailability data are available forformulations exhibiting different release rates, then, ▲if possible, it is encouraged that an in vitro–in vivo relationship (see á1088ñand á1090ñ) be used to establish acceptance criteria (20,21).▲ (USP 1-Dec-2020) Acceptance criteria for the second (L2) and third (L3)stages are derived from the L1 criteria using Dissolution á711ñ, Acceptance Table 2.
6.4 Multiple Dissolution Tests
Typically, monographs for extended-release dosage forms contain multiple dissolution tests representing specific products.In accordance with General Notices, 4.10.10 Applicability of Test Procedures, the appropriate test, if not Test 1, is indicated onthe product labeling. For example, the USP monograph for Oxycodone Hydrochloride Extended-Release Tablets (22) lists 2dissolution tests, each of which has either three or four time points. If the Tablets are analyzed using Test 2 and the dissolutionresults comply with the criteria provided ▲for Test 2, the labeling for the drug product▲ (USP 1-Dec-2020) can indicate that the Tabletsmeet USP Dissolution Test 2. Multiple dissolution tests also can be found in monographs for immediate- and delayed-releasedosage forms. For example, the USP monographs for Levothyroxine Sodium Tablets and Pantoprazole Sodium Delayed-ReleaseTablets provide 4 dissolution tests (23,24).
6.5 Interpretation of Dissolution Results
Dissolution á711ñ, Interpretation discusses immediate-, delayed-, and extended-release dosage forms. The discussion for eachof these release patterns is expanded here with examples to assist with applying the criteria during the various stages of testing.Understanding how these criteria are applied will assist in setting appropriate acceptance criteria.
20
Printed on: Fri May 14 2021, 10:23:39 AM(EST)
Official Status: Currently Official on 14-May-2021 DocId: 1_GUID-CE0902BA-77AC-422D-8BF0-A221B5DE6012_5_en-US
Printed by: Deborah Nishikawa Official Date: Official as of 01-Dec-2020 Document Type: GENERAL CHAPTER @2021 USPC
https://online.uspnf.com/uspnf/document/1_GUID-CE0902BA-77AC-422D-8BF0-A221B5DE6012_5_en-US 20/23
Officia
l

▲For the purpose of correlation with in vivo data, parameters of mathematical models are obtained by fitting to dissolutiondata to establish a continuous functional relationship called in vivo/in vitro correlation (IVIVC) (see á1088ñ). In the case oflow-solubility drug substances, an oral solution for demonstration of bioavailability may not be available. Therefore, plasmadrug concentration time profiles from human permeability predictions and the first in-human trial can be used to synthesizepharmacokinetic profiles for a solution and provide an initial estimate of the in vivo dissolution profile that can be used as atarget for the in vitro dissolution profile (25).▲ (USP 1-Dec-2020)
6.5.1 IMMEDIATE-RELEASE DOSAGE FORMS
Once the Q value ▲and the associated time point are▲ (USP 1-Dec-2020) established, the dissolution test is a staged test of 3 levels.In the first level of testing called S1, 6 dosage ▲units are tested. Each unit must be NLT▲ (USP 1-Dec-2020) Q + 5% (absolute percentagepoints) dissolved at a specified time. For example, the time and tolerances in a monograph would be:
Time: 30 minTolerances: NLT 80% (Q) of the labeled amount of “drug substance” is dissolved.
If the Q value for a 200-mg label claim (LC) immediate-release tablet is specified as 80% and the time point is 30 min, then▲for level S1▲ (USP 1-Dec-2020) NLT 85% LC (170 mg) of the drug substance in each tablet must be dissolved at 30 min.
If this criterion is not met, then 6 additional tablets are tested at level 2 (S2). To pass the S2 acceptance criteria, the averageof all 12 tablets must be equal to or greater than Q (80% LC; 160 mg in the above example), and no tablet has less than Q− 15% (65% LC; 130 mg in the above example).
If these criteria are not met, then level 3 or S3 testing must be performed by testing 12 additional tablets. To pass S3, theaverage of all 24 tablets must be equal to or greater than Q (80% LC; 160 mg in the above example). Two additional criteriamust be met as well: 1) NMT 2 tablets are less than Q − 15% (65% LC; 130 mg in the above example), and 2) no tablet is lessthan Q − 25% dissolved (55% LC; 110 mg in the above example.)
6.5.2 DELAYED-RELEASE DOSAGE FORMS
An aliquot of the ▲sample solution (drug substance or drug substance plus degradation product)▲ (USP 1-Dec-2020) from eachvessel is analyzed at the end of the acid stage. For the acid stage, the acceptance criteria have 3 levels. Level 1 (A1) testing ispassed if no individual value exceeds 10% dissolved. If the A1 criteria are not met, then the dissolution test is performed on 6additional ▲units▲ (USP 1-Dec-2020) for level 2 (A2) testing. Level A2 criteria are passed if the average of all 12 ▲units▲ (USP 1-Dec-2020) inthe acid stage is NMT 10% dissolved and if no individual ▲unit▲ (USP 1-Dec-2020) is more than 25% dissolved. Level 3 testing isperformed if the A2 criteria are not met. The A3 criteria are passed if the average of all 24 ▲units▲ (USP 1-Dec-2020) in the acid stageis NMT 10% dissolved and if no individual ▲unit▲ (USP 1-Dec-2020) is more than 25% dissolved. For the special case in which thesolubility of the drug in an acidic medium ▲is too low (because of conversion to the free acid)▲ (USP 1-Dec-2020) to support anacceptance criterion of NMT 10%, the drug product should be exposed to the acid stage for the defined duration and thenexposed to the buffered medium. Alternate acceptance criteria for the acid stage based on drug solubility may be justified.
For delayed-release dosage forms, the total percentage dissolved is determined by adding the measured amounts ▲of drugsubstance or of drug substance and degradation product in the acid stage to the drug substance dissolved in the buffer stagefor each individual unit (see Example 1 in 5.3 Accuracy/Recovery). If the dosage form is designed for immediate release of thedrug in the intestinal tract,▲ (USP 1-Dec-2020) these calculated values are then compared to staged acceptance criteria (B1, B2, andB3) that are based on a Q value. The B1, B2, and B3 criteria are ▲analogous▲ (USP 1-Dec-2020) to those for the immediate release S1,S2, and S3 criteria.
▲For example, the time and tolerances in a monograph would be:Acid stageTime: 120 minTolerances: NMT 10% of the labeled amount of “drug substance” is dissolved.Buffer stageTime: 45 minTolerances: NLT 80% (Q) of the labeled amount of “drug substance” is dissolved.
If the dosage form is designed for extended release of the drug in the intestinal tract, the sum of the measured amounts inthe acid and buffer stages for each individual unit are then compared to criteria described in the next section.▲ (USP 1-Dec-2020)
6.5.3 EXTENDED-RELEASE DOSAGE FORMS
In the following hypothetical example, which is used to describe the criteria for an extended-release dosage form, the timepoints are 1, 4, and 8 h. ▲▲ (USP 1-Dec-2020)
Acceptance ranges are often expressed in tabular form in the USP–NF (see Table 4).
Table 4. L1 Criteria
Time(h)
Amount Dissolved(%)
1 ▲14–34▲ (USP 1-Dec-2020)
4 ▲46–66▲ (USP 1-Dec-2020)
8 ▲NLT 80▲ (USP 1-Dec-2020)
21
Printed on: Fri May 14 2021, 10:23:39 AM(EST)
Official Status: Currently Official on 14-May-2021 DocId: 1_GUID-CE0902BA-77AC-422D-8BF0-A221B5DE6012_5_en-US
Printed by: Deborah Nishikawa Official Date: Official as of 01-Dec-2020 Document Type: GENERAL CHAPTER @2021 USPC
https://online.uspnf.com/uspnf/document/1_GUID-CE0902BA-77AC-422D-8BF0-A221B5DE6012_5_en-US 21/23
Officia
l
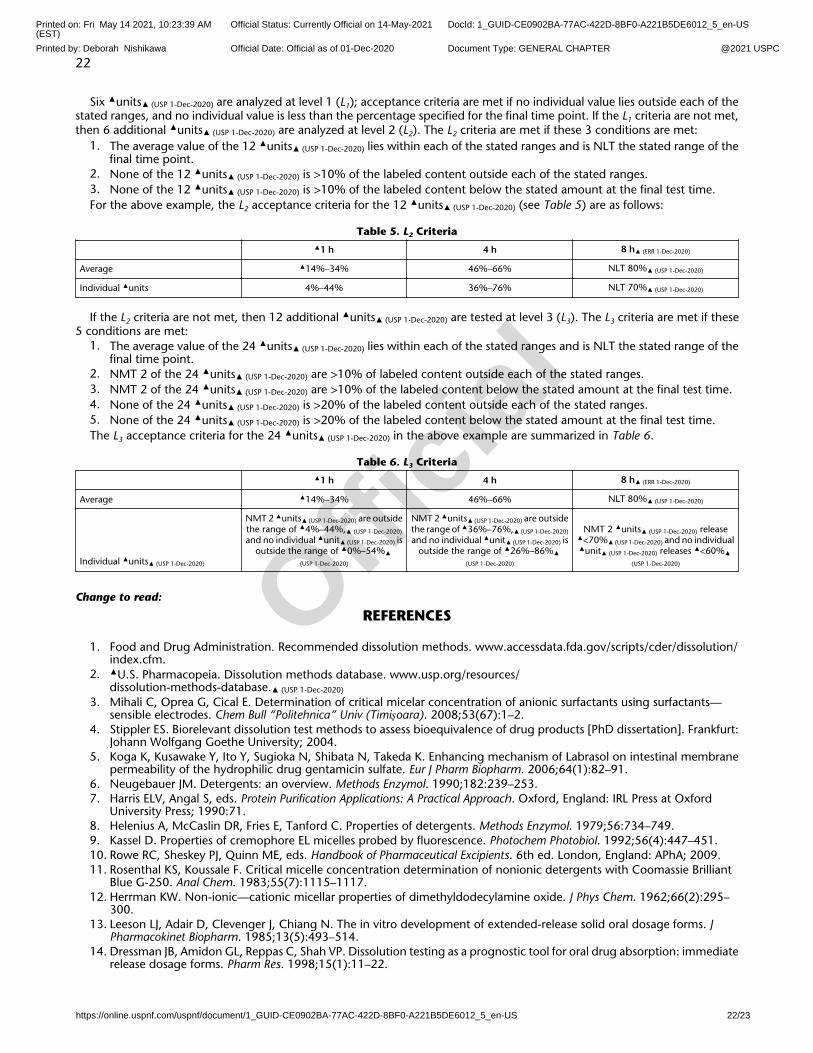
Six ▲units▲ (USP 1-Dec-2020) are analyzed at level 1 (L1); acceptance criteria are met if no individual value lies outside each of thestated ranges, and no individual value is less than the percentage specified for the final time point. If the L1 criteria are not met,then 6 additional ▲units▲ (USP 1-Dec-2020) are analyzed at level 2 (L2). The L2 criteria are met if these 3 conditions are met:
1. The average value of the 12 ▲units▲ (USP 1-Dec-2020) lies within each of the stated ranges and is NLT the stated range of thefinal time point.
2. None of the 12 ▲units▲ (USP 1-Dec-2020) is >10% of the labeled content outside each of the stated ranges.3. None of the 12 ▲units▲ (USP 1-Dec-2020) is >10% of the labeled content below the stated amount at the final test time.For the above example, the L2 acceptance criteria for the 12 ▲units▲ (USP 1-Dec-2020) (see Table 5) are as follows:
Table 5. L2 Criteria
▲1 h 4 h 8 h▲ (ERR 1-Dec-2020)
Average ▲14%–34% 46%–66% NLT 80%▲ (USP 1-Dec-2020)
Individual ▲units 4%–44% 36%–76% NLT 70%▲ (USP 1-Dec-2020)
If the L2 criteria are not met, then 12 additional ▲units▲ (USP 1-Dec-2020) are tested at level 3 (L3). The L3 criteria are met if these5 conditions are met:
1. The average value of the 24 ▲units▲ (USP 1-Dec-2020) lies within each of the stated ranges and is NLT the stated range of thefinal time point.
2. NMT 2 of the 24 ▲units▲ (USP 1-Dec-2020) are >10% of labeled content outside each of the stated ranges.3. NMT 2 of the 24 ▲units▲ (USP 1-Dec-2020) are >10% of the labeled content below the stated amount at the final test time.4. None of the 24 ▲units▲ (USP 1-Dec-2020) is >20% of the labeled content outside each of the stated ranges.5. None of the 24 ▲units▲ (USP 1-Dec-2020) is >20% of the labeled content below the stated amount at the final test time.The L3 acceptance criteria for the 24 ▲units▲ (USP 1-Dec-2020) in the above example are summarized in Table 6.
Table 6. L3 Criteria
▲1 h 4 h 8 h▲ (ERR 1-Dec-2020)
Average ▲14%–34% 46%–66% NLT 80%▲ (USP 1-Dec-2020)
Individual ▲units▲ (USP 1-Dec-2020)
NMT 2 ▲units▲ (USP 1-Dec-2020) are outsidethe range of ▲4%–44%,▲ (USP 1-Dec-2020)
and no individual ▲unit▲ (USP 1-Dec-2020) isoutside the range of ▲0%–54%▲
(USP 1-Dec-2020)
NMT 2 ▲units▲ (USP 1-Dec-2020) are outsidethe range of ▲36%–76%,▲ (USP 1-Dec-2020)
and no individual ▲unit▲ (USP 1-Dec-2020) isoutside the range of ▲26%–86%▲
(USP 1-Dec-2020)
NMT 2 ▲units▲ (USP 1-Dec-2020) release▲<70%▲ (USP 1-Dec-2020) and no individual▲unit▲ (USP 1-Dec-2020) releases ▲<60%▲
(USP 1-Dec-2020)
Change to read:
REFERENCES
1. Food and Drug Administration. Recommended dissolution methods. www.accessdata.fda.gov/scripts/cder/dissolution/index.cfm.
2. ▲U.S. Pharmacopeia. Dissolution methods database. www.usp.org/resources/dissolution-methods-database.▲ (USP 1-Dec-2020)
3. Mihali C, Oprea G, Cical E. Determination of critical micelar concentration of anionic surfactants using surfactants—sensible electrodes. Chem Bull “Politehnica” Univ (Timişoara). 2008;53(67):1–2.
4. Stippler ES. Biorelevant dissolution test methods to assess bioequivalence of drug products [PhD dissertation]. Frankfurt:Johann Wolfgang Goethe University; 2004.
5. Koga K, Kusawake Y, Ito Y, Sugioka N, Shibata N, Takeda K. Enhancing mechanism of Labrasol on intestinal membranepermeability of the hydrophilic drug gentamicin sulfate. Eur J Pharm Biopharm. 2006;64(1):82–91.
6. Neugebauer JM. Detergents: an overview. Methods Enzymol. 1990;182:239–253.7. Harris ELV, Angal S, eds. Protein Purification Applications: A Practical Approach. Oxford, England: IRL Press at Oxford
University Press; 1990:71.8. Helenius A, McCaslin DR, Fries E, Tanford C. Properties of detergents. Methods Enzymol. 1979;56:734–749.9. Kassel D. Properties of cremophore EL micelles probed by fluorescence. Photochem Photobiol. 1992;56(4):447–451.10. Rowe RC, Sheskey PJ, Quinn ME, eds. Handbook of Pharmaceutical Excipients. 6th ed. London, England: APhA; 2009.11. Rosenthal KS, Koussale F. Critical micelle concentration determination of nonionic detergents with Coomassie Brilliant
Blue G-250. Anal Chem. 1983;55(7):1115–1117.12. Herrman KW. Non-ionic—cationic micellar properties of dimethyldodecylamine oxide. J Phys Chem. 1962;66(2):295–
300.13. Leeson LJ, Adair D, Clevenger J, Chiang N. The in vitro development of extended-release solid oral dosage forms. J
Pharmacokinet Biopharm. 1985;13(5):493–514.14. Dressman JB, Amidon GL, Reppas C, Shah VP. Dissolution testing as a prognostic tool for oral drug absorption: immediate
release dosage forms. Pharm Res. 1998;15(1):11–22.
22
Printed on: Fri May 14 2021, 10:23:39 AM(EST)
Official Status: Currently Official on 14-May-2021 DocId: 1_GUID-CE0902BA-77AC-422D-8BF0-A221B5DE6012_5_en-US
Printed by: Deborah Nishikawa Official Date: Official as of 01-Dec-2020 Document Type: GENERAL CHAPTER @2021 USPC
https://online.uspnf.com/uspnf/document/1_GUID-CE0902BA-77AC-422D-8BF0-A221B5DE6012_5_en-US 22/23
Officia
l

15. Food and Drug Administration. Guidance for industry. Waiver of in vivo bioavailability and bioequivalence studies forimmediate-release solid oral dosage forms based on a biopharmaceutics classification system. March 2018. www.fda.gov/downloads/Drugs/.../Guidances/ucm070246.pdf.
16. Kakhi M. Classification of the flow regimes in the flow-through cell. Eur J Pharm Sci. 2009;37(5):531–544.17. Food and Drug Administration. Guidance for industry. Dissolution testing of immediate release solid oral dosage forms.
August 1997. www.fda.gov/downloads/drugs/guidancecomplianceregulatoryinformation/guidances/UCM070237.pdf.18. Food and Drug Administration. 21 CFR Part 11. April 2012. www.accessdata.fda.gov/scripts/cdrh/cfdocs/cfCFR/
CFRSearch.cfm?CFRPart=11.19. International Council for Harmonisation. Q2(R1). Validation of analytical procedures: text and methodology. 1996.
www.ich.org/products/guidelines/quality/quality-single/article/validation-of-analytical-procedures-text-and-methodology.html.
20. International Council for Harmonisation. Q6A. Specifications: test procedures and acceptance criteria for new drugsubstances and new drug products: chemical substances. October 1999. www.ich.org/products/guidelines/quality/quality-single/article/specifications-test-procedures-and-acceptance-criteria-for-new-drug-substances-and-new-drug-produc.html.
21. Food and Drug Administration. Guidance for industry. Extended release oral dosage forms: development, evaluation,and application of in vitro/in vivo correlations. September 1997. www.fda.gov/downloads/Drugs/GuidanceComplianceRegulatoryInformation/Guidances/ucm070239.pdf.
22. USP. Oxycodone Hydrochloride Extended-Release Tablets. In: USP–NF. Rockville, MD: USP; May 1, 2018.online.uspnf.com/uspnf/document/GUID-3067685F-1F92-4358-B483-7AFD0BA1C5AA.
23. USP. Levothyroxine Sodium Tablets. In: USP–NF. Rockville, MD: USP; May 1, 2018. online.uspnf.com/uspnf/document/GUID-023F9323-5475-4068-8E0C-452E09520242.
24. USP. Pantoprazole Sodium Delayed-Release Tablets. In: USP–NF. Rockville, MD: USP; 2018. online.uspnf.com/uspnf/document/GUID-F610DA35-42AF-42F5-804E-FE88520D58D2.
25. ▲Cook AJ. A technique to estimate in vivo dissolution profiles without data from a solution. AAPS J. 2012;14(3):433–436.▲ (USP 1-Dec-2020)
23
Printed on: Fri May 14 2021, 10:23:39 AM(EST)
Official Status: Currently Official on 14-May-2021 DocId: 1_GUID-CE0902BA-77AC-422D-8BF0-A221B5DE6012_5_en-US
Printed by: Deborah Nishikawa Official Date: Official as of 01-Dec-2020 Document Type: GENERAL CHAPTER @2021 USPC
https://online.uspnf.com/uspnf/document/1_GUID-CE0902BA-77AC-422D-8BF0-A221B5DE6012_5_en-US 23/23
Officia
l