10th european ifrs power and utilities roundtable · 2017-03-07 · 10theuropean ifrs power and...
TRANSCRIPT

10TH European IFRS power and utilities roundtable
29 November 2016

10TH European IFRS power and utilities roundtableChristoph Frei, Secretary General, WEC29 November 2016
© World Energy Council 2016 | www.worldenergy.org | @WECouncil
New energy realitiesNavigating the triple transition
Christoph Frei | Secretary General | World Energy Council November 2016 @chwfrei

© World Energy Council 2016 | www.worldenergy.org | @WECouncil
World population1970-2060
0
2
4
6
8
10
12
-
2
4
6
8
10
12
1 6 11 16 21 26 31 36 41 46 51 56 61 66 71 76 81 86 91
2.0 x
1.4x
Forecast(2015-2060)
Bill
ions
of P
eopl
e Billions of People
Source: UN Population Forecasts to 2100
Actuals(1970-2015)
UN Population Growth (Billions of People)
1.2x
1.6x

© World Energy Council 2016 | www.worldenergy.org | @WECouncil
0.6%
-0.4
%
2.7%
-0.7
%
0.4%
2.2%
2.9%
1.0%
0.2%
1.4% 1.
9%
0.2%
2.5% 2.1% 3.
3%
1.0%
0.5%
0.2%
2.4%
-0.4
%
1.0%
2.2%
3.0%
1.0%
6%
1 2 3 4 5 6 7 8 9
Series1 Series2 Series3
Growth in the past 45 years (1970-2015)Climate Change Challenge
Carbon Intensity % reduction p.a. 1970-2015(GtCO2/GDP USD)
Note: Positive % changes denote a reduction in CO2 per USD of GDP Source: Total Economy Database, BP (2015) Statistical Review, IPCC (2015) “AR5, Synthesis Report”;
2015-2060(GtCO2/GDP USD)
Note: Assumes global GDP growth of 2.6%
De-carbonization for 1000 GtCO2

© World Energy Council 2016 | www.worldenergy.org | @WECouncil
New business models:All sectors

© World Energy Council 2016 | www.worldenergy.org | @WECouncil
Financing Resilient Energy InfrastructureExtreme Weather Events
Number of natural catastrophes, 1970-2014: factor 4
Insured catastrophe losses, 1970-2014
Source: WEC Financing Resilience Report, 2015 (October 1); also Swiss Re, 2015: Sigma report No 2/2015
0
20
40
60
80
100
120
140
160
180
200
1970 1975 1980 1985 1990 1995 2000 2005 2010
Natural catastrophes
Source: Swiss Re Sigma 02/2015
• Comparing the last 5 years to the last 20 years: The occurrence of extreme events has roughly quadrupled; according to IPCC this is largely related to the 40% increase of carbon dioxide in the atmosphere.
• From impact-resistant “hard”/‘safe-fail’ components to “soft”/‘fail-safe’ systems. • The solution appears to be ‘smarter not stronger’.

© World Energy Council 2016 | www.worldenergy.org | @WECouncil© World Energy Council 2015© World Energy Council 2015© World Energy Council 2015
. . . .. . . . . . . . .
.
.
.
.
.
.
.
.
.
.
.
.
.
.
.
.
.
.
.
.
climate framework
large scale accidents
economic growth
capital markets
commodity prices
electricity prices
exchange rates
energy water nexus
land use
talent
energy access
energy affordability
extreme weather risks
cyber threats
corruption
terrorism
China
IndiaRussia
EU CohesionMiddle East dynamics
US policytrade barriers
regional integration
market design
energy subsidies
decentralised systems
sustainable cities
energy efficiencycoal
ccs
renewable energiesbiofuels
digitalisationinnovative transport
electric storage
nuclear
hydro
unconventionals
LNG
hydrogen economy
weak signals need for action:
what keeps energyleaders busy at work
critical uncertainties: what keeps energyleaders awake at night
World Energy Issues Monitor 2016
Global map

© World Energy Council 2016 | www.worldenergy.org | @WECouncil© World Energy Council 2015© World Energy Council 2015© World Energy Council 2015
. . . .. . . . . . . . .
.
.
.
.
.
.
.
.
.
.
.
.
.
.
.
.
.
.
.
.
climate frameworklarge scale accidents
economic growth
capital markets
commodity prices
electricity prices
exchange rates
energy water nexus
land use
talent
energy access
energy affordability
extreme weather risks
cyber threats
corruption
terrorism
China
IndiaRussia
EU CohesionMiddle East dynamics
US policytrade barriers
regional integrationmarket design
energy subsidies
decentralised systems
sustainable cities
energy efficiencycoal
ccs
renewable energiesbiofuels
digitalisationinnovative transport
electric storage
nuclear
hydro
unconventionals
LNG
hydrogen economy
► Key insomnia issues are of macro nature: new growth normal, commodity price volatility, climate framework uncertainty and regional integration / cohesion.
World Energy Issues Monitor 2016
Global map

© World Energy Council 2016 | www.worldenergy.org | @WECouncil© World Energy Council 2015© World Energy Council 2015© World Energy Council 2015
. . . .. . . . . . . . .
.
.
.
.
.
.
.
.
.
.
.
.
.
.
.
.
.
.
.
.
climate frameworklarge scale accidents
economic growth
capital markets
commodity prices
electricity prices
exchange rates
energy water nexus
land use
talent
energy access
energy affordability
extreme weather risks
cyber threats
corruption
terrorism
China
IndiaRussia
EU CohesionMiddle East dynamics
US policytrade barriers
regional integrationmarket design
energy subsidiesdecentralised systems
sustainable cities
energy efficiencycoal
ccs
renewable energiesbiofuels
digitalisationinnovative transport
electric storage
nuclear
hydro
unconventionals
LNG
hydrogen economy
► Key action priorities remain constant: renewables, energy efficiency, followed by subsidies and electricity prices.
World Energy Issues Monitor 2016
Global map

© World Energy Council 2016 | www.worldenergy.org | @WECouncil© World Energy Council 2015© World Energy Council 2015© World Energy Council 2015
. . . .. . . . . . . . .
.
.
.
.
.
.
.
.
.
.
.
.
.
.
.
.
.
.
.
.
climate frameworklarge scale accidents
economic growth
capital markets
commodity prices
electricity prices
exchange rates
energy water nexus
land useenergy access
energy affordability
extreme weather risks
cyber threats
corruption
terrorism
China
IndiaRussia
EU CohesionMiddle East dynamics
US policytrade barriers
regional integration
energy subsidies
sustainable cities
energy efficiencycoal
ccs
renewable energiesbiofuels
innovative transport
nuclear
hydro
unconventionals
LNG
hydrogen economy
decentralised systems
electric storage
digitalisationmarket design
► The innovation cluster continues to move up: e-storage, digitalisation, decentralised systems.
talent
World Energy Issues Monitor 2016
Global map: key upward trends

© World Energy Council 2016 | www.worldenergy.org | @WECouncil© World Energy Council 2015© World Energy Council 2015© World Energy Council 2015
. . . .. . . . . . . . .
.
.
.
.
.
.
.
.
.
.
.
.
.
.
.
.
.
.
.
.
climate frameworklarge scale accidents
economic growth
capital markets
commodity prices
electricity prices
exchange rates
energy water nexus
land useenergy access
energy affordability
extreme weather risks
cyber threats
corruption
terrorism
China
IndiaRussia
EU CohesionMiddle East dynamics
US policytrade barriers
regional integrationmarket design
energy subsidiesdecentralised systems
sustainable cities
energy efficiencycoal
ccs
renewable energiesbiofuels
digitalisationinnovative transport
electric storage
hydro
unconventionals
LNG
hydrogen economy
nuclear
► CCS, unconventionals and nuclear and coal are issues which have seen the biggest cooling down over past years.
talent
World Energy Issues Monitor 2016
Global map: key downward trends

© World Energy Council 2016 | www.worldenergy.org | @WECouncil© World Energy Council 2015© World Energy Council 2015© World Energy Council 2015
. . . .. . . . . . . . .
.
.
.
.
.
.
.
.
.
.
.
.
.
.
.
.
.
.
.
.
climate frameworklarge scale accidents
economic growth
capital markets
commodity prices
electricity prices
exchange rates
energy water nexus
land useenergy access
energy affordability
extreme weather risks
corruption
terrorism
China
IndiaRussia
EU CohesionMiddle East dynamics
US policytrade barriers
regional integrationmarket design
energy subsidiesdecentralised systems
sustainable cities
energy efficiencycoal
ccs
renewable energiesbiofuels
digitalisationinnovative transport
electric storage
nuclear
hydro
unconventionals
LNG
hydrogen economy
cyber threats
talent
ResilienceWorld Energy Issues Monitor 2016

© World Energy Council 2016 | www.worldenergy.org | @WECouncil© World Energy Council 2015© World Energy Council 2015
. . . .. . . . . . . . .
.
.
.
.
.
.
.
.
.
.
.
.
.
.
.
.
.
.
.
.
climate framework
large scale accidents
economic growth
capital markets
commodity prices
electricity prices
exchange rates
energy water nexus
land use
talent
energy access
energy affordability
extreme weather risks
cyber threats
corruption
terrorism
China
IndiaRussia
EU CohesionMiddle East dynamics
US policytrade barriers
regional integration
market design
energy subsidies
decentralised systems
sustainable cities
energy efficiencycoal
ccs
renewable energiesbiofuels
digitalisationinnovative transport
electric storage
nuclear
hydro
unconventionals
LNG
hydrogen economyVenezuela United States
United Kingdom
United Arab Emirates
Tunisia
Trinidad & Tobago
Switzerland
Swaziland
Spain South KoreaSouth Africa
Singapore
Serbia
Senegal
Saudi Arabia
Russian Federation
Portugal
Peru
Norway
Nigeria
Niger
Netherlands
Mongolia
Monaco
Mexico
Malaysia
Lithuania
Lebanon
Latvia
Kenya
Jordan
Japan
Italy
Ireland
Iraq
Iran
Indonesia
India
Iceland
Hungary
Hong Kong
Ghana
Germany
Gabon
France
Finland
Ethiopia
Estonia
Ecuador
Dominican Republic
Czech Republic
Cyprus
Cote d'Ivoire
Congo (Democratic Republic of)
Colombia
China
Chad
Canada
Burkina Faso
Bulgaria
Brazil
Botswana
Bolivia
BelgiumAustria
Australia
Argentina
Algeria
© World Energy Council 2015
► Countries with highest concerns for cyber threats are in East Asia and Europe.
cyber threats
ResilienceWorld Energy Issues Monitor 2016

© World Energy Council 2016 | www.worldenergy.org | @WECouncil
► Fast economic growth► Strong technological development► Transition to a highly productive
world► Handles well the economic and
geopolitical shift to Asia► Broadly addresses sustainability► Developments on the energy
supply-side and in the mid-stream reduce energy costs
► Greater access to energy for all
Free market driven approach to achieving individual access and affordability of energy through
economic growth
MODERN JAZZ
► Moderate economic growth (slower, more sustainable, more evenly distributed)
► Delivery of high levels of infrastructure
► Extensive network of fiscal incentives such as green subsidies and carbon pricing
► Global standardization across sectors
► Strong tech. innovation in large-scale, integrated solutions that drive efficiencies & reduce carbon emissions
Government-driven approach to achieving sustainability through
internationally coordinated politics and practices
UNFINISHED SYMPHONY
► Stagnated economic growth► Ineffective policies and failed
market structures► Poverty and inequity drag down
social and economic mobility► Weakening resilience of energy
systems► Large scale (national) energy
solutions driven by security concerns: hydro, nuclear, fossil fuels
Fragmented approach driven by desire for energy security in a
world with low global cooperation
HARD ROCK
21
Three Scenarios Stories

© World Energy Council 2016 | www.worldenergy.org | @WECouncil
Energy Demand
22
Energy Demand
(‘000 MTOE)
0
2
4
6
8
10
12
14
16
18
20
1 2 3 4 5 6 7 8 9 10 11 12 13 14 15 16 17 18 19
Series1 Series2
Series3 Series4
Energy Demand per capita
(TOE)
1.0
1.2
1.4
1.6
1.8
2.0
2.2
1 2 3 4 5 6 7 8 9 10 11 12 13 14 15 16 17 18 19
Series1 Series2
Series3 Series4
peaking at equivalent of 2500 W

© World Energy Council 2016 | www.worldenergy.org | @WECouncil
Carbon Emissions and Carbon Budget
23
0
5
10
15
20
25
30
35
40
1 2 3 4 5 6 7 8 9 10 11 12 13
Series1
Series2
Series3
Series4
Series5
Cumulative Carbon Emissions from 2015
(Gt CO2)
0
200
400
600
800
1,000
1,200
1,400
1,600
1,800
1 6 11 16 21 26 31 36 41 46
Series1 Series2
Series3
Annual Carbon Emissions
(Gt CO2)
CarbonBudget
year of reaching & exceeding carbon budget
© World Energy Council 2016 | www.worldenergy.org | @WECouncil
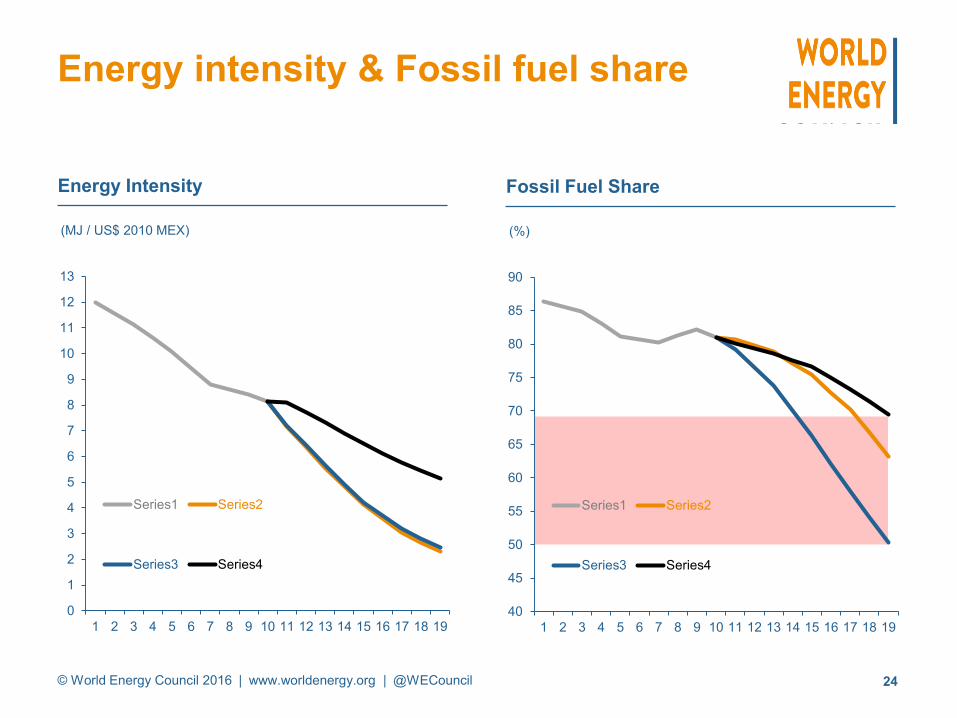
Energy intensity & Fossil fuel share
24
Energy Intensity
(MJ / US$ 2010 MEX)
0
1
2
3
4
5
6
7
8
9
10
11
12
13
1 2 3 4 5 6 7 8 9 10 11 12 13 14 15 16 17 18 19
Series1 Series2
Series3 Series4
Fossil Fuel Share
(%)
40
45
50
55
60
65
70
75
80
85
90
1 2 3 4 5 6 7 8 9 10 11 12 13 14 15 16 17 18 19
Series1 Series2
Series3 Series4

© World Energy Council 2016 | www.worldenergy.org | @WECouncil
Natural Gas & Nuclear Demand
25
Natural Gas Demand
(‘000 MTOE)
0.0
0.5
1.0
1.5
2.0
2.5
3.0
3.5
4.0
4.5
5.0
5.5
6.0
1 2 3 4 5 6 7 8 9 10 11 12 13 14 15 16 17 18 19
Series1 Series2
Series3 Series4
Nuclear Electricity Generation
(‘000 TWh)
0
1
2
3
4
5
6
7
8
9
1 2 3 4 5 6 7 8 9 10 11 12 13 14 15 16 17 18 19
Series1 Series2
Series3 Series4

© World Energy Council 2016 | www.worldenergy.org | @WECouncil
Wind & Solar Electricity
26
Wind Electricity Generation
(‘000 TWh)
0
1
2
3
4
5
6
7
8
9
1 2 3 4 5 6 7 8 9 10 11 12 13 14 15 16 17 18 19
Series1 Series2
Series3 Series4
Solar Electricity Generation
(‘000 TWh)
0
1
2
3
4
5
6
7
8
9
1 2 3 4 5 6 7 8 9 10 11 12 13 14 15 16 17 18 19
Series1 Series2
Series3 Series4

© World Energy Council 2016 | www.worldenergy.org | @WECouncil
Electricity Generation Mix

© World Energy Council 2016 | www.worldenergy.org | @WECouncil
Transport
29
2014 96%
63%58%
76%
© World Energy Council 2016 | www.worldenergy.org | @WECouncil30
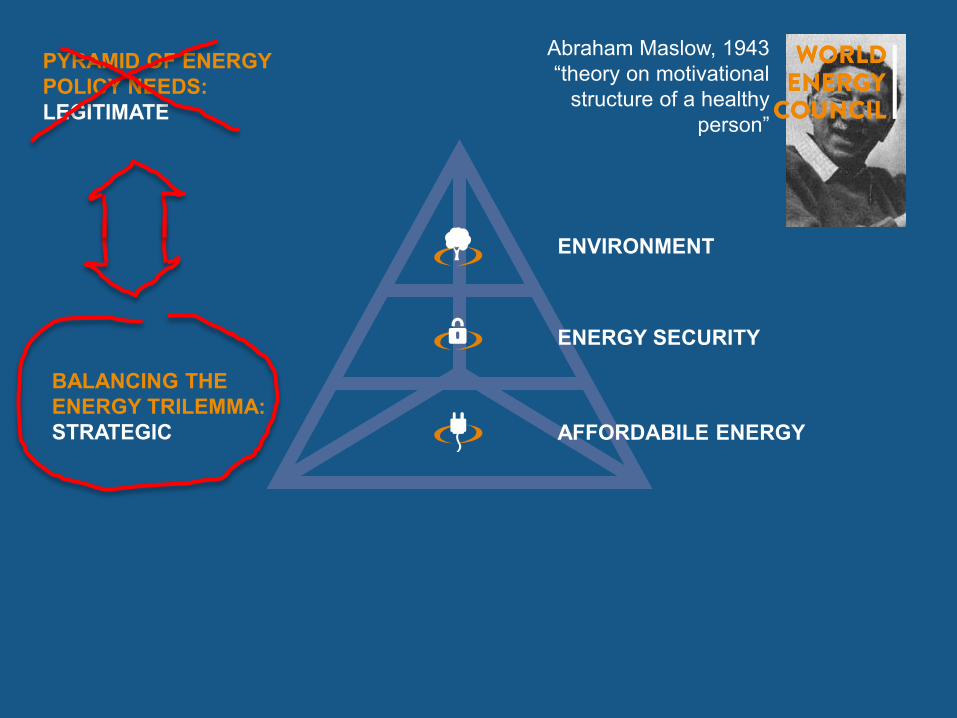
Abraham Maslow, 1943“theory on motivational
structure of a healthy person”
ENVIRONMENT
ENERGY SECURITY
AFFORDABILE ENERGY
PYRAMID OF ENERGY POLICY NEEDS:LEGITIMATE
BALANCING THEENERGY TRILEMMA:STRATEGIC

© World Energy Council 2016 | www.worldenergy.org | @WECouncil
Energy SecurityThe effective management of primary energy supplyfrom domestic and external sources, the reliabilityof energy infrastructure, and the ability of energyproviders to meet current and future demand.
Environmental SustainabilityEncompasses the achievement of supplyand demand side energy efficiencies and thedevelopment of energy supply from renewableand other low-carbon sources.
Energy EquityAccessibility and affordability of energy supplyacross the population.
Balancing the‘Energy Trilemma’
ENERGYEQUITY
ENVIRONMENTALSUSTAINABILITY
World Energy Trilemma
© World Energy Council 2015

© World Energy Council 2016 | www.worldenergy.org | @WECouncil
World Energy Scenarios 2060 UK
World
© World Energy Council 2016 | www.worldenergy.org | @WECouncil
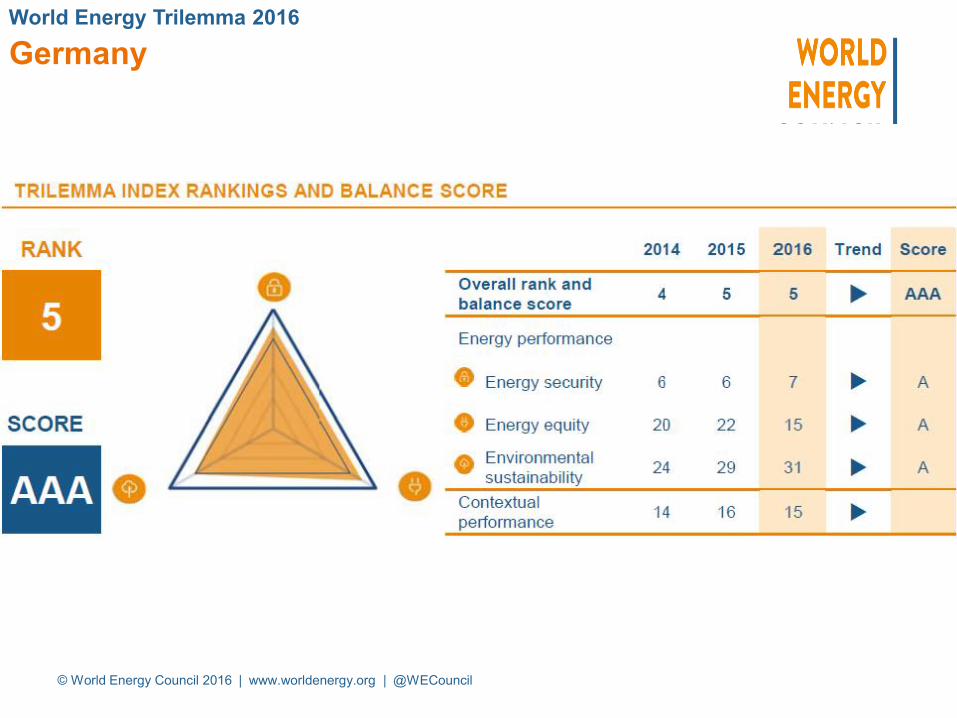
World Energy Trilemma 2016 UK
Germany

© World Energy Council 2016 | www.worldenergy.org | @WECouncil
Priority actions
To meet climate targets, development goals and balance the trilemma a focus on a few key mechanisms is needed
• At the international level:
Trade and transfer Carbon pricing Financing of technology and subsidies mechanisms
• At the national level:
Demand management Prioritisation ofand energy efficiency innovation and RD&D
Financingmechanisms
Demand managementand energy efficiency
Prioritise innovationand RD&D
Trade and transferof technology
Carbonpricing
Financingmechanisms
Demand managementand energy efficiency
Prioritise innovationand RD&D
Trade and transferof technology
Carbonpricing
Financingmechanisms
Demand managementand energy efficiency
Prioritise innovationand RD&D
Trade and transferof technology
Carbonpricing
Financingmechanisms
Demand managementand energy efficiency
Prioritise innovationand RD&D
Trade and transferof technology
Carbonpricing
@chwfrei

© World Energy Council 2016 | www.worldenergy.org | @WECouncil
Defining measures to accelerate the energy transition
35

10TH European IFRS power and utilities roundtable
29 November 2016