11 designing and building a results-based monitoring and evaluation system: a workshop for...
TRANSCRIPT

11
Designing and Building a Results-Based Monitoring
and Evaluation System:
A Workshop for Government Officials and Their Development Partners
A Tool for Public Sector Management
©2000 The International Bank for Reconstruction and Development / THE WORLD BANK
1818 H Street N.W.Washington, DC 20433
All rights reservedManufactured in the United States of America
First printing October 2000

22
Introduction to the Workshop

33
Designing and Building a Results-Based Monitoring and Evaluation System
Table of Contents1Introduction to Workshop2Introduction to Monitoring and Evaluation3Step 1 – Conducting a “Readiness Assessment”4Step 2 – Agreeing on Outcomes to Monitor and Evaluate5Step 3 – Selecting Key Indicators toMonitor Outcomes
A Tool for Public Sector Management
44
Designing and Building Results-Based
Monitoring and Evaluation System (Cont.)
Table of Contents6Step 4 – Baseline Data on Indicators—Where Are We Today?7Step 5 – Planning for Improvement—Setting Results Targets8Step 6 – Monitoring for Results9Step 7 – The Role of Evaluations10Step 8 – Reporting Your Findings11Step 9 – Using Your Findings12Step 10 – Sustaining the Monitoring and Evaluation System within Your Organization

55
Goals for This Workshop
• To prepare you to plan, design, and implement a results-based monitoring and evaluation system within your organization
• To demonstrate how an M&E system is a valuable tool to support good public management
66
• This workshop focuses on ten steps that describe how results-based monitoring and evaluation systems are designed and built
• These steps begin with conducting a “Readiness Assessment” and on through designing and managing your monitoring and evaluation system
• We will be discussing these steps, the tasks needed to complete them, and the tools available to help along the way
Workshop Overview

77
Ten Steps to Designing, Building and Sustaining a Results-Based Monitoring
and Evaluation System
Conducting a Readiness
Assessment
Agreeing on Outcomes to Monitor and
Evaluate
Selecting Key Indicators to
Monitor Outcomes
Baseline Data on
Indicators—Where Are We Today?
Planning for Improvement — Selecting
Results Targets
Monitoring for Results
The Role of Evaluations
Reporting Your Findings
Using Your
Findings
Sustaining the
M&E System Within Your Organization
1 2 3 4 5 6 7 9 108
88
Introduction to Results-Based Monitoring and Evaluation

99
The Power of Measuring Results
• If you do not measure results, you can not tell success from failure
• If you can not see success, you can not reward it
• If you can not reward success, you are probably rewarding failure
• If you can not see success, you can not learn from it
• If you can not recognize failure, you can not correct it
• If you can demonstrate results, you can win public support
Adapted from Osborne & Gaebler, 1992

1010
Introduction to Results-Based Monitoring and Evaluation
• Results-based monitoring and evaluation measures how well governments are performing
• Results-based monitoring and evaluation is a management tool!
• Results-based monitoring and evaluation emphasizes assessing how outcomes are being achieved over time
What Are We Talking About?

1111
Who Are Stakeholders That Care About Government Performance?
• Government officials/Parliament
• Program managers and staff
• Civil society (Citizens, NGOs, Media, Private Sector etc.)
• Donors
1212
Remember
• Monitoring and evaluation are two separate, but interrelated strategies to collect data and report the findings on how well (or not) the public sector is performing
• During this workshop, we will be discussing:
– Monitoring as a tool
– Evaluation as a tool
– How the two interrelate to support good public management
– The ten steps to build a results-based monitoring and evaluation system to measure government performance

1313
Reasons to Do Results-Based M&E
• Provides crucial information about public sector performance
• Provides a view over time on the status of a project, program, or policy
• Promotes credibility and public confidence by reporting on the results of programs
• Helps formulate and justify budget requests
• Identifies potentially promising programs or practices

1414
Reasons to Do Results-Based M&E (cont.)
• Focuses attention on achieving outcomes important to the organization and its stakeholders
• Provides timely, frequent information to staff
• Helps establish key goals and objectives
• Permits managers to identify and take action to correct weaknesses
• Supports a development agenda that is shifting towards greater accountability for aid lending

1515
Important…
• It takes leadership commitment to achieve a better-performing organization
• Plus redeployment of resources to build monitoring and evaluation systems
• Plus individuals committed to improve public sector performance
So…it comes down to a combination of institutional capacity and political will.

1616
Definition
Results-Based Monitoring (what we will call “monitoring”) is a continuous process of collecting and analyzing information to compare how well a project, program or policy is performing against expected results

1717
Major Activities Where Results Monitoring Is Needed
• Setting goals and objectives
• Reporting to Parliament and other stakeholders
• Managing projects, programs and policies
• Reporting to donors
• Allocating resources

1818
A New Emphasis on Both Implementation and Results-Based Monitoring
• Traditional monitoring focuses on implementation monitoring
– This involves tracking inputs ($$, resources, strategies), activities (what actually took place) and outputs (the products or services produced)
– This approach focuses on monitoring how well a project, program or policy is being implemented
– Often used to assess compliance with workplans and budget

1919
• Results-based monitoring involves the regular collection of information on how effectively government (or any organization) is performing
• Results-based monitoring demonstrates whether a project, program, or policy is achieving its stated goals
A New Emphasis on Both Implementation and Results-Based Monitoring

2020
Results-Based Monitoring
Outcomes • Intermediate effects of outputs on clients
Outputs • Products and services produced
Activities• Tasks personnel
undertake to transform inputs to outputs
Inputs • Financial, human, and material resources
Goal(Impacts)
• Long-term, widespread improvement in society
Impl
emen
tatio
nR
esul
ts
Binnendijk, 2000

2121
Results-Based Monitoring:Oral Re-hydration Therapy
Binnendijk, 2000
Outcomes• Improved use of ORT in
management of childhood diarrhea
Outputs • Increased maternal knowledge of and access to ORT services
Activities• Media campaigns to educate
mothers, health personnel trained in ORT, etc.
Inputs • Funds, ORT supplies, trainers, etc.
Goal(Impacts)
• Child mortality and morbidity reduced

2222
Results-Based Monitoring: Adult Literacy
Outcomes • Increased literacy skill; more employment opportunities
Outputs • Number of adults completing literacy courses
Activities • Literacy training courses
Inputs • Facilities, trainers, materials
Goal(Impacts)
• Higher income levels; increase access to higher skill jobs

2323
• Goal: Ensure Healthier Children in Rural Communities
–Information is made available for parents about the importance of sterilizing water before making formula
–Fewer children are going to hospital to be treated for diarrhea diseases
–Increased numbers of Babies drink formula that has been made from sterilized water
–Children morbidity rates decrease in local community
–New funds available to introduce information campaign on sterilizing water in making baby formula
–Knowledge among parents grows about importance of boiling water before making infant formula
Exercise: Identify the Sequence of Inputs, Activities, Outputs and Outcomes

2424
• Goal: Create economically viable women-owned micro-enterprises
– Government makes available funds for micro-enterprise loans
– Government approves 61 applications from program graduates
– 90% of successful applicants begin operating new businesses after government approves application
– 15 qualified course trainers available
– 72 women complete training
– Income of graduates increases 25% in first year after course completion
– 100 women attend training in micro-enterprise business management
Exercise: Identify the Sequence of Inputs, Activities, Outputs and Outcomes

2525
Infant Health Girls Education
PolicyMonitoring
Decreasing InfantMortality Rates
Increasing girls education attainment
ProgramMonitoring
Clinic-based pre-natal care is being used by pregnant women
# of girls in secondary schools completing math and science courses
ProjectMonitoring
Information on good pre-natal care provided in 6 targeted villages
# of girls in four urban neighborhoods completing primary education
Some Examples of Results Monitoring

2626
Definition
Results-Based Evaluation An assessment of a planned, ongoing, or completed intervention to determine its relevance, efficiency, effectiveness, impact and sustainability. The intent is to incorporate lessons learned into the decision-making process.

2727
Evaluation Addresses
“Why” Questions – What caused the changes we are monitoring
“How” Questions – What was the sequence or processes that led to successful (or not) outcomes
“Compliance/ Accountability Questions”
Process/Implementation Questions
– Did the promised activities actually take place and as they were planned?
Was the implementation process followed as anticipated, and with what consequences

2828
Designing Good Evaluations
• Getting the questions right is critical
• Answering the questions is critical
• Supporting public sector decision-making with credible and useful information is critical

2929
Designing Good Evaluations
“Better to have an approximate answer to the right question, than an exact answer to the wrong question.”
Paraphrased from statistician John W. Tukey
“Better to have an approximate answer to the right question, than an exact answer to the wrong question.”
Paraphrased from statistician John W. Tukey

3030
Designing Good Evaluations
“Better to be approximately correctthan precisely wrong.”
Paraphrased fromBertrand Russell
“Better to be approximately correctthan precisely wrong.”
Paraphrased fromBertrand Russell

3131
Some Examples of Evaluation
Privatizing Water Systems Resettlement
Policy Evaluations
Comparing model approaches to privatizing public water supplies
Comparing strategies used for resettlement of rural villages to new areas
Program Evaluations
Assessing fiscal management of government systems
Assessing the degree to which resettled village farmers maintain previous livelihood
Project Evaluations
Assessing the improvement in water fee collection rates in 2 provinces
Assessing the farming practices of resettled farmers in one province

3232
Complementary Roles of Results-Based Monitoring and Evaluation
Monitoring Evaluation
Clarifies program objectives Analyzes why intended results were or were not achieved
Links activities and their resources to objectives
Assesses specific causal contributions of activities to results
Translates objectives into performance indicators and set targets
Examines implementation process
Routinely collects data on these indicators, compares actual results with targets
Explores unintended results
Reports progress to managers and alerts them to problems
Provides lessons, highlights significant accomplishment or program potential, and offers recommendations for improvement
3333
Summary
• Results-based monitoring and evaluation are generally viewed as distinct but complementary functions
• Each provides a different type of performance information
• Both are needed to be able to better manage policy, program, and project implementation

3434
Summary
• Implementing results-based monitoring and evaluation systems can strengthen public sector management
• Implementing results-based monitoring and evaluation systems requires commitment by leadership and staff alike
• We are discussing a political process with technical dimensions – not the reverse

3535
Ten Steps to Designing, Building and Sustaining a Results-Based Monitoring
and Evaluation System
Conducting a Readiness
Assessment
Agreeing on Outcomes to Monitor and
Evaluate
Selecting Key Indicators to
Monitor Outcomes
Baseline Data on
Indicators—Where Are We Today?
Planning for Improvement — Selecting
Results Targets
Monitoring for Results
The Role of Evaluations
Reporting Your Findings
Using Your
Findings
Sustaining the
M&E System Within Your Organization
1 2 3 4 5 6 7 9 108

3636
Step 1
Conducting a “Readiness Assessment”

3737
Conducting a Readiness Assessment
Agreeing on Outcomes to Monitor and
Evaluate
Selecting Key Indicators to
Monitor Outcomes
Baseline Data on
Indicators—Where Are We Today?
Planning for Improvement — Selecting
Results Targets
Monitoring for Results
The Role of Evaluations
Reporting Your Findings
Using Your
Findings
Sustaining the
M&E System Within Your Organization
1 2 3 4 5 6 7 9 1081
Step One: Conducting a Readiness Assessment

3838
What is a Readiness Assessment?
An analytical framework to assess a country’s ability to monitor and evaluate its development goals :

3939
Why Do a Readiness Assessment?
1. To understand what incentives (or lack thereof) exist to effectively monitor and evaluate development goals?
2. To understand the roles and responsibilities of those organizations and individuals involved in monitoring and evaluating government policies, programs, and projects? E.g.
– Supreme Audit Office
– Ministry of Finance
– Parliament
– Ministry of Planning
3. To identify issues related to the capacity ( or lack of) to monitor and evaluate government programs

4040
• First examine whether incentives exist in any of these four areas to begin designing and building an M&E system?
– Political (citizen demand)
– Institutional (legislative/legal framework)
– Personal ( desire to improve government= champions)
– Economic ( donor requirement)
Incentives Help Drive The Need For A Results System

4141
Champions Can Help Drive A Results System
• Who are the champion(s) and what is motivating them?
– Government (social reforms)
– Parliament (effective expenditures)
– Civil society (holding government accountable)
– Donors (PRSP)
– Others
– Note: who will not benefit?

4242
• Assess the roles and responsibilities and existing structures to monitor and evaluate development goals
- What is the role of central and line ministries?
- What is the role of Parliament?
- What is the role of the Supreme Audit Agency?
- What is the role of civil society?
- What is the role of statistical groups/agencies?
Roles and Responsibilities

4343
Roles and Responsibilities
• Who in the country produces data?
– National Government:
• Central ministries (MOF, MOP)
• Line ministries
• Specialized units/offices(National Audit Office)
• Census Bureau
• National Statistics Office

4444
• Who in the country produces data?
– Sub-national/regional government:
• Provincial central ministries
• Provincial line ministries
• Other?
– Local government
– NGO’s
– Donors
– Others
Role and Responsibilities (Cont.)

4545
Roles and Responsibilities (Cont.)
• Where in the government are data used?
– Preparing the budget
– Resource allocation
– Program policy making
– Parliament/legislation & accountability
– Planning
– Fiscal management
– Evaluation and oversight

4646
• Assess current capacity to monitor and evaluate:
– Technical skills
– Managerial skills
– Existing data systems and their quality
– Technology available
– Fiscal resources available
– Institutional experience
Capacity

4747
Barriers
• Do any of these immediate barriers now exist to getting started in building an M&E system?
– Lack of fiscal resources
– Lack of political will
– Lack of champion
– Lack of expertise & knowledge
– Lack of strategy
– Lack of prior experience

4848
Key Elements of Success
• Assess the Country’s Capacity Against the Following:
– Does a clear mandate exist for M&E?
• PRSP?, Law? Civil Society? Other?
– Is there the presence of strong leadership at the most senior level of the government?
– Are resource and policy decisions linked to the budget?
– How reliable is information that may be used for policy and management decision making?
– How involved is civil society as a partner with government, or voice with government?
– Are there pockets of innovation that can serve as beginning practices or pilot programs?

4949
Step 2
Choosing Outcomes to Monitor & Evaluate

5050
Conducting a Readiness
Assessment
Agreeing on Outcomes to Monitor and
Evaluate
Selecting Key Indicators to
Monitor Outcomes
Baseline Data on
Indicators—Where Are We Today?
Planning for Improvement — Selecting
ResultsTargets
Monitoring for Results
The Role of Evaluations
Reporting Your Findings
Using Your
Findings
Sustaining the
M&E System Within Your Organization
1 2 3 4 5 6 7 9 1082
Agreeing on Outcomes to Monitor and Evaluate

5151
Why an Emphasis on Outcomes?
• Makes explicit the intended objectives of government action
(“Know where you are going before you get moving”)
• Outcomes are what produce benefits
• They tell you when you have been successful or not

5252
Why Is It Important to Choose a Set of Key Goals or Outcomes?
“If you don’t know where you’re going, any road will get you there.”
Paraphrased from Lewis Carroll’s Alice in
Wonderland
“If you don’t know where you’re going, any road will get you there.”
Paraphrased from Lewis Carroll’s Alice in
Wonderland

5353
Issues to Consider in Choosing Outcomes to Monitor and Evaluate
• Are there stated national/sectoral goals?
• Have political promises been made that specify improved performance of the government?
• Do citizen polling data indicate specific concerns?
• Is authorizing legislation present?
• Other? (Millennium Development Goals)
• Is aid lending linked with specific goals?

5454
Note: When Choosing Outcomes, Remember – “Do Not Go It Alone!”
• Develop a participative approach that includes the views and ideas of key stakeholder groups

5555
Choosing Outcomes—who Needs to be at the Table?
Who – Government Civil Society Donors
Why – To build consensus for the process

5656
“The new realities of governance, globalization, aid lending, and citizen expectations require an approach that is consultative, cooperative and committed to consensus building.”
Why Building Consensus Is Important

5757
Developing Outcome Statements
Rural Crops are spoiling before getting to the
market
Improve Farmers Access to Markets
Children are dropping out of
School
No Longer safe to go out after
dark
Create Incentives For Families To
Keep Kids In School
Improve crime prevention programs
From To
Reformulate the concerns identified by stakeholders into positive, desirable outcomes
5858
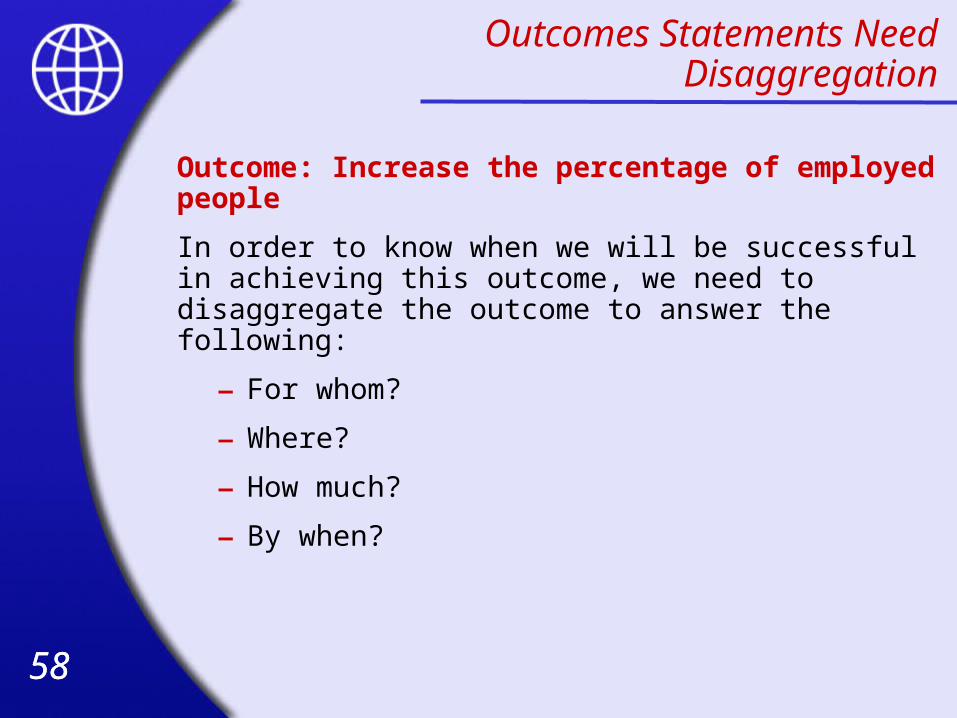
Outcomes Statements Need Disaggregation
Outcome: Increase the percentage of employed people
In order to know when we will be successful in achieving this outcome, we need to disaggregate the outcome to answer the following:
– For whom?
– Where?
– How much?
– By when?
5959
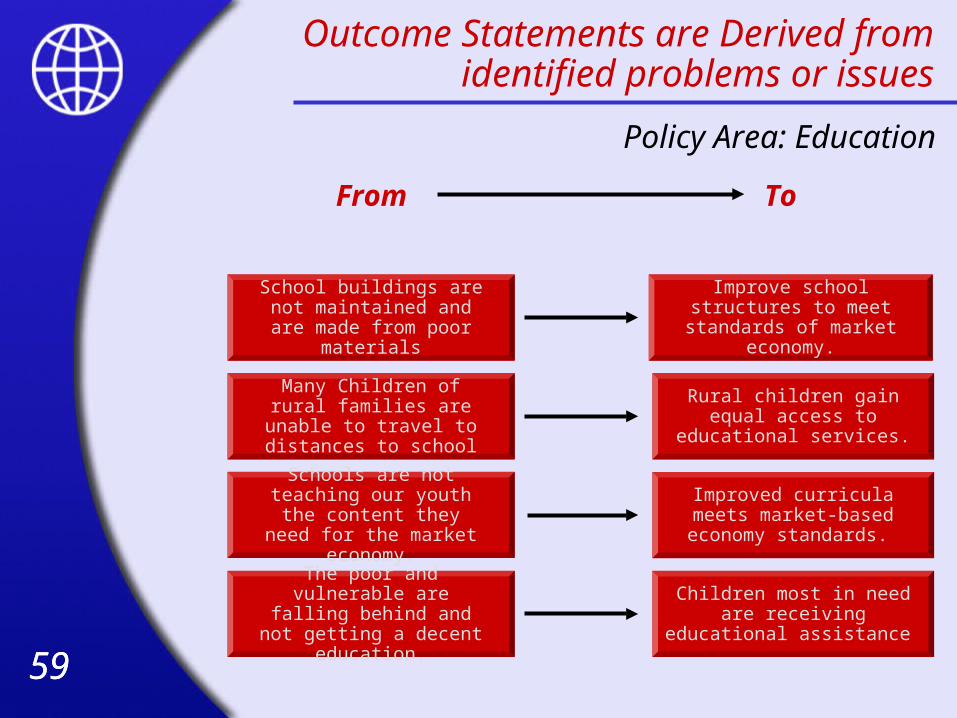
Outcome Statements are Derived from identified problems or issues
From To
School buildings are not maintained and are made
from poor materials
Many Children of rural families are unable to travel
to distances to school
Improve school structures to meet standards of market
economy.
Rural children gain equal access to educational services.
Schools are not teaching our youth the content they
need for the market economy.
The poor and vulnerable are falling behind and not
getting a decent education.
Improved curricula meets market-based economy
standards.
Children most in need are receiving educational
assistance
Policy Area: Education

6060
Outcome Statements Should Capture Only One Objective
Why? Consider this Outcome Statement:
- Students in rural areas improve learning and gain better quality of life.
What are the measurement issues??

6161
Developing Outcomes for One Policy Area:
176176
Primary school learning outcomes for children are improved.
2.
Nation’s children have Improved access to pre-school programs
1.
TargetsBaselinesIndicatorsOutcomes
Example: Education

6262
• Makes explicit the intended objectives of government action
(“Know where you are going before you get moving”)
• Outcomes are the results governments hope to achieve
• Clear setting of outcomes is key to results-based M&E system
• Note: Budget to outputs, manage to outcomes!
In Summary:Why an Emphasis on Outcomes?

6363
Outcomes must be translated to a set of key indicators
Outcomes must be translated to a set of key indicators
Outcomes Summary Continued
Outcomes are usually not directly measured—only reported on
Outcomes are usually not directly measured—only reported on
6464
Step 3
Selecting Key Indicators to Monitor Outcomes

6565
Conducting a Readiness
Assessment
Agreeing on Outcomes to Monitor and
Evaluate
Selecting Key Indicators to
Monitor Outcomes
Baseline Data on
Indicators—Where Are We Today?
Planning for Improvement — Selecting
Results Targets
Monitoring for Results
The Role of Evaluations
Reporting Your Findings
Using Your
Findings
Sustaining the
M&E System Within Your Organization
1 2 3 4 5 6 7 9 1083
Selecting Key Performance Indicators to Monitor Outcomes

6666
Selecting Key Performance Indicators to Monitor Outcomes
• Outcome indictors are not the same as outcomes
• Each outcome needs to be translated into one or more indicators
– An outcome indicator identifies a specific numerical measurement that tracks progress (or not) toward achieving an outcome
Urban Institute 1999

6767
An Outcome Indicator
Answers the question:
“How will we know success when we see it?”
“How will we know success when we see it?”

6868
Selecting Outcome Indicators
The “CREAM” of Good Performance
A good performance indicator must be:
Clear (Precise and unambiguous)
Relevant (Appropriate to subject at hand)
Economic (Available at reasonable cost)
Adequate (Must provide a sufficient basis to assess performance)
Monitorable (Must be amenable to independent validation)
Salvatore-Schiavo-Campo 2000

6969
When Selecting Your Project, Program, or Policy Indicators
• Select several for any one outcome
• Make sure the interest of multiple stakeholders are considered
• Know that over time, it is ok (and expected) to add new ones and drop old ones
• Have at least three points of measurement before you consider changing your indicator

7070
How Many Indicators Are Enough?
The minimum number that answers the question:
“Has the outcome been achieved?” “Has the outcome been achieved?”

7171
Why Use Proxy Indicators?
• Only use indirect measures (proxies) when data for direct indicators are not available or feasible to collect at regular intervals
• Example…
– Number of new tin roofs or televisions as a proxy measure of increased household income

7272
Indicators - Outcome or not?
• % change in annual revenue of farmers
• % change in amount of spoiled crops
• % change in crop pricing due to competition
• % change in agricultural employment
• % change in rural to urban migration
• % change in types of crops being cultivated
Outcome: Increased Access of Farmers to Markets
An Example

7373
Indicators – Outcome or not?
• % in missed school days due to illness
• % reduction in hospital admission due to illness
• More medical doctors hired
• % change in prevalence of communicable diseases
• Number of children immunized
• % working days missed by parents
• % change in childhood gastrointestinal diseases
Outcome: Reduction in Childhood Morbidity
An Example

7474
Developing A Set of Outcomes Indicators for a Policy Area:
Example: Education
Outcomes Indicators Baselines Targets
1. Nation’s children have improved access to pre-school programs
1. % of eligible urban children enrolled in pre-school education
2. % of eligible rural children enrolled in pre-school education
2. Primary school learning outcomes for children are improved
1. % of Grade 6 students scoring 70% or better on standardized math and science tests

7575
Checklist for Assessing Proposed Indicators
Outcome to be measured: ______________________________
Indicator selected: ____________________________________
Is the Indicator…
1 As direct as possible a reflection of the outcome itself?
2 Sufficiently precise to ensure objective measurement?
3 Calling for the most practical, cost-effective collection of data
4 Sensitive to change in the outcome, but relatively unaffected by other changes?
5 Disaggregated as needed when reporting on the outcome?
United Way of America
7676
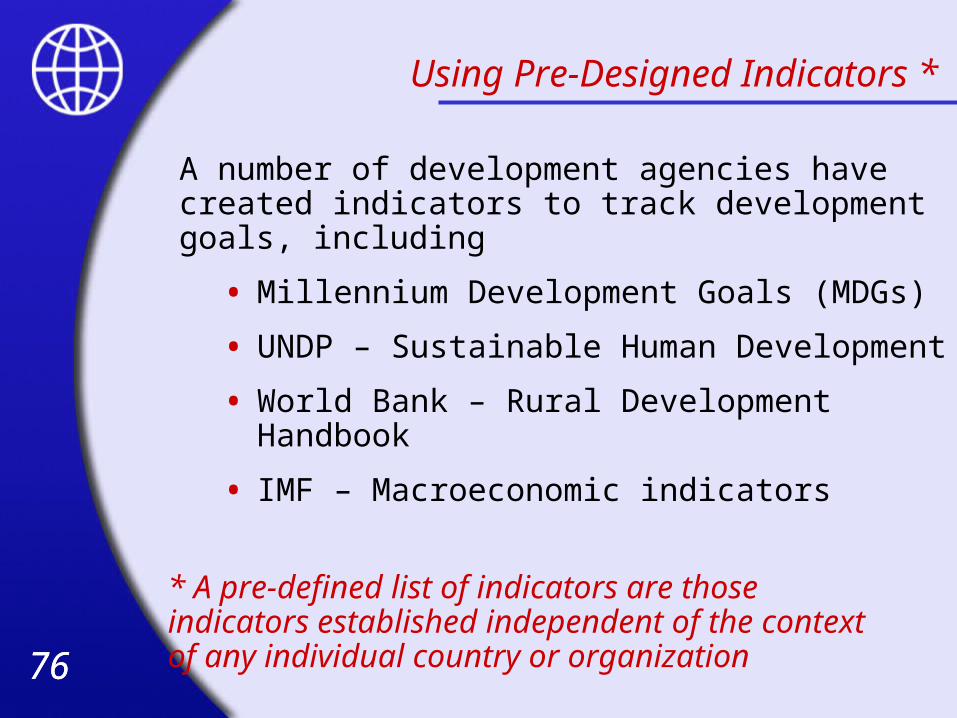
Using Pre-Designed Indicators *
A number of development agencies have created indicators to track development goals, including
• Millennium Development Goals (MDGs)
• UNDP – Sustainable Human Development
• World Bank – Rural Development Handbook
• IMF – Macroeconomic indicators
* A pre-defined list of indicators are those indicators established independent of the context of any individual country or organization

7777
Using Pre-Designed Indicators:Pros and Cons
Pros –• Can be aggregated across similar types of
projects/programs/policies• Reduces costs of building multiple unique measurement
systems• Creates greater harmonization of donor requirements
Cons –• Often does not address country specific goals • Often viewed as imposed—coming from the
top down• Does not promote key stakeholder participation and
ownership• Multiple competing indicators

7878
In Summary:Developing Indicators
• You will need to develop your own indicators to meet your own needs.
• Developing good indicators often takes more than one try!
• Arriving at the final indicators you will use will take time!
• Pilot, Pilot, Pilot!

7979
Exercise: Select Key Performance Indicators for the Following Outcomes
Outcome #1 Improved delivery of health care to citizens living in rural areas
Outcome #2 Improve quality of agriculture export products
Outcome #3 Safe urban communities

8080
Step 4
Baseline Data on Indicators –Where Are We Today

8181
Baseline Data on Indicators –Where Are We Today
Conducting a Readiness
Assessment
Agreeing on Outcomes to Monitor and
Evaluate
Selecting Key Indicators to
Monitor Outcomes
Baseline Data on
Indicators—Where Are We Today?
Planning for Improvement — Selecting
Results Targets
Monitoring for Results
The Role of Evaluations
Reporting Your Findings
Using Your
Findings
Sustaining the
M&E System Within Your Organization
1 2 3 4 5 6 7 9 108

8282
“If you do not know where you are, you will have difficulty determining where you need to go.”
Harry HatryUrban Institute, 1999
“If you do not know where you are, you will have difficulty determining where you need to go.”
Harry HatryUrban Institute, 1999

8383
Establishing Baseline Data on Indicators
A performance baseline is…
• Information (quantitative or qualitative) that provides data at the beginning of, or just prior to, the monitoring period. The baseline is used to:
– Learn about recent levels and patterns of performance on the indicator; and to
– Gauge subsequent policy, program, or project performance

8484
The challenge now is to think about how to obtain baseline information for results
indicators selectedfor each outcome
The challenge now is to think about how to obtain baseline information for results
indicators selectedfor each outcome

8585
Identify Data Sources for Your Indicators
• Sources are who or what provide data –not the method of collecting data
• What types of data sources can you think of for performance indicators in Highway Transportation Safety?

8686
84848484
8484
Building Baseline Information
Indicator
Data Source
Data
Collection Method
Who will
collect data
Frequency
of Collection
Cost of collection
Difficulty
to collect
Who will analyze & report
data
1
2
3

8787
Data Sources May Be Primary or Secondary
• PRIMARY data are collected directly by your organization, for example, through surveys, direct observation, and interviews.
• SECONDARY data have been collected by someone else, initially for a purpose other than yours. Examples include survey data collected by another agency, a Demographic Health Survey, or data from a financial market.
– Secondary data often can save you money in acquiring data you need, but be careful!

8888
Sources of Data
• Written records (paper and electronic)
• Individuals involved with the program
• General public
• Trained observers
• Mechanical measurements and tests

8989
Design Data Collection Methods
1. Decide how to obtain the data you needfrom each source
2. Prepare data collection instruments
3. Develop procedures for use of the data collection instruments

9090
Data Collection Methods
Conversationwith
concernedindividuals
Community Interviews
Informal/Less Structured Methods
Fieldvisits
Reviews of official records
(MIS and admin data)
Participant Observation
Key informantinterviews
FocusGroup
Interviews
One-Time Survey
Questionnaires
PanelSurveys
Fieldexperiments
Census
More Structured/Formal Methods
Direct observation

9191
Practicality
• Are the data associated with the indicator practical?
• Ask whether…
– Quality data are currently available
– The data can be procured on a regular and timely basis
– Primary data collection, when necessary, is feasible and cost-effective

9292
Comparison of MajorData Collection Methods
Date Collection Method
CharacteristicReview of Program Records
Self-Administered Questionnaire
InterviewRating by Trained
Observer
Cost Low Moderate Moderate to HighDepends on
Availability of Low-Cost Observers
Amount of Training
Required for Data Collectors
Some None to Some Moderate to High Moderate to High
Completion Time
Depends on Amount of Data
NeededModerate Moderate Short to Moderate
Response RateHigh, if Records Contain Needed
Data
Depends on How Distributed
Generally Moderate to Good High
United Way of America

9393
Developing Baseline Datafor One Policy Area:
Example: Education
Outcomes Indicators Baselines Targets
1. Nation’s children have Improved access to pre-school programs
1. % of eligible urban children enrolled in pre-school education
1. 75% urban children ages 3-5 in 1999
2. % of eligible rural children enrolled in pre-school education
2. 40% rural children ages 3-5 in 2000
2. Primary school learning outcomes for children are improved
1. % of Grade 6 students scoring 70% or better on standardized math and science tests
1. 75% in 2002 scored 70% or better in math.
61% in 2002 scored 70% or better in science.

9494
In Summary:Establishing Baseline Data on Indicators
A baseline is…
• Information (quantitative or qualitative) that provides data at the beginning of, or just prior to, the monitoring period. The baseline is used to:
– Learn about recent levels and patterns of performance on the indicator; and to
– Gauge subsequent policy, program, or project performance

9595
Step 5
Planning for Improvement –Selecting Results Targets

9696
Planning for Improvement –Selecting Results Targets
Conducting a Readiness
Assessment
Agreeing on Outcomes to Monitor and
Evaluate
Selecting Key Indicators to
Monitor Outcomes
Baseline Data on
Indicators—Where Are We Today?
Planning for Improvement —
Selecting Results Targets
Monitoring for Results
The Role of Evaluations
Reporting Your Findings
Using Your
Findings
Sustaining the
M&E System Within Your Organization
1 2 3 4 5 6 7 9 108

9797
Definition
Targets are the quantifiable levels of the indicators that a country or organization wants to achieve at a given point in time—
For Example,Agricultural exports will increase by 20% in the next three years over the baseline

9898
Identifying Expected or Desired Level of Project or Program or Policy Results
Requires Selecting Performance Targets
Baseline Indicator
Level
DesiredLevel of
Improvement
Assumes afinite and expected level of inputs,
activities, and outputs
Target Performance
Desired level of
performance to be reached
within a specific time
+ =

9999
Examples of TargetsRelated to Development
1. Goal: Economic Well-Being
Outcome target: Reduce by 20% the proportion of people living in extreme poverty by 2008 against the baseline
2. Goal: Social Development
Outcome target: Improve by 30% the Primary Education enrollment rates in Kyrgyz Republic by 2008 against the baseline
Outcome target: Reduce by 20% the incidence of hepatitis rates for infants by 2006 against the baseline.
3. Goal: Environmental Sustainability
Outcome target: Implement a national strategy for sustainable forest management by 2005

100100
Factors to Consider When Selecting Indicator Targets
• Clear understanding of baseline starting point(e.g. average of last 3 years, last year, average trend, etc.)
• Funding and level of personnel resources expected throughout the target period
• Amount of outside resources expected to supplement the program’s resources
• Political concerns
• Institutional capacity

101101
Additional Considerations in Setting Indicator Targets
• Only one target is desirable for each indicator
• If the indicator is new (not previously used) be careful on setting firm targets (use a range)
• Most targets are set yearly, but some could be set quarterly; others set for longer periods (not more than 5 years)
• It takes time to observe the effects of improvements; therefore, be realistic when setting targets
Adapted from the Urban Institute, 1999

102102
Additional Considerations When Setting Indicator Targets
• A target does not have to be one single numerical value; it can be a range
• Consider previous performance
• Take your baseline seriously
• Targets should be feasible, given all the resource (input) considerations
Adapted from the Urban Institute, 1999

103103
“Games Sometimes Played When Setting Targets”
• Set targets so modest (easy) that they will surely be met
• Move the target (as needed) to fit performance
• Pick targets that are not politically sensitive

104104

105105
Targets Support Public Accountability
• “Whether they concern the time someone waits for treatment for cancer or the number of police officers on the beat, targets can help ensure that attention is focused and energy concentrated in the right directions. Targets challenge low expectations and give the public a clear benchmark against which they can measure progress.”
David Miliband
Financial Times (October 9, 2003)

106106
Developing Targets for One Policy Area:
Education
Outcomes Indicators Baselines Targets
1. Nation’s children have improved access to pre-school programs
1.
% of eligible urban children enrolled in pre-school education
1. 75% urban children ages 3-5 in 1999
1. 85% urban children ages 3-5 by 2006
2.
% of eligible rural children enrolled in pre-school education
2. 40% rural children ages 3-5 in 2000
2. 60% rural children ages 3-5 by 2006
2. Primary school learning outcomes for children are improved
1.
% of Grade 6 students scoring 70% or better on standardized math and science tests
1. 75% in 2002 scored 70% or better in math.
61% in 2002 scored 70% or better in science
1. 80% scoring 70% or better in math by 2006.
67% scoring 70% or better in science by 2006.

107107
Now We Have A Results Framework
Note: This completed matrix becomes your results framework!
– It defines your outcomes and gives you a plan for how you will know if you have been successful (or not) in achieving these outcomes

108108
Baseline Indicator
Level
DesiredLevel of
Improvement
Assumes afinite and
expected level of
inputs,activities, and
outputs
Target Performance
Desired level of
performance to be reached
within a specific time
+ =
In Summary…

109109
Step 6
Monitoring For Results

110110
Building a Monitoring System
Conducting a Readiness
Assessment
Agreeing on Outcomes to Monitor and
Evaluate
Selecting Key Indicators to
Monitor Outcomes
Baseline Data on
Indicators—Where Are We Today?
Planning for Improvement — Selecting
Results Targets
Monitoring for Results
The Role of Evaluations
Reporting Your Findings
Using Your
Findings
Sustaining the
M&E System Within Your Organization
1 2 3 4 5 6 7 9 108

111111
Monitoring for Results
• A results-based monitoring system tracks both implementation (inputs, activities, outputs) and results (outcomes and goals)
• Implementation monitoring is supported through the use of management tools – budget, staffing plans, and activity planning

112112
Monitoring for Results (cont.)
• Implementation monitoring tracks the means and strategies used by the organization
• Means and strategies are found in annual and multi-year workplans
• Do not forget: Results framework is not the same as a work plan
• Do not forget: Budget to outputs, manage to outcomes
113113
Developing A Results Plan
• Once a set of outcomes are identified, it is time to develop a plan to assess how the organization will begin to achieve these outcomes
• In the traditional approach to developing a plan, the first thing a manager usually did was to identify activities and assign responsibilities
• But the shortcoming in this approach is that completing all the activities does not mean the same as reaching the outcome goal

114114
Key Types of Monitoring
Output
Activity
Input
Outcome
Impact
Results Monitoring
Implementation Monitoring (Means and Strategies)
Imp
lem
enta
tio
nR
esu
lts

115115
Translating Outcomes to Action
• Note: Activities are crucial! They are the actions you take to manage and implement your programs, use your resources, and deliver the services of government
• But the sum of these activities may or may not mean you have achieved your outcomes
• Question is: How will you know when you have been successful?

116116
Implementation Monitoring Links to Results Monitoring
Outcome
Target2
Means and Strategies (Multi-Year and Annual Work Plans)
Means and Strategies (Multi-Year and Annual Work Plans)
Target1
Target3
Means and Strategies (Multi-Year and Annual Work Plans)

117117
Linking Implementation Monitoring to Results Monitoring
Target
Means andStrategies
Outcome
GoalChildren’s mortality reduced
Children’s morbidity reduced
• Improve cholera prevention programs
• provision of vitamin A supplements
• use of oral re-hydration therapy
Reduce incidence of childhood gastrointestinal disease by 20% over 3 years

118118Partner 1 Partner 3
Partner 2
Partner 1 Partner 3
Partner 2
Partner 1 Partner 3
Partner 2
Achieving Results Through Partnership
Goal
OutcomeOutcome Outcome
Target 2Target 1
Means & Strategy Means & Strategy Means & Strategy

119119
Building a Monitoring System: A Group Exercise
Take this chart and complete the information requirements for Year 1 and Year 2:
Target
Means andStrategies
Outcome
Impact Increase educational opportunities for children
Increase availability of pre-school education for poor children
Increase by 25% the number of poor children ages 2-5 attending pre-school by 2005
Year 1 Year 2

120120
Key Principles in Building a Monitoring System
1. There are results information needs at the project, program, and policy levels
2. Results information needs to move both horizontally and vertically in the organization
3. Demand for results information at each level needs to be identified

121121
Key Principles in Building a Monitoring System (cont.)
4. Responsibility at each level needs to be clear for:– What data are collected (source)– When data are collected
(frequency) – How data are collected
(methodology)– Who collects the data– Who analyzes the data– For whom the data are collected– Who reports the data

122122
Every Monitoring System Needs:
OwnershipOwnership
ManagementManagement
MaintenanceMaintenance
CredibilityCredibility

123123
Managing for Results Calls for Analysis of Performance Data…
120120ID 27902 Published in the New Yorker 5/16/1994
A bird, in a suit, notices charts which compare‘hour of rising’ with ‘worm acquisition.’ Refers
to the saying, “The early bird catches the worm.”

124124
Performance Monitoring System Framework
• For each outcome/goal you need:
BaselineIndicator Data AnalysisTargetData Collection
Strategy Reporting Plan

125125
The plan should cover:
• Units of analysis
• Sampling procedures
• Data collection instruments to be used
• Frequency of data collection
• Expected methods of data analysis
• Who collects the data
• For whom the data are being collected
Monitoring System Strategy Should Include a Data Collection and Analysis Plan

126126
Key Criteria for Collecting Quality Performance Data
Reliability
Validity Timeliness

127127
The Data Quality Triangle
Reliability
The extent to which the data
collection approach is stable
and consistent across timeand space

128128
The Data Quality Triangle
Validity
Extent to which data clearly and directly measure the performance
we intend to measure

129129
The Data Quality Triangle
Timeliness
• Frequency (how often are data collected?)
• Currency (how recently have data been collected?)
• Relevance (data need to be available on a frequent enough basis to support management decisions)

130130
Quality Assurance Challenges
• What will be collected, and by what methods, are tempered by what is practical and realistic in the country and program context
– How much existing data relevant to our project, program, or policy are already available?
– How much of the available data are good enough to meet your organization’s needs?

131131
Pretest Your Data Collection Instruments and Procedures
• You will never really know how good your data collection approach is until you test it
• Pretesting is learning how to improve your instruments or procedures, before your data collection is fully under way
• Avoiding pretesting probably will result in mistakes. The mistake could cost your organization a lot of wasted time and money, and maybe its valued reputation with the public.

132132
• For each outcome/goal you need:
BaselineIndicator Data AnalysisTargetData Collection
Strategy Reporting Plan
In Summary….

133133
Step 7
The Role of Evaluations

134134
The Role of Evaluations
Conducting a Readiness
Assessment
Agreeing on Outcomes to Monitor and
Evaluate
Selecting Key Indicators to
Monitor Outcomes
Baseline Data on
Indicators—Where Are We Today?
Planning for Improvement — Selecting
Results Targets
Monitoring For Results
The Role of Evaluations
Reporting Your Findings
Using Your
Findings
Sustaining the
M&E System Within Your Organization
1 2 3 4 5 6 7 9 108

135135
Definition
EvaluationAn assessment of planned, ongoing or completed intervention to determine its relevance, efficiency, effectiveness, impact and sustainability. The intent is to incorporate lessons learned into the decision-making process.

136136
Uses of Evaluation
• To make resource decisions
• To re-think the causes of a problem
• To identify issues around an emerging problem, i.e. children dropping out of school
• Decision-making on best alternatives
• Support of public sector reform / innovation
• To help build consensus among stakeholders on how to respond to a problem

137137
Evaluation Means Information on:
Strate
gy
• Whether we are doing the right things
– Rationale/justification
– Clear theory of change
Op
era
tion
• Whether we are doing things right
– Effectiveness in achieving expected outcomes
– Efficiency in optimizing resources
– Client satisfaction
Lea
rning
• Whether there are better ways of doing it
– Alternatives
– Best practices
– Lessons learned

138138
Characteristics of Quality Evaluations
Feedback/dissemination
Technical adequacy
Value for money
Stakeholderinvolvement
UsefulnessImpartiality

139139
Eight Types of Questions Answered by Evaluation
• Descriptive: Describe the content of the information campaign in country X for HIV/ AIDS prevention
• Normative/compliance: How many days during the year were national drinking water standards met? ( looks for how a project, program or policy met stated criteria)
• Correlational: What is the relation between the literacy rate and number of trained teachers in locality? ( shows the link between two situations, or conditions, but does not specify causality

140140
Eight Types of Questions Answered by Evaluation
• Cause and Effect: Has the introduction of a new hybrid seed caused increased crop yield? (establishes a causal relation between two situations or conditions)
• Program Logic: Is the sequence/strategy of planned activities likely to increase the number of years girls stay in school? (used to assess whether the design has correct causal sequence)
• Implementation/process: Was a project, program or policy to improve the quality of water supplies in an urban area implemented as intended? (establishes if proposed activities are conducted)

141141
Eight Types of Questions Answered by Evaluation
• Performance: Are the planned outcomes and impacts from a policy being achieved? (establishes links between inputs, activities, outputs, outcomes and impacts)
• Appropriate use of policy tools : Has the government made use of the right policy tool in providing subsidies to indigenous villagers who need to be resettled due to the construction of a new dam? ( establishes whether government selected appropriate instrument to achieve its aims)

142142
When Is It Time to Make Use of Evaluation?
When regular results measurement suggests actual performance diverges sharply from planned performance
Planned
Actual

143143
When Is it Time to Make Use of Evaluation?
StrengthOf Design
Hi Lo
Strength of Implementation
Hi
1. 2.
Lo
3. 4.
When you want to determine the roles of both design and implementation on project, program, or policy outcomes

144144
When Is it Time to Make Use of Evaluation? (cont.)
When:
• Resource and budget allocations are being made across projects, programs, or policies
• A decision is being made whether to (or not) expand a pilot
• There is a long period with no evidence of improvement in the problem situation
• Similar projects, programs or policies are reporting divergent outcomes
• There are conflicting political pressures on decision-making in ministries or parliament
• Public outcry over a governance issue
• To identify issues around an emerging problem, I.e. children dropping out of school

145145
Six Types Of Evaluation
Impact Evaluation
Process Implementation
PerformanceLogic Chain
Meta-Evaluation
Case Study
Pre-ImplementationAssessment

146146
1) Performance Logic– Chain Assessment
• Asks questions about the basic causal logic of the project, program, or policy (cause and effect assumptions)
• Asks about the rationale for the sequence of activities of the project, program, or policy
• Asks about the plausibility of achieving intended effects based on research and prior experience

147147
2) Pre-Implementation Assessment
Preliminary evaluation of a project, program, or policy’s implementation strategy to assure that three standards are met:
• Objectives are well defined
• Implementation plans are plausible
• Intended uses of resources are well defined and appropriate to achievement of objectives

148148
3) Process Implementation Evaluation
• Provides detailed information on whether the program is operating as it ought ( are we doing things right?)
• Provides detailed information on program functioning to those interested in replication or scaling up a pilot
• Provides continuous feedback loops to assist managers

149149
4) Case Study
A case study is a method for learning about a complex situation and is based on a comprehensive understanding of that situation.

150150
Six Basic Types of Case Study
Program effects
Critical instance
Illustrative
Cumulative
Program implementation
Exploratory

151151
5) Impact Evaluation
• Provides information on how and why intended (and un-intended) project, program, or policy outcomes and impacts were achieved (or not)

152152
6) Meta-Evaluation
• Pulls together known studies on a topic to gain greater confidence in findings and generalizability
• Addresses where there are credible supportable evaluation findings on a topic
• Compares different studies with disparate findings about a topic against a common set of criteria

153153
In Summary:Evaluation Means Information on
Strate
gy
• Whether we are doing the right things
– Rationale/justification
– Clear theory of change
Op
era
tion
• Whether we are doing things right
– Effectiveness in achieving expected outcomes
– Efficiency in optimizing resources
– Client satisfaction
Lea
rning
• Whether there are better ways of doing it
– Alternatives
– Best practices
– Lessons learned

154154
Reporting Your Findings
Conducting a Readiness
Assessment
Agreeing on Outcomes to Monitor and
Evaluate
Selecting Key Indicators to
Monitor Outcomes
Baseline Data on
Indicators—Where Are We Today?
Planning for Improvement — Selecting
Results Targets
Monitoring for Results
The Role of Evaluations
Reporting Your
Findings
Using Your
Findings
Sustaining the
M&E System Within Your Organization
1 2 3 4 5 6 7 9 108

155155
“If You Do Not Measure Results, You Can Not Tell Success From Failure”
Analyzing and Reporting Data:
• Gives information on the status of projects, programs, and policies
• Provides clues to problems
• Creates opportunities to consider improvements in the (projects, programs, or policy) implementation strategies
• Provides important information over time on trends and directions
• Helps confirm or challenge theory of change

156156
Analyzing Your Results Data
• Examine changes over time
– Compare present to past data to look for trends and other changes
– The more data points you have, the more certain you are of your trends
?Time
Improving access to rural markets
Acc
ess
TimeImproving access
to rural markets
Acc
ess

157157
Report results data in comparison to earlier data and to your baseline(Remember—Comparisons over time are critical!)
You can report your data by:
– Expenditure/income – Organizational units
– Raw numbers – Geographical locations
– Percentages – Demographics
– Statistical tests – Client satisfaction scales (high, medium, low)
Reporting Your Results Data

158158
Present Your Data in Clear and Understandable Form
• Present most important data only
• Use an appendix or a separate report to convey detailed data
• Use visual presentations (charts, graphs, maps) to highlight key points
• Avoid “data dumps”

159159
When Reporting Your FindingUse Explanatory Notes
Suggestions:
• Combine qualitative information along with quantitative
• When comparisons show unexpected trends or values, provide explanations, if known
• Report internal explanatory notes
– e.g. loss of program personnel or other resources
• Report external explanatory notes,
– e.g unexpected natural disaster, or political changes
• Summarize important findings
The Urban Institute, 1999
160160
What Happens If the Results News Is Bad?
• A good results measurement system is intended to surface problems (early warning system)
• Reports on performance should include explanations about poor outcomes and identify steps taken or planned to correct problems
• Protect the messenger
Adapted from The Urban Institute, 1999

161161
Outcomes Reporting Format
Actual Outcomes Versus Targets
Outcome IndicatorBaseline
(%)
Current
(%)
Target
(%)
Difference
(%)
Rates of hepatitis (N=6000) 30 25 20 -5
Percentage of children with improved overall health status (N=9000)
20 20 24 -4
Percentage of children who show 4 out of 5 positive scores on physical exams (N=3500)
50 65 65 0
Percentage of children with improved nutritional status (N = 14,000)
Source: Made-up data, 2003
80 85 83 +2

162162
In Summary:Analyzing and Reporting Data:
• Gives information on the status of projects, programs, and policies
• Provides clues to problems
• Creates opportunities to consider improvements in the (projects, programs, or policy) implementation strategies
• Provides important information over time on trends and directions

163163
Step 9
Using Your Findings

164164
Using Your Findings
Conducting a Readiness
Assessment
Agreeing on Outcomes to Monitor and
Evaluate
Selecting Key Indicators to
Monitor Outcomes
Baseline Data on
Indicators—Where Are We Today?
Planning for Improvement — Selecting
Results Targets
Monitoring for Results
The Role of Evaluations
Reporting Your Findings
UsingYour
Findings
Sustaining the
M&E System Within Your Organization
1 2 3 4 5 6 7 9 108

165165
Using Your Findings
1 Responds to elected officials’ and the public’s demands for accountability
2 Helps formulate and justify budget requests
3 Helps in making operational resource allocation decisions
4 Triggers in-depth examinations of what performance problems exist and what corrections are needed
10 Uses of Results Findings

166166
Using Your Findings (cont.)
5 Helps motivate personnel to continue making program improvements
6 Monitors the performance of contractors and grantees
7 Provides data for special, in-depth program evaluations
8 Helps provide services more efficiently
9 Supports strategic and other long-term planning efforts (by providing baseline information and later tracking progress)
10 Communicates better with the public to build public trust
10 Uses of Results Findings

167167
Nine Strategies for Sharing Information
• Empower the Media
• Enact “Freedom of Information” legislation
• Institute E-government
• Add information on internal and external internet sites
• Publish annual budget reports
• Engage civil society and citizen groups
• Strengthen parliamentary oversight
• Strengthen the Office of the Auditor General
• Share and compare results findings with development partners
168168
Credible Information Strengthens Public Accountability
“In the National Health Service it is not always clear that the board asks the right questions,” because “inadequate information reduces the clarity behind decision-making that is necessary to achieve effective accountability”.
Nicole Timmins
Financial Times (October 14, 2003)

169169
Step 10
Sustaining the M&E System Within Your Organization

170170
10
Sustaining the M&E System Within Your Organization
Conducting a Readiness
Assessment
Agreeing on Outcomes to Monitor and
Evaluate
Selecting Key Indicators to
Monitor Outcomes
Baseline Data on
Indicators—Where Are We Today?
Planning for Improvement — Selecting
Results Targets
Monitoring for Results
The Role of Evaluations
Reporting Your Findings
Using Your
Findings
Sustaining the M&E System
Within Your Organization
1 2 3 4 5 6 7 98

171171
6 Critical Components of Sustaining Monitoring & Evaluation Systems
1. Demand
2. Clear Roles and Responsibilities
3. Trustworthy and Credible Information
4. Accountability
5. Capacity
6. Incentives

172172
Critical Component One: Demand
• Structured requirements for reporting on results e.g. European Union Accession or national legislation
• The results from M&E system are sought and available for the government, civil society, and for donors
• Officials want evidence on their own performance
• Organizations seek better accountability

173173
Critical Component Two: Clear Roles and Responsibilities
• Establish formal organizational lines of authority (that are clear) for collecting, analyzing, and reporting of performance information
• Build a system that links the central planning and finance ministries to line/sector ministries (internal coordination)
• Issue clear guidance on who is responsible for which components of the M&E system and procedures

174174
Critical Component Two: Clear Roles and Responsibilities (cont.)
• Build a system that goes beyond national government to other levels of government for data collection and analysis
• Build a system that has demand for results information at every level where information is collected and analyzed, i.e. there is no level in the system that is only a “pass through” ofthe information

175175
Critical Component Three: Trustworthy and Credible Information
• The system has to be able to produce results information that brings both good and bad news
• The producers of results information need protection from political reprisals
• The information produced by the M&E system should be transparent and subject to independent verification
• The data collection and analysis procedures should be subject to review by national audit office and/or Parliament
176176
“Stop whimpering and spin the wheel of blame, Lipton!”
Cartoon by Scott Arthur Masear, Harvard Business Review, November 2003.
The Blame Game

177177
Critical Component Four: Accountability
• Civil society organizations play a role by encouraging transparency of the information
• The media, private sector, and the Parliament all have roles to ensure that the information is timely, accurate,and accessible
• Failure is not rewarded
• Problems are acknowledged and addressed

178178
• Sound technical skills in data collection and analysis
• Managerial skills in strategic goal setting and organizational development
• Existing data collection and retrieval systems
• Ongoing availability of financial resources
• Institutional experience
Critical Component Five: Capacity

179179
Critical Component Six: Incentives
• Incentives need to be introduced to encourage use of performance information:
• Success is acknowledged and rewarded
• Problems are addressed
• Messengers are not punished
• Organizational learning is valued
• Budget savings are shared
• Others?

180180
Last Reminders!
• The demand for capacity building never ends! The only way an organization can coast is downhill…
• Keep your champions on your side and help them!
• Establish the understanding with the Ministry of Finance and the Parliament that an M&E system needs sustained resources.
• Look for every opportunity to link results information to budget and resource allocation decisions.
• Begin with pilot efforts to demonstrate effective results-based monitoring: Begin with an enclave strategy (e.g. islands of innovation) as opposed to a whole-of-government approach.
• Monitor both implementation progress and results achievements.
• Complement performance monitoring with evaluations to ensure better understanding of public sector results.