1.1. introduction 1.1.1. molecular modeling and drug...
TRANSCRIPT

Studies based on Supramolecular Chemistry in Drug Design and Improvement of Pharmaceutical Solids
35
1.1. INTRODUCTION
1.1.1. Molecular Modeling and Drug Design
Drug design is a creative act of the same magnitude as composing, sculpting,
or writing. The results can touch the lives of millions and bring dollars of millions. It
is an iterative process which begins when a chemist identifies a compound that
displays an interesting biological profile and ends when both the activity profile and
the chemical synthesis of the new chemical entity are optimized. Traditional
approaches to drug discovery rely on a step-wise synthesis and screening program for
large numbers of compounds to optimize activity profiles. Over the past 30 years,
scientists have used computer models of new chemical entities to help define activity
profiles, geometries and reactivities [Edgar et al. 2000]. The development of
molecular modeling programs helping the discovery to be happened fast and their
application in pharmaceutical research has been formalized as a field of study known
as computer assisted drug design (CADD) or computer assisted molecular design
(CAMD).
Computational chemistry/molecular modeling is the science (or art) of
representing molecular structures numerically and simulating their behavior with the
equations of quantum and classical physics [Diane et al. 1999]. Computational
chemistry programs allow scientists to generate and present molecular data including
geometries (bond lengths, bond angles, and torsion angles), energies (heat of
formation, activation energy, etc.), electronic properties (moments, charges, ionization
potential, and electron affinity), spectroscopic properties (vibrational modes, chemical
shifts) and bulk properties (volumes, surface areas, diffusion, viscosity, etc.). As with
all models however, the chemist's intuition and training is necessary to interpret the
results appropriately. Comparison to experimental data, where available, is also
important to guide both laboratory and computational work.
The approach used in CADD is dependent upon the amount of information
that is available about the ligand and receptor. Based on the information that is
available, one can apply either structure-based or ligand-based molecular design
methods [Christoph et al. 2002]. Structure-based drug design, or rational drug design,
as it is sometimes called, refers to the intricate process of using the supramolecular
information contained in the three-dimensional structure of a macromolecular target
and of related ligand-target complexes to design novel drugs for important human

Studies based on Supramolecular Chemistry in Drug Design and Improvement of Pharmaceutical Solids
36
diseases. Computational methods are needed to exploit the structural information to
understand specific molecular recognition events and to elucidate the function of the
target macromolecule. This information should ultimately lead to the design of small
molecule ligands for the target, which will block its normal function and thereby act
as improved drugs.
The ligand-based approach is applicable when the structure of the receptor site
is unknown, but when a series of compounds have been identified that exert the
activity of interest. To be used most effectively, one should have structurally similar
compounds with high activity, with no activity, and with a range of intermediate
activities. In recognition site mapping, an attempt is made to identify a
pharmacophore, which is a template derived from the structures of these compounds.
It is represented as a collection of functional groups in three-dimensional space that is
complementary to the geometry of the receptor site.
In applying these approaches, conformational analysis will be required, the
extent of which will be dependent on the flexibility of the compounds under
investigation. One strategy is to find the lowest energy conformers of the most rigid
compounds and superimpose them. Conformational searching on the more flexible
compounds is then done while applying distance constraints derived from the
structures of the more rigid compounds. Ultimately, all of the structures are
superimposed to generate the pharmacophore. This template may then be used to
develop new compounds with functional groups in the desired positions. In applying
this strategy, one must recognize that one is assuming that it is the minimum energy
conformers that will bind most favorably in the receptor site. In fact, there is no a
priori reason to exclude higher energy conformers as the source of activity.
Once potential drugs have been identified by the methods described above,
other molecular modeling techniques may then be applied. For example, geometry
optimization may be used to "relax" the structures and to identify low energy
orientations of drugs in receptor sites. Molecular dynamics may assist in exploring the
energy landscape, and free energy simulations can be used to compute the relative
binding free energies of a series of putative drugs. Even after many cycles of the
structure-based design process, when a compound that binds to the target with a very
high level of activity (typically at nanomolar concentrations) has been developed, it is
still a long way from being a drug on the market. The compound still has to pass

Studies based on Supramolecular Chemistry in Drug Design and Improvement of Pharmaceutical Solids
37
through animal and clinical trials, where factors that have not been considered, such
as toxicity, bioavailability, and resistance, often determine its fate. There is now a
greater emphasis on incorporating some of these factors in the initial screening and
optimization process that leads to a drug.
1.1.2. Anticoagulants
Anticoagulants are used for the prevention and treatment of venous and arterial
thromboembolic disorders. Many approaches have been explored in the development
of antithrombotic drugs that inhibit enzymes in the coagulation pathways. However,
most currently approved drugs for the prevention and treatment of thromboembolic
disorders have been on the market for a long time. Heparin (UFH), which was
discovered in 1916 (McLean et al. 1916) targets multiple factors in the coagulation
cascade2, but has a number of limitations, including a parenteral route of
administration, frequent laboratory monitoring of coagulation activity and the risk for
patients of developing potentially life-threatening heparin-induced thrombocytopaenia
[Hirsh et al. 2008]. Low-molecular-weight heparins (LMWHs), which were
developed in the 1980s, promote the inactivation of both thrombin (factor IIa) and, to
a greater extent, factor Xa.
1.1.3. Factor Xa
Factor X has long been known to have a key role in haemostasis and factor Xa plays a
central part in the blood coagulation pathway by catalysing the production of
thrombin, which leads to clot formation and wound closure. Conversely, deficiency of
factor Xa may disturb haemostasis. In the very rare factor X deficiency disorder (for
which 1 in 500,000 is homozygous and 1 in 500 heterozygous), very low plasma and
activity levels of factor Xa manifest as severe bleeding tendencies [Brown et al.
2008, Hougie et al. 1957 and Telfer et al. 1956]. studies of variants of factor X
deficiency indicate that factor X plasma activity levels must be as low as 6–10% of
the normal range (approximately 50–150% of the population average) to be
considered a mild deficiency; cases with factor X activity levels below 1% are
considered to be severe [Brown et al. 2008 and Butenas et al. 1999] thus it seems that
factor X activity can be markedly suppressed without affecting haemostasis. An ideal
anticoagulant would prevent thrombosis without inducing systemic hypocoagulation,
and would thereby avoid unintended bleeding complications. therefore, a factor Xa
inhibitor could potentially have the properties of a desirable anticoagulant.

Studies based on Supramolecular Chemistry in Drug Design and Improvement of Pharmaceutical Solids
38
Figure 1.1. Blood Coagulation Cascade
Xa
XIIa
XIa
IXa
VII
VIIa
Thrombin
Va
Tissue
factor
Intrinsic pathway
Extrinsic pathway
Warfarin
UFHs
LMWHs
Fibrin clot
Dabigatran
Argatroban
Hirudins
Rivaroxaban
Apixaban
Edoxaban
Betrixaban
YM-150
LY-517717
TAK-442 etc.

Studies based on Supramolecular Chemistry in Drug Design and Improvement of Pharmaceutical Solids
39
1.2. LITERATURE SURVEY
Although factor Xa was identified as a promising target for the development
of new anticoagulants in the early 1980s, the viability of factor Xa inhibition was not
tested before the end of that decade. Antistatin was the first first factor Xa inhibitor,
the naturally occurring compound isolated from the salivary glands of the Mexican
leech Haementeria officinalis in 1987. It is a slow, tight-binding, potent factor Xa
inhibitor. Another naturally occurring factor Xa inhibitor, the tick anticoagulant
peptide (tAP), was isolated in 1990 from extracts of the soft tick Ornithodoros
moubata [Waxman et al. 1990]. similarly to antistasin, tAP is a slow, tight-binding
inhibitor of factor Xa. Comparative animal studies suggested that direct factor Xa
inhibitors might be a more effective approach to anticoagulation [Nicolini et al. 1996
and Lynch et al. 1994], and might also offer a wider therapeutic window, particularly
with regard to primary haemostasis [Sitko et al. 1992 and Lefkovits et al. 1996].
Although antistasin and tAP provided support for the concept of factor Xa inhibition,
development of these compounds was discontinued. the reasons were never disclosed.
Nonetheless, the encouraging results from studies using recombinant versions of the
natural factor Xa inhibitors prompted several pharmaceutical companies to initiate
chemistry programmes to develop selective, small-molecule, direct inhibitors of fXa..
The design of selective small molecule fXa inhibitors has profited from X-ray
crystallography of several enzyme–inhibitor complexes, molecular modeling and
three-dimensional QSAR studies [Maignan et al. 2001] . Factor Xa contains a serine
protease domain in a trypsin-like closed β -barrel fold encompassing the catalytic triad
Ser195-His57-Asp102 and two essential subsites S1 and S4. The search for ligands
providing optimal interactions within S1 and S4 pockets, combined with suitable
scaffolds, has been a major focus in structure-based design of selective fXa inhibitors.
Early fXa inhibitors contained benzamidine, naphtylamidine or other basic groups
[Al-Obeidi et al. 1999] , thought to be necessary for binding in the S1 pocket, but the
poor bioavailability often associated with the amidine group directed efforts to replace
this functionality with less basic or nonpolar neutral groups [Lam et al. 2003 and
Agustin et al. 2006] . Examples of benzamidine-containing fXa inhibitors are DX-
9065a ( 1 ), developed by Daiichi Pharmaceutical Co. (Tokyo, JP) [Nagahara et al.
1994] , and otamixaban ( 2 ), developed at Sanofi-Aventis (Frankfurth aM, DE)
[Guertin et al. 2002] . DPC-423 ( 3 ), disclosed by DuPont Pharmaceuticals (Newark,
Delaware, US), was the first orally active fXa inhibitor that went into the clinic [Pinto

Studies based on Supramolecular Chemistry in Drug Design and Improvement of Pharmaceutical Solids
40
et al. 2001 and Wong et al. 2002] . A range of potent and orally bioavailable fXa
inhibitors has since emerged, which include compounds containing either less basic
amidine isosters, such as razaxaban (DPC-906, 4 ) [Quan et al. 2005] , or neutral P1
substituents, such as rivaroxaban (BAY 59-7939, 5 ) [Roherig et al. 2005] and
apixaban (BMS-562247-1, 6 ) [Pinto et al. 2007]. Several other heterocycles were
also evaluated for FXa inhibition. Isoxazolines under bisamidino class were
extensively studied for their FXa activity, the SAR of these compounds therefore
analyzed in the present study with the aid of molecular modeling tools.

Studies based on Supramolecular Chemistry in Drug Design and Improvement of Pharmaceutical Solids
41
1.3. OBJECTIVE
The study was aimed to design and predict the activity of factor Xa binding
compounds as anticoagulants via the below approach.
Developing QSAR among reported analogues of factor Xa inhibitors
Identification of Pharmacophore in the selected series
Docking of a set of diverse structures to correlate the activity
De novo design of ligands based on active site interation points
Prediction of activity for the designed ligands

Studies based on Supramolecular Chemistry in Drug Design and Improvement of Pharmaceutical Solids
42
1.4. PLAN OF WORK
Regression
method- G/PLS,
GFA & Stepwise
Compare/Fit
MFA / MSA –
QSAR Model
Activity Prediction Validation of QSAR
model
Pharmacophore
model
Interaction Energy
Calculation
Alignment and
Descriptors
Factor Xa-Inhibitor
Complex structure (1LPG)
Active Molecules
from Literature
Ludi- De novo
drug design
LigandFit-
Docking studies
CATALYST 3D-QSAR
Lead Molecules
STRUCTURE BASED
APPROACH
ANALOGUE BASED
APPROACH

Studies based on Supramolecular Chemistry in Drug Design and Improvement of Pharmaceutical Solids
43
1.5. ANALOGUE BASED APPROACH
1.5.1. 3D-QSAR
A QSAR (quantitative structure-activity relationship) is a multivariate,
mathematical relationship between a set of 2D and 3D physicochemical properties
(descriptors) and a biological activity. The QSAR relationship is expressed as a
mathematical equation. Analysis of the statistical relationships between molecular
structure and various properties provided by QSAR facilitates an understanding of
how chemical structure and biological activity are related [Charifson 2007]. In a
QSAR study the biological activity is correlated with changes in measured or
computed molecular features of the molecules. These features could be hydrophobic,
steric, electronic, thermodynamic, structural or molecular shape related and these may
influence biological activity. Regression analysis can be applied to the data to create a
model of activity based upon all or some of the features. The number of compounds
for which biological activity is known is usually small as compared to the number of
features, which can be measured or calculated.
A QSAR generally takes the form of a linear equation
Biological Activity = Const + (C1 P1) + (C2 P2) + (C3 P3) + ...
Where the parameters P1 through Pn are computed for each molecule in the series and
the coefficients C1 through Cn are calculated by fitting variations in the parameters
and the biological activity.
An underlying assumption in QSAR analyses is that all molecules in the data
set showing high activity bind to their receptor in a similar way. If the molecules
present similar molecular skeletons or similar binding groups, molecular alignment
can be performed by skeleton or binding group superimposition _i.e. the
pharmacophore using the most active compound in the series as a template.
Alternatively, the alignment can be performed on the basis of similarities in 3D
interaction fields. Molecular alignment is probably the most crucial problem of local
methods in 3D-QSAR analyses as all these methods require an alignment criterion
before developing the quantitative model. Poor alignment can result in an inadequate
statistical model.
Statistical methods are an essential component of QSAR work. They help to
build models, estimate a model's predictive abilities, and find relationships and

Studies based on Supramolecular Chemistry in Drug Design and Improvement of Pharmaceutical Solids
44
correlations among variables and activities. Regression methods are used to build a
model in the form of an equation that gives one or more dependent variables (usually
activity) in terms of independent variables ("descriptors"). The model can then be
used to predict activities for new molecules, perhaps prioritizing or screening a large
group of molecules whose activities are not known.
Methods of Statistical analysis available for the QSAR studies can be classified as:
Data analysis methods
Principal components analysis (PCA)
Cluster analysis
Regression methods
Simple linear regression (simple)
Multiple linear regression (linear)
Stepwise multiple linear regression (stepwise)
Principal components regression (PCR)
Partial least squares (PLS)
Genetic function approximation (GFA)
Genetic partial least squares (G/PLS)
Validation methods
Cross validation
Randomization test
Following are the different modules available in Cerius2 for QSAR study.
Molecular Field Analysis (MFA) [Hirashima et al. 1999], which quantifies the
interaction energy between a probe molecule and a set of aligned target molecules in a
QSAR. Interaction energies measured and analyzed for a set of 3D structures can be
useful in establishing QSARs.
Molecular Shape Analysis (MSA) [John et al. 1994], which extends QSAR
operations for performing 3D QSAR studies. This technique generates quantitative
measurements of molecular shape properties as part of QSAR analysis.

Studies based on Supramolecular Chemistry in Drug Design and Improvement of Pharmaceutical Solids
45
1.5.1.1. MATERIALS AND METHODS
Factor Xa (fXa) binding affinity data reported by Quan et al. has been used for
the present QSAR study. A set of aryl amidino isoxazoline derivatives which were
previously synthesized and evaluated for their activity taken from various references
[Quan et al. 1997, 1999,1999, 2003 and Pancras et al. 2000] were used in this study
(Table 1.1). The affinity data [ Ki(nM)] of aryl amidino isoxazoline derivatives for
factor Xa have been converted to the logarithmic scale [pKi)] and then used for
subsequent QSAR analyses as the response variable. All computational experiments
were conducted with Cerius2 4.11 version QSAR environment from Accelrys (San
Diego, USA) on a Silicon Graphics O2 workstation running under the IRIX 6.5
operating system. Molecular shape analysis (MSA) and Molecular field analysis
(MFA) were used as the 3D-QSAR techniques.
The MSA [John et al. 1994] is a formalism that deals with the quantitative
characterization, representation and manipulation of molecular shape in the
construction of a QSAR. The overall aim of MSA was to identify the biologically
relevant conformation without knowledge of the receptor geometry and to explain in a
quantitative fashion the activity of the series of congeners. The major steps of MSA
were (1) generation of conformers and energy minimization; (2) hypothesizing an
active conformer (global minimum of the most active compound); (3) selecting a
candidate shape reference compound (based on the active conformation); (4)
performing pairwise molecular superimposition using the maximum common
subgroup (MCSG) method; (5) measuring molecular shape commonality using MSA
descriptors; (6) determining other molecular features by calculating quantum
mechanical, spatial, electronic and conformational parameters; (7) selection of
conformers; (8) generation of QSAR equations by genetic function algorithm (GFA)
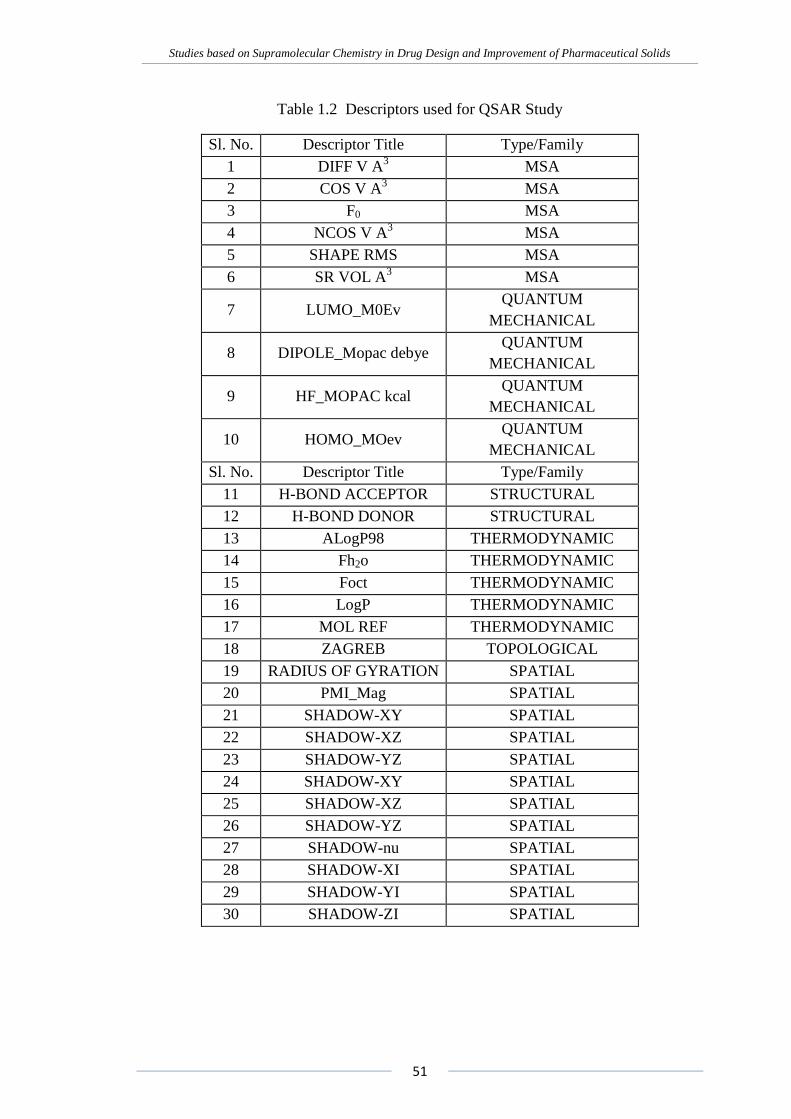
or stepwise regression. A complete list of descriptors used for the QSAR study were
given in Table 1.2. Multiple conformations of each molecule were generated using the
Boltzmann jump as a conformational search method. The upper limit of the number of
conformations per molecule was 150. Each conformer was subjected to an energy
minimization procedure using the smart minimizer with the Drieding force field to
generate the lowest energy conformation for each structure. The lowest energy
conformer of the most active inhibitor 51 and the best binding pose of most active
inhibitor that was obtained in flexible docking study were selected as shape references

Studies based on Supramolecular Chemistry in Drug Design and Improvement of Pharmaceutical Solids
46
in two separate studies for alignment. A rigid fit of atom pairings was performed to
superimpose each structure so that it overlays the shape-reference compound.
The major steps of MFA were (1) generating conformers and energy
minimization; (2) matching atoms using maximum common substructure (MCS)
search and aligning molecules using the default options; (3) setting MFA preferences
(rectangular grid with 2.00 Ao step size, charges by Gasteiger algorithm, H
+, CH3 and
HO- as probes); (4) creating the field; (5) analysis by the Genetic partial least squares
(G/PLS) method. The MFA models were predictive and sufficiently reliable to guide
the design of novel compounds. The MFA was attempted to postulate and represent
the essential features of a receptor site from the aligned common features of the
molecules that bind to it. The method generated multiple models that were checked
for validity. The MFA calculated probe interaction energies on a rectangular grid
around a bundle of active molecules. The surface was generated from a ‗‗Shape
Field‘‘. The atomic coordinates of the contributing models were used to compute field
values on each point of a 3D grid. Grid size was adjusted to default 2Å. The MFA
evaluated the energy between a probe (H+, CH3 and HO
-) and a molecular model at a
series of points defined by a rectangular grid. Fields of molecules were represented
using grids in MFA and each energy associated with an MFA grid point could serve
as input for the calculation of a QSAR. These energies were added to the study table
to form new columns headed according to the probe type. Statistical analysis of data
was done using techniques like G/PLS, genetic function approximation (GFA) and
stepwise regression for MSA and G/PLS, GFA for MFA using QSAR+ environment
of Cerius2 software.
The GFA technique was used to generate a population of equations rather than
one single equation for correlation between biological activity and physicochemical
properties. The GFA provided an error measure, called the lack of fit (LOF) score that
automatically penalized models with too many features. The GFA was done as
follows: (1) an initial population of equations is generated by random choice of
descriptors; (2) pairs from the population of equations are chosen at random and
‗‗crossovers‘‘ are performed and progeny equations are generated; (3) it is better at
discovering combinations of features that take advantage of correlations between
multiple features; (4) the fitness of each progeny equation is assessed by the LOF
measure; (5) it can use a larger variety of equation-term types in construction of its
models; (6) if the fitness of a new progeny equation is better, then it is preserved. The

Studies based on Supramolecular Chemistry in Drug Design and Improvement of Pharmaceutical Solids
47
model with a proper balance of all statistical terms was used to explain the variance of
the biological activity. The G/PLS algorithm was used as an alternative to a GFA
calculation. The G/PLS algorithm used GFA to select appropriate basis functions to
be used in a model of the data and PLS regression as the fitting technique to weigh the
basis functions‘ relative contributions in the final model. The method gave a reduced
solution that was statistically more robust than multiple linear regression (MLR). To
avoid overfitting, a strict test for the significance was done by cross-validation. The
use of G/PLS thus allowed the construction of larger QSAR equations while still
avoiding overfitting and eliminating most variables. For PLS equations r2, r and least
square error (LSE) were taken as statistical measures while LOF was noted for the
GFA-derived equations.
The 3D-QSAR equations generated were validated by PRESS (leave-one-out)
and bootstrap statistics which were calculated using the QSAR+ module of the
Cerius2 software and the reported parameters were cross-validation r2 (q
2), predicted
residual sum of squares (PRESS), standard deviation based on PRESS (SPRESS),
standard deviation of error of prediction (SDEP) and bootstrap r2 (bsr
2). Both the
model development process and finally developed models were subjected for
validation purposes. Additionally, the final models were subjected to leave-20%-out
crossvalidation with 15 trials in each case.
Table 1.1 Structure of QSAR study molecules
Basic Structure Molecule
Number R R1 R2
R
R2
N
O
O
NHR1
1 m-C=NH(NH2) CH2COOH p-C=NH(NH2)
2 m-C=NH(NH2) CH2COOCH3 p-C=NH(NH2)
3 m-C=NH(NH2) CH2CONHCH2COOCH3 p-C=NH(NH2)
4 p-C=NH(NH2) CH2COOCH3 m-C=NH(NH2)
5 m-C=NH(NH2) CH2COOCH3 m-C=NH(NH2)
6 m-C=NH(NH2) H p-C=NH(NH2)

Studies based on Supramolecular Chemistry in Drug Design and Improvement of Pharmaceutical Solids
48
Table 1.1 Structure of QSAR study molecules contd...
Basic Structure Molecule
Number R1
N
OO
NH
N
R1
Cl
NH2
S
O
O
NH2
7 NHCOCH3
8 NHCOOH
9 NHSO2NH2
10 NHSO2CH3
11 NHSO2(CH2)2CH3
12 NHSO2CH2CF3
13 NHSO2C6H5
14 NHSO2-thiophen-3-yl
15 NHSO2-3-pyridyl
16 NHSO2CH2C6H5
17 N
N
NN
18 N
N
19 N
N
N
20 NHCONH2
21 NHCONHCH2CH3
Basic Structure Molecule
Number P1
N
OO
NH
N
S
O
O
NH2
NH
SO
O
CH3
P1
22
NO
NH2
23
CH3
O

Studies based on Supramolecular Chemistry in Drug Design and Improvement of Pharmaceutical Solids
49
Table 1.1 Structure of QSAR study molecules contd...
Basic Structure Molecule
Number R1 R3 X Y
N
OO
NH
X
Y
R1
S
O
O
NH
NH2
NH
R3
24 CH2CH2OCH3 H CH CH
25 COONH2 H CCH3 CH
26 CH2COOH H CH CH
27 CH2SO2CH2CH3 H CH CH
28 CH2OCH3 H CH CH
29 CH2OCH2CH3 H CH CH
30 CH2O-n-Pr H CH CH
31 CH2O-i-Pr H CH CH
32 CH2O-n-Bu H CH CH
33 CH2O-i-Amyl H CH CH
34 H H CH CH
35 CH3 H CH CH
36 CF3 H CH CH
37 CH2C6H5 H CH CH
38 CH2-1-(1,2,4-triazole) H CH CH
39 CH2-1-tetrazole H CH CH
40 CH2-2-tetrazole H CH CH
41 CH2OCH3 H N N
42 CH2OCH2CH3 H N N
43 CH2SCH2CH3 H N N
44 CH2SO2CH2CH3 H N N
45 CH2-1-tetrazole H N N
46 CH3 H N CH
47 CH2OCH3 H N CH
48 CH2OCH2CH3 H N CH
49 CH2SCH2CH3 H N CH
50 CH2SO2CH2CH3 H N CH
51 CH2-1-tetrazole H N CH
52 CH2-1-tetrazole CH3 CH CH
53 CH2-1-tetrazole (CH2)2CH3 CH CH
54 CH2-1-tetrazole H CCH3 CH
55 CH2-1-tetrazole H CF CH

Studies based on Supramolecular Chemistry in Drug Design and Improvement of Pharmaceutical Solids
50
Table 1.1 Structure of QSAR study molecules contd...
Basic Structure Molecule
Number R2 X Y Z
N
OO
NH
X
Y
Z
NH2
NH
O
OCH3
R2
56 SO2NH2 CH CH CH
57 H CH CH CH
58 3‘-CH3 CH CH CH
59 2‘-CH3 CH CH CH
60 3‘-CF3 CH CH CH
61 2‘-CF3 CH CH CH
62 3‘-OCH3 CH CH CH
63 2‘-OCH3 CH CH CH
64 3‘-SO2NH2 CH CH CH
65 2‘-SH CH CH CH
66 2‘-COOCH3 CH CH CH
67 2‘-SO2CH3 CH CH CH
68 2‘-SO2NH2 CH CCH3 CH
69 2‘-SO2NH2 CH CF CH
70 2‘-SO2NH2 CH CH N
71 2‘-SO2NH2 N CH CH
72 2‘-SO2NH2 N N CH
Studies based on Supramolecular Chemistry in Drug Design and Improvement of Pharmaceutical Solids
51
Table 1.2 Descriptors used for QSAR Study
Sl. No. Descriptor Title Type/Family
1 DIFF V A3 MSA
2 COS V A3 MSA
3 F0 MSA
4 NCOS V A3 MSA
5 SHAPE RMS MSA
6 SR VOL A3 MSA
7 LUMO_M0Ev QUANTUM
MECHANICAL
8 DIPOLE_Mopac debye QUANTUM
MECHANICAL
9 HF_MOPAC kcal QUANTUM
MECHANICAL
10 HOMO_MOev QUANTUM
MECHANICAL
Sl. No. Descriptor Title Type/Family
11 H-BOND ACCEPTOR STRUCTURAL
12 H-BOND DONOR STRUCTURAL
13 ALogP98 THERMODYNAMIC
14 Fh2o THERMODYNAMIC
15 Foct THERMODYNAMIC
16 LogP THERMODYNAMIC
17 MOL REF THERMODYNAMIC
18 ZAGREB TOPOLOGICAL
19 RADIUS OF GYRATION SPATIAL
20 PMI_Mag SPATIAL
21 SHADOW-XY SPATIAL
22 SHADOW-XZ SPATIAL
23 SHADOW-YZ SPATIAL
24 SHADOW-XY SPATIAL
25 SHADOW-XZ SPATIAL
26 SHADOW-YZ SPATIAL
27 SHADOW-nu SPATIAL
28 SHADOW-XI SPATIAL
29 SHADOW-YI SPATIAL
30 SHADOW-ZI SPATIAL

Studies based on Supramolecular Chemistry in Drug Design and Improvement of Pharmaceutical Solids
52
Table 1.3. Importanat descriptor values for QSAR Study
MOLECULE
NUMBER
ACTIVITY
(pKi)
NCOSV
A3
DIFF V
A3
DIPOLE
MOMENT
HF_MOPAC
HOMO
PMI
MOL ref
ZAGREB
AlogP
Fh2O
Foct
HIGH
51 9.770 245.525 45.974 8.6680 451.1754 -9.3766 3630.164 143.7 212 0.51 -63.145 -49.440
55 9.357 229.408 49.350 8.7390 440.5836 -9.5678 3569.156 145.8 218 1.33 -60.796 -48.850
52 9.036 243.158 62.773 7.7740 489.7000 -9.5697 3674.995 150.5 216 1.33 -57.056 -45.410
71 9.018 224.787 47.423 7.6390 268.8943 -9.3640 3547.148 137.0 202 1.16 -55.773 -45.600
MEDIUM
29 8.456 227.920 47.1910 7.1910 289.8063 -9.3510 3459.226 139.0 196 2.03 -52.654 -47.090
11 8.432 277.038 41.4990 11.4990 343.6474 -8.8568 4052.572 150.6 214 1.92 -55.707 -47.070
46 8.387 196.119 34.7570 4.7570 302.7423 -9.3492 3342.220 126.2 184 1.55 -51.363 -44.940
67 8.377 236.775 27.0320 7.0320 335.6898 -9.4134 3501.064 140.2 202 2.59 -43.732 -38.100
LOW
57 6.657 224.589 21.263 0.6400 323.107 -8.7641 2727.018 126.6 178 3.06 -40.685 -36.880
58 6.620 200.389 17.250 1.5750 341.5050 8.7521 2975.891 131.7 184 3.55 -40.592 -37.510
6 6.569 128.069 -90.808 1.5750 281.5358 -9.0681 1843.436 96.7 134 0.68 -50.515 -44.760
5 6.097 188.241 -34.421 3.0750 307.9451 -9.1838 1901.327 112.3 160 0.60 -54.613 -45.940

Studies based on Supramolecular Chemistry in Drug Design and Improvement of Pharmaceutical Solids
53
1.5.1.2. RESULTS & DISCUSSION
Molecular field analysis
The generated field was of the rectangular type. The probes used in this study
(MFA1) were H
+ and CH3. In another study (MFA
2) HO
- was also used as extra probe.
The charge method used was Gasteiger and the energy cutoff was kept at -30 to +30
kcal. QSAR equations were generated using both G/PLS and GFA method. The
number of iterations was set to 1000,000 to obtain the final equation. The mutation
probabilities were set to the system defaults. The final best result was obtained with
G/PLS in MFA2
and was discussed here. A view of aligned molecules studied in the
field is shown in Figure 1.2 The following equation was obtained from the MFA:
G/PLS equation
Activity = 6.10935 + 0.101911 H+/220 + 0.010303 CH3/674 - 0.01462 H
+/570 +
0.02806 HO-/569 + 0.015087 HO
-/653 - 0.039155 H
+/213 + 0.027586 HO
-/659 +
0.017601 H+/752 + 0.032525 CH3/870 + 0.013759 H
+/552 - 0.037206 H
+/840 -
0.035787 H+/527 + 0.002849 H
+/751 - 0.054315 H
+/949.----------- Equation 1.1.
In Eq. 1.1, H+ /220, CH3 /674..., and so on were the probes and their
numbering (corresponding to spatial positions as shown in Figure 1.3); i.e., these
represent interactions at points 220 by H+, 674 by CH3, etc. The equation was of very
good statistical quality. It shows 90.2% explained variance while leave-one-out cross-
validation r2
is found to be 80.1%. The final models were also subjected to leave-
20%-out cross-validation tests with 15 trials and the r2 value between the observed
and predicted values were found to be 0.871 and 0.870 respectively (Table 1.4).
Predicted activity values for each molecule by the QSAR model were given in Table
1.5. Figure 1.3 to 1.6 show the plots between actual and predicted activity values.

Studies based on Supramolecular Chemistry in Drug Design and Improvement of Pharmaceutical Solids
54
Figure 1.2. Alignment of molecules for MFA study
Table 1.4 Statistics of MFA QSAR Equation
Statistical
Parameters
MFA1 MFA2
G/PLS GFA G/PLS GFA
r2
q2
LOO r2
20% out r2
BS r2
F-Test
PRESS
LOF
LSE
Outliers
0.881
0.666
0.777
0.870
0.740
13.780
0.068
4
0.902
0.816
0.801
0.871
0.903
37.562
7.568
0.150
0.056
8
0.893
0.715
0.807
0.871
0.797
11.742
0.061
4
0.877
0.840
0.829
0.868
0.877
49.226
6.608
0.125
0.070
6

Studies based on Supramolecular Chemistry in Drug Design and Improvement of Pharmaceutical Solids
55
Table 1.5 QSAR Activity Table
Molecule
Number
Actual
Acivity
(pKi)
MFA2 MSA
1
G/PLS
Redicted
GFA
Predicted
G/PLS
Predicted
GFA
Predicted
Stepwise
Predicted
1 6.845 6.625 6.813 60862 6.945 6.941
2 7.027 6.568 6.788 6.990 7.032 7.032
3 7.745 7.785 7.658 7.457 7.711 7.780
4 6.932 6.686 7.008 6.962 7.027 7.032
5 6.097 6.294 6.159 6.997 7.053 7.043
6 6.569 6.710 6.622 6.674 6.529 6.438
7 7.959 7.981 8.068 7.766 7.794 7.802
8 7.824 8.108 8.433 7.722 7.675 7.701
9 8.260 8.333 8.314 8.407 8.447 8.466
10 8.721 8.347 8.304 8.331 8.293 8.310
11 8.432 8.400 8.646 8.386 8.326 8.354
12 8.481 8.533 8.425 8.200 8.206 8.308
13 8.770 8.829 8.367 8.629 8.565 8.548
14 8.921 8.807 8.495 8.613 8.587 8.580
15 8.523 8.899 8.427 8.553 8.702 8.714
16 8.658 8.615 8.658 8.617 8.593 8.614
17 8.337 8.223 8.480 8.659 8.782 8.793
18 8.000 8.124 8.032 8.463 8.468 8.552
19 8.000 8.255 8.264 8.642 8.638 8.494
20 7.854 7.664 7.754 8.133 7.970 7.897
21 7.468 7.789 7.842 8.409 8.285 8.187
22 8.602 7.966 8.090 7.661 7.750 7.747
23 7.161 7.335 7.368 7.716 7.859 7.869
24 8.300 8.481 8.224 8.007 8.115 8.130
25 8.131 8.326 8.499 8.246 8.462 8.478
26 7.699 8.492 8.295 8.121 8.121 8.144
27 8.456 8.127 7.863 8.471 8.515 8.593
28 8.469 8.422 8.416 8.161 8.129 8.124
29 8.456 8.535 8.385 8.225 8.156 8.167

Studies based on Supramolecular Chemistry in Drug Design and Improvement of Pharmaceutical Solids
56
Molecule
Number
Actual
Acivity
(pKi)
MFA2 MSA
1
G/PLS
Redicted
GFA
Predicted
G/PLS
Predicted
GFA
Predicted
Stepwise
Predicted
30 8.538 8.657 8.476 8.337 8.164 8.190
31 8.367 8.789 8.554 8.319 8.222 8.252
32 7.886 7.895 7.644 8.483 8.181 8.220
33 7.432 7.623 7.558 8.376 8.225 8.308
34 8.143 8.101 8.031 7.907 7.772 7.693
35 7.959 8.087 8.062 8.003 7.841 7.805
36 7.638 7.595 7.894 7.855 7.720 7.766
37 8.070 8.150 8.294 8.480 8.253 8.198
38 8.770 8.532 8.652 8.594 8.617 8.556
39 8.796 8.862 8.850 8.860 8.879 8.768
40 8.796 8.714 8.709 8.733 8.679 8.579
41 8.004 8.053 8.055 8.050 8.101 8.121
42 8.168 8.055 8.106 8.167 8.158 8.186
43 8.620 8.448 8.229 8.279 8.166 8.126
44 8.276 8.381 8.448 8.498 8.613 8.679
45 8.886 9.209 9.550 8.723 8.887 8.836
46 8.387 8.633 8.473 7.885 7.694 7.682
47 8.602 8.248 8.526 7.931 7.951 7.955
48 7.553 8.057 8.104 8.178 8.015 8.041
49 8.658 8.514 8.280 8.220 7.985 7.947
50 8.770 8.432 8.461 8.538 8.481 8.572
51 9.770 9.237 9.584 9.819 9.844 9.863
52 9.036 8.819 8.769 8.798 8.920 8.832
53 8.678 8.783 8.734 9.003 8.981 8.944
54 9.000 8.937 8.888 8.790 8.908 8.801
55 9.357 8.877 8.886 8.711 8.853 8.761
56 8.201 7.943 8.046 7.916 8.039 8.073
57 6.657 6.629 6.577 6.693 6.567 6.646
58 6.620 6.653 6.611 6.991 6.926 6.874
59 6.678 6.882 6.829 6.859 6.893 6.840

Studies based on Supramolecular Chemistry in Drug Design and Improvement of Pharmaceutical Solids
57
Molecule
Number
Actual
Acivity
(pKi)
MFA2 MSA
1
G/PLS
Redicted
GFA
Predicted
G/PLS
Predicted
GFA
Predicted
Stepwise
Predicted
61 7.553 7.430 7.621 7.070 7.024 7.069
62 6.699 6.742 6.706 6.982 7.036 7.037
63 7.208 7.479 7.493 6.806 6.966 6.953
64 7.168 7.308 7.219 7.800 7.968 8.013
65 7.180 7.595 7.482 7.000 7.076 6.996
66 7.276 7.416 7.344 7.109 7.243 7.258
67 8.377 7.990 7.998 8.167 8.085 8.121
68 8.056 7.948 8.009 8.184 8.261 8.285
69 8.377 7.950 7.952 7.895 8.089 8.138
70 7.721 8.317 8.154 8.171 8.204 8.233
71 9.018 8.348 8.959 8.212 8.147 8.213
72 8.367 8.739 8.585 8.034 8.211 8.267
Molecular shape analysis
A view of aligned molecules in MSA1 and MSA
2 study were shown in Figure
1.7. and 1.8 respectively. MSA2 was found to be superior to MSA
1. The best equation
obtained from GFA regression (at 100,000 crossovers and F value for inclusion of
variables was set to 4) in MSA2 was,
Activity = -2.1378 – 0.022792*<Foct> - 0.008514*<NCOSV> - 0.324377*
<AlogP98> + 0.045833*<Mol Ref> + 0.69775*<Rad of Gyration> -----Equation 1.2.
Equation 1.2. could explain 73.6% of the variance and predict 64.1% of the
variance. The final model was also subjected leave-one-out and leave-20%-out cross-
validation tests with 15 trials and the r2 value between the observed and predicted
values was found to be 0.727 and 0.743 respectively (Table 1.6). Predicted activity
values for each molecule by the QSAR model were given in Table 1.5. Figure 1.9 to
1.11 show the plots between actual and predicted activity values.

Studies based on Supramolecular Chemistry in Drug Design and Improvement of Pharmaceutical Solids
58
Figure 1.3. Actual Vs Predicted
Acitvity values obtained in MFA1 by
G/PLS regression
Figure 1.4. Actual Vs Predicted
Acitvity values obtained in MFA1 by
GFA regression
Figure 1.5.: Actual Vs Predicted
Acitvity values obtained in MFA2
by
G/PLS regression
Figure 1.6. Actual Vs Predicted
Acitvity values obtained in MFA2
by
GFA regression

Studies based on Supramolecular Chemistry in Drug Design and Improvement of Pharmaceutical Solids
59
The following two equations were among those obtained from the G/PLS and
Stepwise regressions respectively,
Activity = -3.55282 + 0.06584*<DIPOLE_MOPAC> -0.00127*<Vm> -
0.177066*<AlogP98> -0.720516*<HOMO_MOPAC> + 0.048567*<Mol Ref> -
0.005897*<NCOSV> ----------------- Equation 1.3.
Activity = -4.14186 + 0.0064018*<COSV> + 0.062217*<DIPOLE_MOPAC> -
0.751026* <HOMO_MOPAC> + 0.028011*<Mol Ref> -0.18584*<AlogP98> ----
Equation 1.4.
Table 1.6 Statistics of MSA QSAR Equation
Statistical
Parameters
MSA1 MSA2
G/PLS GFA STEPWISE G/PLS GFA STEPWISE
r2
q2
LOO r2
20% out r2
BS r2
F-Test
PRESS
LOF
LSE
Outliers
0.730
0.639
0.727
0.780
0.695
14.878
0.155
3
0.736
0.641
0.727
0.743
0.736
30.211
14.733
0.217
0.151
7
0.731
0.623
0.721
0.691
0.731
35.841
15.516
7
0.695
0.648
0.682
0.694
0.679
14.516
0.175
1
0.696
0.628
0.686
0.753
0.696
30.241
15.347
0.234
0.174
4
0.677
0.605
0.648
0.724
0.677
35.136
5

Studies based on Supramolecular Chemistry in Drug Design and Improvement of Pharmaceutical Solids
60
Figure 1.7. Alignment of molecules for MSA1 study
Figure 1.8. Alignment of molecules for MSA2 study

Studies based on Supramolecular Chemistry in Drug Design and Improvement of Pharmaceutical Solids
61
Figure 1.9. Actual Vs Predicted Acitvity values obtained in MSA2 by GFA regression
Figure 1.10. Actual Vs Predicted Acitvity values obtained in MSA2 by G/PLS
regression
Figure 1.11. Actual Vs Predicted Acitvity values obtained in MSA2 by Stepwise
regression

Studies based on Supramolecular Chemistry in Drug Design and Improvement of Pharmaceutical Solids
62
1.5.2. PHARMACOPHORE MODELING (CATALYST)
One of the basic tenets of medicinal chemistry is that biological activity is
dependent on the three-dimensional placement of specific functional groups (the
pharmacophore). A pharmacophore is defined as an ensemble of universal chemical
features that characterize a specific mode of action of a ligand in the active site of the
macromolecule in 3D space [Barnum et al. 1996]. Chemical features are e.g.
hydrogen bonds, charge interactions, hydrophobic areas. CATALYST is one of such a
pharmacophore generating modeling tool is being successfully used, in conjunction
with traditional research techniques, to examine the structural properties of existing
compounds, develop and quantify a hypothesis which relates these properties to
observed activity and utilize these "rules" to predict properties and activities for new
chemical entities [Patel et al. 2002]. Catalyst tools help to rationally design small
molecules as drug candidates using 3D pharmacophore and shape-based models, and
to suggest potentially active compounds suitable for synthesis and biological testing.
Ludi can also be used in analog-based design strategies without the knowledge of the
receptor structure. Given a series of superimposed analogs, identifies the potential
interaction sites and searches library for molecules that match these interaction sites.
The aim of this study was the generation of selective pharmacophore models
that describe the type, the size, and the position of chemical functions essential for a
compound‘s anticoagulent activity via factor Xa inhibition, for a set of aryl amidino
isoxazoline derivatives.

Studies based on Supramolecular Chemistry in Drug Design and Improvement of Pharmaceutical Solids
63
1.5.2.1. MATERIALS AND METHODS
All molecular modeling studies were performed using Catalyst 4.11 installed
on a Silicon Graphic Octane desktop Workstation. The flexibility of each molecule
was represented by a set of energetically reasonable conformers which were generated
with the Catalyst catConf module choosing a maximum number of 250 conformers,
the best quality generation type, and an energy threshold of 20 kcal/mol beyond the
calculated global energy minimum. The number of conformers generated for each
molecule was limited to a maximum of 255. Ten hypotheses were generated using
these conformers for each of the molecules and estimated activity values are
generated after selection of the following features for the drugs; hydrogen bond
donor, hydrophobic, negative charge, positive ionizable and ring aromatic. After
assessing all 10 hypotheses generated for each data set, the lowest energy cost
hypothesis was considered the best. The goodness of the structure activity correlation
was estimated by means of the correlation coefficient (r). Also calculated the total
energy cost of the generated pharmacophores from the deviation between the
estimated activity and the observed activity, combined with the complexity of the
hypothesis (i.e., the number of pharmacophore features). A null hypothesis was
additionally calculated, which presumes that there is no relationship in the data and
that experimental activities are normally distributed about their mean. Hence, the
greater the difference between the energy cost of the generated hypothesis and the
energy cost of the null hypothesis, the less likely it is that the hypothesis reflects a
chance correlation. This criterion was then used as an assessment of the
pharmacophore model selected.

Studies based on Supramolecular Chemistry in Drug Design and Improvement of Pharmaceutical Solids
64
1.5.2.2. RESULTS & DISCUSSION
Catalyst was used on the set of molecules with activity spanning orders of
magnitude to construct a useful model of the chemical features and their position in
3D space (Figure 1.12 and Table 1.7) necessary for a biological response. After
several iterations the model of our 30-molecule data set produced a good correlation
when compared with the estimated (r of 0.92). The model contained four features
necessary for activity, namely two hydrogenbond donor, a hydrophobic aromatic, and
a ring aromatic feature (Figure 1.12 and Table 1.8). The features have been compared
with highest and low activity molecules in the dataset using comparefit and found that
ring aromatic feature has been missed for the later one (Figure 1.13 & 1.14). The
generated catalyst hypotheses can serve as query features in 3D database (DB) search
for virtual screening to detect novel lead compounds as factor Xa inhibitors.
Table 1.7. Pharmacophore Activity Table
Molec
ule
Numb
er Fit
Actual
Activity
Ki(Nm)
Estimat
ed
Activity
Ki'
(Nm) Error
Mole
cule
Num
ber Fit
Actual
Activity
Ki(Nm)
Estimat
ed
Activity
Ki'
(Nm) Error
51 8.66 0.17 0.16 -1.1 3 5.98 18 77 -1.6
71 7.57 0.96 2 2 70 6.78 19 12 -1.3
50 7.61 1.7 1.8 1.1 26 6.67 20 16 -1.4
14 7.19 2.8 4.7 1.7 36 6.65 23 16 1.1
11 6.7 3.7 15 4 61 6.38 28 30 -2.4
17 6.61 4.6 18 3.9 21 6.71 34 14 -1
9 7.14 5.5 5.2 -1.1 66 6.15 53 52 -1.7
56 7.26 6.3 4 -1.6 64 6.26 68 40 -1.3
25 6.92 7.4 8.9 1.2 2 6.01 94 72 -1.3
68 7.29 8.8 3.8 -2.3 4 5.9 120 92 -1.3
41 6.74 9.9 13 1.3 1 5.96 140 81 -1.8
7 6.67 11 16 1.4 62 5.68 200 150 -1.3
32 6.87 13 10 -1.3 59 5.87 210 98 -2.1
20 6.73 14 14 -1 58 5.62 240 180 -1.4
8 6.68 15 15 1 6 5.33 270 340 1.3

Studies based on Supramolecular Chemistry in Drug Design and Improvement of Pharmaceutical Solids
65
Table 1.8. Pharmacophore Geometry Table
DISTANCE Ra-Hd2 Ra-Hd1 Ra-La La-Hd2 La-Hd1 Hd1-Hd2
Min.
Max.
5.800
7.800
4.666
6.666
4.153
6.153
9.810
11.810
4.338
6.338
10.891
12.891
ANGLE Hd1RaHd2 Hd1LaHd2 Hd1RaLa LaRaHd2
Min.
Max.
139.0o
149.0o
83.1o
93.0o
53.9o
63.9o
124.0o
133.9o
Figure 1.12: Pharmacophore model showing various features required for activity
Hd1
Hd2
Ra
La
Ra- Ring aromatic
La- Hydrophobic aromatic
Hd- Hydrogen bond donor

Studies based on Supramolecular Chemistry in Drug Design and Improvement of Pharmaceutical Solids
66
Figure 1.13. Complete alignment of Pharmacophoric features observed for the high
active compound of the series
Figure 1.14. Partial alignment of Pharmacophoric features observed for the low active
compound of the series.

Studies based on Supramolecular Chemistry in Drug Design and Improvement of Pharmaceutical Solids
67
1.6. STRUCTURE BASED APPROACH
1.6.1. DOCKING
To discover novel ligands for receptors of known structure, investigators often
use docking computer programs to screen multi-compound databases for molecules
that fit a binding site on the receptor. For each molecule, many orientations and
conformations are sampled; based on these configurations, each molecule is scored
for complementarity to the receptor and ranked relative to the other members of the
database.
LigandFit [Venkatachalam et al. 2003] is one of such a drug discovery
software program. The program apprises each of hundreds of millions of molecules to
see if they are likely to interact with a target protein. It calculates and studies the
many positions, or conformers, the molecule might adopt interacting with the protein.
This process is called virtual screening of the molecules. It explores the 3-dimensional
position each molecule might adopt. Each new position of the molecule may help the
right parts of the molecule interact with the protein target. The total number of
conformations differs molecule to molecule. Some molecules may have more bonds
or flexibility, and thus will have more conformers.
LigandFit provides a cavity search algorithm for finding binding sites.
Possible binding sites are proposed to use as a binding site, or a binding site already
defined by the ligand. This is especially useful when a model or experimental
structure of the protein has been obtained but the binding site has not been identified.
LigandFit uses the energy of the ligand-receptor complex to automatically find the
best binding modes of the ligand to the receptor. A grid method is used for the
evaluation of non-bonded interactions between the rigid protein and the movable
atoms from the flexible ligand [Venkatachalam et al. 2003].

Studies based on Supramolecular Chemistry in Drug Design and Improvement of Pharmaceutical Solids
68
1.6.1.1. MATERIALS AND METHODS
All molecular modeling studies were performed using Accelrys Discovery
studio installed on a Silicon Graphic Octane desktop Workstation. Shape and volume
of the active site has been identified by selecting the aminoacid residues around the
non stranded residue of the protein at 5 Å distance. A set of aryl amidino isoxazoline
derivatives which were previously synthesized and evaluated for their activity taken
from various references [Quan et al. 1997, 1999,1999, 2003 and Pancras et al 2000]
were used in this study (Table 1.1). Ten Molecules with varied range of activities
have been selected from the study set molecules. Conformational search for each
selected molecules was done by simplex search method. Generated conformers were
docked in the active site and calculated for their interactions. Ten best conformations
for each molecule are selected by the system based on dock score and ligand
interaction energies.
1.6.1.2. RESULTS & DISCUSSION
Results of docking studies were displayed in Table 1.9. Difference in
interaction energy values and the binding mode of conformations (Figure 1.15 &
1.16) can be used to explain the activity variance between the molecules. Conformer
with better interaction energy values for 51 was used as shape reference to align all
other study molecules for 3D-QSAR studies.
Table 1.9. Dock score and interaction energy values
Molecule
Number
Dock
Score
Ligand
Interaction Energy
Actual
Acivity (pKi)
51 73.660 -9.682 9.770
3 71.861 -5.479 7.745
14 78.664 -9.339 8.921
17 79.067 -10.071 8.337
56 77.955 -7.561 8.201
60 71.702 -8.440 6.620
25 75.043 -10.075 8.131
71 72.448 -9.925 9.018

Studies based on Supramolecular Chemistry in Drug Design and Improvement of Pharmaceutical Solids
69
Figure 1.15: Comparative view on binding modes between high (stick model) and low
(cylinder model) active molecules
Figure 1.16: Binding mode of another conformer of the high active molecule

Studies based on Supramolecular Chemistry in Drug Design and Improvement of Pharmaceutical Solids
70
1.6.2. DE NOVO LIGAND DESIGN
The receptor-based approach to CADD applies when a reliable model of the
receptor site is available, as from X-ray diffraction, NMR, or homology modeling.
With the availability of the receptor site, the problem is to design ligands that will
interact favorably at the site, which is a docking problem.
Ludi is a de novo ligand design program [Bohm 1992] which provides a
starting point for the design. It offers significant time saving in the search for new and
potentially improved ligands. It quickly generates a series of potential ligands for
molecular receptors. From the structure of the target receptor or from a set of ligands
for the target receptor, Ludi derives the potential binding interaction sites and then
searches a library for complementary small molecules. Ludi automatically fits and
scores members of a library against a receptor site, and ranks those candidate
structures as a prioritized list. The potential ligands suggested by this method are
selected based on their ability to participate in nonbonded interactions with the
receptor. Both hydrogen bonding and hydrophobic interactions are considered in the
selection process. Alternatively, this programme can also be used to optimize a given
ligand by performing targeted modifications to those sites that develop key
interactions with the receptor.

Studies based on Supramolecular Chemistry in Drug Design and Improvement of Pharmaceutical Solids
71
1.6.2.1. MATERIALS AND METHODS
All molecular modeling studies were performed using Accelrys Discovery
studio installed on a Silicon Graphic Octane desktop Workstation. Defining the active
site is the prerequisite for De novo design. PDB structure of factor Xa with bound
ligand (1LPG) revealed by X-ray crystallography was downloaded and used in this
study. Interactions of bound ligand with active site residues of protein can be
visualized from Figure 1.17. The active site of factor Xa was defined with 568 atoms
surrounding the ligand at a distance of 5 Å. Five different centers were defined in the
active site (Figure 1.18) and subjected to find hits from the library of fragments. A hit
fragment in each run was selected based upon the match of the atoms with the
interaction points generated around respective center. After positioning the hits on
their site points linker fragments were generated to connect the hit fragments and
finally built the lead molecule after several runs and selections (Figure 1.19, 1.20 and
1.21). Later the generated molecules were subjected to docking studies to study the
interaction energies.
1.6.2.2. RESULTS & DISCUSSION
Six molecules were designed as lead compounds. Structure were shown in
Figure 1.22. Three molecules were found to have good predicted activity values by
the MSA QSAR model (Table 1.10). The dock scores and interaction energy values
for these molecules were comparable with current active set of molecules. Dock score
and interaction energy value for lead molecules 1,3 & 5 were found to be good and
advocated the predicted activity. We presume that lead1 molecule can be developed
into drug candidate by further optimization.
Table 1.10: Predicted activity for designed structures
Lead
Molecules
Predicted Activity (pKi) By QSAR Model Dock Score
G/PLS
Equation
GFA
Equation
STEPWISE
Equation
1 8.093 7.578 7.931 -6.8306
2 6.003 5.993 5.622 -4.4158
3 9.267 5.241 5.113 -6.10635
4 7.089 5.241 6.296 -5.3038
5 6.898 6.014 5.901 -5.70561

Studies based on Supramolecular Chemistry in Drug Design and Improvement of Pharmaceutical Solids
72
Figure 1.17. Active site residues of factor Xa showing non bonded interactions with
non stranded residue(bound ligand).
Figure 1.18. Active site of factor Xa with interaction points generated by Ludi
program

Studies based on Supramolecular Chemistry in Drug Design and Improvement of Pharmaceutical Solids
73
Figure 1.19. Hits/fragments generated at center ‗A‘ of the active site
Figure 1.20. Hits/fragments generated at center ‗C1 & C2‘ of the active site

Studies based on Supramolecular Chemistry in Drug Design and Improvement of Pharmaceutical Solids
74
Figure 1.21. Hits/fragments generated at center ‗B & D‘ of the active site
SOH
Br
N
O
OHCH3
NN
S
Br
Br
S
Br
Br
O
O
O
CH3
S
Br
Br O
O
S
Br
Br
O
O
Figure 1.22. Structures of designed lead molecules
Lead 1
Lead 2
Lead 3
Lead 4
Lead 5

Studies based on Supramolecular Chemistry in Drug Design and Improvement of Pharmaceutical Solids
75
1.7. CONCLUSION
Designing of fXa inhibitors as anticoagulants started with structure based
approach and ended by predicting the activity for the lead molecules with the aid of
Pharmacophore and QSAR models. Three of the designed molecules found to be
promising candidates to be developed as drug candidates by further optimization. The
present 3D-QSAR analysis explores the spatial, shape and thermodynamic
requirements for the binding affinity of aryl amidino isoxazoline derivatives to factor
Xa. The MSA-derived equations shows the importance of thermodynamic and
quantum mechanical descriptors, molecular refractivity and radius of gyration
contribution to activity. The MFA-derived equation shows interaction energies at
different grid points with positive, negative and neutral bulk probes. Statistically
reliable 3D-QSAR and pharmcophore models obtained from this study suggest that
these techniques could be useful to design potent factor Xa inhibitors and predict the
activity of same.

Studies based on Supramolecular Chemistry in Drug Design and Improvement of Pharmaceutical Solids
76
1.8. REFERENCES
Agustin, C.G., Danette, A. D., Ronald, J. H., Kevin, J. F., Christopher, F. B., Jeremy,
J. E. 2006. Progress in the discovery of factor Xa inhibitors. Expert Opin Ther
Patents. 16:119 –45.
Al-Obeidi, F., Ostrem, J.A. 1999. Factor Xa inhibitors. Expert Opin Ther Patents.
9:931 –53.
Barnum, D., Greene, J., Smellie, A., Sprague, P. 1996. Pharmacophore perception,
development, and use in drug design. J. Chem. Inf. Comput. Sci. 36:563–571.
Böhm, H.J. 1992. The computer program Ludi: a new method for the de novo design
of enzyme inhibitors. J. Comput. Aided Mol. Des. 1:61–78.
Brown, D. L., Kouides, P.A. 2008. Diagnosis and treatment of inherited factor X
deficiency. Haemophilia. 14:1176–1182.
Butenas, S., Veer, C., Mann, K. G., 1999. ―Normal‖ thrombin generation. Blood. 94,
2169–2178.
Cerius2 Version 4.11 (2006) Accelrys Inc, San Diego, USA;
http://www.accelrys.com/cerius2
Charifson P.S. Practical applications of computer-aided drug design‘ 1st ed.; Marcel
Dekker Inc., New York, 1997; pp. 105–163.
Christoph, S., Gerhard, K. 2002. Identification and mapping of small-molecule
binding sites in proteins: computational tools for structure-based drug design. Il
Farmaco. 57(3):243–251.
Diane, J.M. 1999. Computational approaches to structure-based ligand design. Pharm.
& Ther. 84(2):179–191.
Edgar, F.M., Stanley, M.S., Jocylin, A.W. 2000. Molecular modelling and drug
design. Pharmacol Ther. 85(3):113–121.
Guertin, K.R., Gardner, C.J., Klein, S.I., Zulli, A.L., Czekaj, M., Gong, Y., Spada,
A.P., Cheney, D.L., Maignan, S., Guilloteau, J.P., Brown, K.D., Colussi, D.J., Chu,
V., Heran, C.L., Morgan, S.R., Bentley, R.G., Dunwiddie, C.T., Leadley, R.J., Pauls,

Studies based on Supramolecular Chemistry in Drug Design and Improvement of Pharmaceutical Solids
77
H.W. 2002. Optimization of the beta-aminoester class of Factor Xa inhibitors. Part 2:
identifi cation of FXV673 as a potent and selective inhibitor with excellent in vivo
anticoagulant activity. Bioorg Med Chem Lett.12(12):1671 –4.
Hirashima, A., Nagata, T., Pan, C., Kuwano, E., Taniguchi, E., Eto, M. 1999. Three-
dimensional molecular field analyses of octopaminergic agonists and antagonists for
the locust neuronal octopamine receptor class 3. J. Mol. Graph. Model. 17(3-4):198–
206, 218.
Hirsh, J., Bauer, K.A., Donati, M.B., Gould, M., Samama, M.M., Weitz, J.I.,
American College of Chest Physicians. 2008. Parenteral anticoagulants: American
College of Chest Physicians evidence-based clinical practice guidelines (8th Edition).
Chest. 133:141S–159S.
Hougie, C., Barrow, H. M., Graham, J.B. 1957. Segregation of a hereditary
hemorrhagic state from the heterozygous heretofore called ―stable factor‖ (SPCA,
proconvertin factor VII deficiency). J. Clin. Invest. 36:485–493.
Lam PY, Clark CG, Li R, Pinto DJ, Orwat MJ, Galemmo RA, Fevig JM, Teleha CA,
Alexander, R.S., Smallwood, A.M., Rossi, K.A., Wright, M.R., Bai, S.A., He, K.,
Luettgen, J.M., Wong, P.C., Knabb, R.M., Wexler, R.R. 2003. Structure-based design
of novel guanidine/benzamidine mimics: potent and orally bioavailable Factor Xa
inhibitors as novel anticoagulants. J Med Chem. 46(21):4405 –18.
Lefkovits, J., Malycky, J.L., Rao, J.S., Hart, C.E., Plow, E.F., Topol, E.J., Nicolini,
F.A. 1996. Selective inhibition of factor Xa is more efficient than factor VIIa-tissue
factor complex blockade at facilitating coronary thrombolysis in the canine model. J.
Am. Coll. Cardiol. 28(7):1858–1865.
Lynch, J.J.Jr., Sitko, G.R., Mellott, M.J., Nutt, E.M., Lehman, E.D., Friedman, P.A.,
Dunwiddie, C.T., Vlasuk, G.P. 1994. Maintenance of canine coronary artery patency
following thrombolysis with front loaded plus low dose maintenance conjunctive
therapy. A comparison of factor Xa versus thrombin inhibition. Cardiovasc. Res.
28:78–85.
Maduskuie, T.P., McNamara,K.J.Jr., Ru, Y., Knabb, R.M., Stouten, P. 1998. Rational
design and synthesis of novel, potent bis-phenylamidine carboxylate factor Xa

Studies based on Supramolecular Chemistry in Drug Design and Improvement of Pharmaceutical Solids
78
inhibitors. J. Med. Chem.41(1):53–62.
Maignan, S., Mikol, V. 2001. The use of 3D structural data in the design of specifi c
factor Xa inhibitors. Curr Top Med Chem. 1:161 –74.
Matter, H., Defossa, E., Heinelt, U., Blohm, P.M., Schneider, D., Mueller, A., Herok,
S., Schreuder, H.A., Liesum, A., Brachvogel, V., Loenze, P., Walser, A., Al-Obeidi,
F., Wildgoose, P. 2002. Design and quantitative structure-activity relationship of 3-
amidinobenzyl-1H-indole-2-carboxamides as potent, nonchiral, and selective
inhibitors of blood coagulation factor Xa. J.Med.Chem. 45:2749–2769.
McLean, J. 1916. The thromboplastic action of cephalin. Am. J. Physiol. 41(2):250–
257.
Nagahara, T., Yokoyama, Y., Inamura, K., Katakura, S., Komoriya, S., Yamaguchi,
H., Hara, T., Iwamoto, M. 1994. Dibasic (amidinoaryl)propanoic acid derivatives as
novel blood coagulation Factor Xa inhibitors. J Med Chem. 37(8):1200 –7.
Nicolini, F.A., Lee, P., Malycky, J.L., Lefkovits, J., Kottke-Marchant, K., Plow, E.F.,
Topol, E.J .1996. Selective inhibition of factor Xa during thrombolytic therapy
markedly improves coronary artery patency in a canine model of coronary
thrombosis. Blood Coagul. Fibrinolysis. 7(1):39–48.
Pancras, C.W., Mimi, L.Q., Earl, J., Crain, C.A., Watson, R.W., Robert, M.K. 2000.
Nonpeptide Factor Xa Inhibitors: I. Studies with SF303 and SK549, a New Class of
Potent Antithrombotics. J. Pharm. Exp. Ther. 292:351–357.
Patel, Y., Gillet, V.J, Bravi, G., Leach, A.R. 2002. A comparison of the
pharmacophore identification programs: Cat.alyst, DISCO and GASP. J Comput
Aided Mol Des. 16(8-9):653–81.
Pinto, D.J., Orwat, M.J., Koch, S., Rossi, K.A., Alexander, R.S., Smallwood, A.,
Wong, P.C., Rendina, A.R., Luettgen, J.M., Knabb, R.M., He, K., Xin, B., Wexler,
R.R., Lam.P.Y. 2007. Discovery of 1-(4-methoxyphenyl)-7-oxo-6-(4-(2-oxopiperidin-
1-yl)phenyl)-4,5,6,7-tetrahydro-1H-pyrazolo[3,4-c]pyridine-3-carboxamide
(Apixaban, BMS-562247), a highly potent, selective, effi cacious, and orally
bioavailable inhibitor of blood coagulation f. J Med Chem. 50(22):5339 –56.

Studies based on Supramolecular Chemistry in Drug Design and Improvement of Pharmaceutical Solids
79
Pinto, D.J., Orwat, M.J., Wang, S., Fevig, J.M., Quan, M.L., Amparo, E., Cacciola, J.,
Rossi, K.A., Alexander, R.S., Smallwood, A.M., Luettgen, J.M., Liang, L., Aungst,
B.J., Wright, M.R., Knabb, R.M., Wong, P.C., Wexler, R.R., Lam, P.Y. 2001.
Discovery of 1-[3-(aminomethyl) phenyl]-N-[3-fl uoro-2 ′ -(methylsulfonyl)-[1,1′ -
biphenyl]-4-yl]-3-(trifluoromethyl)- 1H-pyrazole-5-carboxamide (DPC-423), a highly
potent, selective, and orally bioavailable inhibitor of blood coagulation Factor Xa. J
Med Chem. 44(4):566 –78.
Quan, M. L., Pruitt, J.R., Ellis, C.D., Liauw, A.Y., Galemmo, Jr.R.A., Stouten,
P.F.W., Wityak, J., Knabb, R.M., Thoolen, M.J., Wong, P.C., Wexler, R.R. 2003.
Nonbenzamidine isoxazoline derivatives as factor Xa inhibitors. Bio. & Med. Chem.
Lett. 13(6):1023–1028.
Quan, M. L., Pruitt, J.R., Ellis, C.D., Liauw, A.Y., Galemmo, Jr.R.A., Stouten,
P.F.W., Wityak, J., Knabb, R.M., Thoolen, M.J., Wong, P.C., Wexler,R.R.1997.
Bisbenzamidine isoxazoline derivatives as factor Xa inhibitors. Bio. & Med. Chem.
Lett. 7(21):2813–2818.
Quan, M.L., Lam, P.Y., Han, Q., Pinto, D.J., He, M.Y., Li, R., Ellis, C.D., Clark,
C.G., Teleha, C.A., Sun, J.H., Alexander, R.S., Bai, S., Luettgen, J.M., Knabb, R.M.,
Wong, P.C., Wexler,R.R. 2005. Discovery of 1-(3 ′ -aminobenzisoxazol-5′ -yl)-3-trifl
uoromethyl-N-[2-fluoro-4-[(2′ -dimethylaminomethyl)imidazol-1-yl]phenyl]-1H-
pyrazole-5-carboxamide hydrochloride (razaxaban), a highly potent, selective, and
orally biovailable Factor Xa inhibitor. J Med Chem.48:1729 –44.
Quan, M.L., Liauw, A.Y., Ellis, C.D., Pruitt, J.R., Carini, D.J., Bostrom, L.L., Huang,
P.P., Harrison, K., Knabb, R.M., Thoolen, M.J., Wong, P.C., Wexler, R.R. 1999.
Design and synthesis of isoxazoline derivatives as factor Xa inhibitors. 1. J. Med.
Chem.42:2752–2759.
Quan, M.L., Liauw, A.Y., Ellis, C.D., Pruitt, J.R., Carini, D.J., Bostrom, L.L., Huang,
P.P., Harrison, K., Knabb, R.M., Thoolen, M.J., Wong, P.C., Wexler, R.R. 1999.
Design and synthesis of isoxazoline derivatives as factor Xa inhibitors. 2. J. Med.
Chem. 42:2760–2773.
Roehrig, S., Straub, A., Pohlmann, J., Lampe, T., Pernerstorfer, J., Schlemmer, K.H.,
Reinemer, P., Perzborn, E.2005. Discovery of the novel antithrombotic agent 5-

Studies based on Supramolecular Chemistry in Drug Design and Improvement of Pharmaceutical Solids
80
chloro-N-({(5S)-2-oxo-3-[4-(3-oxomorpholin-4-yl)phenyl]-1,3-oxazolidin-5-
yl}methyl)thiophene-2-carboxamide (BAY 59-7939): an oral, direct factor Xa
inhibitor. J Med Chem. 48(19):5900 –8.
Sitko, G.R., Ramjit, D.R., Stabilito II, Lehman, D., Lynch, J.J., Vlasuk, G.P. 1992.
Conjunctive enhancement of enzymatic thrombolysis and prevention of thrombotic
reocclusion with the selective factor Xa inhibitor, tick anticoagulant peptide.
Comparison to hirudin and heparin in a canine model of acute coronary artery
thrombosis. Circulation. 85(2):805–815.
Telfer, T. P., Denson, K. W., Wright, D.R. 1956. A ―new‖ coagulation defect. Br. J.
Haematol. 2(3):308–316.
Tokarski, J.S., Hopfinger, A.J. 1994. Three-dimensional molecular shape analysis-
quantitative structure-activity relationship of a series of cholecystokinin-A receptor
antagonists. J Med Chem. 37(21):3639–54.
Venkatachalam, C.M., Jiang, X., Oldfield, T., Waldman, M. 2003. LigandFit: a novel
method for the shape-directed rapid docking of ligands to protein active sites. J Mol
Graph Model. 21(4):289–307.
Waxman, L., Smith, D. E., Arcuri, K. E., Vlasuk, G.P. 1990. Tick anticoagulant
peptide (TAP) is a novel inhibitor of blood coagulation factor Xa. Science. 248:593–
596.
Wong, P.C., Pinto, D.J., Knabb, R.M. 2002. Nonpeptide Factor Xa inhibitors:
DPC423, a highly potent and orally bioavailable pyrazole antithrombotic agent.
Cardiovasc Drug Rev. 20:137 –52.