11 price dispersion in otc markets: a new measure of liquidity rainer jankowitsch amrut nashikkar...
TRANSCRIPT

11
Price Dispersion in OTC Markets: A New Measure of Liquidity
Rainer JankowitschAmrut Nashikkar
Marti Subrahmanyam
Stern School of Business New York University
For presentation at the conference onLiquidity: Pricing and Risk Management
Bank of England, 23-24 June 2008

22
Outline
Liquidity and Asset prices
Research problem
Theoretical model
Data description
Results

3
Liquidity and Asset Prices
• Why are liquidity effects important in asset pricing?• Theory on liquidity effects and asset prices: The current
literature.• Empirical evidence on liquidity effects in asset prices:
The current literature.• Liquidity effects in highly illiquid markets: Problems of
measurement.• Liquidity effects in highly illiquid markets: An example of
the US corporate bond market.• Liquidity effects in OTC markets

4
Why are liquidity effects important? • Assets with similar risk characteristics have different
expected returns.• One candidate for missing factor – liquidity.• Liquidity differentials may explain differences in return
performance for the same level of risk.• Liquidity raises trading volume and reduces the cost of
capital – even small improvements reduce the cost of capital substantially.
• Example: Hedge funds buy illiquid assets and sell liquid ones–“off-the-run” versus “on-the-run.”

5
Liquidity effects in highly illiquid markets
• Problem with most liquidity metrics is that they are transaction-based measures.
• Applicable in the more liquid markets, e.g. equities, foreign exchange, some treasury bonds.
• Many asset markets are too illiquid to permit measures such as bid-offer spread, depth, trading volume or even the Amihud measure of market impact (Kyle’s λ).
• Classic case of “looking for lost keys under the lamp-post rather than where they were lost.”

66
Outline
Liquidity and Asset prices
Research problem
Theoretical model
Data description
Results

77
Microstructure of OTC markets
• Importance of over-the-counter (OTC) markets: Real estate, bond (Treasury and corporate), most new derivative markets etc.
• Microstructure of OTC markets is different from exchange-traded (ET) markets.
• Lack of a centralized trading platform: Trades are result of bilateral negotiations → Trades can take place at different prices at the same time.
• Search costs for investors and inventory costs for broker-dealers (and information asymmetry).
• Challenges of assembling market-wide data.
• Important issues of illiquidity, in crises such as the present credit crisis.

88
Research Questions
• In the presence of search costs for traders and inventory costs for dealers: how are prices determined in an OTC market?
• What determines price dispersion effects, i.e., deviations between the transaction prices and their relevant market-wide valuation?
• How does price dispersion capture illiquidity in such markets?
• How is the “hit rate” – the proportion of transactions within the average quoted bid-ask spread – related to illiquidity?

99
Literature Review
• Price quote determination in a inventory cost setting:– Garbade and Silber (1976, 1979), Garman (1976), Amihud and
Mendelson (1980), Ho and Stoll (1980, 1983)
• Price determination in an asymmetric information setting:– Bagehot (1971), Glosten and Milgrom (1985), Kyle (1985)
• OTC markets:– Garbade and Silber (1976, 1979), Ho and Stoll (1980, 1983),
Duffie et al. (2005, 2007)
• Liquidity effects in Corporate Bond Markets– Edwards et al. (2007), Chen et al. (2007), Mahanti et al. (2008)

1010
Outline
Liquidity and Asset prices
Research problem
Theoretical model
Data description
Results

1111
Market Microstructure Model
• There are i assets, i = 1,2…I, and a continuum of dealers of measure J. j indexes the type of the agent
• Competitive dealers face inventory costs and quote bid and ask prices depending on their desired inventory levels.
• Several investors, who have exogenously given buying and selling needs, trade with the dealers.
• Investors have to directly contact dealers to observe their price quotes (“telephone market”).
• Investors face search costs every time they contact a dealer, before they can trade.

1212
The Dealer’s Decision
• Denote by si,j the inventory of asset i with dealer of type j.
• Each dealer faces inventory holding costs H that are convex in the absolute quantity held, given by H = H(s). Independent across assets.
• The marginal holding cost of adding a unit is approximated by h = H’(s).
• Each trade incurs a marginal transaction cost function fa and fb
• The ask price of asset i quoted by dealer j is denoted as pai,j , the bid
price pbi,j, for one additional unit.
• Since the dealership market is competitive: pai,j = mi,j + fa(h(si,j))
and pbi,j = mi,j – fb(h(si,j)) .
• The market’s expectation of the price of asset i is defined by mi = E(mi,j).

1313
The Investor’s Decision
• An investor wishes to execute a buy-trade of one (infinitesimal) unit.
• The investor has contact with one dealer and is offered an ask price pa,0.
• The investor faces search cost c for contacting an additional dealer; thus, she evaluates the marginal cost and benefit of doing so.
• Garbade and Silber (1976) show that the investor will buy the asset at pa,0 if this price is lower than his reservation price pa*.
• The reservation price solves:
where ga(.) is the density function for the ask price when contacting an arbitrary dealer.
*
0
* )()(ap aa dxxgxpc

1414
Price Dispersion and “Hit Rate”
• Assumption for inventory holding distribution:– Uniformly distributed with mean zero (zero net supply)
– Support from –S to +S
– Independent across assets
• Assumption for the holding costs:
H = αs2/4 → h = αs/2• Assumption for the transaction cost:
h = αS/2
• Solving for the reservation prices for a trader gives:
pa* = m + (2cαs)0.5
pb* = m - (2cαs)0.5
• Ask and bid prices, when contacting a dealer are uniformly distributed with supports [m; m+αs] and [m; m-αs]
15
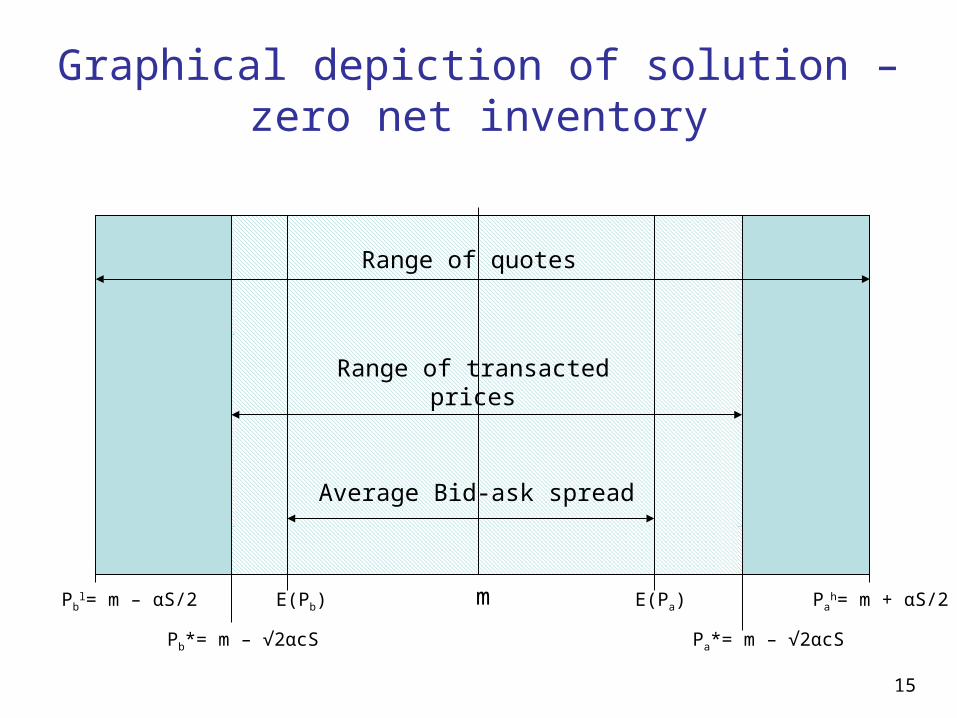
Graphical depiction of solution – zero net inventory
mPbl= m – αS/2 Pa
h= m + αS/2
Pb*= m – √2αcS Pa*= m – √2αcS
Range of quotes
Range of transactedprices
E(Pb) E(Pa)
Average Bid-ask spread

16
Price Dispersion and “Hit Rate”
• Based on this setup, the dispersion of transacted prices pk from the market’s valuation, m, have a mean zero and variance equal to:
• Percentage of trades that fall within the median quote (hit-rate) can be derived:
16
2 if )31(
2 if )32()( 22
2
ScS
ScScmpE k
S/8 c if %100
S/2c S/8 if 2c2
S/2c if %50
SHR

1717
Liquidity Measure
• Based on the model we propose the following new liquidity measure for bond i on day t:
where Ni,t … number of transactions, for bond i on day t
pi,j,t … transaction price for j = 1 to Ni,t, for bond i on day t
Vi,j,t … trade volume j = 1 to Ni,t,for bond i, trade j, on day t
mi,t … market-wide valuation, for bond i on day t
• Intuition behind the measure: Sample estimate of the price dispersion using all trades within a day.
t,j,i
N
1j
2t,it,j,iN
1j t,j,i
t,i V )mp(V
1d t ,i
t ,i

1818
Liquidity Measure
• Represents the root mean squared difference between the traded prices and the respective market-wide valuation.
• Is an estimate for the absolute deviation and, more importantly, has the interpretation as the volatility of the price dispersion distribution.
• Volume-weighting assumes that price dispersion is revealed more reliably in larger trades and eliminates potential erratic prices of particularly small trades.

1919
Outline
Liquidity and Asset prices
Research problem
Theoretical model
Data description
Results

2020
Data for the Present Study
• Time period: October 2004 to October 2006
• US bond market data from three sources:– TRACE: all transaction prices and volumes– Markit: average market-wide valuation each trading day– Bloomberg: closing bid/ask quotes at the end of each trading
day– Bloomberg: bond characteristics
→ 1,800 bonds with 3,889,017 transactions:• Dollar denominated• Fixed coupon or floating rate• Bullet or callable repayment structure• Issue rating from Standard & Poor’s, Moody’s or Fitch• Traded on at least 20 days in the selected time period

2121
Data for the Present Study
• Selected bonds represent:– 7.98% of all US corporate bonds– 25.31% (i.e., $1.308 trillion) of the total amount outstanding– 37.12% of the total trading volume
• Available bond characteristics:– Coupon, maturity, age, amount issued, issue rating, and industry
• Available trading activity variables:– trade volume, number of trades, bid-ask spread and depth (i.e.,
number of major dealers providing information to Markit)

2222
Data for the Present Study
• Distribution of bonds across Bloomberg industry categories:
BANK FINANCIAL INDUSTRIAL TRANS - NON RAIL UTILITY - ELEC
Industry
Nu
mb
er
of B
on
ds
02
00
40
06
00
80
0
Bank Gas Transm Telephone Trans Rail Utility-Gas Financial Industrial Trans-Non Rail Utility-Elec Industry
Nu
mb
er o
f B
on
ds

2323
Data for the Present Study
• Distribution of bonds across ratings:
AAA AA A BBB BB B C/CCC
01
00
20
03
00
40
05
00
Rating Grade
Nu
mb
er o
f B
on
ds

2424
Data for the Present Study
• Distribution of other variables:
Min Median Max _
Coupon 1.95% 6.125% 11.25%
Maturity 0.07 4.80 31.61
Age 0.04 3.34 16.23
Amount Issued $100m $500m $6.5b
Bid-Ask 1.55bp 32.17bp 90bp
Trade Volume $127,925 $2.8m $61.3m
Trades 1.21 4.14 121.6
Depth 3 4.62 12.86

2525
Data for the Present Study
• Trading frequencies:
Days per year 10/2004 to 10/2005 10/2005 to 10/2006
> 200 411 392
151 – 200 309 369
101 – 150 236 322
51 – 100 221 222
≤ 50 444 459 _
Total # bonds 1621 1704

2626
Outline
Liquidity and Asset prices
Research problem
Theoretical model
Data description
Results

2727
Empirical Results – Market Level Analysis
• Volume-weighted average difference between TRACE prices and respective Markit quotations is 4.88 bp with a standard deviation of 71.85 bp → no economically significant bias.
• Price dispersion measure (i.e. root mean squared difference) is 49.94 bp with a standard deviation of 63.36 bp.
• Market-wide average bid-ask spread is only 35.90 bp with a standard deviation of 23.73 bp.
• Overall, we find significant differences between TRACE prices and Markit composite that cannot be simply explained by bid-ask spreads or trade time effects.

2828
Empirical Results – Bond Level Analysis
• At the individual bond level, we relate our liquidity measure to bond characteristics and trading activity variables to show its relation to liquidity.
• We employ cross-sectional linear regressions using time-weighted averages of all variables.
• We present results based on the whole time period, as well as based on each available quarter (2004 Q4 to 2006 Q3).
• To further validate the results, we analyze the explanatory power of our liquidity measure in predicting established estimators of liquidity → Amihud ILLIQ measure.
2929
Empirical Results – Bond Level Analysis
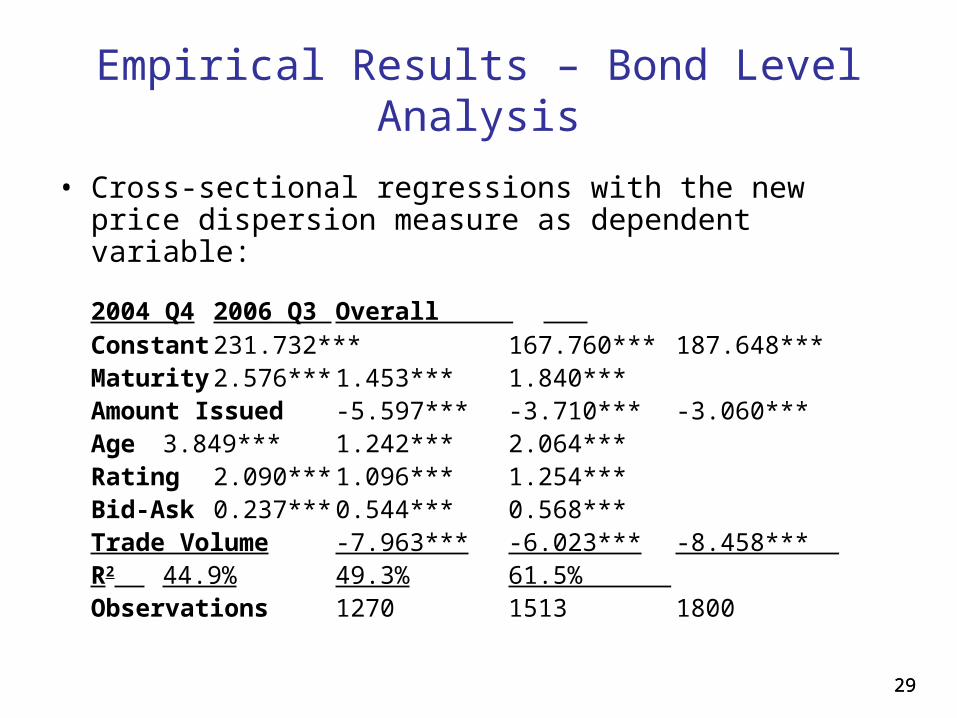
• Cross-sectional regressions with the new price dispersion measure as dependent variable:
2004 Q4 2006 Q3 Overall __ Constant 231.732*** 167.760*** 187.648***Maturity 2.576*** 1.453*** 1.840***Amount Issued -5.597*** -3.710*** -3.060***Age 3.849*** 1.242*** 2.064***Rating 2.090*** 1.096*** 1.254***Bid-Ask 0.237*** 0.544*** 0.568***Trade Volume -7.963*** -6.023*** -8.458*** _R2 44.9% 49.3% 61.5% _Observations 1270 1513 1800

3030
Empirical Results – Bond Level Analysis: Maturity
3131
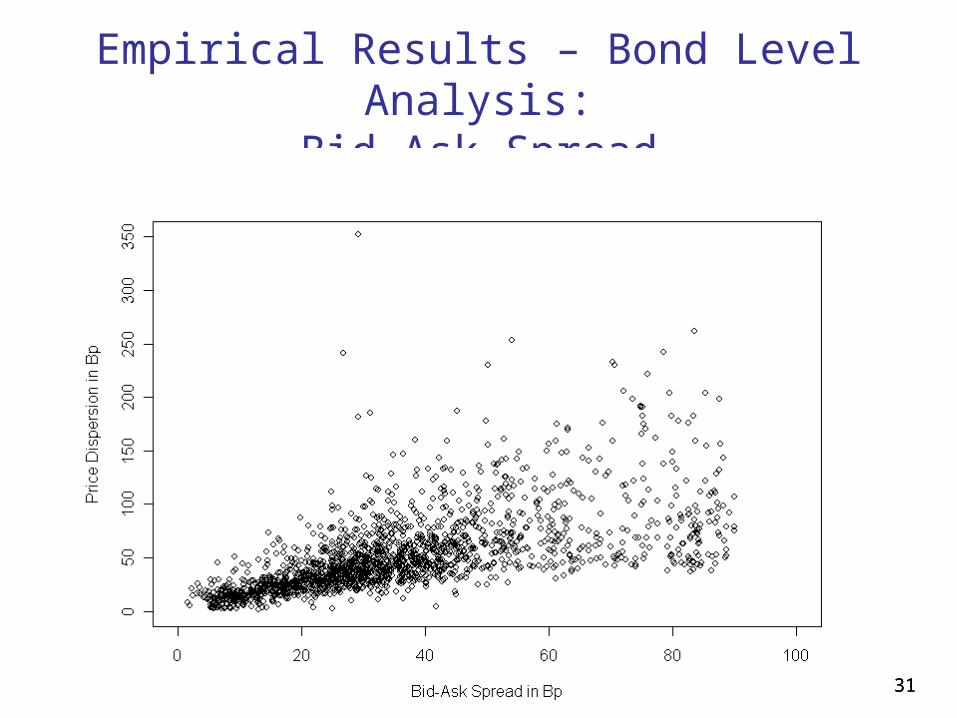
Empirical Results – Bond Level Analysis:Bid-Ask Spread

3232
Empirical Results – Bond Level Analysis :Trade Volume

3333
Empirical Results – Bond Level Analysis :Age

3434
Empirical Results – Bond Level Analysis :Rating Grade

3535
Empirical Results – Bond Level Analysis:Amount Issued

3636
Empirical Results – Bond Level Analysis
• To validate these results, we compare the new measure to established estimators of liquidity in the literature.
• One important approach to measure liquidity is through the price impact of trading.
• A popular (and intuitive) measure was introduced by Amihud:
where ri,t … return on the bond i on day t
Vi,t ... trade volume of the bond i on day t
T
tti
ti
V
r
Ti
1,
,1 bondfor measure ILLIQ Amihud
3737
Empirical Results – Bond Level Analysis
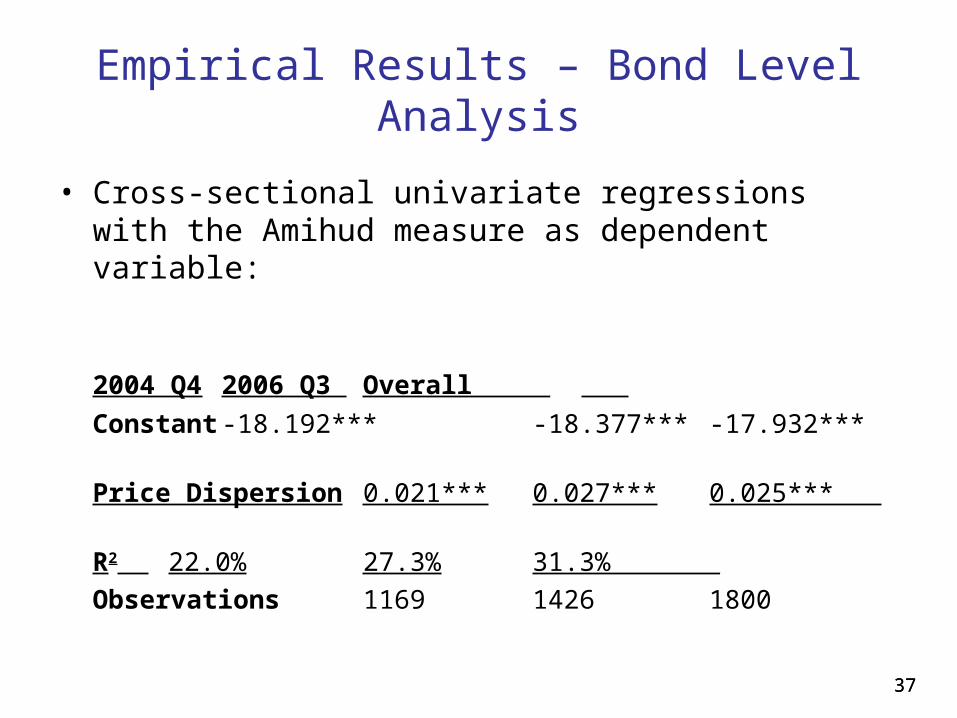
• Cross-sectional univariate regressions with the Amihud measure as dependent variable:
2004 Q4 2006 Q3 Overall __
Constant -18.192*** -18.377*** -17.932***
Price Dispersion 0.021*** 0.027*** 0.025*** _
R2 22.0% 27.3% 31.3% __
Observations 1169 1426 1800

3838
Empirical Results – Bond Level Analysis
• Cross-sectional multivariate regressions with the Amihud measure as dependent variable:
2004 Q4 2006 Q3 Overall Overall 2__
Constant -10.033*** -8.464*** -7.624*** 0.177
Price Dispersion 0.015*** 0.021*** 0.018*** -
Coupon 0.190*** 0.198*** 0.186*** 0.296***
Amount Issued -0.156* -0.226*** -0.275*** -0.583***
Trades -0.049*** -0.059*** -0.067*** -0.050***
Trade Volume -0.366*** -0.375*** -0.336*** -0.436*** _
R2 42.5% 59.2% 63.7% 52.8% _
Observations 1169 1426 1800 1800
3939
Empirical Results – Hit Rate Analysis
• Many studies use bid-ask quotations (or mid quotes) as proxies for traded prices. Our data set allows us to validate this assumption.
• The hit-rate for the TRACE price is 51.37% (i.e., in these cases, the traded price lies within the bid and ask quotation)
• Deviations are symmetric → 50.12% are lower than the bid and 49.88% are higher than the ask.
• Even the hit rate of the Markit quotation (58.59%) is quite low.
• Overall, we find that deviations of traded prices from bid-ask quotations are far more frequent than assumed by most studies.

4040
Future Research
• The proposed liquidity measure can potentially be used to explain the liquidity premia in the corporate bond market.
• The time-series properties of the measure can be explored and potentially used to forecast “true” bond returns.
• We can explore whether observed changes in search costs or inventory costs (e.g. when a shock reduces dealers capital) affect the price dispersion.
• With additional data, we can study the behavior of our liquidity measure in crisis periods such as post-July 2007.

4141
Conclusions
• A new liquidity measure based on price dispersion effects is derived from a market microstructure model.
• The proposed measure is quantified in the context of the US corporate bond market.
• It is larger and more volatile than bid-ask spreads and shows a strong relation to bond characteristics and trading activity variables, as well as established liquidity proxies.
• A “hit-rate” analysis shows that bid-ask spreads can only be seen as a rough approximation of liquidity costs.
• The proposed measure can potentially explain and quantify the liquidity premia.
• These findings foster a better understanding of OTC markets and are relevant for many practical applications, e.g. bond pricing, risk management, and financial market regulation.