1.1-tobe scanned.txt 1.1 source test reports i to be ... · prelim1 nary final report september,...
TRANSCRIPT

1.1-tobe scanned.txt 1.1 Source test reports I to be scanned, not cited in AP-42
Field Test of Industrial Stoker Coal-Fired Boilers for Emissions Control and Efficiency Improvement Site E Preliminary Final Report, September 1979
by P.L. Langsjoen, J.O. Burlingame, J.E. Gabrielson KVB Inc Minneapolis, MN
EPA PO: Robert E. Hall
Page 1
FIELD TESTS OF INDUSTRIAL STOKER
CONTROL AND EFFICIENCY IMPROVEMENT COAL-FIRED BOILERS FOR EMISSIONS
SITE E
PRELIM1 NARY FINAL REPORT SEPTEMBER, 1979
P. L. L a n g s j o e n , J. 0. B u r l i n g a m e , and J. E . G a b r i e l s o n
KVB, INC.
6176 O l s o n M e m o r i a l Highway Minneapolis, Minnesota 5 5 4 2 2
I A G / C o n t r a c t Nos. IAG-D7-E681 (EPA) , EF-77-C-01-2609 (DOE) EPA Program E l e m e n t N o . EHE624
Project O f f i c e r s : R o b e r t E . H a l l (EPA) a n d W i l l i a m T . Harvey, Jr. (DOE)
I n d u s t r i a l E n v i r o n m e n t a l Research L a b o r a t o r y
Research T r i a n g l e P a r k , N.C. 2 7 7 1 1 O f f i c e of E n e r g y , Minerals , and I n d u s t r y
Z r e p a r e d f o r :
I
U . S . ENVIRONMENTAL PROTECTION AGENCY O f f i c e of R e s e a r c h and D e v e l o p m e n t
Washington, D. C . 2 0 4 6 0
U .S . DEPARTMENT OF ENERGY
Washington, D. C . 20545 D i v i s i o n of Fossi l Fuel U t i l i z a t i o n
and
AMERICAN BOILER MANUFACTURERS ASSOCIATION 1500 Wilson B o u l e v a r d A r l i n g t o n , VA 2 2 2 0 9
I' I I I I I I I I I I I I I I I I I "I
ACKNOWLEDGEMENTS
1 , The authors wish to express t h e i r appreciat ion f o r t h e ass i s tance
and d i r ec t ion given t h e program by p r o j e c t monitors W . T. ( B i l l ) Harvey of
the United S t a t e s Department of Energy (WE) and R. E. (Bob) Hal l of the
United S t a t e s Environmental Pro tec t ion Agency (EPA) . t h e i r agencies, WE and EPA, f o r co-funding the program.
Thanks are due t o
We would a l s o l i k e t o thank the American Boi le r Manufacturers
Association, ABM?+ Executive Director , W . H . ( B i l l ) Axtman, ABMA'S Pro jec t
Manager, B. C. (Ben) Severs, and t h e members of the ABMA Stoker Technical
Committee chaired by W. B. (Willard) McBurney of the McBurney Corporation f o r
providing support through t h e i r time and t r a v e l t o manage and review the program.
The pa r t i c ipa t ing conunittee members l i s t e d a lphabet ica l ly a r e as follows:
R. D. Bessette T. Davis J. Dragos T. G . Healey N. H . Johnson K. Luuri D. McCoy J. Mullan E . A. Nelson E. P o i t r a s s P. E . Ralston D. C. Reschley R. A . Santos
I s l and C r e e k Coal Company Combustion Engineering Consolidation Coal Peabody Coal De t ro i t Stoker Riley Stoker E . Keeler Company National Coal Association Zurn Indus t r i e s The McBurney Corporation Babcock and Wilcox Det ro i t Stoker Zurn Indus t r i e s
W e would a l s o l i k e t o recognize the KVB engineers and technicians who
spent much t i m e i n the f i e l d , o f t en under adverse condi t ions, t e s t i n g the b o i l e r s
and gathering da ta f o r t h i s program.
Burl ingam, Russ Parker, Mike Jackson, and J i m Demont.
F ina l ly , our gra t i t ude goes t o the hos t b o i l e r f a c i l i t i e s which in -
v i t ed us t o test t h e i r b o i l e r . A t t h e i r request , the f a c i l i t i e s w i l l remain
anonymous to p ro tec t t h e i r own i n t e r e s t s .
ass i s tance t h i s program would not have been poss ib le .
Those involved a t S i t e E w e r e J i m
Without t h e i r cooperation and
ii

TABLE OF CONTENTS
Page - Sect ion
ACKNOWLEDGEMENTS . . . . . . . . . . . . . . . . . . . . . . . ii LIST OF FIGURES . . . . . . . . . . . . . . . . . . . . . . . V
LIST OF TABLES . . . . . . . . . . . . . . . . . . . . . . . v i
1.0 INTRODUCTION . . . . . . . . . . . . . . . . . . . . . . . . . 1
2.0 EXECUTIVE SUMMARY . . . . . . . . . . . . . . . . . . . . . . 3
3.0 DESCRIPTION OF FACILITY TESTED AND COALS FIRED . . . . . . . . 3.1 Boi le r E Description . . . . . . . . . . . . . . . . . . 3.2 Overf i re A i r System . . . . . . . . . . . . . . . . . . . 3.3 P a r t i c u l a t e Col lect ion Equipment . . . . . . . . . . . . 3,4 T e s t Po r t Locations . . . . . . . . . . . . . . . . . . . 3.5 Coals Ut i l ized . . . . . . . . . . . . . . . . . . . . .
4.0 TEST EQUIPMENT AND PROCEDURES . . . . . . . . . . . . . . . . 4 . 1
4 . 2 4.3 4.4 4.5 4.6 4 .7 4 .8
Gaseous Emissions Measurements (NOx, CO, c02, 02, HC) . . 4.1 .1 Analyt ical Instruments and Related Equipment . . . 4.1.2 Recording Instruments . . . . . . . . . . . . . . 4.1.3 Gas Sampling and Conditioning System . . . . . . . 4.1.4 Gaseous Emiss ion Sampling Techniques . . . . . . . Sulfur Oxides (SOX) Measurement and Procedures . . . . . P a r t i c u l a t e Measurement and Procedures . . . . . . . . . P a r t i c l e S ize Dis t r ibu t ion Measurement and Procedures . . C o a l Sampling and Analysis Procedure . . . . . . . . . . Ash Collect ion and Analysis f o r Combustibles . . . . . . Boi l e r Eff ic iency Evaluation . . . . . . . . . . . . . . Trace Species Measurement . . . . . . . . . . . . . . . .
5.0 TEST RESULTS AND OBSERVATIONS . . . . . . . . . . . . . . . . 5.1 Overfire Air . . . . . . . . . . . . . . . . . . . . . .
5.1.1 Overfire A i r Flow R a t e Measurements . . . . . . . 5.1.2 Pa r t i cu la t e Loading vs Overf i re A i r . . . . . . . 5.1.3 N i t r i c Oxide vs Overf i re A i r . . . . . . . . . . . 5.1.4 Boi le r Eff ic iency vs Overf i re A i r . . . . . . . .
5.2 Excess Oxygen and Grate Heat Release . . . . . . . . . . 5.2.1 Excess Oxygen Operating Levels . . . . . . . . . . 5.2.2 Pa r t i cu la t e Loading vs Oxygen and Grate Heat
Release . . . . . . . . . . . . . . . . . . . . 5.2.3 Stack Opacity vs Oxygen and Grate Heat Release . . 5.2.4 N i t r i c Oxide vs Oxygen and Grate Heat Release ' . . 5.2.5 Carbon Monoxide vs Oxygen and Grate Heat Release . 5.2.6 Combustibles vs Oxygen and Grate Heat Release . . 5.2.7 Bo i l e r Eff ic iency vs Oxygen and Grate Heat Release
9
9 9
13 1 3 13
1 7
1 7 1 7 2 1 2 1 2 1 23 25 27 28 30 31 31
35
35 35 37 4 1 41 44 44
46 48 50 54 64 64
iii
I I I I I I I I I I I I I I I I I I I

!I I I I I I I I I I I I I I I ’ I I I ‘1
TABLE OF CONTENTS (Continued)
Section Page - 5.3 Coal Proper t ies . . . . . . . . . . . . . . . . . . . . . 65
5.3.1 Chemical Composition of the Coals . . . . . . . 67 5.3.2 Coal Size Consistency . . . . . . . . . . . . . 72 5.3.3 Sulfur Balance . . . . . . . . . . . . . . . . . 77
5.4 P a r t i c l e S ize Dis t r ibu t ion of Flyash . . . . . . . . . %77 5.5 Efficiency of Multiclone Dust Col lector . . . . . . . . 83 5.6 Source Assessment Sampling System . . . . . . . . . . . 83
APPENDICES 91 . . . . . . . . . . . . . . . . . . . . . . . .
iv

Figure No.
3- 1 3- 2
4-1 4- 2 4- 3 4-4 4- 5 4- 6
5- 1 5-2
5-3 5- 4 5-5 5- 6 5- 7 5-8 5-9 5-10 5-11 5-12 5-13
5-14 5-15 5-16 5-17 5-18 5-19
5-20
5-21
5-22
5-23
5-24
LIST OF FIGURES
Page
Boi l e r E Schematic . . . . . . . . . . . . . . . . . . . . . . 12 Boi l e r E Sampling Plane Geometry . . . . . . . . . . . . . . . 14
SOX Sample Probe Construction . . . . . . . . . . . . . . . . 24 Sul fu r Oxides Sampling Train (Shell-Emeryville) . . . . . . . 24 EPA Method 5 P a r t i c u l a t e Sampling Train . . . . . . . . . . . 26 B r i n k Cascade Impactor Sampling Train Schematic . . . . . . . 29
Flow Schematic of Mobile Flue Gas Monitoring Laboratory . . . 22
Source Assessment Sampling System (SASS) Flow Diagram . . . . 32 Pressure Flow Relationship, Overf i re A i r System . . . . . . .
of Overf i re A i r Conditions . . . . . . . . . . . . . . . . . Oxygen vs Grate Heat &lease Bo i l e r Out P a r t . vs Grate Heat Release . . . . . . . . . . . . Multiclone Out Part. vs Grate Heat Release . . . . . . . . . . Stack Opacity vs Grate Heat Release . . . . . . . . . . . . . Stack Opacity vs Multiclone Out P a r t N i t r i c Oxide vs Grate Heat Release . . . . . . . . . . . . . . N i t r i c Oxide vs Oxygen . . . . . . . . . . . . . . . . . . . . N i t r i c Oxide vs Oxygen . . . . . . . . . . . . . . . . . . . . N i t r i c Oxide vs Oxygen . . . . . . . . . . . . . . . . . . . . N i t r i c Oxide vs Oxygen . . . . . . . . . . . . . . . . . . . .
P a r t i c u l a t e Loading Breakdown f o r Kentucky Coal as a Function
. . . . . . . . . . . . . . . . .
. . . . . . . . . . . . .
Trend i n N i t r i c Oxide Emissions a s a Function of Grate Heat Release (GHR) and Oxygen . . . . . . . . . . . . . . . . . .
Carbon Monoxide vs Grate Heat Release . . . . . . . . . . . . Carbon Monoxide vs Oxygen . . . . . . . . . . . . . . . . . . Boi l e r Out Comb vs Grate Heat Release . . . . . . . . . . . . Bottom Ash Comb vs Grate Heat Release . . . . . . . . . . . . Boi le r Ef f ic iency vs Grate Heat Release . . . . . . . . . . . Size Consistency of "As Fired" Kentucky Coal vs ABMA
Recommended Sizing fo r Spreader Stokers . . . . . . . . . . Size Consistency of "As Fired" Crushed Kentucky Coal vs ABMA
Recommended Siz ing fo r Spreader Stokers . . . . . . . . . . Size Consistency of "AS Fired" Eas te rn Kentucky Coal vs ABMA
Recommended Sizing for Spreader Stokers . . . . . . . . . . P a r t i c l e Size Dis t r ibu t ion a t t he Economizer o u t l e t from
Brink Cascade Impactor T e s t s . . . . . . . . . . . . . . . . P a r t i c l e Size Dis t r ibu t ion a t t he Boi le r Ou t l e t from SASS
CycloneTes ts . . . . . . . . . . . . . . . . . . . . . . . Multiclone Eff vs Grate Heat Release . . . . . . . . . . . . .
V
38
39 45 47 49 51 52 53 55 56 57 58
59 60 61 62 63 66
74
75
76
81
82 85
I I I I I I I I I I I I I I I I I I I

I I I I I I I I I I I 1 I I I I I ‘I ‘I
Table No . 2- 1
3-1 3-2 3- 3
5- 1 5-2
5- 3 5- 4 5-5 5-6 5- 7 5-8 5-9 5-10 5-11 5-12 5-13 5-14 5-15 5-16 5-17 5-18
-
5-19 5-20 5-21 5-22
LIST OF TABLES
Emission Data Summary . . . . . . . . . . . . . . . . . . . . 8
DesignData . . . . . . . . . . . . . . . . . . . . . . . . . 10 Predicted Performance . . . . . . . . . . . . . . . . . . . . 11 Average Coal Analysis . . . . . . . . . . . . . . . . . . . . 15
Overfire A i r Flow Rates . . . . . . . . . . . . . . . . . . . 36 Ef fec t of Overfire Air on Emissions and Eff ic iency. Kentucky
C o a l . . . . . . . . . . . . . . . . . . . . . . . . . . . 40 N i t r i c Oxide E m i s s i o n s vs Overfire A i r . . . . . . . . . . . 42 Combustibles i n Flyash vs Overf i re A i r . . . . . . . . . . . 43 Ash Carryover vs Coal Type . . . . . . . . . . . . . . . . . 48 Average Heat Losses by C o a l Type . . . . . . . . . . . . . . 65 Coal Proper t ies Corrected to a Constant 106Btu B a s i s . . . . 67 Fuel Analysis - Kentucky Coal . . . . . . . . . . . . . . . . 68 Fuel Analysis - Crushed Kentucky Coal . . . . . . . . . . . . 69 Fuel Analysis - Eastern Kentucky Coal . . . . . . . . . . . . 70 Mineral Analysis of C o a l Ash . . . . . . . . . . . . . . . . 71 Relationship Between Coals F i r ed and Emissions . . . . . . . 72 A s Fired Coal Size Consistency . . . . . . . . . . . . . . . 73 Sulfur Balance . . . . . . . . . . . . . . . . . . . . . . . 78 Description of P a r t i c l e S ize Dis t r ibu t ion Tests . . . . . . . 79 Results of P a r t i c l e Size Di s t r ibu t ion Tests . . . . . . . . . 80 Eff ic iency of Multiclone Dust Col lec tor . . . . . . . . . . . 84 Polynuclear Aromatic Hydrocarbons Sought i n the S i t e E
SASSsamples . . . . . . . . . . . . . . . . . . . . . . . 86 Pa r t i cu la t e Emissions . . . . . . . . . . . . . . . . . . . . 87 Heat Losses and Ef f i c i enc ie s . . . . . . . . . . . . . . . . 88 Sununary of Percent Combustibles i n R e f u s e . . . . . . . . . . 89 Steam Flows and Heat Release R a t e s . . . . . . . . . . . . . 90
v i

I I I I I I 'I I I I I I I I I I I I 'I
- I . . .. . , .
The p r i n c i p a l ob jec t ive of the test program described i n t h i s r epor t ,
one of seve ra l r epor t s i n a series, i s t o produce information which w i l l i n -
cease the a b i l i t y of b o i l e r manufacturers to design and f ab r i ca t e s toke r b o i l e r s
t h a t are &I economical and environmentally s a t i s f a c t o r y a l t e r n a t i v e t o O i l -
f i r e d wits. Further ob jec t ives of the program are to :
operators concerning the e f f i c i e n t opera t ion of t h e i r b o i l e r s ; provide a s s i s -
'tafl* tb s toke r b o i l e r opera tors i n planning t h e i r coa l supply con t r ac t s ;
& f i n s Bpplicat ion of e x i s t i n g po l lu t ion con t ro l equipment with s p e c i a l emphasis
on p5r%ofmancer and eon t r ibu te 'to the design of new po l lu t ion con t ro l equipment.
.. provide information t o s toke r b o i l e r
f n ;order ' to meet these ob jec t ives , it is necessary t o def ine s toke r
.boIpe? ?lesigris .which w i l l provide e f f i c i e n t opera t ion and minimum gaseous and
part-iCui;ate ,emisskons, and def ine what those emissions are i n order t o f a c i l i -
t a t e .preparatkon ,OF a t t a inab le na t iona l emission s tandards f o r i n d u s t r i a l s ize ,
cOa:l-'fire'i3 :boi lers .
.mea%eed .as a 'Sunction of coa l ana lys i s and s i z i n g , rate of f lyash r e i n j e c t i o n ,
ove.rf.ire a&ssLon, .ash handling, g ra t e s i z e , and o t h e r va r i ab le s f o r d i f f e r e n t
'Ijoi-ler, -furnace, .and s toke r designs.
- - - . .. , .
T o do t h i s , b o i l e r emissions and ef f ic iency must be ..
:A ' f ierd tes't .program designed to address the objec t ives ou t l ined above
. w a s .awarded . to ':the 'Anerican Boiler Manufacturers Association (ABMA) , sponsored
:by -&e (United'States Tepar tnent of Energy (DOE) under con t r ac t number
.EF-77-C-Ol-2609, ;and co-sponsored by the United S t a t e s Environmental Pro tec t ion
'Agentq '(EPA) .under .inter-agency agreement number IAG-D7-E681. Ihe program is
'di:recfea:by an .ABMA :Stoker Technical Committee which, i n tu rn , has subcontracted
'the cC<e~la ' test:por. t ion 'to :KVB, Inc . , of Minneapolis, Minnesota.
. .. .
..~. -This Weport !is 'the -F ina l 'Technical Report f o r the fourth of eleven
-IjoiIefi 'to'be *tested under the ABMA program. I t contains a descr ip t ion of the
faci-lLty':te'stea, the coals . f i r e d , the test equipment and procedures, and the
-resul:ts"and'observat.ions of t e s t i n g . There i s a l s o a da ta supplement t o t h i s
L r e p 0 j d r . t Containhg:.the"'raw" da ta shee ts from the tests conducted. The da ta
KVB 15900-531
1
supplemnt has the s a m EPA r epor t number a s this repor t except t h a t i t is
followed by "b" r a t h e r than "a". A s a compilation of a l l data obtained a t
t h i s test site, the supplement a c t s as a research too l f o r fu r the r data
reduct ion and ana lys i s a s new areas of i n t e r e s t a re uncovered i n subsequent
t e s t i n g .
A t the completion of t h i s program, a F ina l Technical Report w i l l com-
bine and c o r r e l a t e the t e s t r e s u l t s from a l l s i t e s t e s t ed . This f i n a l r epor t
w i l l provide the technica l b a s i s f o r t he ABMA publ ica t ion on "Design and
Operating Guide l ines f o r I n d u s t r i a l Stoker F i r i n g , " and w i l l be ava i lab le
t o i n t e r e s t e d p a r t i e s through the ABMA, EPA, or DOE.
t r ace species data w i l l also be wr i t t en a t t he completion of t h i s program.
It , too, w i l l be ava i l ab le t o i n t e r e s t e d p a r t i e s through the ABMA, EPA, or
DOE.
A separate r epor t Covering
Although it is EPA policy t o use S . I . u n i t s ;in a l l EPA sponsored
r epor t s , an exception has been made here in because E n g l i s h u n i t s have been
conventionally .used t o descr ibe b o i l e r ' design and operat ion. Conversion
t ab le s a re provided i n the Appendix f o r those who p r e f e r S . I . units.
To p r o t e c t the i n t e r e s t of the hos t b o i l e r f a c i l i t i e s , each t e s t
s i t e i n t h i s program has been given a l e t t e r designat ion. As the f i f t h
S i t e tes ted , t h i s i s the F i n a l Technical Report f o r Test S i t e E under the
program e n t i t l e d "A Testing Program t o Update Equipment Spec i f ica t ions and
Design C r i t e r i a f o r Stoker F i red Boi le rs . "
KVB 15900-531
-
I I I I I I I I I I I I I 1 I I I I I

I I I I I I I I I 1 I I I I I I I I I
. .
2.0 EXECUTIVE SUMMARY
A spreader s t o k e r r a t e d a t 180,000 lbs s teamhour w a s t e s t e d for
emissions and e f f i c i ency between November 15, 1978, and January 19, 1979.
?his s toke r w a s unique i n t h a t it had been recent ly r e t r o f i t t e d t o use p a i n t
oven exhaust gases as combustion air.
between 14.5 and 20.5% oxygen.
steaming capacity.
run was i n the range 110-125 thousand pounds of steam per hour. This represents
a 30% reduct ion i n design capaci ty .
The p a i n t oven exhaust gases contained
A s i d e e f f e c t of t h i s r e t r o f i t w a s a reduced
Maximum obtainable load during the per iod these tests were
All b u t t h ree of t h e tests run on t h i s b o i l e r used the p a i n t oven
exhaust gases as combustion a i r . The th ree t e s t s run on ambient a i r r e s u l t e d
i n s i m i l a r emission l e v e l s and b o i l e r e f f i c i e n c i e s t o those run on p a i n t oven
exhaust gases.
with ident i fy ing symbols.
The ambient a i r t e s t s are indica ted on a l l p l o t s i n t h i s r epor t
Unfortunately, t h e t e s t plan for T e s t S i t e E w a s no t completed due t o
the unant ic ipated b o i l e r loading l i m i t a t i o n s and the d i f f i c u l t y i n ob ta in ing
ambient a i r test da ta .
completed a t T e s t S i t e E, and provides references t o supporting f igu res , tables
and commentary found i n t h e main t e x t of t h i s r epor t .
This s e c t i o n summarizes the -of those tests
UNIT TESTED: Described i n Sec t ion 3.0, pages 9-13.
0 Riley Boiler
B u i l t 1973 Type VOSP 180,000 lb /hr r a t e d capaci ty 175 p s i g opera t ing steam pressure 427OF steam leaving superheater Economizer
0 Riley Spreader Stoker
Four overthrowing type feeders Traveling g r a t e with f r o n t ash discharge Flyash r e i n j e c t i o n from b o i l e r hopper only 'Two rows OFA je ts on r e a r wal l One row OFA je ts and one row underfeeder a i r jets on f r o n t w a l l
KVB 15900-531
3
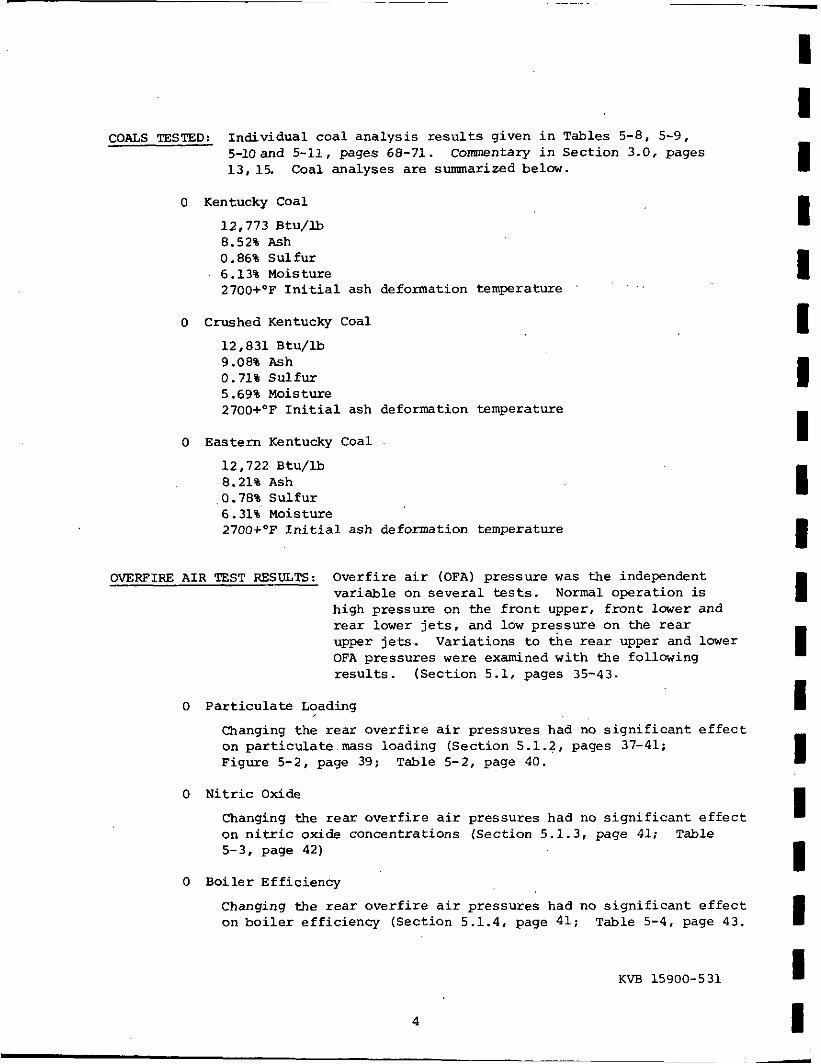
COALS TESTED: Individual coa l ana lys i s r e s u l t s given i n T a b l e s 5 - 8 , 5-9, 5-10and 5-11, pages 68-71. Commentary i n Sect ion 3.0, pages 13, 15. Coal analyses are s m a r i z e d below.
0 Kentucky Coal
12,773 B t U / l b 8.52% Ash 0.86% Sul fur 6.13% Moisture 2700+OF I n i t i a l ash deformation temperature
0 Crushed Kentucky Coal
12,831 Btu/lb 9.08% Ash 0.71% Su l fu r 5.69% Moisture 270O+'F I n i t i a l ash deformation temperature
0 Eastern Kentucky Coal
12,722 Btu / lb 8.21% Ash 0.78% Su l fu r 6.31% Moisture 270OcOF I n i t i a l ash deformation temperature
OVERFIRE AIR "EST RESULTS: Overfire a i r (OFA) pressure was the independent variable on seve ra l tests. Normal operat ion is high pressure on the f r o n t upper, f r o n t lower and r e a r lower j e t s , and l o w pressure on the r e a r upper jets. OFA pressures were examined with the following r e s u l t s . (Sect ion 5.1, pages 35-43.
Variat ions t o the r e a r upper and lower
0 P a r t i c u l a t e Loading
Changing the rear o v e r f i r e a i r pressures had no s i g n i f i c a n t e f f e c t on particulate mass loading (Sect ion 5.1.2, pages 37-41; Figure 5-2, page 39; T a b l e 5-2, page 40.
0 N i t r i c Oxide
Changing the r e a r o v e r f i r e a i r pressures had no s i g n i f i c a n t e f f e c t on n i t r i c oxide concentrations (Section 5.1.3, page 41; Tab le 5-3, page 42)
0 Boi le r Eff ic iency
Changing the r e a r ove r f i r e a i r pressures had no s i g n i f i c a n t e f f e c t on b o i l e r e f f ic iency (Section 5.1.4, page 41 ; T a b l e 5-4, page 43.
KVB 15900-531
4
I I I I I I I I I I I I I I I I I I I

I I I I I I I 1 I I I I I I I 1 I I I
BOILER EMISSION PROFILES: B o i l e r emissions were measured over the load range 46-73% of design capacity which corresponds t o a g ra t e h e a t release range of 274.060 t o 604,000 Btu/hr-f t2 . 3.9-10.0%. The range of values and t rends of the various emissions a re summarized below (Section 5.2, pages 44-65.
Measured oxygen l eve l s ranged from
0 Excess Oxygen Operating Levels
The excess oxygen opera t ing level w a s wi thin the normal range f o r a spreader s toker . A t 70% of design capacity the un i t success- f u l l y operated a t 5.9% 02. 3.9% O2 bu t the r e s u l t i n g p a r t i c u l a t e loading and opaci ty were excessive. The design excess a i r on t h i s u n i t i s 30%, o r 5.3% 0 2 . The da ta ind ica t e s t h a t this level could be e a s i l y met a t design capacity. (Section 5.2.1, pages 44-46, Figure 5-3, page 45)
I n one test t h e u n i t w a s operated at
0 P a r t i c u l a t e Loading
Boi le r o u t l e t and d u s t c o l l e c t o r o u t l e t p a r t i c u l a t e loadings both showed an increasing t rend with increasing g r a t e h e a t re lease . A t high loads, above 500x103Btu/hr-ft2, b o i l e r o u t l e t p a r t i c u l a t e loadings averaged 5.5120.66 lb/106Btu, and dus t co l l ec to r o u t l e t p a r t i c u l a t e loadings averaged 1.9021.49. Reducing the excess a i r t o 3.9% 0 re su l t ed i n excessively high p a r t i c u l a t e loadings of
co l l ec to r o u t l e t . (Sect ion 5.2.2, pages 46-48, Figure 5-4, page 47)
6.5 U/10 2 Btu a t the b o i l e r o u t l e t and 3.8 1b/lO6Btu a t the dus t
0 Stack Opacity
Stack opaci ty w a s measured with a transmissometer which was n o t checked for ca l ib ra t ion . Opacity readings ranged from 1 7 t o 55%. Opacity showed no t rend with g ra t e hea t r e l ease bu t d id co r re l a t e with dus t co l l ec to r o u t l e t p a r t i c u l a t e loading. (Section 5.2.3, pages 48-50; Figures 5-6, 5-7, pages 51, 52.)
0 N i t r i c Oxide
A t high loads, above 500x10%tu/hr-ft2, n i t r i c oxide (NO) averaged 0.533'0.047 lbs/lO%tu and increased w i t h increasing oxygen a t a rate of 0.037 1bs/lO6Btu increase i n NO f o r each one percent increase i n 02. There i s some evidence t h a t the p a i n t oven exhaust gases produced higher NO l eve l s than ambien t air did. (Sect ion 5.2.4, pages 50-54; Figures 5-8 through 5-13, pages 53, 55-59.)
0 Carbon Monoxide
Limited da ta shows t h a t carbon monoxide (CO) concentrations were a t i n s i g n i f i c a n t levels of less than 150 ppm (0.015%). The da ta shows a decreasing t rend i n CO with increasing g ra t e hea t re lease . CO da ta w a s i n s u f f i c i e n t t o e s t a b l i s h any t rend with oxygen. (Section 5.2.5, pages 54-61; Figures 5-14, 5-15, pages 60-62.)
5 KVB 15900-531

. ! 0 Combustibles i n Ash . I .
Combustibles i n the b o i l e r o u t l e t f l yash averaged 66% by weight and accounted f o r an average 4.4% h e a t l o s s . They showed an increas ing t rend wi th inc reas ing g r a t e hea t r e l ease and were not a f f ec t ed by the change i n combustion air .cornposit ion. Com- b u s t i b l e s i n the bottom ash averaged t e n percent by weight and accounted f o r an average 0.87% h e a t loss. Bottom ash combustibles w e r e i n v a r i a n t with g r a t e h e a t r e l e a s e and combustion a i r com- pos i t i on . (Sect ion 5.2.6, page 61; Figures 5-16, 5-17, pages 63-64.)
BOILER EFFICIENCY: Bo i l e r e f f i c i ency w a s determined f o r s ix t een tests using the ASTM hea t loss method. A t high load, above 5 0 0 ~ 1 0 ~ Btu /h r - f t2 , b o i l e r e f f i c i e n c y averaged 79.88%. Design e f f i c i ency on the b o i l e r w a s 80.41% based on Ohio coal . Boiler e f f i c i e n c y showed a decreasing t rend w i t h g r a t e hea t release and was i n v a r i e n t with combustion a i r com- pos i t i on . ' (Section 5.2.7, pages 61-65; Figure 5-18, page 66; Tab le 5-6, page 65; Table 5-20, page 88.)
COAL PROPERTIES: Emissions and b o i l e r e f f i c i ency were s tud ied t o determine any e f f e c t s which could be r e l a t e d t o d i f fe rences i n the p rope r t i e s of t h e th ree c o a l s f i r e d . V e r y few coa l r e l a t e d d i f fe rences were'found due t o the s i m i l a r i t i e s of the th ree coa ls . None of the c o r r e l a t i o n s shown below could be con- s ide red very s igni f icant . . (Sect ion 5.3, pages 65-77.)
0 P a r t i c u l a t e Loading
Crushed Kentucky coa l showed the h ighes t p a r t i c u l a t e .loadings a t the dus t c o l l e c t o r o u t l e t . Coal w a s not a f a c t o r a t the b o i l e r o u t l e t . (Figure 5-5, page 49; Figure 5-4, page 47.)
0 Opacity
Crushed Kentucky coa l showed t h e h ighes t opaci ty of the three coa ls . ( F i g w e 5-6, page 51.)
0 N i t r i c Oxide
Crushed Kentucky coa l had t h e h ighes t NO, E a s t Kentucky coal had the lowest NO. (Figure 5-8, page 53.)
0 combustibles i n Ash
Eas t Kentucky coal had t h e lowest combustible l e v e l i n the b o i l e r o u t l e t f lyash . Coal w a s not a funct ion i n bottom ash combustibles. (Figures 5-16, 5-17, pages 63-64.)
0 Boi le r Eff ic iency
No c o r r e l a t i o n found
KVB 15900-531
6
I I I I I I I I I I I 1 I I I I I I
~
I

I I I I 1 I I I I I I I I I I I I I 'I
PARTICLE SIZE DISTRIBUTION: Size d i s t r i b u t i o n of the f lyash w a s measured t w i c e a t the b o i l e r o u t l e t using SASS cyclones, and twice a t t h e economizer o u t l e t using a Brink Cascade Impactor. I n general , test r e s u l t s show t h a t ten percent of the b o i l e r o u t l e t f lyash was below 3 vm i n diameter, and 25% w a s below 10 vm. (Sect ion 5.4, pages 77-83; Tables 5-15, 5-16, pages 79-80; Figures 5-22, 5-23, pages 81, 82.)
EFFICIENCY OF MULTICLONE DUST COLLECTOR: D u s t c o l l e c t o r e f f i c i ency w a s de te r - mined i n t h i r t e e n tests. Apparent plugging of the c o l l e c t o r tubes re su l t ed i n a d e t e r i o r a t i o n of c o l l e c t i o n e f f i c i ency with time. Eff ic iency averaged 87% during t h e f i r s t month of t e s t i n g and 55% during the second month. Design e f f i c i ency of the c o l l e c t o r w a s 96% based on a dus t loading of 15% under 10 pm. (Sect ion 5.5, page 83; T a b l e 5-17, page 84; Figure 5-24, page 85.)
SOURCE ASSESSMENT SAMPLING SYSTEM: Flue gas w a s sampled for polynuclear aromatic hydrocarbons and t r a c e elements during one test on Kentucky coal and one tes t on Eas te rn Kentucky coa l . D a t a f r o m these tests w i l l be presented i n a sepa ra t e report a t the completion of this tes t program. (Sect ion 5.6, page 83; Table 5-18, page 86.)
The emissions d a t a are summarized i n Table 2-1 on the following page.
O t h e r d a t a tables are included a t the end of Sect ion 5.0, Tes t Results and
Observations. For re ference , a Data Supplement containing a l l the unreduced
d a t a obtained a t S i t e E is ava i l ab le under separa te cover b u t wi th t h e same
t i t l e followed by t h e words "Data Supplemnt ," and having the same EPA document
number followed by the let ter "b" r a t h e r t h a n "a". Copies of t h i s r epor t and
the Data Supplement a r e ava i l ab le through EPA and NTIS.
KVB 15900-531
7

o m 3 0 0 0
0 0 0 I ,
9 9 9 0 3 0 0 0 0
0 0 0 9 9 9 I ,
m 0
N < ' '
4
m m c e
8
I I I I I I
i I I I I I I I I I I I I I

I I I I I I I I I I I I I ~I I I I I I
3.0 DESCRIPTION OF FACILITY TESTED
AND COALS FIRED
This s ec t ion d iscusses the genera l physical layout and opera t iona l
c h a r a c t e r i s t i c s o f the b o i l e r t e s t ed a t T e s t S i t e E. '&e coals u t i l i z e d i n
t h i s t e s t s e r i e s a re a l s o discussed.
3.1 BOILER E DESCRIPTION
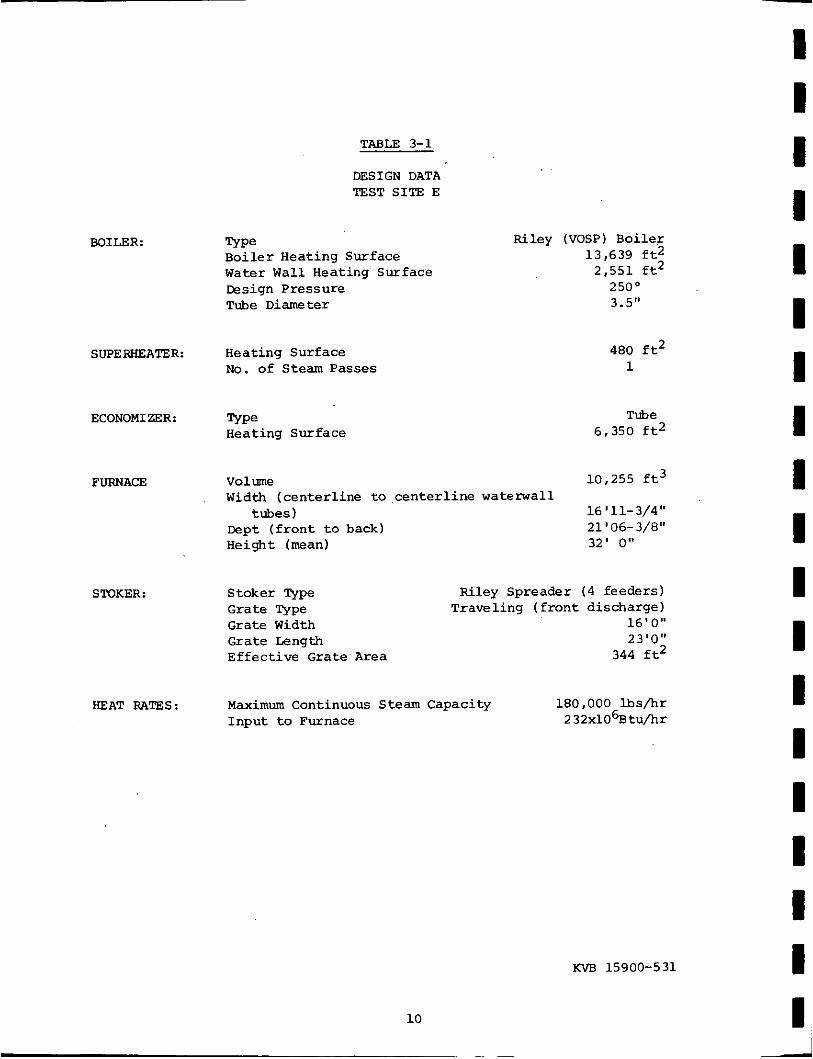
Boi le r E is a Riley (VOSP) u n i t , designed f o r 250 ps ig , and capable
of a maximum continuous capac i ty of 180,000 pounds of steam p e r hour a t 175
psig and a f i n a l superheated steam temperature of 427'F using feedwater a t
220'F. The u n i t has a Riley Stoker Company t r ave l ing g ra t e spreader s toke r ,
w i t h a f r o n t end ash discharge.
gases. Design data on the b o i l e r and s toke r a r e presented i n Table 3-1.
Predicted performance data a r e given i n Table 3-2. A s i d e e leva t ion of t he
b o i l e r i s shown i n Figure 3-1.
Undergrate a i r u t i l i z e s p a i n t oven exhaust
The b o i l e r i s equipped w i t h a Western P r e c i p i t a t o r multiclone dust
co l l ec to r . The c o l l e c t o r has a pred ic ted c o l l e c t i o n e f f ic iency of 96%,
assuming t h a t 15% of the p a r t i c l e s a r e under t en mic rowte r s .
3.2 OVERFIRE A I R SYSTEM
The ove r f i r e a i r system on Bo i l e r E c o n s i s t s of two rows of a i r j e t s
on the back wal l and two rows of j e t s on the f r o n t wal l . The configurat ion
of the ove r f i r e air system is described below:
Front Upper Row:
Front Lower Row:
Rear Upper Row:
8 j e t s 6 ' 6" above grate 15' below hor izonta l
8 j e t s 2 ' 0" above g ra t e Horizontal
8 j e t s 6 ' 0" above g ra t e Horizontal
i
KVB 15900-531
9
BOILER:
SUPERHEATER:
ECONOMIZER:
FURNACE
STOKER:
HEAT RATES:
TABLE 3-1
DESIGN DATA TEST SITE E
Type Ri Boi l e r Heating Surface Water Wall Heat ing Surface r e s ign Pressure Tube Diamete r
Heating Surface NO. of Steam Passes
Type Heating Surface
:y (VOSP) Boi le r 13,639 f t 2
2,551 f t 2 250' 3.5"
480 f t 2 1
Tube 6,350 f t 2
Volume 10,255 ft3 Width ( cen te r l ine t o , c e n t e r l i n e waterwall
16 ' 11- 3/4 " Dept ( f r o n t t o back) 21 ' 06- 3/8" H e i g h t (mean) 32' 0"
tubes)
Stoker Type Riley Spreader ( 4 feeders) Grate Type Traveling ( f r o n t discharge) Grate Width 16'0" Grate Length 23'0" Effec t ive Grate Area 344 f t 2
180.000 lbs/hr M a x i m u m Continuous Steam Capacity I n p u t t o Furnace 2 32x106Btu/hr
KVB 15900-531
I I I I I I I I I I I I I I I I I I I
I I I I I I I I I I I I I I I I I
I I I
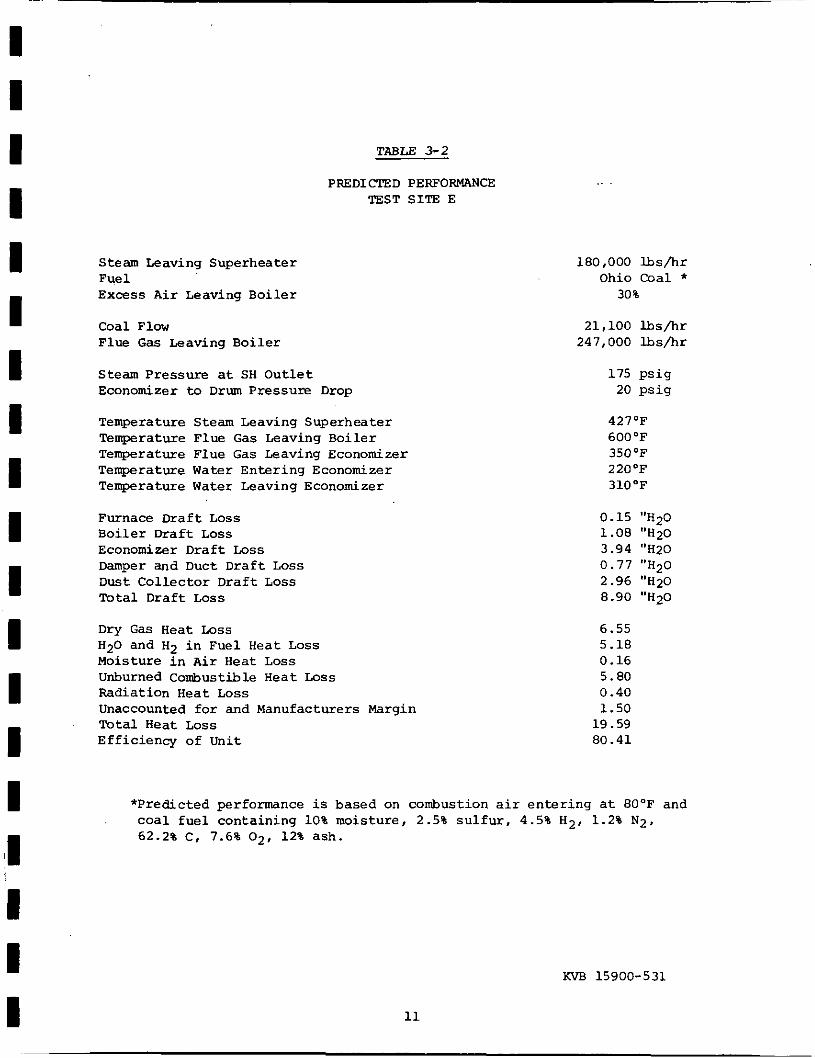
TABLE 3-2
PREDICTED PERFORMANCE TEST SITE E
Steam Leaving Superheater Fuel Excess A i r Leaving Boiler
C o a l Flow Flue G a s Leaving Boiler
Steam Pressure a t SH O u t l e t Economizer to Drum Pressure Drop
Tempe +a t u r e Steam Leaving Superheater Temperature Flue G a s Leaving Boi le r Temperature Flue G a s Leaving Economizer Temperature Water Entering Economizer Temperature Water Leaving Economizer
Furnace D r a f t Loss B o i l e r Draft Loss Economizer Draft Loss Damper and Duct Draf t L o s s D u s t Col lec tor D r a f t Loss Total Draft Loss
Dry Gas Heat Loss H 2 0 and H2 i n Fuel Heat Loss Moisture i n A i r Heat L o s s Unburned Combustible Heat Loss Radiation Heat Loss Unaccounted for and Manufacturers Margin Total Heat Loss Eff ic iency of Unit
180,000 Ibs /h r Ohio Coal *
30%
21,100 lbs/hr 247,000 lbs /h r
175 p s i g 20 p s i g
427OF 600OF 350'F 220'F 310'F
0.15 "H20 1.08 '"20 3.94 '"20 0.77 '"20 2.96 '"20 8.90 '"20
6.55 5.18 0.16 5.80 0.40 1.50
19.59 80.41
*Predicted performance is based on combustion a i r en ter ing a t 80°F and coa l f u e l containing 10% moisture, 2.5% s u l f u r , 4.5% H 2 , 1 . 2 % N 2 , 62.2% C, 7.6% 0 2 , 12% ash.
KVB 15900-531
11
GAS INLET
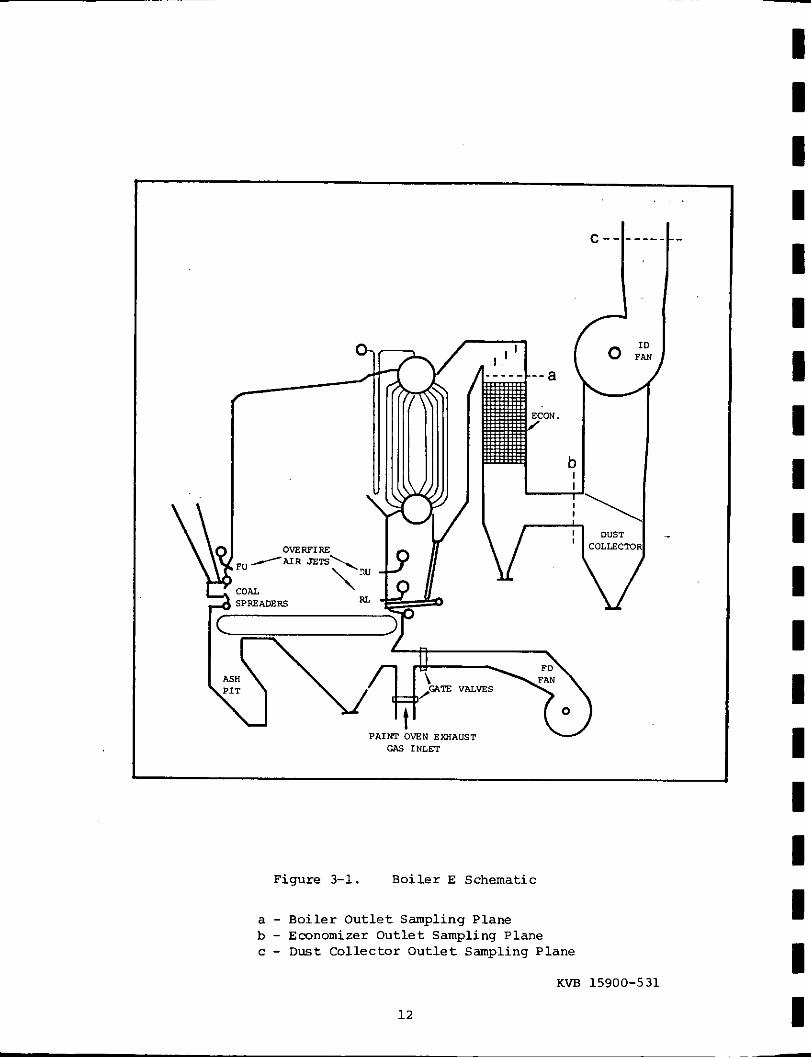
Figure 3-1. Boi le r E Schematic
a - Boi le r Ou t l e t Sampling Plane b - Economizer Out le t Sampling Plane c - D u s t Col lector O u t l e t Sampling Plane
KVB 15900-531
12

I
I
Rear Lwer Row: 8 j e t s 2'0" above g r a t e Horizontal
3.3 PARTICULATE COLLECTION EQUIPMENT
The b o i l e r i s equipped wi th a Western P r e c i p i t a t o r multiclone dus t
co l l ec to r . The multiclone ' s c o l l e c t i o n e f f i c i e n c y de te r io ra t ed during the
t e s t ing per iod, probably due to dus t bui ldup.
3.4 TEST PORT LOCATIONS
Emissions measurements were made a t th ree loca t ions -- a t the b o i l e r
o u t l e t (before t h e economizer), a f t e r the economizer, and a t the d u s t c o l l e c t o r ,
o u t l e t . The loca t ions of these sample sites are shown i n Figure 3-1. Their
geometry is shown i n Figure 3-2.
Whenever p a r t i c u l a t e loading w a s measured i t was measured simultaneously
a t both loca t ions using 24-point sample t r ave r ses .
CO2, CO and NO were obtained by pu l l ing samples ind iv idua l ly and compositely
from s i x probes d i s t r i b u t e d along t h e width of the boiler o u t l e t duct.
measurements and SASS samples f o r organic and t r a c e element determinations
were each obtained from s i n g l e po in t s w i th in t h e b o i l e r o u t l e t duc t .
sample l i n e w a s a t tached t o one of the middle gaseous probes a t the b o i l e r out-
l e t . Its purpose was t o e l imina te losses due t o condensation when measuring
NO2 and unburned hydrocarbons.
Gaseous measurements of 02,
SOX
A heated
I I I I I I 13
3.5 COALS UTILIZED
Three coa l types were f i r e d a t T e s t S i t e E . These were an Eastern
Kentucky coa l , a Kentucky coa l and a crushed Kentucky coa l . Coal samples were
taken f o r each tes t involving p a r t i c u l a t e o r SASS sampling. The average analyses
obtained from these samples are presented i n Table 3-3. The analyses show t h a t
the three coals are quite s i m i l a r i n t h e i r composition, based on both proximate
and u l t i m a t e analyses. The analyses of each individual coal sample are pre-
sented in Sect ion 5.0, Test Results and Observations, Tables 5-7 through 5-10.
KVB 15900-531

I 5 ' 7"
I
Bo i l e r Outlet Sampling Plane c ros s Sec t iona l A r e a = 98.64 f t 2
0 0
0 0 El A 0 0
Economizer O u t l e t Sampling Plane 2 C r o s s Sect iona l Area = 73.61 f t
. r * 1 7 ' 8" -
Multiclone Dust Col lec tor O u t l e t Sampling Plane Cross Sect ional A r e a = 38.50 f t 2
P a r t i c u l a t e Sampling Po in t s 0 Gaseous Sampling Poin ts
0 SASS sox
Figure 3-2. Boiler E Sampling Plane Geometry
I I I I I I I I I I I I I I I I
KVB 15900-531 1 4

I I I I I I I I I I I I I I I I I I 'I
PROXIMATE (As Rec'd)
% Moisture % Ash % Volat i le % Fixed Carbon
€%tu/& % s u l f u r
ULTIMATE (As Rec'd)
% Moisture % Carbon % Hydrogen % Nitrogen % ch lo r ine % s u l f u r % Ash % oxygen (Diff)
TABLE 3-3
AVERAGE COAL ANALYSIS TEST S I T E E
Kentucky coal
6.13 8 . 5 2
35.06 50.29
12773 0.86
6.13 71.69 4.73 1.30 0.13 0.86 8.52 6.67
Crushed Kentucky
C o a l
5.69 9.08
33.50 51.73
12831 0.71
5.69 71.95 4.72 1.36 0.14 0.71 9.08 6.36
E a s t Kentucky
Coal
6.31 8.21
34.47 51.02
12722 0.78
6.31 71.31 4.70 1.13 0.08 0.78 8.21 7.50
KVB 15900-531
15

I I I I 1 I I I I I I I I I I I I I I
(BLANK P A a l
16

4.0 TEST EQUIPMENT AND PROCEDURES
This s e c t i o n details how s p e c i f i c emissions were measured and the
sampling procedures followed t o assure t h a t accura te , reliable da ta w e r e
co l lec ted .
4.1 GASEOUS EMISSIONS MEASUREMENTS (NOx, CO, CO7, 07, HC)
A desc r ip t ion i s given below of the a n a l y t i c a l instrumentat ion, re-
l a t e d equipment, and the gas sampling and condi t ioning system, a l l of which
are loca ted i n a mobile t e s t i n g van owned and operated by KVB. The systems
have been developed as a r e s u l t of t e s t i n g s i n c e 1970, and are opera t iona l
and f u l l y checked ou t .
4 .1 .1
The a n a l y t i c a l system consists of f i v e instruments and assoc ia ted
The
Analy t ica l Instruments and Related Equipment
equipment f o r simultaneously measuring the cons t i t uen t s of f l u e gas .
analyzers , recorders , valves , c o n t r o l s , and manifolds a r e mounted on a panel
i n t h e vehicle .
'Ihe f l u e gas cons t i tuents which are measured a r e oxides of ni t rogen ( N O , N O x ) ,
carbon monoxide (CO) , carbon dioxide ( C 0 2 ) , oxygen (02), and gaseous hydro-
carbons (HC) .
The analyzers are shock mounted t o prevent v ib ra t ion damage.
Lis ted below are the measurement parameters, the analyzer model
furnished, and the range and accuracy of each parameter fo r the system. A
d e t a i l e d d iscuss ion of each analyzer follows:
Const i tuent : N i t r i c Oxide/Total Oxides of Nitrogen (NO/NOx) Analyzer: Thermo Electron Model 10 Chemiluminescent Analyzer Range : 0-2.5, 10, 25, 100. 250, 1000, 2500, 10,000 ppm NO Accuracy: 21% of f u l l s c a l e
Const i tuent : Carbon Monoxide Analyzer: Beckman Model 315B N D I R Analyzer Range : 0-500 and 0-2000 ppm CO Accuracy : 21% of f u l l s c a l e
KVB 15900-531
1 7
I I I I I I I I I I I I I I I I I I I
I I I I I I I I I I I I I I I I I I I
. ..
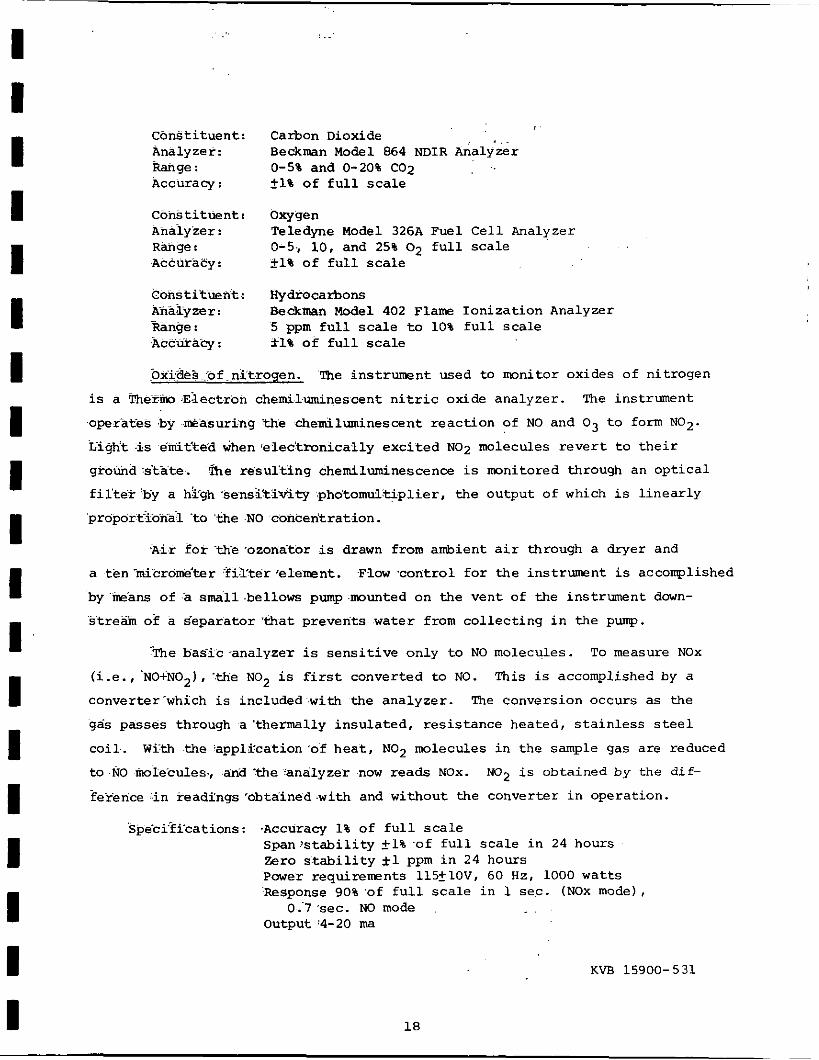
Constituent: Carbon Dioxide 1 , _ Analyzer: Range : 0-5% and 0-20% C02 Accuracy : 21% of f u l l scale
cons t i t uen t : Oxygen Anaiyzer : Teledyne Model 326A Fuel C e l l Analyzer Range I 0-5.. 10, and 25% O2 f u l l s ca l e Accuracy : fl% of f u l l scale
Coi-etitueat c Hydrocarbons Ariazyzer: RBnge : 5 ppm f u l l s c a l e t o 10% f u l l scale xccwacy :
Oxk&h~.:of nitrogen.
Beckman Model 864 NDIR Analyzer
Beckman Model 402 Flame Ion iza t ion Analyzer
fl% of f u l l scale
~.
'me instrument used t o monitor oxides of n i t rogen
is a 'rheFin0 Z lec t ron chemil.uminescent n i t r i c oxide analyzer .
.operates .by .&asuri:ng :the chemiluminescent r eac t ion of NO and O j t o form N 0 2 .
iXgh't :is e'mifte'd when ' e l ec t ron ica l ly exc i t ed NO2 molecules r e v e r t t o t h e i r
growd :s'ta-te.. %e r e s u l t i n g chemiluminescence is monitored through an o p t i c a l
f i l t e r "by a h&gh 3 e n s k t i h t y .photomult ipl ier , t h e output of which is l i n e a r l y
'proport-Loria% 'to 'the .NO conceritration .
The instrument
A i r f o r .the 'ozonator is drawn from ambient a i r through a dryer and
a t en IiScrome'ter 'fiber 'element. %.low 'control f o r the instrument is accomplished
by 'ineans of a small .bellows pump .mounted on the vent of the instrument down-
stream of a s e p a r a t o r ' t h a t prevents water from c o l l e c t i n g i n the pump. .. .
-fie b a s i c a n a l y z e r is s e n s i t i v e only t o NO molecules. To measure NOx
( i .e . , 'NO+N02), 'the NO2 is first converted to NO. This is accomplished by a
converter-which i s included'-with the ana lyzer . The conversion occurs as the
gas passes through a 'thermally in su la t ed , r e s i s t ance heated, s t a i n l e s s s t e e l
c o i l .
to .NO miecules . , ana -the 'analyzer now reads NOx. NO2 is obtained by the d i f -
ference :.in readfngs 'obtained .with and without the converter i n operat ion.
WCth .the 'appl i lcat ion~of h e a t , NO2 molecules i n the sample gas a re reduced
'Spe-cci-flcations: .Accuracy 1% of f u l l Scale S p a ~ ? s t a b i l i t y 51% -of f u l l s c a l e i n 24 hours Zero s t a b i l i t y *1 p p m i n 24 hours Power requirements 115+10V, 60 Hz, 1000 wat t s :Response 90% 'of f u l l scale i n 1 sec . (NOx mode),
0 ..7 'sec. NO mode . . Output :4-20 ma
KVB 15900-531
18

, . S e n s i t i v i t y 0.5 ppm ~- , , . , Linear i ty 21% o f . f u l l s c a i e , . . , , , .~ , , c-
Vacuum detec tor ope ra t ion Range: 2.5, 10, 25,. 100, 250; i000 , 2500, 10,000 ppm
f u l l s c a l e . , I , ,
,. -. , I
Carbon monoxide. Carbon monoxide Concentration i s measured by a
Beckman 315B non-dispersive i n f r a r e d ana lyzer . This instrument measures the
d i f f e r e n t i a l i n i n f r a r e d energy absorbed from energy beams passed through a
reference cel l (containing a gas s e l e c t e d t o have minimal absorpt ion of i n f r a -
red energy in t h e wavelength absorbed by the gas component of i n t e r e s t ) and a
sample ce l l through which t h e sample gas flows continuously. The d i f f e r e n t i a l
absorpt ion appears as a reading on a scale froni 0 t o 100 and i s then r e l a t e d
to the concentrat ion of the specie of i n t e re s t by c a l i b r a t i o n curves suppl ied
with the ' ins t rument . 'The opera t ing ranges f o r 'the CO analyzer a r e 0-500 ppm
and 0-2000 ppm.
Spec i f ica t ions : Span s t a b i l i t y _+1% of f u l l scale i n 24 hours Zero s t a b i l i t y +l% of f u l l scale i n 24 hours Ambient temperature range 32°F to 120°F Line vol tage 115_+15V nns Response 90% of f u l l s c a l e i n 0.5 or 2.5 sec . P rec i s ion 21% of f u l l scale Output 4-20 ma
Carbon dioxide. Carbon dioxide concentrat ion is measured by a Beckman
Model 864 s h o r t path- length, non-dispersive i n f r a r e d analyzer . This instrument
measures t h e d i f f e r e n t i a l i n i n f r a red energy absorbed from energy beams passed
through a reference cell (containing a gas s e l e c t e d t o have minimal absorption
of i n f r a r e d energy i n the wavelength absorbed by t h e gas component of i n t e r e s t )
and a sample ce l l through which the sample gas flows continuously. The d i f -
f e r e n t i a l absorpt ion appears as a reading on a s c a l e from 0 t o 100 and i s then
r e l a t e d to the concentrat ion of the spec ie of i n t e re s t by c a l i b r a t i o n curves
suppl ied with t h e instrument. The opera t ing ranges f o r the C02 analyzer a r e
0-5% and 0-20%.
Speci f ica t ions : Span s t a b i l i t y *l% of f u l l s c a l e i n 24 hours Zero s t a b i l i t y fl% of f u l l s c a l e i n 24 hours Anhient temperature .range 32°F t o 120°F Line vol tage 115f15V rms Response 90% of f u l l scale i n 0 .5 or 2.5 sec . P rec i s ion 21% of f u l l s c a l e Output 4-20 ma
19 KVB 15900-531
I I I I I I I I I I I I I I I I I I I

~
I I I I 1 I I I I I I I I I I I I I I
Oxygen. The oxygen content o f t h e f l u e gas sample is automatical ly
and continuously determined wi th a Teledyne Model 326A Oxygen analyzer .
Oxygen i n the f l u e gas d i f f u s e s through a Teflon membrane and is reduced
on the sur face of the cathode. A corresponding oxidat ion occurs a t the anode
i n t e r n a l l y and an electric cu r ren t is produced tha t i s propor t iona l t o the
concentrat ion of oxygen. This cu r ren t i s measured and conditioned by the
instrument 's e l e c t r o n i c c i r c u i t r y t o give a f i n a l output i n percent O2 by
volume for opera t ing ranges of 0% t o 5%, 0% to 10%. o r 0% to 25%.
Spec i f ica t ions : Prec is ion 21% of f u l l s c a l e Response 90% i n less than 40 sec. S e n s i t i v i t y 1% of low range L inea r i ty 21% of f u l l s c a l e Ambient temperature range 32-125'F Fuel ce l l l i f e expectancy 40,000%-hours Power requirement 115 VAC, 50-60 H z , 100 wat t s Output 4-20
Hydrocarbons. Hydrocarbons are measured using a Beckman Model 402
hydrocarbon analyzer which u t i l i z e s the flame ion iza t ion method of de tec t ion .
The sample is drawn t o the analyzer through a heated l i n e t o prevent the l o s s
of higher molecular weight hydrocarbons. I t is then f i l t e r e d and suppl ied to
the burner by means of a pump and flow c o n t r o l system. The sensor , which i s
the burner, has its flame sus ta ined by regula ted flows of f u e l (40% hydrogen
p lus 60% helium) and a i r . I n the flame, the hydrocarbon components of the
sample undergo a complete ion iza t ion t h a t produces e l ec t rons and p o s i t i v e ions .
Polar ized e lec t rodes c o l l e c t these ions , causing a small curren t t o flow through
a c i r c u i t . This ion iza t ion cu r ren t is propor t iona l t o the concentrat ion of
hydrocarbon atoms which e n t e r t h e burner. The instrument is ava i lab le with
range s e l e c t i o n from 5 ppm t o 10% f u l l scale as CH4.
Spec i f ica t ions : F u l l scale s e n s i t i v i t y , ad jus tab le from 5 ppm CH4 t o 10% CH4
Ranges: Range m u l t i p l i e r switch has 8 pos i t ions : X1, X5, X10, X50, X100, X500, X1000, and X5000. I n add i t ion , span con t ro l provides continuously va r i ab le adjustment wi th in a dynamic range of 1 O : l
Response time 90% f u l l scale i n 0.5 sec. Prec is ion 21% of f u l l scale Elec t ronic s t a b i l i t y 21% of f u l l s c a l e f o r successive
i d e n t i c a l samples
KVB 15900-531
20
Reproducibil i ty 21% o f f u l l ' scal'e "for successi've
Analysis temperature: anbient Ambient temperature 32OF' to 110°F
A i r requirements 350 t o 400 cc/min of c lean, hydro- carbon-free a i r , suppl ied a t 30 ' to 200 p s i g
Fuel gas requirements 75. t o 80 cc/min of pre-mixed . ,
f u e l cons is t ing of 40% hydrogen and 60% nitrogen o r helium, suppl ied a t 30 t o 200 p s i g
. . .. , ~. , . i d e n t i c a l samples . . . .
'
Output 4-20 ma ... ,
E l e c t r i c a l paver requirements 120V, 60 Hz . Automatic flame-out i nd ica t ion and fue l shut-off valve
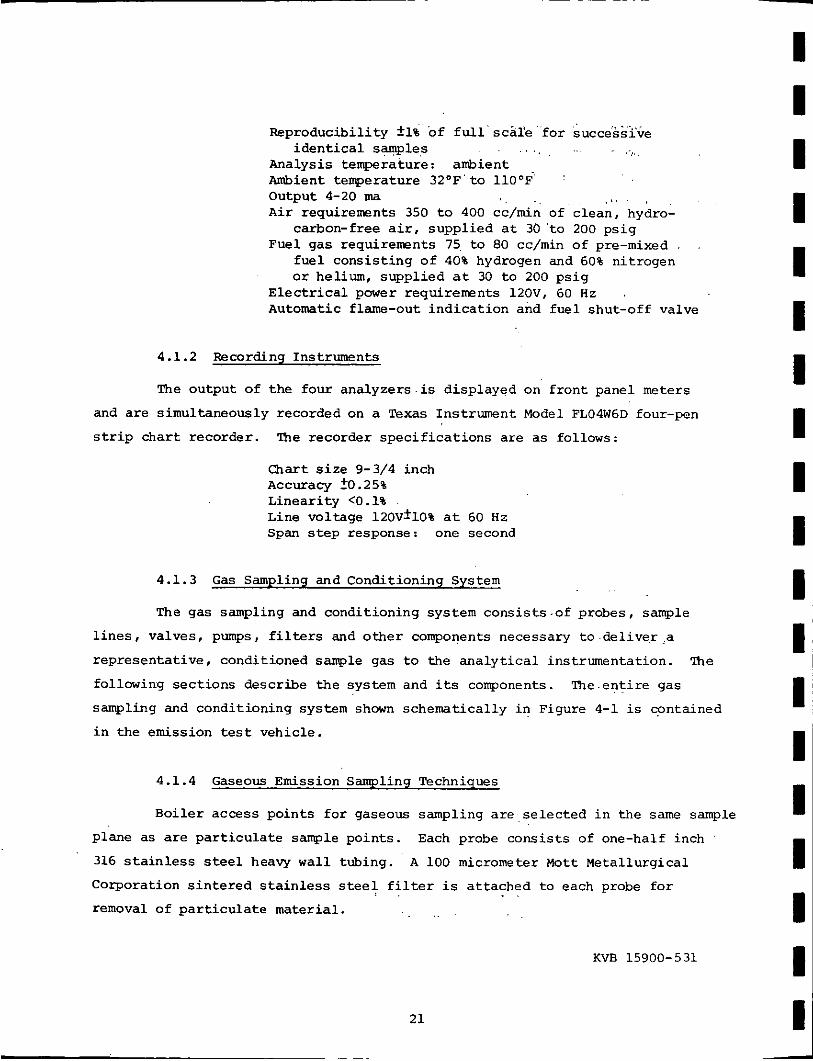
4.1.2 Recording Instruments
The output of t h e four analyzers is displayed on f ron t panel meters
and a re simultaneously recorded on a Texas Instrument Model FL04W6D four-pen
s t r i p cha r t recorder. The recorder spec i f i ca t ions are a s follows:
Chart s i z e 9-3/4 inch Accuracy ?0.25% Lineari ty <O .l% Line voltage l Z O V f l O % a t 60 Hz Span s t e p response: one second
4.1.3 G a s Sampling and Conditioning System
The gas sampling and conditioning system cons i s t s .o f probes, sample
l i n e s , valves, pumps, f i l ters and o the r components necessary t o de l iver a
representa t ive , conditioned sample gas to the ana ly t i ca l instrumentation. ?he
following sec t ions describe the system and its components. The.entire gas
sampling and conditioning system shown schematically i n Figure 4-1 i s cpntained
i n the emission test vehicle .
4.1.4 Gaseous E m i s s i o n Sampling Techniques
Boiler access poin ts f o r gaseous sampling a r e se l ec t ed i n the s a m e sample
plane as are p a r t i c u l a t e sample poin ts .
316 s t a i n l e s s steel heavy w a l l tubing.
Corporation s i n t e r e d s t a i n l e s s steel f i l t e r i s at tached t o each probe f o r
removal of p a r t i c u l a t e material.
Each probe cons is t s of one-half i n c h
A 100 micrometer Mott Metal lurgical
KVB 15900-531
21
I I I I I I I I I I I I I' I I I I I I
~

I I I 1 I I I I I I I I I I I I
. . . ., . . .. . ,.. ...~... .
I 2 2 K

. ... !
Gas samples t o be analyzed f o r 0 2 , C 0 2 , CO and NO a re conveyed t o the
KVB mobile labora tory through 3/8 inch nylon sample l i n e s , Af t e r passing
through bubblers f o r f low con t ro l , the samples pass through a diaphragm pump
and a r e f r i g e r a t e d dryer to reduce the sample dew,point temperature t o 35OF.
Af te r t h e dryer , t h e sample gas i s s p l i t between the various'continuous gas
m n i t o r s f o r ana lys i s . Flow through each continuo& monitor is accura te ly
cont ro l led with rotometers. Excess flow i s vented t o the outs ide . G a s samples
may be drawn both ind iv idua l ly and/or compositely from a l l probes during each
test . The average emission values are repor ted i n t h i s r epor t .
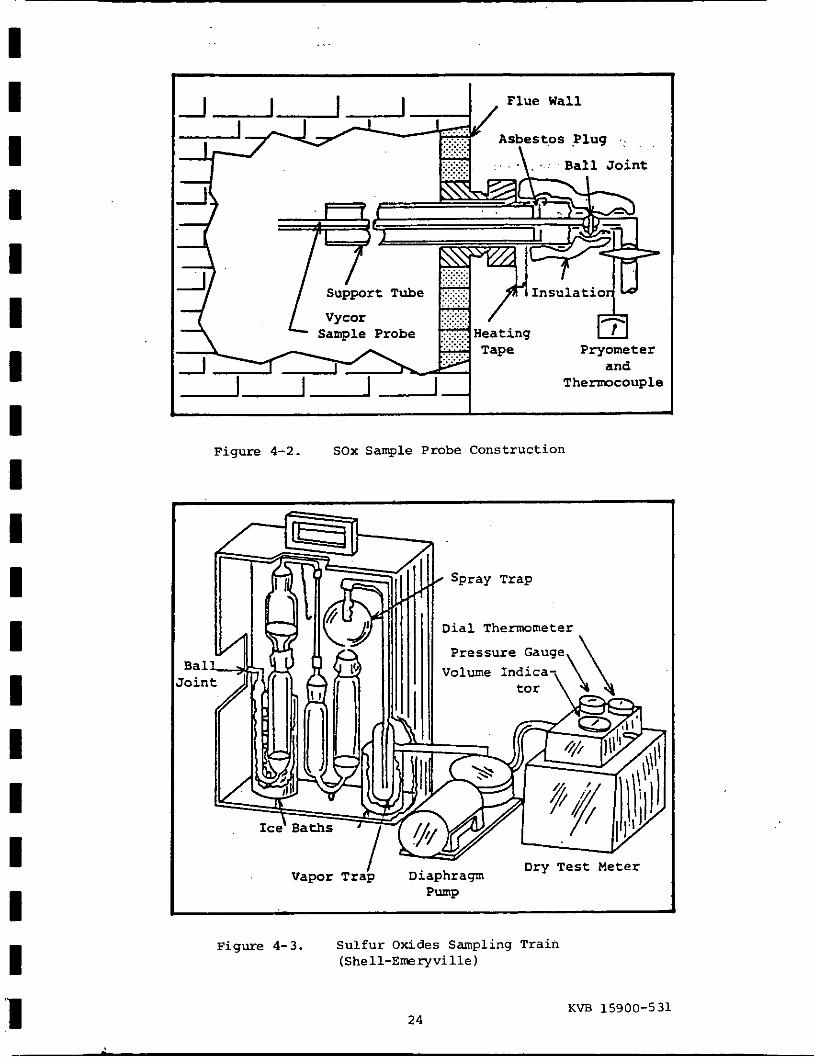
4.2 SULFUR OXILlES (SOX) MEASUREMENT AND PROCEDURES
Measurement of SO2 and SO3 concentrat ions is made by w e t chemical
ana lys i s using both t h e "Shell-Emeryville" m t h o d and EPA Method 6. I n the
Shell-Emeryville method the gas sample i s drawn from the s tack through a
g l a s s probe (Figure 4-21, containing a quar tz wool f i l t e r t o remove p a r t i c u l a t e
matter, i n t o a system of th ree s i n t e r e d g l a s s p l a t e absorbers (Figure 4-3) . The
f i r s t two absorbers contain aqueous isopropyl a lcohol and remove the s u l f u r
t r i o x i d e ; the t h i r d contains aqueous hydrogen peroxide so lu t ion which absorbs
the s u l f u r dioxide.
while the remainder, which passes through as s u l f u r i c ac id m i s t , i s completely
removed by the secondary absorber mounted above the f i r s t . Af te r the gas
sample has passed through t h e absorbers , t h e gas t r a i n is purged with n i t rogen
t o t r a n s f e r s u l f u r dioxide, which has dissolved i n the f i rs t t w o absorbers ,
t o the t h i r d absorber t o complete ~e sepa ra t ion of the two components. The
isoprophy alcohol is used to i n h i b i t t h e oxida t ion of s u l f u r dioxide t o s u l f u r
t r i o x i d e before it gets to the t h i r d absorber .
Some of the s u l f u r t r i o x i d e i s removed by the first absorber,
The isopropyl a lcohol absorber s o l u t i o n s are conbined and the s u l f a t e
r e s u l t i n g from t h e s u l f u r t r i ox ide absorpt ion is t i t r a t e d with s tandard lead
perchlora te so lu t ion using Sulfonazo I11 i n d i c a t o r . I n a similar manner, the
hydrogen peroxide s o l u t i o n is t i t r a t e d fo r the s u l f a t e r e s u l t i n g from the
s u l f u r dioxide absorpt ion.
me gas sample is drawn from the f l u e by a s i n g l e probe made of
quar tz g l a s s i n s e r t e d i n t o the duct approximately one-third t o one-half way.
KVB 15900-531
I I I I I I I I I I I I I I I I I I
2 3
I I I I I I I I I I I I I I I I I I 1
Figure 4-2. SOX Sample Probe Construction
Figure 4-3. Sulfur Oxides Sampling Train (Shel l -Emeryvil le)
KVB 15900-531 24

J
I !
. . !....
The i n l e t end of the probe holds a quartz wool f i l t e r t o remoire 'particulate
matter.
t h e dew po in t of s u l f u r i c ac id during sampling (minimum temperature of
260OC).
I t i s important t h a t the e n t i r e probe temperature be kept above
.. . .. < 8 . I . 1 . . T h i s is accomplished by wrapping t h e : probe with' a hea t ing tape .
EPA Method 6 , which is an a l t e r n a t i v e method for determining SO2,
employs an impinger t r a i n cons i s t ing of a bubbler and three midget impingers.
The bubbler conta ins isopropanol. The f i r s t and second impingers conta in
aqueous hydrogen peroxide.
probe and f i l t e r used i n the Shell-Emeryville method is a l s o used i n Method 6 .
. . , .
The t h i r d impinger i s l e f t dry. The qua r t z
Method 6 d i f f e r s from Shell-Emeryville i n t h a t Method 6 requi res
t h a t t h e sample rate b e propor t iona l t o s tack gas ve loc i ty .
d i f f e r s from Shell-Emeryville i n t h a t t h e sample t r a i n i n Method 6 i s purged
w i t h ambient a i r , i n s t e a d of nitrogen. Sample recovery involves combining
the s o l u t i o n s from the f i r s t and second impingers. A 10 m l . a l i q u o t of
t h i s so lu t ion ,is then t i t r a t e d with s tandardized barium pe rch lo ra t e .
Method 6 a l s o
Three r e p e t i t i o n s of SOX sampling are made a t each tes t po in t .
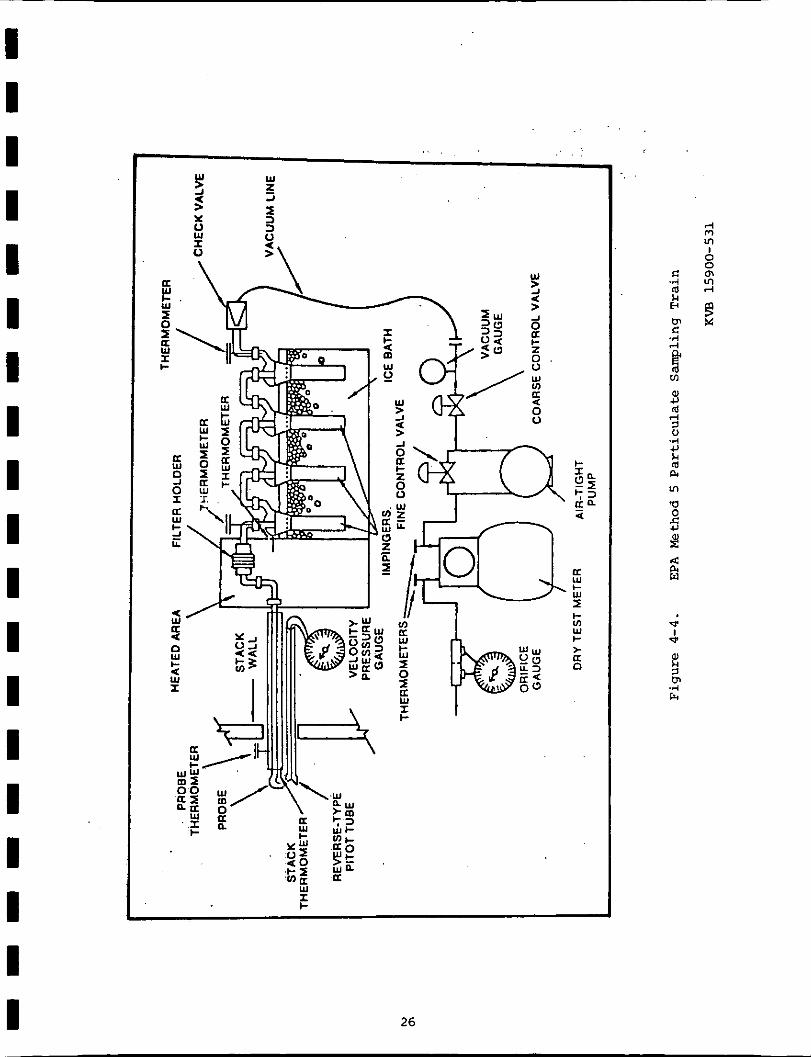
4.3 PARTICULATE MEASUREMENT AND PRCCEDURES
P a r t i c u l a t e samples are taken a t t h e same sample p o r t s as t h e gaseous
emission samples using a Joy Manufacturing Company por tab le e f f l u e n t sampler
(Figure 4-4). This system, which meets the EPA design spec i f i ca t ions f o r
T e s t Method 5 , Determination of P a r t i c u l a t e Emissions from Sta t ionary Sources
(Federal Regis te r , Volume 36, N o . 27, page 24888, December 23, 1971). is used
to perform both the i n i t i a l ve loc i ty t r ave r se and the p a r t i c u l a t e sample
co l l ec t ion . Dry p a r t i c u l a t e s a re c o l l e c t e d i n a heated case using f i r s t a
cyclone t o sepa ra t e p a r t i c l e s l a rge r than f i v e micrometers and a 100 mm g l a s s
f i b e r f i l t e r f o r r e t en t ion of p a r t i c l e s down t o 0.3 micrometers. Condensible
p a r t i c u l a t e s are co l l ec t ed i n a t r a i n of fou r Greenburg-Smith impingers i n an
ice water bath. The con t ro l un i t inc ludes a t o t a l gas meter and thermocouple
ind ica to r .
i s o k i n e t i c sampling condi t ions.
A p i to t tube system i s provided f o r s e t t i n g sample flows t o obtain
KVB 15900-531
25
I I I I I I I I I I I I I I I I I I I
I I I I I I I I I I I I I I I I I I I
U W !-
$ c v) W c > U n
26
4 m Ln I 0 0
Ln 4
m
9 M

All per iphe ra l equipment is c a r r i e d i n the instrument van. This
includes a scale (accurate t o 20.1 mg) , h o t plate, drying oven (212°F). , high
temperature oven, des icca tor , and r e l a t e d glassware. A p a r t i c u l a t e ana lys i s
laboratory is se t up i n the v i c i n i t y of the b o i l e r i n a ,vibrat ion-free area.
Here f i l t e r s are prepared, tare weighed and weighed again a f t e r ' p a r t i c u l a t e
co l l ec t ion . Also, probe washes a r e evaporated and weighed i n t h e lab.
4.4 PARTICLE SIZE DISTRIBZPTION MEASUREMENT AND PROCEDURES
P a r t i c l e s i z e d i s t r i b u t i o n i s measured using seve ra l methods. These
include t h e Brink Cascade Impactor and the SASS cyclones. N o Bahco samples were
taken a t t h i s si te. Each of these p a r t i c l e s i z i n g methods has its advantages
and disadvantages.
Brink. The Brink cascade impactor i s an i n - s i t u p a r t i c l e s i z i n g de-
vice which separa tes the p a r t i c l e s i n t o s i x s i z e c l a s s i f i c a t i o n s . I t has the
advantage of c o l l e c t i n g the e n t i r e sample. That i s , everything down t o the
c o l l e c t i o n e f f i c i e n c y of the f i n a l f i l t e r i s included i n the ana lys i s .
has , however, some disadvantages. I f the p a r t i c u l a t e matter is s p a t i a l l y
s t r a t i f i e d wi th in the duct , the s ingle-poin t Brink sampler w i l l y i e l d
erroneous r e s u l t s . Unfortunately, t h e particles a t t h e o u t l e t s of s toke r
b o i l e r s may be considerably s t r a t i f i e d .
ment's small c l a s s i f i c a t i o n range (0.3 t o 3.0 micrometers) and its small sample
nozzle (1.5 to 2.0 mm maximum diameter) . Both a re inadequate f o r the job a t
hand. The p a r t i c l e s being co l l ec t ed a t t h e b o i l e r o u t l e t are o f t e n as l a rge
as t h e sample nozzle.
I t
Another disadvantage i s the in s t ru -
The sampling procedure is s t r a i g h t forward. F i r s t , the gas ve loc i ty
a t t h e sample po in t is determined using a c a l i b r a t e d S-type p i t o t tube. For
t h i s purpose a hand held p a r t i c u l a t e probe, i nc l ined manometer, thermocouple
and ind ica to r a r e used. Second, a nozzle s i z e i s se l ec t ed which w i l l main- 3 . t a i n i s o k i n e t i c flow r a t e s within t h e recommended .02-.07 f t /min r a t e a t
s tack condi t ions. Having se l ec t ed a nozzle and determined the required flow
r a t e f o r i s o k i n e t i c s , the operat ing pressure drop across the impactor i s
determined from a c a l i b r a t i o n curve.
temperature, pressure and molecular weight of the gas t o be sampled.
This pressure drop i s cor rec ted f o r
KVB 15900-531
I I I
I I I I 27

I I I I I I I I I I I I I I I I I I I
A sample i s drawn a t t he predetermined AP f o r a time per iod which i s
d ic t a t ed by mass loading and s i z e d i s t r i b u t i o n .
it is des i rab le t o c o l l e c t s eve ra l mill igrams on each s t age . However, t o
minimize reentrainment, a r u l e o f thumb i s t h a t no s t age should be loaded
above 10 mg. A schematic of the Brink sampling t r a i n is s h m i n Figure 4-5.
To minimize weighing e r r o r s ,
- SASS. The Source Assess,mnt Sampling System (SASS) was not designed
p r inc ipa l ly as a p a r t i c l e sizer b u t it includes three c a l i b r a t e d cyclones
which can be used a s such. The SASS t r a i n i s a s ing le po in t i n - s i t u sampler.
Thus, it is on a par with cascade impactors. Because it is a high volume
sampler and samples are drawn through l a r g e nozzles (0 .25 t o 1.0 i n . ) , it
has an advantage over the B r i n k cascade impactor where l a rge p a r t i c l e s a re
involved. The c u t po in t s of the three cyclones are 10, 3 and 1 micrometers.
A de t a i l ed desc r ip t ion of t he SASS t r a i n i s presented i n Sect ion 4 .9 .
4 .5 COAL SAMPLING AND ANALYSIS P R o C E D k
Coal samples a t Test S i t e E were taken during each test from the
u n i t ' s two coal scales. The samples w e r e processed and analyzed fo r both
s i z e consistency and chemical composition. The use of the coal s ca l e as
a sampling s t a t i o n has two advantages. I t is close enough t o the furnace
t h a t the coa l sampled simultaneously wi th t e s t i n g is representa t ive of the
coa l f i r e d during the t e s t i n g . Also, because of the construct ion of the
coal s c a l e , it is poss ib le t o c o l l e c t a complete cu t of coa l o f f the s c a l e s '
apron feeder thus insur ing a representa t ive s i z e consistency.
I n order t o c o l l e c t representa t ive coal samples, a sampling device
having the same width as the apron feeder b e l t was moved d i r e c t l y under the
b e l t ' s discharge end t o catch a l l of the coa l over a sho r t increment of time
(approximately f i v e seconds).
The sampling procedure is as follows. A t the s t a r t of t e s t i n g one
increment of sample is col lec ted from each feeder . This is repeated twice more
during the test ( three t o f i v e hours du ra t ion ) so t h a t a s i x increment sample
is obtained. The sample is then r i f f l e d us ing a Gilson Model SP-2 Porta
S p l i t t e r u n t i l two representa t ive twenty pound samples a r e obtained.
KVB 15900-531
28

STAGE 1 . . 1. .
Figure 4-5. B r i n k C a s c a d e Impactor Sampling T r a i n Schematic
.. 0 DRY METER GAS
I I I
F I N A L F I L T E R PRESSURE TAP
FOR 0-20" MAGNAHELIX
KVB 15900-531
DRYING .COLUMN
29
c

I I I I I I I I I I I I I I I I I I I
The sample t o be used f o r sieve ana lys is is weighed, a i r d r i ed over-
n ight , and re-weighed. Drying of the coal i s necessary f o r good separation
of f ines . If the coal is w e t , f i n e s c l i n g to the l a r g e r pieces of coal and t o
each O t h e r .
Screen. Screen sizes used are 1". 1/2", 1/4", #E and #l6 mesh. Screen area
per t r a y is 14"xl4". The coal i n each t r a y i s weighed on a t r i p l e beam balance
to the neares t 0.1 gram.
Once dry, the c o a l is sized using a s i x t r a y Gilson Model PS-3 Por ta
The coal sample for chemical ana lys i s is reduced t o 2-3 pounds by
fu r the r r i f f l i n g and sea l ed i n a plastic bag.
Commercial Test ing and Engineering Company, South Holland, I l l i n o i s . Each
sample assoc ia ted w i t h a p a r t i c u l a t e loading o r p a r t i c l e s i z i n g tes t is
given a proximate ana lys i s . I n add i t ion , composite samples cons i s t ing of
one increment of coal f o r each test f o r each coa l type receive ul t imate
ana lys i s , ash fus ion temperature, mineral ana lys i s , Hardgrove g r i n d a b i l i t y
and f r e e swel l ing index measuremnts.
A l l coa l samples are s e n t t o
4.6 ASH COLLECTION AND ANALYSIS FOR COMBUSTIBLES
The combustible content of f l yash is determined i n the f i e l d by KVB
i n accordance with ASTM D3173, "Moisture i n the Analysis Sample of Coal and
Coke" and ASTM D3174, "Ash i n the Analysis Sample of Coal and Coke."
The f lyash sample is co l l ec t ed by the EPA Method 5 p a r t i c u l a t e sample
t r a i n w h i l e sampling f o r p a r t i c u l a t e s . The cyclone catch is placed i n a desic-
cated and tare-weighed ceramic cruc ib le . f i e c ruc ib le with sample is heated
i n an oven a t 23OOF t o remve i ts moisture. It i s then desiccated t o room
temperature and weighed.
electric muffle furnace maintained a t a temperature of 1400'F u n t i l i g n i t i o n
i s complete and the sample has reached a constant weight. It i s cooled i n a
des icca tor over des iccant and weighed. Combustible content is ca lcu la ted as
the percent weight loss of the sample based on its p o s t 230°F weight.
The c ruc ib l e with sample is then placed i n a n
A t T e s t S i t e E the bottom ash samples were co l l ec t ed i n seve ra l in-
crements from the discharge end of the g r a t e during t e s t i n g . These samples
were mixed, quartered, and s e n t to Commercial Testing and Engineering Company
f o r conbustihle determination. Multiclone ash samples and economizer a s h
KVB 15900-531
30
samples were taken from p o r t s near the base of t h e i r hoppers.
samples,approximately two q u a r t s i n s i z e , w a s Sent t o Conunerci.al Testing and
Engineering Company f o r combustible determination.
lhese
4 .7 BOILER EFFICIENCY EVALUATION
Boiler e f f i c i ency is ca lcu la ted using the ASME T e s t Form f o r Abbre-
v i a t ed Eff ic iency T e s t , Revised, September, 1965. The general approach t o
e f f i c i ency eva lua t ion is based on the assessment of conbustion lo s ses .
losses can be grouped i n t o three major ca tegor ies : s tack gas losses, com-
b u s t i b l e l o s s e s , and r ad ia t ion losses . The f i r s t two groups of l o s ses are
measured d i r e c t l y . The t h i r d is estimated from the RBMA Standard Radiation
Loss Chart.
These
Unlike the ASME tes t i n which combustible lo s ses a r e lumped i n t o one
category, combustible lo s ses a r e ca l cu la t ed and reported separa te ly f o r com-
b u s t i b l e s i n the bottom ash, combustibles i n t h e mechanically co l l ec t ed ash
which is no t r e in j ec t ed , and combustibles i n the f lyash leaving the mechanical
collector.
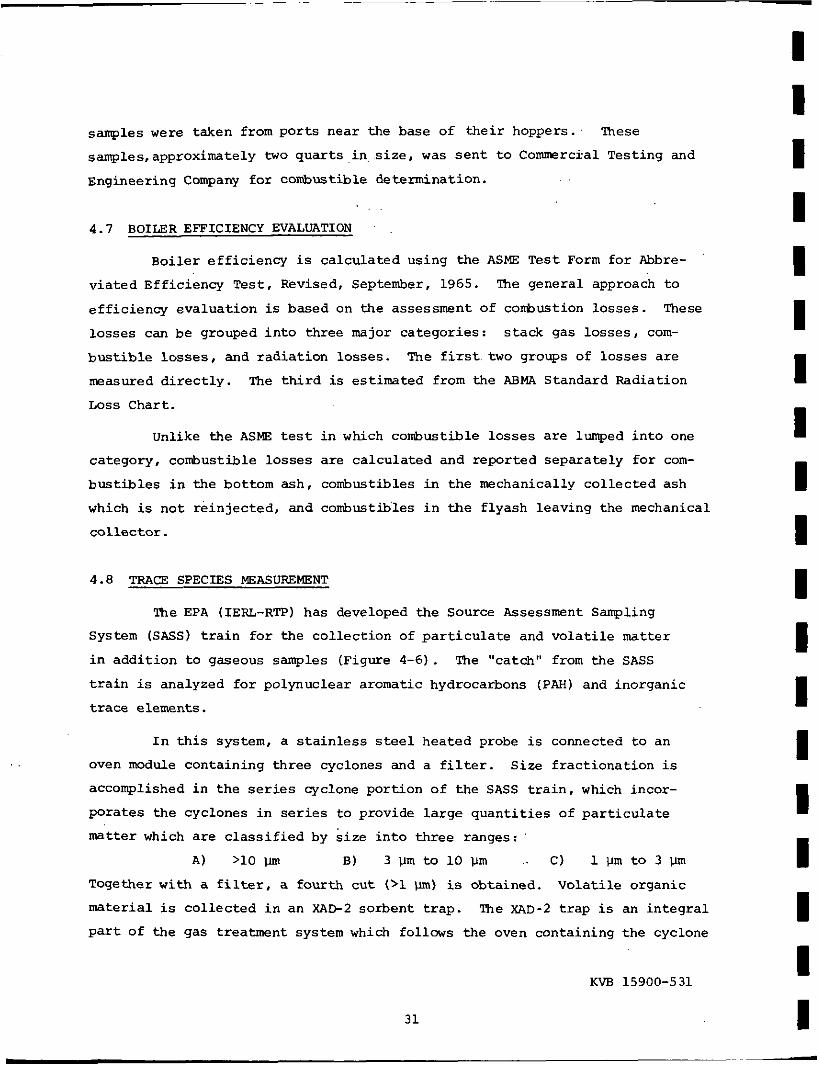
4.8 TRACE SPECIES MEASUREMENT
The EPA (IEPL-RTP) has developed the Source Assessment Sampling
System (SASS) t r a i n f o r the co l l ec t ion of p a r t i c u l a t e and v o l a t i l e mat ter
i n add i t ion t o gaseous samples (Figure 4-6) . The "catch" from the SASS
t r a i n is analyzed f o r polynuclear aromatic hydrocarbons (PAH) and inorganic
trace elements.
I n t h i s system, a s t a i n l e s s steel hea ted probe i s connected t o an
. . oven module containing th ree cyclones and a f i l t e r . S ize f r ac t iona t ion is
accomplished i n the series cyclone por t ion of t h e SASS t r a i n , which incor-
pora tes the cyclones i n s e r i e s t o provide large q u a n t i t i e s of p a r t i c u l a t e
matter which are c l a s s i f i e d by s i z e i n t o three ranges:
A ) >10 B) 3 um to 10 . C ) 1 m t t o 3 l J m
Together w i t h a f i l t e r , a four th c u t (>1 m) is obtained. Vo la t i l e organic
material is co l l ec t ed i n an XAD-2 sorbent trap. The XAD-2 trap is an i n t e g r a l
p a r t o f the gas treatment system which follows the oven containing t h e cyclone
KVB 15900-531
31
I 1 I I I I I 1 I I I I I I I I I I I

I I I I I I I I I I I I I I I I' I I I 32

system.
the gas condi t ioner , the XAE-2 organic sorbent t r a p , the aqueous condensate
c o l l e c t o r , and a temperature con t ro l l e r . The XAE-2 sorbent is a porous polymer
r e s i n w i t h the capab i l i t y of absorbing a broad range of organic spec ies . .'
Some trapping of v o l a t i l e inorganic spec ies is a l s o an t ic ipa ted as a r e s u l t
of simple impaction.
of impingers. The pumping capacity is suppl ied by two 10 cfm high volume
vacuum pumps, while required pressure , temperature, power and f l o w conditions
are obtained from a main con t ro l l e r .
The gas treatment system is composed of four primary components:
Vo la t i l e inorganic elements a r e co l l ec t ed i n a s e r i e s
KVB 15900-531
33
I I I I I I I I I I I I I I I I I I I

I I I I 1 I I I I I I I I I I I I I I
(BLANK PAGE)
34
5.0 TEST RESULTS AND OBSERVATIONS
This sec t ion p resen t s t h e r e s u l t s of the t e s t s performed on Boi le r E .
Observations a re made regarding t h e inf luence on e f f i c i e n c y and gaseous and
p a r t i c u l a t e emissions as the con t ro l parameters were var ied . menty t e s t s
were conducted i n a def ined t e s t matrix to develop t h i s d a t a . Tables 5-19
through 5-22 are included a t the end of t h i s s e c t i o n f o r re ference .
As was mentioned i n t h e execut ive summary t o t h i s r epor t , problems were
encountered which prevented the e n t i r e t e s t program from being completed. A s
a r e s u l t , i n t e r p r e t a t i o n of some of the da t a i s rendered very d i f f i c u l t . I n
genera l , however, the da ta obtained a t S i t e E are usefu l and informative.
These data a re discussed i n t h e following paragraphs.
5.1 OVERFIRE A I R
Boi1er.E had four rows of o v e r f i r e a i r j e t s i n t he configurat ion
shown i n Figure 3-1. Several t e s t s were run i n which ove r f i r e a i r pressure
t o ind iv idua l rows of air j e t s (and thus o v e r f i r e a i r flow) was the indepen-
dent var iab le . Emissions and b o i l e r e f f i c i e n c y were measured as the o v e r f i r e
a i r p ressures were var ied i n order t o determine which ove r f i r e air pressure
s e t t i n g s were optimum.
5.1.1 Overf i re A i r Flow Rate Measurements
Overfire a i r flow r a t e s were determined fo r one pressure s e t t i n g on
each of the four rows of a i r j e t s . Overf i re a i r flow r a t e was a l s o determined
a t t he ove r f i r e a i r fan o u t l e t , thus allowing the f lyash r e i n j e c t i o n a i r f l o w ,
which i s suppl ied by the sane fan, t o be determined by d i f fe rence . These
da ta a r e shown i n Table 5-1.
Based on these measuremnts it i s poss ib l e t o determine the ind iv idua l
and t o t a l a i r flows i n t o t h e furnace a t any ove r f i r e air pressure s e t t i n g . The
r e l a t i o n s h i p used t o make t h i s determination i s der ived from B e r n a u l l i ' s
KVB 15900-531
35
I I I I I I I I I I I I I I I I~ I I I

I I I I 1 I I I I I I I I I I I I I I
TABLE 5-1
OVERFIRE AIR FLOW RATES
TEST SITE E
Measured Overfire Air S t a t i c Pressure Air Flow
Header “H>O l.bs/hr
Front Upper 24 .0 13,200
Front Lower 29.5 300
Rear upper 8.5 13,300
Rear Lower 23.0 16,000
Total 42 .800
Percentage of Total Overfire A i r
31%
1%
31%
31%
- 100%
KVB 15900-531
36
equat ion f o r f l u i d flow through an o r i f i c e .
previous tests. One form of Bernau l l i ' s equat ion is:
I t has been v e r i f i e d by KVB on
AP = Avz P 29 - -
The ve loc i ty (v) is propor t iona l t o the square r o o t of the pressure drop ( & I . A t he = 0 , v = 0. Therefore, a l i n e drawn through the square r o o t of each
s t a t i c pressure l i s t e d i n Table 5-1 and through the ( 0 , O ) p o i n t w i l l def ine
the a i r f low o r ve loc i ty as a func t ion of (Figure 5-1) .
5.1.2 P a r t i c u l a t e Loading vs Overf i re A i r
Four tests were run on Kentucky coal to determine the e f f e c t of
adjustments t o the o v e r f i r e a i r s y s t e m on p a r t i c u l a t e emissions. The r e s u l t s
a re shown i n Figure 5-2 and i n Table 5-2.
The r e s u l t s show t h a t reducing the o v e r f i r e a i r pressure t o the r e a r
upper and lower rows of air jets had no e f f e c t on p a r t i c u l a t e loading. This
conclusion i s based on the r e s u l t s of tes t 8 which averaged 27"H20 pressure
on the r e a r j e t s , and test 11 which averaged 3"H20 pressure on the r e a r j e t s .
?he b o i l e r o u t l e t p r t icu la te loadings f o r tests 8 and 11 were 4.49 and 4.32
lbs/106 Btu, respec t ive ly , which is not a s i g n i f i c a n t d i f fe rence .
were run under similar condi t ions of b o i l e r loading and excess a i r .
Both t e s t s
When the a i r pressure t o the lower f r o n t and lower rear rows of over-
f i re a i r jets w a s reduced, as i t w a s dur ing test 7, the boiler out le t part-
i c u l a t e loading increased t o 5.23 lbs/106 Btu. 6 when compared t o t es t 8 (4 .49 lbs/lO B t u ) , b u t i t m u s t be noted tha t the
var iab le excess a i r was no t held constant . Therefore i t is e n t i r e l y poss ib le
tha t the increase i n p a r t i c u l a t e loading was due t o reduced excess a i r and
n o t the change i n o v e r f i r e a i r condi t ions. Figure 5-2 shows t h a t the increased
P a r t i c u l a t e loading of test 7 resu l ted e n t i r e l y from i ts increased combustible
content when compared t o t e s t 8.
This increase is s i g n i f i c a n t
XVB 15900-531
37
I I I i
I I I I I I I I I I I I I I

I I I I I I I I I I I I I I I I I I I
? i 1
i !
i I
i j I I
1 i t
I !
i I I
i
1 I
I
I I
i i
1
1 j I .
T I '
! ' i !
i I
i I i
i 1
1 !
i 1 I
T
1
i I i
i
I j i
rl
In m
I 0 0 In .-l
m
W
.rl $ 2 VI
P d
i
i ! !
!
N rl
o a " ?
3 (1 0
- !
i I 1 1 i - ~
! !
i i ! * I
! . . ! ' : ! : j 1 , ;
i '
, , : co
\D
P
N
, . . . . , . I . , . . . .
. , : . I . !
. , . . . . . , . . . . , , . .
. . , . . . ,
N In m rl

5
4
3.
2
1
TEST NO.
CONDITIONS
i
COMBUSTIBLES
c] INORGANIC ASH
6 7 8 11
Reduced R e d u c e d H i g h Bal Reduced R U & R L F L & R L OFA RU & RL
OFA OFA OFA
I I I I I 1 I
Figure 5-2. P a r t i c u l a t e Loading B r e a k d o w n for Kentucky C o a l as a Funct ion of O v e r f i r e A i r C o n d i t i o n s .
KVB 15900-531
39

I I I I I I I I I I I I I I I I I I I
TABLE 5-2
EFFECT OF OVERFIRE A I R ON EMISSIONS AND EFFICIENCY KENTUCKY COAL - TEST SITE E
TEST NO
DESCRIPTION
OVERFIE A I R CONDITIONS
F r o n t Upper, " H 2 0 F r o n t m e r , " H 2 0 Rear Upper, '"20 Rear Lcwuer, " H 9
FIRING CONDITIONS
Load, % of C a p a c i t y G r a t e Heat Release , 1 0 % t u / h r - f t 2 Coal S i z i n g , % P a s s i n g 1/4" Excess A i r , 6
BOILER OUTLET EMISSIONS
P a r t i c u l a t e Loading, lb/106Btu Combust ible Loading, lb /1068tu I n o r g a n i c m h L o a d m g , lb/106Btu Combust ib les i n F l y a s h , 6
0 2 , 6 (dry1 CO, ppm (dry1 @ 3% 0 2 NO, lb/106Btu
MULTICWNE OUTLET EMISSIONS
P a r t i c u l a t e Loading, lb/1068tu Comhust ible Loading, 1b/lO6Btu I n o r g a n i c Ash Loading, lb /1068tu Combust ible i n F l y a s h . P HUltiClOne C o l l e c t i o n E f f i c i e n c y . 6 S t a c k O p a c i t y , %
HEAT IDSSES. a Dry Gas Lo55 Mois ture i n Fuel H 2 0 from combust ion o f H2 c o m b u s t i b l e s i n B o i l e r O u t l e t F l y a s h Combust ib les i n B o t t o m Ash R a d i a t i o n Loss unmeasured Losses
T o t a l Losses
B o i l e r E f f i c i e n c y
6 7
Reduced Reduced R U 6 R L F L G R L
OFA OFA ( B a s e l i n e l
28 31
3 19
65 454
34 70
2.060 1 .283 0.777
6 2 . 3
9 . 0 62
0.614
0.335 0.205 0.130
6 1 . 2 8 3 . 1
11
7.60 0 .63 3.88 5.89 1 .17 0 .71 1 . 5 0
21.38
78.62
28 19 28 19
6 1 504
34 29
5.230 3.938 1.292
75.3
5.2 1 4 1
0.494
1.824 1.226 0.598
67.2 65 .1
45
6 . 5 5 0 .43 3.18 5.64 0 .76 0 . 6 8 1 . 5 0
19 .34
80 .66
8
High Bal QFA
2 8 2 8 2 8 26
6 1 458
34 4 3
4 .493 3.172 1 .321
10.6
6 . 8
0.G93 _ _
0.190 _ _ .. 1-
95.8 38
7.32 0.40 3.89 4.52 0 .31 0 .75 1 .50
18.69
81.31
11
Reduced RU b RL
OFA
2 8 2 8
3 3
62 454
31 40
4 , 3 1 6 2.529 1 , 1 8 7
58.6
6 . 5
0.480 _ _
1.558 0.966 0.592
62.0 63.9
46
6 .85 0.48 3.85 3.60 1 . 5 5 0 . 7 3 1 . 5 0
18.56
81.44
KVB 15900-531
40
Test 6 had the lowest p a r t i c u l a t e loading of any test run a t this
s i te and i t i s no t understood-why t h i s w a s t h e ' c a s e . ' I t is suspected t h a t
.high excess a i r played a par t . The o v e r f i r e air s e t t i n g s during test 6Jwere
the normal day-to-day opera t ing s e t t i n g s f o r this u n i t .
5.1.3 N i t r i c Oxide vs Overf i re A i r
The n i t r i c oxide da t a obtained a t Test S i t e E i nd ica t e s t h a t o v e r f i r e
a i r changes had l i t t l e or no e f f e c t on n i t r i c oxide emissions. The n i t r i c
oxide da t a are presented i n Table 5-3.
An e f f o r t w a s made to s o r t o u t the effects of d i f f e r i n g oxygen levels on n i t r i c oxide emissions so t h a t o v e r f i r e a i r s e t t i n g would be the only
var iab le .
i n t h e load range of i n t e r e s t . Linear regress ion by least squares was used
to do this. The s lope of t h i s l i n e w a s then used t o c o r r e c t the n i t r i c oxide
da t a t o a constant 9% 02.
This w a s accomplished by f i r s t f i t t i n g a l i n e to the NO vs O2 data
Having corrected 5or the e f f e c t s of oxygen, the da ta compared as
follows: T e s t s 10b and 10d were c a r r i e d o u t under i d e n t i c a l condi t ions,
except f o r the b i a s ing of the ove r f i r e a i r pressure to the lower and upper
rear rows of a i r j e t s . I n these two tests NO changed from 0.582 t o 0.592
lbs/106 Btu corrected, an i n s i g n i f i c a n t change.
T e s t s 8 and 11 were c a r r i e d out under i d e n t i c a l condi t ions, except
that test 8 had high pressure t o both rear r o w s of a i r je ts and test 11 had
low pressure t o the same rows. I n these two tests NO changed from 0.552 t o
0.548 lbs/106 Btu cor rec ted , again an i n s i g n i f i c a n t change.
5.1.4
B o i l e r e f f i c i ency d a t a f o r the o v e r f i r e air tests are shown i n Table 5-2
B o i l e r Eff ic iency vs Overf i re A i r
-
I I I I I 1 I I I I I I I 1 I I I I
Because o v e r f i r e a i r changes would be expected t o e f f e c t pr imari ly the combustibles-
in - f lyash hea t l o s s , these da t a a re presented i n Table 5-4.
due to combustibles i n the f lyash occurred during tes t 11, which had high over-
f i re air pressures on the f r o n t jets and low p res su res on t h e rear jets. There
is no evidence that ove r f i r e s e t t i n g s were responsible f o r t h e l o w combustible
hea t loss.
The lowest hea t loss
4 1 KVB 15900-531

I I I I I I I I I I I I I I I I I I I
Test No.
6
7
8
lob
10d
11
- Coal
Kentucky
Kentucky
Kentucky
Kentucky
Kentucky
Kentucky
-
TABLe 5-3
NITRIC OXIDE EMISSIONS v s OVERFIRE A I R TEST SITE E
6 Load O2 Overfire Air Pressure, "Hg Nitr i c Oxide, l b / l O Btu
% % RU E Measured Corrected* FU 5 - - -- 865 9.0 28 31 3 19 .614 .614
(663 .5...2 28 19 28 19 .494 .597
.61 .6..,8 28 28 .28 26 .493 .552
:61 7 .6 31 ND 3 29 .544 . 5 82
61 8..2 31 ND , 31 9 .570 .,592
62 6 . 5 28 28 3 3 .480 .548
* Corrected..to 9% 0 by applying the e s t a b l i s h e d 0 2 - N 0 r e l a t i o n s h i p : 1% 0 increase '= 8.027 lbs/lO Btu Nitric Oxide increase .
.2
:front upper FL 'front lower .RU 'rear upper RI. rear .lower -m.-- .no data
KVB 15900-531
42
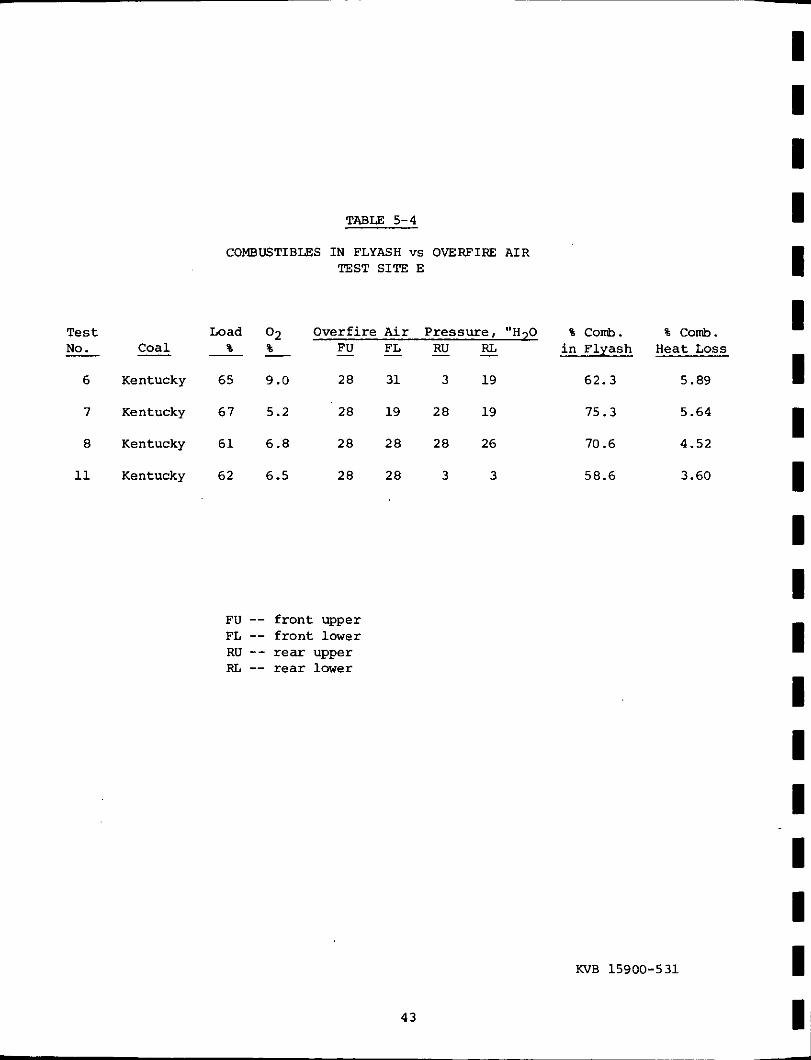
TABLE 5-4
COMBUSTIBLES IN FLYASH vs OVERFIFE AIR TEST SITE E
T e s t Load 02 Overfire A i r Pressure, “ H 7 0 % Corb. % comb.
6 Kentucky 65 9.0 28 31 3 19 62.3 5.89
% % - FU - FL - RU - RL i n Flyash Heat Loss - - Coal - NO. -
7 Kentucky 67 5.2 28 19 28 19 75.3 5.64
8 Kentucky 61 6.8 28 28 28 26 70.6 4.52
11 Kentucky 62 6.5 28 28 3 3 58.6 3.60
FU -- front upper FL -- f ront lower RU -- rear upper RL -- rear lower
KVB 15900-531
43
I I I I I I I I I I I I I I I I I I I

I I I I I I I I I I I I I I I I I I I
5.2 EXCXSS OXYGEN AND GRATE HEAT RELEASE
The b o i l e r a t Test S i t e E was t e s t e d f o r emissions and b o i l e r effiCienCY
under a va r i e ty of operat ing conditions. This sec t ion presents the results of
these emissions and e f f i c i ency t e s t s as a funct ion of load, expressed a s grate
hea t r e l ease , and excess a i r , expressed as percent oxygen i n t he f lue gas. The
data a re a l s o d i f f e r e n t i a t e d by coal type i n many of the p l o t s .
Before examining the test da ta it i s important to understand the
spec ia l nature of the combustion a i r on t h i s b o i l e r , and cor rec t ions t h a t have
been made t o the steam flow readings.
The b o i l e r a t Test S i t e E was recent ly r e t r o f i t t e d with a new combustion
a i r system. This system, which uses p a i n t oven exhaust gasses f o r combustion
a i r , has reduced the steam capaci ty of the b o i l e r by about 30% o r 55,000 lbs
stmhr.
obtainable load, b u t were l imi t ed by fan capaci ty t o the range 110-125 thousand
pounds of steam per hour.
The majori ty of t e s t s a t t h i s test s i t e were run a t the maximum
I t is a l s o worth not ing t h a t the p a i n t oven exhaust gasses contained
varying amounts of oxygen i n the range 14.5 - 20.5% 02.
oxygen l e v e l s a r e included i n the Emission Data Sunnnary, Table 2-1.
These combustion a i r
During th ree tests -- t e s t s 3, 9 , 20 -- the b o i l e r was operated on
ambient air. These t e s t s a r e i d e n t i f i e d i n the p l o t s by the use of s o l i d
r a t h e r than open s y ~ o l s . The same load r e s t r i c t i o n was experienced when
using ambient air as w a s experienced when using p a i n t oven exhaust gasses .
The same r e t r o f i t FD fan was used i n both cases.
The steam f l o w and percent b o i l e r loading da ta reported here in have
been corrected f o r a c a l i b r a t i o n e r r o r i n the steam flow i n t e g r a t o r . The
steam flow i n t e g r a t o r w a s found t o be 20,000 lb s /h r low by a Hays repairman
Subsequent t o the t e s t program a t s i t e E. Consequently, a l l measured steam
flows have been corrected upwards by 20% t o compensate fo r the e r r o r .
5.2.1 Excess Oxygen Operating Levels
Figure 5-3 depicts the various condi t ions of grate heat r e l ease and
KVB 15900-531
44

8- 2
z w >; c3 8-
l i
x 0 .
0
/ / / / I I I I I
300.0 400.0 500.0 690.0 700.0
GRRTE HERT RELERSE 1000 BTU/HR SQFT
0 : KENTUCKY + : aRlSHEO KY A : ERST KENT. : AMBIENT A I R TESTS
FIG. 5-3 OXYGEN VS. GRFlTE HERT RELERSE TEST S I T E E
15900-531
4 5
I I I I I I I I I I I I I I I I I I I
~
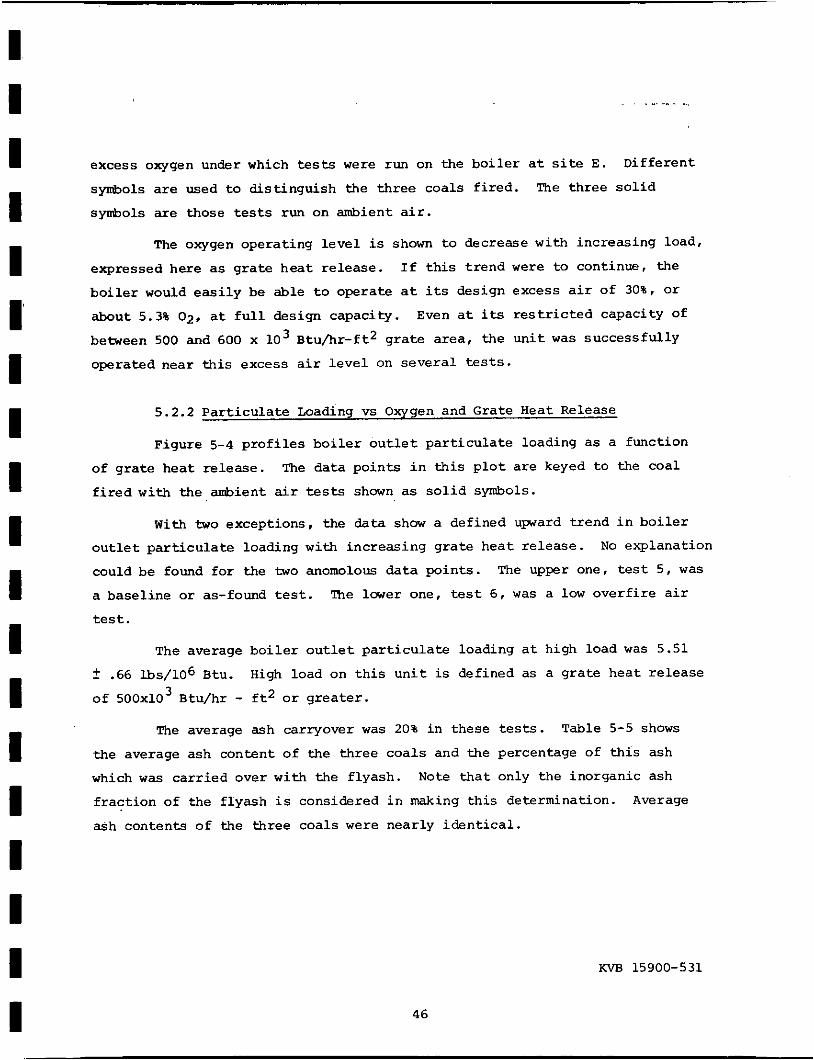
I I I I I I 1 I I I I I I I I I I I I
. . , -. _. . ..
excess oxygen under which t e s t s were run on the b o i l e r a t s i t e E .
symbols a r e used t o d is t inguish the three coals f i r e d .
synbols a re those tests run on ambient a i r .
Different
The three s o l i d
The oxygen operat ing l eve l is shown t o decrease with increasing load,
expressed here as gra te hea t re lease . I f t h i s t rend were t o continue, the
b o i l e r would e a s i l y be able t o operate a t i t s design excess a i r of 30%. o r
about 5.3% 02, a t f u l l design capaci ty .
between 500 and 600 x 10
operated near t h i s excess a i r l e v e l on seve ra l t e s t s .
Even a t its r e s t r i c t e d capacity Of
3 B tu /h r - f t2 g ra t e a rea , the u n i t was successful ly
5.2.2 P a r t i c u l a t e Loading vs Oxygen and Grate Heat Release
Figure 5-4 p r o f i l e s b o i l e r o u t l e t p a r t i c u l a t e loading a s a function
of g ra t e heat re lease .
f i r e d with the ambient air t e s t s shown a s s o l i d symbols.
The data poin ts i n t h i s p l o t a r e keyed t o the coal
W i t h two exceptions, the data show a defined uprard t rend i n b o i l e r
o u t l e t p a r t i c u l a t e loading with increasing gra te hea t r e l ease .
could be found f o r the two anomolous da ta po in t s . The upper one, t e s t 5 , was
a basel ine o r as-found t e s t . The lower one, test 6 , was a low over f i r e a i r
t e s t .
No explanation
The average b o i l e r o u t l e t p a r t i c u l a t e loading a t high load was 5.51
f .66 lbs/106 Btu.
of 500x10
High load on t h i s u n i t is defined as a gra te hea t re lease 3 Btu/hr - f t 2 o r g r e a t e r .
The average ash carryover was 20% i n these t e s t s . Table 5-5 shows
the average ash content of the three coa l s and the percentage of t h i s ash
which w a s c a r r i ed over with the f lyash . Note t h a t only the inorganic ash
f r a c t i o n of the f lyash i s considered i n making t h i s determination.
ash contents of the three coa ls were nearly i d e n t i c a l .
Average
KVB 15900-531
46
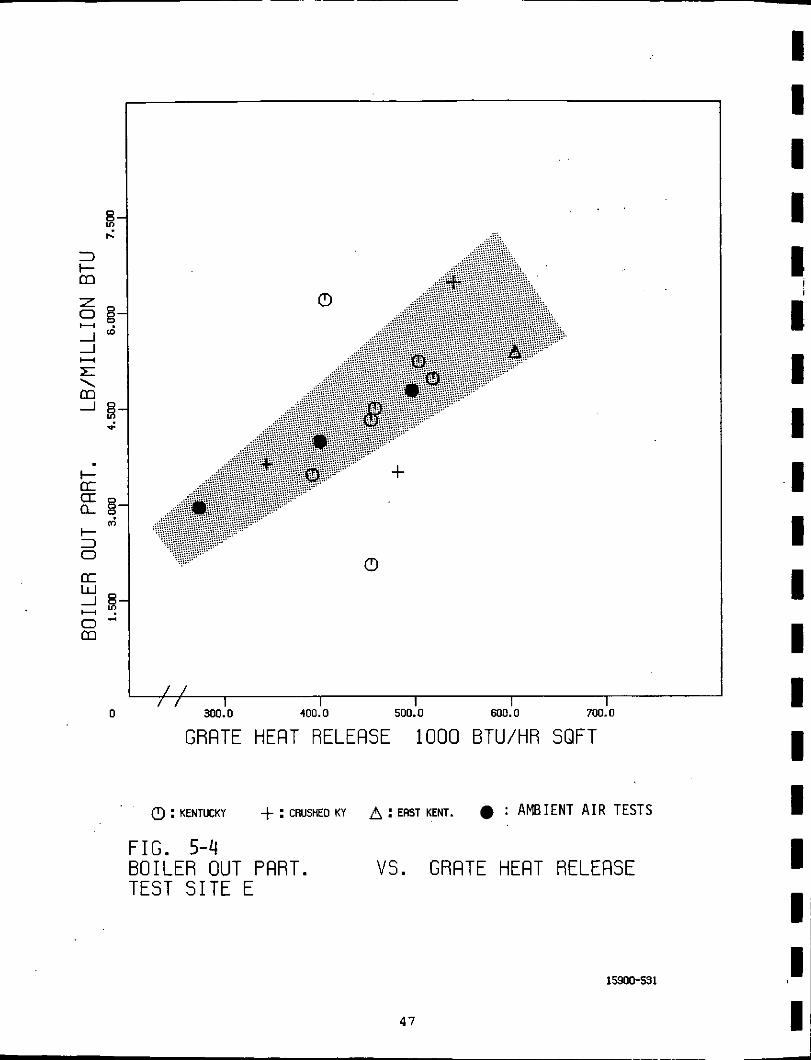
3 I- m
I- K
E E- 6
I- 3 0
K W
0 "
-l ;- m H .
0
/ / / / I I I I I
300.0 400.0 500.0 600.0 700.0
GRRTE HERT RELERSE 1000 BTU/HR SQFT
0 : KENTUCKY + : CRUSHED KY A : ERST KENT. : AMBIENT A I R TESTS
F I G . 5-4 BOILER OUT PFIRT. TEST S I T E E
VS. GRRTE HERT RELEASE
15900-531
4 1
I I I I 1 I
i I I I I I I I I I I I ,I I -

I I I I 1 I I I I I I I
I I I I I I
I ! \
Coal -
TABLE 5-5
ASH CARRYOVER VS COAL TYPE
TEST SITE E
Average Ash Average Ash Content of Coal, Content of Flyash, Average Ash lbs/106 Btu lbs/106 Btu Carryover, %
Kentucky 6.78 1.34 1 9 . 7
Crushed Kentucky 6.80
Eastern Kentucky 6.39
1.45 21.3
2.14 33.4
P a r t i c u l a t e measurements were made a t the o u t l e t of the multiclone dust
co l l ec to r simultaneously w i t h the measurements made a t the b o i l e r o u t l e t .
Figure 5-5 p l o t s the multiclone o u t l e t . p a r t i c u l a t e loadings as a funct ion of
g ra t e hea t r e l ease . Again the data p o i n t s a r e keyed t o coal type and the
ambient a i r t e s t s a r e ind ica ted by s o l i d symbols. The data show a general
upvard t rend i n p a r t i c u l a t e loading w i t h increas ing g ra t e h e a t r e l ease .
The p a r t i c u l a t e loadings a r e very s c a t t e r e d a t the multiclone o u t l e t .
I t is suspected t h a t the multiclone dus t c o l l e c t o r hopper was f i l l e d to
capacity during seve ra l t e s t s r e s u l t i n g i n re intrainment of the ash and a
lowered c o l l e c t i o n e f f i c i ency . Multiclone co l l ec t ion e f f ic iency w i l l be
discussed i n s e c t i o n 5.5.
A t both the b o i l e r o u t l e t and the multiclone d u s t c o l l e c t o r o u t l e t , the
ambient a i r p a r t i c u l a t e test data were no d i f f e r e n t than the data from t e s t s
run on p a i n t oven exhaust gasses. Therefore, it is concluded t h a t t h i s unique
r e t r o f i t t o the b o i l e r a t s i t e E has no impact on p a r t i c u l a t e emission l eve l s .
5.2.3 Stack Opacity vs Oxygen and Grate Heat Release
Stack opac i ty was measured during most t e s t s by a transmissometer
mounted between the multiclone o u t l e t and the i n l e t t o the induced d r a f t fan.
KVB 15900-531
48

ui 3 I- m z 0 - 8- 4.i H
\ m _I
L n i . 8- a a L
I-
2 8. ri w
z 0
0 I
700.0
GRATE HEFlT RELERSE 1000 BTU/HR SQFT
0 : KENTUCKY + : CRUSHED KY A : ERST KENT. : AMBIENT A I R TESTS
FIG. 5-5 MULTICLONE OUT PART. VS. GRRTE HERT RELERSE TEST S I T E E
15900-531
49
I' I I I I I I I 1 I I I I I

1 1 1 I 1 I I I I I I I I 1 I I I I I
I t became apparent
were inc reas ing with t i m e as the l i g h t source and l i g h t r ece ive r g l a s ses
became covered with dus t o r soot . Thus beginning wi th test no. 5 , the
s i g h t g l a s ses were cleaned p r i o r to each opac i ty reading.
during the course o f t e s t i n g t h a t the opaci ty readings
Figure 5-6 presents the opac i ty readings taken a t s i t e E as a
function of g r a t e hea t re lease .
t rend i n opaci ty data versus load. This p l o t a l s o shows that the re may be
sow c o r r e l a t i o n of opac i ty with coa l type, b u t t he re is i n s u f f i c i e n t da t a
t o subs t an t i a t e t h i s specula t ion .
This p l o t shows t h a t t he re is no obvious
A b e t t e r c o r r e l a t i o n i s obtained by p l o t t i n g opac i ty aga ins t multi-
clone o u t l e t p a r t i c u l a t e s as shovn i n Figure 5-7. This p l o t again ind ica t e s
t h a t changes i n coal composition and combustion a i r flow were not f ac to r s i n
opaci ty l e v e l .
5.2.4 N i t r i c Oxide vs Oxygen and Grate Heat Release
N i t r i c oxide (NO) concentrat ion w a s measured during each test i n u n i t s 6 of parts per mi l l ion (ppm). I t i s presented here i n un i t s of lbs/lO Btu t o
be more e a s i l y compared wi th e x i s t i n g and proposed emission s tandards.
N i t r i c oxide i s p l o t t e d as a funct ion of gra te hea t r e l ease i n Figure
5-8. The da ta poin ts i n t h i s f i gu re are keyed to coal being f i r e d , while the
th ree ambient a i r tests are indica ted by s o l i d symbols.
oxide concentrat ion a t high b o i l e r loading (above 5O0X1O3 Btu/hr-Ft2) w a s
0.533 f 0.047 lbs/106 Btu.
and therefore , the t rend shown is f o r NO versus g r a t e hea t release under
normal opera t ing condi t ions. Ignoring the th ree ambient a i r tests, n i t r i c
oxide concentrat ion i s seen t o be h ighes t a t low loads on t h i s un i t . The
maximum measured No w a s 0.65 lbs/106 Btu a t a load of 48% design capaci ty .
The anbient a i r tests produced n i t r i c oxide concentrations which were general ly
lover than the t e s t s u t i l i z i n g p a i n t oven exhaust gasses as combustion a i r .
lhis was e spec ia l ly ev ident i n the two lower load tests.
The average n i t r i c
Figure 5-8 does n o t i s o l a t e the va r i ab le oxygen,
KVE 15900-531
50

8- si
8- $ c z
W 0 a W a 8-
r6
8. - i 0 U [L 0
Y 0
I- m a i
0
+
+
0
0
0
a + 0 . A
0
A
0
0 0
0
0
/ / / / I I I I I
300.0 400.0 500.0 600.0 700.0
GRRTE HERT RELERSE 1000 BTU/HR SQFT
0 : KENTUCKY + : CRLlSHED KY A : EAST KENT. : AMBIENT A I R TESTS
FIG. 5-6 STRCK OPRCITY VS. GRRTE HERT RELERSE TEST S I T E E
15900-531
51
I I I I I I
I I I I I I 1 I 1 1 I I I I
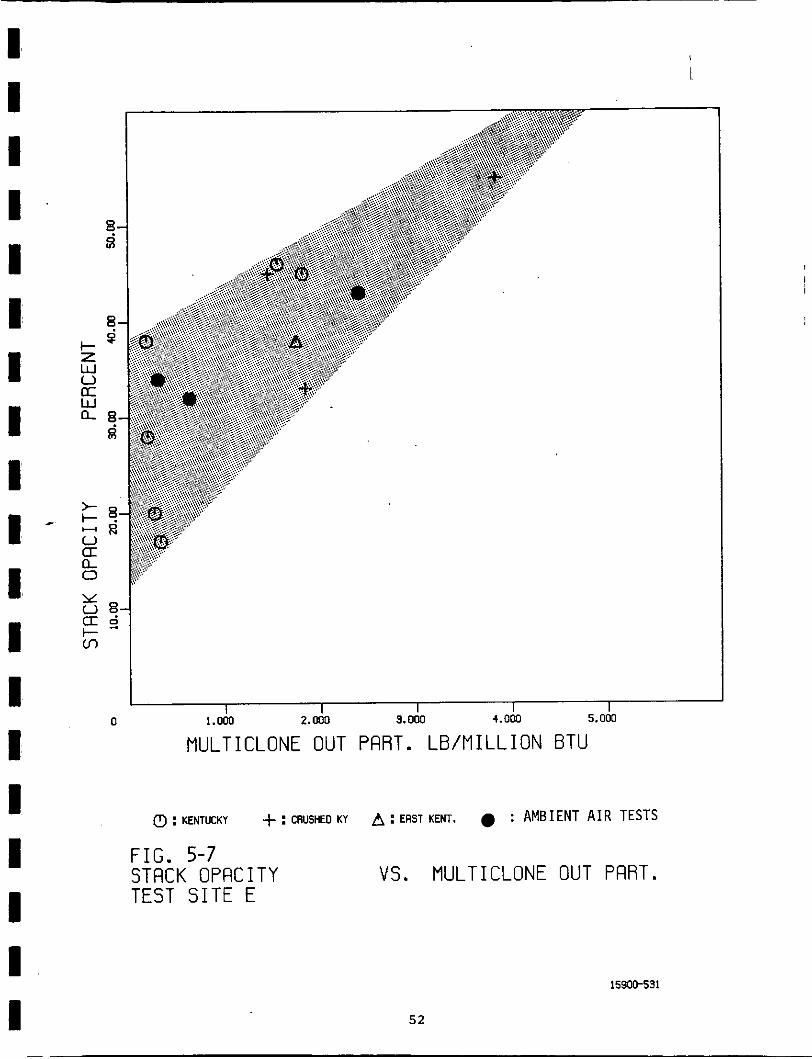
Y
I- v,
0 8- a:
I I I I I 0 1.ow 2.m 3.000 4.OOD 5.000
MULTICLONE OUT PFIRT. L B / M I L L I O N BTU
i
0 : KENTUCKY + : CRUSHED KY A : ERST KENT. : AMBIENT A I R TESTS
F I G . 5-7 STACK OPACITY VS. MULTICLONE OUT PFIRT. TEST S I T E E
15900-531
52
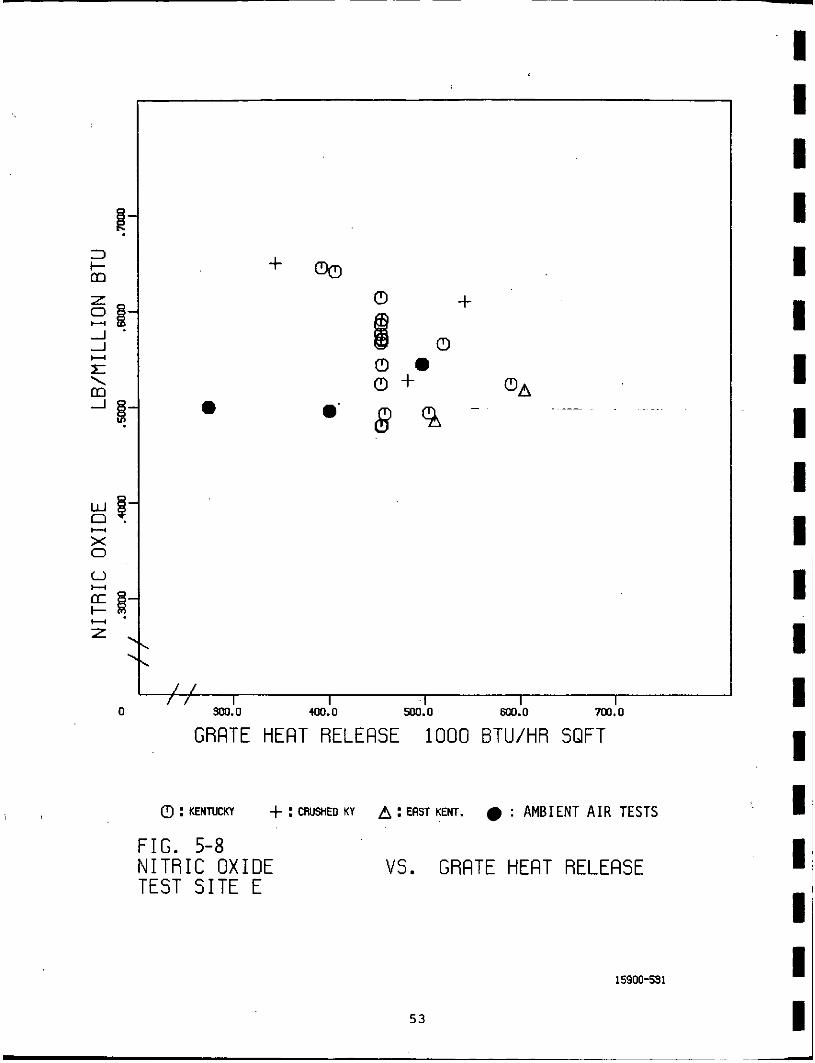
3 I- m
Y
X 0
z
0
+ %
0 0'
0 + 0
/ / / / I I I I I
300.0 400.0 500.0 600.0 7Cll .O
GRATE HERT RELEASE 1000 BTU/HR SQFT
a : KENTUUCl + : WWED KY A : EAST KENT. : AMBIENT A I R TESTS
FIG. 5-8 N I T R I C OXIDE TEST S I T E E
VS. GRATE HEAT RELEASE
15900-531
53
I I I I I I I 1 I I I 1 1 1 I I I I I -

I I I I 1 I I I I I I I I I I I I I I
Nitr ic oxide concentrat ion w a s found t o inc rease sharply with oxygen a t con-
s t a n t b o i l e r load. There a r e a few d a t a po in t s which cannot be explained,
but on t h e whole, the d a t a gives a good NO M O2 p r o f i l e f o r t h e b o i l e r a t
S i t e E. A l l the NO d a t a are p l o t t e d a g a i n s t oxygen i n Figure 5-9, and the
NO da t a i n s p e c i f i c g r a t e hea t release ranges are p l o t t e d aga ins t 0 2 i n
Figures 5-10, 5-11 and 5-12.
A n i t r i c oxide t r end l i n e has been appl ied to the data i n Figures
5-11 and 5-12 using l i n e a r regress ion ana lys i s by method of l eas t squares.
The slope of these two t rend l i n e s ind ica t e s t h e follawing r e l a t ionsh ips .
N i t r i c oxide increases by .027 lbs/106 Btu f o r each one percent increase i n
oxygen a t 4 0 0 - 4 9 9 ~ 1 0 ~ Btu/hr-f t2’ g ra t e a rea . N i t r i c oxide increases by .037
lbs/106 Btu f o r each one percent i nc rease i n oxygen a t 500-605x10) B t u / h r - f t
g ra t e a rea .
2
Combining the t r end l i n e s f o r the t w o main g r a t e h e a t r e l ease ranges
produces t h e p l o t shown i n Figure 5-13. The l o w load da ta , i .e . , 300-399
GHR, w a s n o t included i n t h i s p l o t .
t h e expected r e l a t ionsh ip , t h e two low load data poin ts should be considered
Because of their extreme variance from
suspect .
5.2.5
Carbon monoxide (CO) w a s measured during the f i r s t seven tests a t
Carbon Monoxide vs Oxygen and Grate Heat Release
S i t e E .
o u t of service f o r the remainder of the t e s t i n g a t t h i s s i t e .
Ihe CO analyzer w a s inoperat ive a t the s t a r t o f Test 8 and remained
The CO d a t a are presented i n u n i t s of parts-per-mill ion (ppm) by
volume on a dry b a s i s , cor rec ted t o 3% 02.
of incomplete conhustion and a s e n s i t i v e i n d i c a t o r of combustion problems,
but i f it is kept below 400 ppm it is considered i n s i g n i f i c a n t f o r the
purposes of t h i s report.
0.04% CO and represents a 0.20% h e a t l o s s i n a coa l f i r e d b o i l e r operat ing
a t 8% 0 2 .
va r i e ty of f i r i n g condi t ions and p l o t t e d as a funct ion of g ra t e h e a t r e l e a s e .
Carbon monoxide i s a by-product
AS a reference, 400 ppm CO is equiva len t t o
Figure 5-14 presents t h e carbon monoxide da ta gathered under a
KVB 15900-531
54

A
A Do Of??
0 4.00 6.00
OXYGEN
0 : 200-39SWR 0 : 400-499WR
FIG. 5-9 N I T R I C OXIDE TEST S I T E E
8.00 10.00 12.00
PERCENT, DRY
A : 500599cHR + : AMBIENT A I R TESTS
VS. OXYGEN
15900-531
55
- I 1 I I I I I I I I I 1 1 1 I I I I I ~-

I I I
3 I- m
H
x 0
0
0 r3
/ / / / I I I I I 4.00 6.00 6.00 10.00 12.00
OXYGEN PERCENT. DRY
6: MO-399GHR : AMBIENT AIR TEST
FIG. 5-10 NITRIC OXIDE TEST SITE E
VS. OXYGEN
15900-531
56

3 I- m
/ / / / I I I I
4.m 6.00 8.00 10.00 12.00 I
0
OXYGEN PERCENT, DRY
0 : 400-499GHR : AMBIENT AIR TESTS
FIG. 5-11 NITRIC OXIDE VS. OXYGEN TEST SITE E
15900-531
5 7
-1 ' -I W
Y
X 0
0 CI
E i CI
z
I I I I I I I I I I I I I I I I I I I

4. w
X 0
n -
0
F I G . 5-12 N I T R I C OXIDE TEST S I T E E
A
A
/ / / / I I I I I 4.00 6.M 8.00 10.00 12.00
OXYGEN PERCENT, DRY
VS. OXYGEN
15900-531
58

I I
.65
.60
2
3 8
m a 0 rl \
. .55
H X 0
E 0: B
.50
.45
/
/
I
500-599 GHR -
400-499 GHR
I I I I I 4 6 8 ' 10
/ OXYGEN, PERCENT
FIGURE 5-13. Trend i n N i t r i c Oxide E m i s s i o n s as a Function of G r a t e Heat Release (GHR) and Oxygen a t S i t e E.
KVB 15900-531
59
I I t i
1: I I I I I I I I I I I I I
-
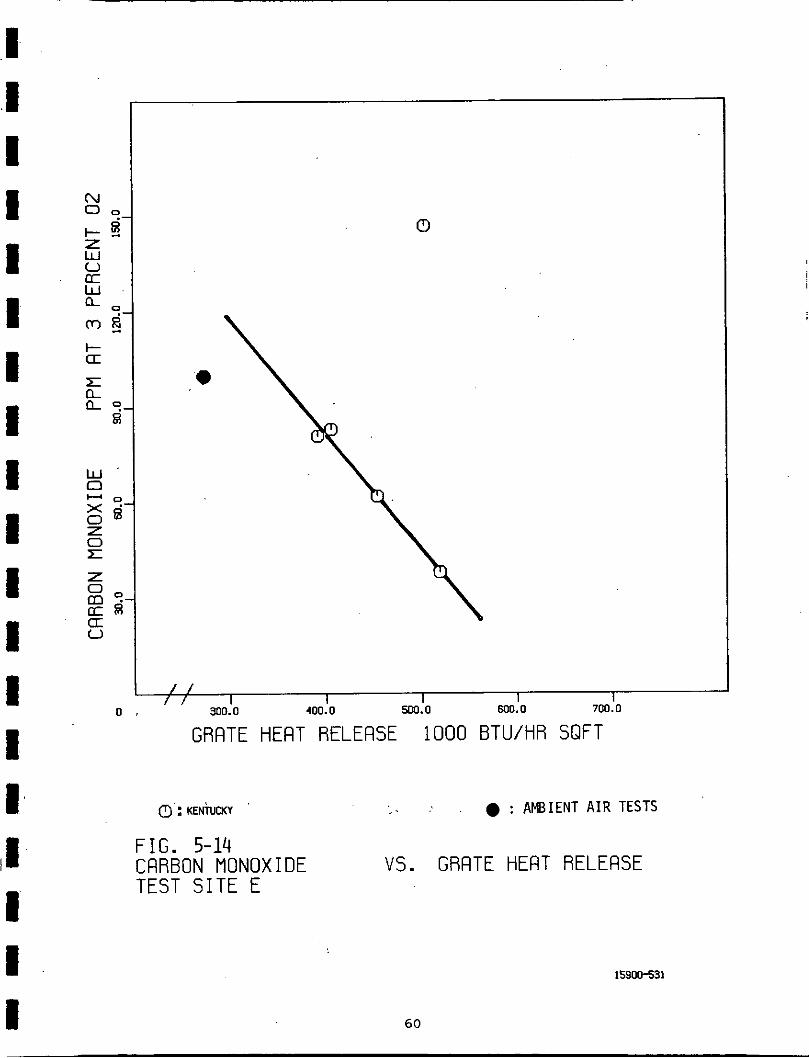
I I
l- a
/ / / / I I I I I
GRRTE HERT RELERSE 1000 BTU/HR SQFT
0': KEN~UCXY I. : AMBIENT A I R TESTS
I G . 5-14 RRBON MONOXIDE VS. GRRTE HERT RELERSE EST S I T E E
15900531
60

With one except ion t h e t r end shows decreasing CO with increas ing g r a t e h e a t
re lease .
concentrat ions w e r e low, and i n s i g n i f i c a n t i n terms of t h e i r cont r ibu t ion .
t o incomplete combustion and hea t loss.
The one except ion w a s Test 7, a l o w O2 tes t . A l l measured CO
Figure 5-15 p resen t s the measured carbon monoxide da ta as a funct ion
There a r e only weak ind ica t ions o f a t rend here . The h ighes t CO of oxygen.
concentrat ion measured w a s a l s o a t t h e lowest oxygen l eve l .
5.2.6 Combustibles vs Oxygen and Grate Heat Release
I n t h i s r e p o r t the term "combustibles" r e f e r s only t o the s o l i d corn
b u s t i b l e s i n the var ious ashes leaving t h e b o i l e r . Combustibles a r e described
here i n terms of t h e i r percent 'by weight i n t h e f lyash-at t h e b o i l e r o u t l e t
and i n the bottom ash co l l ec t ed from the ash p i t .
Figure 5-16 shows the combustibles i n t h e b o i l e r o u t l e t f lyash a s a
The da ta p o i n t s a r e keyed t o coa l , and the funct ion of g r a t e h e a t release.
s o l i d symbols r e f e r to ambient a i r t e s t s .
from 50 t o 84% on t h e spreader s toke r , and averaged 66% o v e r a l l . They
accounted f o r an average 4.40?0.89% hea t loss.
f lyash combustible l e v e l s which were i n the same general range. I t i s a l s o
evident t h a t the ambient a i r t e s t s produced f lyash combustibles i n the same
range a s the p a i n t oven exhaust gas tests. The f lyash combustible l e v e l
showed an increas ing t rend with g ra t e h e a t r e l e a s e .
Figure 5-17 shows t h e combustibles i n the bottom ash a s a funct ion of
Bo i l e r o u t l e t combustibles ranged
A l l t h r ee coals produced
g r a t e hea t r e l ease . The bottom ash combustibles ranged from 6 t o 17% by
weight and averaged 10% overall. They accounted f o r an average 0.87-0.41%
hea t loss. Var ia t ions i n coa l and combustion a i r composition d i d not s ig-
n i f i c a n t l y a f f e c t bottom ash combustible l e v e l s .
+
5.2.7 B o i l e r Eff ic iency vs Oxygen and Grate Heat Release
Boi le r e f f i c i e n c y w a s determined f o r each test t h a t included a b o i l e r
o u t l e t p a r t i c u l a t e loading measurement. The e f f i c i ency determinations were
made by the ASTM h e a t loss method.
KVB 15900-531
6 1
I 1 I I I I I I I I I I I I I I I I 1

I
I I I
E L L 9 .
g
w 0 CI g ;- z 0 E
0
0
0
0
0
0
0
/ / / / I I I I I
4.00 6.00 8.00 10.00 12.00
OXYGEN
0 : KENTUCKY + : CEUSHED KY
F I G . '5-15 cF~RBoN MONOXIDE TEST S I T E E
PERCENT, DRY
h :EAST KENT. : AMBIENT A I R TESTS
VS. OXYGEN
62
159DO-531

9 Sd
c
m E
9- s I- 3 0
CC W A ? U E i 0 m
I / / / / I 1 I I I
0 300.0 400.0 500.0 600.0 700.0
GRATE HEAT RELEASE 1000 BTU/HR SQFT
0 : KENTUCKY + : CRUSHED KY A : ERST KENT. : AMBIENT AIR TESTS
FIG. 5-16 BOILER OUT COMB. VS. GRATE HEAT RELEASE TEST S I T E E
6 3
15900-531
I I I I I I I I I I I I I 1 I I I I I

0
A a + 0 + % a h 0
/ / / I I I I I I
300.0 400.0 500.0 600.0 700.0
GRRTE HERT RELERSE 1000 BTWHR SQFT
FIG. 5-17 BOTTOM FISH COMB. TEST S I T E E
VS. GRRTE HERT RELERSE
15900-531 ..;
64

Figure 5-18 shows the calculated b o i l e r e f f i c i e n c i e s as a funct ion of
g r a t e h e a t r e l ease . Data poin ts are keyed t o the Coal being f i r e d , while the
a d i e n t a i r tests are shown as s o l i d symbols. A general downward t rend i s
seen here with b o i l e r e f f i c i ency dropping of f as g ra t e hea t r e l ease increases . 2 A t high load -- above 500x103Btu/hr-ft
e f f i c i ency w a s 79.88?1.48%.
g ra t e area -- the average b o i l e r
T a b l e 5-6 shows t h e average hea t losses f o r the three coals tes ted .
Kentucky and Crushed Kentucky coa ls gave almost i d e n t i c a l b o i l e r e f f i c i enc ie s .
This would be expected because they were from t h e same mine. East Kentucky
coal gave e f f i c i e n c i e s which averaged 2.5% lower than the o ther two coals .
The d i f fe rence appears i n two areas , dry gas loss (1.6%) and loss due to
combustibles i n refuse (0.9%). . -
TABLE 5-6
AVERAGE HEAT LOSSES BY COAL WPE
Boi le r Dry Moisture H20 From Coxrbustibles Radiation & Total Eff ic iency,
Coal - Gas i n Fuel H? i n Fuel i n Refuse Unmeasured Losses Percent
Kentucky 7.11 0.55 3.85 5.27 2.25 19.03 80.97
Crushed Kentucky 7.20 0.52 3.84 5.23 2.25 19.04 80.96
E a s t Kentucky 8.74 0.59 3.89 6.14 2 .17 21.53 78.47
5 .3 COAL PROPERTIES
Three coa ls were t e s t e d i n t h i s b o i l e r and a re described i n t h i s sec t ion .
?hey a re i d e n t i f i e d here and throughout t h i s r epor t as Kentucky coa l , Crushed
Kentucky coa l and E a s t Kentucky coal .
The Kentucky and E a s t Kentucky coa ls were from separa te mines, while
the Crushed Kentucky coal was a spec ia l ly s i z e d shipment of the Kentucky coa l .
KVB 15900-531
65
I I I I I I I I I I 1 I I 1 I I I I I
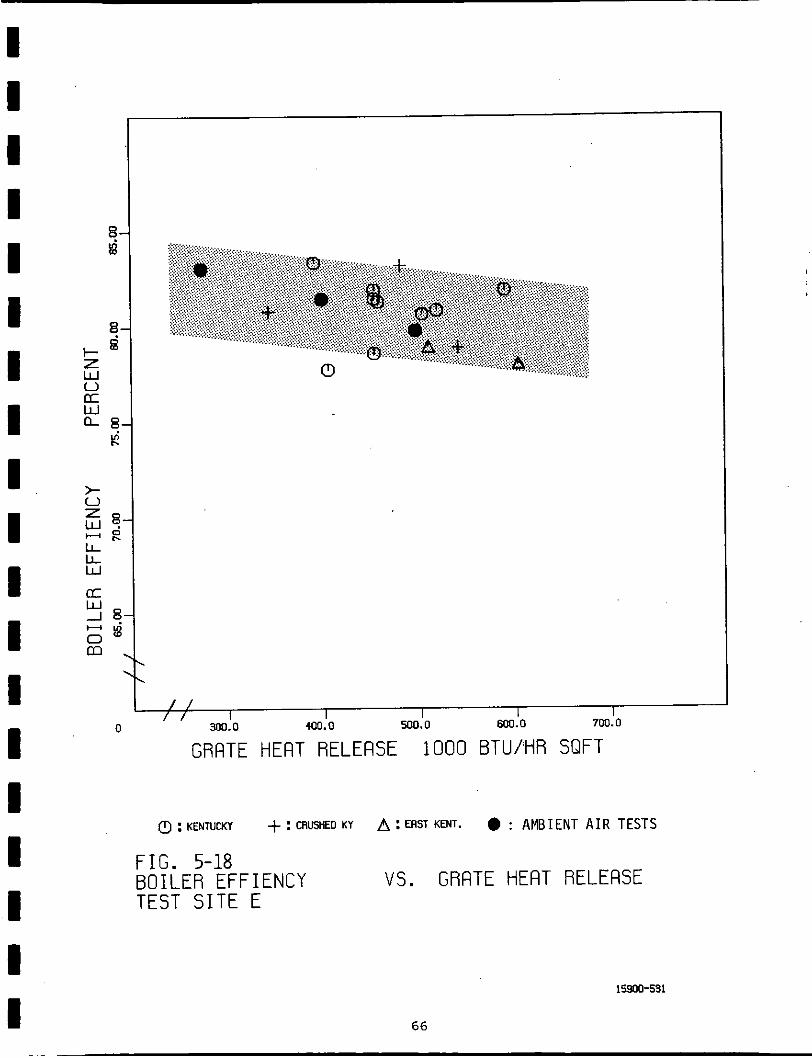
I I I I I I I I I I I I I I I I I I I
8- la
8- €i L
2 W 0 a W n- 8.
k
a
- k i m
w
0
0 7 c I I I I I
400.0 5CQ.O m.0 700.0 300.0
GRRTE HERT RELERSE 1000 BTU/HR SQFT
FIG. 5-18 BOILER EFFIENCY VS. GRRTE HERT RELERSE TEST S I T E E
15900-531
66

Representative coal samples w e r e taken from t h e u n i t s two coa l scales
during each test t h a t included e i t h e r a p a r t i c u l a t e measurement or SASS sample
catch.
A composite sample f o r each coa l w a s a l s o obtained. The composite sample con-
t a ined incremental coal samples from each tes t and was analyzed f o r ash fusion
temperature, Hardgrove g r i n d a b i l i t y index, f r e e swel l ing index, and minerals
i n t h e ash. This s e c t i o n w i l l summarize a l l t e s t r e s u l t s t h a t appear t o be
inf luenced by coal composition and w i l l d i s cuss coa l s i z e consistency and
s u l f u r balance da ta .
These samples w e r e analyzed f o r proximate ana lys i s and ul t imate ana lys i s .
5.3.1 Chemical Composition of the C o a l s
The most s i g n i f i c a n t proper t ies of t h e coa ls t e s t ed are presented i n - - ._
Tab le 5-7 on a hea t ing value b a s i s i n order t o allow f o r meaningful comparisons
between coa ls .
TABLE 5-7
COAL PROPERTIES CORRECTED TO A CONSTANT l o 6 BTU BASIS
Crushed E a s t Kentucky . Kentucky Kentucky
Coal C o a l C o a l
Moisture, 1bs/lO6Btu 4.8 4 .4 5.0
Ash, 1bs/lO6Btu 6.7 7 .1 6.5
Sul fur , lbs/106Btu 0.67 0.55 0.61
The chemical analyses of each c o a l sample a r e grouped by coal and
presented i n Tables 5-8, 5-9, 5-10, and 5-11. These Tables a l s o show t h e
average and s tandard devia t ion fo r each i t e m i n the ana lys i s . By comparing
these T a b l e s , it is evident t h a t a l l t h ree c o a l s were similar i n makeup.
The inf luence of c o a l p rope r t i e s on emissions and b o i l e r e f f i c i ency is
summarized i n T a b l e 5-12 with references to t h e r e l evan t f igu res . Each of these
r e l a t ionsh ips has been addressed elsewhere i n the r epor t b u t is reviewed here
f o r convenience.
KVB 15900-531
67
I I I I I I 1 I I I I I I I I 1 I I I

I I I I I I I I I I I I I I I I I I I 68
.-I m m I 0 0 m .-I
m

m m m r l N O m r l ~ r l o o m ~ m m rl P
+ + + + m o m a m a m m ~ o q w o o 0 0 0 0 . . . . . . . . P P P P - 4 0 - or- . . . . m .
N N N N
B 8 ~ m m q m o ~ m m r l o o m ~ m m rl P
m ~ r l r l q m m ~ ?“1 ‘4?- !?14 m o ~ r l o o o W
P rl
m m ~ - ‘ r l m e m O W P - N P P ~
~ g q r l o o m ~ . . . . . . . .
69
rl m m I 0 0
m ~ r l
m
9 x
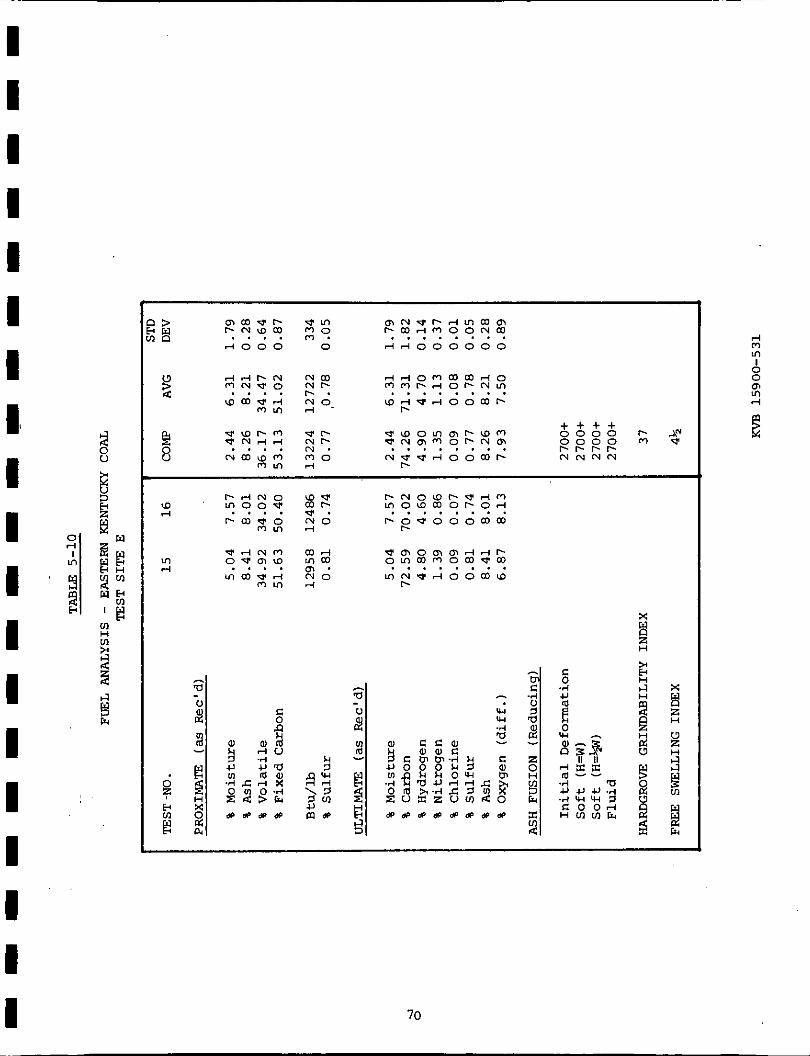
P I N O L D P . ~ ~ ~ ~ m o l ~ m o ~ q r l ~ . o ~ o o o m m
- m o m m d d ~ q q m m o m - ~ ? m N.G A o o m 10
. . . . . . P
. . . P
4
m I 0 0
m 4
m
m
70
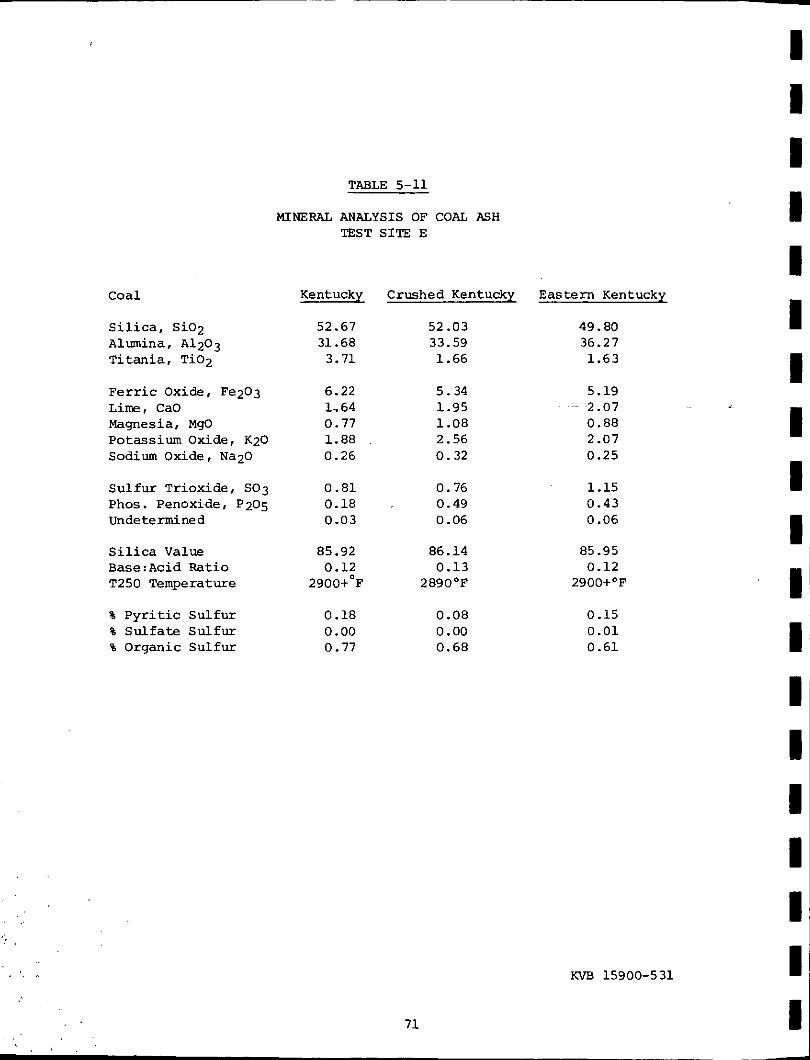
C o a l
S i l i c a , Si02 Alumina, A1203 T i t an ia , Ti02
F e r r i c O x i d e , Fe2O3 Lime, CaO Magnesia, MqO Potassium Oxide, K20 Sodium Oxide, N a 2 0
Su l fu r Trioxide, SO3 Phos . Penoxide, P2O5 U n d e t e h n e d
S i l i c a V a l u e B a s e : A c i d Ratio T250 Temperature
% P y r i t i c Sul fur % Sul fa t e Sul fur % Organic Sul fur
TABLE 5-11
MINERAL ANALYSIS OF COAL ASH TEST SITE E
Kentucky
52.67 31.68 3.71
6.22 1.. 64 0.77 1.88 0.26
0.81 0.18 0.03
85.92 0 .12
2900+'F
0.18 0.00 0.77
Crushed Kentucky
52.03 33.59 1.66
5.34 1.95 1.08 2.56 0.32
0.76 0.49 0.06
86.14 0.13
2890'F
0.08 0.00 0.68
E a s t e r n Kentucky
49.80 36.27 1.63
5.19 2.07 0.88 2.07 0.25
1.15 0.43 0.06
85.95 0.12
2900+'F
0.15 0.01 0.61
I 1 I I I 1 I 1 I I
. . ,%
71
IWB 15900-531 I I

~-
I I! I I I I I I I I I I 'I I I I I I I
TABLE 5-12
RELATIONSHIP BEWEEN COALS FIRED AND EMISSIONS
I .
TEST SITE E
Figure Parameter NO. Relationship' to C o a l lype
1. EXCeSS O2 5- 3 2. Par t i cu la t e s (Boi ler Outlet) 5-4 3. Par t i cu la t e s (Multiclone Out le t ) 5-5
5. N i t r i c Oxide 5-8 4. Opacity 5-6
6. Carbon Monoxide 5-14 7. Combustibles (Boi ler Out le t Flyash) 5-16 8. Combustibles (Bot tom Ash) 5-17 9. Boi le r Eff ic iency 5-18
.O. Multiclone Eff ic iency 5-24
E a s t Ky coa l f i r e d a t highest 0 2 None Crushed Ky coal highest part. Crushed Ky coa l highest opaci ty Crushed Ky coal highest NO E a s t Ky coal lowest NO D a t a on Kentucky coal only East Ky coal lowest comb. None None None ,
.I . . ( " . : ' 5.3.2 Coal S ize Consistency ' . ,
' . ..I
' i
The individual coal samples and the composite coal samples were
screened a t the s i te using l", 1/2", 1/4", #8 and #16 square mesh screens. The . r e s u l t s of these screenings are presented i n Tab le 5-13. The average coal s i z e ; . , i consistency and s tandard deviat ion f o r each of the three coa ls w e r e determined
and are p lo t t ed aga ins t the ABMA recommended l i m i t s fo r spreader s tokers i n
Figures 5-19, 5-20 and 5-21.
. . ,
. . ,
" 1 . . The spec ia l ly s ized Crushed Kentucky coa l , which had been ordered for
test purposes, turned o u t to be nearly i d e n t i c a l t o the Kentucky coal that ' was not spec ia l ly s ized. This unfortunate occurrence eliminated coal s i z e . ,
consistency a s one of the var iab les a t t h i s test site.
. !
, ' ! ,
A l l three coa ls f e l l wi th in the ABMA recommended l i m i t s f o r coa l
s i z ing . The Kentucky and Crushed Kentucky coals f a l l i n the center of the
ABMA recommended l i m i t s while the E a s t Kentucky coal i s on the high f ines
s ide . Using the general ly accepted d e f i n i t i o n of coal f i nes -- percent by
KVB 15900-531
72

1
Average
T e s t NO.
91.5 63.7 36.8 18.8 11.0
02 0 3 04 05 06 07 0 8 09 11 17 20
composi
12 13 14
C o m p o s i t e * Average
TABLE 5-13
AS FIFED COAL SIZE CONSISTENCY TEST SITE E
97.8 61.4 30.4 13.7 8.5 91.5 54.3 29 .O 15.2 10.3 88.5 56.0 32.6 16.2 10.3 95.7 57.1 30.3 14.2 8.5
92.6 57.2 30.7 15.0 9 .7
PERCENT PASSING STATED SCREEN SIZX 1" 1/2" 1/4" #8 #16
15 16
Composite*
Average
93.2 51.9 20.6 8.9 4.8 95.6 66.1 36.9 19.1 11.6 96.8 65.9 29.5 12.7 7.5 95.1 77.0 54.6 31.7 17.2 86.6 56.7 33.8 19.1 12.7 89.. 5 65.1 33.9 15.3 9.8 87.9 57.0 34.3 18.4 12.2 85.3 62.0 37.4 19.2 12.2 90.4 59 .O 31.4 16.0 10.7 93.0 66.1 40.2 20.6 12.4 93.4 73.5 52.0 26.2 9.7 90.6 . 61.7 35.2 18.5 12.3
~.
85.7 60.8 40.6 21.7 13.5 89.4 63.9 41.5 22.8 13.5 94.9 73.8 49.5 27.5 16.8
87.6 62.4 41.1 22.3 13.5
*The composite sample cons i s t s of one i n c r e m e n t a l coal sample f r o m each test on a given coal . I t is n o t included i n the average.
1 I I I I I I I I I 1 1: I I I I I I -
KVB 15900-531

I I I I I I I I I I I I I I I
95
80
50
30
20
10
4
50# 16# 8# 1/4" 1/2" 1" 2" ,
SIEVE SIZE DESIGNATION
I I I
Figure 5-19. S i z e Consistency of "As Fired" Kentucky Coal vs ABMA Recommended S i z i n g for Spreader S tokers .
KVB 15900-531
74
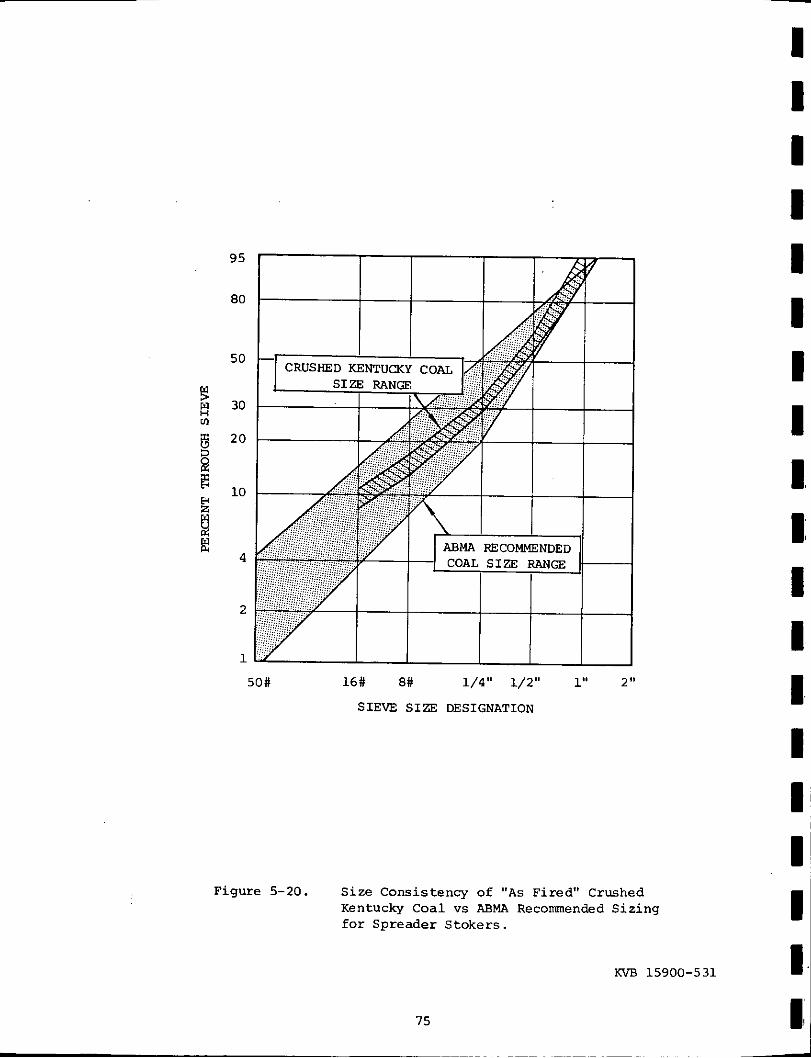
95
80
50
30
20
10
4
2
1
50# 16# 8# 1/4" 1/2" 1" 2 "
SIEVE SIZE DESIGNATION
Figure 5-20. S ize Consistency of "As Fired" Crushed Kentucky Coal vs ABMA Recommended Sizing for Spreader Stokers .
KVB 15900-531
75

I I I I I I I I 1 I I I I I I I I I
95
EO
50
2
I
50# 16# E# 1/4" 1/2" 1" 2"
SIEVE SIZE DESIGNATION
Figure 5-21. S i z e Consistency of "As Fired" Eastern Kentucky Coal vs ABMA Recommended S iz ing for Spreader S tokers .
KVB 15900-531
16

weight passing a 1/4" square mesh screen -- the percent f i nes i n the three
coa ls w a s : Kentucky coa l - 37*10%, Crushed Kentucky coa l - 3 1 h , Eas t
Kentucky Coal - 41+1%.
5.3.3 Su l fu r Balance
Sul fur oxides -- SO2 and SO3 -- were measured i n the f l u e gas during
one tes t on Kentucky coa l and one test on E a s t Kentucky coa l . EPA Method 6
and the Shell-Emeryville w e t chemical methods were used t o make these
measurements.
A s u l f u r balance was ca l cu la t ed f o r the b o i l e r based on the s u l f u r
content of t h e f u e l and the measured s u l f u r i n the-bot tom ash , . f l yash , and
f l u e gas. This s u l f u r balance i s shown i n Tab le 5-14. I t shows measurement
errors, some serious, r e s u l t i n g i n a g r e a t e r s u l f u r ou tput than input . The
Shel l -hneryvi l le method shows a g rea t e r error than EPA method 6. The source
of t h i s error has no t been determined.
5.4 PARTICLE SIZE DISTRIBW'ION OF FLYASH
' The purpose of the p a r t i c l e s ize d i s t r i b u t i o n tests c a r r i e d o u t under
t h i s program is t o accumulate a da ta bank of p a r t i c l e s i z e d i s t r i b u t i o n data
from a l l types of s toke r b o i l e r s f i r i n g a v a r i e t y of coa l s under a va r i e ty of
f i r i n g condi t ions. This da t a w i l l be valuable to manufacturers of dus t
c o l l e c t i o n equipment and to consul t ing engineers faced with t h e task of
spec i fy ing such equipment.
A t test s i t e E, two p a r t i c l e s i z e d i s t r i b u t i o n tests were run a t the
Two add i t iona l tests were run
The t e s t condi t ions
Test
b o i l e r o u t l e t using SASS cyclones f o r s i z i n g .
a t the economizer o u t l e t with a Brink cascade impactor.
f o r a l l four p a r t i c l e s i ze d i s t r i b u t i o n tests are given i n T a b l e 5-15.
r e s u l t s are presented i n T a b l e 5-16 and Figures 5-22 and 5-23.
I n genera l , the t e s t r e s u l t s show t h a t 10% of the b o i l e r o u t l e t f lyash
w a s below th ree micrometers i n diameter, and 25% was.below t e n micrometers.
These results are considered va l id f o r t h e p o i n t sampled, b u t it should be
KVB 15900-531
I I I I I I I I I I I I 'I I I I I I I 17
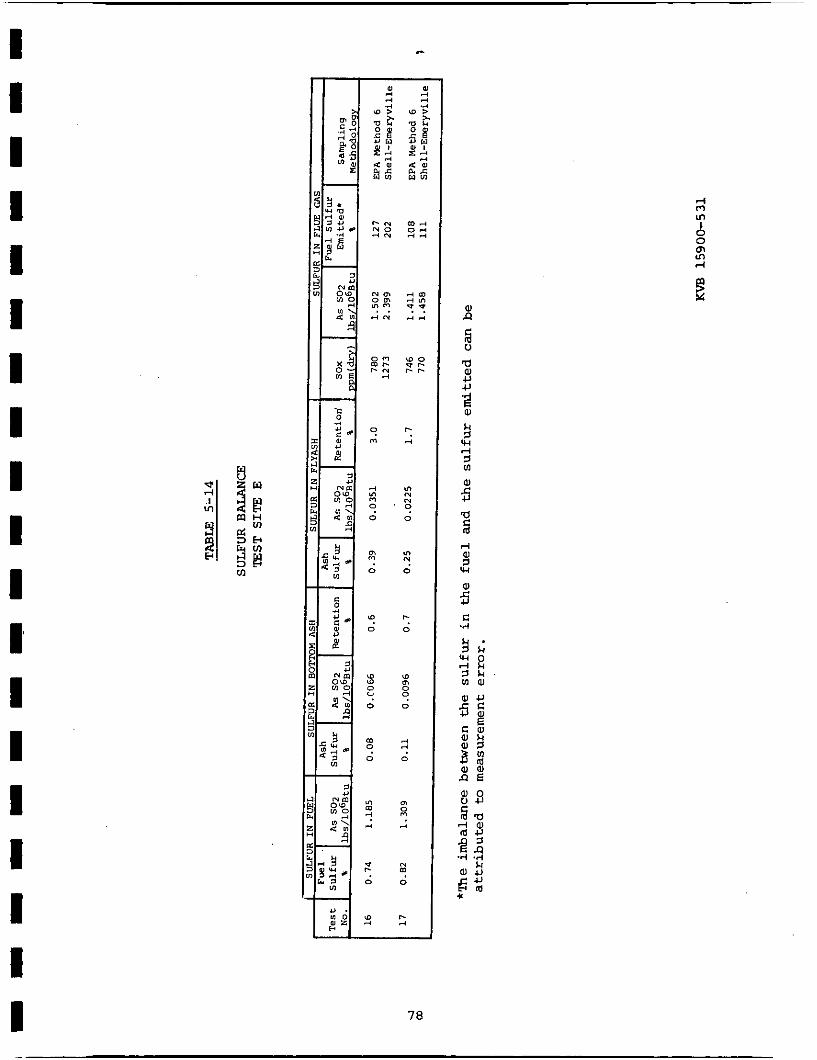
I I I I I I 1 I I I I I I I I I I I I

TABLE 5-15
DESCRIPTION OF PARTICLE SIZE
TEST SITE E DISTRIBUTION TESTS '
P a r t i c l e S ize T e s t Load 02 Dis t r ibu t ion Sample - N o . - Coal -- % % - OFA* Methodology Used Location
11 Kentucky 62 6.5 Low B r i n k Impactor Econ Outlet
14 Crushed Kentucky 69 3.9 High Brink Impactor Econ Out l e t
I I I I I 1
16 E a s t Kentucky 62 8.3 High SASS Cyclones Boi le r O u t l e t
1 7 Kentucky 62 6.2 High SASS Cyclones Boi le r O u t l e t - I ~.
*High o v e r f i r e a i r (OFA) is the normal mode of operat ion a t ' t h i s f a c i l i t y
I I I I I I I I
KVB 15900-531
79

I 1 I I I I I I 1 I I I I I I I I I I
TABLE 5-16
IIESULTS OF PARTICLE SIZE DISTRIBUTION TESTS ,
TEST SITE E
S i z e Di s tr ibut ion S i z e Concentration % B e l o w % B e l o w 1bs/lObBtu ' I b s / l O b B t u
Tes t Description 3 m 10 vm Below 3pm Below10pm
T e s t 11 Brink Econ O u t 11 .0 -- 0 .47 -- T e s t 14 Brink Econ Out 4 . 3 -- 0 . 2 8 -- Test 16 SASS Boiler Out 1 0 . 7 26 .8 0 . 4 8 1 . 2
Test 17 SASS Boiler Out 9 . 1 23 .3 0 . 4 1 1 .0
KVB 15900-531
80

50
w U Io
m
2 a
i 5 rn
a w 1 r%
0.1
0.3 1 3
EQUIVALENT PARTICLEDIAMETER,MICROMETERS
Figure 5-22. P a r t i c l e S ize Di s t r ibu t ion a t the Economizer Out le t from Brink Cascade Impactor T e s t s - T e s t S i t e E .
KVB 15900-531
81
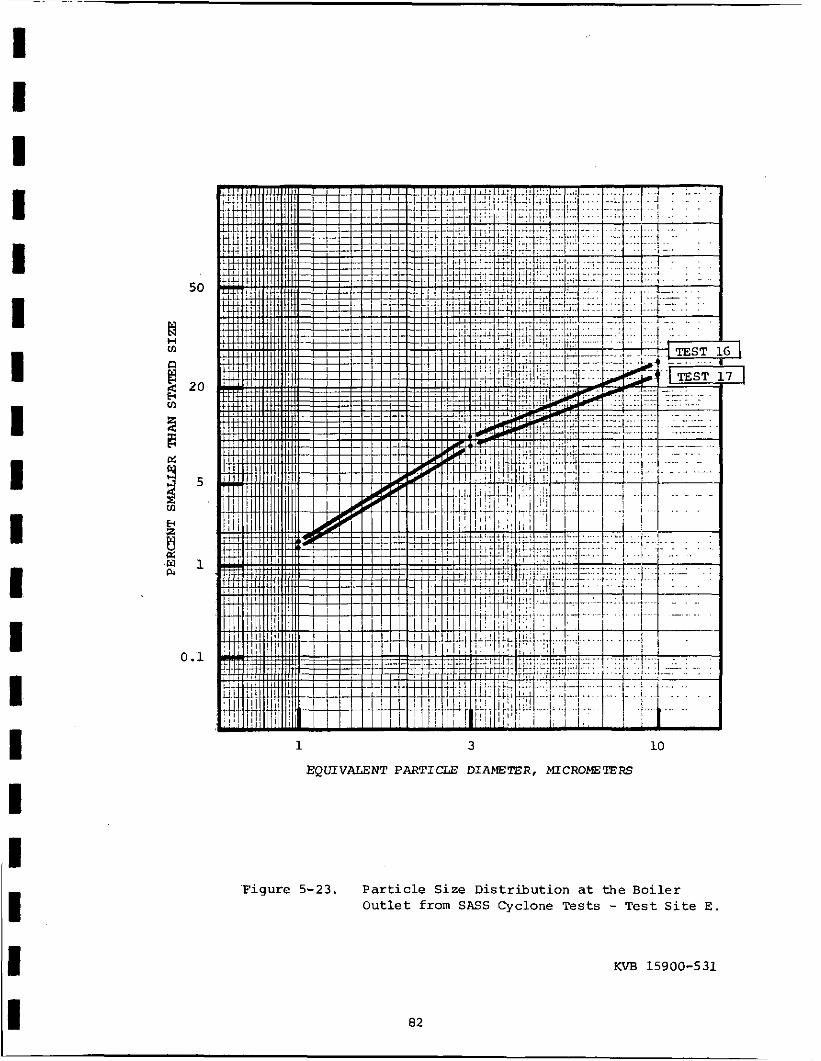
I I I I I 1 I I I I I I I I I I I
50
w H v1
20
0.1
1 3 10
EQUIVALENT PARTICLE DIAMETER, MICROMETERS
F i g u r e 5-23. P a r t i c l e S i z e D i s t r i b u t i o n a t the B o i l e r O u t l e t from SASS Cyclone Tests - T e s t S i t e E.

noted t h a t both methodologies used sample from a s i n g l e p o i n t wi th in the
duct o r breeching. Single po in t samplers a r e sub jec t t o e r r o r s i f s i g n i f i c a n t
s i z e s t r a t i f i c a t i o n of the f lyash exists wi th in the area being t e s t ed .
5.5 EFFICIENCY OF MULTICLONE DUST COLLECTOR
The mult ic lone dus t co l l ec to r e f f i c i e n c y w a s determined i n t h i r t e e n
t e s t s under var ious b o i l e r opera t ing condi t ions. I n each case, c o l l e c t o r
i n l e t and o u t l e t dus t loadings were measured simultaneously f o r b e s t accuracy.
The results of these tests a r e shown i n Table 5-17 and Figure 5-24.
The e f f i c i ency of the mult ic lone dust c o l l e c t o r de t e r io ra t ed with t i m e
during the two months of t e s t i n g .
c o l l e c t i o n e f f i c i ency averaged 87% and dipped below 80% only once. During
the second month of t e s t i n g , however, the c o l l e c t i o n e f f i c i ency remained
below 70% and averaged 55%.
During-the f i r s t -month of t e s t i n g the
Design e f f i c i e n c y is 96% a t 15% below t en micrometers.
I t i s theorized t h a t the reduct ion i n c o l l e c t i o n e f f i c i ency r e s u l t e d
from plugging of severa l cyclone tubes i n t h e c o l l e c t o r , perhaps as a r e s u l t
of in f requent c leaning of the mult ic lone ash hopper.
As a r e s u l t of t h i s problem, no c o r r e l a t i o n has been attempted between
c o l l e c t i o n e f f ic iency and o the r va r i ab le s such as c o a l o r b o i l e r loading.
5.6 SOURCE ASSESSMENT SAMPLING SYSTEM
!Cwo Source Assessment Sampling System (SASS) tests were run a t T e s t
S i t e E. One tes t w a s run on Kentucky coal and one on E a s t Kentucky coa l ,
tests 1 7 and 16 respec t ive ly . The sample catches from these two tests were
s e n t t o Bat te l le Columbus Laboratories where they w i l l be analyzed by com-
bined gas chromatography/miss spectroscopy f o r t o t a l polynuclear conten t ,
seven s p e c i f i c polynuclear aromatic hydrocarbons (PAH) , and trace elements.
The SASS t e s t i n g i s a separa te ly funded segment of t h i s o v e r a l l test program
and a l l SASS tes t r e s u l t s w i l l be reported under separa te cover a t the con-
c lus ion of t h i s t e s t program.
KVB 15900-531
83
- I 1 I I 1 I I I I I I 1 I I I I I I I
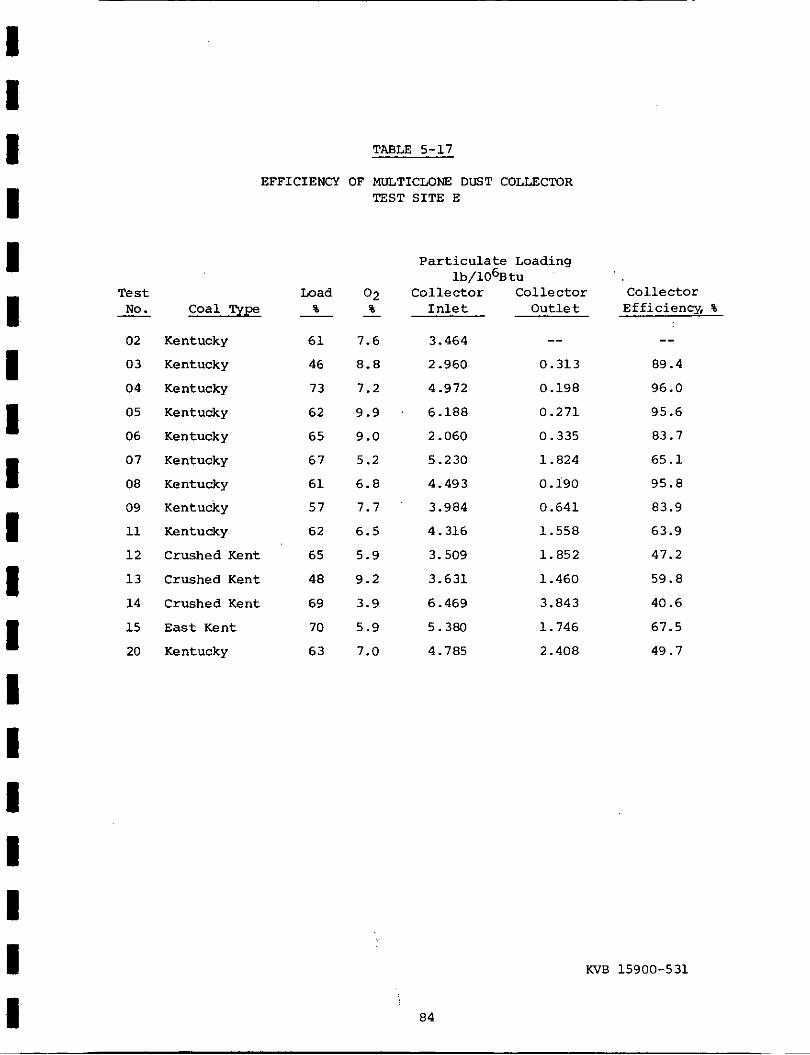
1 I I I I I I I 1 I I I I I I I I I I
T e s t No .
02
03
04
05
06
07
08
09
11
1 2
1 3
14
15
20
-
TABLE 5-17
EFFICIENCY OF MULTICLONE DUST COLLECTOR TEST SITE E
C o a l Type
Kentucky
Kentucky
Kentucky
Kentucky
Kentucky
Kentucky
Kentucky
Kentucky
Kentucky
Crushed Kent
Crushed Kent
Crushed Kent
E a s t Kent
Kentucky
Load %
61
46
73
62
65
67
6 1
57
62
65
48
69
70
63
-
P a r t i c u l a t e Loading lb/106Btu
0 2 Co l l ec to r Collector % I n l e t O u t l e t -
7.6
8.8
7.2
9.9 '
9.0
5.2
6.8
7.7
6.5
5.9
9.2
3.9
3.464
2 -960
4.972
6.188
2.060
5.230
4.493
3.984
4.316
3.509
3.631
6.469
-- 0.313
0.138
0.271
0.335
1.824
0 . i g o
0.641
1.558
1.852
1.460
3.843
5.9 5.380 1.746
7.0 4.785 2.408
Collector Efficiency, %
89.4
96.0
95.6
83.7
65.1
95.8
83.9
63.9
47.2
59.8
40.6
67.5
49.7
W B 15900-531
84
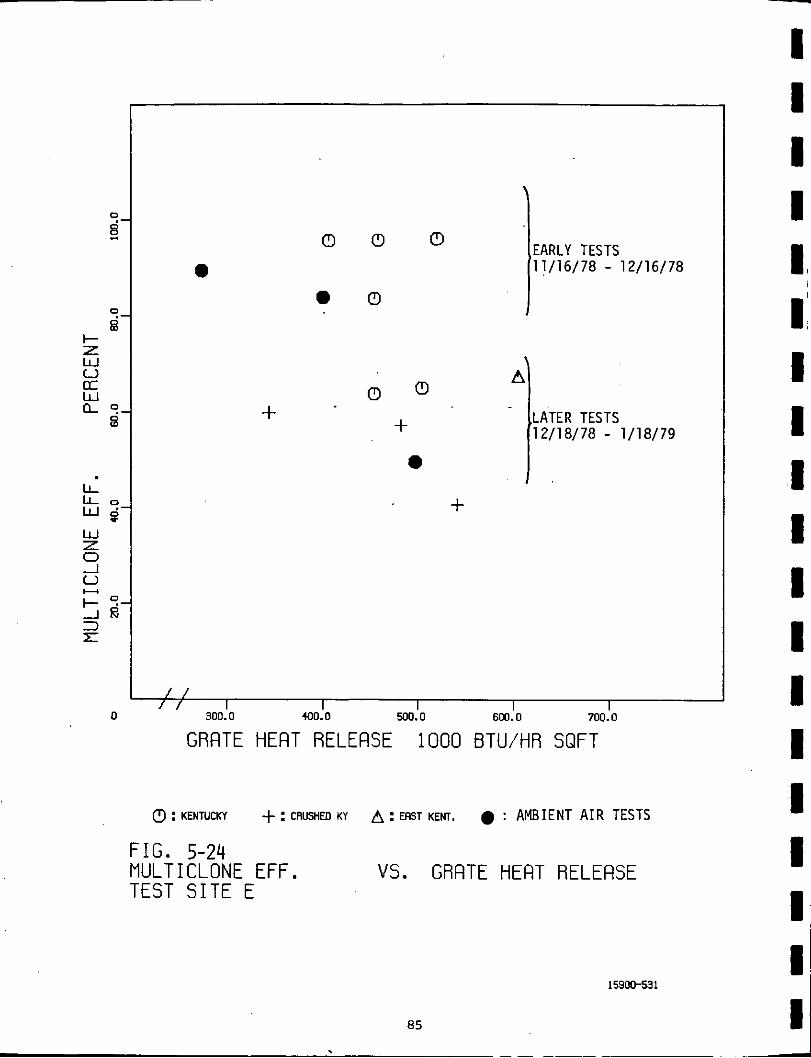
0
0
+
0 0 0
0 0
0 0 + 0
+
/ / / / I I I I I
300.0 400.0 500.0 601. o 700.0
GRRTE HEAT RELEASE 1000 BTU/HR SQFT
0 : KENTUCKY + : CRUSHED KY A : EAST KENT. : AMBIENT A I R TESTS
FIG. 5-24 MULTICLONE EFF. VS. GRRTE HERT RELERSE TEST S I T E E
15900531
85
- I I I I I, I: I I I 1 1 I I I I I I I I

I I
TABLE 5-18
POLYNUCLEAR AROMATIC HYDROCARBONS SOUGHT I N THE SITE E SASS SAMPLES
Molecular Molecular N a m e Weight Formula
7,12 Dimethylbenz (a) anthracene
Dibenz (a,h) anthracene
Benzo (c) phenanthrene
3-methyl cholanthrene
Benzo (a) pyrene
Dibenzo (a,h) pyrene
Dibenzo (a,i) pyrene
Dibenzo (c,g) carbazole
256
278
228
268
252
302
302
26 7
5.7 DATA TABLES
T a b l e s 5-19 through 5-22 summarize t h e test da ta obtained a t T e s t
S i t e E . These tables, i n conjunction with Table 2-1 i n the Executive
Summary, are included f o r reference purposes.
KVB 15900-531
86

I I
7.6 8.8 7.2 9.9 9.0 5.2 6.8 7.7 6.5 5.9 9.2 3.9 5.9 7.0
TAB= 5-19
PARTICULATE EMISSIONS TEST SITE E
3.464 1.'601 2.960 1.245 4.972 2.366 6.188 2.367 2.060 0.961 5.230 2.848 4.493 2.203 3.984-- 1.824 4.316 2.160 3.509 1.828 3.631 1.476 6.469 3.824 5.380 2.801
' 4.785 2.309
Kent Kent
61 Kent Kent 62
70 63
1 02 Kent 61 7.6 2.966 1.319 400 16.58
0 w
02 EMISSIONS % 1b/lObBtu I , gr/SCF.
I I
.
l b h r
46 7 2 79 888 864 322 912 708 549 6 74 582 429
1204 1118
818
Veloc i ty ft/sec
13.99 11.98 18.97 17.53 17.65 19.92 18.49 18.47 17.94 18.70 18.26 21.00 21.25 21.33
07
09
H 12 1 3 14 15 20
Kent Kent Kent Kent Kent Kent Kent Kent Crushed Crushed Crushed E . Kent Kent
6.8 7.7 6.5 5.9
69 3.9 5.9
63 7.0
0.313 0.198 0.271 0.335 1.824 0.190 0.641 1.558 1.852 1.460 3.843 1.746 2.408
0.120 0.092 0.104 0.150 0.880 0.089 0.284 0.769 0.926 0.578 2.018 0.909 1.162
29.5 35.4 37.8 52.3
316 30.0 88.3
243 30 7 173 715 363 412
~~~
35.69 58.71 59.79 52.42 53.19 50.63 45.02 54.20 53.10 52.06 54.16 52.99 55.50
KVB 15900-531
87
I I I I I I 1 I I
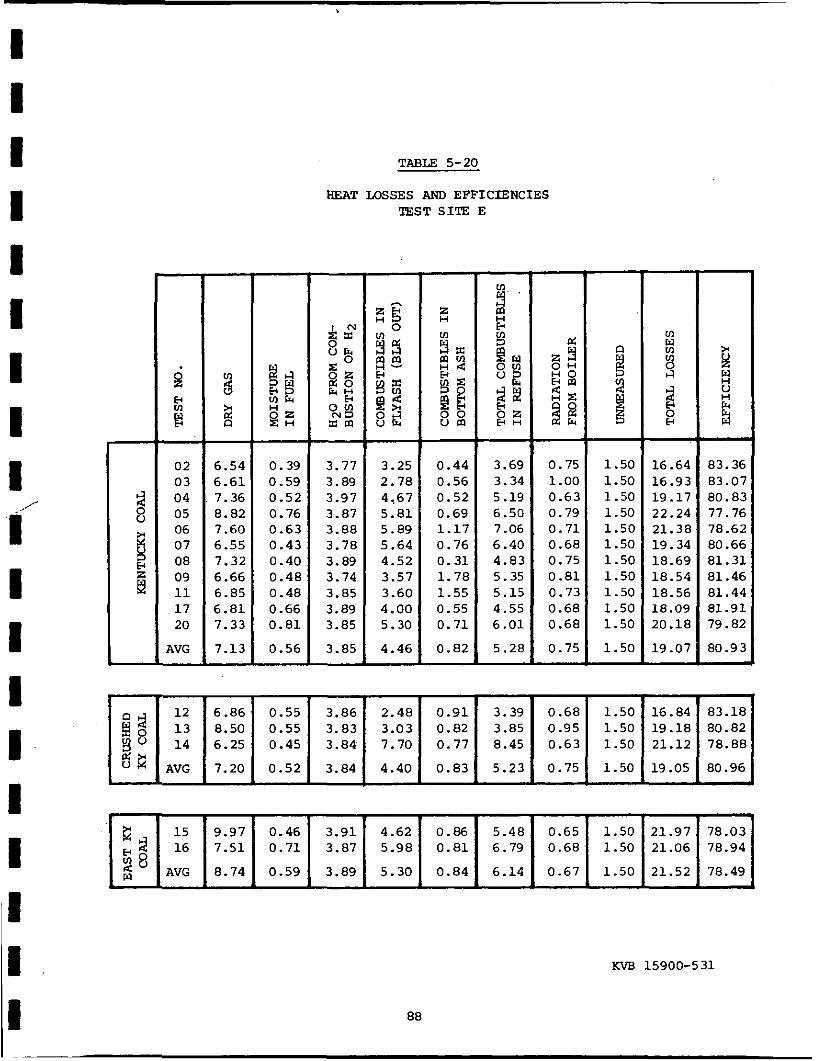
I I I I I I I I I
I I I I I I I I I
m W
$ cl
El 0 €4
d
16.64 16.93 19.17 22.24 21.38 19.34 18.69 18.54 18.56 18.09 20.18
19.07
3 €4 k E
> 8 3 !2 0
E W
83.36 83.0; 80.8: 77.76 78.6; 80.66 81.31 81.46 81.44 81.91 79.82
80.9:
i 02 03 04 05 06 07 08 09 11 17 20
AVG
0.39 0.59 0.52 0.76 0.63 0.43 0.40 0.48 0.48 0.66 0.81
0.56
2 6.54 6.61
. 7.36 8.82 7.60 6.55 7.32 6.66 6.85 6.81 7.33
7.13
TABLE 5-20
HEAT LOSSES AND EFFICIENCIES TEST SITE E
3.77 3.89 3.97 3.87 3.88 3.78 3.89 3.74 3.85 3.89 3.85
3.85
3.25 2.78 4,67 5.81 5.89 5.64 4.52 3.57 3.60 4.00 5.30
4.46
0.44 3.69 0.56 3.34 0.52 5.19 0.69 6.50 1.17 7.06 0.76 6.40 0.31 4.83 1.78 5.35 1.55 5.15 0.55 4.55 0.71 6.01 I 0.82 5.28
0.75 1.50 1.00 1.50 0.63 1.50 0.79 1.50 0.71 1.50 0.68 1.50 0.75 1.50 0.81 1.50 0.73 1.50 0.68 1.50 0.68 1.50 T 0.75 1.50
0.81
KVB 15900-531
88
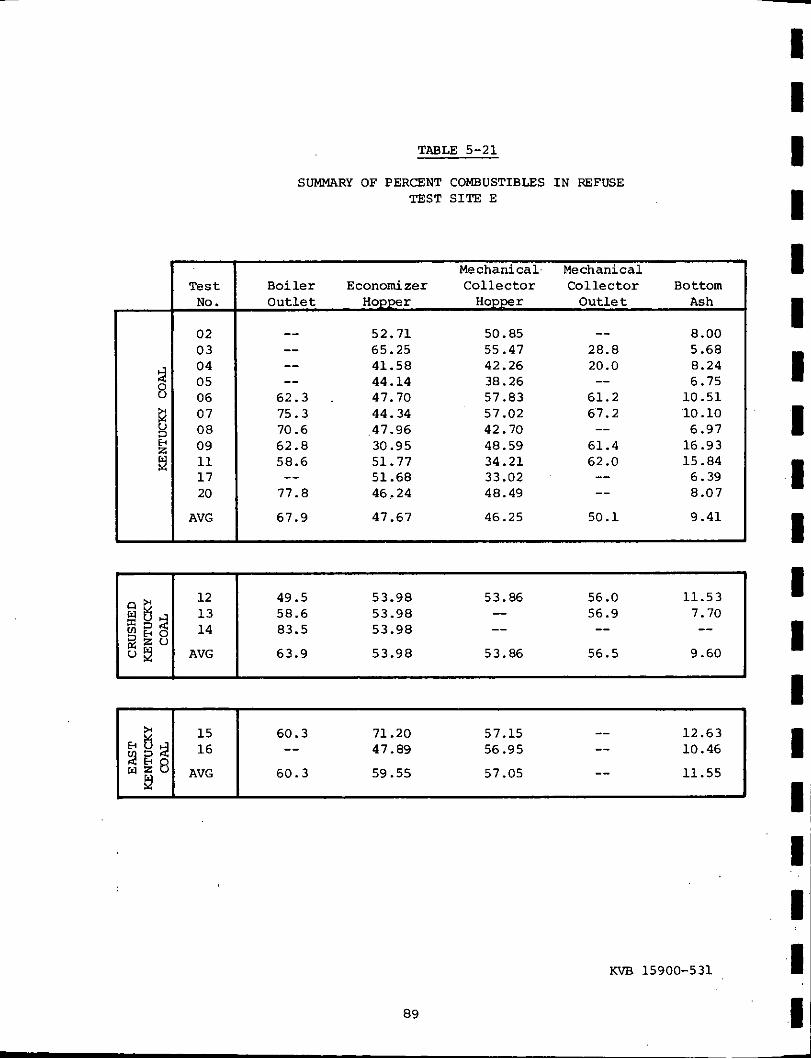
08 09 11 17 20
AVG
S I ' $ 3
TABLE 5-21
SUMMARY OF PERCENT COMBUSTIBLES I N REFUSE TEST SITE E
15 16
AVG
Mechanical. Mechanical B o i l e r Economizer Collector Collector Bottom O u t l e t Hopper Hopper O u t l e t Ash
-- -- -- -- 62.3 . 75.3 70.6 62.8 58.6
77.8 --
52.71 65.25 41.58 44.14 47.70 44.34 .47.96 30.95 51.77 51.68 46,24
50.85 55.47 42.26 38.26 57.83 57.02 42.70 48.59 34.21 33.02 48.49
_- 28.8 20.0
61.2 67.2
61.4 62 .O
__
_ _
-- _ _
8.00 5.68 8.24 6.75 10.51 10.10 6.97 16.93 15.84 6.39 8.07
67.9 47.67 46.25 50.1 9.41
I 1 1 49.5 53.98 53.86 56 .O 11.53 58.6 53.98 -- 56.9 7.70 83.5 53.98
63.9 53.98 53.86 56.5 9.60
_ _ -- --
I I 1
60.3 71.20 57.15 _ _ 12.63 -- 47.89 56.95 -- 10.46
60.3 59.55 57.05 -- 11.55
KVB 15900-531
89
I I I I I 1 I I 1 I I 1 I I I 1 I I I

I I I I I I I I I I I I I I I I I I I
TABLE 5-22
STEAM FLOWS AND HEAT RELEASE RATES TEST SITE E
,, F r o n t f W t Grate . Furnace T e s t C a p a c i t y Steam F l m H e a t I n p u t Heat Release Heat Release H e a t Relcase - _ _ NO. 0 1 0 H l b / h r 106Btu/hr 106Btu/hr-Pt 1038tu /hr - f t2 1 0 3 B t u h r - f t 3
2 6 1 109.5 135.0 8.44 392 13.2 3 46 82.9 94 .3 5.89 274 9 . 2
- 4 73 131.2 178.6 11.16 519 17 .4 5 62 110 .8 139.6 8 . 7 3 406 13.6
-6 65 116.9 156 .3 9 . 7 1 454 15.2 -7 67 121.4 173.4 10.84 504 16.9
8 6 1 109 .5 157.7 9.86 458 15.4 9 57 102.0 137.7 8 . 6 1 400 13.4
1 0 61 109.0 156.4 9 . 7 8 455 1 5 . 3 11 62 112.1 156.2 9 . 7 6 454 15.2 - 1 2 65 117.6 165 .8 10.36 482 16.2 13 4 8 86 .4 118.3 7.39 344 11.5
c 1 5 70 1 2 5 . 8 207.9 12 .99 604 20 .3 16 62 112.2 115.5 10 .97 510 1 7 . 1 1 7 62 1 1 1 . 2 203.1 12.69 590 1 9 . 8
y - 18 65 117.9 156.3 9.77 454 15 .2 20 6 3 114.1 111.0 10.69 497 1 6 . 1
- 14 69 124.6 186 .1 1 1 . 6 3 541 18.2
*Based on steam flow i n t e g r a t o r and corrected upward by a f a c t o r of 1 . 2 t o account f o r a c a l i b r a t i o n e r r o r i n the in t eg ra to r .
**Based on in t eg ra t ed coal s c a l e counters and higher hea t ing value of coa l .
KVB 15900-531
90

I I I I t I I I I I I I I I I I I I I
APPENDICES
APPENDIX A E n g l i s h and Metric U n i t s to S I U n i t s . . . . . . . 92
APPENDIX B S I U n i t s to E n g l i s h and Metric U n i t s . . . . . . . 9 3
APPENDIX C S I P r e f i x e s . . . . . . . . . . . . . . . . . . . 94
APPENDIX D Emissions U n i t s C o n v e r s i o n Factors . . . . . . . . 95
91

CONVERSION FACTORS
ENGLISH AND METRIC UNITS ‘TU SI UNITS
To Convert From - . To Multiply By . .
i n c m i n 2 cm2 f t m f t 2 m2 f t 3 m3
lb Ib/hr6 lb/10 BTU 9/Mcal
BTU BTU/lb BTU/hr J/s e c Jhr
BTU/f t / h r BTU/ft/hr BTU/ftZ/hr BTu/f t2 /hr BTU/f t 3 /h r B T U / f t 3 / h r
psia “H20
Rankine Fahrenheit C e l s i u s Rankine
COAL FUEL ONLY
ppm @ 3% 02 6 0 2 ) ppm @ 3% 0 2 (So31 ppm @ 3% O2 (NO) P P ~ @ 3% 0 2 (NO21 ppm @ 3% 02 (co) ppm @ 3% 0 2 (CH4)
J
W W W
W/m ’
J / h r / m w/m2
J/hr/m2 w/m3
J/hr/m3
Pa Pa
C e l s i u s C e l s i u s Kelvin Kelvin
J/ks
2.540 6.452 0.3048 0.09290 0.02832
0.4536 0.1260 4 30 2 39
1054 0.002324 0.2929 1.000 3600 0.9609 3459 3.152 11349 10.34 37234
6895 249.1
C = 5/9R-273 C = 5/9(F-32) K = C+273 K = 5/9R
0.851 1.063 0.399 0.611 0.372 0.213
KVB 15900-531
92
I 1 I I 1 1 i I I I I I I I I I I I I~

I I I I I I I I I I ‘--.
I I I I I I I I I
TO Convert From
c m
m m2 m 3
cm2
Kg Mg/s ng/J w/J J J/kg
J / h r / m 2 J / h r / m J/hr/m3
W w w/m w/m2 ~ / m 3
Pa Pa
CONVERSION FACTORS
S I UNITS TO ENGLISH AND METRIC UNITS
Kelvin C e l s i u s Fahrenheit Kelvin
COAL FUEL ONLY
ng/J ng/J ng/J ng/J ng/J ng/J
To
i n i n f t
-
2
f t 2 f t 3
l b l b / h r
lb/106BTU g/Mcal
BTU BTU/lb
BTU/ft/hr BTU/ft2/hr BTU/f t3/hr
BTU/hr J /hr
BTU/ft/hr
BTU/f t3 /hr BTU/f t 2 /h r
psia ‘“20
Fahrenhei t Fahrenhei t Rankine Rankine
Mult iply By
0.3937 0.1550 3.281
10.764 35.315
2.205 7.937 0.00233 0.00418
0.000948 4.303 0.000289 0.0000881 0.0000269
3.414 0.000278 1.041 0.317 0.0967
0.000145 0.004014
F = 1.8K-460 F = 1.8C+32 R = F+460 R = 1.8K
1.18 0.941 2.51 1.64 2.69 4.69
KVB 15900-531
93
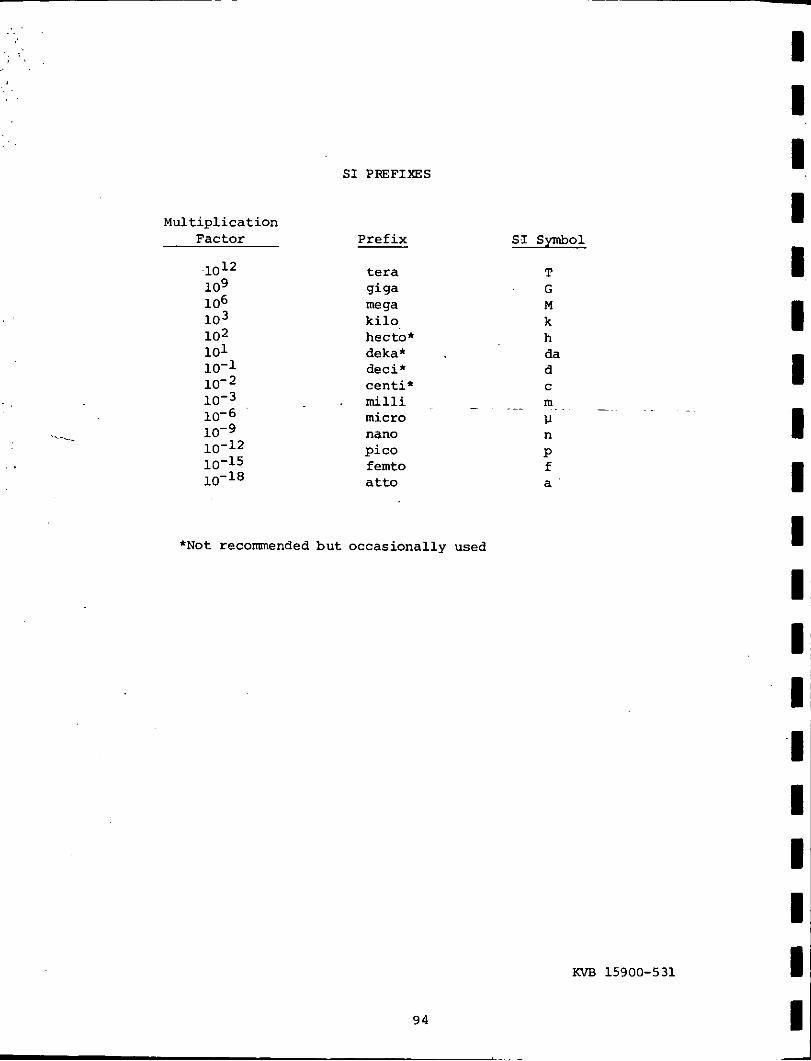
SI PREFIXES
...-
Multiplication Factor
1012 109 106 103 102 101 10-1 10-2 10-3 10-6 10-9 10-12 10-15 10-18
Prefix
tera
me qa kilo hecto* deka* deci* centi* milli micro nano pic0 femto atto
qiqa
SI symbol
T G M k h da d C
*Not recomended but occasionally used
n P f a
KVB 15900-531
94
-
I I I I I I 1 I I I I I I I I I I I I
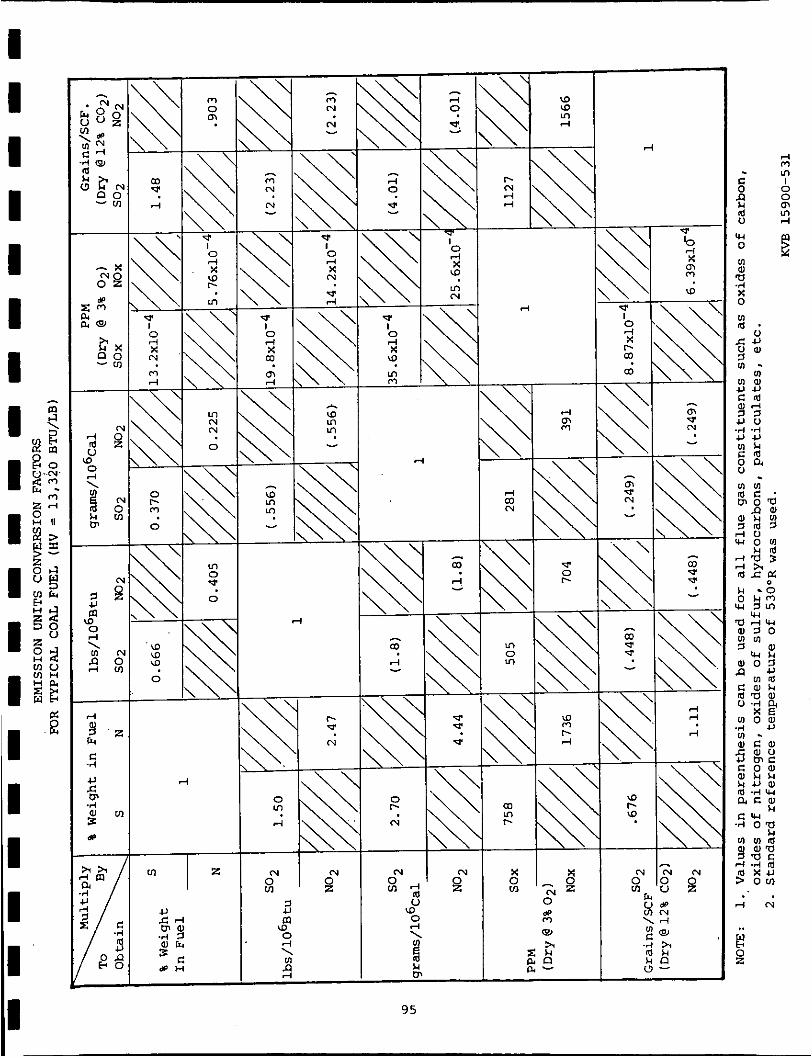
95