11/28/2016 2016 report card - hawthorne brook (07350030)hbms.nmrsd.org/sites/hbms.nmrsd.org/files/hb...
TRANSCRIPT

11/28/2016 2016 Report Card - Hawthorne Brook (07350030)
http://profiles.doe.mass.edu/reportcard/rc.aspx?linkid=37&orgcode=07350030&fycode=2016&orgtypecode=6& 1/19
Enrollment (201516) School District StateTotal Count 504 3,197 953,429Race/Ethnicity (%)African American or Black 0.4 0.9 8.8Asian 0.8 1.2 6.5Hispanic or Latino 3.6 3.1 18.6Multirace, NonHispanic 3.6 2.6 3.2Native American 0.0 0.1 0.2Native Hawaiian or Pacific Islander 0.0 0.0 0.1White 91.7 92.1 62.7Gender (%)Male 47.6 50.7 51.2Female 52.4 49.3 48.8Selected Populations (%)English Language Learner 0.2 0.7 9.0Economically Disadvantaged 15.7 16.5 27.4Students w/Disabilities 16.3 20.0 17.2First Language Not English 2.0 1.6 19.0
Grades Offered:05, 06, 07, 08
Educator Data (201516) School District StateTotal # of Teachers 43.0 248.2 72,384.1Percentage of Teachers Licensed inTeaching Assignment
97.7 99.4 97.4
Total Number of Classes in CoreAcademic Areas
196 1,094 348,472
Percentage of Core Academic ClassesTaught by Teachers Who are HighlyQualified
100.0 100.0 96.3
Percentage of Core Academic ClassesTaught by Teachers Who are Not HighlyQualified
0.0 0.0 3.7
Student/Teacher Ratio 11.7 to 1 12.9 to 1 13.2 to 1Percentage of Public Elementary andSecondary School Teachers IssuedWaivers
0.0 0.9
Massachusetts School and District ProfilesHawthorne BrookHawthorne Brook (07350030)Stephen M Coughlan, PrincipalMailing Address: 64 Brookline RdTownsend, MA 01469Phone: (978) 5976914FAX: (978) 5970354Website: http://hbms.nmrsd.orgOrganization Description: Grades 5 8
This report card contains information required by the federal Elementary and Secondary Education Act (ESEA) for ourschool and district including: student enrollment and teacher qualifications, student achievement, accountability, and theprogress our school is making toward narrowing proficiency gaps for different groups of students.
Enrollment and Educator Data (201516 School Year)About the Data
Profiles Home Directories Statewide Reports State Profile Profiles Help

11/28/2016 2016 Report Card - Hawthorne Brook (07350030)
http://profiles.doe.mass.edu/reportcard/rc.aspx?linkid=37&orgcode=07350030&fycode=2016&orgtypecode=6& 2/19
2016 MCAS Results by Subgroup by Grade and SubjectNOTE: Firstyear ELL students are not included in achievement level or CPI results. However, firstyear ELL students who took the ACCESS for ELLstest are counted as ELA participants; in addition, firstyear ELL students who are present for Mathematics/Science and Technology/Engineering arecounted as Mathematics/Science and Technology/Engineering participants. Please see the principal's administration manual (PAM) for details.
More about the dataData Last Updated on September 26, 2016
GRADE LEVEL 5 ENGLISH LANGUAGE ARTS
Student Group
School District StateStud.Incl
Part.Rate
% at EachLevel
CPI SGPIncl. inSGP(#)
Stud.Incl
Part.Rate
% at EachLevel
CPI SGPIncl.inSGP(#)
Stud.Incl
Part.Rate
% at EachLevel
CPI SGPIncl. inSGP(#)
# % A P NI W # % A P NI W # % A P NIWSubgroupsStudents w/disabilities 20 95 0 50401081.3 N/A 19 57 98 0 44391879.4 46.0 51 ELL and Former ELL Econ. Disadvantaged 20 100 5 65201085.0 N/A 17 46 100 4 6324 9 87.5 35.0 39 High needs 37 98 3 5930 8 84.5 40.0 34 90 99 2 56301284.2 42.0 79 Afr. Amer./Black Amer. Ind. or Alaska Nat. Asian 3 Hispanic/Latino 1 6 Multirace, NonHisp./Lat. 2 4 Nat. Haw. or Pacif. Isl. White 101 99 146218 6 90.3 36.0 97 216 99 165721 6 89.9 45.0 199 Male 49 100 6 61201285.2 33.0 46 118 100 9 60201087.5 43.0 106 Female 55 98 206416 0 95.0 41.0 54 111 98 215522 3 92.3 45.0 104 ELL Ever ELL All Students2016 104 99 136318 6 90.4 35.5 100 229 99 155821 7 89.8 44.0 210 2015 130 99 205025 5 88.8 44.0 126 264 100 284421 7 88.4 57.0 244 24,893 99 234820 9 87.3 50.0 23,451

11/28/2016 2016 Report Card - Hawthorne Brook (07350030)
http://profiles.doe.mass.edu/reportcard/rc.aspx?linkid=37&orgcode=07350030&fycode=2016&orgtypecode=6& 3/19
GRADE LEVEL 5 MATHEMATICS
Student Group
School District StateStud.Incl
Part.Rate
% at EachLevel
CPI SGPIncl.inSGP(#)
Stud.Incl
Part.Rate
% at EachLevel
CPI SGPIncl.inSGP(#)
Stud.Incl
Part.Rate
% at EachLevel
CPI SGPIncl. inSGP(#)
# % A P NI W # % A P NI W # % A P NI WSubgroupsStudents w/disabilities 20 95 0 15602557.5 21.5 20 57 98 0 19423958.3 30.5 50 ELL and Former ELL Econ. Disadvantaged 20 100 5 35402071.3 N/A 19 47 100 6 30432169.7 36.5 40 High needs 37 98 3 24512265.5 23.5 36 91 99 3 25442765.7 33.0 79 Afr. Amer./Black Amer. Ind. or Alaska Nat. Asian 3 Hispanic/Latino 1 6 Multirace, NonHisp./Lat. 2 4 Nat. Haw. or Pacif. Isl. White 101 99 1235441077.5 35.0 99 217 100 1239361378.3 34.0 201 Male 49 100 1037391475.5 34.0 47 117 100 1439321578.8 33.5 108 Female 55 98 153347 5 80.0 38.0 55 113 99 104040 11 79.0 34.0 105 ELL Ever ELL All Students2016 104 99 1335431077.9 36.5 102 230 100 1240361378.9 34.0 213 2015 129 99 2334331081.0 30.0 125 264 99 2832261480.4 33.5 242 24,893 100 3532211283.6 50.0 23,621

11/28/2016 2016 Report Card - Hawthorne Brook (07350030)
http://profiles.doe.mass.edu/reportcard/rc.aspx?linkid=37&orgcode=07350030&fycode=2016&orgtypecode=6& 4/19
GRADE LEVEL 5 SCIENCE AND TECH/ENG
Student Group
School District StateStud.Incl
Part.Rate
% at EachLevel
CPI SGPIncl. inSGP (#)
Stud.Incl
Part.Rate
% at EachLevel
CPI SGPIncl. inSGP(#)
Stud.Incl
Part.Rate
% at EachLevel
CPI SGPIncl.inSGP(#)# % A P NIW # % A P NI W # % A P NI W
SubgroupsStudents w/disabilities 20 95 102560 5 75.0 N/A N/A 57 98 9 19472563.6 N/A N/A 13,420 98 3 14434058.2 N/A N/A ELL and Former ELL 8,913 99 4 16463456.6 N/A N/A Econ. Disadvantaged 20 100 5 5040 5 82.5 N/A N/A 47 100 4 36471374.5 N/A N/A 22,331 99 5 21472763.5 N/A N/A High needs 37 98 8 4146 5 80.4 N/A N/A 91 99 8 30461671.2 N/A N/A 32,892 99 5 21472763.8 N/A N/A Afr. Amer./Black 5,911 99 5 18492960.9 N/A N/A Amer. Ind. or Alaska Nat. 148 99 6 26432566.4 N/A N/A Asian 3 4,514 100 283528 8 84.5 N/A N/A Hispanic/Latino 1 6 12,812 99 5 19463060.7 N/A N/A Multirace, NonHisp./Lat. 2 4 2,402 99 1932351377.6 N/A N/A Nat. Haw. or Pacif. Isl. 61 100 1630381674.6 N/A N/A White 101 99 164140 4 84.7 N/A N/A 218 100 193637 8 82.1 N/A N/A 43,793 99 193736 8 82.2 N/A N/A Male 49 100 183935 8 83.2 N/A N/A 118 100 2136301380.9 N/A N/A 35,768 99 1532381576.0 N/A N/A Female 55 98 134444 0 86.4 N/A N/A 113 99 153942 4 83.2 N/A N/A 33,895 99 1731391376.8 N/A N/A ELL 5,194 99 1 8 434847.0 N/A N/A Ever ELL 10,966 100 6 19453160.3 N/A N/A All Students2016 104 99 154139 4 84.9 N/A N/A 231 100 183836 8 82.0 N/A N/A 69,681 99 1631381476.4 N/A N/A 2015 130 99 3 4548 5 80.0 N/A N/A 265 100 153938 8 81.5 N/A N/A 70,861 99 1635371378.2 N/A N/A
11/28/2016 2016 Report Card - Hawthorne Brook (07350030)
http://profiles.doe.mass.edu/reportcard/rc.aspx?linkid=37&orgcode=07350030&fycode=2016&orgtypecode=6& 5/19
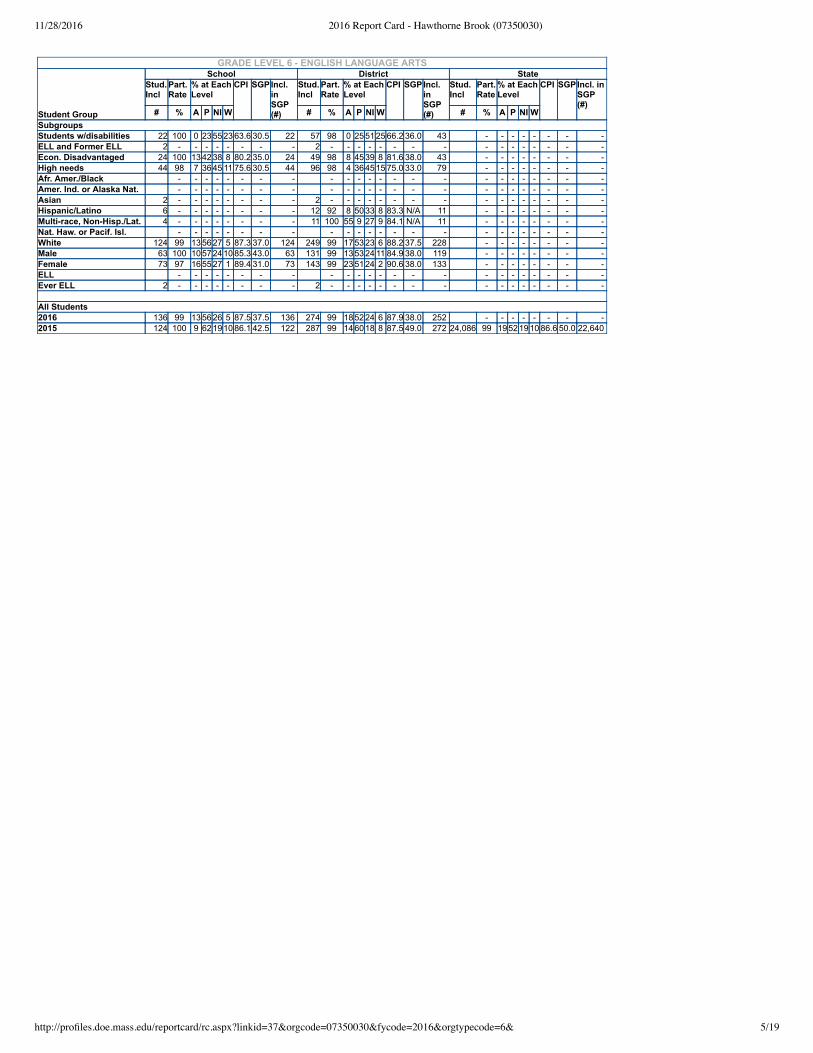
GRADE LEVEL 6 ENGLISH LANGUAGE ARTS
Student Group
School District StateStud.Incl
Part.Rate
% at EachLevel
CPI SGPIncl.inSGP(#)
Stud.Incl
Part.Rate
% at EachLevel
CPI SGPIncl.inSGP(#)
Stud.Incl
Part.Rate
% at EachLevel
CPI SGPIncl. inSGP(#)
# % A P NI W # % A P NI W # % A P NI WSubgroupsStudents w/disabilities 22 100 0 23552363.6 30.5 22 57 98 0 25512566.2 36.0 43 ELL and Former ELL 2 2 Econ. Disadvantaged 24 100 134238 8 80.2 35.0 24 49 98 8 4539 8 81.6 38.0 43 High needs 44 98 7 3645 11 75.6 30.5 44 96 98 4 36451575.0 33.0 79 Afr. Amer./Black Amer. Ind. or Alaska Nat. Asian 2 2 Hispanic/Latino 6 12 92 8 5033 8 83.3 N/A 11 Multirace, NonHisp./Lat. 4 11 100 55 9 27 9 84.1 N/A 11 Nat. Haw. or Pacif. Isl. White 124 99 135627 5 87.3 37.0 124 249 99 175323 6 88.2 37.5 228 Male 63 100 1057241085.3 43.0 63 131 99 135324 11 84.9 38.0 119 Female 73 97 165527 1 89.4 31.0 73 143 99 235124 2 90.6 38.0 133 ELL Ever ELL 2 2 All Students2016 136 99 135626 5 87.5 37.5 136 274 99 185224 6 87.9 38.0 252 2015 124 100 9 62191086.1 42.5 122 287 99 146018 8 87.5 49.0 272 24,086 99 1952191086.6 50.0 22,640

11/28/2016 2016 Report Card - Hawthorne Brook (07350030)
http://profiles.doe.mass.edu/reportcard/rc.aspx?linkid=37&orgcode=07350030&fycode=2016&orgtypecode=6& 6/19
GRADE LEVEL 6 MATHEMATICS
Student Group
School District StateStud.Incl
Part.Rate
% at EachLevel
CPI SGPIncl.inSGP(#)
Stud.Incl
Part.Rate
% at EachLevel
CPI SGPIncl.inSGP(#)
Stud.Incl
Part.Rate
% at EachLevel
CPI SGPIncl. inSGP(#)
# % A P NI W # % A P NI W # % A P NI WSubgroupsStudents w/disabilities 22 100 0 9 454547.7 47.5 22 57 98 4 7 325854.4 51.0 37 ELL and Former ELL 2 2 Econ. Disadvantaged 24 100 1742291380.2 48.5 24 49 98 1237312077.0 48.5 42 High needs 44 98 9 30362567.0 48.0 44 96 98 8 23323666.4 49.0 73 Afr. Amer./Black Amer. Ind. or Alaska Nat. Asian 2 2 Hispanic/Latino 6 12 92 2525252579.2 N/A 10 Multirace, NonHisp./Lat. 4 11 100 3627 9 2775.0 N/A 11 Nat. Haw. or Pacif. Isl. White 125 100 253531 9 81.8 54.0 124 248 99 3231231384.0 63.0 221 Male 63 100 2527351377.8 51.5 62 131 99 2928251880.5 56.0 115 Female 74 99 244326 7 85.5 64.0 74 142 98 353421 11 86.1 71.0 129 ELL Ever ELL 2 2 All Students2016 137 99 253630 9 81.9 54.0 136 273 99 3231231483.4 63.5 244 2015 124 100 214127 11 82.1 59.0 122 287 99 2836241283.4 64.0 267 24,058 99 3032241481.5 50.0 22,597

11/28/2016 2016 Report Card - Hawthorne Brook (07350030)
http://profiles.doe.mass.edu/reportcard/rc.aspx?linkid=37&orgcode=07350030&fycode=2016&orgtypecode=6& 7/19
GRADE LEVEL 7 ENGLISH LANGUAGE ARTS
Student Group
School District StateStud.Incl
Part.Rate
% atEachLevel
CPI SGPIncl. inSGP(#)
Stud.Incl
Part.Rate
% at EachLevel
CPI SGPIncl. inSGP(#)
Stud.Incl
Part.Rate
% atEachLevel
CPI SGPIncl. inSGP(#)
# % A P NI W # % A P NI W # % A P NIWSubgroupsStudents w/disabilities 17 100 0 18 76 6 67.6 N/A 17 50 98 0 32541474.0 74.0 40 ELL and Former ELL Econ. Disadvantaged 22 100 5 55 36 5 83.0 49.0 21 48 100 8 5627 8 84.9 56.5 42 High needs 34 100 3 44 50 3 80.1 61.0 33 85 99 5 4838 9 82.1 68.0 73 Afr. Amer./Black 1 4 Amer. Ind. or Alaska Nat. 1 Asian 2 4 Hispanic/Latino 3 9 Multirace, NonHisp./Lat. 7 14 100 146414 7 91.1 N/A 13 Nat. Haw. or Pacif. Isl. White 104 99 3 76 21 0 92.8 61.0 104 239 98 127116 2 94.2 66.0 230 Male 58 98 2 67 29 2 88.8 49.0 57 137 99 126421 4 91.4 64.0 126 Female 59 100 5 83 12 0 95.8 61.0 59 134 98 1374 11 2 94.6 66.0 131 ELL Ever ELL 2 4 All Students2016 117 99 3 75 21 1 92.3 58.5 116 271 98 126916 3 93.0 66.0 257 2015 136 99 4 64 28 4 87.3 45.5 128 289 99 5 6822 5 90.0 46.0 267 24,816 99 9 6023 8 87.0 50.0 23,180

11/28/2016 2016 Report Card - Hawthorne Brook (07350030)
http://profiles.doe.mass.edu/reportcard/rc.aspx?linkid=37&orgcode=07350030&fycode=2016&orgtypecode=6& 8/19
GRADE LEVEL 7 MATHEMATICS
Student Group
School District StateStud.Incl
Part.Rate
% at EachLevel
CPI SGPIncl.inSGP(#)
Stud.Incl
Part.Rate
% at EachLevel
CPI SGPIncl.inSGP(#)
Stud.Incl
Part.Rate
% at EachLevel
CPI SGPIncl. inSGP(#)
# % A P NI W # % A P NI W # % A P NI WSubgroupsStudents w/disabilities 17 100 0 6 247135.3 N/A 17 50 98 2 6 266643.0 61.0 39 ELL and Former ELL Econ. Disadvantaged 21 95 0 33382961.9 51.0 21 45 96 1329332468.9 50.5 42 High needs 33 97 0 24363954.5 55.0 33 83 98 8 19304258.4 54.5 72 Afr. Amer./Black 1 3 Amer. Ind. or Alaska Nat. 1 Asian 2 4 Hispanic/Latino 3 8 Multirace, NonHisp./Lat. 7 14 100 291450 7 76.8 N/A 14 Nat. Haw. or Pacif. Isl. White 104 99 1542311279.1 59.0 104 239 98 2334281579.7 53.0 228 Male 58 98 2431291676.3 58.5 58 138 99 2829271679.2 55.0 127 Female 59 100 8 5132 8 81.4 60.0 59 131 97 1738301578.6 52.0 129 ELL Ever ELL 2 4 All Students2016 117 99 1641311278.8 59.0 117 269 98 2333281678.9 55.0 256 2015 137 100 9 32352368.8 26.0 130 291 99 1236322172.9 31.5 270 24,863 99 2030262373.0 51.0 23,222

11/28/2016 2016 Report Card - Hawthorne Brook (07350030)
http://profiles.doe.mass.edu/reportcard/rc.aspx?linkid=37&orgcode=07350030&fycode=2016&orgtypecode=6& 9/19
GRADE LEVEL 8 ENGLISH LANGUAGE ARTS
Student Group
School District StateStud.Incl
Part.Rate
% at EachLevel
CPI SGPIncl. inSGP(#)
Stud.Incl
Part.Rate
% at EachLevel
CPI SGPIncl.inSGP(#)
Stud.Incl
Part.Rate
% at EachLevel
CPI SGPIncl. inSGP(#)
# % A P NI W # % A P NI W # % A P NIWSubgroupsStudents w/disabilities 24 100 0 54252175.0 66.5 24 58 100 0 52282178.9 67.0 49 ELL and Former ELL 2 2 Econ. Disadvantaged 30 100 104340 7 80.0 56.0 30 61 100 106225 3 88.1 66.0 59 High needs 45 98 7 5131 11 80.0 66.0 45 105 99 6 6023 11 85.5 67.0 95 Afr. Amer./Black 2 Amer. Ind. or Alaska Nat. 1 Asian 1 Hispanic/Latino 6 14 100 7 79 7 7 92.9 N/A 14 Multirace, NonHisp./Lat. 5 8 Nat. Haw. or Pacif. Isl. White 123 100 126915 3 92.1 59.0 123 267 100 1866 11 4 93.9 62.0 253 Male 64 98 8 7016 6 89.1 62.0 64 150 99 11 6815 6 91.2 64.0 141 Female 70 100 166914 1 94.6 56.0 70 143 100 2466 8 2 96.9 61.5 138 ELL Ever ELL 4 7 All Students2016 134 99 126915 4 92.0 58.0 134 293 100 1867 11 4 93.9 63.0 279 2015 136 97 216512 1 94.3 43.0 135 264 97 236212 3 94.5 52.0 247 24,627 99 265414 6 91.4 50.0 23,268

11/28/2016 2016 Report Card - Hawthorne Brook (07350030)
http://profiles.doe.mass.edu/reportcard/rc.aspx?linkid=37&orgcode=07350030&fycode=2016&orgtypecode=6& 10/19
GRADE LEVEL 8 MATHEMATICS
Student Group
School District StateStud.Incl
Part.Rate
% at EachLevel
CPI SGPIncl.inSGP(#)
Stud.Incl
Part.Rate
% at EachLevel
CPI SGPIncl.inSGP(#)
Stud.Incl
Part.Rate
% at EachLevel
CPI SGPIncl. inSGP(#)
# % A P NI W # % A P NI W # % A P NI WSubgroupsStudents w/disabilities 24 100 0 8 256737.5 34.0 24 58 100 0 14266046.1 42.0 51 ELL and Former ELL 2 2 Econ. Disadvantaged 30 100 7 13404049.2 28.5 30 61 100 2025282865.6 40.0 59 High needs 45 98 4 16364449.4 33.0 45 105 99 11 23293761.0 43.0 97 Afr. Amer./Black 2 Amer. Ind. or Alaska Nat. 1 Asian 1 Hispanic/Latino 6 14 100 7 50212175.0 N/A 14 Multirace, NonHisp./Lat. 5 8 Nat. Haw. or Pacif. Isl. White 122 99 1920402068.4 35.0 122 266 100 3027261777.6 49.0 254 Male 63 97 2117372565.1 35.0 63 149 99 2825242373.3 48.0 143 Female 70 100 1724401970.7 33.0 70 143 100 3031271281.6 55.0 137 ELL Ever ELL 4 7 All Students2016 133 99 1921382268.0 35.0 133 292 99 2928261777.4 49.5 280 2015 138 99 363323 8 85.7 69.0 137 265 98 3033271083.5 65.0 250 24,594 99 2931231778.7 50.0 23,297

11/28/2016 2016 Report Card - Hawthorne Brook (07350030)
http://profiles.doe.mass.edu/reportcard/rc.aspx?linkid=37&orgcode=07350030&fycode=2016&orgtypecode=6& 11/19
GRADE LEVEL 8 SCIENCE AND TECH/ENG
Student Group
School District StateStud.Incl
Part.Rate
% atEachLevel
CPI SGPIncl. inSGP (#)
Stud.Incl
Part.Rate
% atEachLevel
CPI SGPIncl. inSGP(#)
Stud.Incl
Part.Rate
% at EachLevel
CPI SGPIncl.inSGP(#)# % A P NI W # % A P NI W # % A P NI W
SubgroupsStudents w/disabilities 23 96 0 2239 39 55.4 N/A N/A 58 98 0 12484052.2 N/A N/A 13,059 97 1 10375249.7 N/A N/A ELL and Former ELL 3 3 5,259 98 0 8 345741.8 N/A N/A Econ. Disadvantaged 29 97 0 1466 21 57.8 N/A N/A 60 98 2 22631364.6 N/A N/A 20,821 98 2 19443656.4 N/A N/A High needs 45 98 0 2053 27 59.4 N/A N/A 106 99 1 19562560.6 N/A N/A 30,036 98 1 17433855.7 N/A N/A Afr. Amer./Black 1 3 6,130 98 1 15443953.1 N/A N/A Amer. Ind. or Alaska Nat. 1 136 97 3 28432665.1 N/A N/A Asian 1 4,412 99 1546291082.5 N/A N/A Hispanic/Latino 5 13 93 8 2362 8 71.2 N/A N/A 11,867 98 1 17423954.0 N/A N/A Multirace, NonHisp./Lat. 5 8 1,935 98 8 34411773.0 N/A N/A Nat. Haw. or Pacif. Isl. 70 100 7 21393361.1 N/A N/A White 122 99 4 4143 11 76.2 N/A N/A 267 100 3 42451076.2 N/A N/A 46,053 99 7 41401277.0 N/A N/A Male 64 98 6 3839 17 74.2 N/A N/A 151 99 3 38441572.5 N/A N/A 36,004 99 6 35382071.3 N/A N/A Female 69 99 3 4346 7 78.3 N/A N/A 142 99 4 4446 6 79.2 N/A N/A 34,625 99 5 35421871.2 N/A N/A ELL 1 1 3,884 98 0 4 286736.2 N/A N/A Ever ELL 5 8 11,323 99 3 19413755.5 N/A N/A All Students2016 133 99 5 4143 12 76.3 N/A N/A 293 99 3 4145 11 75.8 N/A N/A 70,640 99 6 35401971.3 N/A N/A 2015 138 99 1 5142 6 81.5 N/A N/A 265 97 1 4944 6 79.9 N/A N/A 71,861 99 3 39401872.4 N/A N/A

11/28/2016 2016 Report Card - Hawthorne Brook (07350030)
http://profiles.doe.mass.edu/reportcard/rc.aspx?linkid=37&orgcode=07350030&fycode=2016&orgtypecode=6& 12/19
ALL GRADES ENGLISH LANGUAGE ARTS
Student Group
School District StateStud.Incl
Part.Rate
% at EachLevel
CPI SGPIncl. inSGP(#)
Stud.Incl
Part.Rate
% at EachLevel
CPI SGPIncl. inSGP(#)
Stud.Incl
Part.Rate
% atEachLevel
CPISGPIncl. inSGP (#)
# % A P NI W # % A P NI W # % APNIWSubgroupsStudents w/disabilities 83 99 0 37471672.0 53.0 82 394 98 1 36451874.0 50.0 277 ELL and Former ELL 4 18 90 11 3350 6 76.4 N/A 10 Econ. Disadvantaged 96 100 8 5034 7 81.8 44.0 92 345 99 8 5332 6 84.3 50.0 262 High needs 160 98 5 4839 9 79.8 49.0 156 644 98 5 4737 11 80.3 50.0 472 Afr. Amer./Black 1 15 94 274027 7 85.0 N/A 11 Amer. Ind. or Alaska Nat. 2 Asian 4 20 100 254530 0 87.5 N/A 15 Hispanic/Latino 16 94 6 69131385.9 N/A 16 63 97 6 5627 11 82.5 45.0 45 Multirace, NonHisp./Lat. 18 100 11 6122 6 90.3 N/A 17 56 100 274520 9 87.5 62.0 49 Nat. Haw. or Pacif. Isl. White 452 99 11 6520 4 90.5 48.5 448 1,653 99 185721 4 90.5 52.0 1,311 Male 234 99 6 6422 7 87.2 49.0 230 918 98 11 5823 7 87.6 52.0 720 Female 257 99 146718 1 93.5 48.0 256 891 99 245519 2 92.6 54.0 713 ELL 8 Ever ELL 8 31 94 133942 6 79.8 68.0 23 All Students2016 491 99 11 6620 4 90.5 49.0 486 1,809 99 185621 5 90.1 53.0 1,433 2015 526 99 136021 5 89.2 44.0 511 1,820 98 205519 5 90.1 49.0 1,441 216,396 99 50.0 175,934

11/28/2016 2016 Report Card - Hawthorne Brook (07350030)
http://profiles.doe.mass.edu/reportcard/rc.aspx?linkid=37&orgcode=07350030&fycode=2016&orgtypecode=6& 13/19
ALL GRADES MATHEMATICS
Student Group
School District StateStud.Incl
Part.Rate
% at EachLevel
CPI SGPIncl. inSGP(#)
Stud.Incl
Part.Rate
% at EachLevel
CPI SGPIncl. inSGP(#)
Stud.Incl
Part.Rate
% atEachLevel
CPISGPIncl. inSGP (#)
# % A P NI W # % A P NI W # % APNIWSubgroupsStudents w/disabilities 83 99 0 10395244.6 44.0 83 391 97 5 16384158.0 44.0 267 ELL and Former ELL 4 18 90 11 3944 6 77.8 N/A 10 Econ. Disadvantaged 95 99 7 29372664.5 38.0 94 339 97 1532351874.5 43.0 262 High needs 159 98 4 23403359.1 42.0 158 639 98 11 25372767.8 44.0 464 Afr. Amer./Black 1 14 88 2136142975.0 N/A 11 Amer. Ind. or Alaska Nat. 2 Asian 4 20 100 3545101087.5 N/A 15 Hispanic/Latino 16 94 2538132576.6 N/A 16 63 98 1732321976.6 35.0 46 Multirace, NonHisp./Lat. 18 100 1728332270.8 N/A 18 56 100 3027291478.6 57.5 50 Nat. Haw. or Pacif. Isl. White 452 99 1833361376.6 48.0 449 1,648 99 293227 11 83.0 49.0 1,302 Male 233 99 2127351773.5 46.5 230 915 98 2931261481.1 47.0 718 Female 258 99 1738361079.4 49.0 258 888 99 293328 9 84.2 51.0 708 ELL 8 Ever ELL 8 31 94 2326351673.4 53.0 23 All Students2016 491 99 1933351376.6 48.0 488 1,803 99 293227 11 82.6 49.0 1,426 2015 528 99 2335291379.3 45.0 514 1,830 99 273527 11 82.8 45.0 1,448 216,363 99 50.0 176,568

11/28/2016 2016 Report Card - Hawthorne Brook (07350030)
http://profiles.doe.mass.edu/reportcard/rc.aspx?linkid=37&orgcode=07350030&fycode=2016&orgtypecode=6& 14/19
ALL GRADES SCIENCE AND TECH/ENG
Student Group
School District StateStud.Incl
Part.Rate
% at EachLevel
CPI SGPIncl. inSGP(#)
Stud.Incl
Part.Rate
% at EachLevel
CPI SGPIncl. inSGP(#)
Stud.Incl
Part.Rate
% at EachLevel
CPI SGPIncl.inSGP(#)# % A P NI W # % A P NI W # % A P NI W
SubgroupsStudents w/disabilities 43 96 5 23492364.5 N/A N/A 149 97 5 19492860.4 N/A N/A 38,109 98 3 18413859.7 N/A N/A ELL and Former ELL 3 4 18,594 99 3 16433954.1 N/A N/A Econ. Disadvantaged 49 98 2 29551467.9 N/A N/A 128 99 3 3452 11 72.3 N/A N/A 61,476 98 6 26432565.8 N/A N/A High needs 82 98 4 29501768.9 N/A N/A 243 98 5 28491967.6 N/A N/A 89,857 98 6 25432665.4 N/A N/A Afr. Amer./Black 1 6 17,761 99 5 24442763.9 N/A N/A Amer. Ind. or Alaska Nat. 1 422 98 9 33401971.9 N/A N/A Asian 6 13,043 99 303923 7 86.8 N/A N/A Hispanic/Latino 6 22 96 9 4141 9 77.3 N/A N/A 35,316 99 5 24422862.9 N/A N/A Multirace, NonHisp./Lat. 7 14 93 7 50291480.4 N/A N/A 6,053 99 1936331279.5 N/A N/A Nat. Haw. or Pacif. Isl. 208 100 1832321875.8 N/A N/A White 223 99 9 4142 8 80.0 N/A N/A 660 99 154434 8 82.5 N/A N/A 135,382 99 204230 8 84.1 N/A N/A Male 113 99 1238371378.1 N/A N/A 355 98 1441341279.2 N/A N/A 106,211 99 1737331478.4 N/A N/A Female 124 98 7 4445 4 81.9 N/A N/A 354 99 154635 4 85.2 N/A N/A 102,022 99 1737341279.1 N/A N/A ELL 1 1 11,822 98 1 8 395145.3 N/A N/A Ever ELL 5 12 100 25 8 58 8 68.8 N/A N/A 33,065 99 8 25402764.2 N/A N/A All Students2016 237 99 9 4141 8 80.1 N/A N/A 709 99 154334 8 82.2 N/A N/A 208,262 99 1737331378.7 N/A N/A 2015 268 99 2 4845 5 80.8 N/A N/A 734 99 154534 6 84.1 N/A N/A 210,454 99 1539331279.4 N/A N/A

11/28/2016 2016 Report Card - Hawthorne Brook (07350030)
http://profiles.doe.mass.edu/reportcard/rc.aspx?linkid=37&orgcode=07350030&fycode=2016&orgtypecode=6& 15/19
Lowest performing Highest performing
2016 Accountability Data Hawthorne BrookAccountability InformationAccountability and Assistance Level
Level 2 Not meeting gap narrowing goals
This school's overall performance relative to other schools in same school type (School percentiles: 199)All students: 52
This school’s progress toward narrowing proficiency gaps (Cumulative Progress and Performance Index: 1100)Student Group
(Click group to view subgroupdata)
On Target = 75 or higher Less progress More progress
All students 51 Did Not Meet TargetHigh needs 64 Did Not Meet Target
Econ. Disadvantaged ELL and Former ELL Students w/disabilities 61 Did Not Meet TargetAmer. Ind. or Alaska Nat. Asian Afr. Amer./Black Hispanic/Latino Multirace, NonHisp./Lat. Nat. Haw. or Pacif. Isl. White 53 Did Not Meet Target

11/28/2016 2016 Report Card - Hawthorne Brook (07350030)
http://profiles.doe.mass.edu/reportcard/rc.aspx?linkid=37&orgcode=07350030&fycode=2016&orgtypecode=6& 16/19
Hawthorne Brook:Accountability Data Detail
2016 English Language Arts Proficiency Gap Narrowing
0 10 20 30 40 50 60 70 80 90 100
BaselineCPI
2015CPI
2016CPI
CPIChange
2016Target
6 YearGoal
CPIPercentilein SchoolType
N PPIPoints
Rating
All students 91.8 89.2 90.5 1.3 95.2 95.9 52 491 50 Improved Below TargetHigh needs 79.7 76.9 79.8 2.9 88.2 89.9 44 160 50 Improved Below TargetEcon. Disadvantaged 84.0 84.0 81.8 2.2 85.3 92.0 41 96 25 No ChangeELL and Former ELL 4 Students w/disabilities 71.1 63.8 72.0 8.2 83.1 85.6 56 83 50 Improved Below TargetAmer. Ind. or Alaska Nat. Asian 4 Afr. Amer./Black 1 Hispanic/Latino 16 Multirace, NonHisp./Lat. 18 Nat. Haw. or Pacif. Isl. White 92.1 89.4 90.5 1.1 95.4 96.1 39 452 50 Improved Below Target
2016 Mathematics Proficiency Gap Narrowing
0 10 20 30 40 50 60 70 80 90 100
BaselineCPI
2015CPI
2016CPI
CPIChange
2016Target
6 YearGoal
CPIPercentilein SchoolType
N PPIPoints
Rating
All students 76.1 79.3 76.6 2.7 86.1 88.1 41 491 0 DeclinedHigh needs 58.5 60.8 59.1 1.7 75.8 79.3 27 159 25 No ChangeEcon. Disadvantaged 68.5 68.5 64.5 4.0 71.1 84.3 36 95 0 DeclinedELL and Former ELL 4 Students w/disabilities 45.6 44.0 44.6 0.6 68.3 72.8 31 83 50 Improved Below TargetAmer. Ind. or Alaska Nat. Asian 4 Afr. Amer./Black 1 Hispanic/Latino 16 Multirace, NonHisp./Lat. 18 Nat. Haw. or Pacif. Isl. White 76.5 79.5 76.6 2.9 86.3 88.3 26 452 0 Declined
2016 Science Proficiency Gap Narrowing
0 10 20 30 40 50 60 70 80 90 100
BaselineCPI
2015CPI
2016CPI
CPIChange
2016Target
6 YearGoal
CPIPercentilein SchoolType
N PPIPoints
Rating
All students 78.7 80.8 80.1 0.7 87.6 89.4 71 237 25 No ChangeHigh needs 63.7 68.9 68.9 0.0 78.8 81.9 84 82 25 No ChangeEcon. Disadvantaged 72.7 72.7 67.9 4.8 75.0 86.4 71 49 0 DeclinedELL and Former ELL 3 Students w/disabilities 58.0 59.8 64.5 4.7 75.5 79.0 90 43 75 On TargetAmer. Ind. or Alaska Nat. Asian Afr. Amer./Black 1 Hispanic/Latino 6 Multirace, NonHisp./Lat. 7 Nat. Haw. or Pacif. Isl. White 79.8 81.5 80.0 1.5 88.2 89.9 61 223 25 No Change
2016 English Language Arts Extra Credit Extra credit for increasing % Advanced (10% or more) Extra credit for decreasing % Warning/Failing (10% or more)
2015% Advanced
2016% Advanced
N PPI Points 2015% Warning/Failing
2016% Warning/Failing
N PPI Points
All students 13.5 10.6 491 0 4.9 3.9 491 25High needs 6.4 5.0 160 0 12.2 8.8 160 25Econ. Disadvantaged 9.7 8.3 96 0 8.7 7.3 96 25ELL and Former ELL 4 4 Students w/disabilities 2.3 0.0 83 0 19.5 15.7 83 25Amer. Ind. or Alaska Nat. Asian 4 4 Afr. Amer./Black 1 1 Hispanic/Latino 16 16 Multirace, NonHisp./Lat. 18 18 Nat. Haw. or Pacif. Isl. White 13.5 10.6 452 0 4.8 3.5 452 25
2016 Mathematics Extra Credit

11/28/2016 2016 Report Card - Hawthorne Brook (07350030)
http://profiles.doe.mass.edu/reportcard/rc.aspx?linkid=37&orgcode=07350030&fycode=2016&orgtypecode=6& 17/19
Extra credit for increasing % Advanced (10% or more) Extra credit for decreasing % Warning/Failing (10% or more)2015
% Advanced2016
% AdvancedN PPI Points 2015
% Warning/Failing2016
% Warning/FailingN PPI Points
All students 22.5 18.5 491 0 13.3 13.4 491 0High needs 11.6 4.4 159 0 31.8 32.7 159 0Econ. Disadvantaged 15.4 7.4 95 0 21.2 26.3 95 0ELL and Former ELL 4 4 Students w/disabilities 1.1 0.0 83 0 54.5 51.8 83 0Amer. Ind. or Alaska Nat. Asian 4 4 Afr. Amer./Black 1 1 Hispanic/Latino 16 16 Multirace, NonHisp./Lat. 18 18 Nat. Haw. or Pacif. Isl. White 22.0 18.1 452 0 12.9 12.8 452 0
2016 Science Extra Credit Extra credit for increasing % Advanced (10% or more) Extra credit for decreasing % Warning/Failing (10% or more)
2015% Advanced
2016% Advanced
N PPI Points 2015% Warning/Failing
2016% Warning/Failing
N PPI Points
All students 2.2 9.3 237 25 5.2 8.4 237 0High needs 2.2 3.7 82 25 12.2 17.1 82 0Econ. Disadvantaged 3.6 2.0 49 0 10.9 14.3 49 0ELL and Former ELL 3 3 Students w/disabilities 2.2 4.7 43 25 19.6 23.3 43 0Amer. Ind. or Alaska Nat. Asian Afr. Amer./Black 1 1 Hispanic/Latino 6 6 Multirace, NonHisp./Lat. 7 7 Nat. Haw. or Pacif. Isl. White 2.4 9.4 223 25 4.5 8.1 223 0
2016 English Language Arts Growth
0 10 20 30 40 50 60 70 80 90 100
2015SGP
2016SGP
SGPChange
6 YearGoal
MetSafe
Harbor?
N PPIPoints
Rating
All students 44.0 49.0 5.0 51.0 No 486 50 Below TargetHigh needs 38.0 49.0 11.0 51.0 No 156 75 On TargetEcon. Disadvantaged 42.0 44.0 2.0 51.0 No 92 50 Below TargetELL and Former ELL 51.0 4 Students w/disabilities 38.0 53.0 15.0 51.0 Yes 82 100 Above TargetAmer. Ind. or Alaska Nat. 51.0 Asian 51.0 4 Afr. Amer./Black 51.0 1 Hispanic/Latino 51.0 16 Multirace, NonHisp./Lat. 51.0 17 Nat. Haw. or Pacif. Isl. 51.0 White 43.0 48.5 5.5 51.0 No 448 50 Below Target
2016 Mathematics Growth
0 10 20 30 40 50 60 70 80 90 100
2015SGP
2016SGP
SGPChange
6 YearGoal
MetSafe
Harbor?
N PPIPoints
Rating
All students 45.0 48.0 3.0 51.0 No 488 50 Below TargetHigh needs 44.0 42.0 2.0 51.0 No 158 50 Below TargetEcon. Disadvantaged 50.0 38.0 12.0 51.0 No 94 25 Below TargetELL and Former ELL 51.0 4 Students w/disabilities 40.0 44.0 4.0 51.0 No 83 50 Below TargetAmer. Ind. or Alaska Nat. 51.0 Asian 51.0 4 Afr. Amer./Black 51.0 1 Hispanic/Latino 51.0 16 Multirace, NonHisp./Lat. 51.0 18 Nat. Haw. or Pacif. Isl. 51.0 White 44.0 48.0 4.0 51.0 No 449 50 Below Target
2016 Extra credit for English language proficiency growth 2016 SGPA 2016 Target SGPA N Included PPI Points
All students 60.0 1 High needs 60.0 1 ELL and Former ELL 60.0 1
2016 Assessment Participation English Language Arts Mathematics Science

11/28/2016 2016 Report Card - Hawthorne Brook (07350030)
http://profiles.doe.mass.edu/reportcard/rc.aspx?linkid=37&orgcode=07350030&fycode=2016&orgtypecode=6& 18/19
Enrolled Assessed % Met Target (95%) Enrolled Assessed % Met Target (95%) Enrolled Assessed % Met Target (95%)All students 505 500 99 Yes 506 501 99 Yes 247 244 99 YesHigh needs 170 167 98 Yes 171 167 98 Yes 89 87 98 YesEcon. Disadvantaged 102 102 100 Yes 103 102 99 Yes 55 54 98 YesELL and Former ELL 6 6 3 Students w/disabilities 86 85 99 Yes 86 85 99 Yes 45 43 96 YesAmer. Ind. or Alaska Nat. Asian 4 4 Afr. Amer./Black 2 2 1 Hispanic/Latino 17 17 7 Multirace, NonHisp./Lat. 18 18 7 Nat. Haw. or Pacif. Isl. White 464 461 99 Yes 465 462 99 Yes 232 230 99 Yes
NOTE: In 2016, assessment participation was calculated two ways: First, the 2016 participation rate for each subgroup in each subject area test was calculated. If the actual 2016participation rate was lower than 95 percent for any group in any subject, that rate was compared to the average of the most recent two years of assessment participation data for that groupand subject. The higher of the two resulting rates was factored into the assignment of the school or district's 2016 accountability and assistance level.
11/28/2016 2016 Report Card - Hawthorne Brook (07350030)
http://profiles.doe.mass.edu/reportcard/rc.aspx?linkid=37&orgcode=07350030&fycode=2016&orgtypecode=6& 19/19
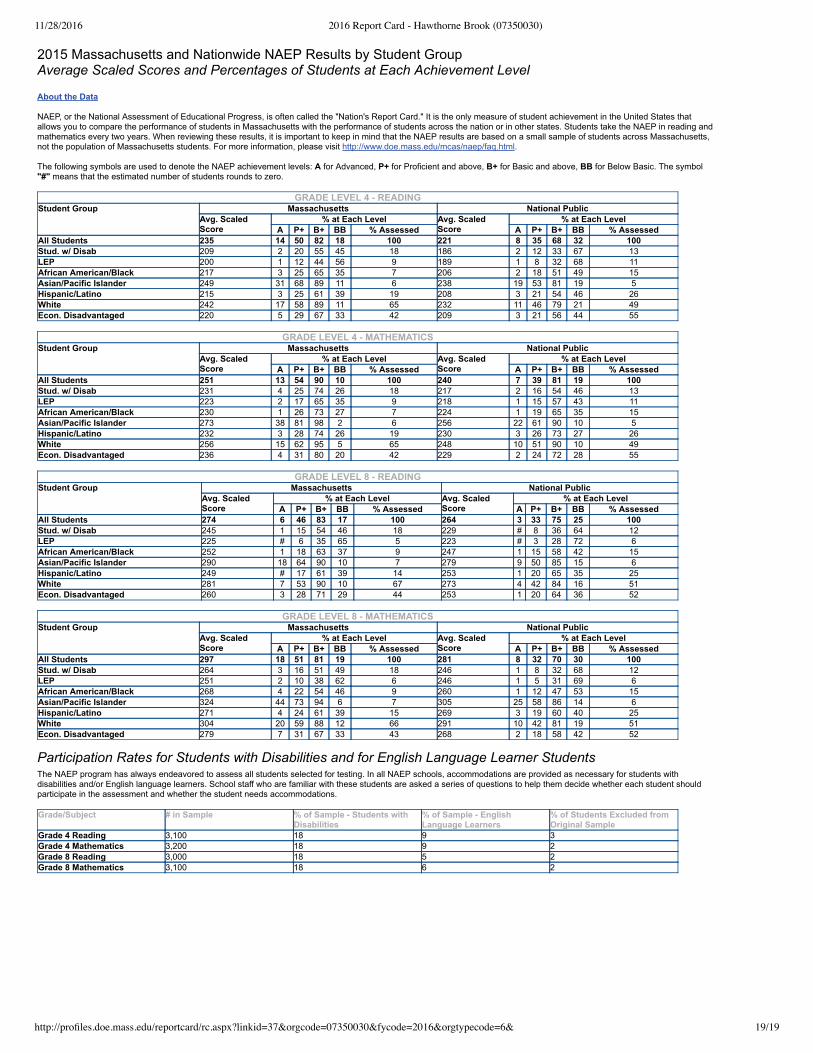
2015 Massachusetts and Nationwide NAEP Results by Student GroupAverage Scaled Scores and Percentages of Students at Each Achievement Level
About the Data
NAEP, or the National Assessment of Educational Progress, is often called the "Nation's Report Card." It is the only measure of student achievement in the United States thatallows you to compare the performance of students in Massachusetts with the performance of students across the nation or in other states. Students take the NAEP in reading andmathematics every two years. When reviewing these results, it is important to keep in mind that the NAEP results are based on a small sample of students across Massachusetts,not the population of Massachusetts students. For more information, please visit http://www.doe.mass.edu/mcas/naep/faq.html.
The following symbols are used to denote the NAEP achievement levels: A for Advanced, P+ for Proficient and above, B+ for Basic and above, BB for Below Basic. The symbol"#" means that the estimated number of students rounds to zero.
GRADE LEVEL 4 READINGStudent Group Massachusetts National Public
Avg. ScaledScore
% at Each Level Avg. ScaledScore
% at Each LevelA P+ B+ BB % Assessed A P+ B+ BB % Assessed
All Students 235 14 50 82 18 100 221 8 35 68 32 100Stud. w/ Disab 209 2 20 55 45 18 186 2 12 33 67 13LEP 200 1 12 44 56 9 189 1 8 32 68 11African American/Black 217 3 25 65 35 7 206 2 18 51 49 15Asian/Pacific Islander 249 31 68 89 11 6 238 19 53 81 19 5Hispanic/Latino 215 3 25 61 39 19 208 3 21 54 46 26White 242 17 58 89 11 65 232 11 46 79 21 49Econ. Disadvantaged 220 5 29 67 33 42 209 3 21 56 44 55
GRADE LEVEL 4 MATHEMATICSStudent Group Massachusetts National Public
Avg. ScaledScore
% at Each Level Avg. ScaledScore
% at Each LevelA P+ B+ BB % Assessed A P+ B+ BB % Assessed
All Students 251 13 54 90 10 100 240 7 39 81 19 100Stud. w/ Disab 231 4 25 74 26 18 217 2 16 54 46 13LEP 223 2 17 65 35 9 218 1 15 57 43 11African American/Black 230 1 26 73 27 7 224 1 19 65 35 15Asian/Pacific Islander 273 38 81 98 2 6 256 22 61 90 10 5Hispanic/Latino 232 3 28 74 26 19 230 3 26 73 27 26White 256 15 62 95 5 65 248 10 51 90 10 49Econ. Disadvantaged 236 4 31 80 20 42 229 2 24 72 28 55
GRADE LEVEL 8 READINGStudent Group Massachusetts National Public
Avg. ScaledScore
% at Each Level Avg. ScaledScore
% at Each LevelA P+ B+ BB % Assessed A P+ B+ BB % Assessed
All Students 274 6 46 83 17 100 264 3 33 75 25 100Stud. w/ Disab 245 1 15 54 46 18 229 # 8 36 64 12LEP 225 # 6 35 65 5 223 # 3 28 72 6African American/Black 252 1 18 63 37 9 247 1 15 58 42 15Asian/Pacific Islander 290 18 64 90 10 7 279 9 50 85 15 6Hispanic/Latino 249 # 17 61 39 14 253 1 20 65 35 25White 281 7 53 90 10 67 273 4 42 84 16 51Econ. Disadvantaged 260 3 28 71 29 44 253 1 20 64 36 52
GRADE LEVEL 8 MATHEMATICSStudent Group Massachusetts National Public
Avg. ScaledScore
% at Each Level Avg. ScaledScore
% at Each LevelA P+ B+ BB % Assessed A P+ B+ BB % Assessed
All Students 297 18 51 81 19 100 281 8 32 70 30 100Stud. w/ Disab 264 3 16 51 49 18 246 1 8 32 68 12LEP 251 2 10 38 62 6 246 1 5 31 69 6African American/Black 268 4 22 54 46 9 260 1 12 47 53 15Asian/Pacific Islander 324 44 73 94 6 7 305 25 58 86 14 6Hispanic/Latino 271 4 24 61 39 15 269 3 19 60 40 25White 304 20 59 88 12 66 291 10 42 81 19 51Econ. Disadvantaged 279 7 31 67 33 43 268 2 18 58 42 52
Participation Rates for Students with Disabilities and for English Language Learner StudentsThe NAEP program has always endeavored to assess all students selected for testing. In all NAEP schools, accommodations are provided as necessary for students withdisabilities and/or English language learners. School staff who are familiar with these students are asked a series of questions to help them decide whether each student shouldparticipate in the assessment and whether the student needs accommodations.
Grade/Subject # in Sample % of Sample Students withDisabilities
% of Sample EnglishLanguage Learners
% of Students Excluded fromOriginal Sample
Grade 4 Reading 3,100 18 9 3Grade 4 Mathematics 3,200 18 9 2Grade 8 Reading 3,000 18 5 2Grade 8 Mathematics 3,100 18 6 2