116th annual convention - ncpa · 116th annual convention date: tuesday, october 21, 2014 ......
TRANSCRIPT

116th Annual Convention
Date: Tuesday, October 21, 2014 Time: 8:30 am – 10:00 am Location: Austin Convention Center, Room 18CD, Level 4 Title: NCPA Digest, Sponsored by Cardinal Health: A Guide to Improved Pharmacy
Practice Sponsored by Cardinal Health
ACPE # 207-000-14-227-L04-P 0.15 CEUs ACPE # 207-000-14-227-L04-T Activity Type: Application-based Speaker: Donna West-Strum, Chair and Associate Professor of Pharmacy Administration,
Research Associate Professor, Research Institute of Pharmaceutical Sciences, School of Pharmacy, The University of Mississippi Richard Jackson, PhD, President, Community Pharmacy Consulting
Pharmacist and Pharmacy Technician Learning Objectives: Upon completion of this activity, participants will be able to: 1. Discuss financial performance trends in independent community pharmacy in 2013. 2. Outline how to utilize pharmacy average data to benchmark individual performance indicators from a
community pharmacy. 3. Summarize key data to collect to assess pharmacy niche performance. Disclosures: Donna West-Strum is receiving an honorarium for this program. The conflict of interest was resolved by peer review of the slide content. Richard Jackson is the President of Community Pharmacy Consulting and is receiving an honorarium for this program. The conflict of interest was resolved by peer review of the slide content. NCPA’s education staff declares no conflicts of interest or financial interest in any product or service mentioned in this program, including grants, employment, gifts, stock holdings, and honoraria.
NCPA is accredited by the Accreditation Council for Pharmacy Education as a provider of continuing pharmacy education. This program is accredited by NCPA for 0.15 CEUs (1.5 contact hours) of continuing education credit.

NCPA Disclosure Statement The National Community Pharmacists Association (NCPA) Office of Continuing Education makes every effort to develop continuing education activities that are scientifically based, accurate, current, and objectively presented. In accordance with the Accreditation Council for Pharmacy Education Standards for Commercial Support NCPA has implemented a mechanism requiring everyone in a position to control the content of an educational activity to disclose any relevant financial relationships with any proprietary entities producing health care goods or services and mange/resolve any conflicts of interest prior to the activity. Individuals must disclose to participants the existence or non-existence of financial relationships. NCPA does not view the existence of interests or relationships with commercial entities as implying bias or decreasing the value of a presentation. It is up to the participants to determine whether the interest or relationships influence the presenter with regard to exposition or conclusions. If at any time during this activity you feel that there has been commercial or promotional bias, please inform us by reflecting the information on the session evaluation form.

10/10/2014
1
NCPA Digest, Sponsored by Cardinal Health:
A Guide to Improved Pharmacy Practice
Donna West Strum, RPh, PhDChair and Professor
Department of Pharmacy AdministrationUniversity of Mississippi
DisclosureDisclosure
Donna West Strum is receiving an honorarium for this program. The conflict of interest was resolved by peer review of the slide content.
Learning ObjectivesLearning Objectives
1. Discuss financial performance trends in independent community pharmacy in 2013.
2. Outline how to utilize pharmacy average data to benchmark individual performance indicators from a community pharmacy.
3. Identify key data to collect to assess pharmacy niche performance.

10/10/2014
2
MEET. LEARN.SUCCEED
MEET. LEARN.SUCCEED
Nationwide
MEET. LEARN.SUCCEED
Adapting to a changing marketplace

10/10/2014
3
MEET. LEARN.SUCCEED
Digest Methodology
• Summarizes data from independent pharmacies nationwide
• Independent owners having completed at least one year of operations with dispensing business are asked to participate
• Electronic data collection• Self‐administered survey; data from 2013• Data analyzed and published
– Public and Member version– Geographic region, third‐party volume, location comparisons
MEET. LEARN.SUCCEED
Sales
MEET. LEARN.SUCCEED
Prescription Volume
2009 2010 2011 2012 2013
RxVolume
64,635 64,169 62,969 62,583 62,424
Mean Rx charge= $57.50 (up from $56.04)54% refills, chronic medications

10/10/2014
4
MEET. LEARN.SUCCEED
Generic Prescriptions
MEET. LEARN.SUCCEED
Third‐Party Prescriptions
MEET. LEARN.SUCCEED
Sales
92% prescription sales

10/10/2014
5
MEET. LEARN.SUCCEED
Pharmacy Operations
MEET. LEARN.SUCCEED
Payroll Expenses
MEET. LEARN.SUCCEED

10/10/2014
6
MEET. LEARN.SUCCEED
Cost of Dispensing
= Total annual costs allocated to Rx department
Total annual number of Rxs dispensed
• All pharmacies= $11.17, down from $11.96
MEET. LEARN.SUCCEED
Technology
MEET. LEARN.SUCCEED
Quiz
• Total average sales in independent community pharmacy _____________ in 2013.
– A. increased
– B. decreased
• Independent community pharmacists continue to increase their expenses and cost to dispense to make sure that they are providing excellent service. – A. True
– B. False

10/10/2014
7
MEET. LEARN.SUCCEED
Niche Markets
• Pharmacists are health care providers
MEET. LEARN.SUCCEED
Patient Care Services
MEET. LEARN.SUCCEED
Disease State Management Services

10/10/2014
8
MEET. LEARN.SUCCEED
Technology to Engage Patients
MEET. LEARN.SUCCEED
MTM Services
MEET. LEARN.SUCCEED
Adherence
• 67% offer adherence services

10/10/2014
9
MEET. LEARN.SUCCEED
Medication Synchronization
MEET. LEARN.SUCCEED
Medication Synchronization
MEET. LEARN.SUCCEED
Niches

10/10/2014
10
MEET. LEARN.SUCCEED
Health Care Team
MEET. LEARN.SUCCEED
Health Care Team
MEET. LEARN.SUCCEED
Health Care Team

10/10/2014
11
MEET. LEARN.SUCCEED
Health Care Team
MEET. LEARN.SUCCEED
Changing Healthcare Marketplace
• Medicare Part D Star Ratings
• Equipp
• Network decisions
• Pay for performance
MEET. LEARN.SUCCEED
Case Study
• Your pharmacy decides to implement a medication synchronization program.
– How might this program improve sales in your pharmacy?
– How might this program affect your prescription volume?
– How might this program affect your payroll expenses?
– How might this program affect performance measures that CMS or others are wanting to measure?

10/10/2014
12
MEET. LEARN.SUCCEED
Financial Trends
MEET. LEARN.SUCCEED
Comparison of Average to Top 25%
• Top 25% have lower cost of goods sold, lower payroll expenses, and lower operating expenses as percent of sales and thus have higher gross profits before taxes.– Products with higher gross margins– Very selective on third‐party contracts– Efficient and productive employees– Mindful of operating expenses– Good relations with wholesaler; take advantage of opportunities to lower cost of goods sold
– Attentive to pricing strategies
MEET. LEARN.SUCCEED
Benchmarking
• Importance of benchmarking
• Benchmarking tools
– Income and expense or P&L statement
– Balance sheet
– Trend analysis
• Statements and ratios– Evaluate past performance for the store
– Compare with peers‐ DIGEST (average, Top 25%, subgroups)

10/10/2014
13
MEET. LEARN.SUCCEED
Key Financial Outcomes
• Profitability ‐‐ How effective have resources been used?
– Gross margin percentage
– Expense control
• Productivity ‐‐ Staff efficiency
• Financial Position ‐‐Managing assets and controlling debt
• Cash flow ‐‐Working capital; liquidity and solvency
MEET. LEARN.SUCCEED
Benchmarking Calculations
• Sales per employee=Sales/number of employees including owners
• Sales=$5,000,000
• Employees= 9
• Sales per employee=__________
– Digest for 2013
MEET. LEARN.SUCCEED
Benchmarking Calculations
• Current assets=$750,000
• Current liabilities= $250,000
• Current ratio=………………..
• Current ratio= Current assets
Current liabilities
=

10/10/2014
14
MEET. LEARN.SUCCEED
Benchmarking calculations
• =Cost of goods sold/Inventory
• Cost of goods sold=$3,000,000• Inventory=$300,000• ITOR=…………………
• Digest Inventory turnover– Technology– Wholesaler/cost of goods sold– Pricing‐sales
MEET. LEARN.SUCCEED
Leaders in Patient Care
• Blount Specialty Pharmacy in Blount County, Tennessee
• Southrifty Drug in Southampton, New York
– Community leader, take back drug program
• Dave Willink, new owner of Village Pharmacy
MEET. LEARN.SUCCEED
Leaders in the Community• Shaping policy‐ 50% of owners have direct personal relationships with a state representative or staffer; 7% of owners hold an elected office
• Supporting community‐35% of owners provide monetary support to 10 or more community organizations
• Developing business‐28% of owners are members of a local business association

10/10/2014
15
MEET. LEARN.SUCCEED
• Thank YOU for participating in survey
• Cardinal Health for funding
• NCPA staff
Acknowledgments
MEET. LEARN.SUCCEED
Conclusion
• Community pharmacists are leaders in patient care and innovative practice. They have great stories to tell about the many ways they care for their patients.
• Community pharmacists are maintaining their financial health while adapting to the changing health care environment. They continue to find market niches and expand their patient care services to improve healthcare in this country.
• Community pharmacists are capitalizing on opportunities like the Medicare Part D Star Ratings and demonstrating their value as a member of the health care team.
NCPA Digest, sponsored by Cardinal Health: A Guide to
Improved Pharmacy Practice
Richard A. Jackson, Ph.D.
Professor Emeritus, Mercer University College of Pharmacy and Health SciencesPresident, Community Pharmacy Consulting, Inc.

10/10/2014
16
MEET. LEARN.SUCCEED
Disclosure
Richard Jackson is the President of Community Pharmacy Consulting. Mr. Jackson received an honorarium for this workshop. The conflict of interest was resolved by peer review of the slide content.
MEET. LEARN.SUCCEED
Improving Your Financial Picture
More Profits
Transferring Ownership
MEET. LEARN.SUCCEED
Improving Your Financial Picture
More Profits
Transferring Ownership

10/10/2014
17
WHEN IS THE BEST TIME TO ANSWER A QUESTION?
Answer: Before You Have To
WHEN IS THE BEST TIME TO SOLVE A FINANCIAL PROBLEM IN YOUR PHARMACY
Answer: Before You Have To
MEET. LEARN.SUCCEED
Have an Annual Physical Exam
Conduct an Annual Fiscal Exam
At Least Once a Year

10/10/2014
18
MEET. LEARN.SUCCEED
Normalization of Data Three Sets of Books (financials)
For the Bank (Look Good)
For the IRS (Look Bad)
For the Owner (Look Real)
MEET. LEARN.SUCCEED
Financial Analysis
Comparative Analysis
Ratio Analysis
Identify Problems
Describe Solutions (Action Plan)
Define Measurable Outcomes (Goals)
Measure Success
MEET. LEARN.SUCCEED
Comparative Analysis Income Statement
Express Each Component of the Income Statement as a Percentage of Sales
Compare to NCPA Digest Averages and Top 25%

10/10/2014
19
MEET. LEARN.SUCCEED
Income Statement Analysis
Cost of Goods Sold
Expenses (Especially Personnel)
MEET. LEARN.SUCCEED
Comparative Analysis Balance Sheet
Express Each Component of the Balance Sheet as a Percentage of Total Assets
Compare with NCPA Digest Averages and Top 25%
MEET. LEARN.SUCCEED
Financial Ratio Analysis
Profitability Ratios
Productivity Ratios
Financial Position Ratios
Cash Flow Ratios

10/10/2014
20
MEET. LEARN.SUCCEED
Profitability Ratios
Net Profit Percentage
Net Income $ (Net Profit plus Owner Salary)
MEET. LEARN.SUCCEED
Productivity Ratios
Sales/Employee
Staff Salaries/Employee
Rx Sales/Sq. Ft.
Other Sales/Sq. Ft.
Total Sales/Sq. Ft.
MEET. LEARN.SUCCEED
Financial Position Ratios
Sales/Assets
Return on Investment (Net Profit/Net Worth)
Debt/Net Worth

10/10/2014
21
MEET. LEARN.SUCCEED
Cash Flow Ratios
Current Ratio
Quick or Acid Test Ratio
Inventory Turnover
Rx Inventory Turnover
Accounts Receivable Turnover
Accounts Payable Turnover
MEET. LEARN.SUCCEED
Areas For Improvement
Profit
Cost of Goods Sold
Expenses
Cash Flow
Accounts Receivable
Accounts Payable
Inventory
MEET. LEARN.SUCCEED
Improving Profit Cost of Goods Sold
Caveat: Even Small Differences Significant Too high, not indication of too much inventory
Beginning Inventory+ PurchasesCost of Goods Available for Sale‐ Ending InventoryCost of Goods Sold

10/10/2014
22
MEET. LEARN.SUCCEED
Improving Profit Cost of Goods Sold
Modify Pricing
Evaluate Source of Supply
Cash/Quantity Discounts
Shoplifting/Pilferage
Evaluate Third Parties
MEET. LEARN.SUCCEED
Third Party Dilemma Economics 101
In the long run, small business variable expenses do not increase in a linear fashion but stepwise.
Greatest variable expense is payroll.
MEET. LEARN.SUCCEED
Elementary Example
100 Rx’s/day
Third party contract (Cost + $2.50) increases volume 10 Rx/Day to 110 Rx/Day
Add 3 more contracts one at a time (Now 140/day)
Hire part‐time pharmacist 2 hours a day for $50/hour.
Increased work 40%, same income

10/10/2014
23
MEET. LEARN.SUCCEED
Improving Profits Expense Control
Personnel (Salaries and Wages)
Greatest Expense
Example: Decrease payroll from 10% to 9% of sales and increase net profit $40,000 or over 30%
To Decrease Payroll
Decrease Employees
Decrease Hours of Employees
Decrease Hours Pharmacy Open
MEET. LEARN.SUCCEED
Improving Cash Flow Accounts Receivable
Accounts Receivable Collection Period: Days to collect average account/third party.
AR Turnover = Credit and Third Party Sales/AR
ARCP = 365/AR Turnover
Usual Value is 15 Days
MEET. LEARN.SUCCEED
Improving Cash Flow Accounts Receivable
Reasons for Value Over 15 Days:
Too Liberal Extension of Credit
Poor Collection Policies
Late Paying Third Parties

10/10/2014
24
MEET. LEARN.SUCCEED
Improving Cash Flow Accounts Receivable
Example:
Credit and Third Party Sales = $2,000,000
Accounts Receivable = $109,589
AR Turnover = $2,000,000/$109,589 = 18.25
ARCP = 365/18.25 = 20 days
MEET. LEARN.SUCCEED
Improving Cash Flow Accounts Receivable
To what would accounts receivable of $109,589 have to be reduced to produce an acceptable ARCP of 15 days?
AR Turnover = 365/15 = 24.5
AR Turnover = Charge and TP sales/AR
24.5 = $2,000,000/AR
Therefore, AR = $81,632
MEET. LEARN.SUCCEED
Improving Cash Flow Accounts Receivable
How to Reduce Accounts Receivable
More Selective Credit Extension
More Aggressive Credit Collection
Evaluation of Third Party Plans

10/10/2014
25
MEET. LEARN.SUCCEED
Improving Cash Flow Accounts Payable
Normal is 15 ‐25 Days
Reasons for Too High Value (Low Cash)
Due to:
High Accounts Receivable
High Inventory
Low Profits (High COGS, High Expenses)
MEET. LEARN.SUCCEED
Improving Cash Flow Accounts Payable
Accounts Payable Collection Period: Days to pay average accounts payable.
AP Turnover = Annual Purchases/AP
APCP = 365/AP Turnover
Usual Value is 15 ‐ 25 Days
MEET. LEARN.SUCCEED
Example:
Purchases = $1,000,000
Accounts Payable = $82,684
AP Turnover = $1,000,000/$82,684 = 12.1
APCP = 365/12.1 = 30.1 days
Improving Cash Flow Accounts Payable
Example:
Purchases = $1,000,000
Accounts Payable = $82,684
AP Turnover = $1,000,000/$82,684 = 12.1
APCP = 365/12.1 = 30.1 days
10/10/2014
26
MEET. LEARN.SUCCEED
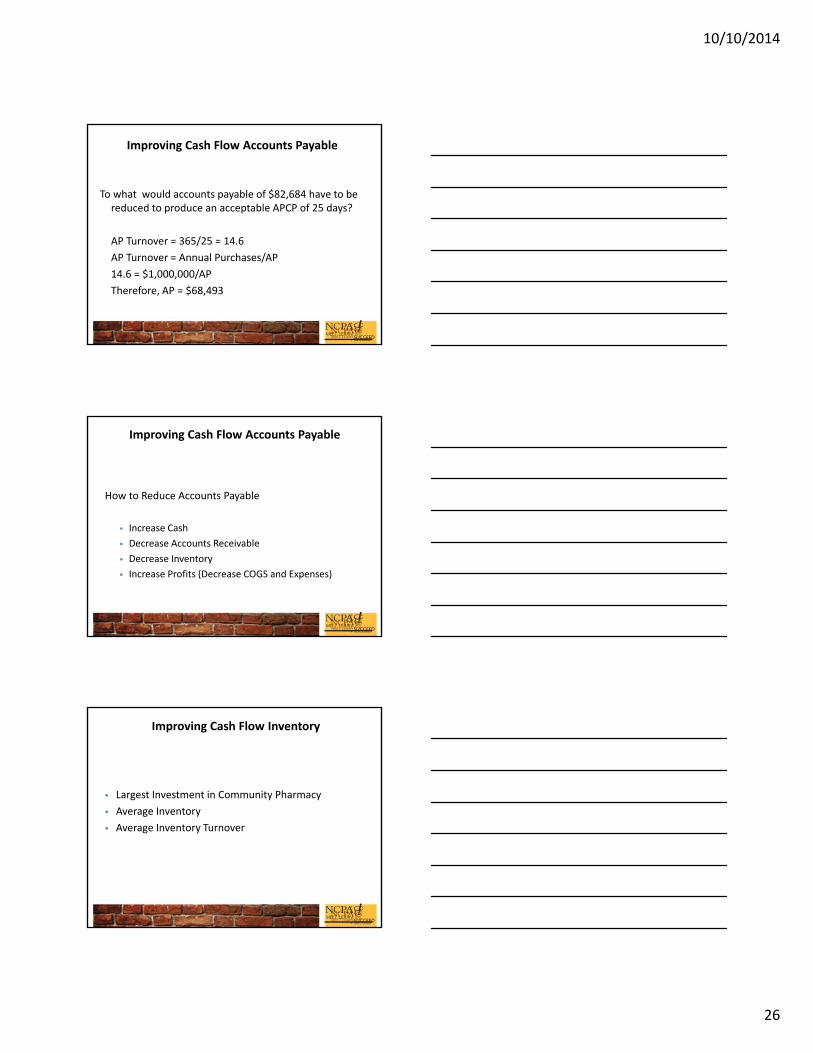
Improving Cash Flow Accounts Payable
To what would accounts payable of $82,684 have to be reduced to produce an acceptable APCP of 25 days?
AP Turnover = 365/25 = 14.6
AP Turnover = Annual Purchases/AP
14.6 = $1,000,000/AP
Therefore, AP = $68,493
MEET. LEARN.SUCCEED
Improving Cash Flow Accounts Payable
How to Reduce Accounts Payable
Increase Cash
Decrease Accounts Receivable
Decrease Inventory
Increase Profits (Decrease COGS and Expenses)
MEET. LEARN.SUCCEED
Improving Cash Flow Inventory
Largest Investment in Community Pharmacy
Average Inventory
Average Inventory Turnover

10/10/2014
27
MEET. LEARN.SUCCEED
Improving Cash Flow Inventory
Inventory Turnover = Cost of Goods Sold/Inventory
Example:
Cost of Goods Sold = $3,200,000
Inventory = $400,000
Inventory Turnover = $3,200,000/$400,000
Inventory Turnover = 8.0
MEET. LEARN.SUCCEED
Improving Cash Flow Inventory
To what would inventory of $400,000 have to be reduced to produce a more acceptable inventory turnover of 10.0?
Inventory Turnover = COGS/InventoryIf Inventory Turnover = 10.0 then,10 = $3,200,000/InventoryTherefore, Inventory = $320,000A Reduction of Approximately $80,000 or $6,666 per month for 12 months
MEET. LEARN.SUCCEED
How to Reduce Inventory
Open to Buy (OTB) Budget
Improving Cash Flow Inventory
How to Reduce Inventory
Open to Buy (OTB) Budget

10/10/2014
28
MEET. LEARN.SUCCEED
Open To Buy Budget
Entire Pharmacy
Department
MEET. LEARN.SUCCEED
Open To Buy Budget
Determine monthly Purchase Budget to:
Maintain desirable inventory level
Achieve desirable inventory level
MEET. LEARN.SUCCEED
Personal Purchase Budget
Monthly income previous month
Expenditures previous month

10/10/2014
29
MEET. LEARN.SUCCEED
Open‐to‐buy Budget: Based On Previous Months
Sales
Purchases
MEET. LEARN.SUCCEED
Open‐to‐buy Budget Adjusted Each Month
Sales previous month compared to expected sales
Purchases previous month compared to amount budgeted to purchase
MEET. LEARN.SUCCEED
Open To Buy Budget Example For October
Projected sales this year: $200,000
COGS = 75%
Unadjusted Purchase Budget: $200,000 X 0.75 = $150,000
Assume Inventory at Desirable Level

10/10/2014
30
MEET. LEARN.SUCCEED
Unadjusted Purchase Budget
Amount of inventory to purchase (at cost) to replace “expected” sales
MEET. LEARN.SUCCEED
Adjustments To UPB
Sales previous month compared to expected sales
Purchases previous month compared to purchase budget
MEET. LEARN.SUCCEED
Adjustment For Sales
Actual sales previous month (September) = $180,000
Projected sales = $200,000
Difference = $20,000
Didn’t sell as much as projected
Therefore, purchase less this month
Adjustment = $20,000 x 0.75 = $15,000 (minus)

10/10/2014
31
MEET. LEARN.SUCCEED
Adjustment For Purchases
Purchase budget previous month (September) = $160,000
Actual purchases = $150,000
$160,000 ‐ $150,000 = $10,000 (plus)
Need to purchase ($10,000) more this month
MEET. LEARN.SUCCEED
Adjusted Purchase Budget
Unadjusted purchase budget = $150,000
Adjusted for sales = Minus $15,000
Adjusted for purchases = Plus $10,000
Total adjustment = Minus $,5000
Adjusted purchase budget for October: $150,000 ‐ $5,000 = $145,000
To reduce $80,000 in year, reduce each month’s purchase budget $80,000/12 or $6,666.
Therefore purchase budget for October is $145,000 ‐$6,666 or $138,334.
RULE OF THUMB VALUATION FORMULAS*FOR AVERAGE PHARMACY
25 % of Sales
Return on Investment (ROI) or (NP/0.20)
Net Profit X 5
15% of Sales plus Inventory
1.5 (Net Profit + Owner Salary) + Inventory
*multipliers and % vary with net profit

10/10/2014
32
MEET. LEARN.SUCCEED
Example Community Pharmacy
Sales $3,000,000 (100%)
COGS 2,340,000 (78%)
Gross Margin 660,000 (22%)
Expenses
Owner Salary 110,000 (3.7%)
Payroll 282,000 (9.4%)
Total Expenses 510,000 (17.0%)
Net Profit 150,000 (5.0%)
Inventory: $200,000
MEET. LEARN.SUCCEED
Impact On Selling Price
Decrease COGS 1% to 77%
OR
Decrease Payroll 1% to 8.4%
MEET. LEARN.SUCCEED
Impact On Selling Price
Now
Decrease COGS 1% to 77% OR
Payroll 1% to 8.4% ($30,000)
Decrease COGS 1% to 77% AND
Payroll 1% to 8.4% ($30,000)
X(NP + OS) + Inventory
$590,000 $693,000 $808,000
Average $685,000 $823,250 $964,500
Difference $138,250 $279,500

10/10/2014
33
MEET. LEARN.SUCCEED
Impact On Selling Price
Now
Decrease COGS 1% to 77% OR
Payroll 1% to 8.4% ($30,000)
Decrease COGS 1% to 77% AND
Payroll 1% to 8.4% ($30,000)
% of Sales $750,000 $900,000 $1,050,000
ROI/NP $750,000 $900,000 $1,050,000
% Sales + Inventory
$650,000 $800,000 $950,0000
MEET. LEARN.SUCCEED
In Summary: Ways To Use Benchmarks
Improving Profit Decreasing Cost of Goods Sold Decreasing Expense (Personnel) Improving Cash Flow Increasing Cash Decreasing Accounts Receivable Decreasing Accounts Payable Decreasing Inventory