118111_musings 041211
TRANSCRIPT

MUSINGS FROM THE OIL PATCH April 12, 2011
Allen Brooks
Managing Director
Note: Musings from the Oil Patch reflects an eclectic collection of stories and analyses dealing with issues and developments within the energy industry that I feel have potentially significant implications for executives operating and planning for the future. The newsletter is published every two weeks, but periodically events and travel may alter that schedule. As always, I welcome your comments and observations. Allen Brooks Are Prospects For Natural Gas Shifting To The Plus Column? Even the leader of the country has bought into the mystique of the super abundance of natural gas from shale “He likes to tinker on this stuff in his garage on the weekend.”
“In terms of new sources of energy, we have a few different options. The first is natural gas.” These were the words of President Obama in his remarks entitled A Secure Energy Future
, delivered on March 30th at Georgetown University. For being the first of various energy fuel options, however, natural gas received precious little additional mention during the President’s comments other than his view that “recent innovations” have given the United States “the opportunity to tap large reserves – perhaps a century’s worth.” Even the leader of the country has bought into the mystique of the super abundance of natural gas from shale that appears to be ubiquitous throughout North America.
The President cautioned his listeners, though, that the government needs to make sure that the oil and gas industry is tapping these shale reserves “without polluting our water supply,” a bone thrown in the direction of environmentalists who seem to be losing in their efforts to restrict the burning of fossil fuels. In his comments, President Obama said he was asking Secretary of Energy Steven Chu to work with other federal agencies, various state governments, environmental specialists and the natural gas industry to “improve the safety of this process [hydraulic fracturing of gas shale formations].” President Obama made a point of mentioning that Secretary Chu has a Nobel Prize for physics. According to the President, “He likes to tinker on this stuff in his garage on the weekend.” We’re not sure whether that comment was to compare Secretary Chu to Bill Hewlett and David Packer who created a technology and commercial powerhouse company or to Christopher Lloyd who played Dr. Emmett “Doc” Brown in the 1985 film, Back to the Future
. We must say we haven’t met many physicists tinkering in the domestic oil and gas industry.

MUSINGS FROM THE OIL PATCH PAGE 2
APRIL 12, 2011
The financial crisis of 2008 has produced one of the most anemic economic recoveries since the Great Depression The upward pressure on global oil prices is likely to increase in the near-term
There appears to be a sort of Dr. Jekyll and Mr. Hyde outlook for natural gas. Recognized as a lower carbon, i.e., cleaner, alternative fuel choice that possesses significant energy and provides consumption flexibility to meet the multiple energy demands of modern society, natural gas should be in high demand. That demand should be further boosted by its current low price – the product of significant new supplies of gas and declines in energy markets needing it. The problem is that the financial crisis of 2008 has produced one of the most anemic economic recoveries since the Great Depression. The economic downturn and weak recovery has reduced energy demand. This, coupled with government mandates for increased use of renewable fuels in the utility sector, has created increased fuel-on-fuel price competition, in particular for coal and natural gas. But the real culprit has been the growth in supplies of new natural gas. Exhibit 1. Oil Prices Boosted By Geopolitical Problems
Source: EIA, PPHB At the same time gas prices were collapsing, explosive oil demand in the developing economies of the world, principally in Asia/Pacific, combined with geopolitical turmoil have driven oil prices significantly higher than where they would likely be absent the civil unrest in the Middle East and North Africa. As it appears, the political problems in Libya, and now Syria and Yemen, are not improving quickly and, in fact, could actually spread to additional Middle Eastern countries. The upward pressure on global oil prices is likely to increase in the near-term. The price divergence between crude oil and natural gas has produced a profoundly distorted relative valuation of these fuels. The energy content of natural gas to crude oil is 5.6 to 1.0, or six to one for ease of figuring. The current West Texas Intermediate (WTI)

MUSINGS FROM THE OIL PATCH PAGE 3
APRIL 12, 2011
The ratio of the price of crude oil to natural gas has expanded to about 25-times The gas rig count is reported weekly by several sources and is being sliced and diced regularly by analysts
Exhibit 2. Oil Trading At 25-times Gas Value
Source: EIA, PPHB crude oil price of about $112 per barrel suggests that a thousand cubic feet (Mcf) of natural gas should be valued at roughly $20. Instead, the ratio of the price of crude oil to natural gas has expanded to about 25-times. As can be seen in the chart in Exhibit 2, between 2005 and 2008, this ratio averaged around 10-times. Since the beginning of 2009, the ratio has increased to an average of about 20-times. Given the run-up in crude oil prices and the prospect of only modest increases in natural gas demand, the oil to gas ratio is now moving closer to an average of 25-times. At some point the ratio will reverse. The question is what will have to happen before that trend reverses? Most natural gas industry observers have focused on two trends in trying to understand market sentiment – the gas-directed rig count and the monthly gas production figures. The gas rig count is reported weekly by several sources and is being sliced and diced regularly by analysts trying to discern early movements in activity that may foreshadow declines in gas production, which presumably would lead to higher natural gas prices in the future. The problem is trying to ascertain how long in the future before gas prices might rise. The problem in answering the timing question is that natural gas production totals are reported monthly and then with at least a one month lag. The latest natural gas production figure for January (derived from the federal government’s survey on Form 914) showed only a very marginal decline from the prior month’s revised production estimate. On the chart in Exhibit 3, the latest decline looks somewhat larger because we plotted the initial production estimates as that is all we have from the January report.

MUSINGS FROM THE OIL PATCH PAGE 4
APRIL 12, 2011
There are questions about how much production might have been restricted to prevent producers selling gas into a weak pricing environment
Exhibit 3. Gas Production Growth Slowing
Source: EIA, PPHB We focus on the Lower 48 states’ gas production data as Alaska’s production, while important on a national basis, has little impact on the dynamics of natural gas prices. We do look at the trend in Gulf of Mexico natural gas production, which has shown a steady downtrend since 2005 and is not apt to change especially given the disruption to offshore drilling due to the BP oil spill. Exhibit 4. GOM Production On Down Trend
Source: EIA, PPHB When one removes the Gulf of Mexico from the Lower 48 gas production figures, what is left is natural gas production from land sources. While the chart visual shows a flattening of land production, there are questions about how much production might have been restricted to prevent producers selling gas into a weak pricing environment given the high levels of natural gas in storage. The real challenge for the natural gas industry is to understand how much drilling activity is being driven by the need to start production in order to hold lease acreage recently acquired by producers and is boosting production at a time when natural gas prices are weak. The implication is that producers would like to exercise capital

MUSINGS FROM THE OIL PATCH PAGE 5
APRIL 12, 2011
The rise in oil drilling stopped in late 2008 but began recovering in the summer of 2009
Exhibit 5. Land Gas Production Flat
Source: EIA, PPHB deployment discipline but that their activity is forced by the need to drill to hold acreage. If we could sense when this drilling driver stops then we might be able to speculate on how quickly natural gas prices might rise. Exhibit 6. Oil Drilling On The Rise
Source: Baker Hughes, PPHB We can see that over the past 25 years, there was a significant shift in domestic drilling focus from looking for crude oil to searching for natural gas. In 2005, the decline in oil drilling ended. That coincided with the start of the climb in crude oil prices that peaked at the time of the financial crisis in 2008. The rise in oil drilling stopped in late 2008 but began recovering in the summer of 2009 as prices rose. At that point, restrictions on capital availability for the oil and gas industry had eased, the crude oil market strengthened, and crude oil prices rose. At the same time, natural gas prices were flirting with the $3 per Mcf level making many of the gas shale plays that had been driving gas-oriented drilling uneconomical. Since then, continued weak natural gas prices coupled with stronger than anticipated oil prices have driven the relative disparity in drilling activity in each market. As a result of the shift within the gas shale
MUSINGS FROM THE OIL PATCH PAGE 6
APRIL 12, 2011
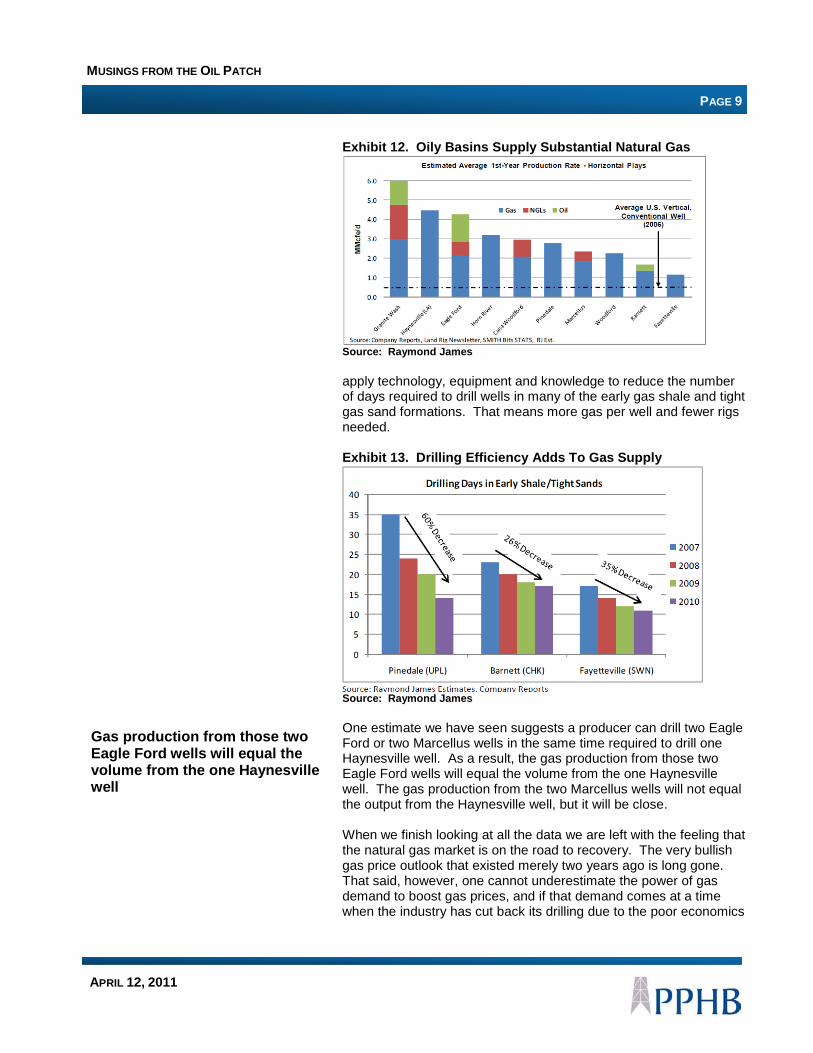
The futures curve reflects a steady upward trend in natural gas prices that reaches price levels by the end of 2014 that have not been experienced since January 2010
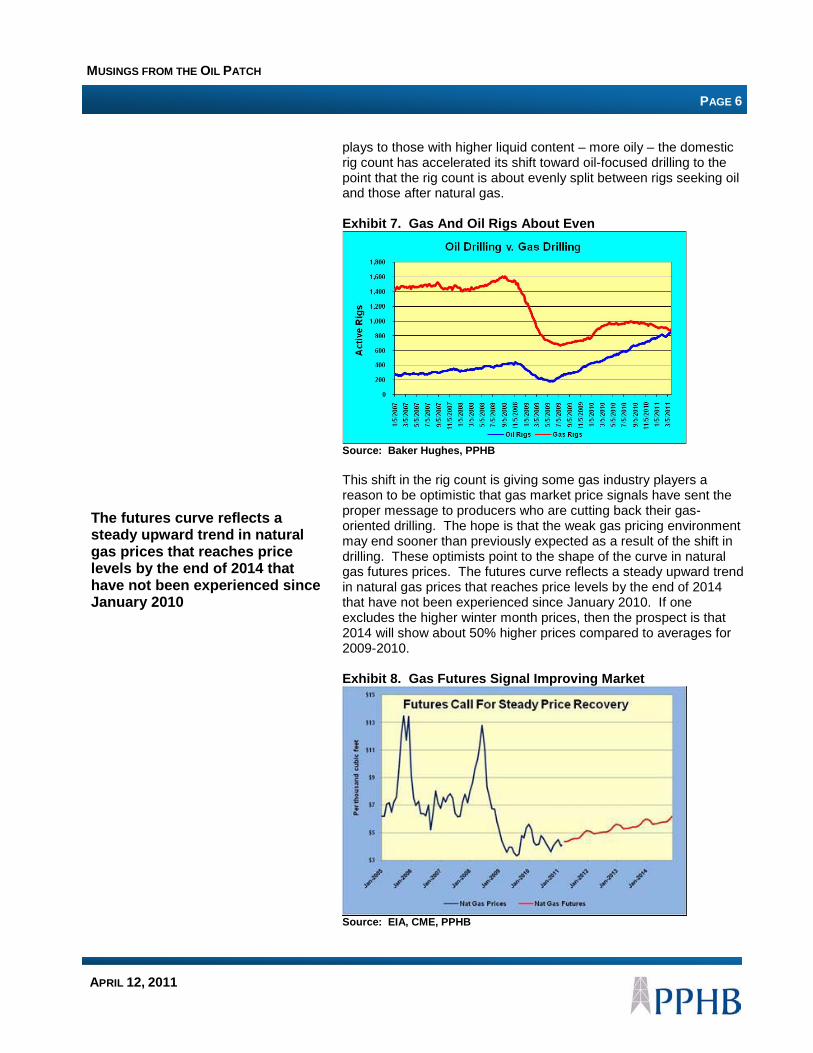
plays to those with higher liquid content – more oily – the domestic rig count has accelerated its shift toward oil-focused drilling to the point that the rig count is about evenly split between rigs seeking oil and those after natural gas. Exhibit 7. Gas And Oil Rigs About Even
Source: Baker Hughes, PPHB This shift in the rig count is giving some gas industry players a reason to be optimistic that gas market price signals have sent the proper message to producers who are cutting back their gas-oriented drilling. The hope is that the weak gas pricing environment may end sooner than previously expected as a result of the shift in drilling. These optimists point to the shape of the curve in natural gas futures prices. The futures curve reflects a steady upward trend in natural gas prices that reaches price levels by the end of 2014 that have not been experienced since January 2010. If one excludes the higher winter month prices, then the prospect is that 2014 will show about 50% higher prices compared to averages for 2009-2010. Exhibit 8. Gas Futures Signal Improving Market
Source: EIA, CME, PPHB

MUSINGS FROM THE OIL PATCH PAGE 7
APRIL 12, 2011
The recent slowdown in gas production growth mirrors the slowdown in the growth of the number of active horizontal drilling rigs Many more of them today are seeking crude oil and/or liquids-rich shale plays
The hope behind the gas industry’s growing optimism is that the shift in drilling by horizontal rigs toward more seeking oil will lead to a decline in production from gas shale wells. When the total number of rigs drilling horizontal wells is compared to Lower 48 gas production, one can see the recent slowdown in gas production growth, which mirrors the slowdown in the growth of the number of active horizontal drilling rigs. Exhibit 9. Rig Count Suggests Slower Gas Supply Growth
Source: EIA, Baker Hughes, PPHB What we do know about the growth in the number of rigs drilling horizontal wells is that many more of them today are seeking crude oil and/or liquids-rich shale plays. To try to gain additional insight into the current relationship between the drilling of horizontal wells and gas production, we applied the percentage of rigs drilling for natural gas to the number of rigs reported as drilling horizontal wells. This is a short-cut as the more accurate way would be to check the location (basin) in which each rig is working and what the likely target of the well is in order to determine exactly how many horizontal wells are drilling for gas as opposed to oil. Exhibit 10. Gas-oriented Rigs Not Slowing Supply Growth
Source: EIA, Baker Hughes, PPHB

MUSINGS FROM THE OIL PATCH PAGE 8
APRIL 12, 2011
The population of drilled but uncompleted wells in many of the gas shale basins due to a lack of equipment to perform hydraulic fracturing on the wells has grown Marcellus, Woodford, Eagle Ford and Granite Wash wells produce substantial volumes of natural gas in their first year of production, albeit less than a Haynesville well
Our short-cut analysis resulted in the data plotted in the chart in Exhibit 10. What it shows is that the estimated count of rigs drilling horizontal wells targeting natural gas peaked in September 2010. On the other hand, natural gas production has continued to climb. There are various reasons why this may be the case. For example, the population of drilled but uncompleted wells in many of the gas shale basins due to a lack of equipment to perform hydraulic fracturing on the wells has grown. So while fewer gas wells are being drilled, the number of completed wells is higher resulting in more gas production than would otherwise be the case given the reduced number of active drilling rigs. Exhibit 11. Uncompleted Wells Spell More Gas Supply
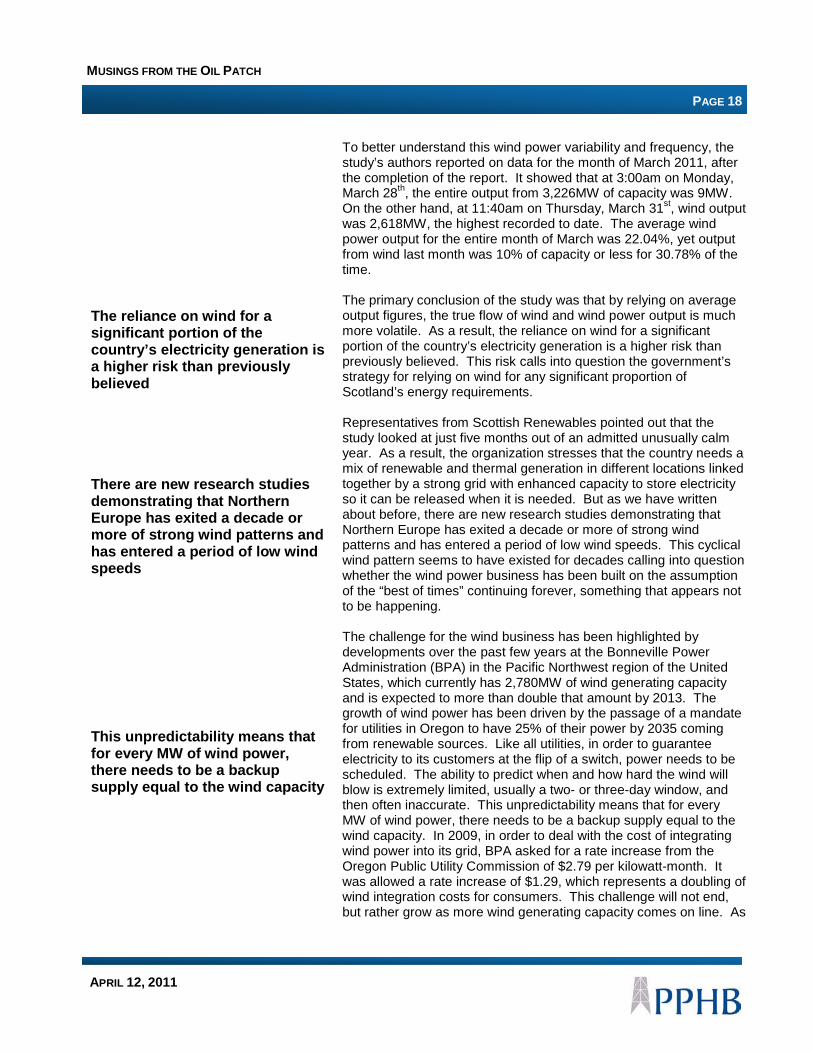
Source: Raymond James Another explanation is that there is a fair amount of associated natural gas produced from the liquids-rich shale plays that have exploded in industry importance over the past 18 months due to the price disparity for liquids versus gas. The high-profile shift in drilling focus to liquids may not be diminishing the amount of natural gas production envisioned when one focuses only on the shift in basin activity. When one looks at the chart in Exhibit 12, if becomes clear that Marcellus, Woodford, Eagle Ford and Granite Wash wells produce substantial volumes of natural gas in their first year of production, albeit less than a Haynesville well, but much more than the average production from a conventional vertical well. It is estimated that horizontal wells contain three times the estimated ultimate recovery of a vertical well. At the same time, horizontal wells usually have four to five times the initial production of vertical wells, making them a powerful factor in growing production. Another consideration for growing gas production despite a drop in gas-focused drilling rigs is the dramatically improved efficiency in drilling and completing the latest batch of horizontal wells. Various oil and gas producing companies have reported on their ability to
MUSINGS FROM THE OIL PATCH PAGE 9
APRIL 12, 2011
Gas production from those two Eagle Ford wells will equal the volume from the one Haynesville well
Exhibit 12. Oily Basins Supply Substantial Natural Gas
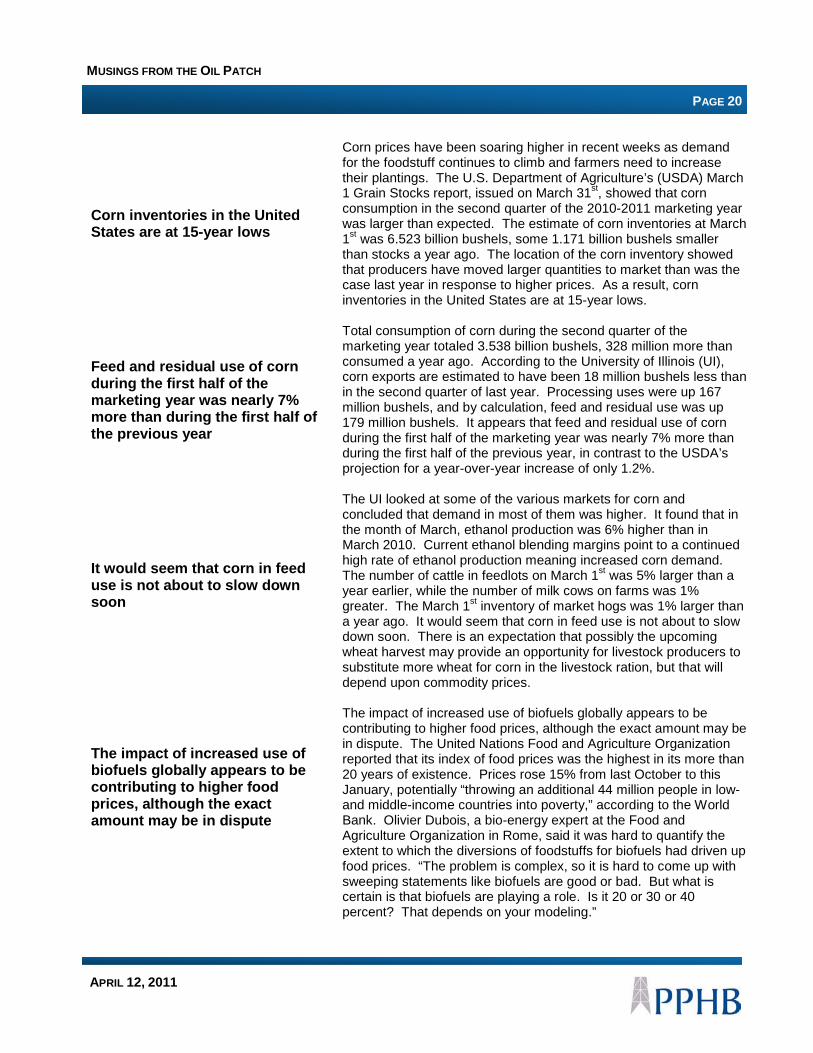
Source: Raymond James apply technology, equipment and knowledge to reduce the number of days required to drill wells in many of the early gas shale and tight gas sand formations. That means more gas per well and fewer rigs needed. Exhibit 13. Drilling Efficiency Adds To Gas Supply
Source: Raymond James One estimate we have seen suggests a producer can drill two Eagle Ford or two Marcellus wells in the same time required to drill one Haynesville well. As a result, the gas production from those two Eagle Ford wells will equal the volume from the one Haynesville well. The gas production from the two Marcellus wells will not equal the output from the Haynesville well, but it will be close. When we finish looking at all the data we are left with the feeling that the natural gas market is on the road to recovery. The very bullish gas price outlook that existed merely two years ago is long gone. That said, however, one cannot underestimate the power of gas demand to boost gas prices, and if that demand comes at a time when the industry has cut back its drilling due to the poor economics

MUSINGS FROM THE OIL PATCH PAGE 10
APRIL 12, 2011
of gas shale plays, we could see sharply higher gas prices in a fairly short time. We still believe the odds favor a long, slow road to higher natural gas prices. The gas futures curve may have it about right this time.
Chesapeake Energy And Natural Gas In The News This volume of natural gas has the same energy content as one gallon of gasoline based on heating values In Oklahoma, CNG vehicles weighing less than one ton pay an annual fee of $100 in lieu of per gallon fuel taxes Mr. McClendon said the U.S. will be exporting natural gas by 2015
Last week, Chesapeake Energy Corporation (CHK-NYSE) announced it had completed the conversion of its 800th company vehicle to burning 100% compressed natural gas (CNG). This means it has converted nearly 20% of its 4,200 vehicle fleet, an effort the company expects to complete by 2014. Chesapeake said it expects to have $11 million in annual fuel savings by switching from gasoline to natural gas. In the press release, Chesapeake stated that the price of CNG was “$1.39 per gallon of gasoline equivalent in Oklahoma.” According to Wikipedia, one gallon of gasoline equivalent of natural gas is 126.67 cubic feet at standard conditions. This volume of natural gas has the same energy content as one gallon of gasoline based on heating values. Based on Friday’s closing price for natural gas futures of $4.04 per thousand cubic feet, one gallon of CNG costs $0.51. That cost represents 36.7% of the cost per gallon cited by Chesapeake. So just what are the economics of CNG? In Oklahoma, CNG vehicles weighing less than one ton pay an annual fee of $100 in lieu of per gallon fuel taxes. Vehicles weighing above one ton pay $150. If we assume a CNG-vehicle averages 20 miles per gallon and drives 15,000 miles a year, then it uses 750 gallons of CNG. Since most vehicles weigh over one ton, the annual fuel fee of $150 equates to $0.20 per gallon of tax, less than the $0.48 tax per gallon on average for gasoline today. If we add taxes and fuel cost for CNG together, it equates to 51% of the retail price. This compares to the 78% of the retail price of a gallon of gasoline accounted by these two items. This cost spread generates two questions: Does CNG distribution and marketing expense consume nearly half of the retail price? What happens to the money needed for building and maintaining roads when the CNG fuel tax is less than half of that of a gallon of gasoline? We were amused to read a column in the Houston Business Journal discussing Chesapeake’s CEO Aubrey McClendon’s comments at the annual conference of the Society of American Business Editors and Writers last week in Dallas, Texas. The columnist was happy to hear a candid talk about the energy business. The thrust of the talk was about natural gas (no surprise) and the role it will play in the nation’s future energy mix. Mr. McClendon said the U.S. will be exporting natural gas by 2015. I assume he was talking about liquefied natural gas (LNG) since we already export gas to Mexico.

MUSINGS FROM THE OIL PATCH PAGE 11
APRIL 12, 2011
He also said that there was no such thing as “clean” coal
He also said that there was no such thing as “clean” coal – it’s always dirty. He also said that if people read the Environmental Protection Agency report on hydraulic fracturing they will see that there is no problem. He further said he hoped in the future that when the nation considers foreign intervention it is not making the decision based on energy concerns. Lastly, he chastised the business writers to learn more about the technology revolution that has led to the gas shale explosion and all the financial activity generated around it. The gas shale revolution moves on!
Rising Energy Prices Hit U.S. Consumers And Economy The reality is that when one is in the middle of a commodity price bubble, it is hard to envision how quickly things can change Increased public expenditures in Saudi Arabia have increased the Kingdom’s budget breakeven price for oil to $88 per barrel, some 30% higher than last year
Consumers are facing sticker shock everywhere they turn – at the grocery store and at the gas pump. While Federal Reserve bankers, Wall Street economists and White House politicians all suggest that core inflation remains modest with merely “transitory commodity inflation” impacting the economy, consumers question what planet these people live on. In a speech last week, Sandra Pianalto, president of the Federal Reserve Bank of Cleveland, hewed to the party line. She said, “Large increases in food or energy prices tend to be temporary. History shows that they are often followed by sharp declines.” Her observation is correct, but there is always that time when it doesn’t happen. The reality is that when one is in the middle of a commodity price bubble, it is hard to envision how quickly things can change. The big question this time is whether with the unleashing of the freedom/democracy genie from the bottle in North Africa, West Africa and the Middle East will lead to an extended period of political turmoil with adverse impacts on global oil supplies just at a time when the ability to find and develop new cheap oil supplies elsewhere has been largely exhausted. A new report from the Institute of International Finance points out that the increased public expenditures in Saudi Arabia that have been used in an attempt to buy peace amongst the populace have increased the Kingdom’s budget breakeven price for oil to $88 per barrel, some 30% higher than last year. The ability of the royal family to lower these new expenditures is limited. At the same time, Saudi Arabia’s consumption of domestic oil output will grow with the increased subsidies further reducing the government’s income. To the extent that other OPEC member countries have also increased their outlays to their citizens either directly or through various fuel subsidies, the pressure for higher prices within that organization will grow. Barring a collapse in global energy demand, it is hard to see how this pressure can be eased enabling world oil prices to drop. Food and fuel are two of the most frequent consumer purchases and ones that oftentimes impact their budgets the most. According to the Bureau of Labor Statistics within the Department of Labor, as of December 2010, the food and beverage component of the

MUSINGS FROM THE OIL PATCH PAGE 12
APRIL 12, 2011
All totaled, the food and energy component of the cost of living of Americans was 23.7% We expect the energy expenditures share of GDP will rise to the 10% mark, and possibly exceed it if natural gas and coal prices rise
Consumer Price Index for All Urban Consumers (CPI) accounted for 14.8% of the index. Gasoline was 4.9% and household energy represented 4.0%. All totaled, the food and energy component of the cost of living of Americans was 23.7%. While some might say this segment of the cost of living isn’t really that high as the total housing component, including household energy, represented about 41%. However, consumers rarely buy houses so they are less influenced by changes in their prices. Consumers in this day and age are more worried about how much it costs to put dinner on the table for a family of four and what it will cost to fill up their SUV. The impact of rising energy costs on the domestic economy can be shown by plotting the share of the country’s gross domestic product represented by energy expenditures. The chart in Exhibit 14 shows the history of this measure from 1985 through 2010 with a forecast prepared by the Energy Information Administration (EIA) for 2011 and 2012. The forecast was based on their price outlook for oil in those years when this projection was prepared late last year. At that time, the EIA believed West Texas Intermediate oil prices (WTI) would average somewhere in the mid to upper $80 per barrel price range and then trend down to about $85 per barrel. Their latest forecast, as of the end of March, is for WTI to average $101.77 in 2011 and $104.75 in 2012. As WTI is trading at above $112 per barrel with few signs of any price relief, it looks like the EIA will be adjusting its forecast upward as spring progresses. Therefore, we expect the energy expenditures share of GDP will rise to the 10% mark, and possibly exceed it if natural gas and coal prices rise. As it is, we are close to the 10% mark last recorded in 2008, and we know how difficult that period was for Americans and the economy. Exhibit 14. Energy’s Share of GDP Rising
Source: EIA The recovering global economy, largely driven by increasing energy demands from developing economies primarily in Asia/Pacific, has been on the upswing since the ending of the financial crisis and recession in late 2009. In recent months, the growing civil unrest in

MUSINGS FROM THE OIL PATCH PAGE 13
APRIL 12, 2011
The Census Bureau reported that in 2010 the American population was 308.7 million people with 82% living in cities and suburbs
North African and Middle Eastern countries has propelled crude oil prices higher. As oil prices have climbed higher, gasoline prices have followed in lock-step, until quite recently. Exhibit 15. Gasoline Prices Reflect World Oil Prices
Source: EIA, PPHB One of the reasons that gasoline pump prices have risen more sharply than U.S. crude oil prices is a quirk of the domestic oil distribution system and the imbalance of our population. The Census Bureau reported that in 2010 the American population was 308.7 million people with 82% living in cities and suburbs. As can be seen by the population density map in Exhibit 16, the population is concentrated not only in the eastern half of the country but also heavily concentrated along the U.S. coastlines. Over the years, this pattern contributed to the concentration of oil refineries close to the coast to allow for ease of importing foreign crude oil and the be closer to the ultimate consumer. Exhibit 16. Population Density High In East And Coasts
Source: Census Bureau

MUSINGS FROM THE OIL PATCH PAGE 14
APRIL 12, 2011
The disparity in market conditions has contributed to a reversal in the historic relationship between WTI and Brent, in which WTI usually was priced at a slight premium to Brent Former Saudi Arabia Oil Minister Sheikh Zaki Yamani recently said that if civil unrest moves to his homeland, the world should be prepared for oil prices in the $200-$300 per barrel range
One of the problems in recent years has been the growth in U.S. imports of Canadian oil sands production that comes into the mid-continent region via pipelines from the north. Because there is little transportation infrastructure to ship Canadian oil south to the Gulf Coast refineries, if demand for petroleum products in the mid-continent and Midwest regions of the country is not strong, crude oil inventories tend to build in the Cushing, Oklahoma, terminus of the pipeline from Canada. This inventory build was a significant development in the U.S. oil market last fall and winter and has contributed to West Texas Intermediate oil prices being depressed while coastal refineries that rely on imported oil are confronted with paying global oil prices. The primary international benchmark oil price is for UK Brent crude oil. Brent, along with virtually all crude oils, has been climbing in response to the rising petroleum demands from countries such as China and India along with growing risk premium assigned to a barrel of oil due to the North African and Middle Eastern turmoil. The disparity in market conditions has contributed to a reversal in the historic relationship between WTI and Brent, in which WTI usually was priced at a slight premium to Brent. Today, Brent is trading at a premium, and because of international and geopolitical dynamics, it is at a substantial premium. Exhibit 17. Brent Premium Over WTI Expanding
Source: EIA The magnitude of the spread and how it has developed is demonstrated in the chart in Exhibit 17. As of April 6th, the spread between Brent and WTI was $14.22 per barrel, a 13% premium. As the chart shows, the spread has been as wide as $16. Former Saudi Arabia Oil Minister Sheikh Zaki Yamani, who held that position during the explosive oil market period in the 1970s and 1980s, recently said that if civil unrest moves to his homeland, the world should be prepared for oil prices in the $200-$300 per barrel range. That eventuality, which would likely come in the form of a price spike, would generate significant economic and geopolitical ramifications. The global financial and banking system would become chaotic and global equity and bond markets would fall. Without a quick resolution, the world would likely be thrown into a worldwide recession that would rival the one we just exited. Since

MUSINGS FROM THE OIL PATCH PAGE 15
APRIL 12, 2011
Some 71% said they are cutting back spending in other areas to pay for their higher gasoline bills A few months of prices at $150 a barrel would push the economy back into a recession Be prepared for further downward adjustments to economic growth estimates for the U.S. economy
the current economic and financial recovery is so frail, the inability of the global economy to withstand such a shock is magnified. But already the rise in global oil prices and domestic gasoline prices is taking a toll on the American consumer and our economy. According to a new Gallup-GfK poll of Americans taken in late March, two-thirds of respondents said they expect higher gasoline prices to create hardships for them and their families in the next six months. Some 71% said they are cutting back spending in other areas to pay for their higher gasoline bills. Some 64% said they are driving less and 53% said they have changed their vacation plans to stay closer to home. The fear of a continuation of these high oil prices is already being reflected in economists’ estimates for U.S. economic growth this year. Bernard Baumohl, chief economist at the Economic Outlook Group, has cut his estimate for growth this year to 2.8% from 3.5%. His new forecast is slightly below the 2.9% the economy grew in 2010. Mark Zandi, economist with Moody’s, says that higher oil prices have shaved 0.5% from economic growth in the first quarter of this year to 2.6%. He estimates that if oil prices average $100 a barrel for the balance of the year, growth will be 0.3% lower than if prices had remained at 2010 levels. If oil prices average $125 a barrel for a few months, Mr. Zandi believes growth would be reduced by 1% and a few months of prices at $150 a barrel would push the economy back into a recession. At the present time, the confluence of events, geopolitical pressures and economic trends all suggest high and possibly higher oil prices for the foreseeable future. It is still possible that if the political turmoil subsides, the froth in the oil futures market might disappear leading to lower oil prices toward the end of the year. Even with that outlook, again ignoring the potential for a global economic recession relapse, oil prices will be staying higher than many were anticipating only a matter of a few weeks ago. Be prepared for further downward adjustments to economic growth estimates for the U.S. economy, which will put downward pressure on financial markets.
Scotland Wind Power Report Challenges Proponent Claims The study concluded that many of the claims about the performance of wind energy were untrue
We have previously reported on data from Scotland questioning the performance claims of wind power. The John Muir Trust sponsored a study by Stuart Young Consulting utilizing publicly available data on wind energy generated by turbines connected to National Grid’s (NGG-NYSE) transmission and distribution network. The study concluded that many of the claims about the performance of wind energy were untrue based on the 26 months of data studied. The average output of the wind farms was 27.18% of metered capacity in 2009 and 21.14% for 2010. Over the 26-month period November

MUSINGS FROM THE OIL PATCH PAGE 16
APRIL 12, 2011
He was one of the founders of the Sierra Club in 1892 and through his advocacy he helped save Yosemite Valley and Sequoia National Park The Climate Change (Scotland) Act that targets a reduction in carbon emissions through a plan to generate 80% of the country’s electricity and 11% of its heat demand from renewable sources by 2020
2008 through December 2010, average output of the wind farms was 24.08% of metered capacity compared to industry and wind energy proponent claims that it would average 30%. The John Muir Trust is a UK charity founded in 1983 to safeguard the future of wild lands in Scotland against development and to promote awareness and recognition of the value of such places. The Trust owns land and partners with other landowners to prevent the development of certain wild land parcels. The Trust was named after the Scottish-born American naturalist, John Muir, an author and early advocate of preserving wilderness and forests in the United States. He was one of the founders of the Sierra Club in 1892 and through his advocacy he helped save Yosemite Valley and Sequoia National Park. Exhibit 18. Braes O’Doune Wind Farm in Scotland
Source: Daily Mail The report was designed to address five principle claims of wind power proponents that underlie the aggressive wind energy development program in Scotland and throughout the UK. Onshore wind power began to be developed in the 1990s in response to the enactment of The Climate Change (Scotland) Act that targets a reduction in carbon emissions through a plan to generate 80% of the country’s electricity and 11% of its heat demand from renewable sources by 2020. Because the country has been developing wind power facilities for a number of years, there is a well-established planning and consent system in place. The system determines whether a wind farm is acceptable in terms of visual impact, its impact on communities and habitat and other factors such as the impact on radar facilities. The Forestry Commission Scotland, which was established to work with developers and to build wind farms on its property, owns nearly 10% of the country’s land mass. It has recently designated five

MUSINGS FROM THE OIL PATCH PAGE 17
APRIL 12, 2011
Scotland has 10 times per capita the amount of renewable energy of England Wind generation was below 20% of capacity more than half the time and below 10% of capacity over one-third of the time The study showed that the frequency of changes in output of 100MW or more was high
areas for development of renewable energy projects and is currently waiting on proposals. Even though Scotland has 10 times per capita the amount of renewable energy of England, the country is actively promoting the construction of offshore wind farms to meet its renewable energy target because it cannot be achieved with only land-based wind farms. The John Muir Trust report focused on five claims of the wind power industry. These claims are:
1. “Wind turbines will generate on average 30% of their rated capacity over a year.”
2. “The wind is always blowing somewhere.” 3. “Periods of widespread low wind are infrequent.” 4. “The probability of very low wind output coinciding with
peak electricity demand is slight.” 5. “Pumped hydro storage can fill the generation gap
during prolonged low wind periods.” The data collected raises serious questions about these claims. For example, during the study period, wind generation was below 20% of capacity more than half the time and below 10% of capacity over one-third of the time. Wind power generation was below 2.5% of capacity for the equivalent of one day in 12 and below 1.25% of capacity for the equivalent of just under one day per month. The low output for significant amounts of time was a surprise to the authors of the study. There were 124 days in which generation was below 20 megawatts (MW) including 51 days when it fell to 10MW or below. While this is interesting, it is somewhat irrelevant because once you fall to or below 20MW of generation the wind contribution is effectively zero. It was also determined that the low wind episodes were not confined to periods of high pressure in winter. These low wind periods can occur anytime of the year. One of the important considerations for wind power is its variability, which is putting increased pressure on the operating ability of the electricity grid to handle the changes. The study showed that the frequency of changes in output of 100MW or more was high. We know this condition contributed to a power system failure several years ago in Texas when the wind in West Texas stopped blowing and there was a brief hiatus before a thermal power plant could be brought on stream to offset the lost wind generation capacity. The power industry’s response to this situation is to build larger numbers of wind turbines scattered around a region with the belief that the diversification of wind sources will insure continuity of supply. This is about as questionable an operational strategy as portfolio diversification in financial circles proved to be during the financial crisis.
MUSINGS FROM THE OIL PATCH PAGE 18
APRIL 12, 2011
The reliance on wind for a significant portion of the country’s electricity generation is a higher risk than previously believed There are new research studies demonstrating that Northern Europe has exited a decade or more of strong wind patterns and has entered a period of low wind speeds This unpredictability means that for every MW of wind power, there needs to be a backup supply equal to the wind capacity
To better understand this wind power variability and frequency, the study’s authors reported on data for the month of March 2011, after the completion of the report. It showed that at 3:00am on Monday, March 28th, the entire output from 3,226MW of capacity was 9MW. On the other hand, at 11:40am on Thursday, March 31st, wind output was 2,618MW, the highest recorded to date. The average wind power output for the entire month of March was 22.04%, yet output from wind last month was 10% of capacity or less for 30.78% of the time. The primary conclusion of the study was that by relying on average output figures, the true flow of wind and wind power output is much more volatile. As a result, the reliance on wind for a significant portion of the country’s electricity generation is a higher risk than previously believed. This risk calls into question the government’s strategy for relying on wind for any significant proportion of Scotland’s energy requirements. Representatives from Scottish Renewables pointed out that the study looked at just five months out of an admitted unusually calm year. As a result, the organization stresses that the country needs a mix of renewable and thermal generation in different locations linked together by a strong grid with enhanced capacity to store electricity so it can be released when it is needed. But as we have written about before, there are new research studies demonstrating that Northern Europe has exited a decade or more of strong wind patterns and has entered a period of low wind speeds. This cyclical wind pattern seems to have existed for decades calling into question whether the wind power business has been built on the assumption of the “best of times” continuing forever, something that appears not to be happening. The challenge for the wind business has been highlighted by developments over the past few years at the Bonneville Power Administration (BPA) in the Pacific Northwest region of the United States, which currently has 2,780MW of wind generating capacity and is expected to more than double that amount by 2013. The growth of wind power has been driven by the passage of a mandate for utilities in Oregon to have 25% of their power by 2035 coming from renewable sources. Like all utilities, in order to guarantee electricity to its customers at the flip of a switch, power needs to be scheduled. The ability to predict when and how hard the wind will blow is extremely limited, usually a two- or three-day window, and then often inaccurate. This unpredictability means that for every MW of wind power, there needs to be a backup supply equal to the wind capacity. In 2009, in order to deal with the cost of integrating wind power into its grid, BPA asked for a rate increase from the Oregon Public Utility Commission of $2.79 per kilowatt-month. It was allowed a rate increase of $1.29, which represents a doubling of wind integration costs for consumers. This challenge will not end, but rather grow as more wind generating capacity comes on line. As

MUSINGS FROM THE OIL PATCH PAGE 19
APRIL 12, 2011
The cost of power will be 7-10 times that produced from coal
one power industry engineer said, it takes roughly one gigawatt (GW) of natural gas plants plus 3-5GW of wind plants and extra transmission lines to replace 1GW of coal plants. Comparing an electric power system based on 100% wind and natural gas, the cost of power will be 7-10 times that produced from coal. Renewable energy mandates are turning the electricity cost pyramids for consumers upside down. There will be an economic impact from this ill-thought out strategy.
Using Food For Fuel Creating Unintended Consequences From 1% of total grain production in 2000, fuel use of grains claimed 6% of a larger harvest last year
Rumors at the end of last week as the Congressional budget standoff played out was that one of the spending cuts Republicans were demanding and Democrats were agreeing to involved the $6 billion subsidy for ethanol for use in gasoline, at least for the current fiscal year. That doesn’t mean ethanol is going away as the Environmental Protection Agency (EPA) has mandated the use of renewable fuels in gasoline. That is one reason why the Government Accounting Office has said the subsidy is no longer needed. Despite the correctness of the rumor, the debate over the use of food crops for fuel and its real or possible impact on food inflation will continue to grow. We cannot forget that rising food costs were behind the initial civil unrest in Tunisia and Egypt. There have been food cost demonstrations in other countries around the world. The chart in Exhibit 19 shows just how much of the world’s grain supply has been diverted into the fuel market in recent years. From 1% of total grain production in 2000, fuel use of grains claimed 6% of a larger harvest last year. Can we continue to go on with a global policy of using foodstuffs for fuel? Exhibit 19. Share Of Grains To Fuel Rising
Source: Financial Times
MUSINGS FROM THE OIL PATCH PAGE 20
APRIL 12, 2011
Corn inventories in the United States are at 15-year lows Feed and residual use of corn during the first half of the marketing year was nearly 7% more than during the first half of the previous year It would seem that corn in feed use is not about to slow down soon The impact of increased use of biofuels globally appears to be contributing to higher food prices, although the exact amount may be in dispute
Corn prices have been soaring higher in recent weeks as demand for the foodstuff continues to climb and farmers need to increase their plantings. The U.S. Department of Agriculture’s (USDA) March 1 Grain Stocks report, issued on March 31st, showed that corn consumption in the second quarter of the 2010-2011 marketing year was larger than expected. The estimate of corn inventories at March 1st was 6.523 billion bushels, some 1.171 billion bushels smaller than stocks a year ago. The location of the corn inventory showed that producers have moved larger quantities to market than was the case last year in response to higher prices. As a result, corn inventories in the United States are at 15-year lows. Total consumption of corn during the second quarter of the marketing year totaled 3.538 billion bushels, 328 million more than consumed a year ago. According to the University of Illinois (UI), corn exports are estimated to have been 18 million bushels less than in the second quarter of last year. Processing uses were up 167 million bushels, and by calculation, feed and residual use was up 179 million bushels. It appears that feed and residual use of corn during the first half of the marketing year was nearly 7% more than during the first half of the previous year, in contrast to the USDA’s projection for a year-over-year increase of only 1.2%. The UI looked at some of the various markets for corn and concluded that demand in most of them was higher. It found that in the month of March, ethanol production was 6% higher than in March 2010. Current ethanol blending margins point to a continued high rate of ethanol production meaning increased corn demand. The number of cattle in feedlots on March 1st was 5% larger than a year earlier, while the number of milk cows on farms was 1% greater. The March 1st inventory of market hogs was 1% larger than a year ago. It would seem that corn in feed use is not about to slow down soon. There is an expectation that possibly the upcoming wheat harvest may provide an opportunity for livestock producers to substitute more wheat for corn in the livestock ration, but that will depend upon commodity prices. The impact of increased use of biofuels globally appears to be contributing to higher food prices, although the exact amount may be in dispute. The United Nations Food and Agriculture Organization reported that its index of food prices was the highest in its more than 20 years of existence. Prices rose 15% from last October to this January, potentially “throwing an additional 44 million people in low- and middle-income countries into poverty,” according to the World Bank. Olivier Dubois, a bio-energy expert at the Food and Agriculture Organization in Rome, said it was hard to quantify the extent to which the diversions of foodstuffs for biofuels had driven up food prices. “The problem is complex, so it is hard to come up with sweeping statements like biofuels are good or bad. But what is certain is that biofuels are playing a role. Is it 20 or 30 or 40 percent? That depends on your modeling.”
MUSINGS FROM THE OIL PATCH PAGE 21
APRIL 12, 2011
They believe these mandates should be suspended whenever food stocks get low or prices become too high Last year, 98% of cassava chips exported from Thailand, the world’s largest cassava exporter, went to China Research conducted by Absolute Strategy Research of London shows that 50% year-over-year oil price increases do not necessarily lead to economic recessions ING suggests that if the oil price rise is perceived as driven by a demand shock then stocks prosper
Mr. Dubois and Hans Timmer, director of the Development Prospects Group of the World Bank, suggest that there may be a need for adjustments to governments’ policies on the use of biofuels. As Mr. Timmer put it, “The policy really has to be food first. The problems occur when you set targets for biofuels irrespective of the prices of other commodities.” Mr. Timmer and Mr. Dubois advocate that governments move away from rigid biofuel mandates. They believe these mandates should be suspended whenever food stocks get low or prices become too high. China made that adjustment nearly a decade ago when it set out to make ethanol from corn, but instead the government’s plan created meaningful shortages of corn and drove up food prices. In 2007, the Chinese government banned the use of grains to make biofuel. Instead Chinese scientists perfected the process of making fuel from cassava, a root crop that yielded good energy returns. The Chinese believed that they had created a market for a crop that would not impact food prices. The proportion of Chinese cassava going into fuel climbed from 10% in 2008 to 52% in 2010. But the food/fuel issue hasn’t been fully resolved. Last year, 98% of cassava chips exported from Thailand, the world’s largest cassava exporter, went to China. The problem is that farmers in Southeast Asian countries supplying cassava to China have been inclined to switch away from growing rice and vegetables in favor of this more profitable root crop, to the detriment of global food supplies. Agricultural crops and their rising prices may become a problem for equity markets going forward. Sharply rising crude oil prices have begun to worry the stock market. Since the credit crisis, the relationship between oil prices and stock price performance has been almost one-to-one with oil prices leading equities higher. Very recently, however, oil prices have been climbing while the stock market has not followed. Research conducted by Absolute Strategy Research of London shows that 50% year-over-year oil price increases do not necessarily lead to economic recessions, although many investors are questioning the price threshold that does pinch economic activity and undercuts equity markets. A report from ING Investment Management has shown that in response to the five oil price shocks experienced since 1970, stock price earnings multiples fell during three of them but expanded during the other two. ING suggests that if the oil price rise is perceived as driven by a demand shock then stocks prosper, which has been the case for the past two years as the global economic recovery has gathered strength. On the other hand, if the price rise comes because of supply shortages then investors believe it signals that economic activity will soon be heading down pushing stock prices lower.

MUSINGS FROM THE OIL PATCH PAGE 22
APRIL 12, 2011
Rising food prices, especially if they are being driven up by increased fuel demands, could signal growing trouble for stock markets
Exhibit 20. Food And Fuel Key Market
Source: Financial Times If oil prices continue to climb in response to the loss of Libyan oil supplies, it is possible investors may become more concerned about shrinking supplies and the impact on future economic activity. But as we are seeing in the agricultural arena, rising food prices, especially if they are being driven up by increased fuel demands, could signal growing trouble for stock markets as higher prices cut consumer spending.
Updated 2011 Hurricane Forecast Still Calls For Active Year
The latest forecast update from Professors Philip Klotzbach and William Gray of the Department of Atmospheric Science at the Colorado State University (CSU) says the upcoming hurricane season is expected to see above-average activity. The April 6th forecast is slightly lower than their December 2010 forecast largely

MUSINGS FROM THE OIL PATCH PAGE 23
APRIL 12, 2011
The Pacific Ocean for most of the past year has been cooler than normal Atmospheric conditions currently are conducive for an active hurricane season
due to uncertainty about the sea surface temperatures in both the South Pacific and South Atlantic oceans that can assist or retard the development and strengthening of tropical storms. The forecasting team has developed a new April methodology based on a data collected from 1982-2010. There are four predictors employed in the model with two of them based on sea surface temperatures in the Atlantic and Pacific oceans. The Pacific Ocean for most of the past year has been cooler than normal, which helped contribute to the Atlantic basin’s storm activity last year mostly turning north before reaching the U.S. In general, sea surface temperatures in the eastern and central tropical Pacific Ocean have been 0.50C-1.00C below average. Exhibit 21. Pacific Ocean Sea Surface Temperatures Low
Source: Colorado State University On the other side of the globe, Atlantic Ocean sea surface temperatures remain at or above average levels. They have cooled recently but most likely that has been caused by a shift from a negative phase for the North Atlantic Oscillation to a positive phase. Atmospheric conditions currently are conducive for an active hurricane season as wind shear, a force that can limit the development and strengthening of tropical storms, across the basin has been well below average over the past two months. Exhibit 22. Atlantic Ocean Temperatures Near Normal
Source: Colorado State University

MUSINGS FROM THE OIL PATCH PAGE 24
APRIL 12, 2011
They were looking for years generally characterized by weak to moderate La Niña conditions and above-average tropical Atlantic and far North Atlantic sea surface temperatures during February and March The CSU team anticipates 2011 to be slightly more active than what was experienced in the average of these five analog years The forecast calls for a 72% probability of a storm hitting the entire U.S. coastline
With these conditions, the CSU forecasting team began looking for analog years to help fine-tune their forecast. They were looking for years generally characterized by weak to moderate La Niña conditions and above-average tropical Atlantic and far North Atlantic sea surface temperatures during February and March. They found five seasons that met these conditions. Four of them had either neutral or La Niña conditions during the hurricane season and all four of them were very active years. Those four years were 1955, 1996, 1999 and 2008. Exhibit 23. Analog Years For Hurricane Forecast
Year NS NSD H HD MH MHD ACE NTC1955 12 82.75 9 46.75 6 17.25 199 2071996 13 79.00 9 45.00 6 13.00 166 1921999 12 78.50 8 41.00 5 14.25 177 1822006 10 52.75 5 21.25 2 2.00 79 852008 16 88.25 8 30.50 5 7.50 146 162
Mean 12.6 76.30 7.8 36.90 4.8 10.80 153 166
F.4/6/11 16 80.00 9 35.00 5 10.00 160 175 Source: Colorado State University, PPHB The forecasters also found 2006, which had the same February-March conditions. That year, however, experienced an unexpected El Niño, which greatly reduced hurricane activity. The CSU team anticipates 2011 to be slightly more active than what was experienced in the average of these five analog years due to the very active season predicted by their new statistical model. It is interesting that there were only two analog years that fit the parameters for both the December 2010 and April 2011 forecasts, and those years were 1999 and 2008. Exhibit 24. Latest Hurricane Forecast Down Slightly
Forecast Parameter and 1950-2000Climatology (in parentheses) 6-Apr-11 8-Dec-10 2010 2009 2008 2007 2006 2005 2004 2003
Named Storms (9.6) 16 17 19 10 16 15 10 26 14 14Named Storm Days (49.1) 80.00 85.00 88.25 45.00 84.75 34.5 50.0 116.0 90.0 71.0Hurricanes (5.9) 9 9 12 4 8 6 5 14 9 7Hurricane Days (24.5) 35.00 40.00 37.50 18.00 29.50 11.25 20.00 48.00 46.00 32.00Intense Hurricanes (2.3) 5 5 5 2 5 2 2 7 6 3intense Hurricane Days (5.0) 10.00 10.00 11.00 4.00 8.50 5.75 3.00 16.75 22.00 17.00
Forecast for 2011
Source: Colorado State University, PPHB The CSU forecast calls for a total of 16 named storms, down one from the December 2010 forecast total. It also expects there to be nine hurricanes and five major hurricanes. The total number of storm days will be down by five, from 85 to 80, with a similar reduction for each of the other storm categories. In terms of landfall probabilities, the forecast calls for a 72% probability of a storm hitting the entire U.S. coastline compared to the 52% average for the past century. There is a 48% chance of a landing on the East Coast including the Florida peninsula compared to the historic 31% rate. For the Gulf Coast from the Florida Panhandle to Brownsville, Texas, there is a 47% chance of a tropical storm landfall versus the historical average of 30%. Despite the

MUSINGS FROM THE OIL PATCH PAGE 25
APRIL 12, 2011
higher probabilities, nature is such that it is impossible to forecast with any degree of accuracy until a storm is on its way whether it will reach land. For the offshore energy industry, it will need to be on alert this hurricane season, although if the current pace of permitting continues, there won’t be too many offshore rigs to have to worry about this fall. Is that a backhanded positive?
Contact PPHB: 1900 St. James Place, Suite 125 Houston, Texas 77056 Main Tel: (713) 621-8100 Main Fax: (713) 621-8166 www.pphb.com PPHB is an independent investment banking firm providing financial advisory services, including merger and acquisition and capital raising assistance, exclusively to clients in the energy service industry.