12 – 1 copyright © 2010 pearson education, inc. publishing as prentice hall. inventory management...
TRANSCRIPT

12 – 1Copyright © 2010 Pearson Education, Inc. Publishing as Prentice Hall.
Inventory Management(solved problems and exercises)12
For Operations Management, 9e by Krajewski/Ritzman/Malhotra © 2010 Pearson Education

12 – 2Copyright © 2010 Pearson Education, Inc. Publishing as Prentice Hall.
Solved Problem 1
Booker’s Book Bindery divides SKUs into three classes, according to their dollar usage. Calculate the usage values of the following SKUs and determine which is most likely to be classified as class A.
SKU Number Description Quantity Used per Year
Unit Value ($)
1 Boxes 500 3.00
2 Cardboard (square feet)
18,000 0.02
3 Cover stock 10,000 0.75
4 Glue (gallons) 75 40.00
5 Inside covers 20,000 0.05
6 Reinforcing tape (meters)
3,000 0.15
7 Signatures 150,000 0.45

12 – 3Copyright © 2010 Pearson Education, Inc. Publishing as Prentice Hall.
Solved Problem 1
SOLUTION
The annual dollar usage for each item is determined by multiplying the annual usage quantity by the value per unit. As shown in Figure 12.11, the SKUs are then sorted by annual dollar usage, in declining order. Finally, A–B and B–C class lines are drawn roughly, according to the guidelines presented in the text. Here, class A includes only one SKU (signatures), which represents only 1/7, or 14 percent, of the SKUs but accounts for 83 percent of annual dollar usage. Class B includes the next two SKUs, which taken together represent 28 percent of the SKUs and account for 13 percent of annual dollar usage. The final four SKUs, class C, represent over half the number of SKUs but only 4 percent of total annual dollar usage.

12 – 4Copyright © 2010 Pearson Education, Inc. Publishing as Prentice Hall.
Solved Problem 1
SKU Number Description
Quantity Used per
Year
Unit Value ($)
Annual Dollar Usage ($)
1 Boxes 500 3.00 = 1,500
2 Cardboard (square feet)
18,000 0.02 = 360
3 Cover stock 10,000 0.75 = 7,500
4 Glue (gallons) 75 40.00 = 3,000
5 Inside covers 20,000 0.05 = 1,000
6 Reinforcing tape (meters)
3,000 0.15 = 450
7 Signatures 150,000 0.45 = 67,500
Total 81,310

12 – 5Copyright © 2010 Pearson Education, Inc. Publishing as Prentice Hall.
Solved Problem 1
Percentage of SKUs
Pe
rce
nta
ge
of
Do
lla
r V
alu
e
100 –
90 –
80 –
70 –
60 –
50 –
40 –
30 –
20 –
10 –
0 –10 30 40 50 60 70 80 90 10020
Class C
Class A
Class B
Figure 12.11 – Annual Dollar Usage for Class A, B, and C SKUs Using Tutor 12.2

12 – 6Copyright © 2010 Pearson Education, Inc. Publishing as Prentice Hall.
Solved Problem 2
Nelson’s Hardware Store stocks a 19.2 volt cordless drill that is a popular seller. Annual demand is 5,000 units, the ordering cost is $15, and the inventory holding cost is $4/unit/year.
a. What is the economic order quantity?
b. What is the total annual cost for this inventory item?
SOLUTION
a. The order quantity is
EOQ = =2DS
H2(5,000)($15)
$4
= 37,500 = 193.65 or 194 drills
b. The total annual cost is
C = (H) + (S) =Q
2DQ ($4) + ($15) = $774.60
1942
5,000194

12 – 7Copyright © 2010 Pearson Education, Inc. Publishing as Prentice Hall.
Solved Problem 3
A regional distributor purchases discontinued appliances from various suppliers and then sells them on demand to retailers in the region. The distributor operates 5 days per week, 52 weeks per year. Only when it is open for business can orders be received. Management wants to reevaluate its current inventory policy, which calls for order quantities of 440 counter-top mixers. The following data are estimated for the mixer:
Average daily demand (d) = 100 mixers
Standard deviation of daily demand (σd) = 30 mixers
Lead time (L) = 3 days
Holding cost (H) = $9.40/unit/year
Ordering cost (S) = $35/order
Cycle-service level = 92 percent
The distributor uses a continuous review (Q) system
12 – 8Copyright © 2010 Pearson Education, Inc. Publishing as Prentice Hall.
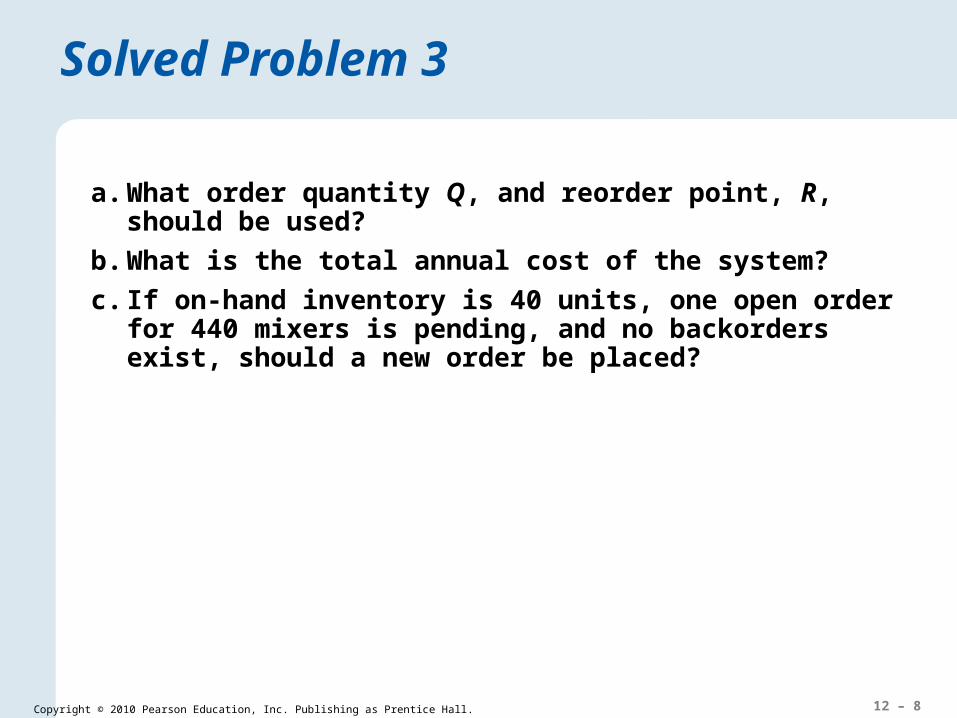
Solved Problem 3
a. What order quantity Q, and reorder point, R, should be used?
b. What is the total annual cost of the system?
c. If on-hand inventory is 40 units, one open order for 440 mixers is pending, and no backorders exist, should a new order be placed?

12 – 9Copyright © 2010 Pearson Education, Inc. Publishing as Prentice Hall.
Solved Problem 3
SOLUTION
a. Annual demand is
The order quantity is
D = (5 days/week)(52 weeks/year)(100 mixers/day)= 26,000 mixers/year
EOQ = =2DS
H2(26,000)($35)
$9.40
= 193,167 = 440.02 or 440 mixers

12 – 10Copyright © 2010 Pearson Education, Inc. Publishing as Prentice Hall.
Solved Problem 3
The standard deviation of the demand during lead time distribution is
A 92 percent cycle-service level corresponds to z = 1.41
σdLT = σd L = 30 3 = 51.96
Safety stock = zσdLT = 1.41(51.96 mixers) = 73.26 or 73 mixers
100(3) = 300 mixersAverage demand during lead time = dL =
Reorder point (R) = Average demand during lead time + Safety stock
= 300 mixers + 73 mixers = 373 mixers
With a continuous review system, Q = 440 and R = 373

12 – 11Copyright © 2010 Pearson Education, Inc. Publishing as Prentice Hall.
Solved Problem 3
b. The total annual cost for the Q systems is
C = (H) + (S) + (H)(Safety stock)Q
2DQ
C = ($9.40) + ($35) + ($9.40)(73) = $4,822.38440
226,000
440
c. Inventory position = On-hand inventory + Scheduled receipts – Backorders
IP = OH + SR – BO = 40 + 440 – 0 = 480 mixers
Because IP (480) exceeds R (373), do not place a new order

12 – 12Copyright © 2010 Pearson Education, Inc. Publishing as Prentice Hall.
Solved Problem 4
Suppose that a periodic review (P) system is used at the distributor in Solved Problem 3, but otherwise the data are the same.
a. Calculate the P (in workdays, rounded to the nearest day) that gives approximately the same number of orders per year as the EOQ.
b. What is the target inventory level, T? Compare the P system to the Q system in Solved Problem 3.
c. What is the total annual cost of the P system?
d. It is time to review the item. On-hand inventory is 40 mixers; receipt of 440 mixers is scheduled, and no backorders exist. How much should be reordered?

12 – 13Copyright © 2010 Pearson Education, Inc. Publishing as Prentice Hall.
Solved Problem 4
SOLUTION
a. The time between orders is
P = (260 days/year) = EOQ
D(260) = 4.4 or 4 days
44026,000
b. Figure 12.12 shows that T = 812 and safety stock = (1.41)(79.37) = 111.91 or about 112 mixers. The corresponding Q system for the counter-top mixer requires less safety stock.
Figure 12.12 –OM Explorer Solver for Inventory Systems

12 – 14Copyright © 2010 Pearson Education, Inc. Publishing as Prentice Hall.
Solved Problem 4
c. The total annual cost of the P system is
C = (H) + (S) + (H)(Safety stock)dP2
DdP
C = ($9.40) + ($35) + ($9.40)(1.41)(79.37)100(4)
2
26,000100(4)
= $5,207.80
d. Inventory position is the amount on hand plus scheduled receipts minus backorders, or
IP = OH + SR – BO = 40 + 440 – 0 = 480 mixers
The order quantity is the target inventory level minus the inventory position, or
Q = T – IP =
An order for 332 mixers should be placed.
812 mixers – 480 mixers = 332 mixers
12 – 15Copyright © 2010 Pearson Education, Inc. Publishing as Prentice Hall.
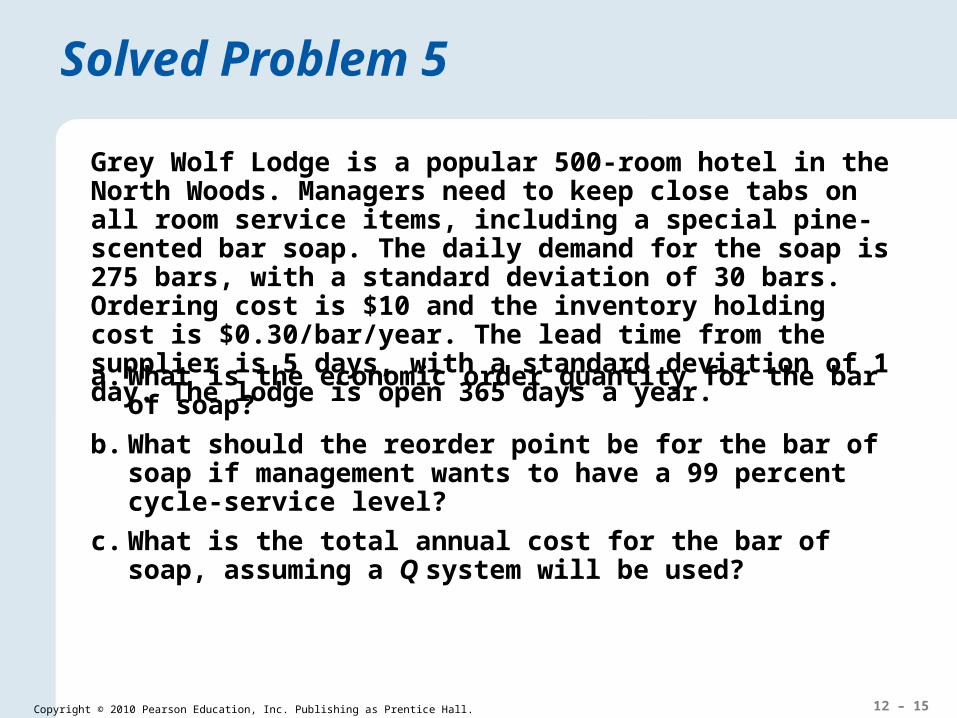
Solved Problem 5
Grey Wolf Lodge is a popular 500-room hotel in the North Woods. Managers need to keep close tabs on all room service items, including a special pine-scented bar soap. The daily demand for the soap is 275 bars, with a standard deviation of 30 bars. Ordering cost is $10 and the inventory holding cost is $0.30/bar/year. The lead time from the supplier is 5 days, with a standard deviation of 1 day. The lodge is open 365 days a year.
a. What is the economic order quantity for the bar of soap?
b. What should the reorder point be for the bar of soap if management wants to have a 99 percent cycle-service level?
c. What is the total annual cost for the bar of soap, assuming a Q system will be used?

12 – 16Copyright © 2010 Pearson Education, Inc. Publishing as Prentice Hall.
Solved Problem 5
SOLUTION
a. We have D = (275)(365) = 100,375 bars of soap; S = $10; and H = $0.30. The EOQ for the bar of soap is
EOQ = =2DS
H2(100,375)($10)
$0.30
= 6,691,666.7 = 2,586.83 or 2,587 bars

12 – 17Copyright © 2010 Pearson Education, Inc. Publishing as Prentice Hall.
Solved Problem 5
b. We have d = 275 bars/day, σd = 30 bars, L = 5 days, and σLT = 1 day.
σdLT = Lσd2 + d2σLT
2 = (5)(30)2 + (275)2(1)2 = 283.06 bars
Consult the body of the Normal Distribution appendix for 0.9900. The closest value is 0.9901, which corresponds to a z value of 2.33. We calculate the safety stock and reorder point as follows:
Safety stock = zσdLT = (2.33)(283.06) = 659.53 or 660 bars
Reorder point = dL + Safety stock = (275)(5) + 660 = 2,035 bars
12 – 18Copyright © 2010 Pearson Education, Inc. Publishing as Prentice Hall.
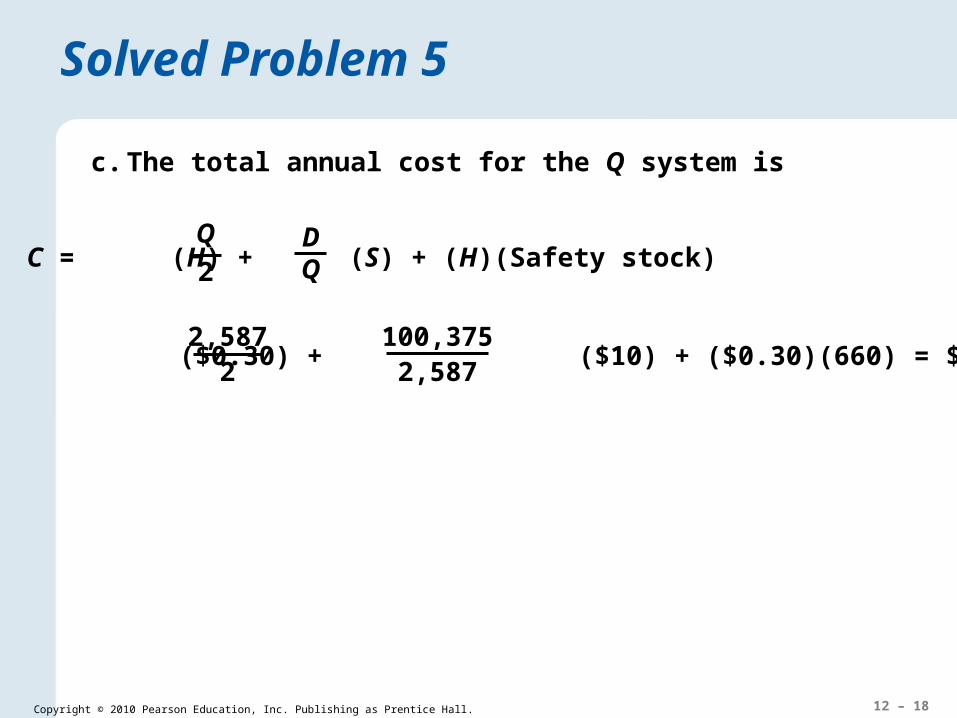
Solved Problem 5
c. The total annual cost for the Q system is
C = (H) + (S) + (H)(Safety stock)Q
2DQ
C = ($0.30) + ($10) + ($0.30)(660) = $974.052,587
2100,375
2,587

12 – 19Copyright © 2010 Pearson Education, Inc. Publishing as Prentice Hall.
Solved Problem 6
Zeke’s Hardware Store sells furnace filters. The cost to place an order to the distributor is $25 and the annual cost to hold a filter in stock is $2. The average demand per week for the filters is 32 units, and the store operates 50 weeks per year. The weekly demand for filters has the probability distribution shown on the left below.
The delivery lead time from the distributor is uncertain and has the probability distribution shown on the right below.
Suppose Zeke wants to use a P system with P = 6 weeks and a cycle-service level of 90 percent. What is the appropriate value for T and the associated annual cost of the system?

12 – 20Copyright © 2010 Pearson Education, Inc. Publishing as Prentice Hall.
Solved Problem 6
Demand Probability
24 0.15
28 0.20
32 0.30
36 0.20
40 0.15
Lead Time (wks) Probability
1 0.05
2 0.25
3 0.40
4 0.25
5 0.05

12 – 21Copyright © 2010 Pearson Education, Inc. Publishing as Prentice Hall.
Solved Problem 6
SOLUTION
Figure 12.13 contains output from the Demand During the Protection Interval Simulator from OM Explorer.
Figure 12.13 – OM Explorer Solver for Demand during the Protection Interval

12 – 22Copyright © 2010 Pearson Education, Inc. Publishing as Prentice Hall.
Solved Problem 6
Given the desired cycle-service level of 90 percent, the appropriate T value is 322 units. The simulation estimated the average demand during the protection interval to be 289 units, consequently the safety stock is 322 – 289 = 33 units.
The annual cost of this P system is
C = ($2) + ($25) + (33)($2)6(32)
250(32)6(32)
= $192.00 + $208.33 + $66.00 = $466.33

12 – 23Copyright © 2010 Pearson Education, Inc. Publishing as Prentice Hall.
Solved Problem 7
Consider Zeke’s inventory in Solved Problem 6. Suppose that he wants to use a continuous review (Q) system for the filters, with an order quantity of 200 and a reorder point of 140. Initial inventory is 170 units. If the stockout cost is $5 per unit, and all of the other data in Solved Problem 6 are the same, what is the expected cost per week of using the Q system?
SOLUTION
Figure 12.14 shows output from the Q System Simulator in OM Explorer. Only weeks 1 through 13 and weeks 41 through 50 are shown in the figure. The average total cost per week is $305.62. Notice that no stockouts occurred in this simulation. These results are dependent on Zeke’s choices for the reorder point and lot size. It is possible that stockouts would occur if the simulation were run for more than 50 weeks.

12 – 24Copyright © 2010 Pearson Education, Inc. Publishing as Prentice Hall.
Solved Problem 7
Figure 12.14 – OM Explorer Q System Simulator

12 – 25Copyright © 2010 Pearson Education, Inc. Publishing as Prentice Hall.
Solved Problem D1
Peachy Keen, Inc., makes mohair sweaters, blouses with Peter Pan collars, pedal pushers, poodle skirts, and other popular clothing styles of the 1950s. The average demand for mohair sweaters is 100 per week. Peachy’s production facility has the capacity to sew 400 sweaters per week. Setup cost is $351. The value of finished goods inventory is $40 per sweater. The annual per-unit inventory holding cost is 20 percent of the item’s value.
a. What is the economic production lot size (ELS)?b. What is the average time between orders (TBO)?c. What is the total of the annual holding cost and setup cost?

12 – 26Copyright © 2010 Pearson Education, Inc. Publishing as Prentice Hall.
Solved Problem D1
SOLUTION
a. The production lot size that minimizes total cost is
dpp
HDS
2ELS
100400
40040200
351521002
$.$
sweaters 78034
300456 ,
b. The average time between orders is
D
ELSOTB ELS year0.15
2005780
,
Converting to weeks, we get
weeks7.8r weeks/yea52 year0.15TBOELS

12 – 27Copyright © 2010 Pearson Education, Inc. Publishing as Prentice Hall.
Solved Problem D1
c. The minimum total of setup and holding costs is
SQD
Hp
dpQC
2
3517802005
40200400
1004002
780$
,$.
r$4,680/year$2,340/year$2,340/yea

12 – 28Copyright © 2010 Pearson Education, Inc. Publishing as Prentice Hall.
Solved Problem D2
A hospital buys disposable surgical packages from Pfisher, Inc. Pfisher’s price schedule is $50.25 per package on orders of 1 to 199 packages and $49.00 per package on orders of 200 or more packages. Ordering cost is $64 per order, and annual holding cost is 20 percent of the per unit purchase price. Annual demand is 490 packages. What is the best purchase quantity?
SOLUTIONWe first calculate the EOQ at the lowest price:
HDS2
EOQ 0049.
packages 804006
004920000644902
,.$.
.$

12 – 29Copyright © 2010 Pearson Education, Inc. Publishing as Prentice Hall.
Solved Problem D2
This solution is infeasible because, according to the price schedule, we cannot purchase 80 packages at a price of $49.00 each. Therefore, we calculate the EOQ at the next lowest price ($50.25):
HDS2
EOQ 2550.
packages 792416
255020000644902
,.$.
.$
This EOQ is feasible, but $50.25 per package is not the lowest price. Hence, we have to determine whether total costs can be reduced by purchasing 200 units and thereby obtaining a quantity discount.

12 – 30Copyright © 2010 Pearson Education, Inc. Publishing as Prentice Hall.
Solved Problem 2
PDSQD
HQ
C 2
4902550006479490
25502002
7979 .$.$.$. C
49000490064200490
00492002
200200 .$.$.$. C
/year$25,416.44$24,622.50ar$396.68/year$396.98/ye
/year$25,146.80$24,010.00ar$156.80/year$980.00/ye
Purchasing 200 units per order will save $269.64/year, compared to buying 79 units at a time.

12 – 31Copyright © 2010 Pearson Education, Inc. Publishing as Prentice Hall.
Solved Problem D3
Swell Productions is sponsoring an outdoor conclave for owners of collectible and classic Fords. The concession stand in the T-Bird area will sell clothing such as T-shirts and official Thunderbird racing jerseys. Jerseys are purchased from Columbia Products for $40 each and are sold during the event for $75 each. If any jerseys are left over, they can be returned to Columbia for a refund of $30 each. Jersey sales depend on the weather, attendance, and other variables. The following table shows the probability of various sales quantities. How many jerseys should Swell Productions order from Columbia for this one-time event?
Sales Quantity Probability Quantity Sales Probability
100 0.05 400 0.34
200 0.11 500 0.11
300 0.34 600 0.05

12 – 32Copyright © 2010 Pearson Education, Inc. Publishing as Prentice Hall.
Solved Problem D3
SOLUTION
Table D.1 is the payoff table that describes this one-period inventory decision. The upper right portion of the table shows the payoffs when the demand, D, is greater than or equal to the order quantity, Q. The payoff is equal to the per-unit profit (the difference between price and cost) multiplied by the order quantity. For example, when the order quantity is 100 and the demand is 200,
Payoff = (p – c)Q = ($75 - $40)100 = $3,500

12 – 33Copyright © 2010 Pearson Education, Inc. Publishing as Prentice Hall.
Solved Problem D3
TABLE D.1 | PAYOFFS
Demand, DExpected
PayoffQ 100 200 300 400 500 600
100 $3,500 $3,500 $3,500 $3,500 $3,500 $3,500 $3,500
200 $2,500 $7,000 $7,000 $7,000 $7,000 $7,000 $6,775
300 $1,500 $6,000 $10,500 $10,500 $10,500 $10,500 $9,555
400 $500 $5,000 $9,500 $14,000 $14,000 $14,000 $10,805
500 ($500) $4,000 $8,500 $13,000 $17,500 $17,500 $10,525
600 ($1,500) $3,000 $7,000 $12,000 $16,500 $21,000 $9,750

12 – 34Copyright © 2010 Pearson Education, Inc. Publishing as Prentice Hall.
Solved Problem D3
The lower-left portion of the payoff table shows the payoffs when the order quantity exceeds the demand. Here the payoff is the profit from sales, pD, minus the loss associated with returning overstock, l(Q – D), where l is the difference between the cost and the amount refunded for each jersey returned and Q – D is the number of jerseys returned. For example, when the order quantity is 500 and the demand is 200,
Payoff = pD – l(Q – D) = ($75 - $40)200 – ($40 – $30)(500 – 200)
= $4,000
The highest expected payoff occurs when 400 jerseys are ordered:
Expected payoff400 = ($500 0.05) + ($5,000 0.11) + ($9,500 0.34) + ($14,000 0.34) + ($14,000 0.11) + ($14,000 0.05)
= $10,805

12 – 35Copyright © 2010 Pearson Education, Inc. Publishing as Prentice Hall.
Application 12.1
Suppose that you are reviewing the inventory policies on an $80 item stocked at a hardware store. The current policy is to replenish inventory by ordering in lots of 360 units. Additional information is:
D = 60 units per week, or 3,120 units per year
S = $30 per order
H = 25% of selling price, or $20 per unit per year
What is the EOQ?
EOQ = =2DS
H= 97 units2(3,120)(30)
20
SOLUTION

12 – 36Copyright © 2010 Pearson Education, Inc. Publishing as Prentice Hall.
Current Policy EOQ Policy
Application 12.1
What is the total annual cost of the current policy (Q = 360), and how does it compare with the cost with using the EOQ?
Q = 360 units Q = 97 units
C = 3,600 + 260
C = $3,860
C = (360/2)(20) + (3,120/360)(30)
C = 970 + 965
C = $1,935
C = (97/2)(20) + (3,120/97)(30)

12 – 37Copyright © 2010 Pearson Education, Inc. Publishing as Prentice Hall.
Application 12.1
What is the time between orders (TBO) for the current policy and the EOQ policy, expressed in weeks?
TBO360 =
TBOEOQ =
(52 weeks per year) = 6 weeks360
3,120
(52 weeks per year) = 1.6 weeks97
3,120
SOLUTION

12 – 38Copyright © 2010 Pearson Education, Inc. Publishing as Prentice Hall.
Application 12.2
The on-hand inventory is only 10 units, and the reorder point R is 100. There are no backorders and one open order for 200 units. Should a new order be placed?
IP = OH + SR – BO = 10 + 200 – 0 = 210
R = 100
SOLUTION
Decision: Place no new order

12 – 39Copyright © 2010 Pearson Education, Inc. Publishing as Prentice Hall.
Application 12.3
Suppose that the demand during lead time is normally distributed with an average of 85 and σdLT = 40. Find the safety stock, and reorder point R, for a 95 percent cycle-service level.
SOLUTION
Safety stock = zσdLT =
Find the safety stock, and reorder point R, for an 85 percent cycle-service level.
R = Average demand during lead time + Safety stock
R = 85 + 66 = 151 units
1.645(40) = 65.8 or 66 units
Safety stock = zσdLT = 1.04(40) = 41.6 or 42 units
R = Average demand during lead time + Safety stock
R = 85 + 42 = 127 units

12 – 40Copyright © 2010 Pearson Education, Inc. Publishing as Prentice Hall.
Application 12.4
Grey Wolf lodge is a popular 500-room hotel in the North Woods. Managers need to keep close tabs on all of the room service items, including a special pint-scented bar soap. The daily demand for the soap is 275 bars, with a standard deviation of 30 bars. Ordering cost is $10 and the inventory holding cost is $0.30/bar/year. The lead time from the supplier is 5 days, with a standard deviation of 1 day. The lodge is open 365 days a year.
What should the reorder point be for the bar of soap if management wants to have a 99 percent cycle-service?

12 – 41Copyright © 2010 Pearson Education, Inc. Publishing as Prentice Hall.
Application 12.4
SOLUTION
d = 275 bars
L = 5 days
σd = 30 bars
σLT = 1 day
283.06 barsσdLT = Lσd2 + d2σLT
2 =
From the Normal Distribution appendix for 0.9900, z = 2.33. We calculate the safety stock and reorder point as follows;
Safety stock = zσdLT =
Reorder point + safety stock = dL + safety stock
(2.33)(283.06) = 659.53 or 660 bars
= (275)(5) + 660 = 2,035 bars

12 – 42Copyright © 2010 Pearson Education, Inc. Publishing as Prentice Hall.
Application 12.5
The Discount Appliance Store uses a continuous review system (Q system). One of the company’s items has the following characteristics:
Demand = 10 units/wk (assume 52 weeks per year)
Ordering and setup cost (S) = $45/order
Holding cost (H) = $12/unit/year
Lead time (L) = 3 weeks (constant)
Standard deviation in weekly demand = 8 units
Cycle-service level = 70%

12 – 43Copyright © 2010 Pearson Education, Inc. Publishing as Prentice Hall.
Application 12.5
SOLUTION
What is the EOQ for this item?
D = 10/wk 52 wks/yr = 520 units
EOQ = =2DS
H= 62 units
2(520)(45)12
What is the desired safety stock?
σdLT = σd L = 8 3 = 14 units
Safety stock = zσdLT = 0.525(14) = 8 units

12 – 44Copyright © 2010 Pearson Education, Inc. Publishing as Prentice Hall.
Application 12.5
What is the desired reorder point R?
R = Average demand during lead time + Safety stock
R =
What is the total annual cost?
3(10) + 8 = 38 units
($12) + ($45) + 8($12) = $845.42622
52062
C =

12 – 45Copyright © 2010 Pearson Education, Inc. Publishing as Prentice Hall.
Application 12.5
Suppose that the current policy is Q = 80 and R = 150. What will be the changes in average cycle inventory and safety stock if your EOQ and R values are implemented?
Reducing Q from 80 to 62
Cycle inventory reduction = 40 – 31 = 9 units
Safety stock reduction = 120 – 8 = 112 units
Reducing R from 150 to 38

12 – 46Copyright © 2010 Pearson Education, Inc. Publishing as Prentice Hall.
Application 12.6
The on-hand inventory is 10 units, and T is 400. There are no back orders, but one scheduled receipt of 200 units. Now is the time to review. How much should be reordered?
SOLUTION
IP = OH + SR – BO
The decision is to order 190 units
= 10 + 200 – 0 = 210
T – IP = 400 – 210 = 190

12 – 47Copyright © 2010 Pearson Education, Inc. Publishing as Prentice Hall.
Application 12.7
Return to Discount Appliance Store (Application 12.4), but now use the P system for the item.
Previous information
Demand = 10 units/wk (assume 52 weeks per year) = 520
EOQ = 62 units (with reorder point system)
Lead time (L) = 3 weeks
Standard deviation in weekly demand = 8 units
z = 0.525 (for cycle-service level of 70%)
Reorder interval P, if you make the average lot size using the Periodic Review System approximate the EOQ.

12 – 48Copyright © 2010 Pearson Education, Inc. Publishing as Prentice Hall.
Application 12.7
SOLUTION
Reorder interval P, if you make the average lot size using the Periodic Review System approximate the EOQ.
P = (EOQ/D)(52) = (62/529)(52) = 6.2 or 6 weeks
Safety stock
Target inventory
T = 10(6 + 3) + 13 = 103 units
T = d(P + L) + safety stock for protection interval
Safety stock = LPd units 13 or 12.63680.525

12 – 49Copyright © 2010 Pearson Education, Inc. Publishing as Prentice Hall.
Application 12.7
Total cost
C = (H) + (S) + HzσP + L
dP2
DdP
= ($12) + ($45) + (13)($12) = $906.0010(6)
2
52010(6)

12 – 50Copyright © 2010 Pearson Education, Inc. Publishing as Prentice Hall.
Application D.1
A domestic automobile manufacturer schedules 12 two-person teams to assemble 4.6 liter DOHC V-8 engines per work day. Each team can assemble 5 engines per day. The automobile final assembly line creates an annual demand for the DOHC engine at 10,080 units per year. The engine and automobile assembly plants operate 6 days per week, 48 weeks per year. The engine assembly line also produces SOHC V-8 engines. The cost to switch the production line from one type of engine to the other is $100,000. It costs $2,000 to store one DOHC V-8 for one year.
a. What is the economic lot size?b. How long is the production run?c. What is the average quantity in inventory?d. What is the total annual cost?

12 – 51Copyright © 2010 Pearson Education, Inc. Publishing as Prentice Hall.
Application D.1
SOLUTION
a. Demand per day = d = 10,080/[(48)(6)] = 35
dpp
HDS
2ELS
385551
356060
0002000100080102
.,,
,,
or 1,555 engines
b. The production run
pQ
days production 26 or 25.91605551
,

12 – 52Copyright © 2010 Pearson Education, Inc. Publishing as Prentice Hall.
Application D.1
c. Average inventory
d. Total annual cost
engines 32460
356025551
,
SQD
Hp
dpQS
QD
HI
C
22max
000100555108010
000260
356025551
,$,,
,$,
1482961
231648917647
,,$
,$,$
p
dpQI22
max

12 – 53Copyright © 2010 Pearson Education, Inc. Publishing as Prentice Hall.
Application D.2
A supplier’s price schedule is:
Order Quantity Price per Unit
0–99 $50
100 or more $45
If ordering cost is $16 per order, annual holding cost is 20 percent of the purchase price, and annual demand is 1,800 items, what is the best order quantity?

12 – 54Copyright © 2010 Pearson Education, Inc. Publishing as Prentice Hall.
Application D.2
SOLUTION
Step 1:
HDS2
EOQ 0045.
e)(infeasibl units 80
20451680012
.
,
HDS2
EOQ 0050.
(feasible) units 76
20501680012
.
,
Step 2:
76C 7599080015016768001
20502
76,$,
,.
100C 73881800145161008001
20452
100,$,
,.
The best order quantity is 100 units

12 – 55Copyright © 2010 Pearson Education, Inc. Publishing as Prentice Hall.
Application D.3
For one item, p = $10 and l = $5. The probability distribution for the season’s demand is:
Demand Demand
(D) Probability
10 0.2
20 0.3
30 0.3
40 0.1
50 0.1
Complete the following payoff matrix, as well as the column on the right showing expected payoff. (Students complete highlighted cells) What is the best choice for Q?

12 – 56Copyright © 2010 Pearson Education, Inc. Publishing as Prentice Hall.
Application D.3
D
Expected Payoff
Q 10 20 30 40 50
10 $100 $100 $100 $100 $100 $100
20 50 200 200 200 200 170
30 0 300 300
40 –50 100 250 400 400 175
50 –100 50 200 350 500 140

12 – 57Copyright © 2010 Pearson Education, Inc. Publishing as Prentice Hall.
Application D.3
Payoff if Q = 30 and D = 20:
pD – l(Q – D) = 10(20) – 5(30 – 20) = $150
Payoff if Q = 30 and D = 40:
Expected payoff if Q = 30:
pD = 10(30) = $300
0(0.2) + 150(0.3) + 300(0.3 + 0.1 + 0.1) = $195
Q = 30 has the highest payoff at $195.00
D
Expected Payoff
Q 10 20 30 40 50
10 $100 $100 $100 $100 $100 $100
20 50 200 200 200 200 170
30 0 300 300
40 –50 100 250 400 400 175
50 –100 50 200 350 500 140
150 300 195

12 – 58Copyright © 2010 Pearson Education, Inc. Publishing as Prentice Hall.