12 february 2014 - tullow oil
TRANSCRIPT
2013 FULL YEAR RESULTS
12 February 2014
2013 FULL YEAR RESULTS
This presentation contains certain forward-looking statements that are subject to the usual risk factors and uncertainties associated with the oil and gas exploration and production business.
Whilst Tullow believes the expectations reflected herein to be reasonable in light of the information available to them at this time, the actual outcome may be materially different owing to factors beyond the Group’s control or within the Group’s control where, for example, the Group decides on a change of plan or strategy.
The Group undertakes no obligation to revise any such forward-looking statements to reflect any changes in the Group’s expectations or any change in circumstances, events or the Group’s plans and strategy. Accordingly no reliance may be placed on the figures contained in such forward looking statements.
Disclaimer
Slide 2
2013 FULL YEAR RESULTS
Agenda
Slide 3
Section Page
Introduction 4
Finance 6
Development and Operations 13
Exploration and Appraisal 18
Conclusion 26
Appendix 28
2013 FULL YEAR RESULTS
TULLOW OIL PLC – 2013 FULL YEAR RESULTS
AIDAN HEAVEY
2013 FULL YEAR RESULTS
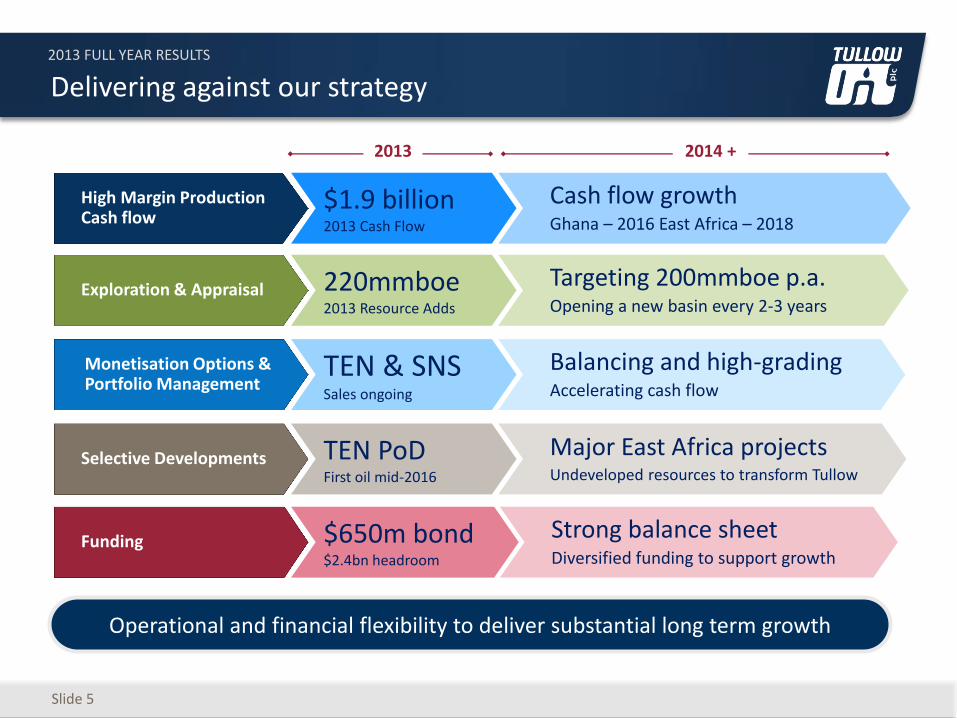
Delivering against our strategy
Slide 5
Exploration & Appraisal
Monetisation Options & Portfolio Management
Selective Developments
High Margin Production Cash flow
$1.9 billion 2013 Cash Flow
Funding
Operational and financial flexibility to deliver substantial long term growth
220mmboe 2013 Resource Adds
TEN & SNS Sales ongoing
TEN PoD First oil mid-2016
$650m bond $2.4bn headroom
Cash flow growth Ghana – 2016 East Africa – 2018
Targeting 200mmboe p.a. Opening a new basin every 2-3 years
Balancing and high-grading Accelerating cash flow
Major East Africa projects Undeveloped resources to transform Tullow
Strong balance sheet Diversified funding to support growth
2013 2014 +
2013 FULL YEAR RESULTS
TULLOW OIL PLC – 2013 FULL YEAR RESULTS
IAN SPRINGETT
2013 FULL YEAR RESULTS
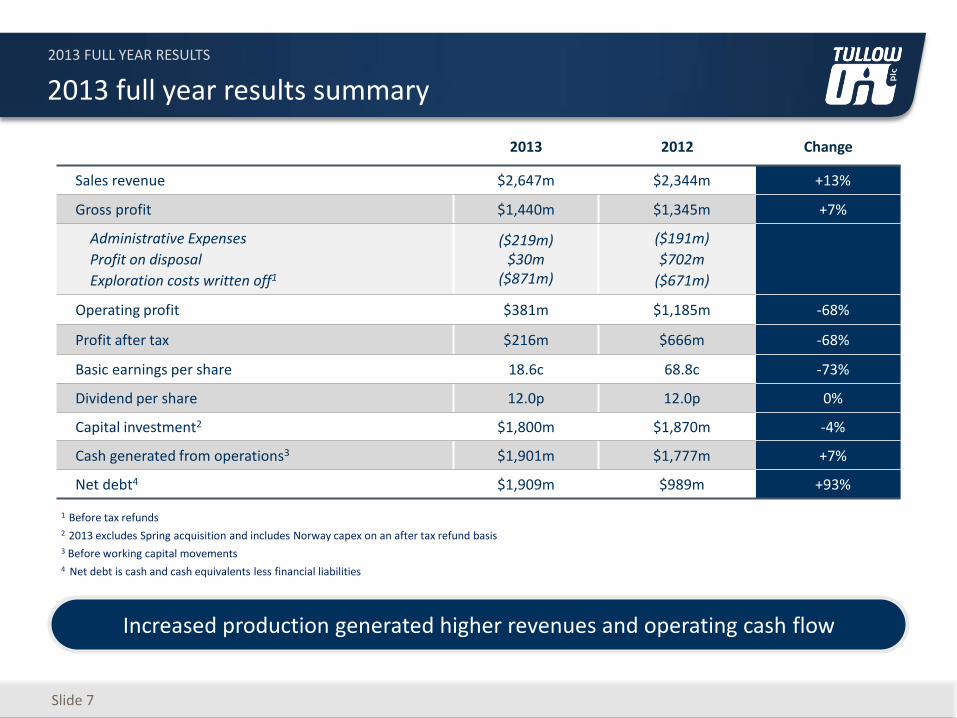
2013 full year results summary
2013 2012 Change
Sales revenue $2,647m $2,344m +13%
Gross profit $1,440m $1,345m +7%
Administrative Expenses
Profit on disposal
Exploration costs written off1
($219m) $30m
($871m)
($191m)
$702m
($671m)
Operating profit $381m $1,185m -68%
Profit after tax $216m $666m -68%
Basic earnings per share 18.6c 68.8c -73%
Dividend per share 12.0p 12.0p 0%
Capital investment2 $1,800m $1,870m -4%
Cash generated from operations3 $1,901m $1,777m +7%
Net debt4 $1,909m $989m +93%
1 Before tax refunds 2 2013 excludes Spring acquisition and includes Norway capex on an after tax refund basis 3 Before working capital movements 4 Net debt is cash and cash equivalents less financial liabilities
Slide 7
Increased production generated higher revenues and operating cash flow
2013 FULL YEAR RESULTS
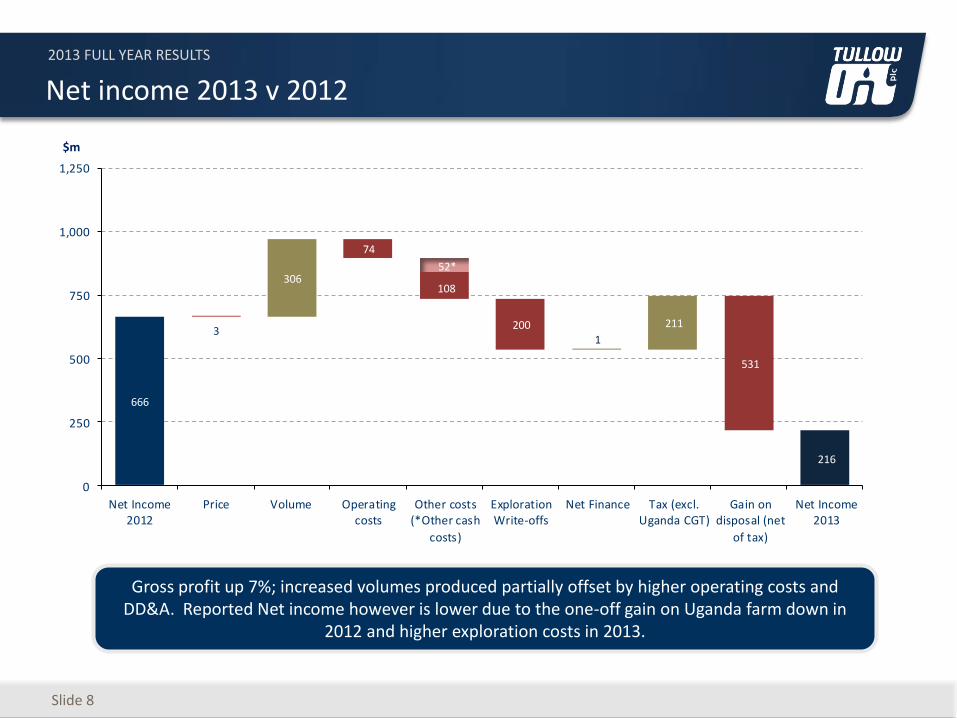
Net income 2013 v 2012
Gross profit up 7%; increased volumes produced partially offset by higher operating costs and DD&A. Reported Net income however is lower due to the one-off gain on Uganda farm down in
2012 and higher exploration costs in 2013.
Slide 8
$m
666
3
306
74
108
2001
211
531
216
0
250
500
750
1,000
1,250
Net Income2012
Price Volume Operatingcosts
Other costs(*Other cash
costs)
ExplorationWrite-offs
Net Finance Tax (excl.Uganda CGT)
Gain ondisposal (net
of tax)
Net Income2013
52*
2013 FULL YEAR RESULTS
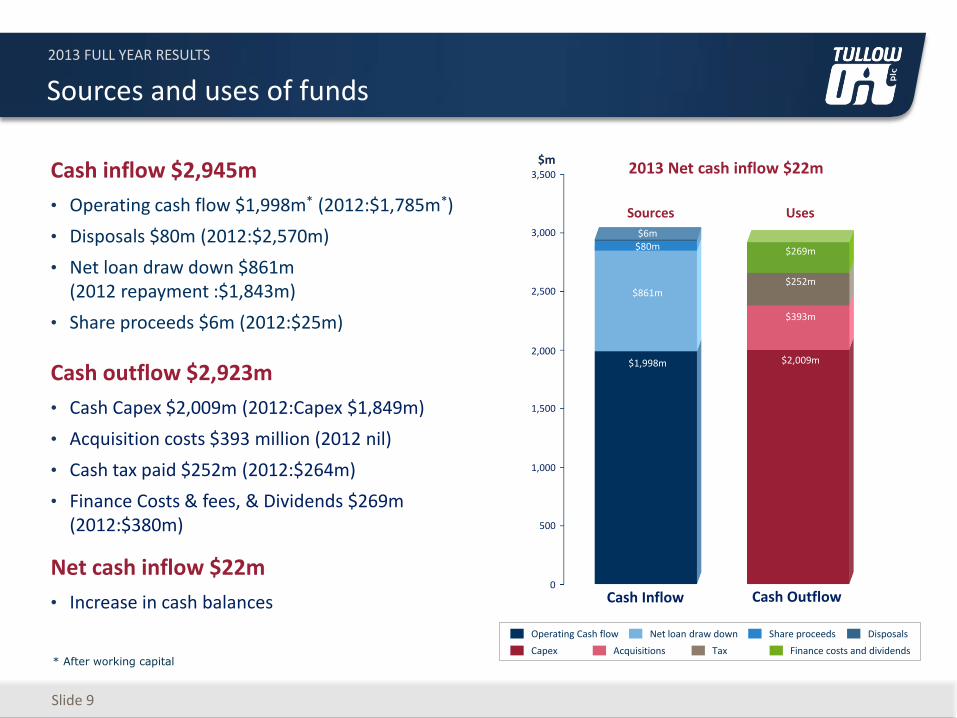
Sources and uses of funds
* After working capital
Slide 9
Cash inflow $2,945m
• Operating cash flow $1,998m* (2012:$1,785m*)
• Disposals $80m (2012:$2,570m)
• Net loan draw down $861m (2012 repayment :$1,843m)
• Share proceeds $6m (2012:$25m)
Cash outflow $2,923m
• Cash Capex $2,009m (2012:Capex $1,849m)
• Acquisition costs $393 million (2012 nil)
• Cash tax paid $252m (2012:$264m)
• Finance Costs & fees, & Dividends $269m (2012:$380m)
Net cash inflow $22m
• Increase in cash balances
Operating Cash flow Net loan draw down
Acquisitions Finance costs and dividends
Share proceeds
Capex Tax
Disposals
3,500
3,000
2,500
2,000
1,500
1,000
500
0
$m 2013 Net cash inflow $22m
Sources Uses
Cash Inflow Cash Outflow
$6m $80m
$861m
$1,998m
$269m
$252m
$2,009m
$393m
2013 FULL YEAR RESULTS
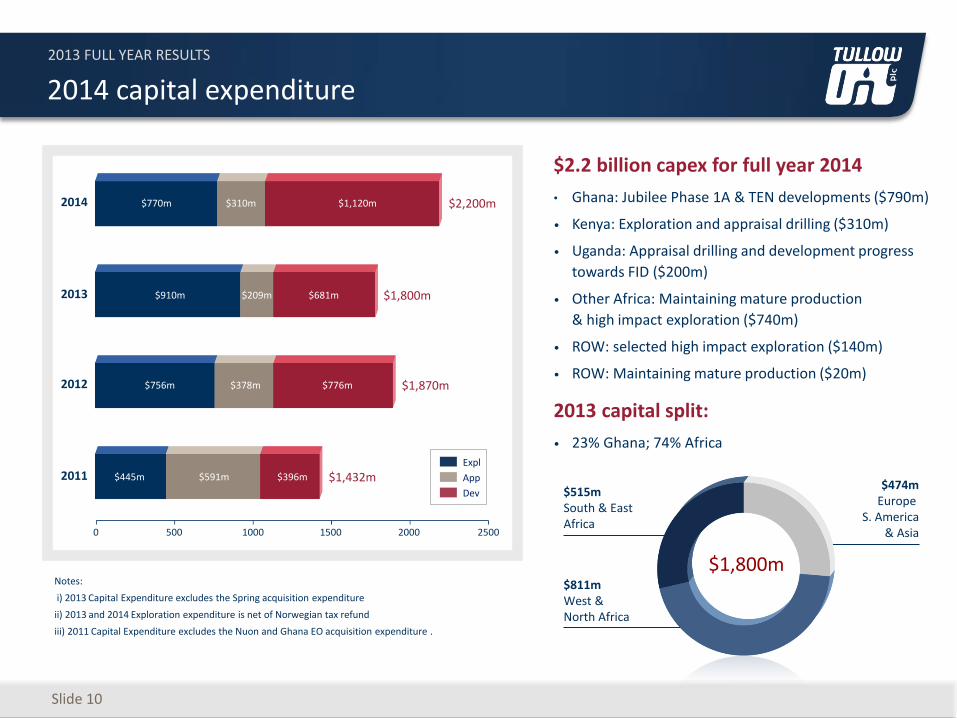
2014 capital expenditure
Slide 10
$2.2 billion capex for full year 2014
• Ghana: Jubilee Phase 1A & TEN developments ($790m)
• Kenya: Exploration and appraisal drilling ($310m)
• Uganda: Appraisal drilling and development progress
towards FID ($200m)
• Other Africa: Maintaining mature production
& high impact exploration ($740m)
• ROW: selected high impact exploration ($140m)
• ROW: Maintaining mature production ($20m)
2013 capital split:
• 23% Ghana; 74% Africa
Notes:
i) 2013 Capital Expenditure excludes the Spring acquisition expenditure
ii) 2013 and 2014 Exploration expenditure is net of Norwegian tax refund
iii) 2011 Capital Expenditure excludes the Nuon and Ghana EO acquisition expenditure .
2012
2011
2013
2014
0 500 1000 1500 2000 2500
$2,200m
$1,800m
$1,870m
$1,432m
$770m
$910m
$756m
$445m
$310m
$209m
$378m
$591m
$1,120m
$681m
$776m
$396m
Dev
Expl
App
$1,800m $811m West & North Africa
$515m South & East Africa
$474m Europe
S. America & Asia
2013 FULL YEAR RESULTS
Slide 11
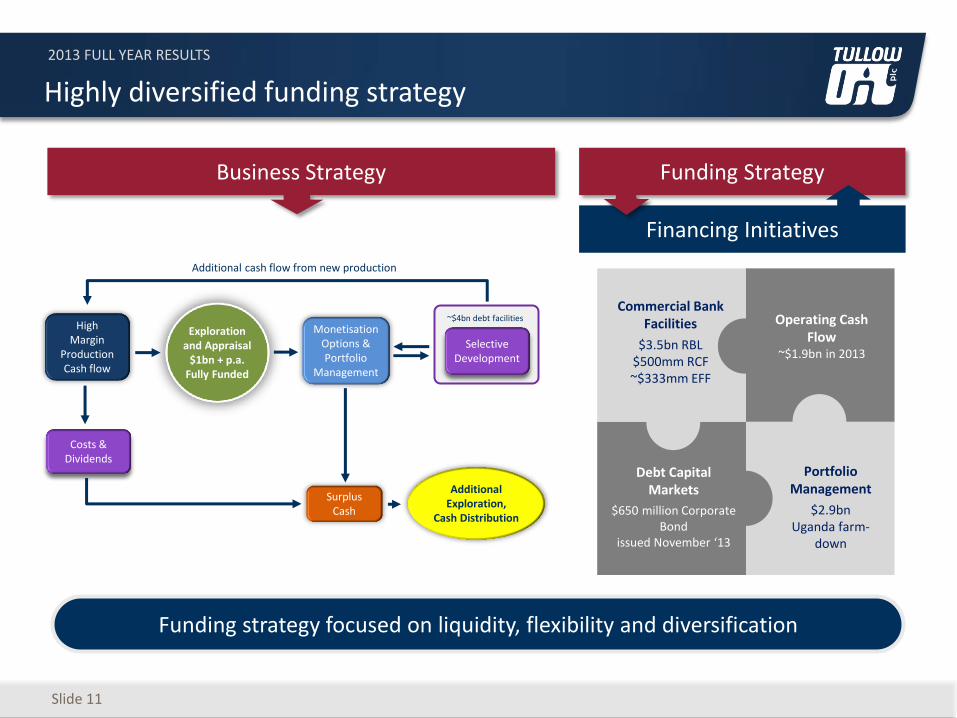
Highly diversified funding strategy
Funding Strategy
Financing Initiatives
Business Strategy
Additional Exploration,
Cash Distribution
Surplus Cash
Costs & Dividends
High Margin
Production Cash flow
Exploration and Appraisal
$1bn + p.a. Fully Funded
Monetisation Options & Portfolio
Management
Selective Development
~$4bn debt facilities
Additional cash flow from new production
Debt Capital Markets
$650 million Corporate Bond
issued November ‘13
Commercial Bank Facilities
$3.5bn RBL $500mm RCF ~$333mm EFF
Operating Cash Flow
~$1.9bn in 2013
Portfolio Management
$2.9bn Uganda farm-
down
Funding strategy focused on liquidity, flexibility and diversification
2013 FULL YEAR RESULTS
TULLOW OIL PLC – 2013 FULL YEAR RESULTS
PAUL McDADE
2013 FULL YEAR RESULTS
South & East Africa
41%
Slide 13
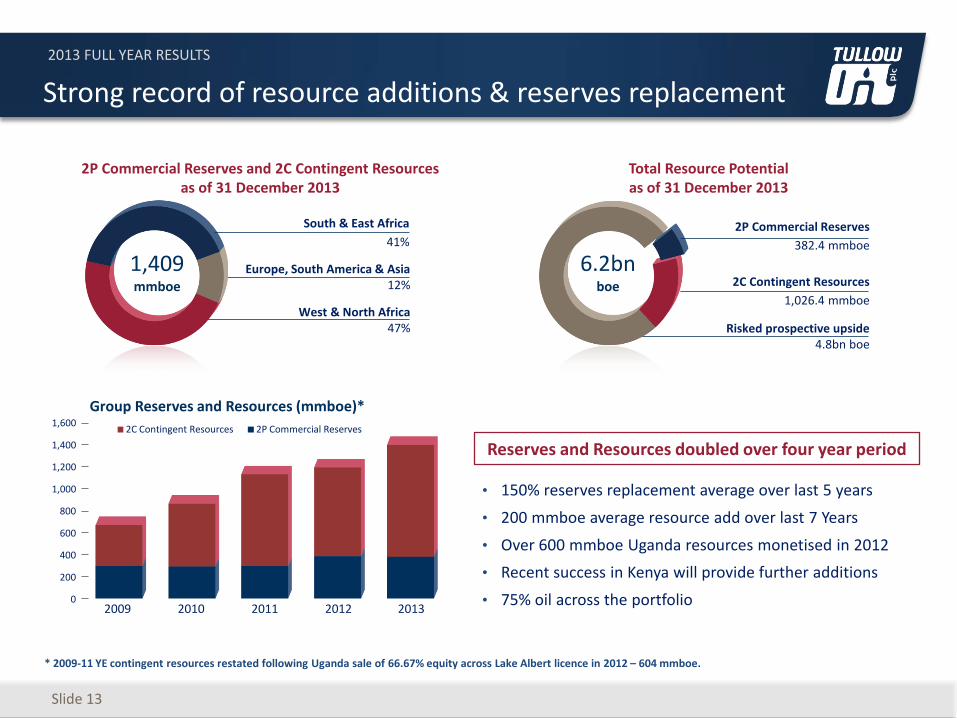
Strong record of resource additions & reserves replacement
• 150% reserves replacement average over last 5 years
• 200 mmboe average resource add over last 7 Years
• Over 600 mmboe Uganda resources monetised in 2012
• Recent success in Kenya will provide further additions
• 75% oil across the portfolio
Group Reserves and Resources (mmboe)*
1,409 mmboe
2P Commercial Reserves and 2C Contingent Resources as of 31 December 2013
* 2009-11 YE contingent resources restated following Uganda sale of 66.67% equity across Lake Albert licence in 2012 – 604 mmboe.
Total Resource Potential as of 31 December 2013
Reserves and Resources doubled over four year period
Europe, South America & Asia 12%
West & North Africa 47%
0
200
400
600
800
1,000
1,200
1,400
1,600
2009 2010 2011 2012 2013
2C Contingent Resources 2P Commercial Reserves
2P Commercial Reserves
382.4 mmboe
2C Contingent Resources
1,026.4 mmboe
Risked prospective upside 4.8bn boe
6.2bn boe
2013 FULL YEAR RESULTS
0
5
10
15
20
25
30
35
40
2012 2013 2014 2015
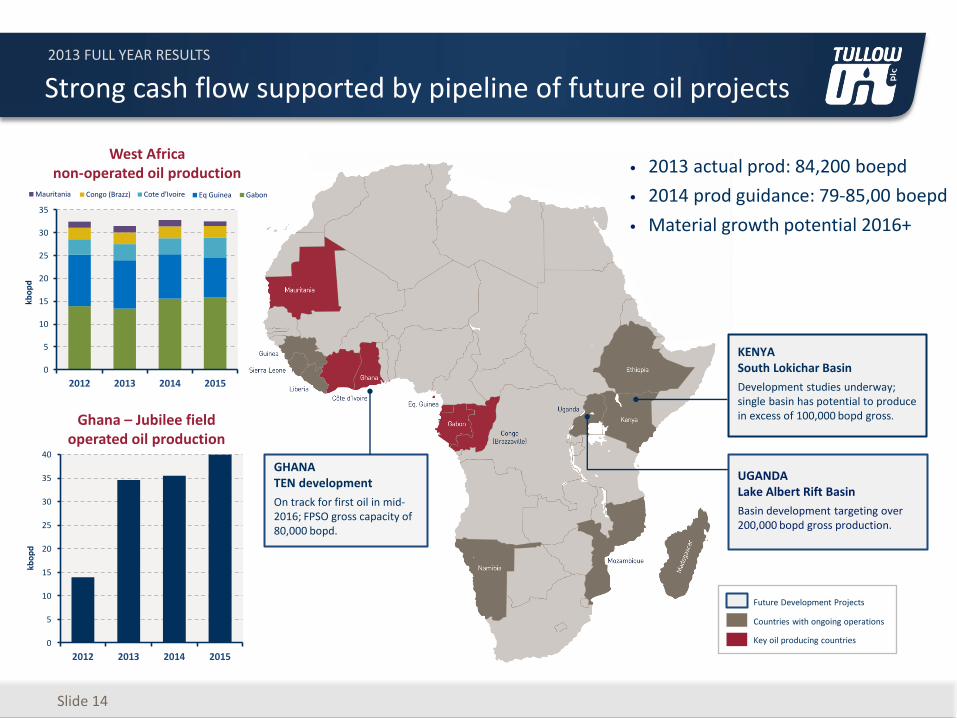
Strong cash flow supported by pipeline of future oil projects
Slide 14
Ghana – Jubilee field operated oil production
kbo
pd
• 2013 actual prod: 84,200 boepd
• 2014 prod guidance: 79-85,00 boepd
• Material growth potential 2016+
GHANA TEN development
On track for first oil in mid-2016; FPSO gross capacity of 80,000 bopd.
0
5
10
15
20
25
30
35
2012 2013 2014 2015
kbo
pd
West Africa non-operated oil production
KENYA South Lokichar Basin
Development studies underway; single basin has potential to produce in excess of 100,000 bopd gross.
UGANDA Lake Albert Rift Basin
Basin development targeting over 200,000 bopd gross production.
Mauritania Congo (Brazz) Cote d'Ivoire Eq Guinea Gabon
Countries with ongoing operations
Key oil producing countries
Future Development Projects
2013 FULL YEAR RESULTS
Slide 15
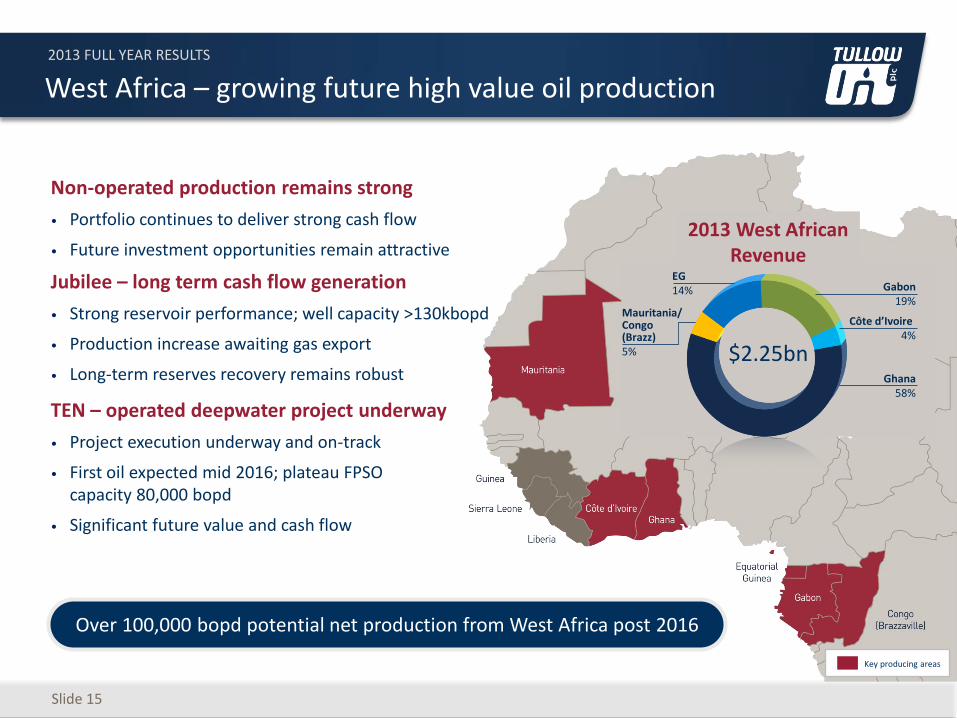
West Africa – growing future high value oil production
Non-operated production remains strong
• Portfolio continues to deliver strong cash flow
• Future investment opportunities remain attractive
Jubilee – long term cash flow generation
• Strong reservoir performance; well capacity >130kbopd
• Production increase awaiting gas export
• Long-term reserves recovery remains robust
TEN – operated deepwater project underway
• Project execution underway and on-track
• First oil expected mid 2016; plateau FPSO capacity 80,000 bopd
• Significant future value and cash flow
Key producing areas
2013 West African Revenue
Gabon
19% Côte d’Ivoire
4%
Ghana 58%
EG 14%
Mauritania/ Congo (Brazz) 5% $2.25bn
Over 100,000 bopd potential net production from West Africa post 2016
2013 FULL YEAR RESULTS
Slide 16
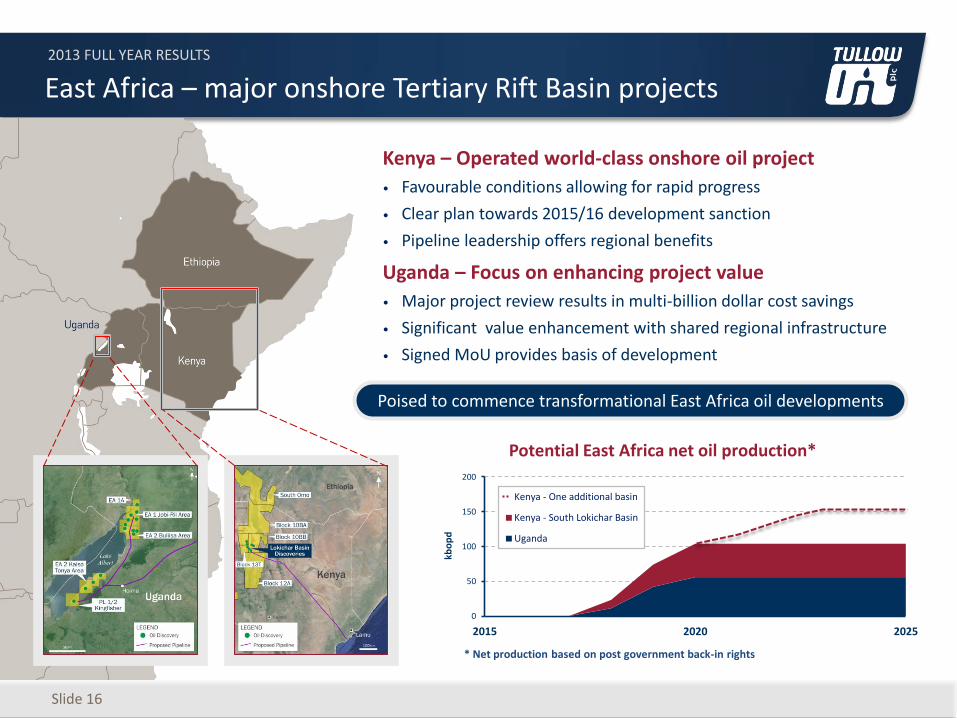
East Africa – major onshore Tertiary Rift Basin projects
Kenya – Operated world-class onshore oil project
• Favourable conditions allowing for rapid progress
• Clear plan towards 2015/16 development sanction
• Pipeline leadership offers regional benefits
Uganda – Focus on enhancing project value
• Major project review results in multi-billion dollar cost savings
• Significant value enhancement with shared regional infrastructure
• Signed MoU provides basis of development
Poised to commence transformational East Africa oil developments
kbo
pd
Potential East Africa net oil production*
* Net production based on post government back-in rights
0
50
100
150
200
2015 2020 2025
Kenya - One additional basin
Kenya - South Lokichar Basin
Uganda
2013 FULL YEAR RESULTS
Slide 17
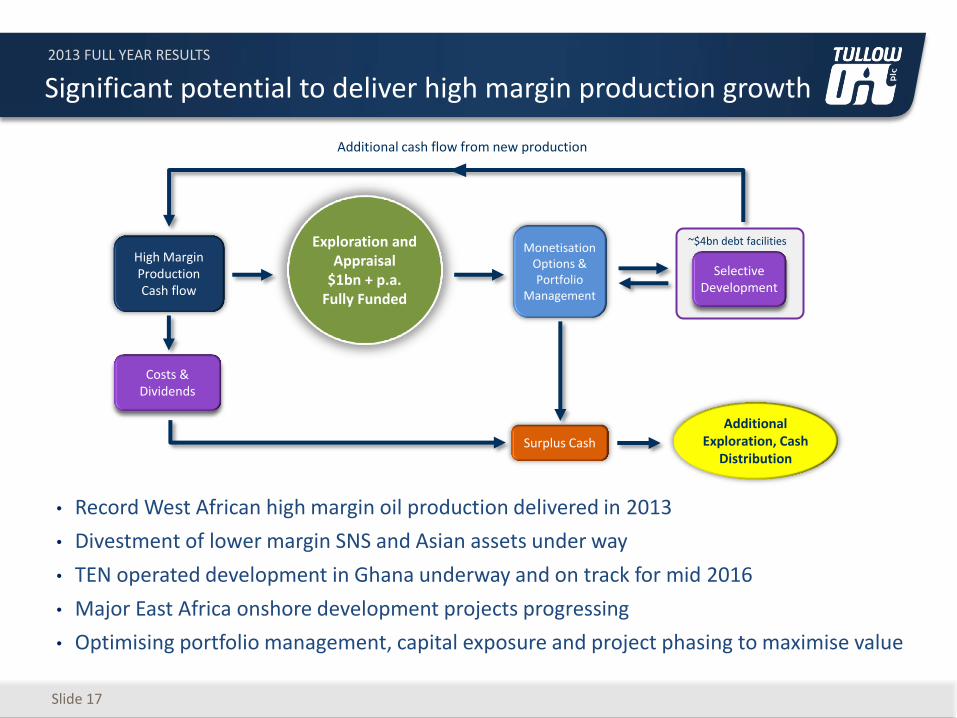
Significant potential to deliver high margin production growth
• Record West African high margin oil production delivered in 2013
• Divestment of lower margin SNS and Asian assets under way
• TEN operated development in Ghana underway and on track for mid 2016
• Major East Africa onshore development projects progressing
• Optimising portfolio management, capital exposure and project phasing to maximise value
Exploration and Appraisal
$1bn + p.a. Fully Funded
Monetisation Options & Portfolio
Management
High Margin Production Cash flow
Selective Development
Additional cash flow from new production
~$4bn debt facilities
Additional Exploration, Cash
Distribution
Costs & Dividends
Surplus Cash
2013 FULL YEAR RESULTS
TULLOW OIL PLC – 2013 FULL YEAR RESULTS
ANGUS McCOSS
2013 FULL YEAR RESULTS
Slide 19
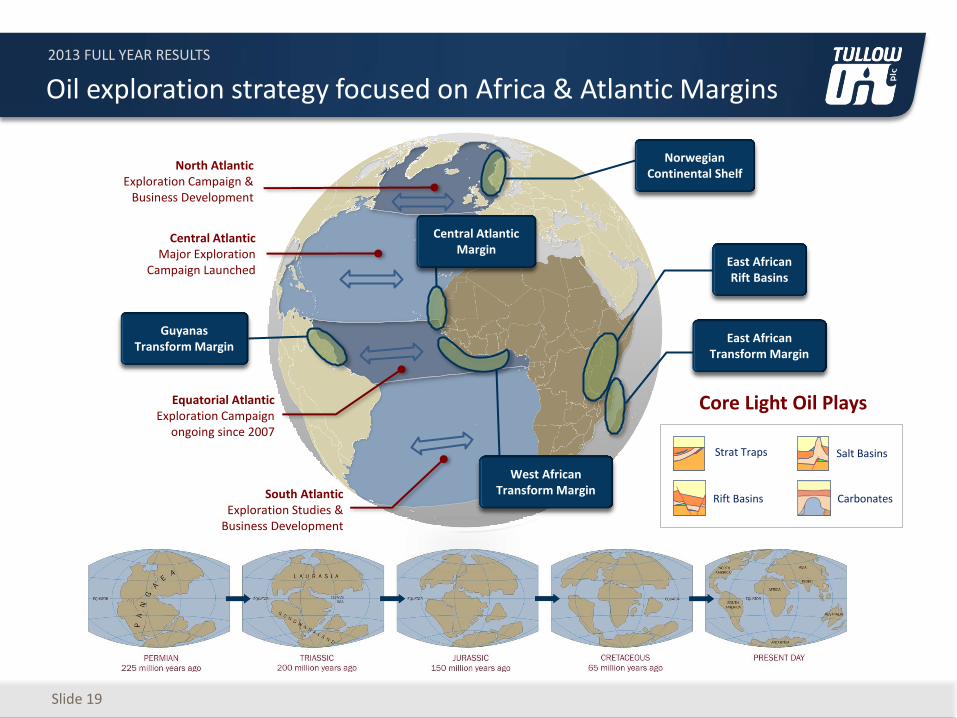
Oil exploration strategy focused on Africa & Atlantic Margins
Guyanas Transform Margin
Central Atlantic Major Exploration
Campaign Launched
North Atlantic Exploration Campaign &
Business Development
South Atlantic Exploration Studies &
Business Development
East African Rift Basins
Equatorial Atlantic Exploration Campaign
ongoing since 2007
East African Transform Margin
Salt Basins
Rift Basins
Strat Traps
Carbonates
Core Light Oil Plays
West African Transform Margin
Central Atlantic Margin
Norwegian Continental Shelf
2013 FULL YEAR RESULTS
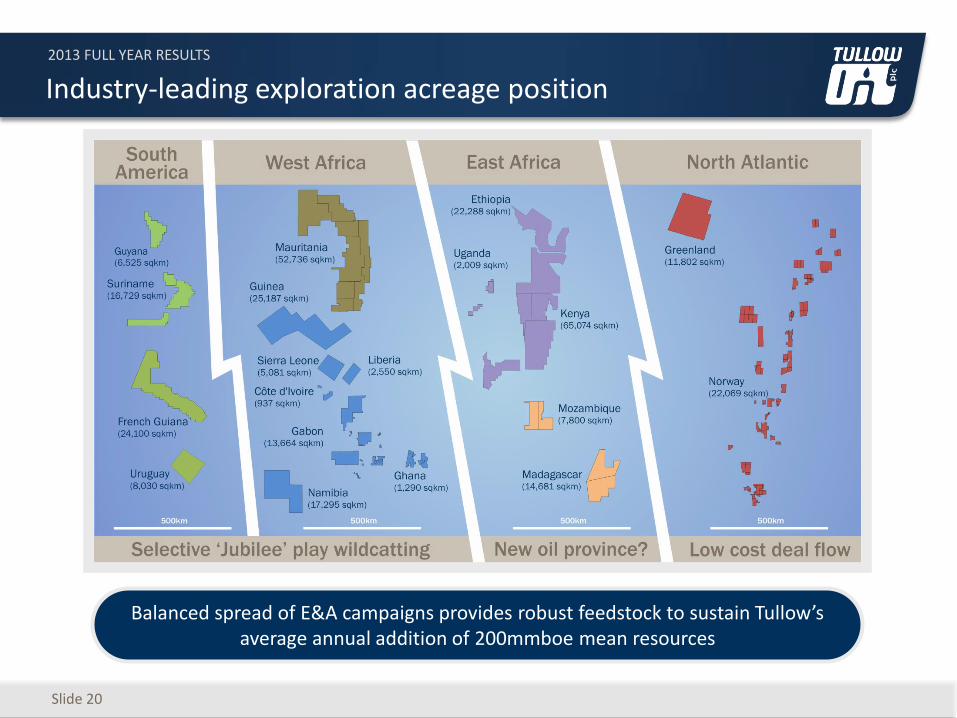
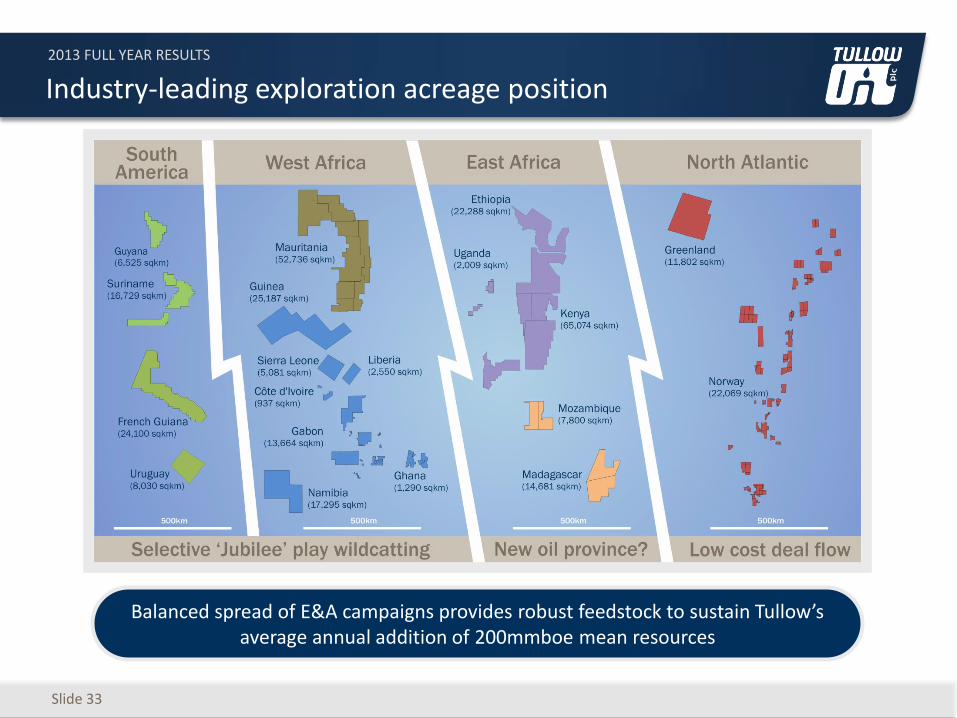
Balanced spread of E&A campaigns provides robust feedstock to sustain Tullow’s average annual addition of 200mmboe mean resources
Slide 20
Industry-leading exploration acreage position
2013 FULL YEAR RESULTS
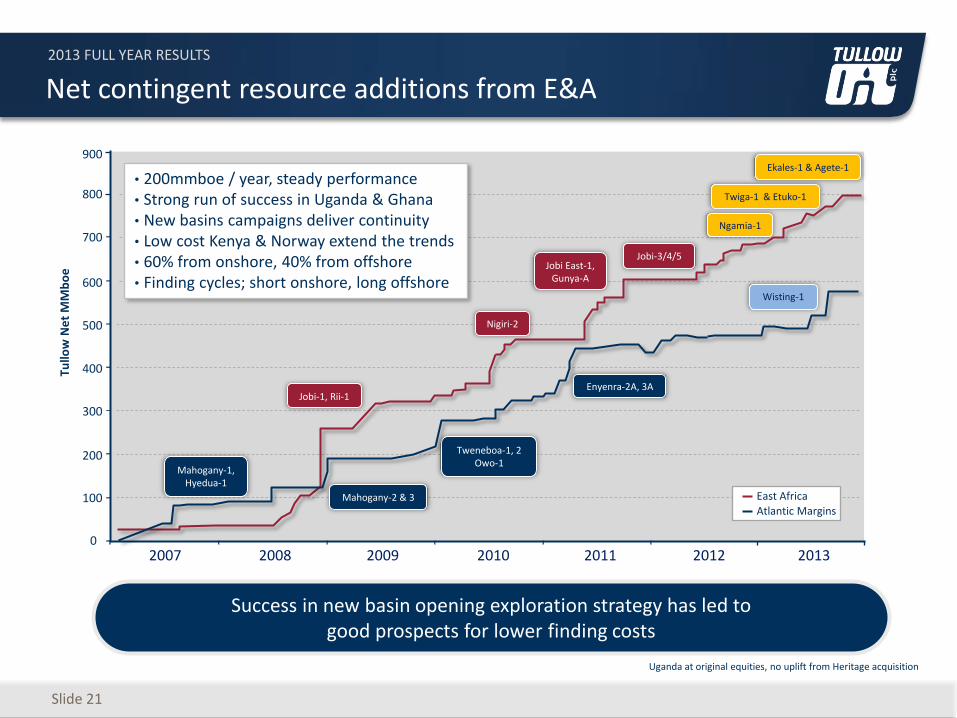
Net contingent resource additions from E&A
Uganda at original equities, no uplift from Heritage acquisition
Slide 21
Success in new basin opening exploration strategy has led to good prospects for lower finding costs
0
100
200
300
400
500
600
700
Tullo
w N
et
MM
bo
e
2007 2008 2009 2010 2011 2012 2013
East Africa
Atlantic Margins
Mahogany-1, Hyedua-1
Mahogany-2 & 3
Tweneboa-1, 2 Owo-1
Enyenra-2A, 3A Jobi-1, Rii-1
Jobi East-1, Gunya-A
Nigiri-2
Jobi-3/4/5
800
900
Ngamia-1
Twiga-1 & Etuko-1
Ekales-1 & Agete-1
Wisting-1
• 200mmboe / year, steady performance • Strong run of success in Uganda & Ghana • New basins campaigns deliver continuity • Low cost Kenya & Norway extend the trends • 60% from onshore, 40% from offshore • Finding cycles; short onshore, long offshore
2013 FULL YEAR RESULTS
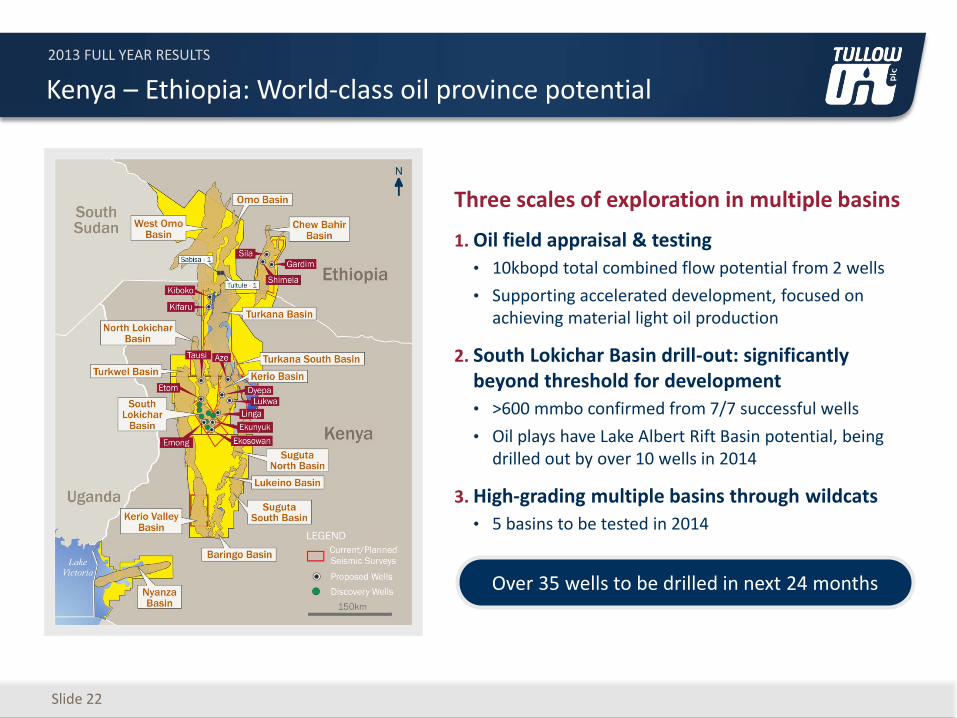
Three scales of exploration in multiple basins
1. Oil field appraisal & testing
• 10kbopd total combined flow potential from 2 wells
• Supporting accelerated development, focused on achieving material light oil production
2. South Lokichar Basin drill-out: significantly beyond threshold for development
• >600 mmbo confirmed from 7/7 successful wells
• Oil plays have Lake Albert Rift Basin potential, being drilled out by over 10 wells in 2014
3. High-grading multiple basins through wildcats
• 5 basins to be tested in 2014
Slide 22
Kenya – Ethiopia: World-class oil province potential
Over 35 wells to be drilled in next 24 months
2013 FULL YEAR RESULTS
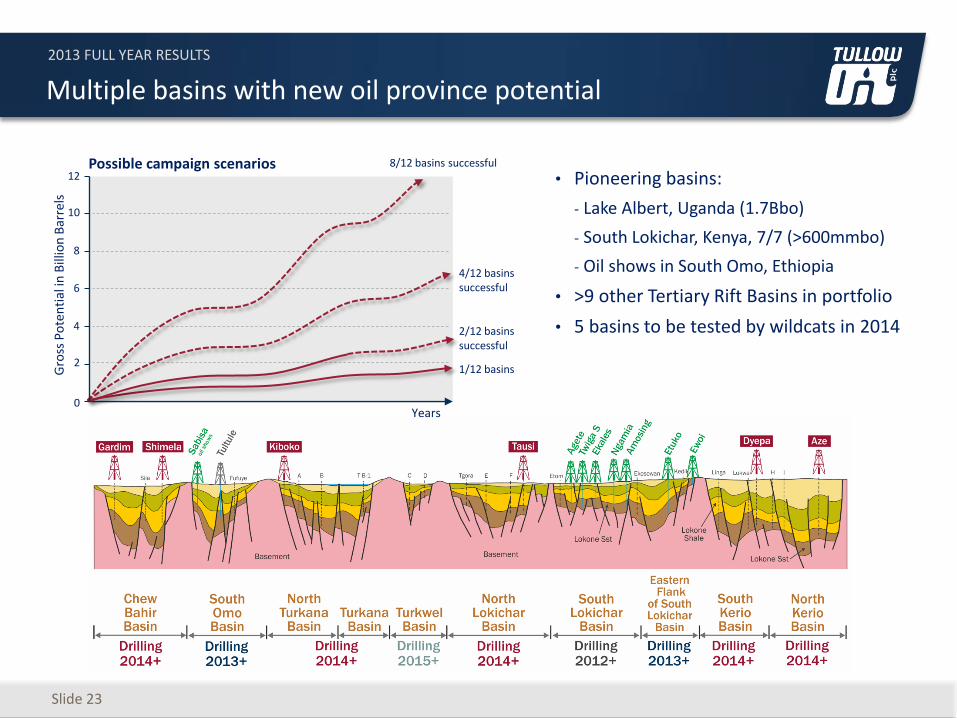
Multiple basins with new oil province potential
Slide 23
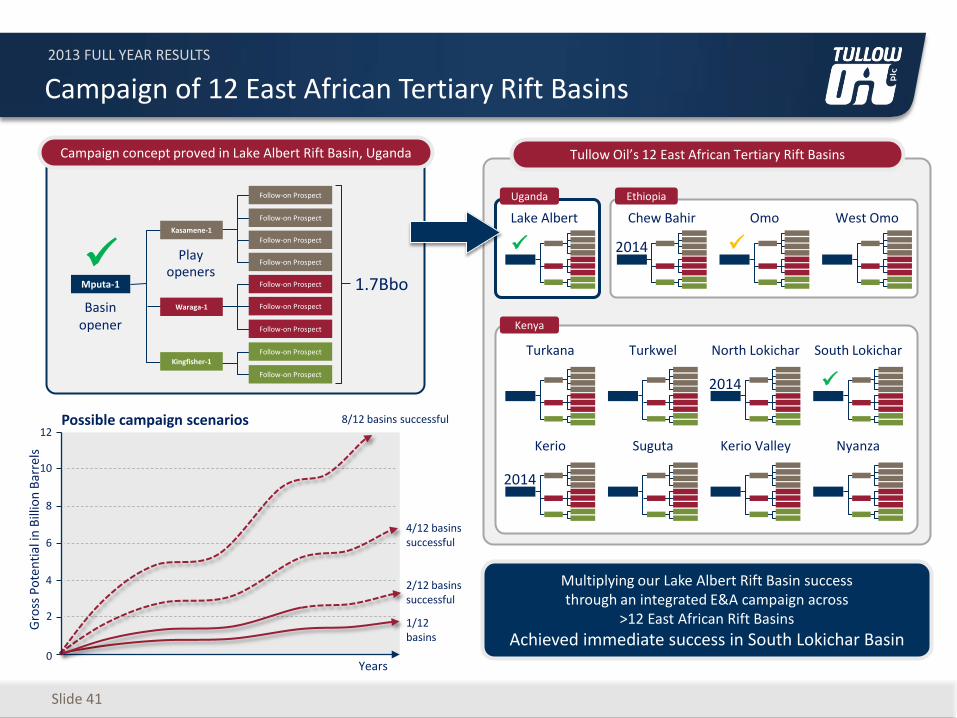
• Pioneering basins:
- Lake Albert, Uganda (1.7Bbo)
- South Lokichar, Kenya, 7/7 (>600mmbo)
- Oil shows in South Omo, Ethiopia
• >9 other Tertiary Rift Basins in portfolio
• 5 basins to be tested by wildcats in 2014
8/12 basins successful
4/12 basins successful
2/12 basins successful
Years
1/12 basins 2
4
6
8
10
12
0
Gro
ss P
ote
nti
al in
Bill
ion
Bar
rels
Possible campaign scenarios
2013 FULL YEAR RESULTS
Slide 24
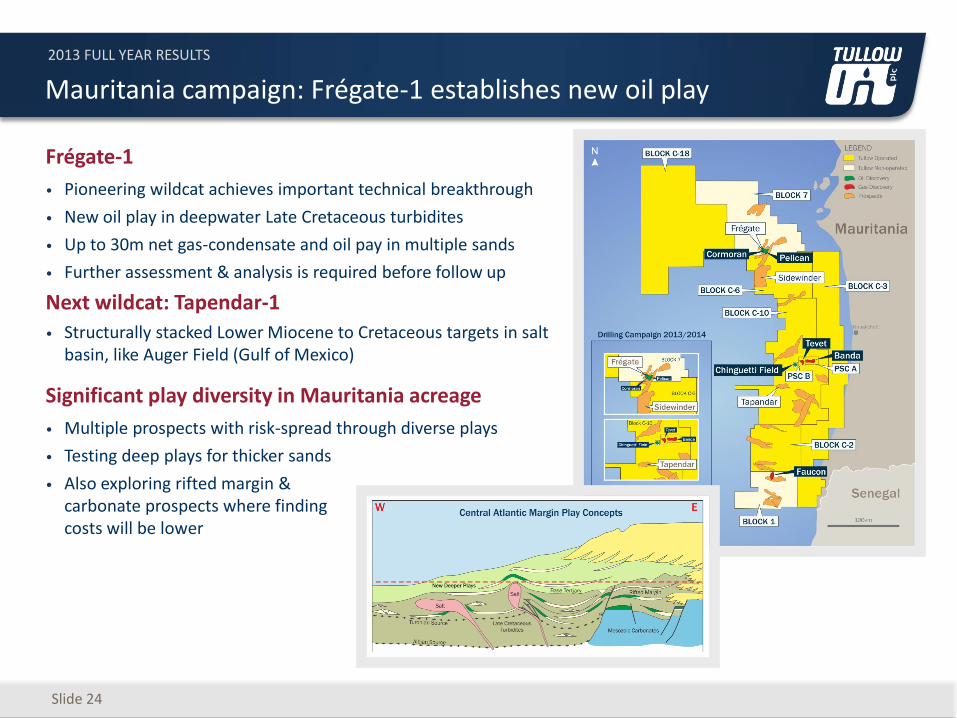
Mauritania campaign: Frégate-1 establishes new oil play
Frégate-1
• Pioneering wildcat achieves important technical breakthrough
• New oil play in deepwater Late Cretaceous turbidites
• Up to 30m net gas-condensate and oil pay in multiple sands
• Further assessment & analysis is required before follow up
Next wildcat: Tapendar-1
• Structurally stacked Lower Miocene to Cretaceous targets in salt basin, like Auger Field (Gulf of Mexico)
Significant play diversity in Mauritania acreage
• Multiple prospects with risk-spread through diverse plays
• Testing deep plays for thicker sands
• Also exploring rifted margin & carbonate prospects where finding costs will be lower
2013 FULL YEAR RESULTS
Slide 25
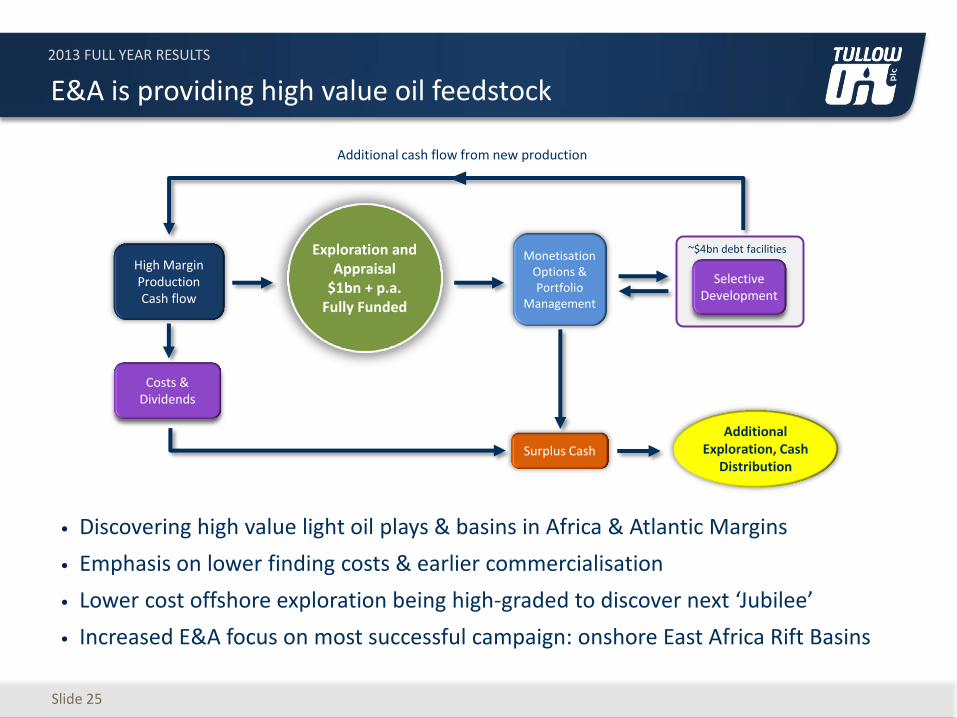
E&A is providing high value oil feedstock
• Discovering high value light oil plays & basins in Africa & Atlantic Margins
• Emphasis on lower finding costs & earlier commercialisation
• Lower cost offshore exploration being high-graded to discover next ‘Jubilee’
• Increased E&A focus on most successful campaign: onshore East Africa Rift Basins
Exploration and Appraisal
$1bn + p.a. Fully Funded
Monetisation Options & Portfolio
Management
High Margin Production Cash flow
Selective Development
Additional cash flow from new production
~$4bn debt facilities
Additional Exploration, Cash
Distribution
Costs & Dividends
Surplus Cash
2013 FULL YEAR RESULTS
TULLOW OIL PLC – 2013 FULL YEAR RESULTS
AIDAN HEAVEY
2013 FULL YEAR RESULTS
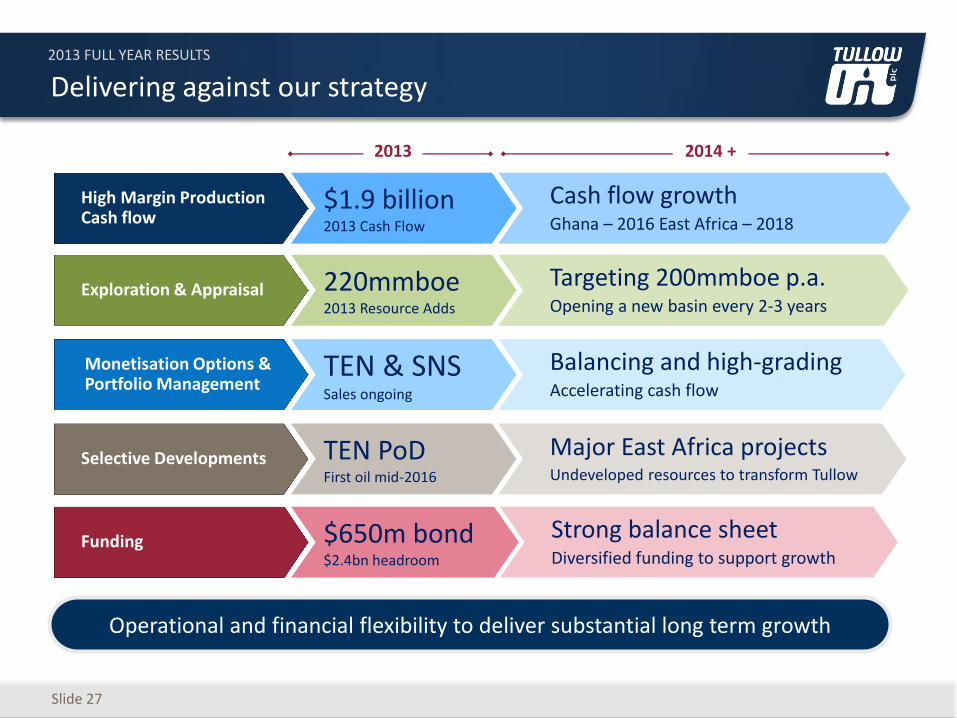
Delivering against our strategy
Slide 27
Exploration & Appraisal
Monetisation Options & Portfolio Management
Selective Developments
High Margin Production Cash flow
$1.9 billion 2013 Cash Flow
Funding
Operational and financial flexibility to deliver substantial long term growth
220mmboe 2013 Resource Adds
TEN & SNS Sales ongoing
TEN PoD First oil mid-2016
$650m bond $2.4bn headroom
Cash flow growth Ghana – 2016 East Africa – 2018
Targeting 200mmboe p.a. Opening a new basin every 2-3 years
Balancing and high-grading Accelerating cash flow
Major East Africa projects Undeveloped resources to transform Tullow
Strong balance sheet Diversified funding to support growth
2013 2014 +
2013 FULL YEAR RESULTS
TULLOW OIL PLC – 2013 FULL YEAR RESULTS
2013 FULL YEAR RESULTS
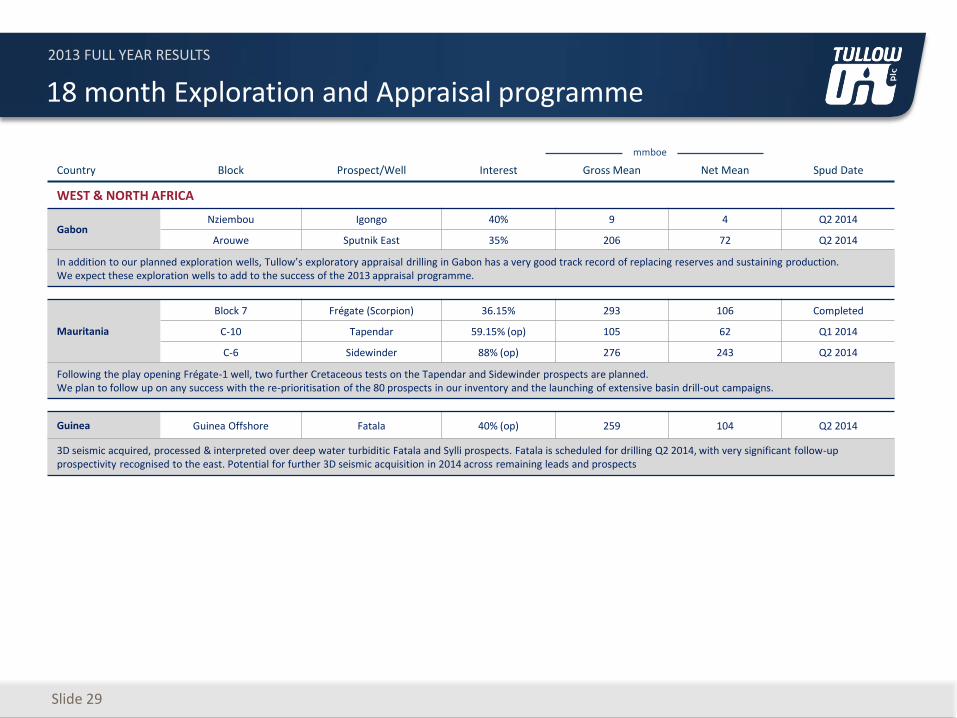
18 month Exploration and Appraisal programme
Slide 29
Country Block Prospect/Well Interest Gross Mean Net Mean Spud Date
WEST & NORTH AFRICA
Gabon Nziembou Igongo 40% 9 4 Q2 2014
Arouwe Sputnik East 35% 206 72 Q2 2014
In addition to our planned exploration wells, Tullow’s exploratory appraisal drilling in Gabon has a very good track record of replacing reserves and sustaining production. We expect these exploration wells to add to the success of the 2013 appraisal programme.
Mauritania
Block 7 Frégate (Scorpion) 36.15% 293 106 Completed
C-10 Tapendar 59.15% (op) 105 62 Q1 2014
C-6 Sidewinder 88% (op) 276 243 Q2 2014
Following the play opening Frégate-1 well, two further Cretaceous tests on the Tapendar and Sidewinder prospects are planned. We plan to follow up on any success with the re-prioritisation of the 80 prospects in our inventory and the launching of extensive basin drill-out campaigns.
Guinea Guinea Offshore Fatala 40% (op) 259 104 Q2 2014
3D seismic acquired, processed & interpreted over deep water turbiditic Fatala and Sylli prospects. Fatala is scheduled for drilling Q2 2014, with very significant follow-up prospectivity recognised to the east. Potential for further 3D seismic acquisition in 2014 across remaining leads and prospects
mmboe
2013 FULL YEAR RESULTS
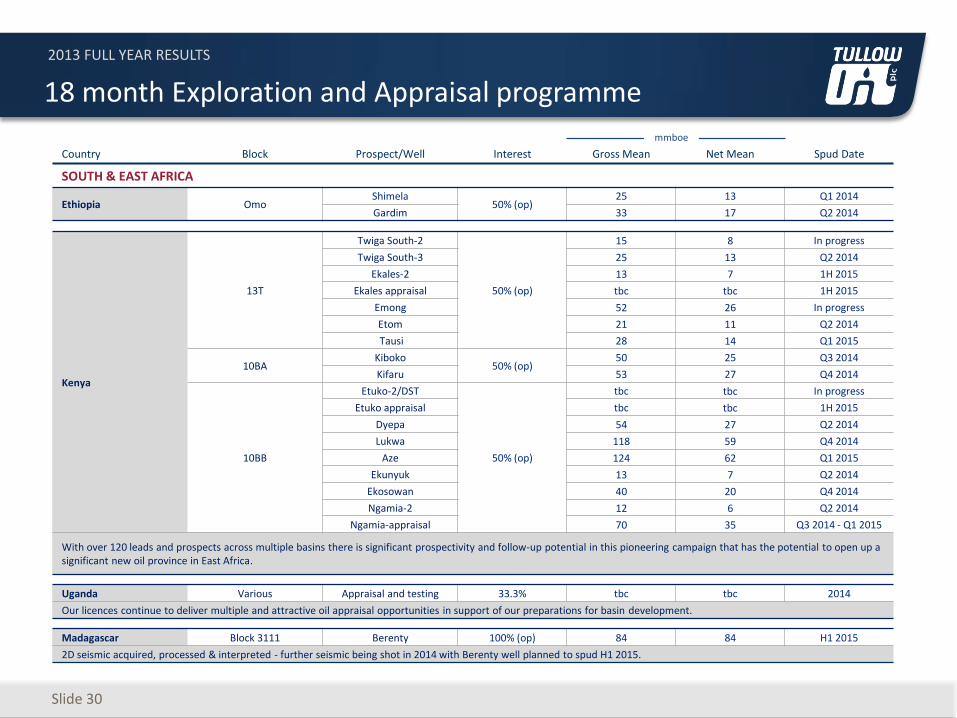
18 month Exploration and Appraisal programme
Slide 30
Country Block Prospect/Well Interest Gross Mean Net Mean Spud Date
SOUTH & EAST AFRICA
Ethiopia Omo Shimela
50% (op) 25 13 Q1 2014
Gardim 33 17 Q2 2014
Kenya
13T
Twiga South-2
50% (op)
15 8 In progress
Twiga South-3 25 13 Q2 2014
Ekales-2 13 7 1H 2015
Ekales appraisal tbc tbc 1H 2015
Emong 52 26 In progress
Etom 21 11 Q2 2014
Tausi 28 14 Q1 2015
10BA Kiboko
50% (op) 50 25 Q3 2014
Kifaru 53 27 Q4 2014
10BB
Etuko-2/DST
50% (op)
tbc tbc In progress
Etuko appraisal tbc tbc 1H 2015
Dyepa 54 27 Q2 2014
Lukwa 118 59 Q4 2014
Aze 124 62 Q1 2015
Ekunyuk 13 7 Q2 2014
Ekosowan 40 20 Q4 2014
Ngamia-2 12 6 Q2 2014
Ngamia-appraisal 70 35 Q3 2014 - Q1 2015
With over 120 leads and prospects across multiple basins there is significant prospectivity and follow-up potential in this pioneering campaign that has the potential to open up a significant new oil province in East Africa.
Uganda Various Appraisal and testing 33.3% tbc tbc 2014
Our licences continue to deliver multiple and attractive oil appraisal opportunities in support of our preparations for basin development.
Madagascar Block 3111 Berenty 100% (op) 84 84 H1 2015
2D seismic acquired, processed & interpreted - further seismic being shot in 2014 with Berenty well planned to spud H1 2015.
mmboe
2013 FULL YEAR RESULTS
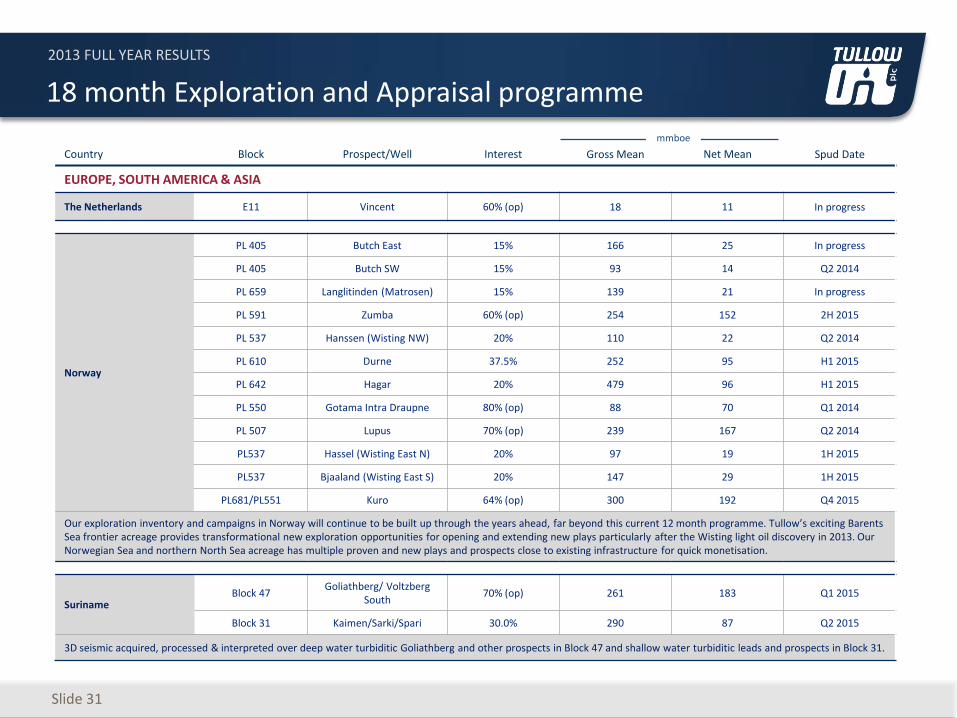
18 month Exploration and Appraisal programme
Slide 31
Country Block Prospect/Well Interest Gross Mean Net Mean Spud Date
EUROPE, SOUTH AMERICA & ASIA
The Netherlands E11 Vincent 60% (op) 18 11 In progress
Norway
PL 405 Butch East 15% 166 25 In progress
PL 405 Butch SW 15% 93 14 Q2 2014
PL 659 Langlitinden (Matrosen) 15% 139 21 In progress
PL 591 Zumba 60% (op) 254 152 2H 2015
PL 537 Hanssen (Wisting NW) 20% 110 22 Q2 2014
PL 610 Durne 37.5% 252 95 H1 2015
PL 642 Hagar 20% 479 96 H1 2015
PL 550 Gotama Intra Draupne 80% (op) 88 70 Q1 2014
PL 507 Lupus 70% (op) 239 167 Q2 2014
PL537 Hassel (Wisting East N) 20% 97 19 1H 2015
PL537 Bjaaland (Wisting East S) 20% 147 29 1H 2015
PL681/PL551 Kuro 64% (op) 300 192 Q4 2015
Our exploration inventory and campaigns in Norway will continue to be built up through the years ahead, far beyond this current 12 month programme. Tullow’s exciting Barents Sea frontier acreage provides transformational new exploration opportunities for opening and extending new plays particularly after the Wisting light oil discovery in 2013. Our Norwegian Sea and northern North Sea acreage has multiple proven and new plays and prospects close to existing infrastructure for quick monetisation.
Suriname Block 47
Goliathberg/ Voltzberg South
70% (op) 261 183 Q1 2015
Block 31 Kaimen/Sarki/Spari 30.0% 290 87 Q2 2015
3D seismic acquired, processed & interpreted over deep water turbiditic Goliathberg and other prospects in Block 47 and shallow water turbiditic leads and prospects in Block 31.
mmboe
2013 FULL YEAR RESULTS
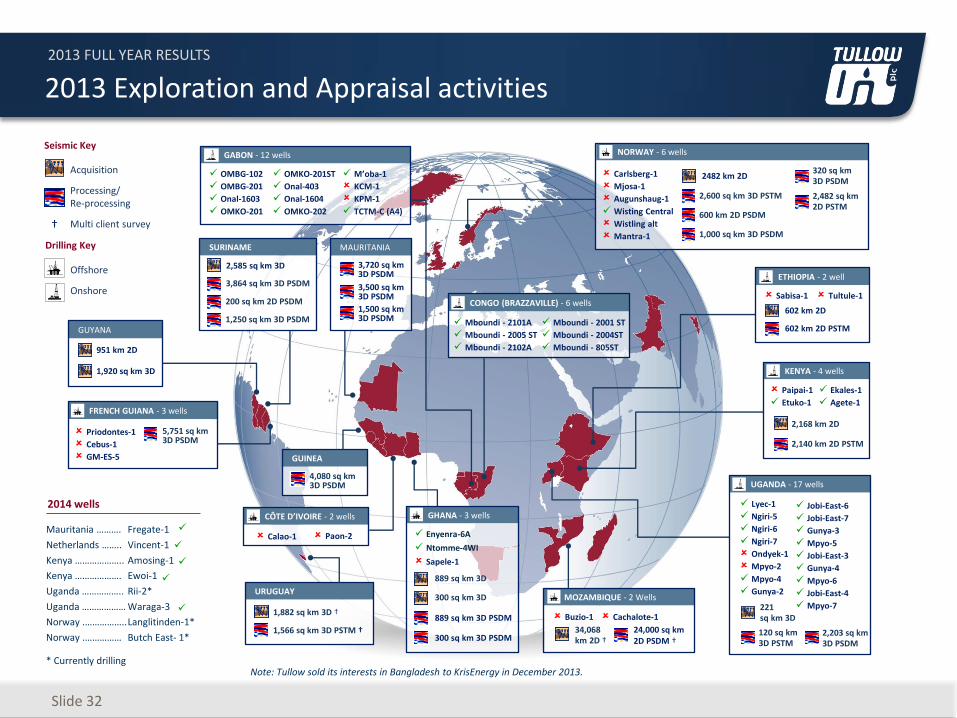
2013 Exploration and Appraisal activities
Slide 32
Seismic Key
Drilling Key
Acquisition
Processing/ Re-processing
Multi client survey
Offshore
Onshore
†
Note: Tullow sold its interests in Bangladesh to KrisEnergy in December 2013.
URUGUAY
1,882 sq km 3D †
1,566 sq km 3D PSTM †
FRENCH GUIANA - 3 wells
5,751 sq km 3D PSDM
Priodontes-1
Cebus-1
GM-ES-5 GUINEA
4,080 sq km 3D PSDM
CONGO (BRAZZAVILLE) - 6 wells
Mboundi - 2101A
Mboundi - 2005 ST
Mboundi - 2102A
Mboundi - 2001 ST
Mboundi - 2004ST
Mboundi - 805ST
GHANA - 3 wells
Enyenra-6A
Ntomme-4WI
Sapele-1
889 sq km 3D
889 sq km 3D PSDM
ETHIOPIA - 2 well
602 km 2D
602 km 2D PSTM
Tultule-1 Sabisa-1
KENYA - 4 wells
2,168 km 2D
2,140 km 2D PSTM
Ekales-1
Agete-1
Paipai-1
Etuko-1
CÔTE D’IVOIRE - 2 wells
Paon-2 Calao-1
MOZAMBIQUE - 2 Wells
34,068 km 2D †
Buzio-1
24,000 sq km 2D PSDM †
Cachalote-1
GUYANA
951 km 2D
1,920 sq km 3D
SURINAME
3,864 sq km 3D PSDM
200 sq km 2D PSDM
2,585 sq km 3D
2014 wells
Mauritania ……….
Netherlands ……..
Kenya ………………..
Kenya ……………….
Uganda ……………..
Uganda ………………
Norway .……………..
Norway .……………
Fregate-1
Vincent-1
Amosing-1
Ewoi-1
Rii-2*
Waraga-3
Langlitinden-1*
Butch East- 1*
* Currently drilling
300 sq km 3D
300 sq km 3D PSDM
UGANDA - 17 wells
Jobi-East-6
Jobi-East-7
Gunya-3
Mpyo-5
Jobi-East-3
Gunya-4
Mpyo-6
Jobi-East-4
Mpyo-7 221 sq km 3D
Lyec-1
Ngiri-5
Ngiri-6
Ngiri-7
Ondyek-1
Mpyo-2
Mpyo-4
Gunya-2
120 sq km 3D PSTM
2,203 sq km 3D PSDM
NORWAY - 6 wells
2,600 sq km 3D PSTM
600 km 2D PSDM
1,000 sq km 3D PSDM
Carlsberg-1
Mjosa-1
Augunshaug-1
Wisting Central
Wistling alt
Mantra-1
2482 km 2D 320 sq km 3D PSDM
2,482 sq km 2D PSTM
GABON - 12 wells
OMBG-102
OMBG-201
Onal-1603
OMKO-201
OMKO-201ST
Onal-403
Onal-1604
OMKO-202
M’oba-1
KCM-1
KPM-1
TCTM-C (A4)
MAURITANIA
3,720 sq km 3D PSDM
3,500 sq km 3D PSDM
1,500 sq km 3D PSDM 1,250 sq km 3D PSDM
2013 FULL YEAR RESULTS
Balanced spread of E&A campaigns provides robust feedstock to sustain Tullow’s average annual addition of 200mmboe mean resources
Slide 33
Industry-leading exploration acreage position
2013 FULL YEAR RESULTS
Slide 34
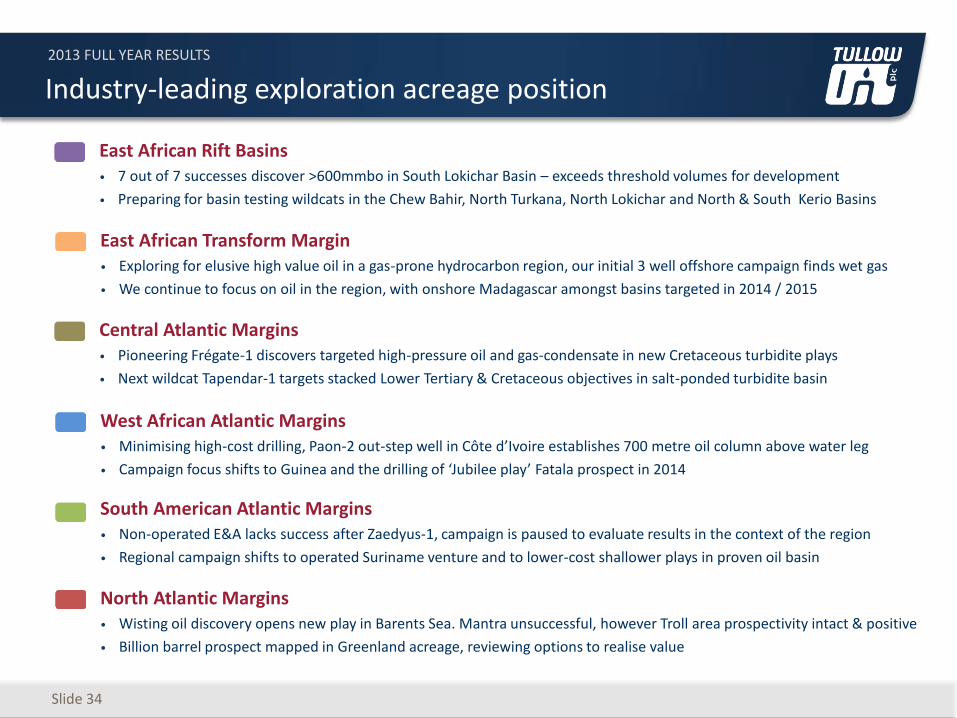
Industry-leading exploration acreage position
Central Atlantic Margins • Pioneering Frégate-1 discovers targeted high-pressure oil and gas-condensate in new Cretaceous turbidite plays
• Next wildcat Tapendar-1 targets stacked Lower Tertiary & Cretaceous objectives in salt-ponded turbidite basin
West African Atlantic Margins • Minimising high-cost drilling, Paon-2 out-step well in Côte d’Ivoire establishes 700 metre oil column above water leg
• Campaign focus shifts to Guinea and the drilling of ‘Jubilee play’ Fatala prospect in 2014
East African Rift Basins • 7 out of 7 successes discover >600mmbo in South Lokichar Basin – exceeds threshold volumes for development
• Preparing for basin testing wildcats in the Chew Bahir, North Turkana, North Lokichar and North & South Kerio Basins
North Atlantic Margins • Wisting oil discovery opens new play in Barents Sea. Mantra unsuccessful, however Troll area prospectivity intact & positive
• Billion barrel prospect mapped in Greenland acreage, reviewing options to realise value
East African Transform Margin • Exploring for elusive high value oil in a gas-prone hydrocarbon region, our initial 3 well offshore campaign finds wet gas
• We continue to focus on oil in the region, with onshore Madagascar amongst basins targeted in 2014 / 2015
South American Atlantic Margins • Non-operated E&A lacks success after Zaedyus-1, campaign is paused to evaluate results in the context of the region
• Regional campaign shifts to operated Suriname venture and to lower-cost shallower plays in proven oil basin
2013 FULL YEAR RESULTS
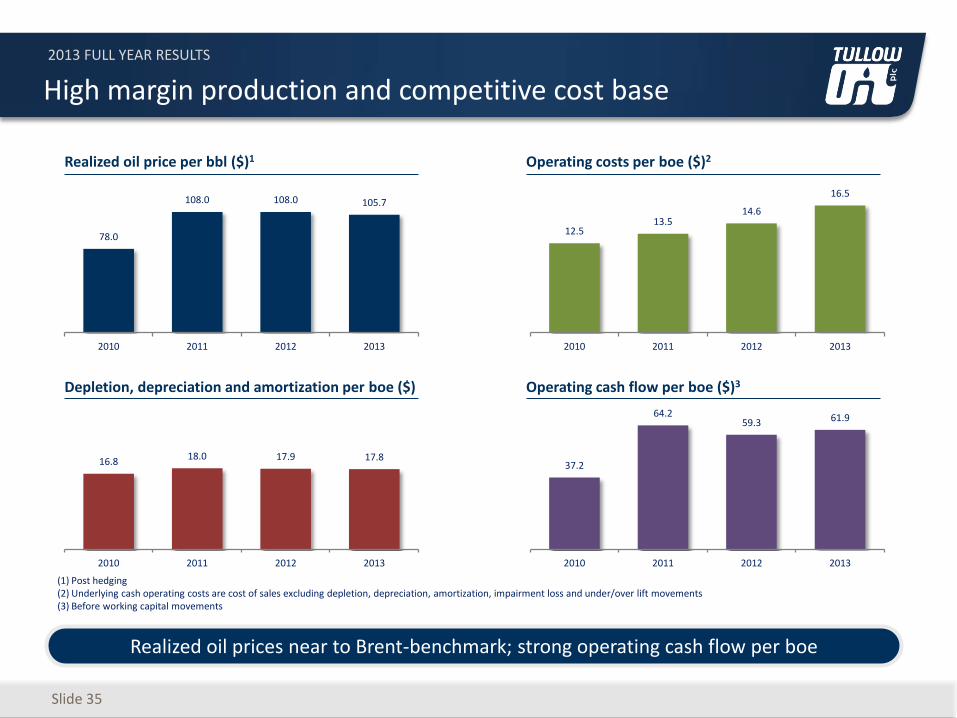
78.0
108.0 108.0 105.7
2010 2011 2012 2013
Slide 35
High margin production and competitive cost base
(1) Post hedging (2) Underlying cash operating costs are cost of sales excluding depletion, depreciation, amortization, impairment loss and under/over lift movements (3) Before working capital movements
Realized oil prices near to Brent-benchmark; strong operating cash flow per boe
12.5 13.5
14.6
16.5
2010 2011 2012 2013
16.8 18.0 17.9 17.8
2010 2011 2012 2013
37.2
64.2 59.3 61.9
2010 2011 2012 2013
Realized oil price per bbl ($)1 Operating costs per boe ($)2
Depletion, depreciation and amortization per boe ($) Operating cash flow per boe ($)3
2013 FULL YEAR RESULTS
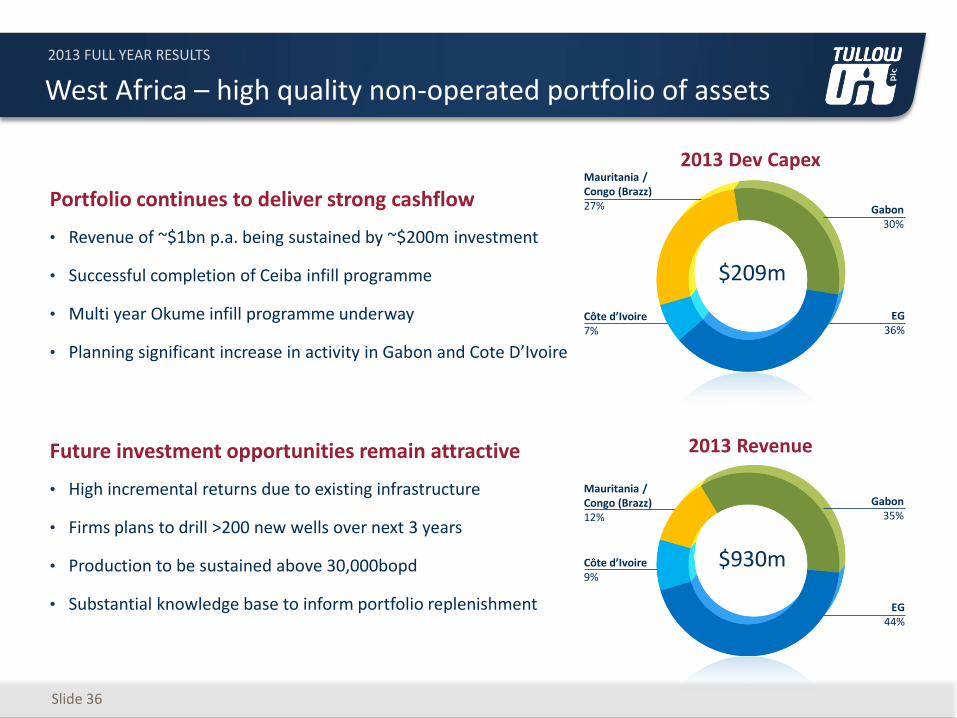
West Africa – high quality non-operated portfolio of assets
Slide 36
Portfolio continues to deliver strong cashflow
• Revenue of ~$1bn p.a. being sustained by ~$200m investment
• Successful completion of Ceiba infill programme
• Multi year Okume infill programme underway
• Planning significant increase in activity in Gabon and Cote D’Ivoire
Future investment opportunities remain attractive
• High incremental returns due to existing infrastructure
• Firms plans to drill >200 new wells over next 3 years
• Production to be sustained above 30,000bopd
• Substantial knowledge base to inform portfolio replenishment
2013 Dev Capex
Gabon
30%
Côte d’Ivoire 7%
$209m
EG 36%
Mauritania / Congo (Brazz) 27%
2013 Revenue
Gabon
35%
EG 44%
Côte d’Ivoire 9%
Mauritania / Congo (Brazz) 12%
$930m
2013 FULL YEAR RESULTS
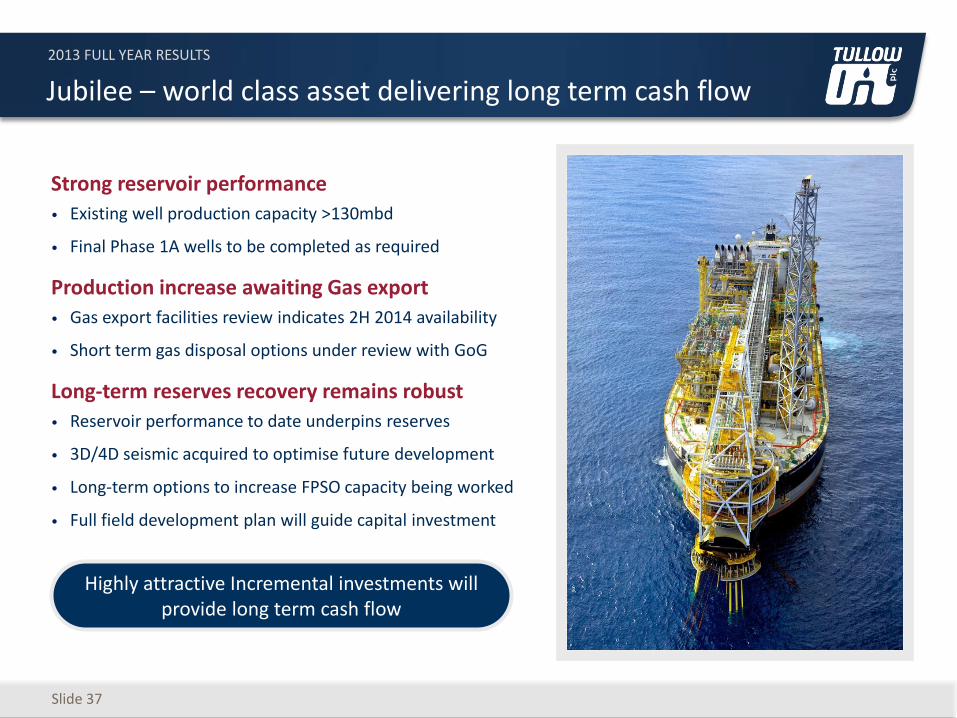
Jubilee – world class asset delivering long term cash flow
Strong reservoir performance
• Existing well production capacity >130mbd
• Final Phase 1A wells to be completed as required
Production increase awaiting Gas export
• Gas export facilities review indicates 2H 2014 availability
• Short term gas disposal options under review with GoG
Long-term reserves recovery remains robust
• Reservoir performance to date underpins reserves
• 3D/4D seismic acquired to optimise future development
• Long-term options to increase FPSO capacity being worked
• Full field development plan will guide capital investment
Slide 37
Highly attractive Incremental investments will provide long term cash flow
2013 FULL YEAR RESULTS
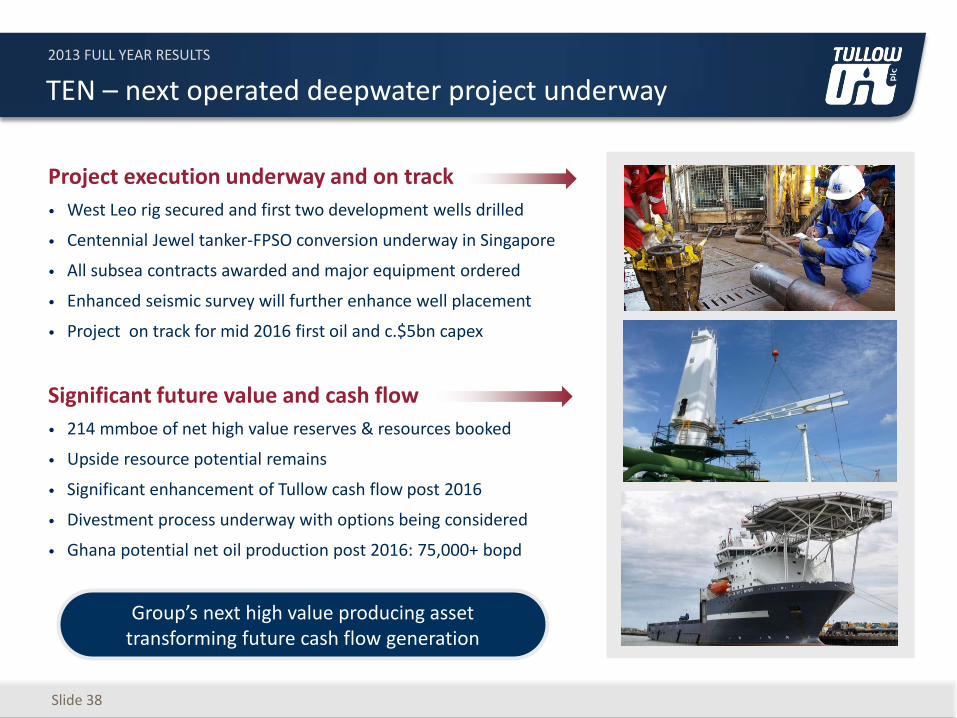
TEN – next operated deepwater project underway
Slide 38
DRILLING
Significant future value and cash flow
• 214 mmboe of net high value reserves & resources booked
• Upside resource potential remains
• Significant enhancement of Tullow cash flow post 2016
• Divestment process underway with options being considered
• Ghana potential net oil production post 2016: 75,000+ bopd
Project execution underway and on track
• West Leo rig secured and first two development wells drilled
• Centennial Jewel tanker-FPSO conversion underway in Singapore
• All subsea contracts awarded and major equipment ordered
• Enhanced seismic survey will further enhance well placement
• Project on track for mid 2016 first oil and c.$5bn capex
Group’s next high value producing asset transforming future cash flow generation
2013 FULL YEAR RESULTS
Slide 39
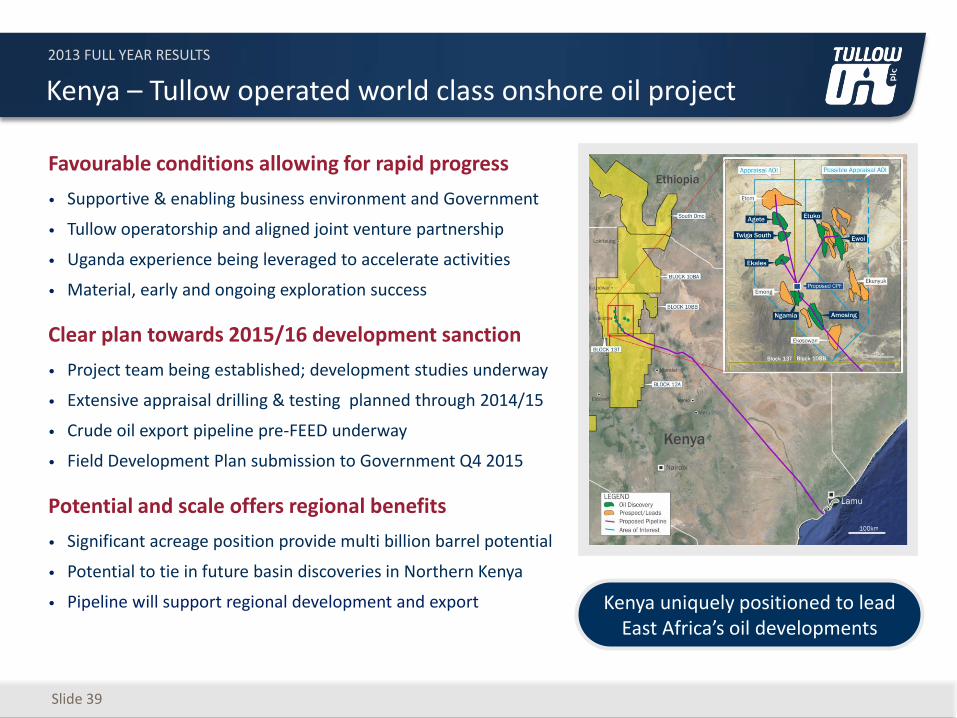
Kenya – Tullow operated world class onshore oil project
Favourable conditions allowing for rapid progress
• Supportive & enabling business environment and Government
• Tullow operatorship and aligned joint venture partnership
• Uganda experience being leveraged to accelerate activities
• Material, early and ongoing exploration success
Clear plan towards 2015/16 development sanction
• Project team being established; development studies underway
• Extensive appraisal drilling & testing planned through 2014/15
• Crude oil export pipeline pre-FEED underway
• Field Development Plan submission to Government Q4 2015
Potential and scale offers regional benefits
• Significant acreage position provide multi billion barrel potential
• Potential to tie in future basin discoveries in Northern Kenya
• Pipeline will support regional development and export Kenya uniquely positioned to lead East Africa’s oil developments
2013 FULL YEAR RESULTS
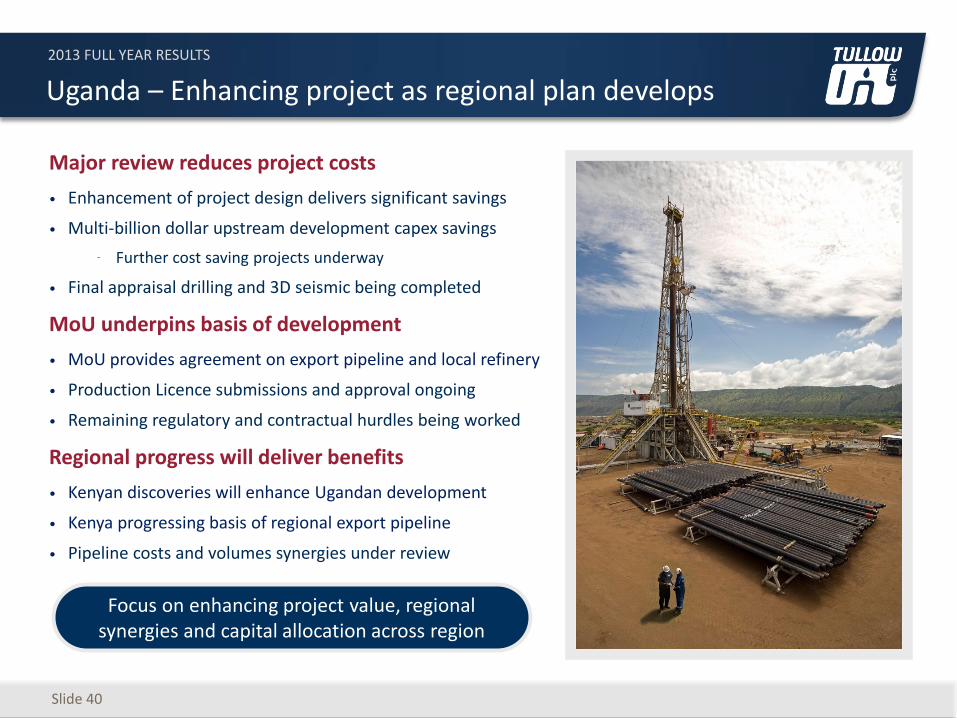
Uganda – Enhancing project as regional plan develops
Slide 40
Major review reduces project costs
• Enhancement of project design delivers significant savings
• Multi-billion dollar upstream development capex savings
⁻ Further cost saving projects underway
• Final appraisal drilling and 3D seismic being completed
MoU underpins basis of development
• MoU provides agreement on export pipeline and local refinery
• Production Licence submissions and approval ongoing
• Remaining regulatory and contractual hurdles being worked
Regional progress will deliver benefits
• Kenyan discoveries will enhance Ugandan development
• Kenya progressing basis of regional export pipeline
• Pipeline costs and volumes synergies under review
Focus on enhancing project value, regional synergies and capital allocation across region
2013 FULL YEAR RESULTS
Slide 41
Follow-on Prospect
Follow-on Prospect
Follow-on Prospect
Follow-on Prospect
Follow-on Prospect
Follow-on Prospect
Follow-on Prospect
Follow-on Prospect
Follow-on Prospect
Mputa-1
Kasamene-1
Waraga-1
Kingfisher-1
1.7Bbo
Campaign concept proved in Lake Albert Rift Basin, Uganda Tullow Oil’s 12 East African Tertiary Rift Basins
Turkana Turkwel North Lokichar South Lokichar
Kerio Suguta Kerio Valley Nyanza
Lake Albert Chew Bahir Omo West Omo
Basin opener
Play openers
Uganda Ethiopia
Kenya
Multiplying our Lake Albert Rift Basin success through an integrated E&A campaign across
>12 East African Rift Basins
Achieved immediate success in South Lokichar Basin
Campaign of 12 East African Tertiary Rift Basins
2014
2014
2014
8/12 basins successful
4/12 basins successful
2/12 basins successful
Years
1/12 basins
2
4
6
8
10
12
0
Gro
ss P
ote
nti
al in
Bill
ion
Bar
rels
Possible campaign scenarios
2013 FULL YEAR RESULTS
Slide 42
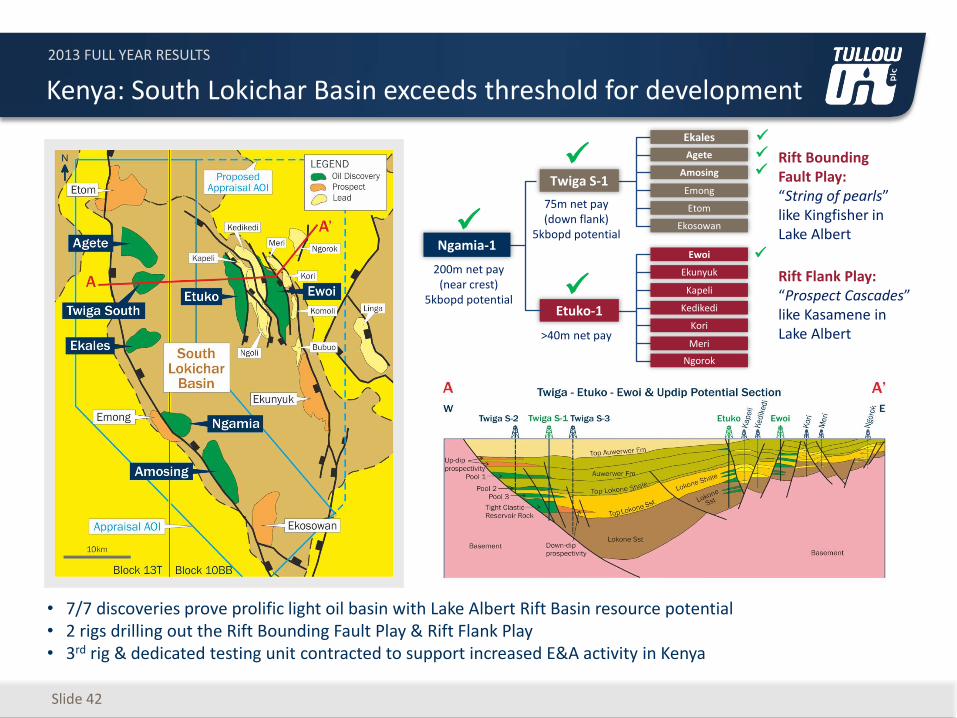
Kenya: South Lokichar Basin exceeds threshold for development
• 7/7 discoveries prove prolific light oil basin with Lake Albert Rift Basin resource potential • 2 rigs drilling out the Rift Bounding Fault Play & Rift Flank Play • 3rd rig & dedicated testing unit contracted to support increased E&A activity in Kenya
Ngamia-1
Twiga S-1
Etuko-1
Rift Bounding Fault Play: “String of pearls” like Kingfisher in Lake Albert
Rift Flank Play: “Prospect Cascades” like Kasamene in Lake Albert
Amosing
Emong
Etom
Ekosowan
Ewoi
Ekunyuk
Kapeli
Ekales
Agete
Kedikedi
Kori
Meri
Ngorok
200m net pay
(near crest) 5kbopd potential
75m net pay (down flank)
5kbopd potential
>40m net pay
2013 FULL YEAR RESULTS
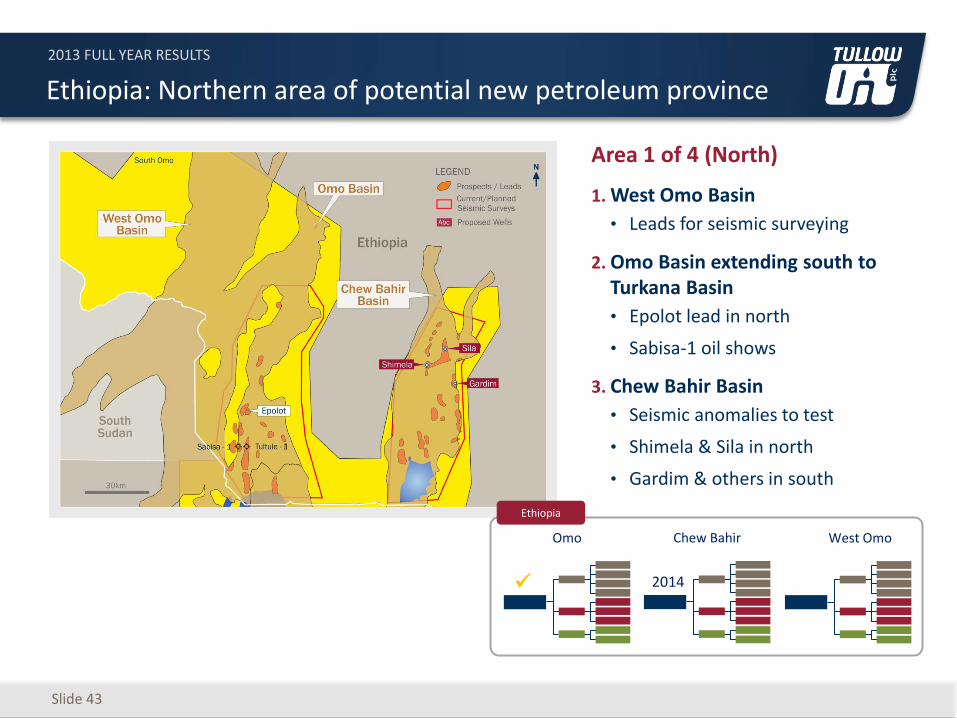
Slide 43
Area 1 of 4 (North)
1. West Omo Basin
• Leads for seismic surveying
2. Omo Basin extending south to Turkana Basin
• Epolot lead in north
• Sabisa-1 oil shows
3. Chew Bahir Basin
• Seismic anomalies to test
• Shimela & Sila in north
• Gardim & others in south
Ethiopia: Northern area of potential new petroleum province
West Omo Chew Bahir
Omo
Ethiopia
2014
2013 FULL YEAR RESULTS
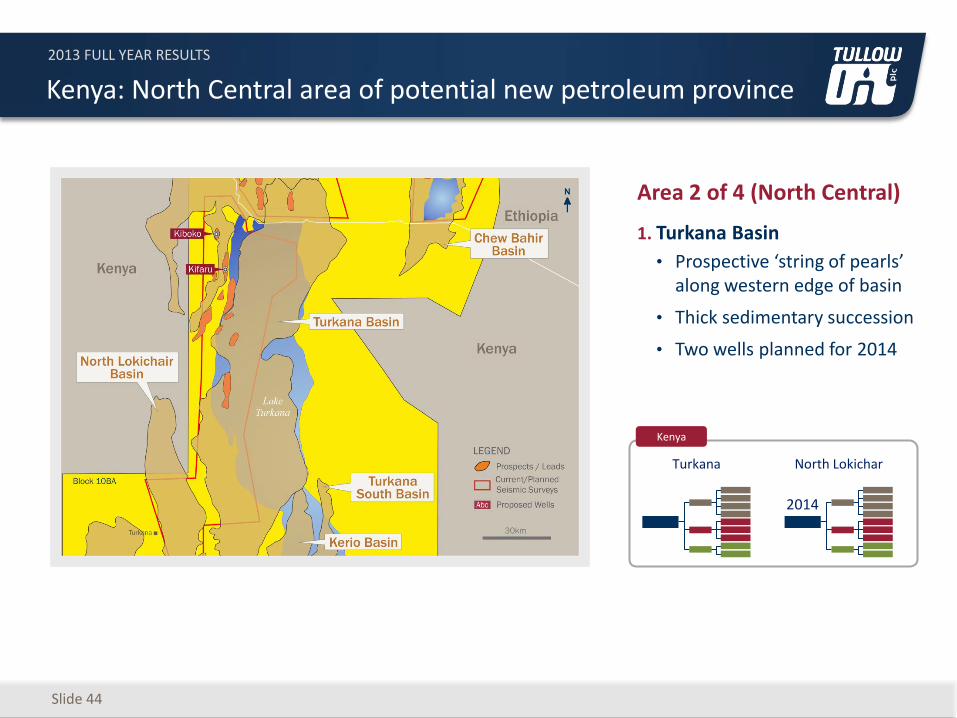
Slide 44
Kenya: North Central area of potential new petroleum province
Area 2 of 4 (North Central)
1. Turkana Basin
• Prospective ‘string of pearls’ along western edge of basin
• Thick sedimentary succession
• Two wells planned for 2014
Turkana North Lokichar
Kenya
2014
2013 FULL YEAR RESULTS
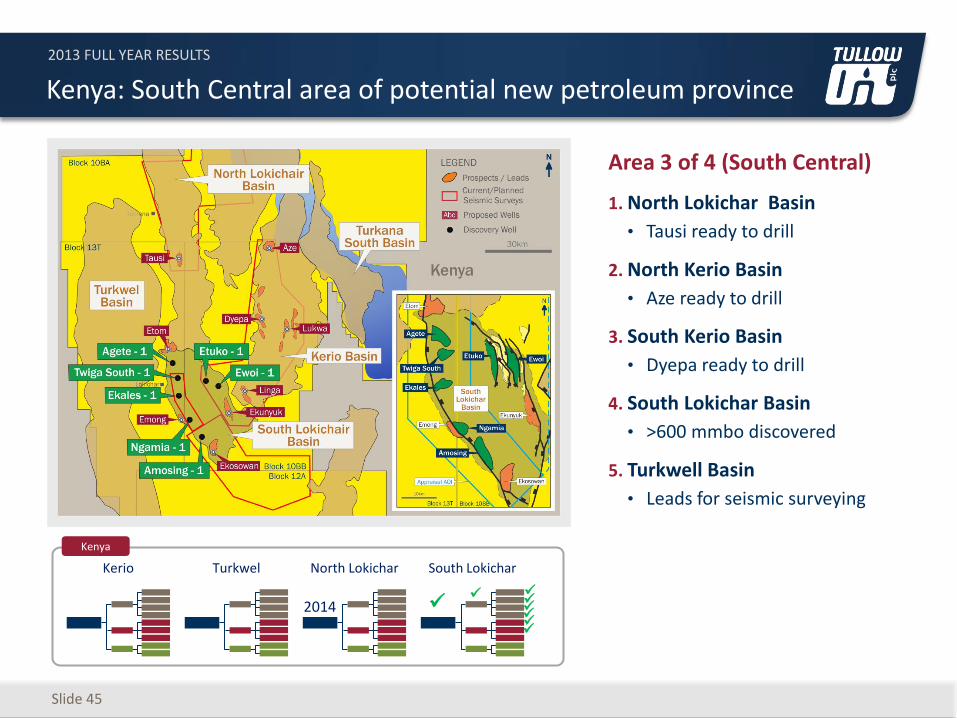
Slide 45
Kenya: South Central area of potential new petroleum province
Area 3 of 4 (South Central)
1. North Lokichar Basin
• Tausi ready to drill
2. North Kerio Basin
• Aze ready to drill
3. South Kerio Basin
• Dyepa ready to drill
4. South Lokichar Basin
• >600 mmbo discovered
5. Turkwell Basin
• Leads for seismic surveying
Kerio Turkwel North Lokichar South Lokichar
Kenya
2014
2013 FULL YEAR RESULTS
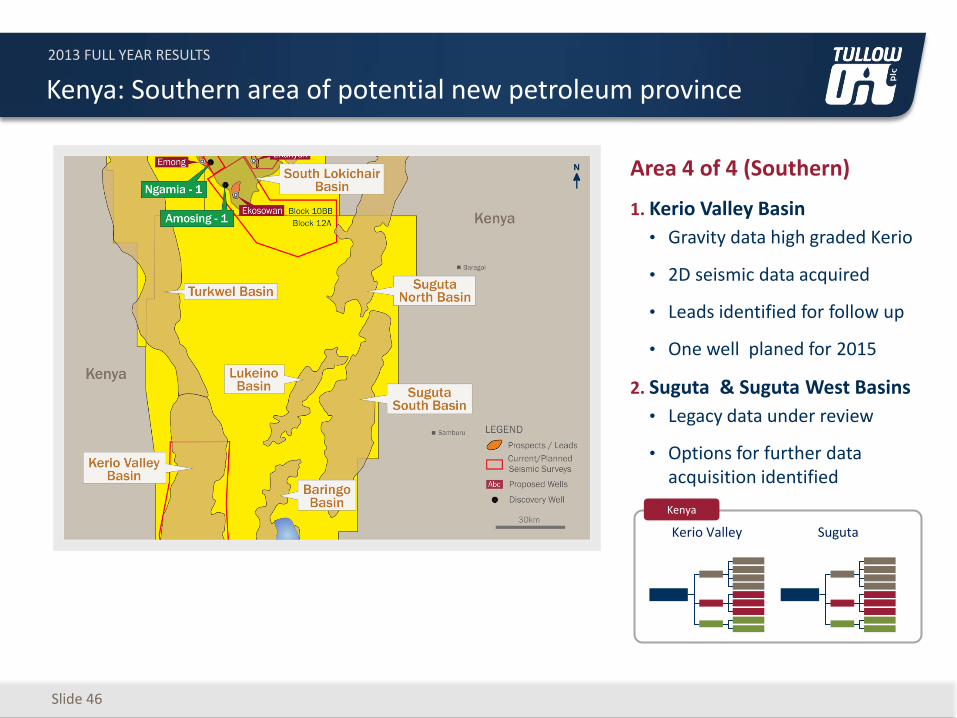
Slide 46
Kenya: Southern area of potential new petroleum province
Area 4 of 4 (Southern)
1. Kerio Valley Basin
• Gravity data high graded Kerio
• 2D seismic data acquired
• Leads identified for follow up
• One well planed for 2015
2. Suguta & Suguta West Basins
• Legacy data under review
• Options for further data acquisition identified
Kerio Valley Suguta
Kenya
2013 FULL YEAR RESULTS
Slide 47
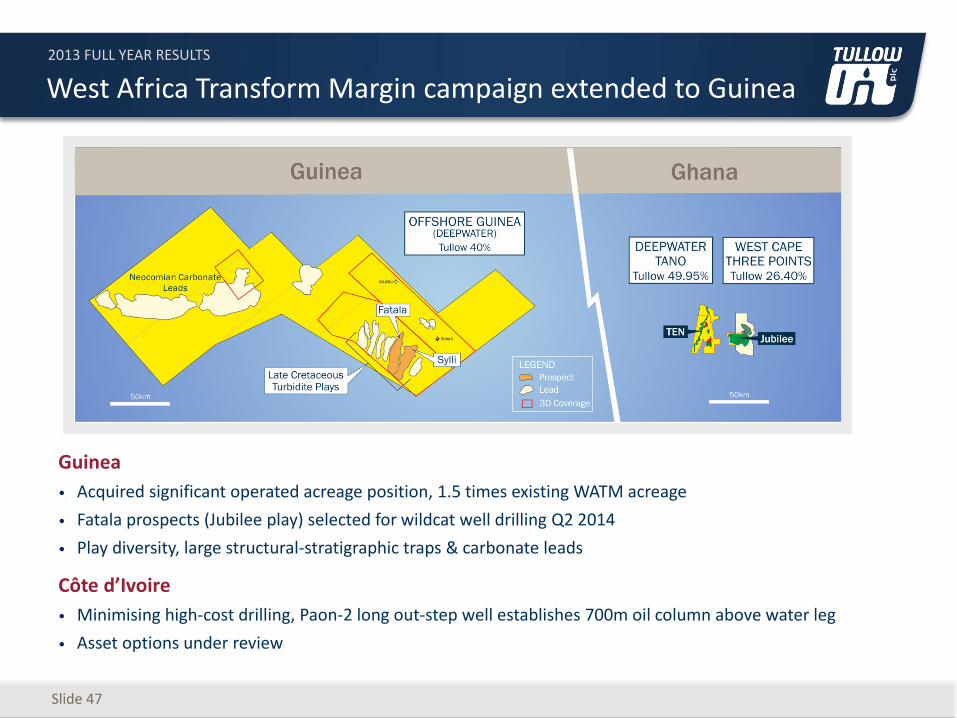
West Africa Transform Margin campaign extended to Guinea
Guinea
• Acquired significant operated acreage position, 1.5 times existing WATM acreage
• Fatala prospects (Jubilee play) selected for wildcat well drilling Q2 2014
• Play diversity, large structural-stratigraphic traps & carbonate leads
Côte d’Ivoire
• Minimising high-cost drilling, Paon-2 long out-step well establishes 700m oil column above water leg
• Asset options under review
2013 FULL YEAR RESULTS
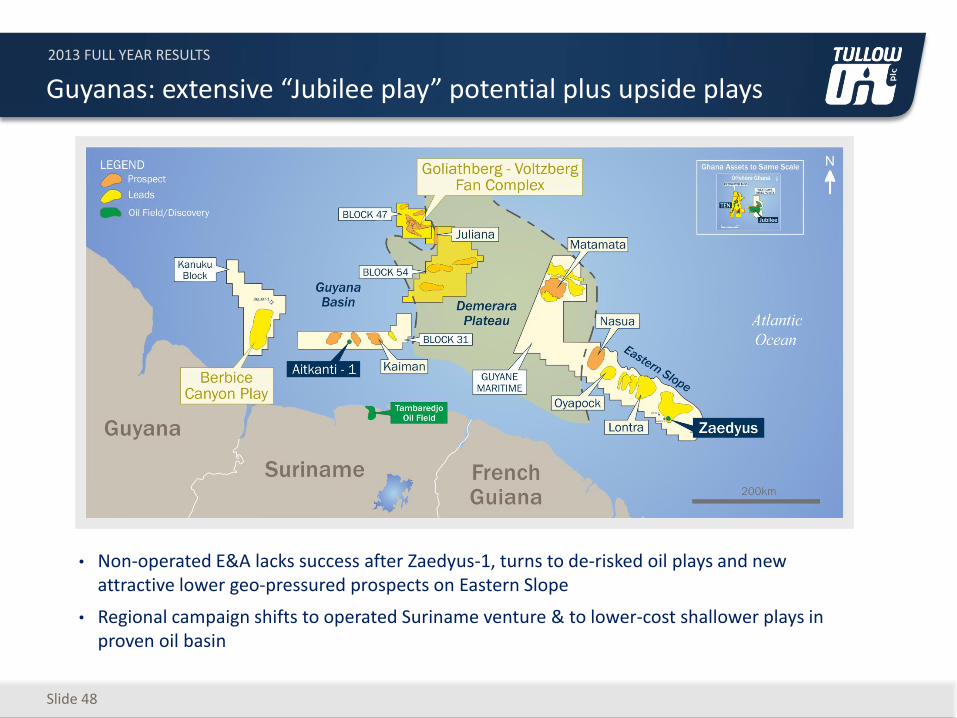
• Non-operated E&A lacks success after Zaedyus-1, turns to de-risked oil plays and new attractive lower geo-pressured prospects on Eastern Slope
• Regional campaign shifts to operated Suriname venture & to lower-cost shallower plays in proven oil basin
Guyanas: extensive “Jubilee play” potential plus upside plays
Slide 48
2013 FULL YEAR RESULTS
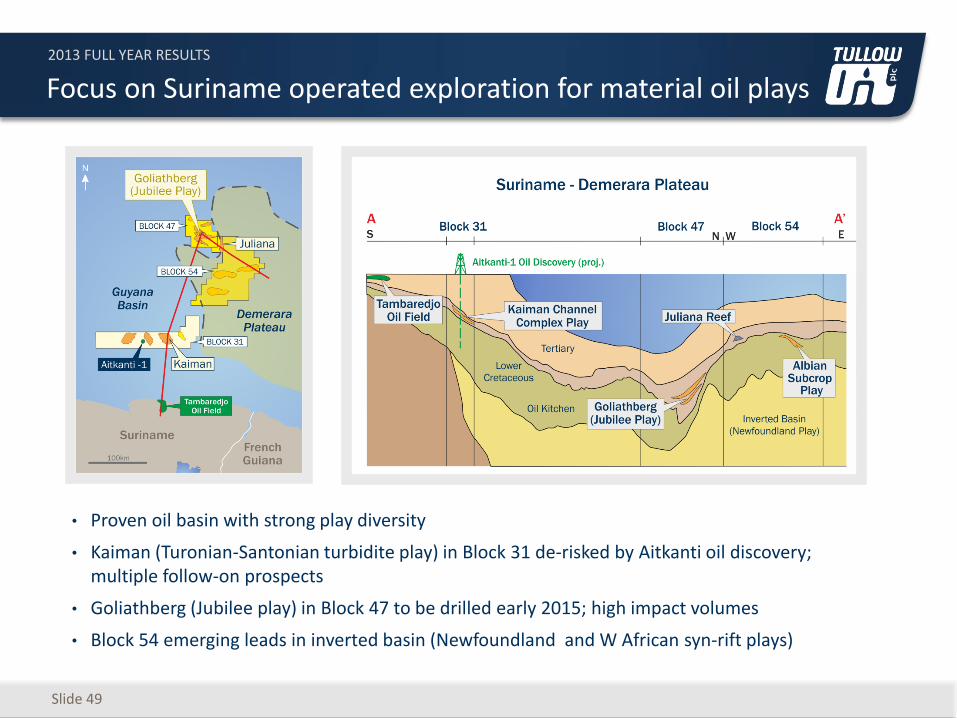
Focus on Suriname operated exploration for material oil plays
• Proven oil basin with strong play diversity
• Kaiman (Turonian-Santonian turbidite play) in Block 31 de-risked by Aitkanti oil discovery; multiple follow-on prospects
• Goliathberg (Jubilee play) in Block 47 to be drilled early 2015; high impact volumes
• Block 54 emerging leads in inverted basin (Newfoundland and W African syn-rift plays)
Slide 49
2013 FULL YEAR RESULTS
Slide 50
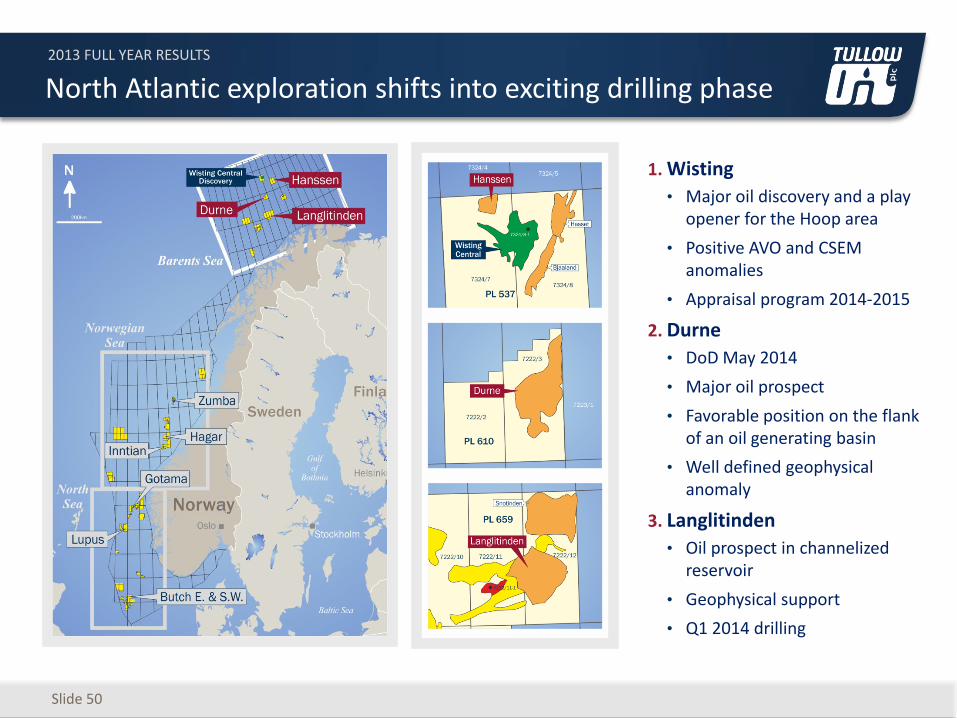
North Atlantic exploration shifts into exciting drilling phase
1. Wisting
• Major oil discovery and a play opener for the Hoop area
• Positive AVO and CSEM anomalies
• Appraisal program 2014-2015
2. Durne
• DoD May 2014
• Major oil prospect
• Favorable position on the flank of an oil generating basin
• Well defined geophysical anomaly
3. Langlitinden
• Oil prospect in channelized reservoir
• Geophysical support
• Q1 2014 drilling
2013 FULL YEAR RESULTS
Slide 51
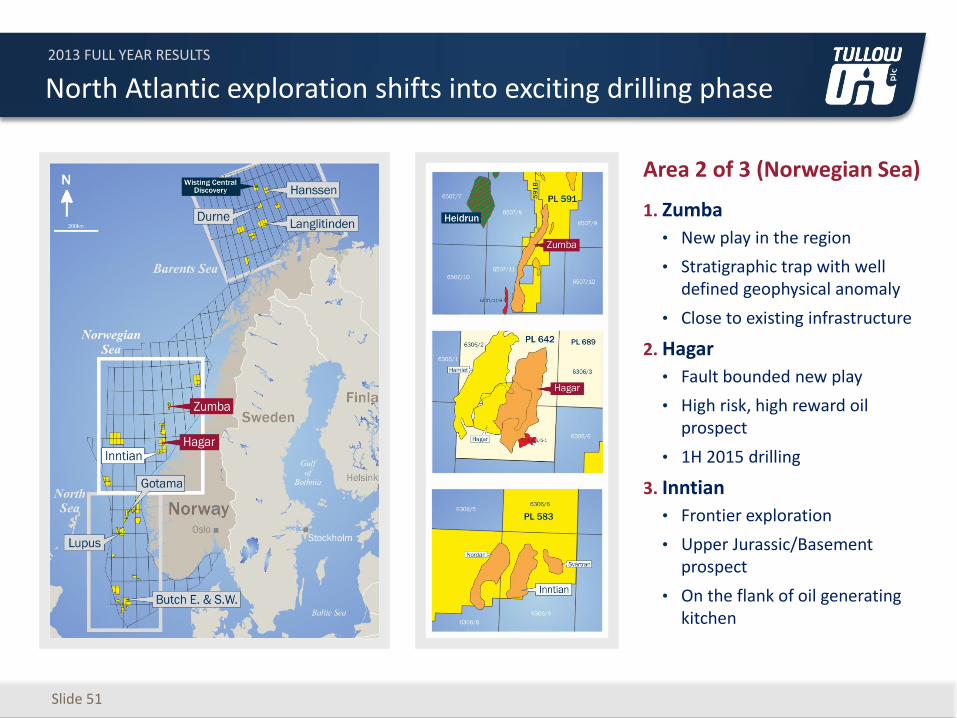
North Atlantic exploration shifts into exciting drilling phase
Area 2 of 3 (Norwegian Sea)
1. Zumba
• New play in the region
• Stratigraphic trap with well defined geophysical anomaly
• Close to existing infrastructure
2. Hagar
• Fault bounded new play
• High risk, high reward oil prospect
• 1H 2015 drilling
3. Inntian
• Frontier exploration
• Upper Jurassic/Basement prospect
• On the flank of oil generating kitchen
2013 FULL YEAR RESULTS
Slide 52
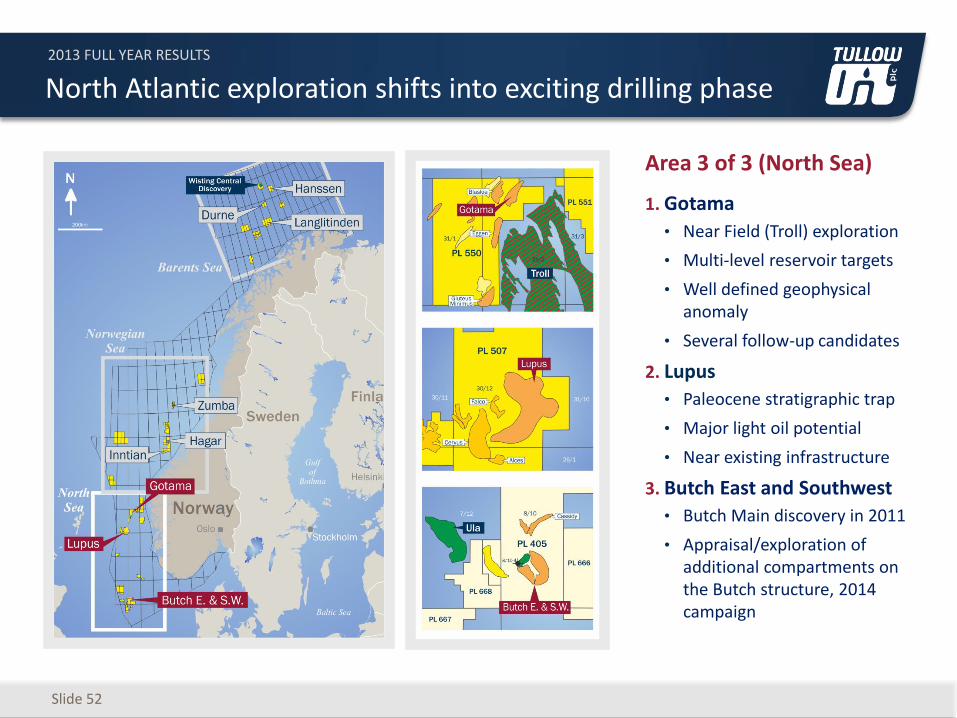
North Atlantic exploration shifts into exciting drilling phase
Area 3 of 3 (North Sea)
1. Gotama
• Near Field (Troll) exploration
• Multi-level reservoir targets
• Well defined geophysical anomaly
• Several follow-up candidates
2. Lupus
• Paleocene stratigraphic trap
• Major light oil potential
• Near existing infrastructure
3. Butch East and Southwest
• Butch Main discovery in 2011
• Appraisal/exploration of additional compartments on the Butch structure, 2014 campaign
2013 FULL YEAR RESULTS
Tullow Oil plc 9 Chiswick Park
566 Chiswick High Road London, W4 5XT United Kingdom
Tel: +44 (0)20 3249 9000 Fax: +44 (0)20 3249 8801
Email: [email protected]
Follow Tullow on:
Download the Tullow Investor Relations and Media App from the Apple and Android stores: