12 march 2015 · pdf file11 march 2015 chf 20.37 potential upside +3.1% research analysts ......
TRANSCRIPT

Rating Remains NeutralTarget price Remains CHF 21.00
Closing price 11 March 2015 CHF 20.37
Potential upside +3.1%
Research analysts
European Capital Goods
Alexander Virgo - NIplc [email protected] +44 20 7102 5759
Maggie Paxton - NIplc [email protected] +44 20 7102 4397
Felix Wienen - NIplc [email protected] +44 20 7102 5758
Sidharth Saboo [email protected] +91 22 4053 3728
Industry specialist
Eve Raoul - NIplc [email protected] +44 20 7103 9214
Key company data: See page 2 for company data and detailed price/index chart
ABB ABBN.VX ABBN VX
EQUITY: EUROPEAN CAPITAL GOODS
Initiated with Neutral; TP CHF 21
Downside revenue risks from O&G
We initiated coverage of ABB with a target price of CHF 21 and a Neutral rating on 11 March 2015 Growth: With US and Asian revenue now 29% and 27% of total revenue,
respectively, providing access to faster-growing regions for the near term, ABB’s European exposure (34%) should support revenue growth in the medium term as the region’s recovery gains momentum. O&G headwinds (>10% of sales) and continued weakness in power and mining markets drive our forecasts below consensus, suggesting downside risks remain despite ABB’s backlog covering 67% of our 2015 revenue forecast and positive base order trends.
Secular trends: ABB has been at the forefront of industrial software development for many years with global-leading positions in both process and factory automation. With the ‘Next Level’ strategy, management is formalising that software focus and ABB should be well positioned to develop the industrial internet revenue opportunity.
Profitability: We believe investors should take heart from the Relentless Execution strand of Next Level. ABB has consistently delivered in the 3-5% target range on cost savings, EBITA focus (as opposed to EBITDA) is a cleaner measure and Power Systems appears to be under control.
Sentiment: ABB has underperformed the sector and the broader market for the past three years and has been characterised by continual earnings disappointments. Working through legacy projects and driving better execution is positive for sentiment but improvements are still a long-term story and largely in consensus forecasts.
Valuation: Execution issues and earnings disappointments have eroded the valuation premium ABB enjoyed in the previous cycle. 2015E EV/sales of 1.25x reflects expected margin development, although P/EG at 1x and mid-teens EPS growth is better than sector average.
Please see Investing in industrials in the digital age for full details.
Year-end: Dec 2014 2015E 2016E 2017E
Currency (USD) Actual Old New Old New Old New
Revenue (mn) 39,830 37,372 37,372 37,081 37,081 39,469 39,469
Organic revenue growth (%)
(2.0) 3.6 3.6 4.2 4.2 6.3 6.3
Adj. EBITA (mn) 4,848 4,893 4,893 5,259 5,259 5,670 5,670
Adj. EBITA margin (%) 12.2 13.1 13.1 14.2 14.2 14.4 14.4
Adj. EPS 1.34 1.49 1.49 1.64 1.64 1.78 1.78
EV/sales (x) 1.35 N/A 1.25 N/A 1.20 N/A 1.10
Adj. EV/EBITA (x) 11.95 N/A 10.35 N/A 9.18 N/A 8.33
Adj. P/E (x) 17.50 N/A 14.73 N/A 13.32 N/A 12.29
Source: Company data, Nomura estimates
Global Markets Research 12 March 2015
See Appendix A-1 for analyst certification, important disclosures and the status of non-US analysts.
Nomura | ABB 12 March 2015
2
Key data on ABB Rating Stock NeutralSector Neutral Relative performance chart
Source: Thomson Reuters, Nomura research
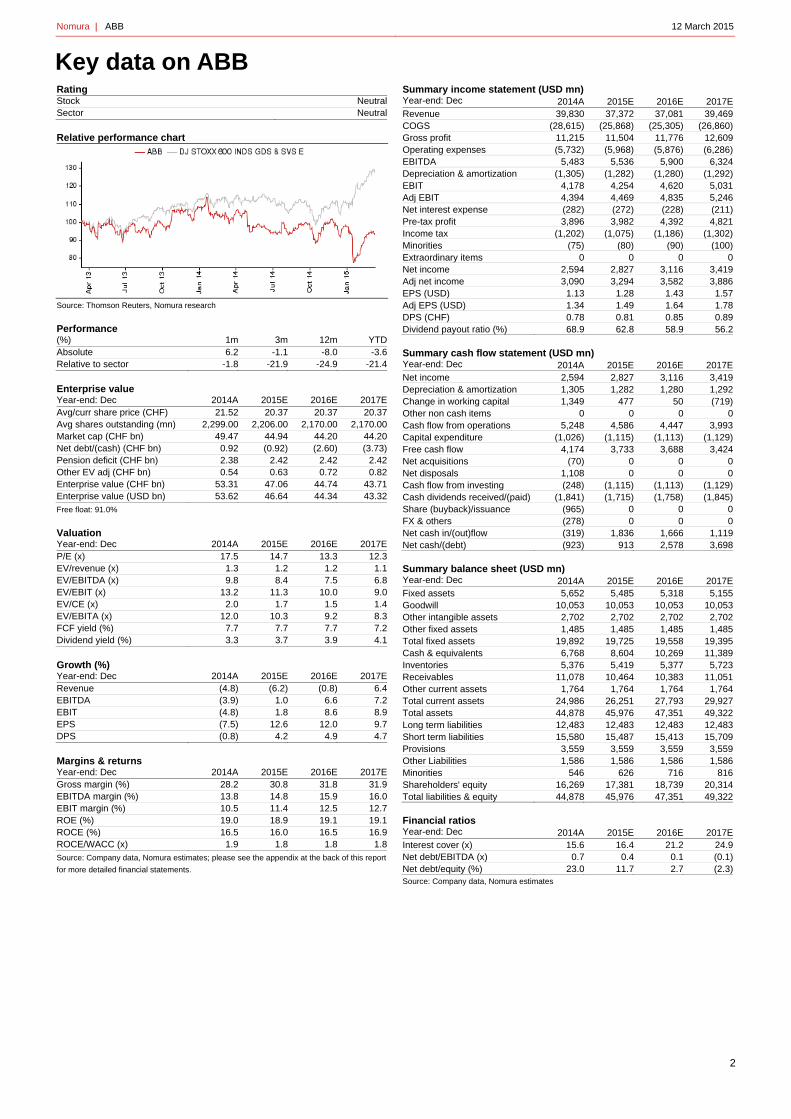
Performance (%) 1m 3m 12m YTDAbsolute 6.2 -1.1 -8.0 -3.6Relative to sector -1.8 -21.9 -24.9 -21.4 Enterprise value Year-end: Dec 2014A 2015E 2016E 2017EAvg/curr share price (CHF) 21.52 20.37 20.37 20.37Avg shares outstanding (mn) 2,299.00 2,206.00 2,170.00 2,170.00Market cap (CHF bn) 49.47 44.94 44.20 44.20Net debt/(cash) (CHF bn) 0.92 (0.92) (2.60) (3.73)Pension deficit (CHF bn) 2.38 2.42 2.42 2.42Other EV adj (CHF bn) 0.54 0.63 0.72 0.82Enterprise value (CHF bn) 53.31 47.06 44.74 43.71Enterprise value (USD bn) 53.62 46.64 44.34 43.32Free float: 91.0%
Valuation Year-end: Dec 2014A 2015E 2016E 2017EP/E (x) 17.5 14.7 13.3 12.3EV/revenue (x) 1.3 1.2 1.2 1.1EV/EBITDA (x) 9.8 8.4 7.5 6.8EV/EBIT (x) 13.2 11.3 10.0 9.0EV/CE (x) 2.0 1.7 1.5 1.4EV/EBITA (x) 12.0 10.3 9.2 8.3FCF yield (%) 7.7 7.7 7.7 7.2Dividend yield (%) 3.3 3.7 3.9 4.1 Growth (%) Year-end: Dec 2014A 2015E 2016E 2017ERevenue (4.8) (6.2) (0.8) 6.4EBITDA (3.9) 1.0 6.6 7.2EBIT (4.8) 1.8 8.6 8.9EPS (7.5) 12.6 12.0 9.7DPS (0.8) 4.2 4.9 4.7 Margins & returns Year-end: Dec 2014A 2015E 2016E 2017EGross margin (%) 28.2 30.8 31.8 31.9EBITDA margin (%) 13.8 14.8 15.9 16.0EBIT margin (%) 10.5 11.4 12.5 12.7ROE (%) 19.0 18.9 19.1 19.1ROCE (%) 16.5 16.0 16.5 16.9ROCE/WACC (x) 1.9 1.8 1.8 1.8Source: Company data, Nomura estimates; please see the appendix at the back of this report
for more detailed financial statements.
Summary income statement (USD mn) Year-end: Dec 2014A 2015E 2016E 2017ERevenue 39,830 37,372 37,081 39,469COGS (28,615) (25,868) (25,305) (26,860)Gross profit 11,215 11,504 11,776 12,609Operating expenses (5,732) (5,968) (5,876) (6,286)EBITDA 5,483 5,536 5,900 6,324Depreciation & amortization (1,305) (1,282) (1,280) (1,292)EBIT 4,178 4,254 4,620 5,031Adj EBIT 4,394 4,469 4,835 5,246Net interest expense (282) (272) (228) (211)Pre-tax profit 3,896 3,982 4,392 4,821Income tax (1,202) (1,075) (1,186) (1,302)Minorities (75) (80) (90) (100)Extraordinary items 0 0 0 0Net income 2,594 2,827 3,116 3,419Adj net income 3,090 3,294 3,582 3,886EPS (USD) 1.13 1.28 1.43 1.57Adj EPS (USD) 1.34 1.49 1.64 1.78DPS (CHF) 0.78 0.81 0.85 0.89Dividend payout ratio (%) 68.9 62.8 58.9 56.2 Summary cash flow statement (USD mn) Year-end: Dec 2014A 2015E 2016E 2017ENet income 2,594 2,827 3,116 3,419Depreciation & amortization 1,305 1,282 1,280 1,292Change in working capital 1,349 477 50 (719)Other non cash items 0 0 0 0Cash flow from operations 5,248 4,586 4,447 3,993Capital expenditure (1,026) (1,115) (1,113) (1,129)Free cash flow 4,174 3,733 3,688 3,424Net acquisitions (70) 0 0 0Net disposals 1,108 0 0 0Cash flow from investing (248) (1,115) (1,113) (1,129)Cash dividends received/(paid) (1,841) (1,715) (1,758) (1,845)Share (buyback)/issuance (965) 0 0 0FX & others (278) 0 0 0Net cash in/(out)flow (319) 1,836 1,666 1,119Net cash/(debt) (923) 913 2,578 3,698 Summary balance sheet (USD mn) Year-end: Dec 2014A 2015E 2016E 2017EFixed assets 5,652 5,485 5,318 5,155Goodwill 10,053 10,053 10,053 10,053Other intangible assets 2,702 2,702 2,702 2,702Other fixed assets 1,485 1,485 1,485 1,485Total fixed assets 19,892 19,725 19,558 19,395Cash & equivalents 6,768 8,604 10,269 11,389Inventories 5,376 5,419 5,377 5,723Receivables 11,078 10,464 10,383 11,051Other current assets 1,764 1,764 1,764 1,764Total current assets 24,986 26,251 27,793 29,927Total assets 44,878 45,976 47,351 49,322Long term liabilities 12,483 12,483 12,483 12,483Short term liabilities 15,580 15,487 15,413 15,709Provisions 3,559 3,559 3,559 3,559Other Liabilities 1,586 1,586 1,586 1,586Minorities 546 626 716 816Shareholders' equity 16,269 17,381 18,739 20,314Total liabilities & equity 44,878 45,976 47,351 49,322 Financial ratios Year-end: Dec 2014A 2015E 2016E 2017EInterest cover (x) 15.6 16.4 21.2 24.9Net debt/EBITDA (x) 0.7 0.4 0.1 (0.1)Net debt/equity (%) 23.0 11.7 2.7 (2.3)Source: Company data, Nomura estimates

Nomura | ABB 12 March 2015
3
Note: The following is reproduced from our report Investing in industrials in the digital age, priced as at close of 5 March 2015.
Source: Company data, Nomura estimates Fig. 1: ABB in the context of the sector framework
• We initiate coverage of ABB with a target price of CHF 21 and a Neutral rating.
• Growth: Underlying organic growth at bottom end of target range, but forex headwinds offset in 2015E/16E. Mining remains weak and O&G likely to deteriorate which could weigh on consensus revenue forecasts, particularly for 2016.
• Secular trends: Leading industrial software company with established market positions and smart product offerings already in the marketplace.
• Profitability: 3-5% cost saves offset price on annual basis and increasing software content should drive up gross margins. 2015 still transition year for Power Systems as it works through legacy contracts.
• Valuation: Despite valuation at discount relative to history and above-sector EPS growth (11% 2015E-17E), recent share price rally means this is priced in.
Source: Nomura research
Fig. 2: Nomura estimates vs consensus estimates
Source: Bloomberg, Nomura estimates
Fig. 3: Relative valuation 12-month forward EV/EBITA and P/E relative to SXNP
Source: Bloomberg, Nomura research
ABB NEUTRAL PRICE TARGET (CHF) 21Market data (USDm) 2015E 2016E Headline data (USDm) 2013 2014 2015E 2016E 2017E
Share price (CHF) 21 Sales 41,848 39,830 37,372 37,081 39,469
NOSH 2,206 Gross profit 11,992 11,215 11,504 11,776 12,609
Market capitalisation 48,885 48,087 Nomura EBITA 5,493 4,848 4,893 5,259 5,670
Adj. net debt (inc pension 2,107 532 EBIT (reported) 4,387 4,178 4,254 4,620 5,031
Enterprise value 50,992 48,619 EPS (reported) (USD) 1.2 1.1 1.3 1.4 1.6Share price as of 5th March, 2015 EPS (Nomura) (USD) 1.7 1.3 1.5 1.6 1.8
Multiples 2015E 2016E
EV/Sales 1.36 1.31 Reported sales growth 6% -5% -6% -1% 6%
EV/EBITDA (clean) 8.9 8.0 Organic sales growth 5% -2% 4% 4% 6%
EV/Nomura EBITA 10.4 9.2 Gross margin 28.7% 28.2% 30.8% 31.8% 31.9%
EV/IC 2.3 2.2 Nomura EBITA margin 13.1% 12.2% 13.1% 14.2% 14.4%
P/E (reported) 17.3 15.4 EPS growth (reported) 4% -8% 13% 12% 10%
P/E (Nomura) 14.8 13.4 EPS growth (Nomura) 13% -19% 11% 10% 8%
Dividend yield 3.7% 3.9% FCF conversion 99% 135% 113% 103% 88%
FCF yield 7.6% 7.7% RoIC 16.8% 14.9% 16.3% 17.7% 18.6%
REGIONAL GROWTHSECULAR TRENDS
END MARKET GROWTH
PROFITABILITY AND CAPITAL EFFICIENCY
VA
LU
AT
ION
PE
RF
OR
MA
NC
E
EARNINGS GROWTH
-10%
-5%
0%
SA
LE
S
0%
10%
EB
ITA
-10%
0%
10%
2015E 2016E 2017E
EP
S
0.6
0.7
0.8
0.9
1.0
1.1
1.2
1.3
1.4
1.5
1.6
Feb-0
6Jun-0
6O
ct-
06
Feb-0
7Jun-0
7O
ct-
07
Feb-0
8Jun-0
8O
ct-
08
Feb-0
9Jun-0
9O
ct-
09
Feb-1
0Jun-1
0O
ct-
10
Feb-1
1Jun-1
1O
ct-
11
Feb-1
2Jun-1
2O
ct-
12
Feb-1
3Jun-1
3O
ct-
13
Feb-1
4Jun-1
4O
ct-
14
Feb-1
5
ABB EV/EBIT rel to SXNP ABB P/E rel to SXNP
Nomura | ABB 12 March 2015
4
Downside revenue risks from O&G We initiate coverage of ABB with a target price of CHF 21 and a Neutral rating.
• Growth: With US and Asian revenue now 29% and 27% of total revenue, respectively, providing access to faster-growing regions for the near term, ABB’s European exposure (34%) should support revenue growth in the medium term as the region’s recovery gains momentum. O&G headwinds (>10% of sales) and continued weakness in power and mining markets drive our forecasts below consensus suggesting downside risks remain despite ABB’s backlog covering 67% of our 2015 revenue forecast and positive base order trends.
• Secular trends: ABB has been at the forefront of industrial software development for many years with global-leading positions in both process and factory automation. With the ‘Next Level’ strategy, management is formalising that software focus and ABB should be well positioned to develop the industrial internet revenue opportunity.
• Profitability: We believe investors should take heart from the Relentless Execution strand of Next Level. ABB has consistently delivered in the 3-5% target range on cost savings, EBITA focus (as opposed to EBITDA) is a cleaner measure and Power Systems appears to be under control.
• Sentiment: ABB has underperformed the sector and the broader market for the past three years and has been characterised by continual earnings disappointments. Working through legacy projects and driving better execution is positive for sentiment but improvements are still a long-term story and largely in consensus forecasts.
• Valuation: Execution issues and earnings disappointments have eroded the valuation premium ABB enjoyed in the previous cycle. 2015E EV/sales of 1.4x reflects expected margin development, although P/EG at 1x and mid-teens EPS growth is better than sector average.
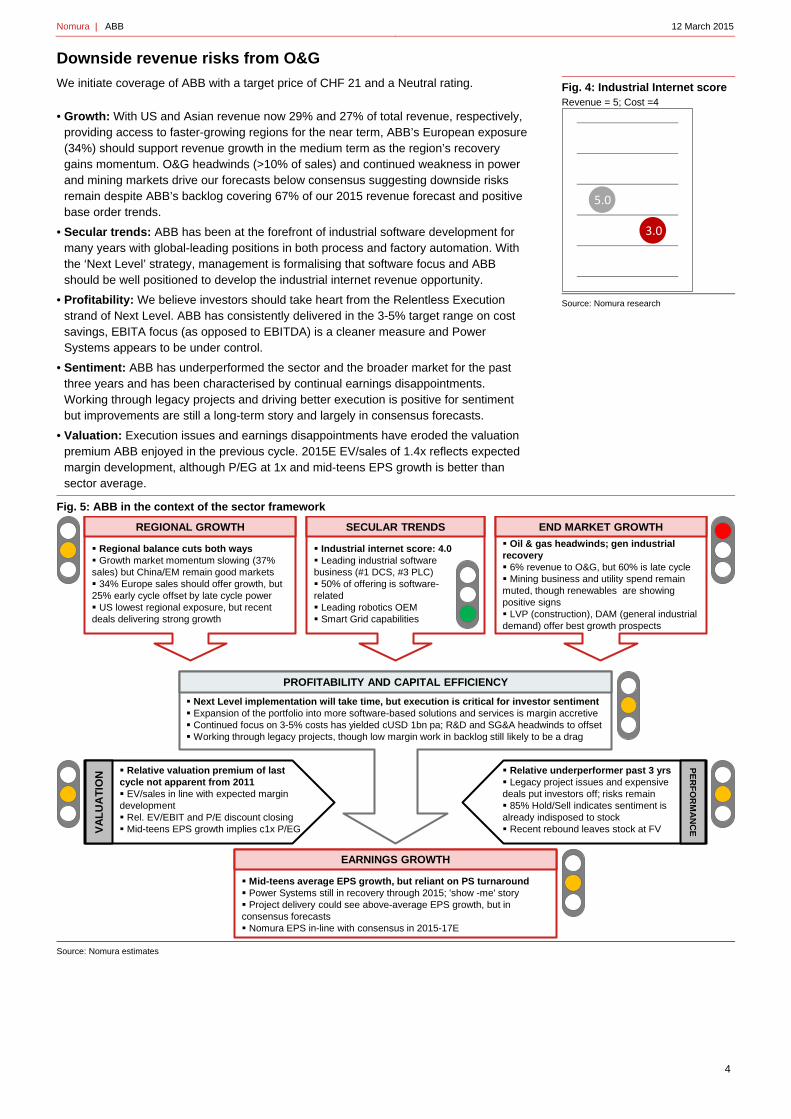
Fig. 5: ABB in the context of the sector framework
Source: Nomura estimates
REGIONAL GROWTH SECULAR TRENDS END MARKET GROWTH
PROFITABILITY AND CAPITAL EFFICIENCY
VA
LU
AT
ION
PE
RF
OR
MA
NC
E
EARNINGS GROWTH
Regional balance cuts both ways Growth market momentum slowing (37% sales) but China/EM remain good markets 34% Europe sales should offer growth, but 25% early cycle offset by late cycle power US lowest regional exposure, but recent deals delivering strong growth
Oil & gas headwinds; gen industrial recovery 6% revenue to O&G, but 60% is late cycle Mining business and utility spend remain muted, though renewables are showing positive signs LVP (construction), DAM (general industrial demand) offer best growth prospects
Industrial internet score: 4.0 Leading industrial software business (#1 DCS, #3 PLC) 50% of offering is software-related Leading robotics OEM Smart Grid capabilities
Next Level implementation will take time, but execution is critical for investor sentiment Expansion of the portfolio into more software-based solutions and services is margin accretive Continued focus on 3-5% costs has yielded cUSD 1bn pa; R&D and SG&A headwinds to offset Working through legacy projects, though low margin work in backlog still likely to be a drag
Relative valuation premium of last cycle not apparent from 2011 EV/sales in line with expected margin development Rel. EV/EBIT and P/E discount closing Mid-teens EPS growth implies c1x P/EG
Relative underperformer past 3 yrs Legacy project issues and expensive deals put investors off; risks remain 85% Hold/Sell indicates sentiment is already indisposed to stock Recent rebound leaves stock at FV
Mid-teens average EPS growth, but reliant on PS turnaround Power Systems still in recovery through 2015; 'show -me' story Project delivery could see above-average EPS growth, but in consensus forecasts Nomura EPS in-line with consensus in 2015-17E
Fig. 4: Industrial Internet score Revenue = 5; Cost =4
Source: Nomura research
5.0
3.0

Nomura | ABB 12 March 2015
5
Standing at the forefront of industrial software development Since developing the world’s first industrial robot in 1974, ABB has stood at the forefront of industrial robotics and software development. With leading global positions in process automation (global leader of distributed control systems (DCS)) and discrete automation (global leader of industrial motion motors and drives) as well as having delivered 250,000 robots, ABB is very well positioned to play a major role in the development and adoption of the industrial internet.
ABB already provides products, systems and software for automated process plants and factories. The Next Level strategy is positioning the company to expand into a closer and more symbiotic relationship with its customers offering software as a service (SaaS) and solutions focused on reducing through-life cost from product design to implementation. Fig. 6: Robots vs DAM growth
Source: International Federation of Robotics, World Robotics 2014, company data, Nomura estimates
Fig. 7: Shifting the centre of gravity
Source: Company data, Nomura research
Sitting pretty at the top of Nomura Smart Sectors ABB is well positioned at the top of several of the Nomura Smart Sectors, such as Smart Plant and Smart Utilities. With recent acquisitions, such as Ventyx in smart-grid applications, as well as long-established market positions in process automation with the 800xA DCS, ABB occupies a software development and integrator role that should position it well to take advantage of developments in the industrial internet.
Looking at ABB’s overall exposure, we can see it participates in Smart Sectors accounting for 20% of the theoretical VaS in the industrial internet, with subsectors such as T&D and power generation expected to see CAGRs of 30-40% in sector-specific connected devices.
ABB's exposure to industrial automation is well publicised, with management presenting the portfolio as 60% automation, with software related to some 50% of the overall portfolio. Historically, ABB splits software revenue out explicitly, with the last published number being cUSD 1.6bn in 2012, or c4% of group sales that year. The reality is that ABB has automation products, software and systems across the industrial automation value chain, positioning it well to take advantage of developments in the industrial internet.
-40%
-30%
-20%
-10%
0%
10%
20%
0
50
100
150
200
250
300
350
2004
2005
2006
2007
2008
2009
2010
2011
2012
2013
2014
2015E
2016E
2017E
Industrial robots shipments ('000 units) DAM organic growth (RHS)
Solution offering
Software‐led differentiation
Technological leadership
High growth segments
PIE
Intrinsic business risk
Global Imbalance
Economic cycle imbalance
Customer value proposition
Services
Today
Future

Nomura | ABB 12 March 2015
6
Fig. 8: ABB is present across many of our Smart Sectors, driven by strong legacy automation technology
Source: GE, Cisco, Bosch, Machina Research, Nomura estimates
Established positions in process automation control systems such as DCS and safety control and data acquisition (SCADA) systems place ABB towards the top of the plant or factory automation hierarchy, while the motors and drives it produces also give it exposure through the factory floor or field. Being present throughout the value chain should provide synergies and some advantage to ABB in developing more holistic solutions and ensuring greater connectivity between the various parts. Fig. 9: ABB is positioned across most automation levels
Source: Company data, Nomura research
The breadth of ABB's product and software portfolio helps in its market positioning, placing the company at or near the top of most automation end markets. Historical strengths lie in the process automation end of the spectrum, where ABB is a strong number two or three manufacturer. Software and smart-grid capabilities in power systems underpin ABB's presence at the top of the power automation market, while the strength of its 800xA DCS is the driver for the company's position in O&G, petrochem and general process industries.
Automotive Aerospace Manufacturing Trucking Agriculture Basic resources Chem/pharma Oil & Gas
800k robots 160k robots 640k robots 15.5m trucks 6.5m machines 222k mining 260k machines 129k machines3000 prod. lines 176k pulp/paper
5% 2% 3% 2% 5% 3% 2% 3%$1,185bn $356bn $1,710bn $347bn $189bn $146bn $504bn
25% 10% 5% 5% 10% 8% 5% 5%
Buildings Construction Industrial Internet Generation T&D
12m lifts 12m vehicles $19tn Value at Stake 264k machines 240GW HVDC4% 1% 4% 1%
$349bn $356bn $14.4tn private $4.6tn public $146bn $757bn20% 10% sector VaS sector VaS 40% 30%
Retail Tech Fin Services Other Healthcare Transport Water Services
>5m units 2.16m machines5% 4% 5%
$1,500bn $1,317bn $1,317bn $1,400bn $1,100bn $293bn $2,960bn45% 40% 20%
Example of installed base; potential for asset management solutions2013 VaS realised as % of total VaSNPV of 2013‐22 VaS5yr CAGR in sector specific connected devices
Smart Factory Sm
art Plan
tSm
art
Buildings
Smart U
tilitiesOther
Smart Services
EAM ERP/SCMABB SAP Dassault SAP PTCIBM Schneider Siemens ABB MicrosoftInfor AspenTech Oracle IBM AspenTechGE Rockwell PTC Oracle
MES CAx PLMSiemens Dassault Siemens DassaultSAP Schneider PTC SiemensABB GE Autodesk PTCHoneywell Rockwell Aveva Hexagon
Werum
DCS SCADAABB Schneider GEHoneywell Metso SchneiderYokogawa Siemens SiemensEmerson Hollysys EmersonValmet ABB
PLCs CNC HMISiemens Omron Fanuc Bosch Schneider RockwellSchneider Mitsubishi Siemens Mitsubishi Siemens OSI SoftRockwell Amada Yaskawa GE
Motion Control Drives Robots Machine tools Metrology Pumps Valves Actuators CompressorsBosch Emerson Fanuc DMG Hexagon Weir Weir Rotork Atlas CopcoSiemens ABB ABB Makino Renishaw Sulzer Metso Tyco Gardner DenverFesto Siemens Kuka Okuma Carl Zeiss Flowserve IMI Emerson Ingersoll RandRockwell Yaskawa Yaskawa Amada Faro Tech Pentair SMC Nabtesco EbaraSchneider Rockwell Mitutoyo Metso Flowserve Yaskawa Siemens (DRC)Yaskawa Mitsubishi Nikon Ebara SMC SMC DoverKeyence Eaton Toroshima Eaton Parker Mitsubishi
Regal Beloit Dover Parker Flowserve
Control
level
Field/plant floor level
Enterprise
Resource
Planning
Manufacturing
Execution
System
s
Operational
Level

Nomura | ABB 12 March 2015
7
Fig. 10: ABB holds leading position in power, general process, O&G and petrochem
Source: Company data, Nomura research
ABB’s leading position in providing DCS for mining end markets puts it at the front of automated mining development, or Mining 2.0 as the company calls it. Despite remaining focused on capex constraints, miners are still considering investing in automated mining for the long-term savings inherent in being able to reduce operating costs in personnel and safety costs. Mining is one the lowest areas of penetration in the industrial sector, yet the mining sector is one of the key areas where adoption of the industrial internet is expected to take hold quickly and ABB Process Automation is well positioned to take advantage.
ABB's positioning in factory automation focuses on its robotics business and the drives and motors it supplies through its Discrete Automation and Motion (DAM) division. Robotics accounts for c20% of DAM divisional revenue; roughly half of the robotics business is automotive-driven, 30% or so is food & beverage and the balance is general manufacturing. Demand in China and Asia more broadly remains strong as wage inflation drives the need for automation. The rest of the division is relatively evenly split among the other discrete and hybrid end markets, with drives and motors being sold for mining equipment, pulp & paper equipment and the process industry. Fig. 11: ABB leads in pulp & paper and mining
Source: Company data, Nomura research
Fig. 12: Lower exposure to discrete end-markets
Source: Company data, Nomura research
More generally, in the power segment, ABB’s pioneering technology in HVDC applications and the Ventyx smart-grid software position it favourably to benefit from distributed power-generation and renewable power development. Fundamental changes in substation architecture driven by increased digitisation are met by ABB’s USD 6bn in R&D focused on product innovation. The increased prevalence of the internet and the development of the industrial internet are likely to place further demands on electrical power requirements, while power security is likely to play an ever more important role, and thus provide opportunities for ABB.
Power Gen Proc Oil & gas PetrochemEUR 32bn EUR 9bn EUR 25bn EUR 12bn
3% 4% 6% 5%
Siemens 5.0 Siemens 2.9 Emerson 3.9 Emerson 1.8Schneider 3.2 ABB 2.5 ABB 2.4 Yokogawa 1.5ABB 2.0 Emerson 1.5 Siemens 2.0 ABB 1.0GE 1.3 Schneider 0.9 Rockwell 1.4 Siemens 1.0SAP 1.0 SAP 0.4 GE 1.0 Honeywell 0.9Emerson 1.0 Oracle 0.3 Honeywell 1.0 SAP 0.7Bosch 0.6 Honeywell 0.2 SAP 1.0 GE 0.4Oracle 0.5 Fanuc 0.2 Yokogawa 0.5 Oracle 0.3Hexagon 0.4 Microsoft 0.1 Schneider 0.5 Bosch 0.2Yokogawa 0.2 Bosch 0.4 Infor 0.2
Food & bev Pulp & paper MiningEUR 16bn EUR 3bn EUR 10bn
4% 3% 6%
Siemens 1.9 ABB 0.86 ABB 3.6Fanuc 0.9 Siemens 0.77 Siemens 1.4ABB 0.7 Valmet 0.34 Rockwell 1.4Schneider 0.4 Honeywell 0.26 SAP 0.9Bosch 0.3 SAP 0.25 Bosch 0.6Oracle 0.3 Bosch 0.11 Schneider 0.4Microsoft 0.2 IBM 0.01 Oracle 0.3Infor 0.2 Aveva 0.01 Honeywell 0.2GE 0.1 Yaskawa 0.2Dassault 0.1 Autodesk 0.1
Aero Gen Man AutoEUR 4bn EUR 50bn EUR 11bn
3% 5% 3%
Siemens 0.9 Siemens 4.0 Fanuc 1.5GE 0.4 Schneider 2.9 Kuka 1.4ABB 0.4 Emerson 2.6 Siemens 1.4Dassault 0.3 SAP 2.3 Bosch 1.1Bosch 0.3 Rockwell 2.2 ABB 1.0Infor 0.3 Omron 2.2 Dassault 0.6PTC 0.2 Bosch 2.2 Rockwell 0.6Hexagon 0.2 ABB 1.9 SAP 0.5SAP 0.2 Yaskawa 1.7 Infor 0.4IBM 0.1 Fanuc 1.1 Yaskawa 0.4

Nomura | ABB 12 March 2015
8
Growing service revenue has been difficult after a strong start Service accounts for 18% of revenue, with software varying as a proportion of that, depending on which division (more in Process Automation and Power Systems). A key tenet of the Next Level strategy is to move this proportion overall for the group to 25% by 2020 through a combination of increased penetration (ABB believes it has mapped two-thirds of the USD 300bn product it has installed to date) and capturing a larger share of the customer wallet in its chosen end markets.
Service growth in the early part of the decade appears to have been easier for ABB to come by, presumably as accessing the low-hanging fruit in the installed base was a relatively easy win. Service declined by only 5% in the GFC (compared with a 15% decline in product revenue), providing some resilience for revenue and profitability of the group as a whole. As with many industrial companies, ABB was able to pick up momentum strongly again post the GFC, but then has seen a marked slowdown as the mining industry has shrunk over the past couple of years and economic growth more generally has been anaemic. Fig. 13: Divisional service and systems exposure varies, but service has reached c20% of sales for the group overall Service and systems revenue as proportion of total, 2014 (ex. Baldor and T&B)
Source: Company data, Nomura estimates
Fig. 14: Growth in service revenue was strong in the early part of the decade and post-GFC, but has slowed since Y-o-y growth in service revenue and orders
Source: Company data, Nomura research
Although we are proponents of the development of the service business within ABB, growth appears to have slowed in the past couple of years. Both the two big deals in the past five years (Baldor and Thomas & Betts) had low service businesses, so the original 2010/11 targets to increase installed base penetration and raise the service business to 25% of revenue remain in place. Adjusting for Baldor and Thomas & Betts makes a c300bp difference to the proportion of revenues derived from service (16.4% including; 19% excluding), and the proportion of orders from service in 2014 (19%) gives an indication that the service focus is beginning to pay off. Fig. 15: Service as a proportion of the overall revenue and order intake has grown to c16.5% of total sales Service revenue and orders (CHFm, lhs) vs revenue as % of sales (rhs)
Source: Company data, Nomura research
Fig. 16: Previous targets were for service to be 25% of sales by 2015; we suspect it has been harder than expected to penetrate the installed base, while M&A has been dilutive Penetration of the installed base (100%); 2010 vs targeted penetration for 2015
Source: Company data, Nomura estimates
0%
5%
10%
15%
20%
25%
30%
35%
40%
45%
PP PS DAM LVP PA GROUP
% service % systems
-10%
-5%
0%
5%
10%
15%
20%
25%
2005 2006 2007 2008 2009 2010 2011 2012 2013 2014
Orders Revenue
13.5%
14.0%
14.5%
15.0%
15.5%
16.0%
16.5%
17.0%
0
1,000
2,000
3,000
4,000
5,000
6,000
7,000
8,000
2007 2008 2009 2010 2011 2012 2013 2014
Orders (lhs) Revenue (lhs) Revenue: % total
0%
10%
20%
30%
40%
50%
60%
70%
80%
90%
100%
PP PS DAM LVP PA
2010 2015

Nomura | ABB 12 March 2015
9
Regional balance cuts both ways ABB has shifted its regional exposure over the past 10 years through a combination of organic initiatives and M&A. The result is a group with regional revenue exposure that is well balanced across geographies and should provide exposure to continued strength in the US, improving momentum in Europe and some insulation against continued moderation in China. The acquisitions of Baldor and Thomas & Betts have also shifted the balance of the portfolio away from being overly exposed to late-cycle, big-ticket business. Acquiring the motors and low-voltage businesses in the US has helped geographically, but also given ABB access to a less lumpy revenue stream. Fig. 17: ABB’s regional revenue mix has become much more balanced over the past decade, positioning it to benefit as the different growth rates shift over 2015-17E Regional revenue mix based on 2004 and 2014 revenues
Source: Company data, Nomura research
Fig. 18: ABB’s recent (and much maligned) M&A has given it better cyclical balance, reducing the late-cycle exposure and increasing early-cycle exposure Revenue mix by cycle exposure
Source: Company data, Nomura research
Both acquisitions have helped in increasing ABB’s exposure to North American markets, as shown by the strong organic growth in the Americas for both DAM and LVP in 2014, particularly in the second half. Fig. 19: As well as increasing early-cycle exposure, the acquisition of Baldor improved the regional balance in DAM Revenue by region, 2009 vs 2012
Source: Company data, Nomura research
Fig. 20: Similarly, the acquisition of Thomas & Betts addressed the regional revenue imbalance in LVP Revenue by region, 2011 vs 2012
Source: Company data, Nomura research
Having said that, balanced regional exposure does cut both ways. ABB’s reduced European exposure compared with the previous cycle dilutes the impact of accelerating growth in the bloc, while the third of its revenue exposed to Asia continues to see moderating growth in China. Our forecasts assume mid-single-digit organic growth in most regions, but the slowdown of Asia and the acceleration of Europe serve to drive convergence of global growth for ABB on that mid-single-digit level. There is less of a disparity among regional rates of growth than there was in previous cycles. Looking to the order book, given we do not forecast big, one-off orders, the expected growth rates look much less volatile as they essentially reflect just the base order growth.
0%
10%
20%
30%
40%
50%
60%
70%
80%
90%
100%
2004 2014
Europe Americas Asia Middle East and Africa
0%
20%
40%
60%
80%
100%
2010 2012 2013
Early Mid Late
0%
10%
20%
30%
40%
50%
60%
Americas Europe RoW
2009 2012
0%
10%
20%
30%
40%
50%
60%
Americas Europe RoW
2011 2012
Nomura | ABB 12 March 2015
10
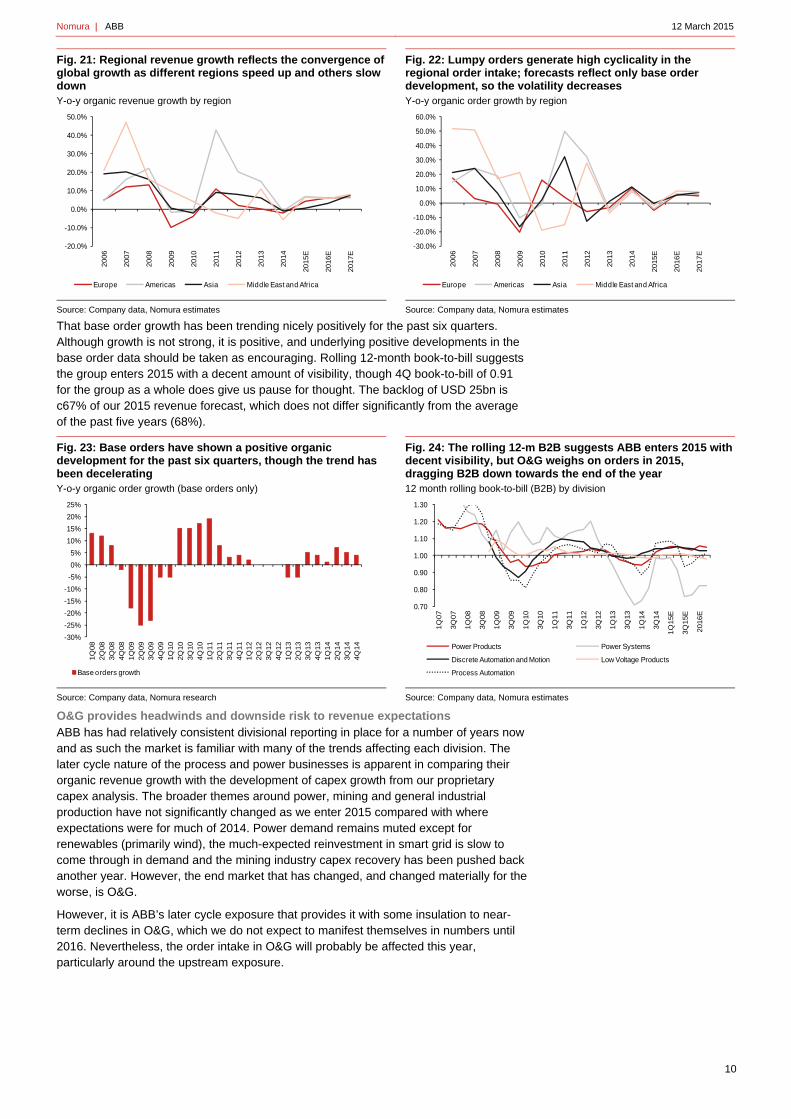
Fig. 21: Regional revenue growth reflects the convergence of global growth as different regions speed up and others slow down Y-o-y organic revenue growth by region
Source: Company data, Nomura estimates
Fig. 22: Lumpy orders generate high cyclicality in the regional order intake; forecasts reflect only base order development, so the volatility decreases Y-o-y organic order growth by region
Source: Company data, Nomura estimates
That base order growth has been trending nicely positively for the past six quarters. Although growth is not strong, it is positive, and underlying positive developments in the base order data should be taken as encouraging. Rolling 12-month book-to-bill suggests the group enters 2015 with a decent amount of visibility, though 4Q book-to-bill of 0.91 for the group as a whole does give us pause for thought. The backlog of USD 25bn is c67% of our 2015 revenue forecast, which does not differ significantly from the average of the past five years (68%). Fig. 23: Base orders have shown a positive organic development for the past six quarters, though the trend has been decelerating Y-o-y organic order growth (base orders only)
Source: Company data, Nomura research
Fig. 24: The rolling 12-m B2B suggests ABB enters 2015 with decent visibility, but O&G weighs on orders in 2015, dragging B2B down towards the end of the year 12 month rolling book-to-bill (B2B) by division
Source: Company data, Nomura estimates
O&G provides headwinds and downside risk to revenue expectations ABB has had relatively consistent divisional reporting in place for a number of years now and as such the market is familiar with many of the trends affecting each division. The later cycle nature of the process and power businesses is apparent in comparing their organic revenue growth with the development of capex growth from our proprietary capex analysis. The broader themes around power, mining and general industrial production have not significantly changed as we enter 2015 compared with where expectations were for much of 2014. Power demand remains muted except for renewables (primarily wind), the much-expected reinvestment in smart grid is slow to come through in demand and the mining industry capex recovery has been pushed back another year. However, the end market that has changed, and changed materially for the worse, is O&G.
However, it is ABB’s later cycle exposure that provides it with some insulation to near-term declines in O&G, which we do not expect to manifest themselves in numbers until 2016. Nevertheless, the order intake in O&G will probably be affected this year, particularly around the upstream exposure.
-20.0%
-10.0%
0.0%
10.0%
20.0%
30.0%
40.0%
50.0%
2006
2007
2008
2009
2010
2011
2012
2013
2014
2015E
2016E
2017E
Europe Americas Asia Middle East and Africa
-30.0%
-20.0%
-10.0%
0.0%
10.0%
20.0%
30.0%
40.0%
50.0%
60.0%
2006
2007
2008
2009
2010
2011
2012
2013
2014
2015E
2016E
2017E
Europe Americas Asia Middle East and Africa
-30%
-25%
-20%
-15%
-10%
-5%
0%
5%
10%
15%
20%
25%
1Q
08
2Q
08
3Q
08
4Q
08
1Q
09
2Q
09
3Q
09
4Q
09
1Q
10
2Q
10
3Q
10
4Q
10
1Q
11
2Q
11
3Q
11
4Q
11
1Q
12
2Q
12
3Q
12
4Q
12
1Q
13
2Q
13
3Q
13
4Q
13
1Q
14
2Q
14
3Q
14
4Q
14
Base orders growth
0.70
0.80
0.90
1.00
1.10
1.20
1.30
1Q
07
3Q
07
1Q
08
3Q
08
1Q
09
3Q
09
1Q
10
3Q
10
1Q
11
3Q
11
1Q
12
3Q
12
1Q
13
3Q
13
1Q
14
3Q
14
1Q
15E
3Q
15E
2016E
Power Products Power Systems
Discrete Automation and Motion Low Voltage Products
Process Automation
Nomura | ABB 12 March 2015
11
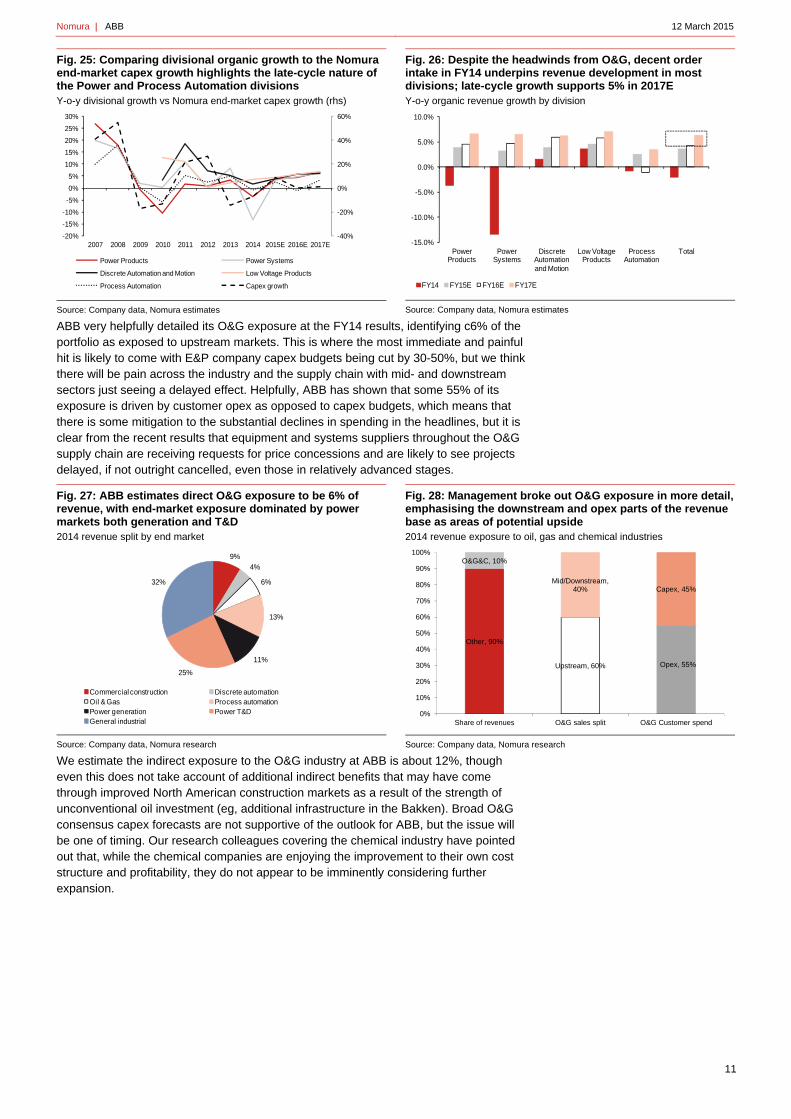
Fig. 25: Comparing divisional organic growth to the Nomura end-market capex growth highlights the late-cycle nature of the Power and Process Automation divisions Y-o-y divisional growth vs Nomura end-market capex growth (rhs)
Source: Company data, Nomura estimates
Fig. 26: Despite the headwinds from O&G, decent order intake in FY14 underpins revenue development in most divisions; late-cycle growth supports 5% in 2017E Y-o-y organic revenue growth by division
Source: Company data, Nomura estimates
ABB very helpfully detailed its O&G exposure at the FY14 results, identifying c6% of the portfolio as exposed to upstream markets. This is where the most immediate and painful hit is likely to come with E&P company capex budgets being cut by 30-50%, but we think there will be pain across the industry and the supply chain with mid- and downstream sectors just seeing a delayed effect. Helpfully, ABB has shown that some 55% of its exposure is driven by customer opex as opposed to capex budgets, which means that there is some mitigation to the substantial declines in spending in the headlines, but it is clear from the recent results that equipment and systems suppliers throughout the O&G supply chain are receiving requests for price concessions and are likely to see projects delayed, if not outright cancelled, even those in relatively advanced stages. Fig. 27: ABB estimates direct O&G exposure to be 6% of revenue, with end-market exposure dominated by power markets both generation and T&D 2014 revenue split by end market
Source: Company data, Nomura research
Fig. 28: Management broke out O&G exposure in more detail, emphasising the downstream and opex parts of the revenue base as areas of potential upside 2014 revenue exposure to oil, gas and chemical industries
Source: Company data, Nomura research
We estimate the indirect exposure to the O&G industry at ABB is about 12%, though even this does not take account of additional indirect benefits that may have come through improved North American construction markets as a result of the strength of unconventional oil investment (eg, additional infrastructure in the Bakken). Broad O&G consensus capex forecasts are not supportive of the outlook for ABB, but the issue will be one of timing. Our research colleagues covering the chemical industry have pointed out that, while the chemical companies are enjoying the improvement to their own cost structure and profitability, they do not appear to be imminently considering further expansion.
-40%
-20%
0%
20%
40%
60%
-20%
-15%
-10%
-5%
0%
5%
10%
15%
20%
25%
30%
2007 2008 2009 2010 2011 2012 2013 2014 2015E 2016E 2017E
Power Products Power Systems
Discrete Automation and Motion Low Voltage Products
Process Automation Capex growth
-15.0%
-10.0%
-5.0%
0.0%
5.0%
10.0%
Power Products
Power Systems
Discrete Automation and Motion
Low Voltage Products
Process Automation
Total
FY14 FY15E FY16E FY17E
9%4%
6%
13%
11%
25%
32%
Commercial construction Discrete automationOil & Gas Process automationPower generation Power T&DGeneral industrial
Other, 90%
O&G&C, 10%
Upstream, 60%
Mid/Downstream, 40%
Opex, 55%
Capex, 45%
0%
10%
20%
30%
40%
50%
60%
70%
80%
90%
100%
Share of revenues O&G sales split O&G Customer spend

Nomura | ABB 12 March 2015
12
Fig. 29: We estimate the total O&G exposure is closer to 12% for ABB group, but includes mid- and downstream O&G revenue exposure by division and group; 2014
Source: Company data, Nomura estimates
Fig. 30: O&G capex forecasts are not supportive of positive end-market outlook for ABB, even in mid- and downstream Y-o-y capex growth by O&G sub-sector
Source: Bloomberg, Nomura research
Overall our Nomura research O&G industry capex forecasts across the board are more bearish than consensus, whether for upstream or downstream, suggesting that we remain in the early stages of a reset in expectations. Going back to our comments on regional exposure, ABB’s balance here may provide some additional mitigation, with much of the pain in the near term at least likely to happen in North America. Having said that, Weir recently commented that it has received requests for price concessions internationally, and even in the Middle East, as much as it has in the US, which suggests that the industry overall is looking to address an inflated cost structure. Fig. 31: Our OFS research colleagues are more bearish than consensus on capex development Y-o-y O&G capex growth
Source: Bloomberg, Nomura research
Fig. 32: ABB’s regional exposure may provide some mitigation, given the biggest cuts are likely in the US Y-o-y O&G capex growth
Source: Bloomberg, Nomura research
Moving beyond project execution issues ABB has, rightly, been the subject of investor concern with respect to the long-term profitability of some of its businesses, particularly in the power end of the portfolio. Although the Power Products (PP) division has seen margins deteriorate from high-teen levels, the real culprit here is Power Systems (PS), which has seriously under-delivered for two of the past three years. Much of the underperformance relates to large, turnkey projects where ABB has acted as the overall contractor for delivering the project and has undertaken this task with weak risk management, weak pricing and weak execution.
In fairness to the company, though, despite a difficult pricing environment in many of its divisions, it has managed to drive net positive savings vs price since 2009 and we expect this to continue. We assume pricing deteriorates in 2016/17 as the current weak oil price environment will be unlikely to manifest in revenue until then. If management can cut out the PS execution issues, then the drag on group margins should lift and, with the benefit of productivity offsetting price headwinds, mid-single-digit organic growth in the balance of the business should see overall margins edge up to within target ranges for the rest of the divisions.
0%
5%
10%
15%
20%
25%
30%
35%
40%
PowerProducts
PowerSystems
DAM LVP ProcessAutomation
GROUP
-30%
-20%
-10%
0%
10%
20%
30%
40%
2013 2014E 2015E 2016E
Integrated Oil & Gas IOC up
IOC down Oil & Gas Exploration & Production
Oil & Gas Drilling Oil & Gas Equipment & Services
Oil & Gas Storage & Transportation Oil & Gas Refining & Marketing
-15%
-10%
-5%
0%
5%
10%
2013 2014E 2015E 2016E
Consensus Nomura
-20%
-15%
-10%
-5%
0%
5%
10%
15%
20%
25%
30%
2013 2014E 2015E 2016E
Europe Nomura Europe US Nomura US Japan China

Nomura | ABB 12 March 2015
13
Fig. 33: ABB has consistently delivered net positive benefits despite serious price headwinds in competitive product areas, which underpins our forecasts Cost savings and price vs margin
Source: Company data, Nomura estimates
Fig. 34: We assume all divisions apart from PS manage to achieve margins inside the target ranges over 2015-17 Divisional margin vs target ranges
Source: Company data, Nomura estimates
At PS, the business remains in transition, with margin improvement likely this year, but the real improvement towards target margin range is likely in 2016. The lumpy nature of the project business and already low profitability means 2015 is likely to continue to see sub-par margins in PS, but management believes that it now has sufficient handle on the business to be confident in achieving target margins in 2016. With a firm grip on the execution side, management has also stated that it is not including the platform in the project bid anymore, which should help reduce the ultimate risk for ABB. Pricing for the industry appears to have improved somewhat as all participants have had their fingers burned, so competitive discipline should also help margins recover. With less project work, the business may well end up being smaller, but profitability should improve and the risks decline.
For the group as a whole, the aggregate EBIT bridge shows the benefits, or arguably necessity, of a successful productivity programme, with cost saves offsetting pricing. Underlying volume development contributes above half of the overall incremental in the forecast period, but the real kicker is whether management can deliver the productivity savings to offset pricing headwinds and any cost inflation. History provides decent evidence that it can do that, if it can ensure the project business remains under control. Fig. 35: Lack of charges as legacy project execution issues are addressed should allow the margins to improve but the ramp in margins is steep and well above historical delivery PS margin development
Source: Company data, Nomura estimates
Fig. 36: Cost savings and price remain the largest components of the aggregate group EBIT bridge, which means it comes down to whether management can deliver Group EBIT bridge (CHFm)
Source: Company data, Nomura estimates
6.0%
7.0%
8.0%
9.0%
10.0%
11.0%
12.0%
13.0%
14.0%
-1,500
-1,000
-500
0
500
1,000
1,500
2,000
2009 2010 2011 2012 2013 2014 2015E 2016E 2017E
Savings Price Net (Savings ex price) Margin (RHS)
0.0%
2.0%
4.0%
6.0%
8.0%
10.0%
12.0%
14.0%
16.0%
18.0%
20.0%
Power Products
Power Systems
Discrete Automation and Motion
Low Voltage Products
Process Automation
Total
FY14 FY15E FY16E FY17E
-5.0%
-2.5%
0.0%
2.5%
5.0%
7.5%
10.0%
(300)
(200)
(100)
-
100
200
300
400
500
600
1Q
12
2Q
12
3Q
12
4Q
12
1Q
13
2Q
13
3Q
13
4Q
13
1Q
14
2Q
14
3Q
14
4Q
14
1Q
15E
2Q
15E
3Q
15E
4Q
15E
2015E
2016E
2017E
PS EBIT clean Project charges PS EBIT clean margin
-
1,000
2,000
3,000
4,000
5,000
6,000
FY
14
Pri
ce
Vo
lum
e
FX
M&
A
Savin
gs
Oth
er
FY
17E

Nomura | ABB 12 March 2015
14
SG&A costs have remained largely flat relative to sales (ex-R&D and D&A), which is a positive given the acquisitions and additional investments in selling personnel and IT (particularly in the past couple of years; selling expenses increased 5% in 2013 on an underlying basis and 9%, excluding Thomas & Betts, in 2012 owing to investment in personnel). The benefits of this investment should begin to manifest themselves in improved organic growth. Disaggregating the impact of an improvement in net promotor score (NPS) on the base order growth is difficult, but the trends are encouraging, while the increase in R&D should also support further improvement in organic growth in our forecast period. Fig. 37: Although difficult to disaggregate, the improvement in Net Promoter Score should have had a positive impact on the base order intake NPS over time vs base order growth
Source: Company data, Nomura estimates
Fig. 38: SG&A costs have remained stable relative to sales over time, despite the business doubling sales SG&A and R&D as a % of sales (SG&A adjusted for R&D and D&A )
Source: Company data, Nomura estimates
ABB has cautioned that continued R&D investment is required as part of the Next Level strategy and therefore we build continued growth in R&D into our forecasts, expecting the expense grows to 4.3% of 2016E/17E sales. Encouragingly, if we look historically at the growth in R&D spending and organic growth, the latter tends to improve after an increase in the former, giving us some confidence that our low-growth assumptions are supported by new product innovation. Fig. 39: Comparing R&D growth with organic growth shows the latter tends to improve following an increase in the former Y-o-y change
Source: Company data, Nomura estimates
-2%
0%
2%
4%
6%
8%
10%
12%
0
5
10
15
20
25
30
35
40
45
50
2010 2011 2012 2013 2014
Net Promoter Score Base order growth
-14.0%
-12.0%
-10.0%
-8.0%
-6.0%
-4.0%
-2.0%
0.0%
2004
2005
2006
2007
2008
2009
2010
2011
2012
2013
2014
2015
E
2016
E
2017
E
SG&A % sales R&D % sales
-10%-5%0%5%
10%15%20%25%30%
2004
2005
2006
2007
2008
2009
2010
2011
2012
2013
2014
2015
E
2016
E
2017
E
Organic growth R&D

Nomura | ABB 12 March 2015
15
Valuation premium has disappeared
Our standard EPS growth vs share price performance charts are particularly instructive for ABB, with strong growth in 2003-08 supporting strong share price performance, and lack of EPS growth in 2010-14 driving little share price performance. Fig. 40: Share price performance and EPS growth in the past cycle Share price growth vs EPS growth
Source: Company data, Nomura research
Fig. 41: Share price performance and EPS growth in the current cycle Share price growth vs EPS growth
Source: Company data, Nomura research
As such, a low EPS base in 2014 means ABB’s EPS growth over 2015-17E could be among the best in the sector we cover. However, compared with a broader European peer group it appears more in line, which means outperformance relative to the broader SXNP may be less well supported. Nevertheless, on a stand-alone basis, the strong EPS growth and deterioration in forward P/E multiples means ABB is one of the few of our coverage companies to enjoy a P/EG ratio of 1x, which represents good value compared with the broader sector both within Europe and elsewhere. Fig. 42: A low base in 2014 drives EPS growth above the sector average, which should drive a reversal in fortunes for the share price performance Average EPS growth 2015-17E
Source: Bloomberg, Nomura estimates
Fig. 43: Strong EPS growth and a relative P/E at cyclical lows vs the sector means ABB’s P/EG ratio is well below the sector average P/EG ratio
Source: Bloomberg, Nomura estimates
Looking at EV/sales multiples compared with EBITA margins suggests the market is pricing a lack of margin improvement. We have demonstrated above that we believe there may be some improvement, conditional on the improvement in the PS division, which suggests the current valuation is building in little in the way of upside. The balance of sentiment has become marginally more negative in recent months, with more of our peers recommending selling the stock.
0%
10%
20%
30%
40%
50%
60%
70%
(10%) 0% 10% 20% 30% 40% 50% 60% 70%
Sh
are
pri
ce C
AG
R 2
003-7
EPS CAGR 2003-8
(15%)
(10%)
(5%)
0%
5%
10%
15%
20%
(15%) (10%) (5%) 0% 5% 10% 15% 20%
Sh
are
pri
ce C
AG
R 2
010-1
4
EPS CAGR 2010-14
0%
2%
4%
6%
8%
10%
12%
14%
16%
ABB Sector Europe US Asia
EPS growth (Avg 2015E-17E)
0.0
0.5
1.0
1.5
2.0
2.5
ABB Sector Europe US Asia
PEG (FY15E)

Nomura | ABB 12 March 2015
16
Fig. 44: EV/sales reflects the market’s caution regarding the EBITA margin development EV/sales (lhs) vs EBITA margins over time (rhs)
Source: Company data, Nomura research
Fig. 45: Sell-side ratings have evolved over the past 18 months but sentiment towards ABB remains neutral Bloomberg ratings history
Source: Bloomberg, Nomura research
Concerns around M&A integration and execution issues in the backlog led to a preponderance of earnings disappointments over the past three years. This has led to underperformance relative to the broader sector for the past three years and the recent development of the oil price has further dampened performance. Fig. 46: Concerns around M&A integration, project execution and earnings disappointments have weighed on the stock, compounded by the removal of the CHF peg Share price development indexed to 100, Jan 2012=100
Source: Bloomberg, Nomura research
Fig. 47: Relative valuation is at cyclical lows; although the stock has rallied in the last month, it will take time to recover prior cycle premium One-year forward EV/EBITA and P/E relative to SXNP
Source: Bloomberg, Nomura research
It has also further eroded ABB’s relative valuation, with the stock now trading at cyclical lows on a relative EV/EBITA and P/E basis. Fig. 48: Earnings disappointments have been predominant for several years; turning this around should drive better share price performance % beat or miss on sales and EPS
Source: Bloomberg, Nomura research
Fig. 49: Our cautious growth outlook drives revenue forecasts below consensus, but we see margin improvement driving EBITA/EPS in line with consensus % difference vs consensus
Source: Bloomberg, Nomura estimates
0.0%
2.0%
4.0%
6.0%
8.0%
10.0%
12.0%
14.0%
16.0%
18.0%
0.0x
0.2x
0.4x
0.6x
0.8x
1.0x
1.2x
1.4x
1.6x
1.8x
2003
2004
2005
2006
2007
2008
2009
2010
2011
2012
2013
2014
2015E
2016E
2017E
EV/sales EBITA margins (RHS)
0%
10%
20%
30%
40%
50%
60%
70%
80%
90%
100%
tot sell rec tot buy rec tot hold rec
40
50
60
70
80
90
100
110
120
130
140
Feb-1
2
Apr-
12
Jun-1
2
Aug-1
2
Oct-
12
Dec-1
2
Feb-1
3
Apr-
13
Jun-1
3
Aug-1
3
Oct-
13
Dec-1
3
Feb-1
4
Apr-
14
Jun-1
4
Aug-1
4
Oct-
14
Dec-1
4
Feb-1
5
ABB share price (abs) ABB share price (rel to SXNP)
ABB share price (rel to SXXP)
0.6
0.7
0.8
0.9
1.0
1.1
1.2
1.3
1.4
1.5
1.6F
eb-0
6Jun-0
6O
ct-
06
Feb-0
7Jun-0
7O
ct-
07
Feb-0
8Jun-0
8O
ct-
08
Feb-0
9Jun-0
9O
ct-
09
Feb-1
0Jun-1
0O
ct-
10
Feb-1
1Jun-1
1O
ct-
11
Feb-1
2Jun-1
2O
ct-
12
Feb-1
3Jun-1
3O
ct-
13
Feb-1
4Jun-1
4O
ct-
14
Feb-1
5
ABB EV/EBIT rel to SXNP ABB P/E rel to SXNP
-40%
-35%
-30%
-25%
-20%
-15%
-10%
-5%
0%
5%
10%
1Q
CY
11
2Q
CY
11
3Q
CY
11
4Q
CY
11
1Q
CY
12
2Q
CY
12
3Q
CY
12
4Q
CY
12
1Q
CY
13
2Q
CY
13
3Q
CY
13
4Q
CY
13
1Q
CY
14
2Q
CY
14
3Q
CY
14
4Q
CY
14
Sales surprise EPS surprise
-10%
-5%
0%
SA
LE
S
0%
10%
EB
ITA
-10%
0%
10%
2015E 2016E 2017E
EP
S
Nomura | ABB 12 March 2015
17
Our forecasts relative to consensus paint a mixed picture. We are cautious on top-line development, driven by continued weakness in power and mining markets and medium-term deterioration in ABB’s O&G exposure. However, we are optimistic on profitability. We do believe in the Relentless Execution element of the ABB ‘Next Level’ plan, which is why our EBIT margin expectations are in line with consensus. Improved project execution in PS and continued delivery of productivity should go some way to mitigating what we see as downside risks in revenue expectations.
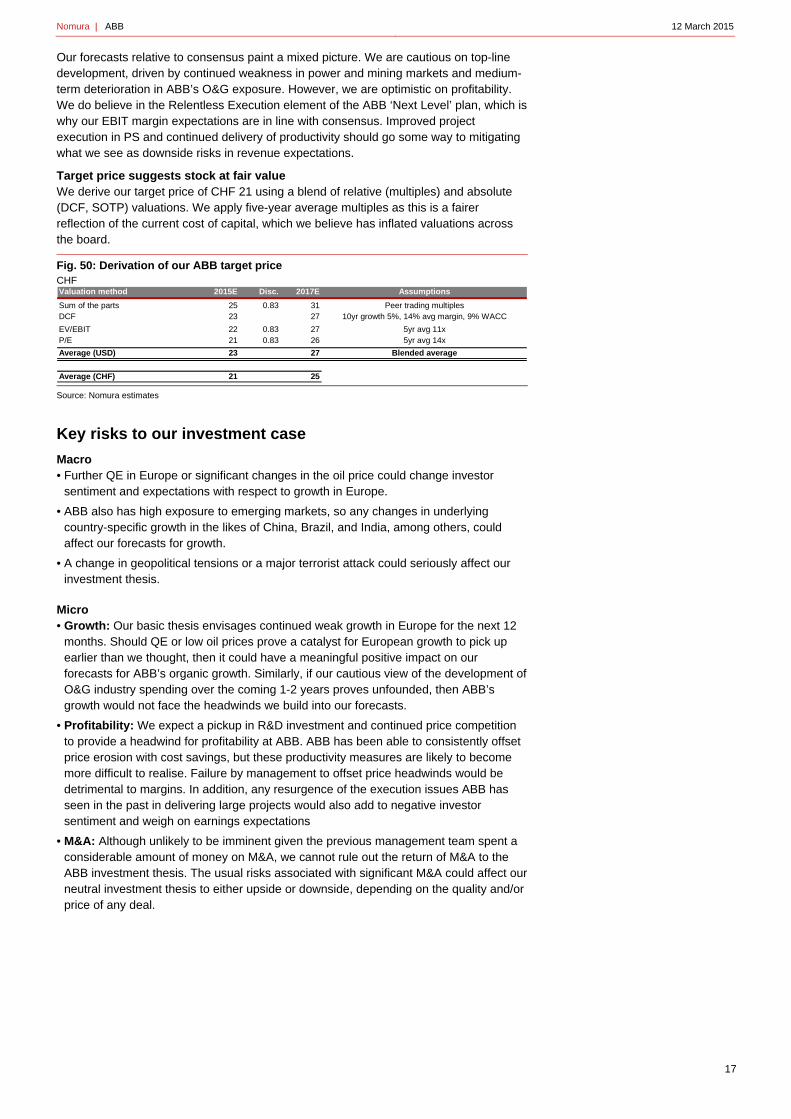
Target price suggests stock at fair value We derive our target price of CHF 21 using a blend of relative (multiples) and absolute (DCF, SOTP) valuations. We apply five-year average multiples as this is a fairer reflection of the current cost of capital, which we believe has inflated valuations across the board. Fig. 50: Derivation of our ABB target price CHF
Source: Nomura estimates
Key risks to our investment case
Macro • Further QE in Europe or significant changes in the oil price could change investor
sentiment and expectations with respect to growth in Europe.
• ABB also has high exposure to emerging markets, so any changes in underlying country-specific growth in the likes of China, Brazil, and India, among others, could affect our forecasts for growth.
• A change in geopolitical tensions or a major terrorist attack could seriously affect our investment thesis.
Micro • Growth: Our basic thesis envisages continued weak growth in Europe for the next 12
months. Should QE or low oil prices prove a catalyst for European growth to pick up earlier than we thought, then it could have a meaningful positive impact on our forecasts for ABB’s organic growth. Similarly, if our cautious view of the development of O&G industry spending over the coming 1-2 years proves unfounded, then ABB’s growth would not face the headwinds we build into our forecasts.
• Profitability: We expect a pickup in R&D investment and continued price competition to provide a headwind for profitability at ABB. ABB has been able to consistently offset price erosion with cost savings, but these productivity measures are likely to become more difficult to realise. Failure by management to offset price headwinds would be detrimental to margins. In addition, any resurgence of the execution issues ABB has seen in the past in delivering large projects would also add to negative investor sentiment and weigh on earnings expectations
• M&A: Although unlikely to be imminent given the previous management team spent a considerable amount of money on M&A, we cannot rule out the return of M&A to the ABB investment thesis. The usual risks associated with significant M&A could affect our neutral investment thesis to either upside or downside, depending on the quality and/or price of any deal.
Valuation method 2015E Disc. 2017E Assumptions
Sum of the parts 25 0.83 31 Peer trading multiplesDCF 23 27 10yr growth 5%, 14% avg margin, 9% WACC
EV/EBIT 22 0.83 27 5yr avg 11xP/E 21 0.83 26 5yr avg 14x
Average (USD) 23 27 Blended average
Average (CHF) 21 25
Nomura | ABB 12 March 2015
18
Source: Company data, Nomura estimates
Source: Company data, Nomura estimates
Source: Company data, Nomura estimates
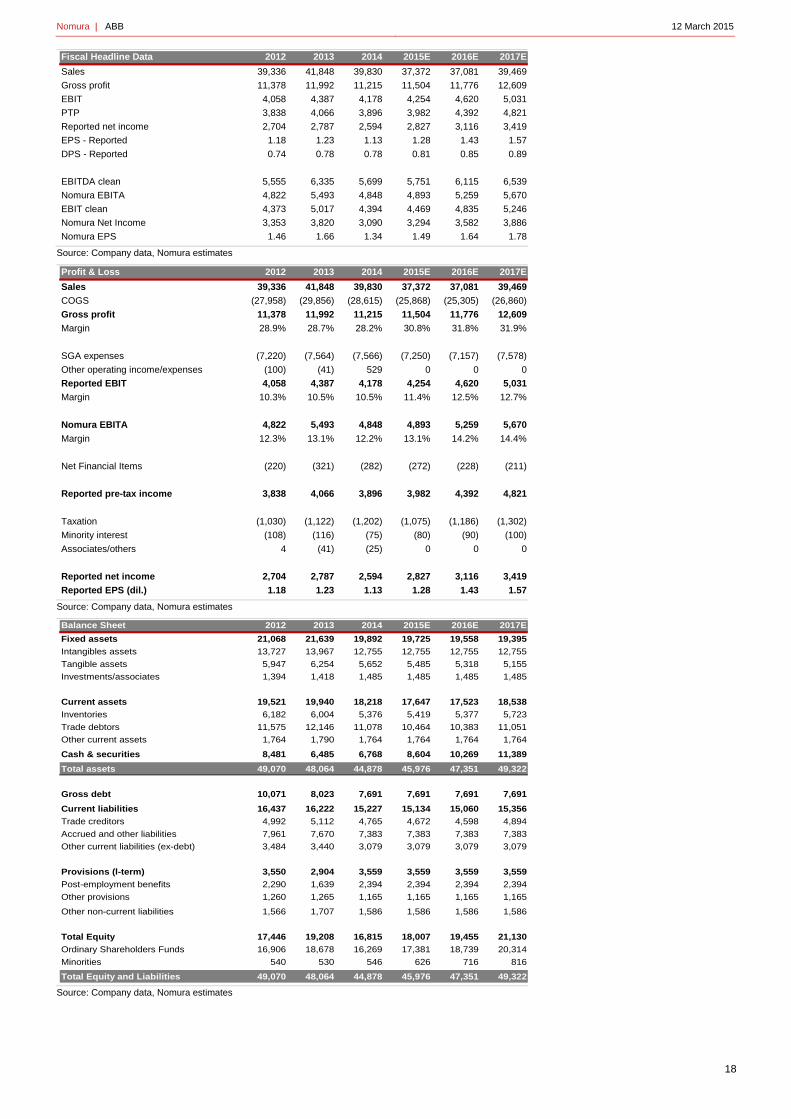
Fiscal Headline Data 2012 2013 2014 2015E 2016E 2017E
Sales 39,336 41,848 39,830 37,372 37,081 39,469
Gross profit 11,378 11,992 11,215 11,504 11,776 12,609
EBIT 4,058 4,387 4,178 4,254 4,620 5,031
PTP 3,838 4,066 3,896 3,982 4,392 4,821
Reported net income 2,704 2,787 2,594 2,827 3,116 3,419
EPS - Reported 1.18 1.23 1.13 1.28 1.43 1.57
DPS - Reported 0.74 0.78 0.78 0.81 0.85 0.89
EBITDA clean 5,555 6,335 5,699 5,751 6,115 6,539
Nomura EBITA 4,822 5,493 4,848 4,893 5,259 5,670
EBIT clean 4,373 5,017 4,394 4,469 4,835 5,246
Nomura Net Income 3,353 3,820 3,090 3,294 3,582 3,886
Nomura EPS 1.46 1.66 1.34 1.49 1.64 1.78
Profit & Loss 2012 2013 2014 2015E 2016E 2017E
Sales 39,336 41,848 39,830 37,372 37,081 39,469
COGS (27,958) (29,856) (28,615) (25,868) (25,305) (26,860)
Gross profit 11,378 11,992 11,215 11,504 11,776 12,609
Margin 28.9% 28.7% 28.2% 30.8% 31.8% 31.9%
SGA expenses (7,220) (7,564) (7,566) (7,250) (7,157) (7,578)
Other operating income/expenses (100) (41) 529 0 0 0
Reported EBIT 4,058 4,387 4,178 4,254 4,620 5,031
Margin 10.3% 10.5% 10.5% 11.4% 12.5% 12.7%
Nomura EBITA 4,822 5,493 4,848 4,893 5,259 5,670
Margin 12.3% 13.1% 12.2% 13.1% 14.2% 14.4%
Net Financial Items (220) (321) (282) (272) (228) (211)
Reported pre-tax income 3,838 4,066 3,896 3,982 4,392 4,821
Taxation (1,030) (1,122) (1,202) (1,075) (1,186) (1,302)
Minority interest (108) (116) (75) (80) (90) (100)
Associates/others 4 (41) (25) 0 0 0
Reported net income 2,704 2,787 2,594 2,827 3,116 3,419
Reported EPS (dil.) 1.18 1.23 1.13 1.28 1.43 1.57
Balance Sheet 2012 2013 2014 2015E 2016E 2017E
Fixed assets 21,068 21,639 19,892 19,725 19,558 19,395
Intangibles assets 13,727 13,967 12,755 12,755 12,755 12,755
Tangible assets 5,947 6,254 5,652 5,485 5,318 5,155
Investments/associates 1,394 1,418 1,485 1,485 1,485 1,485
Current assets 19,521 19,940 18,218 17,647 17,523 18,538
Inventories 6,182 6,004 5,376 5,419 5,377 5,723
Trade debtors 11,575 12,146 11,078 10,464 10,383 11,051
Other current assets 1,764 1,790 1,764 1,764 1,764 1,764
Cash & securities 8,481 6,485 6,768 8,604 10,269 11,389
Total assets 49,070 48,064 44,878 45,976 47,351 49,322
Gross debt 10,071 8,023 7,691 7,691 7,691 7,691
Current liabilities 16,437 16,222 15,227 15,134 15,060 15,356
Trade creditors 4,992 5,112 4,765 4,672 4,598 4,894
Accrued and other liabilities 7,961 7,670 7,383 7,383 7,383 7,383
Other current liabilities (ex-debt) 3,484 3,440 3,079 3,079 3,079 3,079
Provisions (l-term) 3,550 2,904 3,559 3,559 3,559 3,559
Post-employment benefits 2,290 1,639 2,394 2,394 2,394 2,394
Other provisions 1,260 1,265 1,165 1,165 1,165 1,165
Other non-current liabilities 1,566 1,707 1,586 1,586 1,586 1,586
Total Equity 17,446 19,208 16,815 18,007 19,455 21,130
Ordinary Shareholders Funds 16,906 18,678 16,269 17,381 18,739 20,314
Minorities 540 530 546 626 716 816
Total Equity and Liabilities 49,070 48,064 44,878 45,976 47,351 49,322

Nomura | ABB 12 March 2015
19
Source: Company data, Nomura estimates
Source: Company data, Nomura estimates
Cash Flow 2012 2013 2014 2015E 2016E 2017E
Reported net income 2,704 2,787 2,594 2,827 3,116 3,419
D & A 1,182 1,318 1,305 1,282 1,280 1,292
Movement in working capital (1,044) (273) 1,349 477 50 (719)
Other items
Operating Cash Flow 2,842 3,832 5,248 4,586 4,447 3,993
Capital expenditure (1,293) (1,106) (1,026) (1,115) (1,113) (1,129)
Fixed asset/ investment sales (5,119) (759) 1,535 0 0 0
Others investing items 1,057 (13) (757) 0 0 0
Investing Activities (5,355) (1,878) (248) (1,115) (1,113) (1,129)
Change in debt 6,075 (2,048) (332) 0 0 0
Shareholders' equity (1,594) (1,025) (4,987) (1,635) (1,668) (1,745)
Financing Activities 4,481 (3,073) (5,319) (1,635) (1,668) (1,745)
Inc (+)/dec(-) in cash 1,968 (1,119) (319) 1,836 1,666 1,119
Divisional Sales 2012 2013 2014 2015E 2016E 2017E
Power Products 10,717 11,032 10,333 9,975 9,975 10,627
Power Systems 7,852 8,375 7,020 6,700 6,693 7,124
Discrete Automotion and Motion 9,405 9,915 10,142 9,636 9,747 10,355
Low Voltage Products 6,638 7,729 7,532 7,018 7,073 7,565
Process Automation 8,156 8,497 7,948 7,244 6,818 7,049
Corporate and Other (3,432) (3,700) (3,145) (3,200) (3,225) (3,250)
Total revenue 39,336 41,848 39,830 37,372 37,081 39,469
Divisional EBIT clean 2012 2013 2014 2015E 2016E 2017E
Power Products 1,376 1,414 1,252 1,309 1,441 1,576
Power Systems 116 496 156 239 363 469
Discrete Automotion and Motion 1,472 1,498 1,451 1,467 1,557 1,648
Low Voltage Products 969 1,145 1,128 1,086 1,131 1,232
Process Automation 921 1,009 941 889 861 870
Corporate and Other (481) (545) (534) (521) (517) (548)
Total revenue 4,373 5,017 4,394 4,469 4,835 5,246
Divisional Clean margins (%) 2012 2013 2014 2015E 2016E 2017E
Power Products 12.8% 12.8% 12.1% 13.1% 14.4% 14.8%
Power Systems 1.5% 5.9% 2.2% 3.6% 5.4% 6.6%
Discrete Automotion and Motion 15.7% 15.1% 14.3% 15.2% 16.0% 15.9%
Low Voltage Products 14.6% 14.8% 15.0% 15.5% 16.0% 16.3%
Process Automation 11.3% 11.9% 11.8% 12.3% 12.6% 12.3%
Total revenue 11.1% 12.0% 11.0% 12.0% 13.0% 13.3%

Nomura | ABB 12 March 2015
20
Source: Company data, Nomura estimates Fig. 51: Divisional revenue and EBITA mix, regional exposure, OE/AM mix and end-market exposure
Source: Company data, based on 2014, Nomura research
Source: Nomura estimates
ABB NEUTRAL PRICE TARGET (CHF) 21Market data (USDm) 2015E 2016E Headline data (USDm) 2013 2014 2015E 2016E 2017E
Share price (CHF) 21 Sales 41,848 39,830 37,372 37,081 39,469
NOSH 2,206 Gross profit 11,992 11,215 11,504 11,776 12,609
Market capitalisation 48,885 48,087 Nomura EBITA 5,493 4,848 4,893 5,259 5,670
Adj. net debt (inc pension 2,107 532 EBIT (reported) 4,387 4,178 4,254 4,620 5,031
Enterprise value 50,992 48,619 EPS (reported) (USD) 1.2 1.1 1.3 1.4 1.6Share price as of 5th March, 2015 EPS (Nomura) (USD) 1.7 1.3 1.5 1.6 1.8
Multiples 2015E 2016E
EV/Sales 1.36 1.31 Reported sales growth 6% -5% -6% -1% 6%
EV/EBITDA (clean) 8.9 8.0 Organic sales growth 5% -2% 4% 4% 6%
EV/Nomura EBITA 10.4 9.2 Gross margin 28.7% 28.2% 30.8% 31.8% 31.9%
EV/IC 2.3 2.2 Nomura EBITA margin 13.1% 12.2% 13.1% 14.2% 14.4%
P/E (reported) 17.3 15.4 EPS growth (reported) 4% -8% 13% 12% 10%
P/E (Nomura) 14.8 13.4 EPS growth (Nomura) 13% -19% 11% 10% 8%
Dividend yield 3.7% 3.9% FCF conversion 99% 135% 113% 103% 88%
FCF yield 7.6% 7.7% RoIC 16.8% 14.9% 16.3% 17.7% 18.6%
-20% 0% 20% 40% 60% 80%
Power Products
Power Systems
Discrete…
Low Voltage…
Process Automation
% of EBITA % of sales
34%
29%
27%
10%
Europe N Am
Asia RoW
9%4%
6%
13%
11%25%
32%
Com. Const. DA
Oil & Gas PA
Power gen Power T&D
Gen. industrial
OE84%
AM16%
REGIONAL GROWTH SECULAR TRENDS END MARKET GROWTH
PROFITABILITY AND CAPITAL EFFICIENCY
VA
LU
AT
ION
PE
RF
OR
MA
NC
E
EARNINGS GROWTH
Regional balance cuts both ways Growth market momentum slowing (37% sales) but China/EM remain good markets 34% Europe sales should offer growth, but 25% early cycle offset by late cycle power US lowest regional exposure, but recent deals delivering strong growth
Oil & gas headwinds; gen industrial recovery 6% revenue to O&G, but 60% is late cycle Mining business and utility spend remain muted, though renewables are showing positive signs LVP (construction), DAM (general industrial demand) offer best growth prospects
Industrial internet score: 4.0 Leading industrial software business (#1 DCS, #3 PLC) 50% of offering is software-related Leading robotics OEM Smart Grid capabilities
Next Level implementation will take time, but execution is critical for investor sentiment Expansion of the portfolio into more software-based solutions and services is margin accretive Continued focus on 3-5% costs has yielded cUSD 1bn pa; R&D and SG&A headwinds to offset Working through legacy projects, though low margin work in backlog still likely to be a drag
Relative valuation premium of last cycle not apparent from 2011 EV/sales in line with expected margin development Rel. EV/EBIT and P/E discount closing Mid-teens EPS growth implies c1x P/EG
Relative underperformer past 3 yrs Legacy project issues and expensive deals put investors off; risks remain 85% Hold/Sell indicates sentiment is already indisposed to stock Recent rebound leaves stock at FV
Mid-teens average EPS growth, but reliant on PS turnaround Power Systems still in recovery through 2015; 'show -me' story Project delivery could see above-average EPS growth, but in consensus forecasts Nomura EPS in-line with consensus in 2015-17E
Nomura | ABB 12 March 2015
21
Appendix A-1
Analyst Certification
We, Alexander Virgo, Maggie Paxton, Felix Wienen and Sidharth Saboo, hereby certify (1) that the views expressed in this Research report accurately reflect our personal views about any or all of the subject securities or issuers referred to in this Research report, (2) no part of our compensation was, is or will be directly or indirectly related to the specific recommendations or views expressed in this Research report and (3) no part of our compensation is tied to any specific investment banking transactions performed by Nomura Securities International, Inc., Nomura International plc or any other Nomura Group company.
Issuer Specific Regulatory Disclosures The term "Nomura Group" used herein refers to Nomura Holdings, Inc. or any of its affiliates or subsidiaries, and may refer to one or more Nomura Group companies.
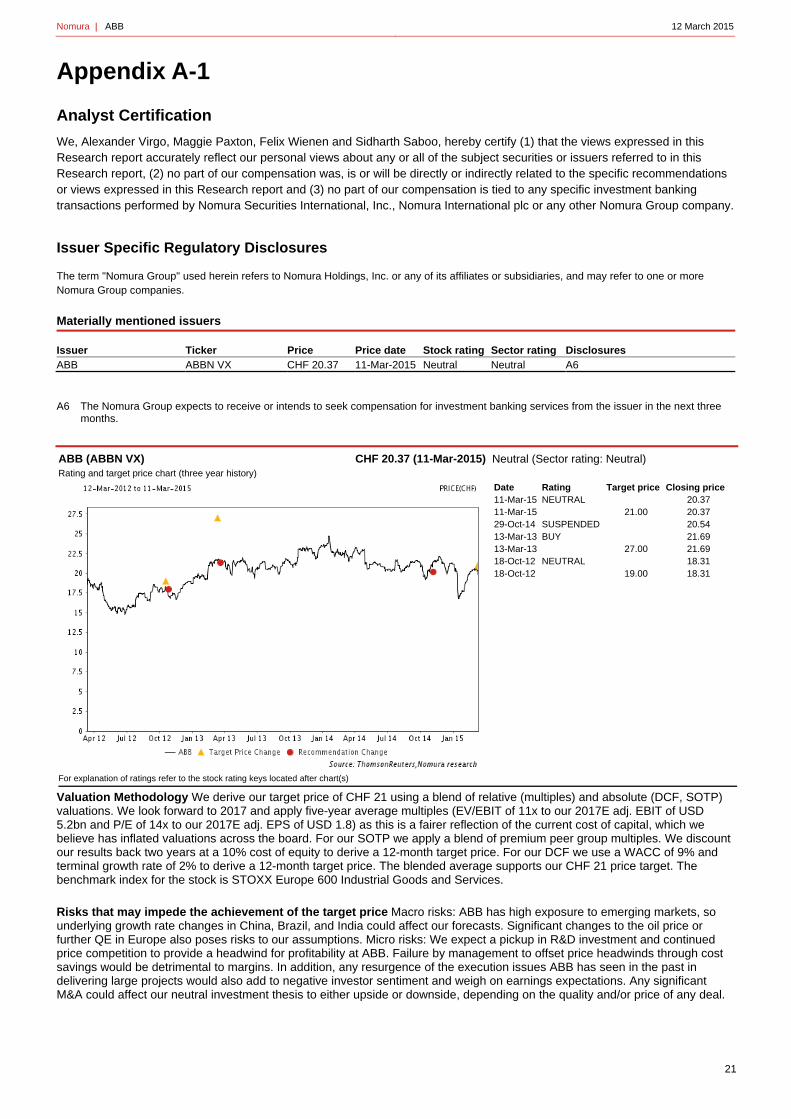
Materially mentioned issuers Issuer Ticker Price Price date Stock rating Sector rating Disclosures ABB ABBN VX CHF 20.37 11-Mar-2015 Neutral Neutral A6
A6 The Nomura Group expects to receive or intends to seek compensation for investment banking services from the issuer in the next three months.
ABB (ABBN VX) CHF 20.37 (11-Mar-2015) Rating and target price chart (three year history)
Neutral (Sector rating: Neutral)
Date Rating Target price Closing price 11-Mar-15 NEUTRAL 20.37 11-Mar-15 21.00 20.37 29-Oct-14 SUSPENDED 20.54 13-Mar-13 BUY 21.69 13-Mar-13 27.00 21.69 18-Oct-12 NEUTRAL 18.31 18-Oct-12 19.00 18.31
For explanation of ratings refer to the stock rating keys located after chart(s)
Valuation Methodology We derive our target price of CHF 21 using a blend of relative (multiples) and absolute (DCF, SOTP) valuations. We look forward to 2017 and apply five-year average multiples (EV/EBIT of 11x to our 2017E adj. EBIT of USD 5.2bn and P/E of 14x to our 2017E adj. EPS of USD 1.8) as this is a fairer reflection of the current cost of capital, which we believe has inflated valuations across the board. For our SOTP we apply a blend of premium peer group multiples. We discount our results back two years at a 10% cost of equity to derive a 12-month target price. For our DCF we use a WACC of 9% and terminal growth rate of 2% to derive a 12-month target price. The blended average supports our CHF 21 price target. The benchmark index for the stock is STOXX Europe 600 Industrial Goods and Services. Risks that may impede the achievement of the target price Macro risks: ABB has high exposure to emerging markets, so underlying growth rate changes in China, Brazil, and India could affect our forecasts. Significant changes to the oil price or further QE in Europe also poses risks to our assumptions. Micro risks: We expect a pickup in R&D investment and continued price competition to provide a headwind for profitability at ABB. Failure by management to offset price headwinds through cost savings would be detrimental to margins. In addition, any resurgence of the execution issues ABB has seen in the past in delivering large projects would also add to negative investor sentiment and weigh on earnings expectations. Any significant M&A could affect our neutral investment thesis to either upside or downside, depending on the quality and/or price of any deal.

Nomura | ABB 12 March 2015
22
Important Disclosures Online availability of research and conflict-of-interest disclosures Nomura research is available on www.nomuranow.com/research, Bloomberg, Capital IQ, Factset, MarkitHub, Reuters and ThomsonOne. Important disclosures may be read at http://go.nomuranow.com/research/globalresearchportal/pages/disclosures/disclosures.aspx or requested from Nomura Securities International, Inc., on 1-877-865-5752. If you have any difficulties with the website, please email [email protected] for help. The analysts responsible for preparing this report have received compensation based upon various factors including the firm's total revenues, a portion of which is generated by Investment Banking activities. Unless otherwise noted, the non-US analysts listed at the front of this report are not registered/qualified as research analysts under FINRA/NYSE rules, may not be associated persons of NSI, and may not be subject to FINRA Rule 2711 and NYSE Rule 472 restrictions on communications with covered companies, public appearances, and trading securities held by a research analyst account. Nomura Global Financial Products Inc. (“NGFP”) Nomura Derivative Products Inc. (“NDPI”) and Nomura International plc. (“NIplc”) are registered with the Commodities Futures Trading Commission and the National Futures Association (NFA) as swap dealers. NGFP, NDPI, and NIplc are generally engaged in the trading of swaps and other derivative products, any of which may be the subject of this report. Any authors named in this report are research analysts unless otherwise indicated. Industry Specialists identified in some Nomura International plc research reports are employees within the Firm who are responsible for the sales and trading effort in the sector for which they have coverage. Industry Specialists do not contribute in any manner to the content of research reports in which their names appear. Distribution of ratings (Global) The distribution of all ratings published by Nomura Global Equity Research is as follows: 49% have been assigned a Buy rating which, for purposes of mandatory disclosures, are classified as a Buy rating; 43% of companies with this rating are investment banking clients of the Nomura Group*. 43% have been assigned a Neutral rating which, for purposes of mandatory disclosures, is classified as a Hold rating; 54% of companies with this rating are investment banking clients of the Nomura Group*. 8% have been assigned a Reduce rating which, for purposes of mandatory disclosures, are classified as a Sell rating; 26% of companies with this rating are investment banking clients of the Nomura Group*. As at 31 December 2014. *The Nomura Group as defined in the Disclaimer section at the end of this report. Explanation of Nomura's equity research rating system in Europe, Middle East and Africa, US and Latin America, and Japan and Asia ex-Japan from 21 October 2013 The rating system is a relative system, indicating expected performance against a specific benchmark identified for each individual stock, subject to limited management discretion. An analyst’s target price is an assessment of the current intrinsic fair value of the stock based on an appropriate valuation methodology determined by the analyst. Valuation methodologies include, but are not limited to, discounted cash flow analysis, expected return on equity and multiple analysis. Analysts may also indicate expected absolute upside/downside relative to the stated target price, defined as (target price - current price)/current price. STOCKS A rating of 'Buy', indicates that the analyst expects the stock to outperform the Benchmark over the next 12 months. A rating of 'Neutral', indicates that the analyst expects the stock to perform in line with the Benchmark over the next 12 months. A rating of 'Reduce', indicates that the analyst expects the stock to underperform the Benchmark over the next 12 months. A rating of 'Suspended', indicates that the rating, target price and estimates have been suspended temporarily to comply with applicable regulations and/or firm policies. Securities and/or companies that are labelled as 'Not rated' or shown as 'No rating' are not in regular research coverage. Investors should not expect continuing or additional information from Nomura relating to such securities and/or companies. Benchmarks are as follows: United States/Europe/Asia ex-Japan: please see valuation methodologies for explanations of relevant benchmarks for stocks, which can be accessed at: http://go.nomuranow.com/research/globalresearchportal/pages/disclosures/disclosures.aspx; Global Emerging Markets (ex-Asia): MSCI Emerging Markets ex-Asia, unless otherwise stated in the valuation methodology; Japan: Russell/Nomura Large Cap. SECTORS A 'Bullish' stance, indicates that the analyst expects the sector to outperform the Benchmark during the next 12 months. A 'Neutral' stance, indicates that the analyst expects the sector to perform in line with the Benchmark during the next 12 months. A 'Bearish' stance, indicates that the analyst expects the sector to underperform the Benchmark during the next 12 months. Sectors that are labelled as 'Not rated' or shown as 'N/A' are not assigned ratings. Benchmarks are as follows: United States: S&P 500; Europe: Dow Jones STOXX 600; Global Emerging Markets (ex-Asia): MSCI Emerging Markets ex-Asia. Japan/Asia ex-Japan: Sector ratings are not assigned. Explanation of Nomura's equity research rating system in Japan and Asia ex-Japan prior to 21 October 2013 STOCKS Stock recommendations are based on absolute valuation upside (downside), which is defined as (Target Price - Current Price) / Current Price, subject to limited management discretion. In most cases, the Target Price will equal the analyst's 12-month intrinsic valuation of the stock, based on an appropriate valuation methodology such as discounted cash flow, multiple analysis, etc. A 'Buy' recommendation indicates that potential upside is 15% or more. A 'Neutral' recommendation indicates that potential upside is less than 15% or downside is less than 5%. A 'Reduce' recommendation indicates that potential downside is 5% or more. A rating of 'Suspended' indicates that the rating and target price have been suspended temporarily to comply with applicable regulations and/or firm policies in certain circumstances including when Nomura is acting in an advisory capacity in a merger or strategic transaction involving the subject company. Securities and/or companies that are labelled as 'Not rated' or shown as 'No rating' are not in regular research coverage of the Nomura entity identified in the top banner. Investors should not expect continuing or additional information from Nomura relating to such securities and/or companies. SECTORS

Nomura | ABB 12 March 2015
23
A 'Bullish' rating means most stocks in the sector have (or the weighted average recommendation of the stocks under coverage is) a positive absolute recommendation. A 'Neutral' rating means most stocks in the sector have (or the weighted average recommendation of the stocks under coverage is) a neutral absolute recommendation. A 'Bearish' rating means most stocks in the sector have (or the weighted average recommendation of the stocks under coverage is) a negative absolute recommendation. Target Price A Target Price, if discussed, reflects in part the analyst's estimates for the company's earnings. The achievement of any target price may be impeded by general market and macroeconomic trends, and by other risks related to the company or the market, and may not occur if the company's earnings differ from estimates. Disclaimers This document contains material that has been prepared by the Nomura entity identified on page 1 and/or with the sole or joint contributions of one or more Nomura entities whose employees and their respective affiliations are also specified on page 1 or identified elsewhere in the document. The term "Nomura Group" used herein refers to Nomura Holdings, Inc. or any of its affiliates or subsidiaries and may refer to one or more Nomura Group companies including: Nomura Securities Co., Ltd. ('NSC') Tokyo, Japan; Nomura International plc ('NIplc'), UK; Nomura Securities International, Inc. ('NSI'), New York, US; Nomura International (Hong Kong) Ltd. (‘NIHK’), Hong Kong; Nomura Financial Investment (Korea) Co., Ltd. (‘NFIK’), Korea (Information on Nomura analysts registered with the Korea Financial Investment Association ('KOFIA') can be found on the KOFIA Intranet at http://dis.kofia.or.kr); Nomura Singapore Ltd. (‘NSL’), Singapore (Registration number 197201440E, regulated by the Monetary Authority of Singapore); Nomura Australia Ltd. (‘NAL’), Australia (ABN 48 003 032 513), regulated by the Australian Securities and Investment Commission ('ASIC') and holder of an Australian financial services licence number 246412; P.T. Nomura Indonesia (‘PTNI’), Indonesia; Nomura Securities Malaysia Sdn. Bhd. (‘NSM’), Malaysia; NIHK, Taipei Branch (‘NITB’), Taiwan; Nomura Financial Advisory and Securities (India) Private Limited (‘NFASL’), Mumbai, India (Registered Address: Ceejay House, Level 11, Plot F, Shivsagar Estate, Dr. Annie Besant Road, Worli, Mumbai- 400 018, India; Tel: +91 22 4037 4037, Fax: +91 22 4037 4111; CIN No : U74140MH2007PTC169116, SEBI Registration No: BSE INB011299030, NSE INB231299034, INF231299034, INE 231299034, MCX: INE261299034) and NIplc, Madrid Branch (‘NIplc, Madrid’). ‘CNS Thailand’ next to an analyst’s name on the front page of a research report indicates that the analyst is employed by Capital Nomura Securities Public Company Limited (‘CNS’) to provide research assistance services to NSL under a Research Assistance Agreement. ‘NSFSPL’ next to an employee’s name on the front page of a research report indicates that the individual is employed by Nomura Structured Finance Services Private Limited to provide assistance to certain Nomura entities under inter-company agreements. THIS MATERIAL IS: (I) FOR YOUR PRIVATE INFORMATION, AND WE ARE NOT SOLICITING ANY ACTION BASED UPON IT; (II) NOT TO BE CONSTRUED AS AN OFFER TO SELL OR A SOLICITATION OF AN OFFER TO BUY ANY SECURITY IN ANY JURISDICTION WHERE SUCH OFFER OR SOLICITATION WOULD BE ILLEGAL; AND (III) BASED UPON INFORMATION FROM SOURCES THAT WE CONSIDER RELIABLE, BUT HAS NOT BEEN INDEPENDENTLY VERIFIED BY NOMURA GROUP. Nomura Group does not warrant or represent that the document is accurate, complete, reliable, fit for any particular purpose or merchantable and does not accept liability for any act (or decision not to act) resulting from use of this document and related data. To the maximum extent permissible all warranties and other assurances by Nomura group are hereby excluded and Nomura Group shall have no liability for the use, misuse, or distribution of this information. Opinions or estimates expressed are current opinions as of the original publication date appearing on this material and the information, including the opinions and estimates contained herein, are subject to change without notice. Nomura Group is under no duty to update this document. Any comments or statements made herein are those of the author(s) and may differ from views held by other parties within Nomura Group. Clients should consider whether any advice or recommendation in this report is suitable for their particular circumstances and, if appropriate, seek professional advice, including tax advice. Nomura Group does not provide tax advice. Nomura Group, and/or its officers, directors and employees, may, to the extent permitted by applicable law and/or regulation, deal as principal, agent, or otherwise, or have long or short positions in, or buy or sell, the securities, commodities or instruments, or options or other derivative instruments based thereon, of issuers or securities mentioned herein. Nomura Group companies may also act as market maker or liquidity provider (within the meaning of applicable regulations in the UK) in the financial instruments of the issuer. Where the activity of market maker is carried out in accordance with the definition given to it by specific laws and regulations of the US or other jurisdictions, this will be separately disclosed within the specific issuer disclosures. This document may contain information obtained from third parties, including ratings from credit ratings agencies such as Standard & Poor’s. Reproduction and distribution of third-party content in any form is prohibited except with the prior written permission of the related third-party. Third-party content providers do not guarantee the accuracy, completeness, timeliness or availability of any information, including ratings, and are not responsible for any errors or omissions (negligent or otherwise), regardless of the cause, or for the results obtained from the use of such content. Third-party content providers give no express or implied warranties, including, but not limited to, any warranties of merchantability or fitness for a particular purpose or use. Third-party content providers shall not be liable for any direct, indirect, incidental, exemplary, compensatory, punitive, special or consequential damages, costs, expenses, legal fees, or losses (including lost income or profits and opportunity costs) in connection with any use of their content, including ratings. Credit ratings are statements of opinions and are not statements of fact or recommendations to purchase hold or sell securities. They do not address the suitability of securities or the suitability of securities for investment purposes, and should not be relied on as investment advice. Any MSCI sourced information in this document is the exclusive property of MSCI Inc. (‘MSCI’). Without prior written permission of MSCI, this information and any other MSCI intellectual property may not be reproduced, re-disseminated or used to create any financial products, including any indices. This information is provided on an "as is" basis. The user assumes the entire risk of any use made of this information. MSCI, its affiliates and any third party involved in, or related to, computing or compiling the information hereby expressly disclaim all warranties of originality, accuracy, completeness, merchantability or fitness for a particular purpose with respect to any of this information. Without limiting any of the foregoing, in no event shall MSCI, any of its affiliates or any third party involved in, or related to, computing or compiling the information have any liability for any damages of any kind. MSCI and the MSCI indexes are services marks of MSCI and its affiliates. Russell/Nomura Japan Equity Indexes are protected by certain intellectual property rights of Nomura Securities Co., Ltd. and Russell Investments. Nomura Securities Co., Ltd. and Russell Investments do not guarantee the accuracy, completeness, reliability, or usefulness thereof and do not account for business activities and services that any index user and its affiliates undertake with the use of the Indexes. Investors should consider this document as only a single factor in making their investment decision and, as such, the report should not be viewed as identifying or suggesting all risks, direct or indirect, that may be associated with any investment decision. Nomura Group produces a number of different types of research product including, among others, fundamental analysis and quantitative analysis; recommendations contained in one type of research product may differ from recommendations contained in other types of research product, whether as a result of differing time horizons, methodologies or otherwise. Nomura Group publishes research product in a number of different ways including the posting of product on Nomura Group portals and/or distribution directly to clients. Different groups of clients may receive different products and services from the research department depending on their individual requirements. Figures presented herein may refer to past performance or simulations based on past performance which are not reliable indicators of future performance. Where the information contains an indication of future performance, such forecasts may not be a reliable indicator of future

Nomura | ABB 12 March 2015
24
performance. Moreover, simulations are based on models and simplifying assumptions which may oversimplify and not reflect the future distribution of returns. Certain securities are subject to fluctuations in exchange rates that could have an adverse effect on the value or price of, or income derived from, the investment. The securities described herein may not have been registered under the US Securities Act of 1933 (the ‘1933 Act’), and, in such case, may not be offered or sold in the US or to US persons unless they have been registered under the 1933 Act, or except in compliance with an exemption from the registration requirements of the 1933 Act. Unless governing law permits otherwise, any transaction should be executed via a Nomura entity in your home jurisdiction. This document has been approved for distribution in the UK and European Economic Area as investment research by NIplc. NIplc is authorised by the Prudential Regulation Authority and regulated by the Financial Conduct Authority and the Prudential Regulation Authority. NIplc is a member of the London Stock Exchange. This document does not constitute a personal recommendation within the meaning of applicable regulations in the UK, or take into account the particular investment objectives, financial situations, or needs of individual investors. This document is intended only for investors who are 'eligible counterparties' or 'professional clients' for the purposes of applicable regulations in the UK, and may not, therefore, be redistributed to persons who are 'retail clients' for such purposes. This document has been approved by NIHK, which is regulated by the Hong Kong Securities and Futures Commission, for distribution in Hong Kong by NIHK. This document has been approved for distribution in Australia by NAL, which is authorized and regulated in Australia by the ASIC. This document has also been approved for distribution in Malaysia by NSM. In Singapore, this document has been distributed by NSL. NSL accepts legal responsibility for the content of this document, where it concerns securities, futures and foreign exchange, issued by their foreign affiliates in respect of recipients who are not accredited, expert or institutional investors as defined by the Securities and Futures Act (Chapter 289). Recipients of this document in Singapore should contact NSL in respect of matters arising from, or in connection with, this document. Unless prohibited by the provisions of Regulation S of the 1933 Act, this material is distributed in the US, by NSI, a US-registered broker-dealer, which accepts responsibility for its contents in accordance with the provisions of Rule 15a-6, under the US Securities Exchange Act of 1934. The entity that prepared this document permits its separately operated affiliates within the Nomura Group to make copies of such documents available to their clients. This document has not been approved for distribution to persons other than ‘Authorised Persons’, ‘Exempt Persons’ or ‘Institutions’ (as defined by the Capital Markets Authority) in the Kingdom of Saudi Arabia (‘Saudi Arabia’) or 'professional clients' (as defined by the Dubai Financial Services Authority) in the United Arab Emirates (‘UAE’) or a ‘Market Counterparty’ or ‘Business Customers’ (as defined by the Qatar Financial Centre Regulatory Authority) in the State of Qatar (‘Qatar’) by Nomura Saudi Arabia, NIplc or any other member of Nomura Group, as the case may be. Neither this document nor any copy thereof may be taken or transmitted or distributed, directly or indirectly, by any person other than those authorised to do so into Saudi Arabia or in the UAE or in Qatar or to any person other than ‘Authorised Persons’, ‘Exempt Persons’ or ‘Institutions’ located in Saudi Arabia or 'professional clients' in the UAE or a ‘Market Counterparty’ or ‘Business Customers’ in Qatar . By accepting to receive this document, you represent that you are not located in Saudi Arabia or that you are an ‘Authorised Person’, an ‘Exempt Person’ or an ‘Institution’ in Saudi Arabia or that you are a 'professional client' in the UAE or a ‘Market Counterparty’ or ‘Business Customers’ in Qatar and agree to comply with these restrictions. Any failure to comply with these restrictions may constitute a violation of the laws of the UAE or Saudi Arabia or Qatar. NO PART OF THIS MATERIAL MAY BE (I) COPIED, PHOTOCOPIED, OR DUPLICATED IN ANY FORM, BY ANY MEANS; OR (II) REDISTRIBUTED WITHOUT THE PRIOR WRITTEN CONSENT OF A MEMBER OF NOMURA GROUP. If this document has been distributed by electronic transmission, such as e-mail, then such transmission cannot be guaranteed to be secure or error-free as information could be intercepted, corrupted, lost, destroyed, arrive late or incomplete, or contain viruses. The sender therefore does not accept liability for any errors or omissions in the contents of this document, which may arise as a result of electronic transmission. If verification is required, please request a hard-copy version. Nomura Group manages conflicts with respect to the production of research through its compliance policies and procedures (including, but not limited to, Conflicts of Interest, Chinese Wall and Confidentiality policies) as well as through the maintenance of Chinese walls and employee training. Additional information is available upon request and disclosure information is available at the Nomura Disclosure web page: http://go.nomuranow.com/research/globalresearchportal/pages/disclosures/disclosures.aspx Copyright © 2015 Nomura International plc. All rights reserved.