12-step powerpoint - index funds advisors
TRANSCRIPT
1
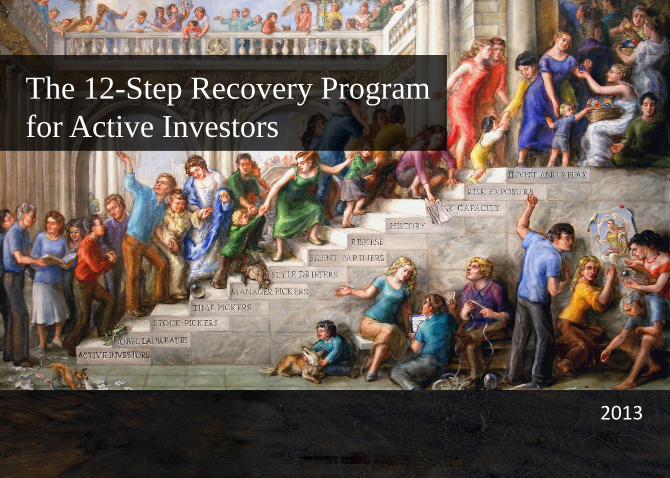
The 12-Step Recovery Program
for Active Investors
2013
2
3
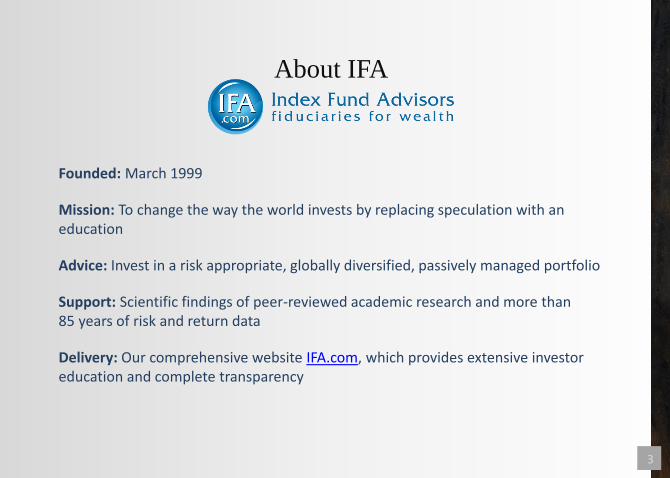
Founded: March 1999
Mission: To change the way the world invests by replacing speculation with an education
Advice: Invest in a risk appropriate, globally diversified, passively managed portfolio
Support: Scientific findings of peer-reviewed academic research and more than 85 years of risk and return data
Delivery: Our comprehensive website IFA.com, which provides extensive investor education and complete transparency
About IFA
4
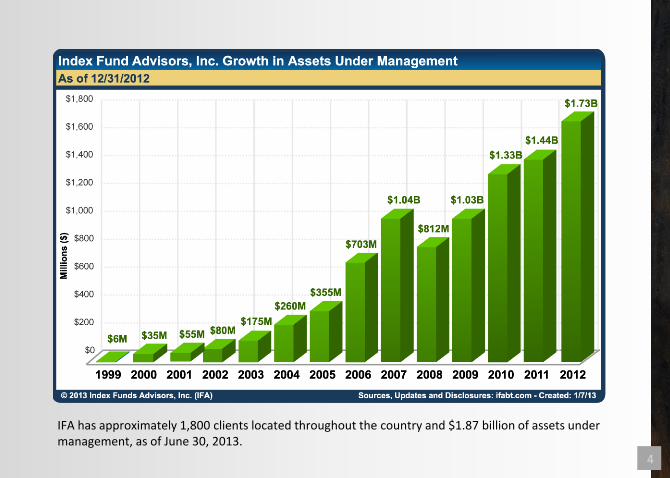
IFA has approximately 1,800 clients located throughout the country and $1.87 billion of assets under management, as of June 30, 2013.

5

6
Disclosure for Backtested Performance Information, the IFA Indexes, and IFA Index Portfolios (updates can be found at www.ifabt.com): 1. Index Fund Advisors, Inc. (IFA) is an SEC registered Investment Adviser. Information pertaining to IFA’s advisory operations, services, and fees is set forth in IFAs’ current Form ADV Part 2 (Brochure), a copy of which is available upon request and at www.adviserinfo.sec.gov. The performance information presented in certain charts or tables represent backtested performance based on combined simulated index data and live (or actual) mutual fund results from January 1, 1928 to the period ending date shown, using the strategy of buy and hold and on the first of each year annually rebalancing the globally diversified portfolios of index funds. Backtested performance is hypothetical (it does not reflect trading in actual accounts) and is provided for informational purposes only to indicate historical performance had the index portfolios been available over the relevant time period. IFA refers to this hypothetical data as a Simulated Passive Investor Experience (SPIE). IFA did not offer the index portfolios until November 1999. Prior to 1999, IFA did not manage client assets. The IFA indexing investment strategy is based on principles generally known as Modern Portfolio Theory and the Fama and French Three Factor Model for Equities and Two Factor Model for Fixed Income. Index portfolios are designed to provide substantial global diversification in order to reduce investment concentration and the resulting potential increased risk caused by the volatility of individual companies, indexes, or asset classes. 2. A review of the IFA Index Data Sources (ifaindexes.com), IFA Indexes Time Series Construction (ifa.com/pdf/tsc.pdf) and several of the Dimensional Indexes (ifa.com/pdf/DFAIndexes.pdf) is an integral part of this disclosure and should be read in conjunction with this explanation of backtested performance information presented. IFA defines index funds as mutual funds that follow a set of rules of ownership that are held constant regardless of market conditions. An important characteristic of an index fund is that its rules of ownership are not based on a forecast of short-term events. Therefore, an investment strategy that is limited to the buying and rebalancing of a portfolio of index funds is often referred to as passive investing, as opposed to active investing. Simulated index data is based on the performance of indexes and live mutual funds as described in the IFA Indexes Data Sources page. The index mutual funds used in IFA’s Index Portfolios are IFA’s best estimate of a mutual fund that will come closest to the index data provided in the simulated indexes. Simulated index data is used for the period prior to the inception of the relevant live mutual fund data and an equivalent mutual fund expense ratio is deducted from simulated index data. Live (or actual) mutual fund performance is used after the inception date of each mutual fund. The IFA Indexes Times Series Construction goes back to January 1928 and consistently reflects a tilt towards small cap and value equities over time, with an increasing diversification to international markets, emerging markets and real estate investment trusts as data became available. As of January 1928, there are 4 equity indexes and 2 bond indexes; in January 1970 there are a total of 8 indexes, and there are 15 indexes in March 1998 to present. See (http://www.ifa.com/pdf/The_Evolution_of_IFA_Portfolio.pdf) to see the analysis of the evolution of these portfolios. This PDF names the indexes used in the IFA Portfolios for each period, and page 4 of the PDF shows the Time Series Construction of the IFA indexes. If the original 4 equity indexes from 1928 (IFA US Large Company Index; IFA US Large Cap Value Index; IFA US Small Cap Index; IFA US Small Cap Value Index) are held constant until December 2011, the annualized rate of return of this simplified version of IFA Index Portfolio 90 is 10.23%, after the deduction of a 0.9% IFA advisory fee and a standard deviation of 22.76%. The evolving IFA Indexes over the same period have a 10.35% annualized return for IFA Index Portfolio 90 after the same IFA advisory fees and a standard deviation of 21.79%. The stitching together of index and live fund data and adding international markets, emerging markets and REITs only had a slight impact on risk and return over this 84 year period. Instead, it demonstrates the value of a small cap and value tilt in global equity markets, since over the same period a Simulated S&P 500 Index only had a return of 9.46% (with no fees deducted), at a standard deviation of 19.27%. Backtested performance is calculated by using a computer program and monthly returns data set that start with the first day of the given time period and evaluates the returns of simulated indexes and DFA index mutual funds. In 1999, tax-managed funds became available for many different DFA index funds. 3. Backtested performance does not represent actual performance and should not be interpreted as an indication of such performance. Actual performance for client accounts may be materially lower than that of the index portfolios. Backtested performance results have certain inherent limitations. Such results do not represent the impact that material economic and market factors might have on an investment adviser’s decision-making process if the adviser were actually managing client money. Backtested performance also differs from actual performance because it is achieved through the retroactive application of model portfolios (in this case, IFA’s Index Portfolios) designed with the benefit of hindsight. As a result, the models theoretically may be changed from time to time and the effect on performance results could be either favorable or unfavorable. 4. History of Changes to the IFA Indexes: 1991-2000: IFA Index Portfolios 10, 30, 50, 70 and 90 were originally suggested by Dimensional Fund Advisors (ifa.com/pdf/balancedstrategies.pdf), merely as an example of globally diversified investments using their custom index mutual funds, back in 1991 with moderate modifications in 1996 to reflect the availability of index funds that tracked the emerging markets asset class. Index Portfolios between each of the above listed portfolios were created by IFA in 2000 by interpolating between the above portfolios. Portfolios 5, 95 and 100 were created by Index Fund Advisors in 2000, as a lower and higher extension of the DFA 1991 risk and return line. As of March 1, 2010, 100 IFA Index Portfolios are available to IFA clients, with IFA Index Portfolios between the shown allocations being interpolations of the 20 allocations shown. In January 2008, IFA introduced three new indexes and eighteen socially responsible portfolios constructed from these three indexes and five pre-existing IFA indexes. The new indexes introduced were: IFA US Social Core 2 Equity, IFA Emerging Markets Social Core, and IFA International Real Estate. All three use live DFA fund data as long as it has been available. Prior to live fund data, they use index data supplied by DFA modified for fund management fees. In April 2008, IFA introduced two new indexes and eighteen sustainability portfolios constructed from these two indexes and five pre-existing indexes. The new indexes introduced were: IFA US Sustainability Core 1 Equity and IFA International Sustainability Core Equity. In November 2011, IFA made a change to the index data used in its large growth and small growth indexes. Fama/French data was replaced with data supplied by Dimensional Fund Advisors via its Returns 2.2 program. For large growth, the difference in annualized return was about 1% (a decrease). For small growth, the difference was about 0.2%. In November 2012, IFA changed the allocations and the historical returns for its socially responsible portfolios to reflect the introduction of the DFA International Social Core Equity Portfolio (DSCLX). Prior to this, the international developed equity asset class was unavailable in a socially responsible implementation. Although clients who were invested in the old allocation from the time it became available (January 2008) likely did better than they would have done with the new allocation, the difference is not statistically significant, and it is IFA’s advice that going forward having an exposure to international developed equities will provide a substantial diversification benefit to socially responsible investors. Go to www.ifa.com/btp/historyofchange.html to see a summary of changes made to the IFA Indexes and Index Portfolios.

7
5. Backtested performance results assume the reinvestment of dividends and capital gains and annual rebalancing at the beginning of each year. It is important to understand that the assumption of annual rebalancing has an impact on the monthly returns reported for the IFA Index Portfolio in both the Risk and Reward Table (www.ifabigtable.com) and the Index Calculator (www.ifacalc.com). For monthly rebalancing, the monthly return is calculated with the assumption that the portfolio is perfectly in balance at the beginning of each month. For annual rebalancing, the year-to-date return is calculated with the assumption that the portfolio is perfectly in balance at the beginning of the year. The latter assumption underlies the returns shown for the IFA Index Portfolios. In actual portfolios, however, rebalancing occurs at no set time, and such actions are dependent on both market conditions and individual client liquidity inflows and outflows, along with the cost impact of such transactions on the overall portfolio. Therefore actual monthly and year-to-date returns will differ from the IFA Returns Calculator. The reason for this difference is that with annual rebalancing, the monthly returns are calculated from the ratio of the year-to-date growth of $1.00 at the end of the month to the year-to-date growth of $1.00 at the beginning of the month. For monthly rebalancing, the monthly return is calculated with the assumption that the portfolio is perfectly in balance at the beginning of the month. The performance of the IFA Index Portfolios reflects and is net of the effect of IFA’s annual investment management fee of 0.9%, billed monthly, unless stated otherwise. Monthly fee deduction is a requirement of our software used for backtesting. Actual IFA advisory fees are deducted quarterly, in advance. This fee is the highest fee IFA charges. Depending on the amount of your assets under management, your investment management fee may be less. Backtested risk and return data is a combination of live (or actual) mutual fund results and simulated index data, and mutual fund fees and expenses have been deducted from both the live (or actual) results and the simulated index data. When IFA Indexes are shown in IFA Index Portfolios, all returns data reflects a deduction of 0.9% annual investment advisory fee, which is the maximum IFA fee. Unless indicated otherwise, data shown for each individual IFA Index is shown without a deduction of the IFA advisory fee. We choose this method because the creation, choice, monitoring and rebalancing of diversified index portfolios are the services of the independent investment advisor and at that point the fees are appropriate to deduct from the whole portfolio returns. Since we accept no fees from investment product firms, IFA compares index funds based on net asset value returns, which are net of the mutual fund company expense ratios only. Although index mutual funds minimize tax liabilities from short and long-term capital gains, any resulting tax liability is not deducted from performance results. Performance results also do not reflect transaction fees (as seen at www.ifafee.com) and other expenses, which reduce returns. 6. For all data periods, annualized standard deviation is presented as an approximation by multiplying the monthly standard deviation number by the square root of 12. Please note that the number computed from annual data may differ materially from this estimate. We have chosen this methodology because Morningstar uses the same method. Go to www.ifabt.com for details. In those charts and tables where the standard deviation of daily returns is shown, it is estimated as the standard deviation of monthly returns divided by the square root of 22. 7. The tax-managed index funds are not used in calculating the backtested performance of the index portfolios, unless specified in the table or chart. 8. Performance results for clients that invested in accordance with the IFA Index Portfolios will vary from the backtested performance due to market conditions and other factors, including investments cash flows, mutual fund allocations, frequency and precision of rebalancing, tax-management strategies, cash balances, lower than 0.9% advisory fees, varying custodian fees, and/or the timing of fee deductions. As the result of these and potentially other variances, actual performance for client accounts may differ materially from (and may be lower than) that of the index portfolios. Clients should consult their account statements for information about how their actual performance compares to that of the index portfolios. 9. As with any investment strategy, there is potential for profit as well as the possibility of loss. IFA does not guarantee any minimum level of investment performance or the success of any index portfolio or investment strategy. All investments involve risk and investment recommendations will not always be profitable. 10. Past performance does not guarantee future results. 11. IFA Index Portfolio Value Data is based on a starting value of one, as of January 1, 1928. 12. DISCLAIMER: THERE ARE NO WARRANTIES, EXPRESSED OR IMPLIED, AS TO ACCURACY, COMPLETENESS, OR RESULTS OBTAINED FROM ANY INFORMATION PROVIDED HEREIN OR ON THE MATERIAL PROVIDED. This document does not constitute a complete description of our investment services and is for informational purposes only. It is in no way a solicitation or an offer to sell securities or investment advisory services. Any statements regarding market or other financial information is obtained from sources which we and our suppliers believe to be reliable, but we do not warrant or guarantee the timeliness or accuracy of this information. Neither our information providers nor we shall be liable for any errors or inaccuracies, regardless of cause, or the lack of timeliness of, or for any delay or interruption in the transmission thereof to the user. All investments involve risk, including foreign currency exchange rates, political risks, market risk, different methods of accounting and financial reporting, and foreign taxes. Your use of these materials, including www.ifa.com website is your acknowledgement that you have read and understood the full disclaimer as stated above. IFA Index Portfolios, times series, standard deviations, and returns calculations are determined in the Dimensional Returns 2.0 program. © Copyright 1999-2013, DFA, Inc. 13. IFA licenses the use of data, in part, from Morningstar Direct, a third-party provider of stock market data. Where data is cited from Morningstar Direct, the following disclosures apply: ©2013 Morningstar, Inc. All rights reserved. The information provided by Morningstar Direct and contained herein: (1) is proprietary to Morningstar and/or its content providers; (2) may not be copied or distributed; and (3) is not warranted to be accurate, complete or timely. Neither Morningstar nor its content providers are responsible for any damages or losses arising from any use of this information. Updated 7-1-2013. For additional updates see www.ifabt.com. 14. Effective July 1, 2013, Index Funds Advisors, Inc., a California Corporation, is now Index Fund Advisors, Inc. a Delaware corporation.
8
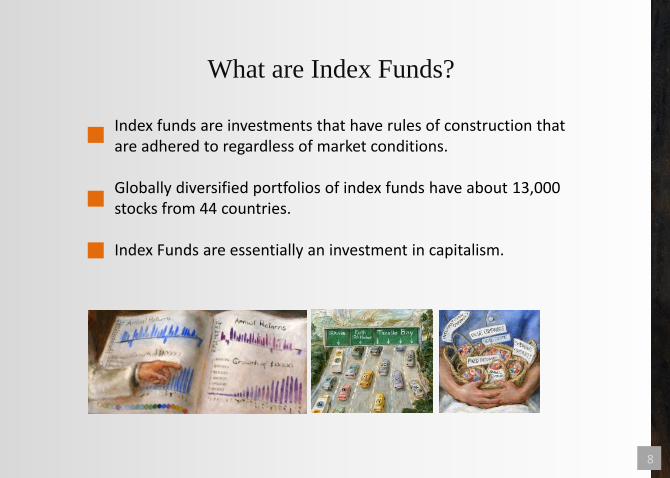
Index funds are investments that have rules of construction that are adhered to regardless of market conditions.
Globally diversified portfolios of index funds have about 13,000 stocks from 44 countries.
Index Funds are essentially an investment in capitalism.
What are Index Funds?

9

10
Because you get… Because you avoid…
1. Market rates of returns with lower fees,
expenses and taxes.
Speculation through stock, time, manager
and style picking
2. Increased Diversification Unrewarded Concentration
3.
More than 85 years of Risk and Return
Data for IFA Index Portfolios and IFA
Indexes
Silent Partners and below market rate of
returns
4. Style Purity, Asset Allocation
Consistency Style Drift, Asset Allocation Shift
5. Relaxation Stress
Why Invest in a Portfolio of Index Funds?

11
Celebrate
the Price!
Baked in the Cake

12
Step 1:
Active Investors
13
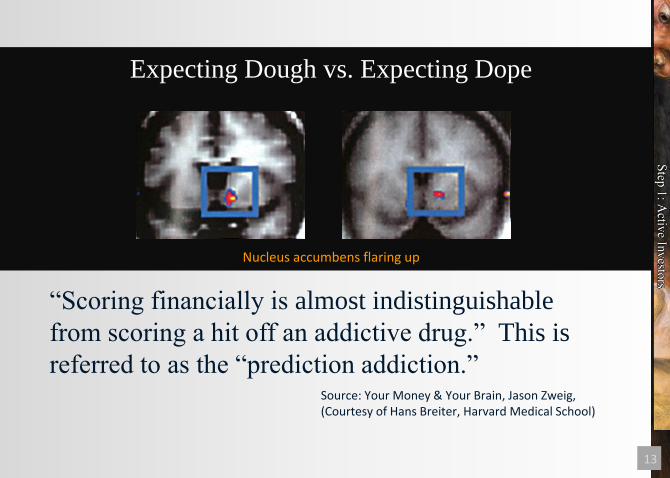
Expecting Dough vs. Expecting Dope
“Scoring financially is almost indistinguishable
from scoring a hit off an addictive drug.” This is
referred to as the “prediction addiction.” Source: Your Money & Your Brain, Jason Zweig, (Courtesy of Hans Breiter, Harvard Medical School)
Nucleus accumbens flaring up
14

15
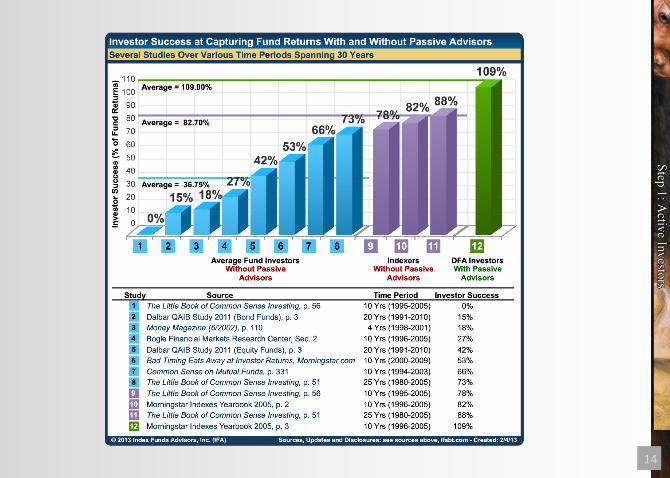
1. Bogle, John C. The Little Book of Common Sense Investing: the Only Way to Guarantee Your Fair Share of Market Returns. Hoboken, NJ: John Wiley & Sons, 2007. 56. Print.
2. Dalbar. "Helping Investors Change Behavior to Capture Alpha." Quantitative Analysis of Investor Behavior. 25 Mar. 2011. Web. 14 Nov. 2011. 3. <http://www.qaib.com/>.
3. Zweig, Jason. "What Fund Investors Really Need To Know. OUR EXCLUSIVE STUDY OF MUTUAL FUND RETURNS SHOWS WHICH ONES REALLY MADE MONEY FOR INVESTORS
AND WHICH ONES TOOK SHAREHOLDERS FOR A COSTLY RIDE." CNNMoney - Business, Financial and Personal Finance News. June 1, 2002. Web. 14 Nov. 2011. 10.
<http://money.cnn.com/magazines/moneymag/moneymag_archive/2002/06/01/323312/index.htm>.
4. Bogle, John C. "Bogle Financial Markets Research Center." Vanguard - Mutual Funds, IRAs, ETFs, 401(k) Plans, and More. 8 Jan. 2010. Web. 14 Nov. 2011.
<http://vanguard.com/bogle_site/sp20071015.html>.
5. Dalbar. "Helping Investors Change Behavior to Capture Alpha." Quantitative Analysis of Investor Behavior. 25 Mar. 2011. Web. 14 Nov. 2011. 3. <http://www.qaib.com/>.
6. Kinnel, Russell. "Bad Timing Eats Away at Investor Returns." Morningstar. 15 Feb. 2010. Web. 14 Nov. 2011.
<http://news.morningstar.com/articlenet/article.aspx?id=325664>.
7. Bogle, John C. Common Sense on Mutual Funds. Hoboken, NJ: Wiley, 2010. 331. Print.
8. Bogle, John C. The Little Book of Common Sense Investing: the Only Way to Guarantee Your Fair Share of Market Returns. Hoboken, NJ: John Wiley & Sons, 2007. 51. Print.
9. Bogle, John C. The Little Book of Common Sense Investing: the Only Way to Guarantee Your Fair Share of Market Returns. Hoboken, NJ: John Wiley & Sons, 2007. 56. Print.
10. Morningstar. "Morningstar Index Yearbook 2005." Morningstar, 12 May 2006. Web. 14 Nov. 2011. 3.
<http://indexes.morningstar.com/Index/PDF/MorningstarIndexesYearbook2005.pdf>.
11. Bogle, John C. The Little Book of Common Sense Investing: the Only Way to Guarantee Your Fair Share of Market Returns. Hoboken, NJ: John Wiley & Sons, 2007. 51. Print.
12. Morningstar. "Morningstar Index Yearbook 2005." Morningstar, 12 May 2006. Web. 14 Nov. 2011. 3.
<http://indexes.morningstar.com/Index/PDF/MorningstarIndexesYearbook2005.pdf>.
Sources for Investor Success Chart:
16
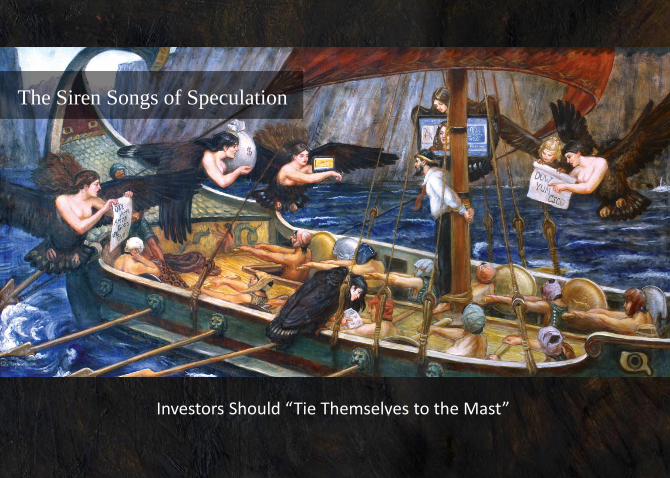
Investors Should “Tie Themselves to the Mast”
The Siren Songs of Speculation
17
18
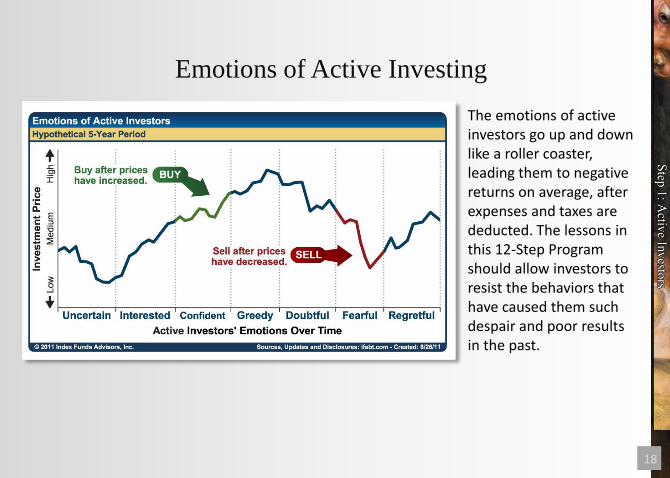
The emotions of active investors go up and down like a roller coaster, leading them to negative returns on average, after expenses and taxes are deducted. The lessons in this 12-Step Program should allow investors to resist the behaviors that have caused them such despair and poor results in the past.
Emotions of Active Investing
19
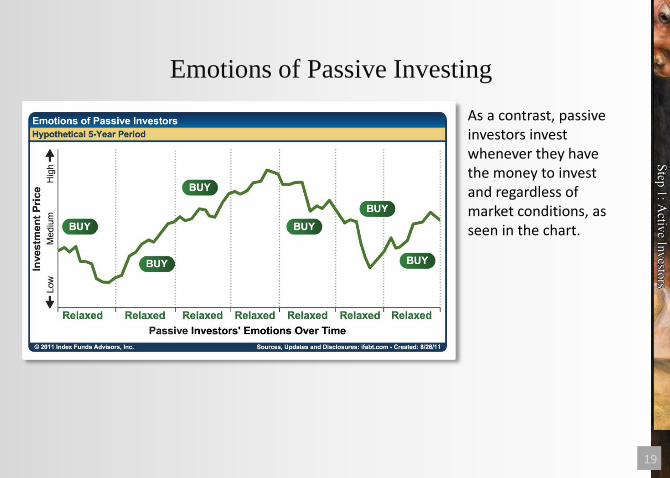
As a contrast, passive investors invest whenever they have the money to invest and regardless of market conditions, as seen in the chart.
Emotions of Passive Investing
20
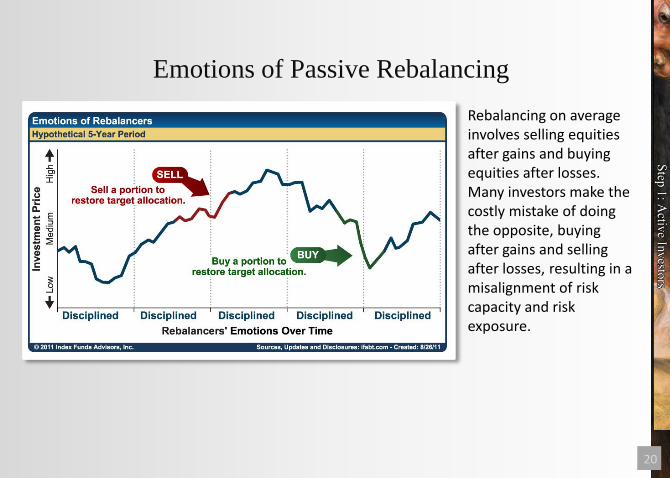
Rebalancing on average involves selling equities after gains and buying equities after losses. Many investors make the costly mistake of doing the opposite, buying after gains and selling after losses, resulting in a misalignment of risk capacity and risk exposure.
Emotions of Passive Rebalancing
21
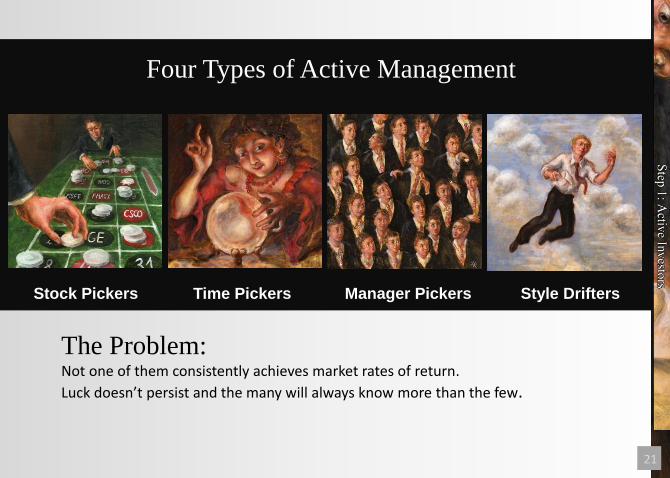
The Problem: Not one of them consistently achieves market rates of return.
Luck doesn’t persist and the many will always know more than the few.
Four Types of Active Management
Stock Pickers Time Pickers Manager Pickers Style Drifters

22
Step 2:
Nobel Laureates

23
1. Markets move randomly and are efficiently priced 2. The allocation of priced risk factors determines returns 3. Diversification reduces risk and increases returns 4. Risk exposure must be matched to risk capacity 5. Probability and statistics help investors control the risk of investing
Tenets for Proper Investing

24

25
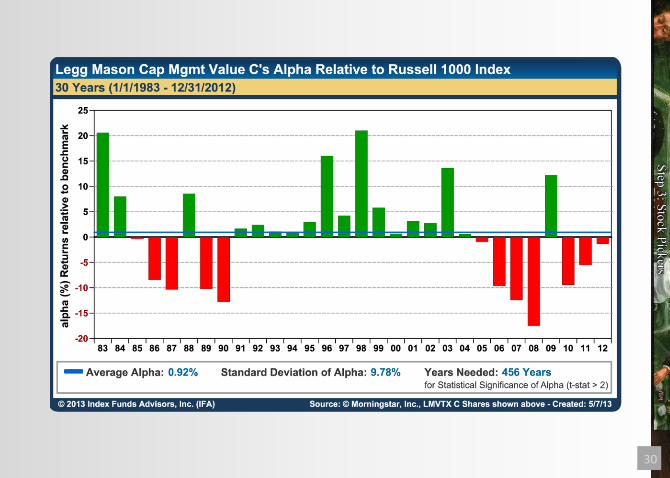
Step 3:
Stock Pickers

26
Source: The Trillion Dollar Bet
"A blindfolded monkey throwing darts at a newspaper's financial pages could select a portfolio that would do just as well as one carefully selected by the experts." Burton Malkiel, Princeton University Professor Economics, "A Random Walk Down Wall Street” 1973
“A Devastating Conclusion…
Success = Luck Rather than Skill”
27
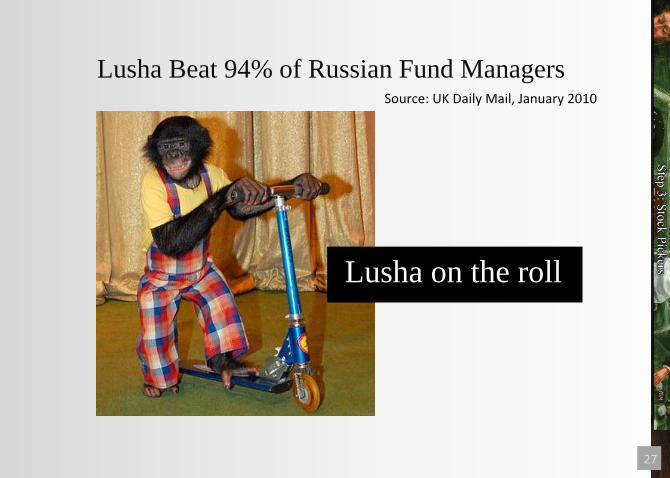
Source: UK Daily Mail, January 2010
Lusha Beat 94% of Russian Fund Managers
Lusha on the roll
28
29
30

31
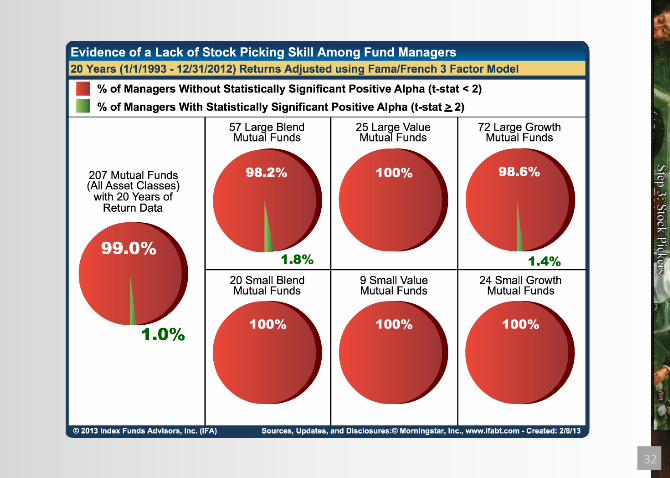
32

33

34
“Professor Wermers says his advice has evolved
significantly as a result of this study. Until now, he
says, he wouldn’t have tried to discourage a
sophisticated investor from trying to pick a mutual
fund that would outperform the market. Now, he
says, ‘it seems almost hopeless.’”
-Mark Hulbert
“The Prescient Are Few”, NY Times 7/13/08 Academic Study: Barras, Laurent, Scaillet , O. and Wermers, Russ R.,False Discoveries in Mutual Fund Performance: Measuring Luck in Estimated Alphas (September 1, 2008). Robert H. Smith School Research Paper No. RHS 06-043; Swiss Finance Institute Research Paper No. 08-18. Available at SSRN: http://ssrn.com/abstract=869748
“It Seems Almost Hopeless”

35
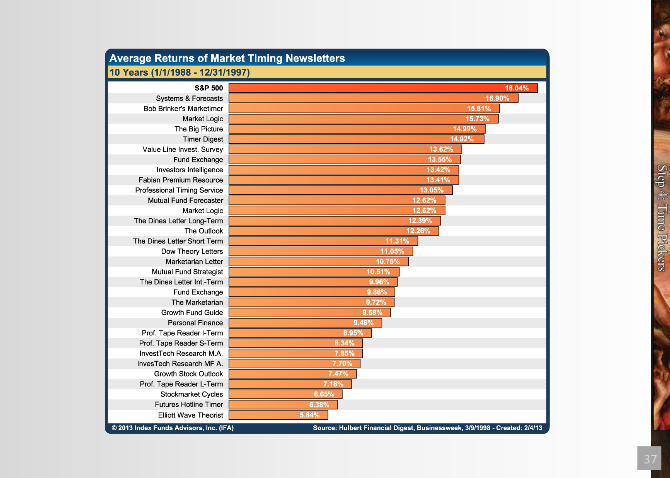
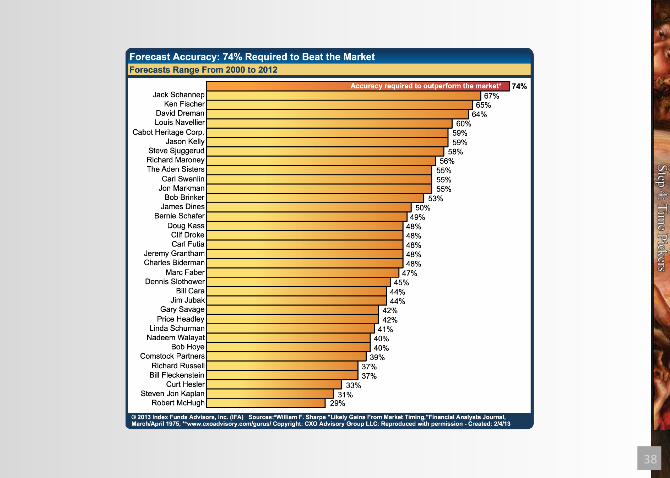
Step 4:
Time Pickers

36
37
38

39

40
Step 5:
Manager Pickers

41
42
“Wall Street’s favorite
scam is pretending that
luck is skill.”
-Ron Ross, Ph.D.
The Unbeatable Market, 2002
43
44
45
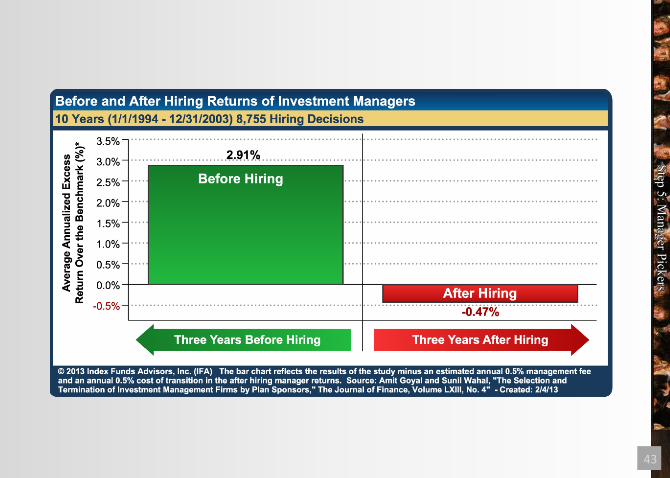
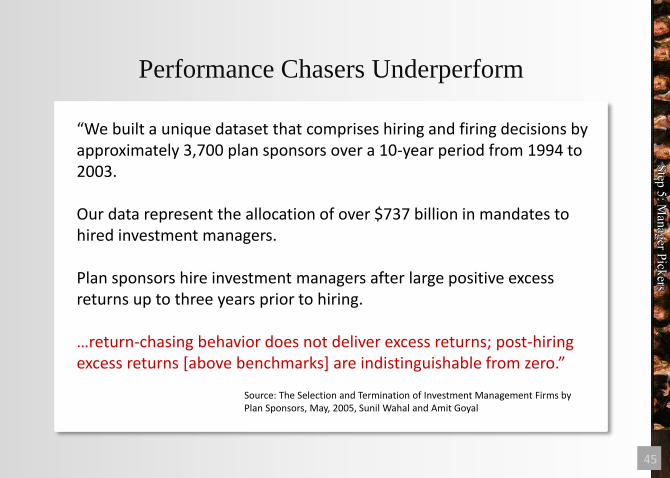
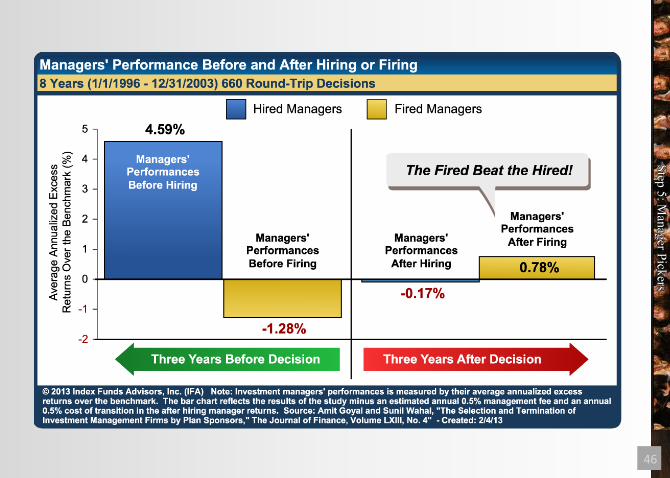
“We built a unique dataset that comprises hiring and firing decisions by approximately 3,700 plan sponsors over a 10-year period from 1994 to 2003. Our data represent the allocation of over $737 billion in mandates to hired investment managers. Plan sponsors hire investment managers after large positive excess returns up to three years prior to hiring. …return-chasing behavior does not deliver excess returns; post-hiring excess returns [above benchmarks] are indistinguishable from zero.”
Source: The Selection and Termination of Investment Management Firms by Plan Sponsors, May, 2005, Sunil Wahal and Amit Goyal
Performance Chasers Underperform
46
47
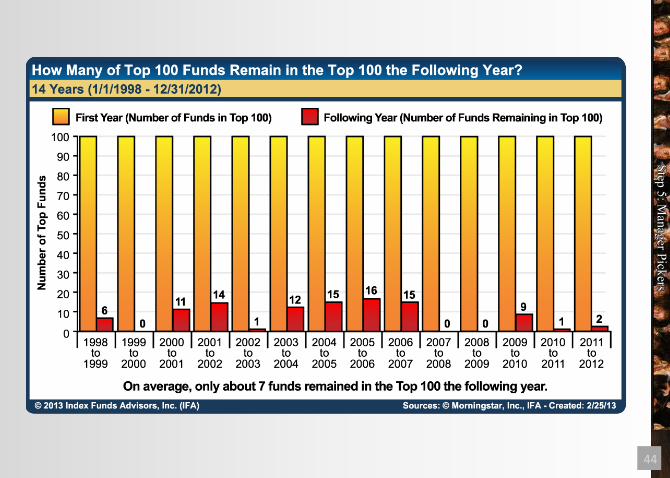
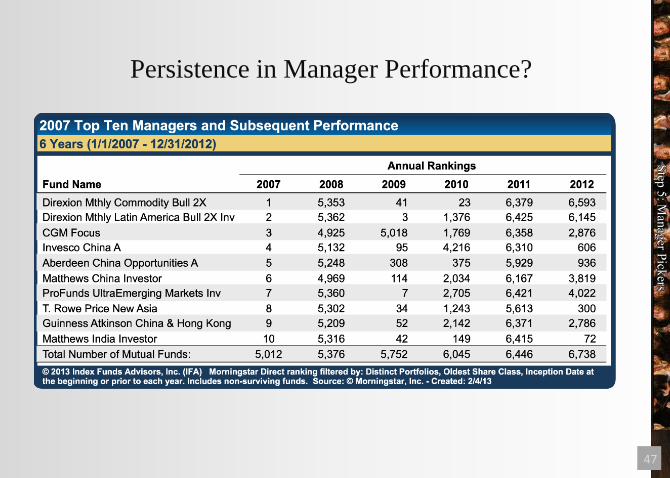
Persistence in Manager Performance?

48
Step 6:
Style Drifters
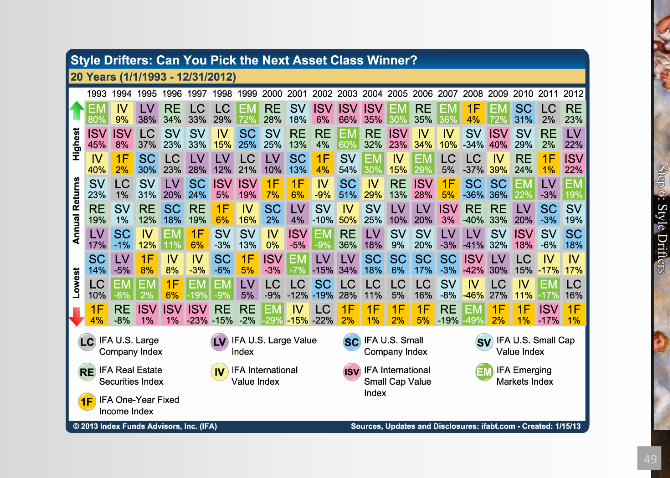
49
50

51
Step 7:
Silent Partners

52
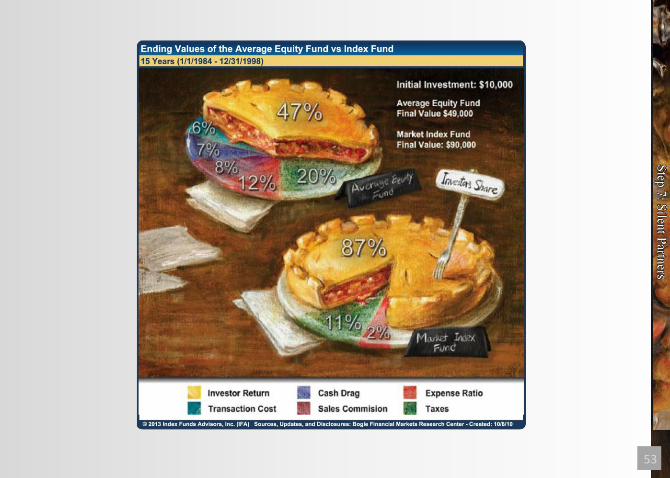
Silent Partners
• Sales agents or stockbrokers
• Fund managers
• Accountants
• Investment advisory fees
• Market makers
• Transfer agents
• Mutual fund distributors
• Brokerage firms
Numerous “Silent Partners” take bites out of your investments. These can include:
53

54
Step 8:
Riskese
55
56
57
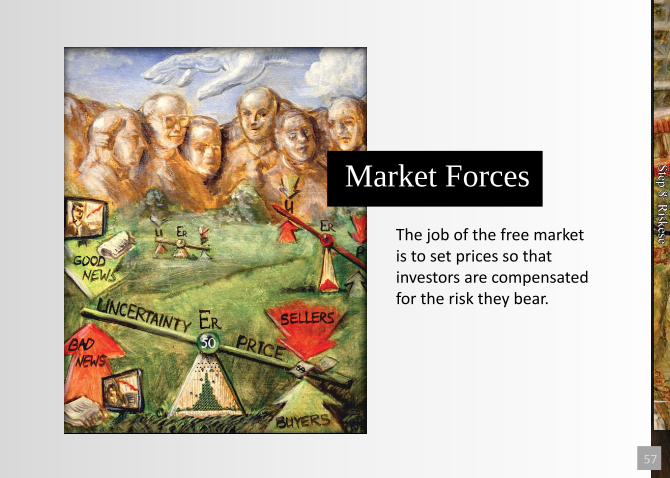
The job of the free market is to set prices so that investors are compensated for the risk they bear.
Market Forces

58
Step 9:
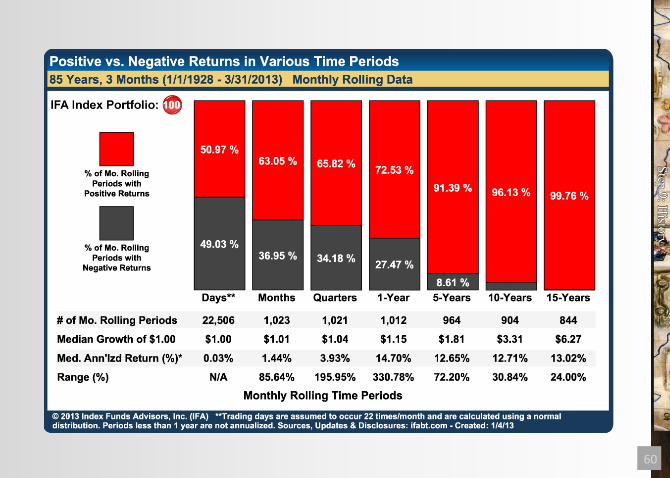
History
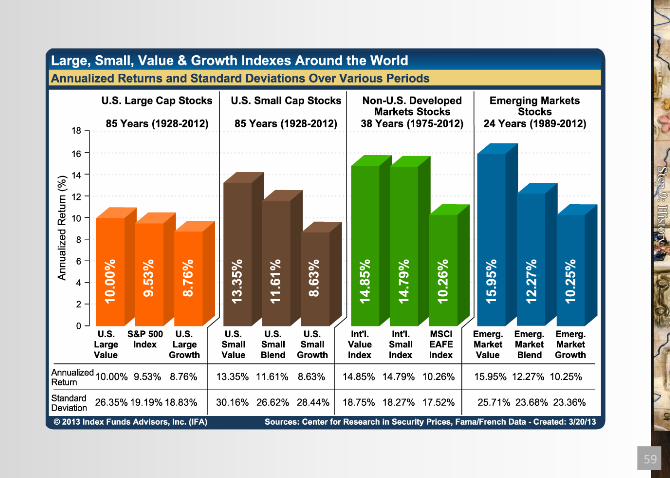
59
60

61
Step 10:
Capacity

62
The Five
Dimensions of
Risk Capacity
Time

63 Attitude Knowledge

64 Worth Income
65
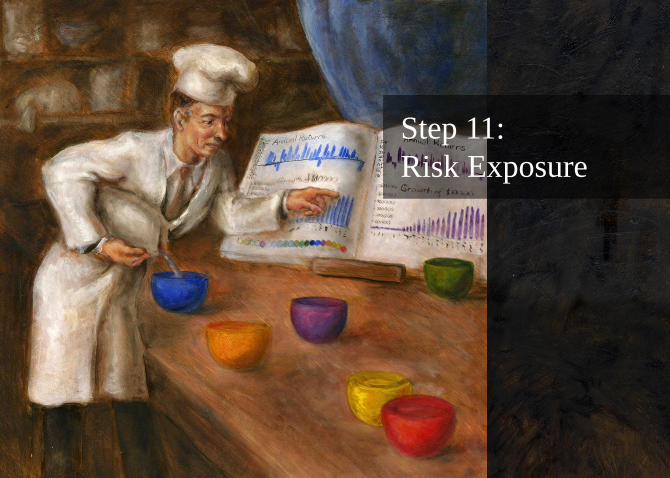
Step 11:
Risk Exposure

66
The Five
Dimensions of
Risk Factors
Market
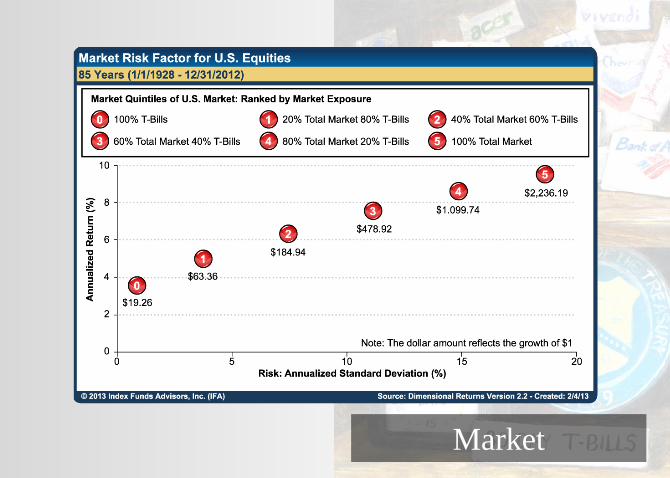
67 Market

68 Size Value
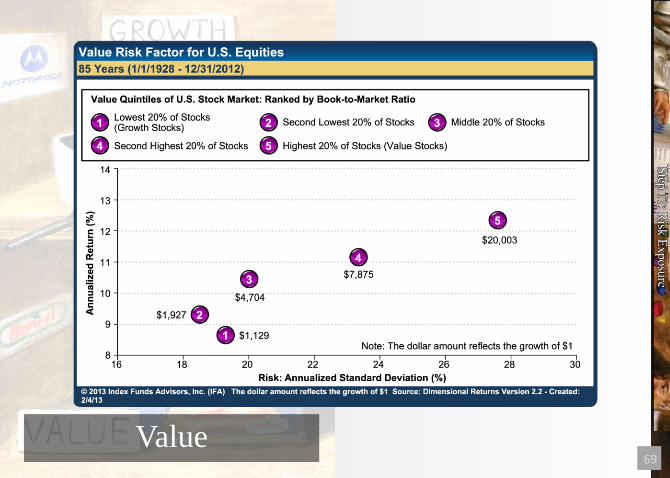
69 Value
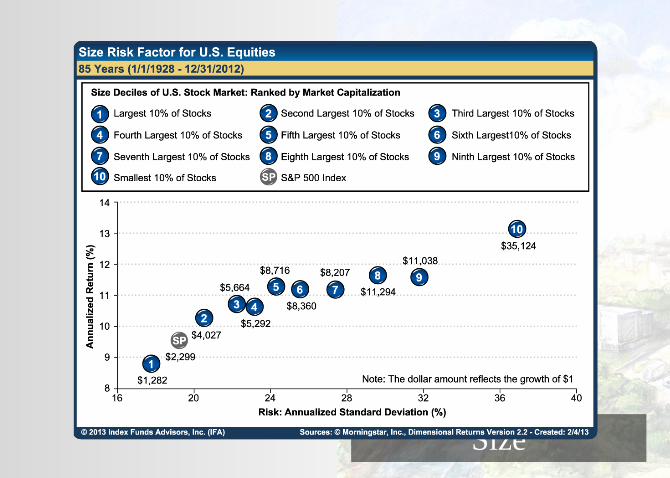
70 Size
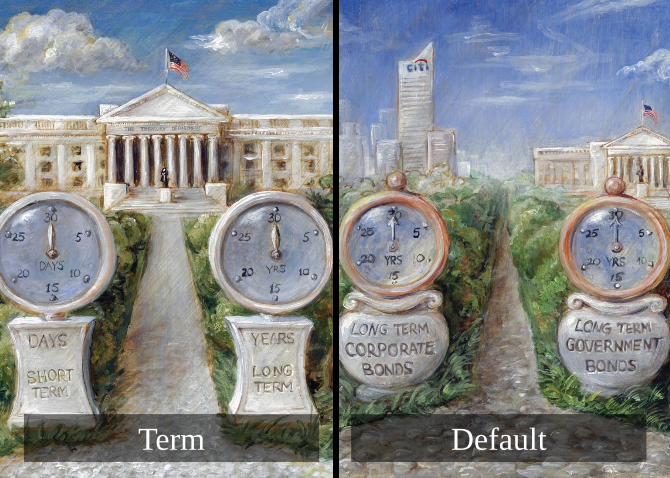
71 Default Term
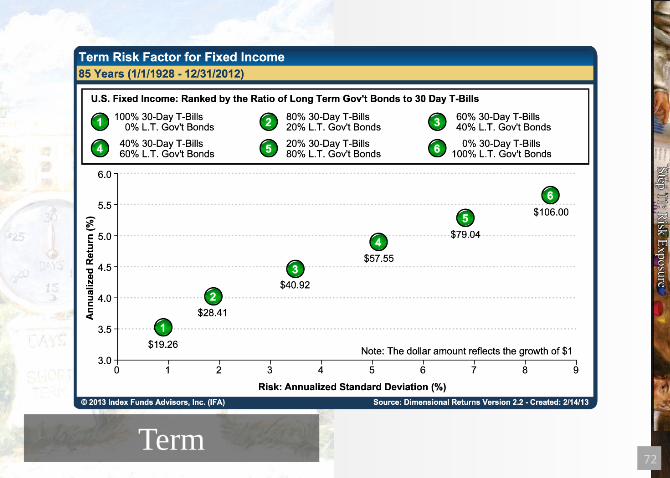
72 Term
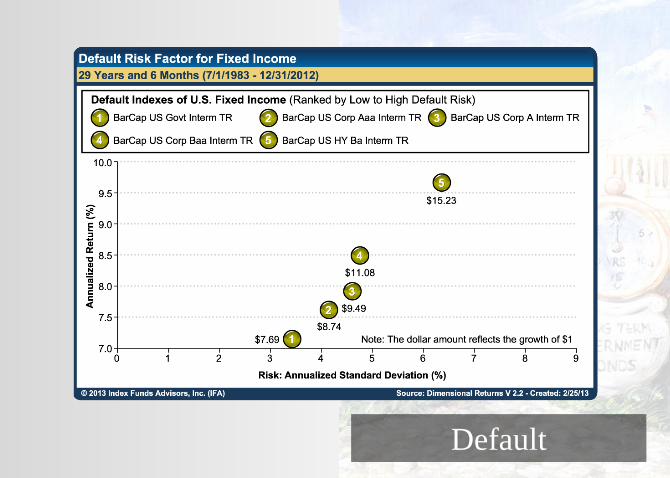
73 Default

74
Step 12:
Invest and Relax

75 Asset Location Rebalancing

76
Glide Path Strategy Tax Loss Harvesting

77
78
Corporate Headquarters
19200 Von Karman Avenue,
Suite 150
Irvine, CA 92612-8502
Toll Free: 888-643-3133
Phone: 949-502-0050
Fax: 949-502-0048
IFA.com
IFA.tv
IFA401k.com
IFAsustainable.com
IFAfaithbased.com
IFAcollegesavings.com
Index Fund Advisors, Inc. For more information: