12- turbomachinery performance testing
TRANSCRIPT

12
Turbomachinery PerformanceTesting
Nathan G. Adams
The Boeing Company, Mesa, Arizona, U.S.A.
AERODYNAMIC PERFORMANCE TESTING
Chapter Objective
Gas turbine propulsion system development traditionally proceeds fromdesign conceptualization to analysis to individual component/stage perfor-mance testing before the complete engine is assembled and run. Theobjective of this chapter is to introduce methodologies, techniques, andsuggested procedures for turbomachinery component aerodynamic perfor-mance testing. Turbomachinery component testing reduces design anddevelopment risks while verifying engineering analysis and performanceestimates. Inlets, fans, compressors, combustors, turbines, and exhaustnozzle components are all traditionally tested individually as part of the gasturbine development process. Even after an engine has been assembled andtested, component tests are often used to support performance improve-ments and diagnostic testing.
Materials presented in this chapter are focused on fan, compressor,and turbine-stage aerodynamic performance testing. The component of
Copyright © 2003 Marcel Dekker, Inc.

interest may be a single rotor and stator assembly or a combination ofseveral individual rotor/stator vane blade rows operating together as, forexample, a multistage axial compressor. Fundamental test concepts that areused to quantify individual turbomachinery stage performance character-istics are presented. Test concepts described are essentially applicable to fan,compressor, and turbine stages. Newcomers to the turbomachinery test fieldwill find this chapter useful in developing an understanding for what isrequired to plan for and conduct a successful test activity.
Chapter Outline
The intent of this chapter is not that of presenting all possible test andmeasurement techniques that are used throughout the industry and atresearch laboratories, nor is it to recommend or specify any particulartesting approach. Rather, the materials presented reflect what the authorfeels to be important in the definition, planning, and conductingturbomachinery test activities.
The first section discusses turbomachine component performancetesting and the impact of different system operational characteristics onperformance. The second section presents test methodologies, the third testhardware, and the fourth instrumentation design considerations. Testprocedures and data presentation considerations are presented in the lasttwo sections.
Turbomachinery mechanical test procedures and requirements are notcovered in this chapter. However, this does not diminish the importance ofmechanical testing to verify vibration, stress, and fatigue life characteristicsin the development of gas turbine equipment.
Component Performance Testing
The validity and applicability of individual turbomachinery componentperformance testing are based on the premise that actual engine environ-mental conditions are accurately simulated with the test rig. With anaccurate simulation, component performance measured with the test rig willbe equivalent to that of the same component operating in the gas turbineengine.
Gas turbine cycle analyses traditionally utilize performance maps indescribing the steady-state aerothermodynamic performance characteristicsof each turbomachine component over its complete operating range. Theprincipal objective of individual component testing is to define the respectivecomponent performance maps. Sufficient test rig instrumentation must beutilized to accurately measure and compute stage performance character-
Copyright © 2003 Marcel Dekker, Inc.

istics. The more accurate the performance maps, the more accurate will bethe overall gas turbine cycle performance predictions. In addition,instrumentation is also often included on the test rig for flow diagnosticevaluation of the individual blade rows and localized areas of interest.
For steady-state operation (engine and flight operating conditionschanging very slowly with time), the component maps describe severalperformance features. Typical compressor and turbine maps are shown inFigs. 1 and 2. Performance maps are characterized with stage total pressureratios plotted as a function of corrected flow rate at different correctedrotational speeds. As seen, each speed line has a distinctive locus ofperformance data. Also included on performance maps are constantefficiency islands as is shown in Fig. 1. See the final section for a definitionof corrected flow parameters.
Compressor and fan maps also include a stall line. The stall lineidentifies the locus of unstable operating conditions with stable operation tothe right of the stall line. The operating regions that include choked flowthrough the blade passages are recognized by the vertical speed lineperformance characteristics. Referring to the performance map examples, wesee a weak dependence of turbine performance on wheel speed, contrastedwith a relatively strong dependence shown by compressors and fans.
Each turbomachine component performance map is associated with aspecific configuration and flow-path geometry. Blading differences, flow-path geometric changes, running tip clearance changes, different gaps,
Figure 1 Typical compressor map.
Copyright © 2003 Marcel Dekker, Inc.

cracks, and seals, and leakage flow rates throughout the stage flow path canimpact overall performance. Separate performance maps are normallyrequired for each geometric configuration. Often performance scalars aredefined to quantify stage performance differences due to small geometricvariations.
Normally, full-scale component test rigs are used to experimentallydefine performance maps. Meaningful performance measurements are madewhen actual flow paths, blading, and rotor speeds are faithfully reproduced.In addition, inlet and outlet velocities, pressures, and temperaturedistributions must also simulate accurately those in the gas turbine engineinstallation. Specialized hardware and instrumentation are also used tosupport design development and diagnostic testing.
Operational Characteristics’ Impact on Performance
It is important to recognize that specific performance numbers defined bycomponent maps are dependent on several different stage operationalcharacteristics. These include nonuniform inlet flows, commonly referred toas inlet distortion, Reynolds number effects, changes in gas thermodynamicproperties, and transient operations. There is no generalized methodology toaccount for the impact of these characteristics on steady-state performance.For a given stage, different operational characteristics can result in differentperformance maps.
Figure 2 Typical turbine map.
Copyright © 2003 Marcel Dekker, Inc.

Inlet Distortion
Most turbomachinery stages are designed assuming uniform pressure,temperature, and velocity profiles at the stage inlet plane. However,integration of the individual stages into the gas turbine engine and itsresultant installation into the vehicle of interest often leads to nonuniforminlet flow characteristics. In particular, fan and compressor stages, due totheir close proximity to the inlet, are typically subjected to distorted inletflows. Inlet flow distortion includes both steady-state and time-variant totalpressures, static pressures, swirl, and total temperatures at the stage inletplane.
Nonuniform fan and compressor inlet flows can be generated fromseveral different sources. Typical sources include extreme vehicle maneuver-ing and the resultant flow separation from the inlet lip, inlet duct boundarylayers and separated flows, hot-gas ingestion during armament firing,shock–boundary-layer interactions, and ‘‘S-shaped’’ ducts that result inlocal flow curvature. Nonuniform inlet conditions can lead to bothcircumferential and radial distortion characteristics.
Usually inlet disturbances are attenuated in both magnitude andspatial extent as they pass through a turbomachine stage. Test rig inletdistortion testing often includes special instrumentation at the stage exit tomeasure exit plane flow distortion characteristics.
The effects of inlet distortion are generally detrimental to turboma-chinery performance. Direct effects include a degradation of total stagepressure rise, flow, and efficiency. In addition, there is often a decrease install margin, resulting in a reduced range of stable operation.
Typically, stage performance with inlet distortion is determinedexperimentally as part of the test program. For these tests, inlet flowdistortion characteristics are simulated in the test rig. As an example, totalpressure distortion patterns are typically generated with wire mesh screensmounted in the upstream flow path. The shape and solidity of the patternsare tailored to generate specific total pressure profiles. Vehicle inlet totalpressure surveys can be used to define the desired total pressure profiles.Reference [1] presents the methodologies required to define wire meshpatterns that will simulate specific pressure profiles for fan and compressordistortion testing.
Figure 3 shows an example of classical wire mesh shapes that are usedfor fan and compressor total pressure inlet distortion testing. Performancemaps are generated for different inlet distortion patterns. Performancescalars, that is, ratios of flow rates, pressures, and efficiencies that relatedistorted with undistorted performance, are then calculated for each of thedistortion patterns. Methodologies to equate distortion shapes and
Copyright © 2003 Marcel Dekker, Inc.

magnitudes to stage performance characteristics are described in Ref. [2]. Inaddition, Refs. [3–8] are several of many papers that describe inlet distortioneffects on gas turbine performance.
Unsteady inlet flow properties can also be a source of unwantedmechanical excitation of stage blading and ducting hardware. Mechanicaldesign considerations must ensure that blade natural frequencies do notcoincide with those anticipated from unsteady inlet flows.
Reynolds Number
The impact of Reynolds number on performance is more often associatedwith smaller turbomachines operating at extreme altitudes where the airdensity is much less than at sea level. Under these high-altitude ambientconditions, the stage Reynolds number (based on blade chord as thecharacteristic length and mean stream fluid properties) will be much lessthan at sea level. Fans, front ends of compressor stages, and the last turbinestages are most susceptible to Reynolds number effects. For most largerengines, Reynolds number effects are minimal. An empirical rule of thumbsuggests that for stage Reynolds numbers greater than 26105, Reynoldsnumber impact on stage performance is relatively unimportant.
Blade boundary-layer behavior is a very strong function of Reynoldsnumber. In an axial compressor, for example, the smaller Reynolds numberdue to extreme altitude operation can result in a transition delay from alaminar to a turbulent boundary layer. A laminar boundary layer is morelikely to separate, which can result in blade stalling much earlier than at thehigher Reynolds numbers. Flow separation not only deteriorates local stageperformance but can also impact downstream stage performance.
For small gas turbine engines with high-altitude operating conditions,design applications normally require larger blade chords (increasedcharacteristic length) to minimize Reynolds number effects.
Figure 3 Classical distortion screen shapes.
Copyright © 2003 Marcel Dekker, Inc.

Gas Thermodynamic Properties
Turbomachinery performance is also very dependent on the working fluidgas properties, including molecular weight and specific heat ratios. Severaloperational situations that can impact gas thermodynamic propertiesinclude the reingestion of hot exhaust gases, gun gas ingestion rocketexhaust ingestion, and operations in a high-humidity environment.Performance consequences include changes in specific heat ratios that canreadily impact compressible flow properties, which include the local speed ofsound.
Transient Operations
Typical turbomachinery performance maps do not include transientoperating characteristics. Performance maps are generated assuming steadyflow conditions with the mechanical hardware in thermal equilibrium.
TEST METHODOLOGY
Testing Approach
An approach that one might follow in defining and planning for aturbomachine component test is briefly described. The first step in testplanning is that of defining the performance parameters that must bemeasured to satisfy the test objectives. Specific instrumentation required torecord performance should also be specified.
In addition, one must specify both the speed and flow ranges requiredfor the test. The engineer must select a facility that both meets geometricinterface requirements and is capable of operating over the flow and speedranges required for the performance test. Once the test facility has beenselected and the required performance data specified, the test rig designcan be accomplished. Normally, test rigs are designed using full-scalehardware with the rotor turning at the design speed and with full-scale flowrates.
However, successful testing can be accomplished with scaled test rigs.Scaling requirements include maintaining flow similarity between the fulland scaled hardware. Reynolds number, Mach number, and characteristicgeometric relationships must be maintained. The operating conditionswithin the stage must be dynamically similar, with the respective bladevelocity triangles preserved. Classical scaling parameters for turbomachin-ery blading are defined in Ref. [9].
Copyright © 2003 Marcel Dekker, Inc.

Required Performance Data
Test data required to produce turbomachine component performance mapsinclude rotational speeds, flow rates, pressure ratios, and measurements thatcan be used for component efficiency calculations. In addition, theaerodynamicist will want to know test parameters such as total pressureand temperature radial distributions, static pressures on both the hub andouter casing flow paths, dynamic measurements including running tipclearances, dynamic pressures to quantify rotor blade shocks, when present,and unsteady flow characteristics, and wake rakes to quantify pressure andtemperature profiles behind the stator assemblies.
Required Measurements
The selection of proper instrumentation is one of the most important aspectsof turbomachinery testing. The amount of instrumentation utilized on a testrig is related directly to the information and data required. A more detaileddescription of each of the measurement sensors is presented in a latersection.
Figure 4 shows a test rig cross-section schematic with typicalinstrumentation that is utilized in classical aerodynamic performancetesting. Included are radial immersion total pressure and total temperaturerakes, numerous static pressure taps, selected radial surveys and wake rakes,and dynamic response instrumentation. Not shown but of equal importanceare flow rate and speed measurements, in addition to ambient test conditionmeasurements. Stage performance is defined from total pressure, tempera-ture, flow rate, and shaft speed measurements. The total or stagnation stateof the fluid is defined as that state that would be achieved if the fluid were
Figure 4 Test rig instrumentation setup.
Copyright © 2003 Marcel Dekker, Inc.
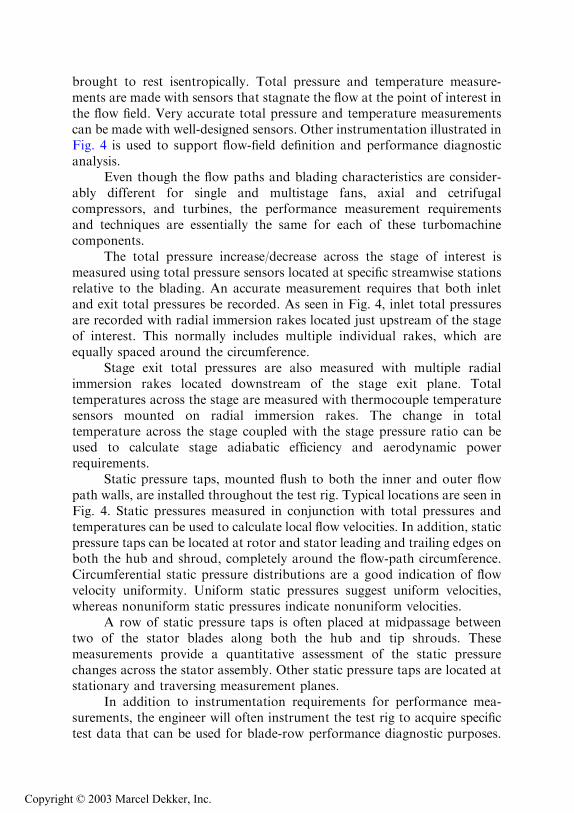
brought to rest isentropically. Total pressure and temperature measure-ments are made with sensors that stagnate the flow at the point of interest inthe flow field. Very accurate total pressure and temperature measurementscan be made with well-designed sensors. Other instrumentation illustrated inFig. 4 is used to support flow-field definition and performance diagnosticanalysis.
Even though the flow paths and blading characteristics are consider-ably different for single and multistage fans, axial and cetrifugalcompressors, and turbines, the performance measurement requirementsand techniques are essentially the same for each of these turbomachinecomponents.
The total pressure increase/decrease across the stage of interest ismeasured using total pressure sensors located at specific streamwise stationsrelative to the blading. An accurate measurement requires that both inletand exit total pressures be recorded. As seen in Fig. 4, inlet total pressuresare recorded with radial immersion rakes located just upstream of the stageof interest. This normally includes multiple individual rakes, which areequally spaced around the circumference.
Stage exit total pressures are also measured with multiple radialimmersion rakes located downstream of the stage exit plane. Totaltemperatures across the stage are measured with thermocouple temperaturesensors mounted on radial immersion rakes. The change in totaltemperature across the stage coupled with the stage pressure ratio can beused to calculate stage adiabatic efficiency and aerodynamic powerrequirements.
Static pressure taps, mounted flush to both the inner and outer flowpath walls, are installed throughout the test rig. Typical locations are seen inFig. 4. Static pressures measured in conjunction with total pressures andtemperatures can be used to calculate local flow velocities. In addition, staticpressure taps can be located at rotor and stator leading and trailing edges onboth the hub and shroud, completely around the flow-path circumference.Circumferential static pressure distributions are a good indication of flowvelocity uniformity. Uniform static pressures suggest uniform velocities,whereas nonuniform static pressures indicate nonuniform velocities.
A row of static pressure taps is often placed at midpassage betweentwo of the stator blades along both the hub and tip shrouds. Thesemeasurements provide a quantitative assessment of the static pressurechanges across the stator assembly. Other static pressure taps are located atstationary and traversing measurement planes.
In addition to instrumentation requirements for performance mea-surements, the engineer will often instrument the test rig to acquire specifictest data that can be used for blade-row performance diagnostic purposes.
Copyright © 2003 Marcel Dekker, Inc.

These measurements include radial surveys directly behind the rotor, wakerake measurements behind fixed blades and struts, boundary-layer probes tomeasure profiles in the boundary layer, dynamic pressure sensors locatednear the rotor for stall/surge indications, and tip clearance probes tomeasure in real time the running blade-tip clearance.
Total pressure, temperature, and yaw (circumferential) and pitch(radial) absolute flow angles at the rotor exit plane can be measured withyaw-nulling probes, which are traversed radially across the flow path. Wakerakes consist of a series of pressure taps mounted on a fixture such that acircumferential spatial pressure distribution is measured across the flow pathat a fixed radius. Wake rakes can be mounted on radial survey mechanismsso that wake profiles can be recorded across the flow path.
High-response pressure transducers flush mounted in the vicinity ofthe rotor blade tip are used to measure unsteady static pressures on the flowduct outer casing. These data can be monitored to identify flow separationand shock waves on the rotor blade tip.
Rotor blade-tip clearance differences can impact stage performance,especially in compressors and fans. Typically, stage pressure rise andefficiency decreases with increased blade-tip–shroud clearance [10]. Test rigsusually include dynamic proximity sensors to measure rotor tip clearancesduring testing. Sensors are mounted circumferentially over the blade tips,flush to the outer flow path.
Not shown in Fig. 4 but equally important is the instrumentationrequired for flow rate and test rig speed measurements. Often a torque meteris used to measure test rig power consumption or generation.
Instrumentation also required but not discussed in this chapterincludes that required to monitor in real time the mechanical health of thetest rig and test facility during test rig operations.
Instrumentation Planning and Layout
The previous section identified the measurements required for turboma-chinery aerodynamic performance testing. In this section we discuss themethodologies for placing and locating the instrumentation on the test rig.
Total Pressure Measurements
Stage pressure ratios are calculated using averaged pressures measured fromboth the inlet and discharge total pressure rakes. An understanding of wherethe inlet and discharge total pressure rakes are located in the test rig relativeto the stage blading is important in the total system performance analysis ofgas turbine machines. Unless corrected for, the measured stage pressures
Copyright © 2003 Marcel Dekker, Inc.

include not only the pressure change across the turbomachine blading ofinterest but also the pressure losses due to flow-path ducting from the inletpressure measurement plane to the stage of interest and from the bladingexit plane to the discharge measurement station.
A careful accounting of both stage pressure ratio characteristics andflow-path total pressure losses must be made. Often flow-path duct lossesare ‘‘doubled-dipped’’ because the analyst fails to recognize that flow-pathduct losses are included in the stage performance map because of the waythe test rig was instrumented. Likewise, losses may be missed should theanalyst not include duct losses that were thought to be included, but werenot, in the stage performance map pressure characteristics.
Radial immersion rakes, similar to the rake configuration seen in Fig.5, are used to measure turbomachine stage inlet and exit pressures. Totalpressures are measured with impact or kiel sensors mounted on rakes thatare immersed into the flow path. The individual impact sensor tube axesshould be aligned parallel to the incoming flow direction. A choice must bemade by the engineer to select the number of rakes such that the flow field isadequately defined but the flow path is not blocked nor significantly alteredby the installed rakes.
A generally accepted practice is to install inlet rakes at least a ductdiameter upstream of the test stage. This separation distance minimizes flowand mechanical interactions due to the rake’s wake on the test blading, while
Figure 5 Radial immersion rake.
Copyright © 2003 Marcel Dekker, Inc.

still being sufficiently close to measure representative inlet pressures.Multiple inlet rakes are typically spaced uniformly around the ductcircumference. Typically, three to four rakes are installed for the inletmeasurement, as illustrated in Fig. 6. Provisions must be made should therebe obstacles such as structural members, struts, and cross shafting in theinlet flow path. Inlet rakes should not be installed near or directly behindthese objects.
Test-cell ambient conditions can be used as inlet flow conditions if thetest rig includes a well-designed and fabricated inlet bellmouth that iscoupled to the test stage with a ‘‘short,’’ clean, axisymmetric duct. A test rigconfigured in this manner does not require inlet rake instrumentation. Theassumption is that there are no significant sources of pressure loss throughthe bellmouth and ducting into the test rig and that the bellmouth inlet flowis uniform. Uniform inlet flow can be assumed if the bellmouth lip is locatedat least one diameter above the test cell floor and one diameter away fromany obstructions in front of the bellmouth. In this case the ambient pressureis the test rig inlet pressure, with the ambient temperature being the inlettotal temperature.
Stage discharge total pressure radial immersion rakes are normallylocated as close as possible to the test stage exit plane. Using the trailingblade-row chord as a measure, the rakes are normally located less than achord length downstream of the trailing edge. The actual placement of therakes in the test rig may depend on many factors, including accessibility andstructure/struts in the flow path.
Figure 6 Typical inlet rake orientation.
Copyright © 2003 Marcel Dekker, Inc.

The circumferential placement of the exit rakes must be carefullyselected. The flow field immediately downstream of a stator vane blade rowis characterized by periodic blade wakes that mix out while propagatingdownstream. If the measurement rakes are placed far enough downstream,the wakes are essentially mixed and the flow is relatively uniform. Shouldthis be the case, the circumferential placement of the rakes is not critical.
For most test applications, the rakes are placed relatively close to thestage exit. Here the flow is nonuniform because of the wakes generated bythe test stage blading. Should all the sensing elements be located in wake-free flow-field regions, the integrated pressures will be high. Likewise, shouldall the sensors be located in the wake, the integrated pressures will be low. Inorder to get a more representative pressure average, the positions of theindividual rakes are indexed equally across the blade passage so that thedifferent wake flow properties are equally measured.
An example of how this might be done is illustrated in Fig. 7. Here wehave arbitrarily selected a stage exit plane that includes 11 stator bladesspaced 32.78 apart and 4 individual immersion rakes to measure the totalpressure. As seen, the four rakes have been located approximately 908 apart.Rake positioning is accomplished by indexing each rake a specificcircumferential distance from a fixed reference point such as a stator blade
Figure 7 Exit rake placement.
Copyright © 2003 Marcel Dekker, Inc.

trailing edge. For convenience, we have positioned the first rake directlybehind one of the blade trailing edges, in this case the stator blade at topdead center. Since we have chosen to use four rakes, the 32.78 blade spacingis divided into four equal segments of 8.28 each. The second rake is thenpositioned 8.28 past the trailing edge of blade number 4. Likewise, rake 3 ispositioned 16.48 past the trailing edge of blade number 7, with rake 4positioned 24.68 past blade number 9. In this manner, each discrete part ofthe nonuniform pressure flow field is measured. Should three rakes be used,each rake would be indexed across a third of the blade passage, and so onfor any number of rakes in the measurement plane.
Similar care must be exercised in determining the radial position of thesensors on the rake. Typical rakes will include between five and eightindividual pressure sensors per rake. Each sensor should be positioned at thecentroid of a constant-area ring. This is illustrated in Fig. 8. For thisexample we have specified that a five-element rake be installed in the flowfield. In order to locate the position of the individual pressure sensors on therake the flow-path area is divided into five equal area rings as seen in Fig. 8.The sensors are then located at the centroid of each equal-area ring. Byinstalling the sensors in this manner, each pressure tap ‘‘sees’’ equal-flowareas. As a result, area-averaged data reduction can be accomplished by
Figure 8 Radial sensor distribution.
Copyright © 2003 Marcel Dekker, Inc.

simply arithmetically averaging the several measurements in the measure-ment plane.
Individual pressure probes inserted into the flow path can also be usedin performance testing. These sensors are usually used in flow-path regionswhere it is impractical to install rakes, where flow-path blockage must beminimized, or at locations in the flow path where isolated measurements arerequired.
As an alternative to radial immersion rakes, two-dimensionaltraversing actuators, usually controlled by preprogrammed microproces-sors, have been developed to survey the flow path with single-elementsensors. The probe is traversed both radially and tangentially to preselectedpositions. Once the probe is in place, data are recorded before the probemoves to the next position. Measurement locations can be tailored tomaximize measurements in areas of interest (such as a wake behind a strutor blade) while minimizing measurements in areas of uniform flow.Advantages of this type of measurement system include minimizing flow-field blockage, minimizing instrumentation-induced flow disturbances, andeliminating probe-to-probe measurement variations.
Disadvantages include the amount of time required to complete a two-dimensional survey. Each measurement requires time for the probe to bepositioned and data to be recorded. In addition, a large amount of data canbe acquired that requires complicated data reduction and analysis schemes.The use of two-dimensional traversing mechanisms can also be complicatedby available real estate on the test rig. In some cases, special test hardwaremust be designed and integrated onto the test rig to accommodate thesetraversing systems.
Static Pressure Measurements
Static pressures are normally measured with flush-mounted taps located onouter and inner flow paths. Static pressures coupled with measured totalpressures can be used to calculate local flow velocities. In order to do this,static pressure taps are normally located in the same measurement plane asthe total pressure sensing elements as illustrated in Fig. 9. Typically, staticpressure taps are equally spaced around the circumference on both the innerand outer flow paths. As shown in Fig. 9, the static taps are locatedequidistant between each of the rakes. This is done so that the rakeinstallations will have minimum impact on the static pressure measure-ments.
Pitot-static pressure probes can be used to measure both total andstatic pressures at the same point in the flow field. A typical Pitot-staticprobe configuration is seen in Fig. 10. Most Pitot-static probe applications
Copyright © 2003 Marcel Dekker, Inc.

are found with inlet flow measurements where the flow is relatively uniform.Significant measurement errors will occur if the probe is not properlyaligned with the flow. In addition, the probes have relatively long sensingheads to minimize sensitivities to flow Mach numbers.
Total Temperature Measurements
Total temperature measurements are used to calculate stage adiabaticefficiencies. In addition, radial survey temperature data can be used tocalculate rotor work distributions across the flow path. Turbomachineryflow-field total temperatures are recorded using thermocouple sensors,
Figure 9 Immersion rake–static pressure tap positioning.
Figure 10 Pitot-static tube configuration.
Copyright © 2003 Marcel Dekker, Inc.

usually mounted in radial immersion rakes similar to the total pressurerakes discussed earlier. Often temperature and pressures sensors will beinstalled on the same rakes. Rake design considerations for total pressuresensors also apply to total temperature sensors. Individual temperaturesensors can also be placed throughout the flow field as required and used inthe two-dimensional surveys as described earlier.
Care must be exercised in using temperature measurements tocalculate stage efficiencies for low-pressure-ratio machines. Small tempera-ture-measuring errors, including that of the thermocouple wire, can impactthe accuracy of the small temperature difference measurements across low-pressure-ratio turbomachinery. To illustrate, Fig. 11 shows the sensitivity of1, 2, and 4 8F measurement errors on stage efficiency calculations for a rangeof pressure ratios. For a fan/compressor that generates a 1.65 pressure ratio,a 1 8F temperature measurement error results in an error of approximately1% in calculated efficiency. For low-pressure ratios (<1.3), it is recom-mended that a torque meter be used to measure stage power consumptionand efficiencies, rather than calculating efficiencies from temperature risemeasurements.
Figure 11 Efficiency sensitivity.
Copyright © 2003 Marcel Dekker, Inc.

Radial Surveys
One of the principal techniques for turbomachine performance diagnosticsis the radial survey. This measurement technique is normally used at blade-row exit planes, in particular behind rotor blades. Using an actuator, asingle probe is traversed radially across the flow path. The radial survey canbe used where there is no room to mount immersion rakes, where probeblockage and flow interference must be minimized, and where the flow fieldhas nonuniform swirl. Most radial actuator mechanisms will null the sensingelement into the flow direction. Performance characteristics of individualblade rows from hub to tip can be quantified by measuring total pressures,temperatures, and flow angles as a function of radius across the flow path.These measurements can be used to calculate tangential, radial, and axial-flow angles and pressure and temperature distributions. Figure 12 showstypical measured flow angles and total pressure radial profiles behind a fanrotor. It is interesting to note that the flow-field properties are not uniformbut vary significantly from hub to tip.
An important characteristic of the radial survey is an ability to null thesensing element into the flow direction. By doing so, the local flow swirlangle is defined in the absolute reference frame. In addition, pressure- andtemperature-sensing elements on the nulled probe are aligned with the flowdirection, which typically reduces measurement errors. A well-acceptedtechnique used to null the sensing element is to include a ‘‘cobra’’ probe as
Figure 12(a) Radial pressure profile.
Copyright © 2003 Marcel Dekker, Inc.

part of the measurement probe. An illustrative cobra probe configuration isseen in Fig. 13.
Cobra probes are designed to measure flow angles in a planeperpendicular to the probe axis. The pressure-sensing elements consist oftwo tubes whose inlets are angled into the flow direction. A center tube canbe used to measure total pressures or temperatures, depending on what isrequired. The cobra probe is nulled into the flow by rotating the probearound its axis until the two outer direction-sensing pressures are balanced.Feedback control loops required for probe nulling are typically integrateddirectly into the radial survey control units. Often radial surveys areaccomplished in pairs. One probe is used to determine flow angle, which inturn is used to orient a performance probe on the second system directly intothe flow.
Test procedures using radial surveys could include a slow continuoustraverse across the flow field to identify areas of interest. The engineer canthen position the probe at radii where more detailed measurements arerequired.
Wake Rakes
Wake rakes are normally utilized to measure localized flow-field character-istics behind objects in the flow path, such as struts and stator vanes. A
Figure 12(b) Radial flow angle profile.
Copyright © 2003 Marcel Dekker, Inc.

typical wake rake configuration is seen in Fig. 14. This particular rake hasbeen designed to measure the total pressure distribution behind a fan statorblade. The rake has been sized to measure the area equivalent to a completeblade-to-blade passage width.
A typical wake rake total pressure profile measured behind a fan statoris seen in Fig. 15. As can be seen, considerable flow-field detail is available in
Figure 13 Cobra probe configuration.
Figure 14 Wake rake configuration.
Copyright © 2003 Marcel Dekker, Inc.

this measurement. In addition, the profiles can be integrated to give veryaccurate flow-field properties at the measurement plane.
Rotor Wheel Speeds
Test rig rotor stage rotational speeds must be accurately determined at eachoperating point during the test. Rotational speed can be measured with amagnetic pulse generator or a photoelectric sensor in conjunction with ageared tooth mounted on the drive shaft. Data are normally transmitted to afrequency counter calibrated to read rpm directly.
Torque Measurements
A torque meter can be used to measure the power required to drive the testrig or, in the case of a turbine rig, the power generated. Included in thetorque meter measurement are both stage aerodynamic power and themechanical power required to overcome drive system losses from bearingsand windage. The power utilization due to aerodynamic work must beseparated from the mechanical power losses for accurate performancemeasurements. The torque meter typically includes a calibrated strain gaugeelement bonded to the drive shaft. The measured torque and shaft rotationalspeed are used to calculate power.
Figure 15 Wake rake total pressure profile.
Copyright © 2003 Marcel Dekker, Inc.

Mass Flow Rate Measurements
Accurate test rig flow measurements are required in the generation ofperformance maps. Flow rates are normally measured with hardware that iseither a part of or installed directly into the flow path. This includes inletbellmouths, venturi meters, flow nozzles, and square-edged orifice plates.Flow measurements are typically made either well upstream or downstreamof the test hardware where fluid properties are relatively uniform. Pressuremeasurements coupled with known geometric parameters and calibrationflow coefficients are used to calculate resultant flow rates.
Another technique that can be used to calculate flow rates is tointegrate radial total pressure profiles across the flow path. These datacoupled with wall static pressures and temperature measurements are usedto calculate flow rates.
Fan test rigs that split the flow into core and bypass require additionalflow measurements so that bypass ratios can be accurately calculated.Typically the total inlet flow and either the core or bypass flows aremeasured. Additional flow rate measurements are required for bleed flowsand turbine cooling air-flow measurements.
Dynamic Measurements
Even though turbomachine performance testing is accomplished duringsteady-state operating conditions, rotor blade running tip clearance andunsteady static pressure at the rotor blade tips are usually monitoredthroughout the test.
Rotor blade-tip clearances can impact stage efficiencies, especially incompressors and fans. Test rigs normally include dynamic proximity sensorsto measure rotor tip clearances in real time during rig testing. Sensors aretypically mounted circumferentially over the blade tips, flush to the outerflow path.
Unsteady pressure measurements can be used to determine when therotor is getting near a stall operating condition. Typical high-responsepressure transducer output traces are seen in Figs. 16 and 17. Here we seethe blade passage static pressure rise from the suction to the pressure side ofthe rotor as it passes beneath the pressure transducer. These data can beused to monitor rotor blade flow quality. The periodic, smooth, uniformpressure rise characteristic as seen in Fig. 16 implies the absence of flowseparation in the blade passage. On the other hand, the nonuniform,‘‘ragged’’ pressure rise characteristics as seen in Fig. 17 show blade passageflow separation and unsteadiness. The flattened portion of the pressure traceis an indication of separated flow. The apparent random pressurefluctuations are indicative of unsteady flows incident on the rotor. Some
Copyright © 2003 Marcel Dekker, Inc.

localized flow fluctuations are generated by the presence of rotating stallcells in the rotor blading.
Figure 16 Blade-tip pressure traces.
Figure 17 Blade-tip unsteady pressure traces.
Copyright © 2003 Marcel Dekker, Inc.

Ambient Conditions
In addition to test rig instrumentation and measurements, an accuratemeasurement of the local ambient conditions must be made during the testactivity. These measurements include barometric pressure, ambient tem-perature, relative humidity, and wind speed and direction if testing isaccomplished outside in an unprotected area. If the test rig is installed insidea closed test cell, test-cell static pressure should be recorded.
TEST HARDWARE
Test hardware, commonly referred to as ‘‘test rigs,’’ is designed to simulateflow and operating conditions found in the turbomachine stage of interest.Great care must be taken to duplicate the flow path and blading as close aspossible to the stage that is being simulated. Test rigs are normally designedso that a complete range of performance data can be measured. This impliesthat the rotor blade speeds be variable and that the stage pressure ratios becontrolled with a type of flow resistance such as a throttle valve.
The test facility must have the power capacity and speed range tooperate the test rig over the operating conditions required for performancetesting. In addition, the test hardware must be designed to accommodate theinstrumentation required for the test activity. Test stage flow propertiesmust be duplicated as closely as possible to those of the component ofinterest in the gas turbine.
A schematic of a typical test rig for fan and compressor test activities isseen in Fig. 18. Test rig components include a variable-speed drive system,inlet and discharge ducting, a control valve, flow-measuring hardware, andthe test stage of interest.
Normally an aerodynamically contoured bellmouth is used for the testrig air inlet. The bellmouth shape should have a large radius to minimizelocalized high-velocity areas and to produce a uniform inlet flow. Thebellmouth can also be used as an accurate flow-measuring device. Otherflow-measuring devices typically used in rig testing are venturi meters, flownozzles, and sharp-edge orifice plates. Flow-measuring devices must be sizedfor given flow ranges to ensure that measurement accuracies are maintained.Because of the broad range of air flows required for most performancetesting, it is often necessary to change the size of the flow-measuring deviceso that it will be operating at its most sensitive flow range for that part of thetest.
Some test rigs include an inlet plenum chamber upstream of the test riginlet plane. The chamber is normally several diameters larger than the flow
Copyright © 2003 Marcel Dekker, Inc.
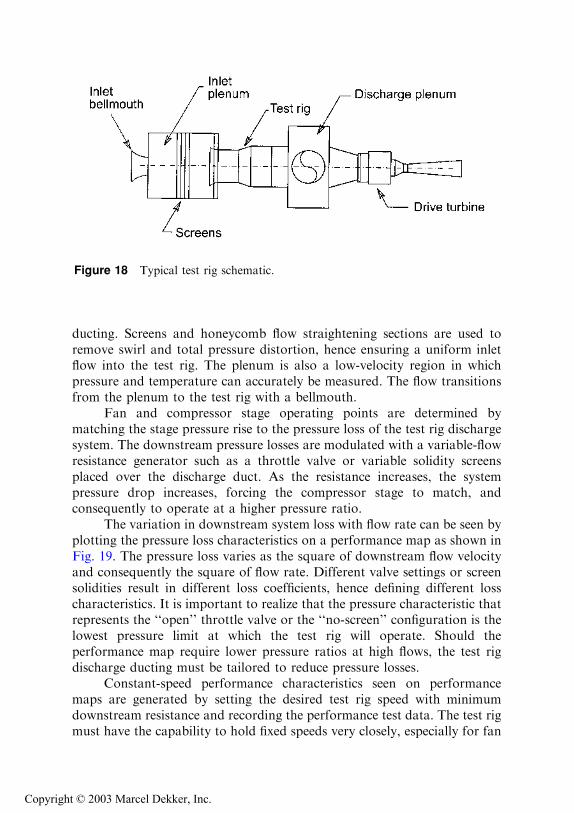
ducting. Screens and honeycomb flow straightening sections are used toremove swirl and total pressure distortion, hence ensuring a uniform inletflow into the test rig. The plenum is also a low-velocity region in whichpressure and temperature can accurately be measured. The flow transitionsfrom the plenum to the test rig with a bellmouth.
Fan and compressor stage operating points are determined bymatching the stage pressure rise to the pressure loss of the test rig dischargesystem. The downstream pressure losses are modulated with a variable-flowresistance generator such as a throttle valve or variable solidity screensplaced over the discharge duct. As the resistance increases, the systempressure drop increases, forcing the compressor stage to match, andconsequently to operate at a higher pressure ratio.
The variation in downstream system loss with flow rate can be seen byplotting the pressure loss characteristics on a performance map as shown inFig. 19. The pressure loss varies as the square of downstream flow velocityand consequently the square of flow rate. Different valve settings or screensolidities result in different loss coefficients, hence defining different losscharacteristics. It is important to realize that the pressure characteristic thatrepresents the ‘‘open’’ throttle valve or the ‘‘no-screen’’ configuration is thelowest pressure limit at which the test rig will operate. Should theperformance map require lower pressure ratios at high flows, the test rigdischarge ducting must be tailored to reduce pressure losses.
Constant-speed performance characteristics seen on performancemaps are generated by setting the desired test rig speed with minimumdownstream resistance and recording the performance test data. The test rigmust have the capability to hold fixed speeds very closely, especially for fan
Figure 18 Typical test rig schematic.
Copyright © 2003 Marcel Dekker, Inc.

and compressor rigs where the performance is so sensitive to rotor bladespeed. Downstream resistance is then increased by closing a throttle valve orpartially blocking the discharge with screens. The test stage responds bypumping at a higher pressure to match the increased downstream losses. Theperformance data are once again recorded.
This process is continuously repeated until stall or surge is detected.Safety dictates that test rigs not be operated in a surge or stall operatingcondition. The stall line is defined by recording a performance point as closeto stall as possible without stall actually occurring. At all operatingconditions, data points should not be recorded until the test rig has achievedthermal equilibrium. The complete process is repeated for different rotorblade speeds until the desired performance map has been generated.
Turbine test rigs require a high-temperature and -pressure air supplyto drive the stage. The resultant turbine power is absorbed by adynamometer coupled directly to the drive shaft. Turbine stage loading isvaried by increasing or decreasing the resistance offered by the dynam-ometer.
Figure 19 Downstream resistance.
Copyright © 2003 Marcel Dekker, Inc.
INSTRUMENTATION DESIGN CONSIDERATIONS
This section presents a brief overview of the design of instrumentationsensors utilized in gas turbine testing. Volumes of information are availableto the test engineer to support sensor selection and design.
Instrumentation Requirements
Selection of proper instrumentation is one of the most important aspects inturbomachinery component testing. Of equal importance are the design andintegration of the sensors into the test rig. Obviously, one would desireinstrumentation that does not influence or disturb the flow while recordingdata. Several test facilities are developing and using nonintrusive measure-ment techniques such as laser doppler velocimetry for turbomachinerytesting. However, most turbomachine development test programs still usepressure and temperature sensors installed on probes and rakes to measureflow-field performance properties in the test stage.
Instrumentation sensors should be designed to minimize flowdisturbances. Local stream blockage due to probes and rakes should beminimized by aerodynamically shaping the rake assemblies and probe stemsalong with the sensing end of the probe assembly. A small frontal area witha low drag coefficient is desired.
One must also consider the mechanical design of the sensing element.The assembly must be mechanically stiff so that it will not ‘‘flap in thebreeze’’ or fatigue. The probe should be designed such that its naturalfrequency does not coincide with frequencies inherent on the test rig. Often,strain gauges and even miniature accelerometers are installed on the probestems to monitor the mechanical health of the probe. Probe breakage duringtesting can have catastrophic consequences on high-speed turbomachineblading, flow ducting, and downstream instrumentation.
Rake and probe assemblies are typically installed in the test rigthrough openings in the outer flow path. Easy instrumentation accessibilityfor inspection, cleaning, and recalibration during the test activity isimportant. Individual probes must be able to pass through small openings.Normally this will be a small circular hole, often not more than a quarterinch in diameter. The hole must be large enough to allow the probe stem tomove freely but not so large that it becomes a major leak source during thetest.
Another important consideration in the design and installation ofsensing elements is its ability to be washed and cleaned during the course ofthe test. Under normal circumstances the sensing elements are clean whenflow checked and calibrated. However, during testing a considerable amount
Copyright © 2003 Marcel Dekker, Inc.

of small debris (oils, lubricants, fine dirt, sand, etc.) can impinge and attachto the sensing elements. As the material builds up, the aerodynamic andconsequently performance characteristics of the sensing elements willdeteriorate. Often sensors will become completely plugged if not periodicallycleaned.
Performance Instrumentation
Pressure Measurements
Static Pressure. Static pressure is the actual fluid pressure. It is normallymeasured by a small tap inserted perpendicular to and flush with the flowboundary. In addition, local flow stream static pressures can be measuredwith Pitot-static probes as described earlier. The preferred static pressuremeasurement technique for gas turbine testing is that of flush-mounted taps.
Typically, static pressure taps are installed in constant-area ducts awayfrom abrupt bends and area changes. A typical static pressure tapinstallation is shown in Fig. 20. The pressure taps must be drilledperpendicular to the flow boundary with the hole square-edged. In addition,great care must be exercised to ensure that the tap is burr-free [11,12]. It isgood test practice to inspect and clean the static pressure taps afterprolonged test rig operations.
Figure 20 Wall static pressure tap.
Copyright © 2003 Marcel Dekker, Inc.

Dynamic Pressure. Dynamic pressure is associated with the kinetic energyof the fluid. It cannot be measured directly but is calculated from local fluidvelocity and density properties.
Total Pressure. Total pressure, often referred to as stagnation pressure, isthe sum of both the static and dynamic pressures. It can be measured by aprobe that is at rest with respect to the test rig system boundaries. The probecan be designed such that the fluid is isentropically stagnated at the point ofinterest. An important consideration in the selection of a total pressuresensor configuration is its relative insensitivity to flow angle changes,especially if the sensor will be fixed in the flow stream.
Sensor measurement quality is quantified by its recovery factor. Therecovery factor is the ratio of measured pressure to actual pressure.Recovery factors are normally determined over the expected range of flowMach numbers and flow angles by flow testing in a calibration facility.Recovery factors are utilized in the data reduction process to correctmeasured pressure values to actual pressures.
The impact tube and kiel probe are most often used to measure totalpressures in gas turbine testing. Either sensing element can be mounted on aradial immersion rake or single element probe.
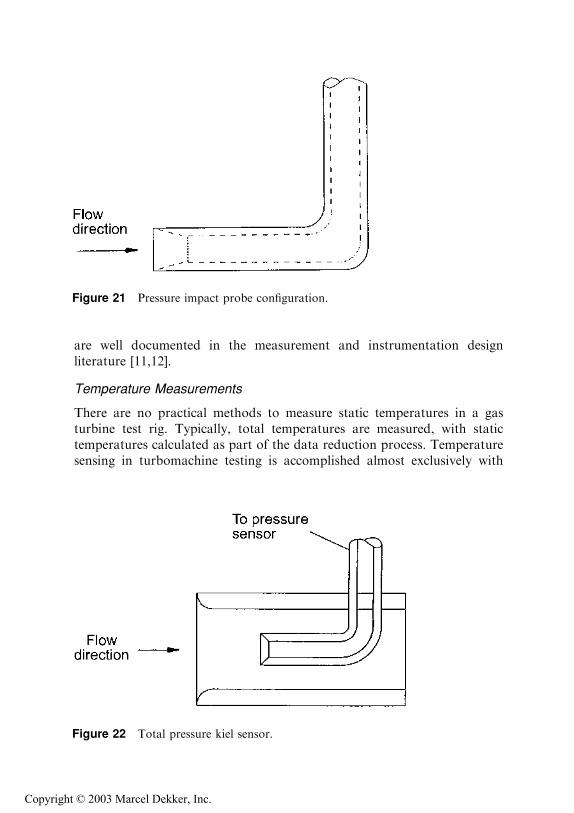
The impact total pressure sensor consists of a relatively smallcylindrical tube with its axis aligned in the flow direction. A cylindricaltube with a square leading edge can have flow angle insensitivities up to+10� in subsonic flows. Flow angle insensitivity can be increased up to 208by beveling the internal wall as seen in Fig. 21. These sensors are typicallymanufactured from stainless steel tubing and are relatively simple tofabricate. Impact sensors are often used on radial immersion rakes wherethe flow field is relatively uniform.
The cross section of a kiel pressure sensor is seen in Fig. 22. The kielprobe is insensitive to flow angles up to +45�. It is also insensitive toReynolds number effects and turbulence errors over a wide range of flowvelocities. The kiel sensor seems to be the total pressure sensor of choice forturbomachinery testing because of its extraordinary flow angle insensitiv-ities. However, it is more complicated to fabricate. Individual kiel probes arecommercially available, typically with flow and calibration characteristicsincluded.
In supersonic flows the pressure sensors do not indicate local totalpressure because of the shock wave that is formed in front of the sensingelement. The local total pressure can be calculated from the measuredpressure using normal shock pressure drop relationships.
Total pressure sensor operating characteristics and design considera-tions as well as flow calibration procedures and recovery factor calculations
Copyright © 2003 Marcel Dekker, Inc.
are well documented in the measurement and instrumentation designliterature [11,12].
Temperature Measurements
There are no practical methods to measure static temperatures in a gasturbine test rig. Typically, total temperatures are measured, with statictemperatures calculated as part of the data reduction process. Temperaturesensing in turbomachine testing is accomplished almost exclusively with
Figure 21 Pressure impact probe configuration.
Figure 22 Total pressure kiel sensor.
Copyright © 2003 Marcel Dekker, Inc.

thermocouples. With care in construction and calibration, thermocoupletemperature measurements can be made accurate to less than a degree inmeasurement error. A temperature measurement technique for a broadrange of flow velocities and flow angles is to imbed the thermocouplejunction inside a sensor configuration similar to a pressure impact tube.
The effects of thermal equilibrium must be considered in the designand use of temperature probes. Thermal energy can be transferred from themeasurement point both by heat conduction down the probe stem or rakebody and by radiation to surrounding surfaces. This reduces the sensedtemperature from the actual local total temperature. Radiation heat-transferlosses can be minimized by placing a shield over the thermocouple. Inaddition, a small vent at the rear of the probe can be used to balance theheat loss with thermal energy from the fluid by convective heat transfer.
Two principal thermocouple sensor designs are typically used inturbomachine testing. These include bare-bead thermocouples and shieldedsensor configurations. Figure 23 illustrates the basic differences between thetwo configurations. The bare-bead thermocouple sensor has a relativelysimple design and is easy to fabricate. Fast response is the primaryadvantage of this design. However, the bare-bead thermocouple is subject toradiation losses and to Mach number and Reynolds number effects. In
Figure 23 Temperature sensor configurations.
Copyright © 2003 Marcel Dekker, Inc.

addition, the sensors can be easily damaged by handling and by any foreignobject damage (FOD) that is present in the flow.
Shielded thermocouple sensors are insensitive to radiation losses andMach and Reynolds number effects. In steady-state flow conditions, theshielded thermocouple sensors provide higher recovery factors. Thesesensors are insensitive to flow angle and also provide FOD protection. Caremust be taken throughout the test activity to ensure that both the sensingtube and the aspiration vent hole do not get plugged up.
The recovery characteristics of the probe are primarily a function ofvelocity over the thermocouple junction. Shielded probes reduce free-streamvelocity, resulting in a higher recovery. Temperature recovery factors thatrelate the indicated to actual temperatures are determined by a flowcalibration process.
As with pressure measurements, temperature measurement techniquesand sensing element designs are well documented in the literature. Manysensor configurations are also available commercially at a modest cost.
Flow Angle Measurements
The local flow angle can be determined either by nulling a sensor into theflow and recording the resulting angle or by using fixed sensors. The fixedsensors have installed on the sensing head a series of pressure elements thathave fixed geometric relationships to each other. The most sensitive designwill generate a large pressure gradient between two points on the probe forvery small flow angle differences.
Two-dimensional probes are used to measure flow angles in onedirection only. Typical two-dimensional sensors include three-claw, three-hole, wedge, and cobra probes. These configurations are illustrated in Fig.24.
Three-dimensional probes are used to measure both yaw and pitchangles. These sensors include five-claw, four-hole, spherical, and pyramidprobes. A typical pyramid probe configuration is seen in Fig. 25. The three-dimensional probes are not only used to measure flow angles but can alsosense total and static pressures. This is accomplished by using a series offlow calibrations where each of the individual sensor pressures is recorded asa function of fixed yaw and pitch angle for a range of flow Mach numbers.References [13] and [14] present both design criteria and the requiredcalibration techniques and resultant data reduction processes to process thedata from three-dimensional flow angle probes. Numerous flow directionprobe configurations are available commercially. These sensors are typicallyflow checked and calibrated by the manufacturer.
Copyright © 2003 Marcel Dekker, Inc.

Figure 24 Typical two-dimensional flow direction sensors.
Figure 25 Pyramid probe configuration.
Copyright © 2003 Marcel Dekker, Inc.
TEST PROCEDURES AND DATA COLLECTION
While preparing for a test program there are several recommended pretestactivities that should be accomplished to help ensure a successful testprogram. Many times testing has been accomplished only to find out afterthe fact that critical instrumentation was not functioning or data were notrecorded properly. Troubleshooting instrumentation and measurementproblems and errors during the test can impact cost and schedules. Thefollowing, which is by no means comprehensive, includes several recom-mended activities that should be performed to minimize measurementproblems during the test activity.
Pretest
Prior to test rig installation into the test cell, a careful inspection of thehardware should be made. During the inspection, the following types ofquestions should be addressed: Are the flow ducts properly aligned to avoidsteps in the flow path? Are the flow-path ducts free from oil and debris? Arethe measurement sensors facing into the flow direction? Are the sensors freefrom machining burrs, dirt, and grime? Have protective caps been removedfrom the sensors? Are the lines running from the individual sensors labeledproperly so that they will be hooked up to the correct data channels? Dosurvey actuators fit and traverse without obstructions? Are sensors that arelocated over the rotor blade row flush-mounted so that they will not getclipped by the rotor blade during testing? Has each of the instrumentationsensors been flow checked to ensure that calibration tolerances are satisfied?
Daily Before Testing
Simple checkout procedures before each day’s testing can also minimizeinstrumentation problems. Before testing starts, it is recommended that thetest rig be leak checked. This can be done by sealing and pressurizing the testrig slightly above ambient. Once the test rig is pressurized, several data scanscan be recorded. Pressure data channels with readings less than rig pressureindicate that a leak may be present. Sources of leaks can include poorconnections and broken lines.
A second recommended check is a ‘‘zero-data scan’’ to record ambienttemperatures and pressures of all measurements prior to the start of testing.This is one of the best instrumentation diagnostics that can be performed.During the data scan all readings should indicate ambient conditions. Whenindividual sensors do not read ambient values, it is a good indication thatthere is a potential problem with that sensor and/or data channel.
Copyright © 2003 Marcel Dekker, Inc.

Thermocouple lead wires should be inspected periodically. Improperlywired or damaged thermocouple circuits can result in temperatures beingsensed outside the test rig instead of at the instrument sensor. A good checkfor thermocouple operation is to immerse temperature rakes and probes in ahot bath. Any thermocouple channel that reads less than the bathtemperature should be checked out for potential problems.
During Testing
Several simple things can be done throughout the test to minimizemeasurement errors and questions about the test data. These include askingquestions like: Are the temperature reference junctions at the righttemperature? If an ice bath is being used, is ice in the bath? If at allpossible, reference pressures and temperatures should be monitoredthroughout the test to ensure high data quality. The test engineer shouldhave a good feel before the test starts for the magnitudes of the several dataparameters being recorded. Unexpected data values can indicate malfunc-tioning and deteriorated instrumentation performance. This can trigger aquick check of the instrumentation systems before testing continues.
Test Procedures
The ultimate goal of performance testing is to record performance data.Performance map speed lines are acquired by setting the rotor speed atdifferent fixed rpm values. Since testing is normally accomplished atdifferent times and ambient air temperatures, the physical speed is set usingthe corrected speed relationship. This is determined by multiplying thedesired rig speed by the square root of the actual to reference temperatureratio. The next section discusses corrected speed calculations.
Time should be allowed for the test rig to achieve thermal equilibriumbefore performance data are acquired. Hardware expansion due to thermalgradients and blade growth due to centrifugal forces occur as differentoperating conditions are set. Equilibrium is often determined by monitoringa small group of select thermocouple readings. Once all readings have‘‘leveled out’’ to a predetermined setting (e.g., less than 1 8F change perminute), the data can be recorded. It is recommended that at least two andpreferably three or four continuous data scans be recorded at each operatingpoint. Once the data scans have been recorded, the throttling device canthen be activated to modulate the downstream resistance pressure to set anew performance point. Once the new operating condition is set, time mustonce again be allowed for the test rig to achieve thermal equilibrium beforethe data point is recorded.
Copyright © 2003 Marcel Dekker, Inc.

This procedure is repeated while moving up the speed line until stall orsurge is encountered. It is strongly recommended that the test rig not beoperated knowingly in stall and surge. Monitoring dynamic pressures overthe rotor blade tip can give a good indication of an impending stall/surge. Atest rig fan or compressor stage in surge can experience violent flowfluctuations and high mechanical vibrations and loads. Test hardware hasbeen known to break during hard surges and during continuous operationin stall.
The stall condition at each speed line is determined by operating thetest rig as close to stall as possible without the machine actually stallingduring the data acquisition process.
DATA PRESENTATION
Data Reduction and Analysis
Following the test activity, a large amount of time and effort is oftenexpended in reducing and analyzing test measurements. Included in thisprocess is the conversion of measured/recorded data to test data inengineering units. This is normally accomplished using pre- and posttestcalibrations combined with data acquisition system sensitivity ranges. Oncethe data are in engineering units, data ‘‘calculations and manipulations’’ areaccomplished for analysis and presentation.
Calculations that are normally performed include mass flow rates,rotor speeds, measurement plane average pressures and temperatures, andstage efficiencies. Once the absolute performance parameters are calculated,corrected values and data required for performance map generation areproduced.
Flow rates and rotor speeds are corrected to a reference set ofoperating conditions. Using corrected parameters, performance test datarecorded at different ambient pressure and temperature operating condi-tions can be compared on the same performance map. Typically, referenceoperating conditions are ambient pressure and temperature for a standardday at sea level (59 8F, 14.696 psia). The data correction factors arenondimensional pressure and temperature ratios. These ratios are calculatedby dividing the measured absolute stage inlet total pressure with thereference pressure and stage inlet absolute total temperature with theabsolute reference temperature [15].
Copyright © 2003 Marcel Dekker, Inc.

Corrected Flow
The flow rates used for performance map presentation are corrected usingthe following expressions:
_mmcorr ¼ _mmffiffiffiy
p
d
y ¼ TT in
Trefd ¼ PT in
Pref
where _mm is the measured flow rate and y and d are, respectively, thetemperature and pressure ratios discussed earlier. Corrected mass flow ratecan be equated to the stage inlet Mach number.
Corrected Speed
Rotor blade speeds are corrected to standard conditions using this equation:
Ncorr ¼ Nffiffiffiy
p
where N is the physical speed. The corrected speed is related to the rotorblade tip Mach number.
Performance Parameters
The following expressions are typical of those used to calculate turboma-chine performance parameters. These expressions can be tailored to meetindividual test and data presentation requirements.
Bellmouth Flow Rate. Bellmouth measurements provide an accurate flowmeasurement technique without obstructing the flow-like venturi meters,flow nozzles, or orifice plates. Bellmouth flow rates can be calculated withthe following expression:
_mm ¼ ðCdÞAffiffiffiffigR
rPTffiffiffiffiffiffiTT
pffiffiffiffiffiffiffiffiffiffiffi2
g� 1
sP
PT
� �2=g
� P
PT
� �ðgþ1Þ=g" #1=2In this equation the static pressure is that measured downstream of thebellmouth, the total properties are either ambient test-cell properties orthose measured in the flow path, and Cd is the discharge loss coefficient forthe bellmouth. The area used for calculations is that of the duct cross sectionat the static pressure measurement plane. The static pressure taps aretypically installed in a constant-area duct approximately one duct diameterdownstream from the bellmouth.
Copyright © 2003 Marcel Dekker, Inc.

Pressure Ratios. Stage pressure ratios are calculated by dividing theaverage stage exit total pressure by the average inlet total pressure. Thepressure ratios are calculated using absolute pressure values:
PR ¼ PT exit
PT in
For turbine stages, the pressure ratio is normally calculated by dividing theinlet average pressure by the exit average pressure.
Temperature Ratios. Stage temperature ratios are calculated by dividingaverage exit temperatures with average inlet temperatures. The temperaturesmust be in absolute units for this calculation:
TR ¼ TT exit
TT in
Fan and Compressor Power. The aerodynamic turbomachine stagehorsepower requirements can be calculated as follows:
power ¼ CpTT in _mm
0:707ZPðg�1Þ=gR � 1
h i
The temperature used in this calculation is that of the air at the stage inletplane, with the pressure ratio and efficiency being those across the stage ofinterest.
Power from torque meter measurements can be calculated with thefollowing:
power ¼ NðTorÞK
In this expression, the value of the constant K is 1000/2p when torque (Tor)is in Newton-meters, power in kilowatts, and speed in rps. It is equal to63,030 for torque in inch-pounds, power in horsepower, and speed in rpm[9].
Stage Efficiency. Fan and compressor stage efficiency is defined as theratio of ideal work of compression to actual work of compression at a given
Copyright © 2003 Marcel Dekker, Inc.

pressure ratio [15]. It can be calculated directly from stage pressure andtemperature measurements:
Z ¼ Pðg�1Þ=gR � 1
TR � 1
Likewise, for uncooled turbine stages, the efficiency is defined as the ratio ofactual work to the ideal work at a given pressure ratio:
Z ¼ 1� TR
1� Pðg�1Þ=gR
Local Mach Number. Local flow Mach numbers can be calculated at anyposition in the flow path where the total and static pressures andtemperatures are known. This can be done using the isentropic flowrelations:
M ¼ffiffiffiffiffiffiffiffiffiffiffiffiffiffiffiffiffiffiffiffiffiffiffiffiffiffiffiffiffiffiffiffiffiffiffiffiffiffiffi2
g� 1Pðg�1Þ=gR � 1
h is
The specific heat ratio is a function of temperature.
Data Presentation
Performance Maps
The customary method of presentation for turbomachine stage performancecharacteristics are the maps described in the first section. Two sets of dataare normally presented, which completely describe the stage aerodynamicperformance. These include a family of corrected constant-speed lines withstagnation pressure and temperature ratios plotted as a function ofcorrected flows. Stage adiabatic efficiency is calculated as a function ofmeasured pressure and temperature ratios or from torque meter measure-ments.
Stall Margin Definitions
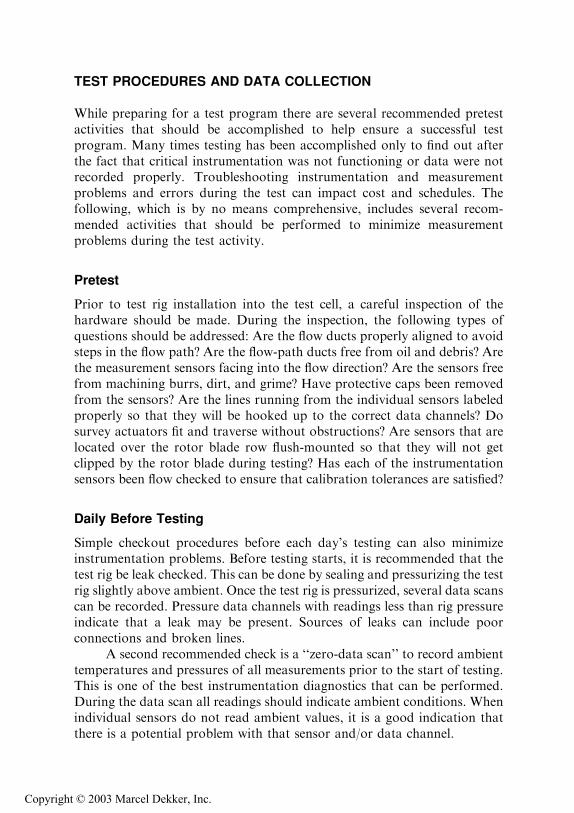
A measure of great interest to turbomachine designers is the fan andcompressor stall margin. It is a measure of performance margin between astage operating point and the stall line. Often, stage performancespecifications will include a stall margin requirement. There are at leasttwo well-accepted definitions for stall margin, constant-speed line stallmargin and constant-flow stall margin.
Copyright © 2003 Marcel Dekker, Inc.
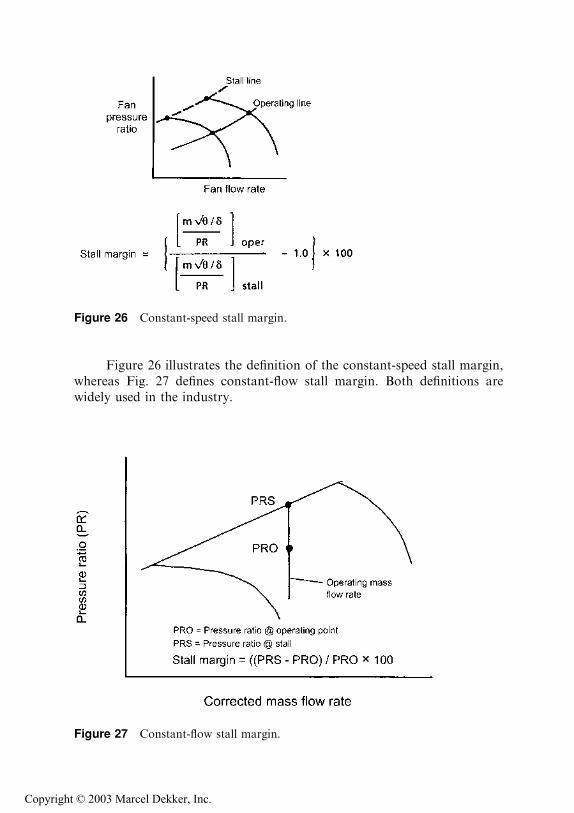
Figure 26 illustrates the definition of the constant-speed stall margin,whereas Fig. 27 defines constant-flow stall margin. Both definitions arewidely used in the industry.
Figure 26 Constant-speed stall margin.
Figure 27 Constant-flow stall margin.
Copyright © 2003 Marcel Dekker, Inc.

SYMBOLS
A Cross-section area
Cd Discharge coefficient
Cp Constant-pressure specific heat of air
K Torque meter unit conversion constant
M Mach number_mm Mass flow rate_mmcorr Corrected mass flow rate
N Rotor wheel speed
Ncorr Corrected speed
P Static pressure
Power Stage power
PR Pressure ratio
PRI Pressure ratio at stall line
PRO Pressure ratio at operating point
PT Total pressure
R Gas constant
SM Stall margin
Tor Torque
TR Temperature ratio
TT Total temperature
g Ratio of specific heats
d Pressure ratio, measured to reference
Z Adiabatic stage efficiency
y Temperature ratio, measured to reference
( )in Stage inlet properties
( )exit Stage exit properties
REFERENCES
1. B. W. Overall, ‘‘A Procedure for the Design of Complex Distortion Screen
Patterns for Producing Specified Steady-State Total Pressure Profiles at the
Inlet of Turbine Engines,’’ AEDC-TR-72-10, Arnold Engineering Development
Center, Arnold Air Force Station, Tennessee, January (1972).
2. ‘‘Gas Turbine Engine Inlet Flow Distortion Guidelines,’’ ARP 1420, Society of
Automotive Engineers, Warrendale, PA (1978).
3. C. Reid, ‘‘The Response of Axial Flow Compressors to Intake Flow
Distortion,’’ ASME 69-GT-29, The American Society of Mechanical Engi-
neers, New York, March (1969).
4. F. Roberts, G. A. Plourde, and F. Smakula, ‘‘Insights Into Axial Compressor
Response to Distortion,’’ AIAA 68–565, AIAA 4th Propulsion Joint Specialist
Conference, Cleveland, OH, June (1968).
Copyright © 2003 Marcel Dekker, Inc.

5. G. A. Plourde and A. H. Stenning, ‘‘The Attenuation of Circumferential
Distortion in Multi-Stage Axial Compressors,’’ AIAA 67–415, AIAA 3rd
Propulsion Joint Specialist Conference, Washington DC, July (1967).
6. R. H. Soeder and G. A. Bobula, ‘‘Effect of Steady-State Pressure Distortion on
Inlet Flow to a High-Bypass-Ratio Turbofan Engine,’’ NASA TM 82964,
Lewis Research Center, Cleveland, OH, October (1982).
7. W. M. Braithwaite, E. J. Graber Jr., and C. M. Mehalic, ‘‘The Effect of Inlet
Temperature and Pressure Distortion on Turbojet Performance,’’ AIAA 73–
1316, AIAA/SAE 9th Propulsion Conference, Las Vegas, NV, November
(1973).
8. J. Mace and D. Sedlock, ‘‘A Perspective on Developing New Inlet Distortion
Measurement and Predictive Methods,’’ AIAA 81–1589, AIAA/SAE/ASME
17th Joint Propulsion Conference, Colorado Springs, CO, July (1981).
9. Robert Jorgensen, ed. Fan Engineering 8th ed. Buffalo Forge Company,
Buffalo, NY (1983).
10. I. N. Moyle, ‘‘Analysis of Efficiency Sensitivity Associated with Tip Clearance
in Axial Flow Compressors,’’ ASME 88-GT-316, The American Society of
Mechanical Engineers, New York, NY (1988).
11. R. P. Benedict, Fundamentals of Temperature, Pressure, and Flow Measure-
ments, John Wiley & Sons, New York (1977).
12. R. C. Dean, Aerodynamic Measurements, Gas Turbine Laboratory, Massachu-
setts Institute of Technology, Cambridge (1953).
13. G. E. Glawe, L. N. Krause, and T. J. Dudzinski, ‘‘A Small Combination
Sensing Probe for Measurement of Temperature, Pressure, and Flow
Direction,’’ NASA TN D-4816, Lewis Research Center, Cleveland, OH,
October (1968).
14. T. J. Dudzinski and L. N. Krause, ‘‘Flow Direction Measurement with Fixed-
Position Probes,’’ NASA TM X-1904, Lewis Research Center, Cleveland, OH,
October (1969).
15. J. L. Kerrebrock, Aircraft Engines and Gas Turbines, MIT Press, Cambridge,
MA (1977).
Copyright © 2003 Marcel Dekker, Inc.