(12) united states patent (10) patent no.: us 9,292.874 b2 ... · executive summary, pp. 9-1...
TRANSCRIPT

(12) United States Patent Beverina et al.
US009292874B2
(10) Patent No.: US 9,292.874 B2 (45) Date of Patent: *Mar. 22, 2016
(54)
(75)
(73)
(*)
(21)
(22)
(65)
(60)
(51)
(52)
(58)
METHOD AND APPARATUS FORRISK MANAGEMENT
Inventors: Anthony Beverina, Falls Church, VA (US); Bryan Ware, Fairfax, VA (US)
Assignee: HAYSTAX TECHNOLOGY, INC., McLean, VA (US)
Notice: Subject to any disclaimer, the term of this patent is extended or adjusted under 35 U.S.C. 154(b) by 1821 days. This patent is Subject to a terminal dis claimer.
Appl. No.: 11/931,545
Filed: Oct. 31, 2007
Prior Publication Data
US 2008/OO52O54A1 Feb. 28, 2008
Related U.S. Application Data Continuation of application No. 09/853,690, filed on May 14, 2001, now Pat. No. 7,308,388, which is a division of application No. 09/453.509, filed on Dec. 3, 1999, now Pat. No. 7,231,327.
Int. C. G06G 7/48 (2006.01) G06F 7/60 (2006.01) G06O40/08 (2012.01) G06O20/20 (2012.01) G06O 50/26 (2012.01) U.S. C. CPC .............. G06O40/08 (2013.01); G06O20/203
(2013.01); G06O20/206 (2013.01); G06Q 50/26 (2013.01)
Field of Classification Search USPC .......................................................... 703/2, 6 See application file for complete search history.
UPDATED BASELNE
(56) References Cited
U.S. PATENT DOCUMENTS
5,020,411 A 6, 1991 Rowan 5,153,366 A 10, 1992 Lucas 5.440,498 A 8, 1995 Timm
(Continued)
FOREIGN PATENT DOCUMENTS
WO 99/23443 5, 1999
OTHER PUBLICATIONS
Biswas, et al., “Applications of Quantitative Modeling to Knowl edge-Based Risk Assessment Studies”, 1989, ACM 0-89791-320-5/ 89/0006/0092, pp. 92-101.*
(Continued)
Primary Examiner — Kamini S Shah Assistant Examiner — Juan Ochoa (74) Attorney, Agent, or Firm — DLA Piper LLP (US)
(57) ABSTRACT An integrated risk management tool includes a persistent object database to store information about actors (individuals and/or groups), physical Surroundings, historical events and other information. The risk management tool also includes a decision Support system that uses data objects from the data base and advanced decision theory techniques, such as Baye sian Networks, to infer the relative risk of an undesirable event. As part of the relative risk calculation, the tool uses a simulation and gaming environment in which artificially intelligent actors interact with the environment to determine susceptibility to the undesired event. Preferred embodiments of the tool also include an open “plug-in' architecture that allows the tool to interface with existing consequence calcu lators. The tool also provides facilities for presenting data in a user-friendly manner as well as report generation facilities.
8 Claims, 53 Drawing Sheets

US 9,292.874 B2 Page 2
(56) References Cited
U.S. PATENT DOCUMENTS
5,850,352 A 12/1998 MoeZZi et al. 5,856,803 A 1, 1999 Pever 6,088,804 A 7, 2000 Hill et al. 6.254.394 B1 7/2001 Draper et al. 6,408.404 B1 6/2002 Ladwig 6,442,694 B1 8/2002 Bergman et al. 6,507,353 B1 1/2003 Huard et al. 6,590,496 B2 7/2003 Peterson et al. 6,807,537 B1 10/2004 Thiesson et al. 6,823,068 B1 1 1/2004 Samid 7,027,992 B2 4/2006 Zaccaria et al. 7,130,779 B2 10/2006 Beverina et al. 7,231,327 B1 6, 2007 Beverina et al.
2001/0027388 A1 2001/OO27389 A1 2004.0006513 A1 2004/0249679 A1
10, 2001 Beverina et al. 10, 2001 Beverina et al.
1, 2004 Wolfe 12/2004 Henderson et al.
2005/0172155 A1 8/2005 Sheymov 2005, 0183072 A1 8/2005 Horning et al.
OTHER PUBLICATIONS
Allen, et al., “Modeling Requirements for Simulating the Effects of Extreme Acts of Terrorism: A White Paper.” Sandia National Labo ratories, Abstract (Oct. 1998). Anonymous, "SAVI: Systematic Analysis of Vulnerability to Intru sion.” vol. 1, SAND89-0926, Sandia National Laboratories (publica tion available from www.ntis.gov) (Dec. 1989). Anonymous, “General Airport Assessment Plan. Science Applica tions International Corporation, Contract No. DTFAO3-97-C-00036 (Nov. 1997) (SAIC). Anonymous, "Combating Terrorism: Threat and Risk Assessments Can Help Prioritize and Target Program Investments.” General Accounting Office, Report NSIAD-98-74 (Apr. 1998). Anonymous, “Science and Technology: Serious Games.” Economist, pp. 81-82 (Jul. 8, 2000). Baker, et al., “Access Features—Bomb Blast.” (Mar. 1998) (webpage available at: http://www.ncsa.uiuc.edu/News/Access/Stories/Bomb Blast/indexBB.htm). Baker, et al., “Visualization of Damaged Structures.” (Mar. 1998) (web page available at: http://www.archive.ncsa.uiuc.edu/Vis/Publi cations/damage.html). Bakert, et al., “Force Aggregation Via Bayesian Nodal Analysis.” IEEE 1998 Information Technology Conference, pp. 6-9 (Sep.1998). Biswas, et al., "Applications of Quantitative Modeling to Knowl edge-Based Risk Assessment Studies.” ACM 0-89791-320-5/89/ O006/0092, ACM 1989. Castillo, et al., “Modeling Probabilistic Networks of Discrete and Continuous Variables,” Journal of Multivariate Analysis, vol. 64. Issue 1. pp. 48-65 (Jan. 1998). Department of Defense, DoD Instruction 2000. 16, "DoD Combating Terrorism Program Standard” (Jun. 14, 2001) (believed to be a suc cessor to document dated Jul. 21, 1997). Department of Defense, DoD 0/2000. 12-H, “Protection of DoD Per sonnel and Activities Against Acts of Terrorism and Political Turbu lence.” (Feb. 1993). Doyle, et al., “Strategic Directions in Artificial Intelligence.” ACM Computing Surveys, vol. 28, No. 4 (Dec. 1996). Federal Aviation Administration, “Hazard Analysis of Commercial Space Transportation.” Executive Summary, pp. 9-1 through 9-12 (Oct. 1995). Fitzgerald, “Anti-Terrorism Software Models Real Effects of Bio logical Weapons.” Security, pp. 9-10 (Jul. 1999).
Fleming, "Assessing Organizational Vulnerability to Acts of Terror ism.” S.A.M. Advanced Management Journal, vol. 63, Issue 4, pp. 27-32 (1998). Geiger, et al., “Probabilistic Relevance Relations.” IEEE Transac tions on Systems, Man, and Cybernetics-Part A: Systems and Humans, vol. 28, No. 1, pp. 17-25 (Jan. 1998). Goldszmidt, et al., “Plan Simulation Using Bayesian Networks.” IEEE Proceedings of the 11th Conference on Artificial Intelligence to Applications, pp. 155-161 (Feb. 1995). Hudson, et al., “An Application of Bayesian Networks to Antiterror ism Risk Management for Military Planners.” Dept. of Systems Engi neering and or, George Mason University (2002). Johnson, et al., “Blast Vulnerability of Building Structures and the Public from Terrorist Attack.” Proceedings of 1994 International Carnahan Conference on Security Technology, IEEE 1994. Joint Chiefs of Staff, Joint Publication No. 3-07.2 "Joint Tactics, Techniques and Procedures for Antiterrorism.” Mar. 17, 1998, pp. II-1-II-12, IV-1-V-10, and VII-1-VII-10. Lazarick, "Airport Vulnerability Assessment—An Analytical Approach.” IEEE 0-7803-4535-5/98, IEEE 1998. Jablonowski. “When in Doubt, Simulate.” Risk Management, vol. 45, Issue 11, pp. 44-49 (Nov. 1998). McMichael, "BARTIN: Minimising Bayes Risk and Incorporating Priors. Using Supervised Learning Networks.” IEEE Proceedings F-Radar and Signal Processing, vol. 139, Issue 6, pp. 413-419 (Dec. 1992). Meyer, et al., “The Strategic Use of Expert Systems for Risk Man agement in the Insurance Industry.” ACM089791-416-3, ACM 1990. Nguyen, “Target Mission Estimation.” IEEE Third International Conference on Knowledge-Based Intelligent Information Engine Systems, pp. 66-69 (Aug. 1999). Ogyunyemi, et al., “Probabilistically Predicting Penetrating Injury for Decision Support.” IEEE 1998 Symposium on Computer-Based Medical Systems, pp. 44-49 (Jun. 1998). Ojha, et al., “Quantifying Operational Risk Using Bayesian Net works and Monte Carlo Simulations.” Proceedings of the Second International Conference on Information Fusion, Abstract (Jul. 1999). Rosen, et al., “Influencing Global Situations: A Collaborative Approach.” Air Chronicles (1996) (paper available at: http://www. inet.saic.com/docs docs ?conops.pdf). Santoso, et al., “Nuclear Plant Fault Diagnosis. Using Probabilistic Reasoning.” IEEE 1999 Power Engineering Society Summer Meet ing, pp. 714-719 (Jul 1999). Secretary of the Air Force, "Air Force Instruction 31-210.” (Aug. 1, 1999). Spencer, "Vulnerability Assessment.” Corrections Today, vol. 60, Issue 4, pp. 88-98 (Jul. 1998). Swiatek, et al., “Crisis Prediction Disaster Management.” SAIC Sci ence and Technology Trends II, (Jun. 1994). Swiatek, et al., "SAIC Science and Technology Trends II: Crisis Prediction Disaster Management.” pp. 1-13 (Jun. 1999) (paper avail able at: http://www.saic.com/products/simulation/catsVUPQPV4R. pdf). United States Air Force, "Installation Force Protection Guide.” (1997). Veatch, et al., “An Airport Vulnerability Assessment Methodology.” IEEE 33rd Annual 1999 International Carnahan Conference on Secu rity Technology, pp. 134-151 (Oct. 1999). Verton, “Marine Unit Buys Attack-Modeling Software.” Federal Computer Week, p. 39 (Oct. 18, 1999). “Tools Against Terrorism and Other Disasters.” Press Release, Sandia National Laboratories (Jul. 2001).
* cited by examiner

U.S. Patent Mar. 22, 2016 Sheet 1 of 53 US 9,292.874 B2
s
2 3
s
E.

US 9,292.874 B2 Sheet 2 of 53 Mar. 22, 2016 U.S. Patent
-U

U.S. Patent Mar. 22, 2016 Sheet 4 of 53 US 9,292.874 B2
U.S. Patent Mar. 22, 2016 Sheet 5 of 53 US 9,292.874 B2
500 5100
510
Likelihood
Asset Attractive reSS
Apparent Site
ReOdiness Relative Risk
(Actor w/weapon & delivery system against a target)
Apparent Target ReOdiness
Recog nizability
5100 Susceptibility
Acces sibility
Effect Vulnerability O Mission
5100
Symbolic Effect
Conse - quences FIG.5
U.S. Patent Mar. 22, 2016 Sheet 6 of 53 US 9,292.874 B2
Ed Site Baseline S. ------ Assets
i- People B Threots
Screen Title Some Question? O Some Question? O Some Question? O
Influence Network Doto Model

U.S. Patent Mar. 22, 2016 Sheet 7 of 53
U.S. Patent Mar. 22, 2016 Sheet 8 of 53 US 9,292.874 B2
801 Risk Summary Toble
MEA PROB. OF SUSCEPT- CONSEQ- PASSME SYSTEM GES Attack By UENCES COUNTEREASURES
500LB HEAD Go Gisco coco E 500B DLA Ero Boole eru
to avor own to is
II is i?---S Site Profiler Risk Assessment s s RISK ASSESSMENT:
THE LIKELHOOD OF GEICUAB) YOUR MOST ATRACTIVE TARGETS ARE:
-BUILDING 2120, DLA HQ -BUILDING 600, NVESD LAB -BUILDING 1900, INSEAM HQ -BUILDING 20, GENERAL QUARTERS <WHY?x
OF THESE TARGETS, GA E)IS THE MOS SUSCEPTIBLE.
THE CONSEQUENCES OF ACEHICULAB) GOMBAT ALL OF THESE ASSETS IS EXTREMELY HIGH DUE TO:
-MISSION MPORTANCE (WHY?X -POPULATION CWHY?X -RECOVERABILITY CWHY2Y 802
oMORE a RISK TABLE oDONE
FIG.8
US 9,292.874 B2 Sheet 9 Of 53 Mar. 22, 2016 U.S. Patent

Sheet 10 of 53 Mar. 22, 2016 U.S. Patent
|
0 || '0|| S?DuJOJ ?JOdøy
a=s Q: D
qndu|| 19Sn
-

US 9,292.874 B2 Sheet 11 of 53 Mar. 22, 2016 U.S. Patent
| || '0||
[-] žuo?sano ?ulos [-] žuoqsano aujos [-] quoqsano aulos

US 9,292.874 B2 Sheet 12 Of 53 Mar. 22, 2016 U.S. Patent
JepuDuJuJOO JOIu9S
U.S. Patent Mar. 22, 2016 Sheet 13 Of 53 US 9,292.874 B2
Mointoiner
AT/FP Ponning PC (Desktop)
Secure WAN/ SneckerNet KgProcess>>
WAT Ponner KgThreod>> K{ThreadXX
Ul Computotion
KKProcess>> DBMS
K{ProcessXX Anolytic Model
CONTINUED
SneokerNet Troiner Operotor FIG.13b
AT/FP Assessment PC (LOptop) {KProcessXX
Secure WAN/ SneakerNet
VAT
Professional KgThreodXX K{Threoddx Assessor Ul Computation
Secure AN
K{Process>> Analytic Model
Mointoiner
FIG. 130

U.S. Patent Mar. 22, 2016 Sheet 14 of 53 US 9,292.874 B2
Commonder
Theoter Level Informotion Monagement PC (Desktop)
g<Process>> KKProcess>> TMS DBMS
Commonder's PC (Desktop)
K{ProcessXX WWW Browser
AT/FP Development PC (Desktop)
CKProcess>> WAT
KKThreOdds K{ThreOdxx Ul Computation
<<Process>> NYSSYZ KCProcess>> Analytic DBMS Model area
CONTINUED FROM
FIG. 150
<<Process>2 Editor
Developer Mointoiner
FIG.13b

U.S. Patent Mar. 22, 2016 Sheet 15 Of 53 US 9,292.874 B2
Asset Attroctiveness
IN ORDER TO ASSESS THE ATTRACTMENESS OF THIS ASSET TO A TERRORIST, YOU WILL NEED TO DESCRIBE THE FOLLOWING FEATURES OF THE ASSET:
o PROXIMTY TO OTHER IMPORTANT ASSETS o POPULATION o DEMOGRAPHICS O RECOGNIZABILITY o ACCESSIBILITY to AND IMPORTANCE
EACH OF THESE DESCRIPTIONS WILL IMPACT THE ATTRACTMENESS OF THE ASSET TO A TERRORIST.
OLET'S GET STARTED
1400
U.S. Patent Mar. 22, 2016 Sheet 17 Of 53 US 9,292.874 B2
Clicking On O column heading will sort Ond group the toble bosed On that column being the secondory sort.
Selection of the entire row, using the Orrow On the left of the toble tokes the User to the Risk Detolls Screen allowing Occess to the Sim ond other feotures.
Selecting O column heading Ond drogging it to the left will moke O primory grouping
DELIVERY PROB. OSUSCEPT- CONSEQ- PASSIVE SS TARGETS UENCES COUNTERMEASURES
For Gise up to occo 5000LB DLA
AEROSOL FT. BE VOIR own a Dis
Clicking on a risk component will allow the user to drill down for the information
thot coused the risk roting to occur.
FIG.16 1600

US 9,292.874 B2 Sheet 18 of 53 Mar. 22, 2016 U.S. Patent
U.S. Patent Mar. 22, 2016 Sheet 19 of 53 US 9,292.874 B2
1800
Risk Details: 500LB Cor Bomb vs. Headquarters 7
VIEW RISK TEM DETALS O READ STE PROFILER RISK ASSESSMENT
VIEW SIMULATION OF EVENT O ANAYZE COUNTERMEASURES
ANALYZE CONSEQUENCES
FIG. 18
U.S. Patent Mar. 22, 2016 Sheet 20 Of 53 US 9,292.874 B2
US 9,292.874 B2 Sheet 21 Of 53 Mar. 22, 2016 U.S. Patent
FIG.20b FIG.20d
W ()
-- /W/? (\)\\() --WXY. () O
WIE
FIG.20d FIG.20C

US 9,292.874 B2 U.S. Patent

US 9,292.874 B2 Sheet 23 Of 53 Mar. 22, 2016
SISATWNW 3.ONET?ESNOO
U.S. Patent

U.S. Patent Mar. 22, 2016 Sheet 24 of 53 US 9,292.874 B2
220
Blost and Frogment Plug-in WAT
Dotobose
Physical Geography Buildings
Features LOCotions
Weapons Nature "Size
"Counter reOSUeS
Actors
220
WAT Dotobose
Physical Geography Buildings
Locations 0ccupancy
Weapons Noture Size
Counter reOSUeS
• Climate
Weapon, Building, Relotive
Geometry
Building Domage,
Cosualties, Geographic
Effects
Chemical/Biological/Radiological Plug-in
"Agent, Release, Time Ond SeOSOn
COSuolities, Geographic
Effects
U.S. Patent Mar. 22, 2016 Sheet 25 Of 53 US 9,292.874 B2
FIG.25

US 9,292.874 B2 Sheet 26 of 53 Mar. 22, 2016 U.S. Patent
97'0|} |, als
INEAR No. |Domowa||ºvo||somomaeo||ml|| TWO SWHd
U.S. Patent Mar. 22, 2016 Sheet 27 Of 53 US 9,292.874 B2
AGENCY ATTRIBUTE: 2700 OPERATION: 2710 M
REGION DIVISION
REGION/DMSION NAME COUNTRY SERMCE
OPERATION:
2720
()
NAME ORGANIZATION 2750
OPERATION:
INFORMATION 2732 PRODUCTS
SITE BASELNE 2734
THREA 2733
SITE LAYOUT 2731
FIG.27

US 9,292.874 B2 U.S. Patent
US 9,292.874 B2 Sheet 29 Of 53 Mar. 22, 2016 U.S. Patent
006Z
NI-90’ld IWA
US 9,292.874 B2 Sheet 30 Of 53 Mar. 22, 2016 U.S. Patent

US 9,292.874 B2 Sheet 31 Of 53 Mar. 22, 2016 U.S. Patent
U.S. Patent Mar. 22, 2016 Sheet 32 Of 53 US 9,292.874 B2
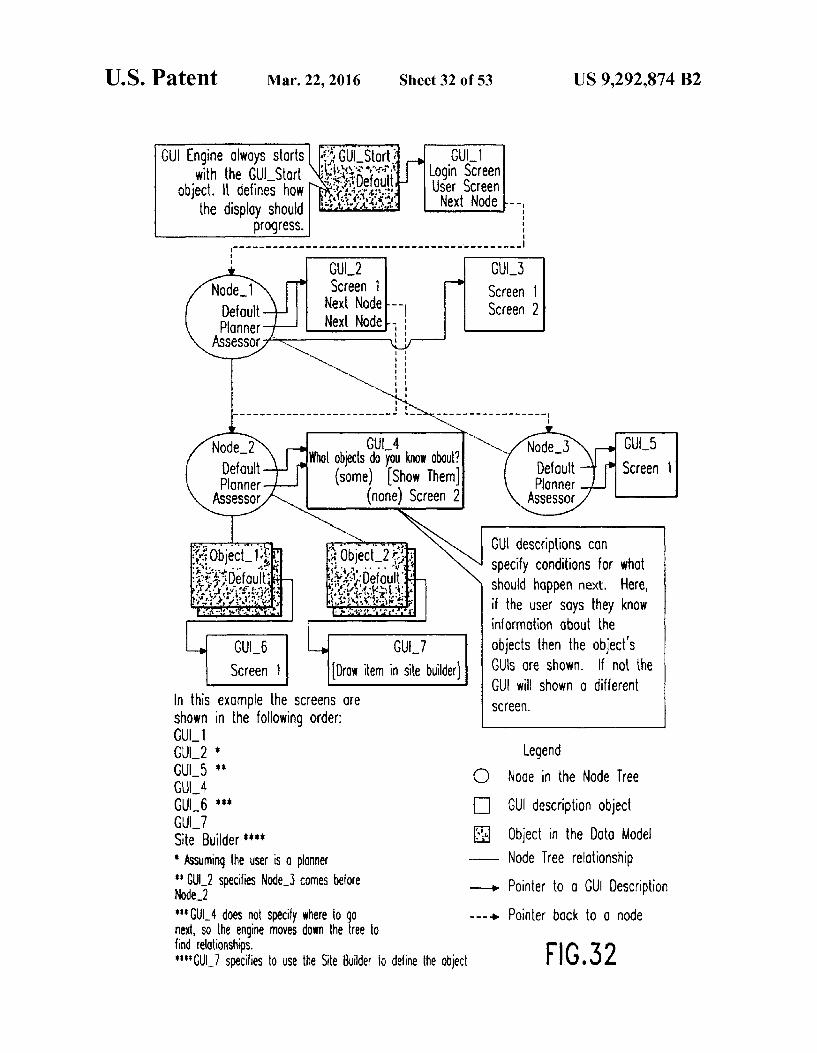
GUI Login Screen User Screen Next Node ---
GUI Engine olways starts with the GUI Stort
Object. It defines how the display should
progress.
GU15 Screen 1 Screen 2
Nodel Defoult Ponner
ASSeSSOr 7
GUI-4 Whot objects do you know about?
(some) Show Them (none) Screen 2
Node 2 Defoult Plonner
Assessor
Defoult Planner
Assessor
GU descriptions con specify conditions for what should hoppen next. Here, if the user Soys they know informotion (bout the objects then the object's GUIs Ore shown. If not the GUI will shown O different Screen.
R.
i:43, ; . Defoylt .
is: : 33 ille .. i
5. 2.
CU6 Screen
In this example the screens are shown in the following order:
Drow item in site builder
GUll GU2 * Legend CUL5 * - GU 4 O Node in the Node Tree CUL6 | GUI description object GU17 f Site Builder **** Object in the Data Model * Assuming the user is 0 planner - Node Tree relotionship N. specifies Node-3 comes before - Pointer to a GUI Description "GUI-4 does not specify where to 90 ----> Pointer bock to O node next, so the engine moves down the tree to find relationships. "CU-7 specifies to use the Site Builder to define the object FIG.32

US 9,292.874 B2 U.S. Patent

US 9,292.874 B2 Sheet 34 of 53 Mar. 22, 2016 U.S. Patent
099°0||
US 9,292.874 B2 U.S. Patent


US 9,292.874 B2 Sheet 39 Of 53 Mar. 22, 2016 U.S. Patent

US 9,292.874 B2 Sheet 41 of 53 Mar. 22, 2016 U.S. Patent
suo?do jo ?si] quasaid


Sheet 44 of 53 Mar. 22, 2016 U.S. Patent
|

US 9,292.874 B2 U.S. Patent

US 9,292.874 B2 Sheet 47 of 53 Mar. 22, 2016 U.S. Patent
Ág 110S 9SM018
U.S. Patent Mar. 22, 2016 Sheet 48 of 53
s 7/
t O M ve
2
3.
US 9,292.874 B2

U.S. Patent Mar. 22, 2016 Sheet 49 of 53 US 9,292.874 B2
wide File Edit Go Help
Stotic LOok & Feel User Interfoce Report Formats User Type
Planner Edit user pes
Stotic Look & Feel User
Fonts COns
Dynomic Look & Feel
Text Styles
input/Output Elements Screen Definition Dynamic Look & Feel User information
a Please enter your name: UsernOme Add Definition Definition Please enter your military ID: UserMILD
Remove DefinitionDefiniti Please select your ronk: UserRonk Please enter your Oge:
Link Object To Definition Set Bronching Condition
U.S. Patent Mar. 22, 2016
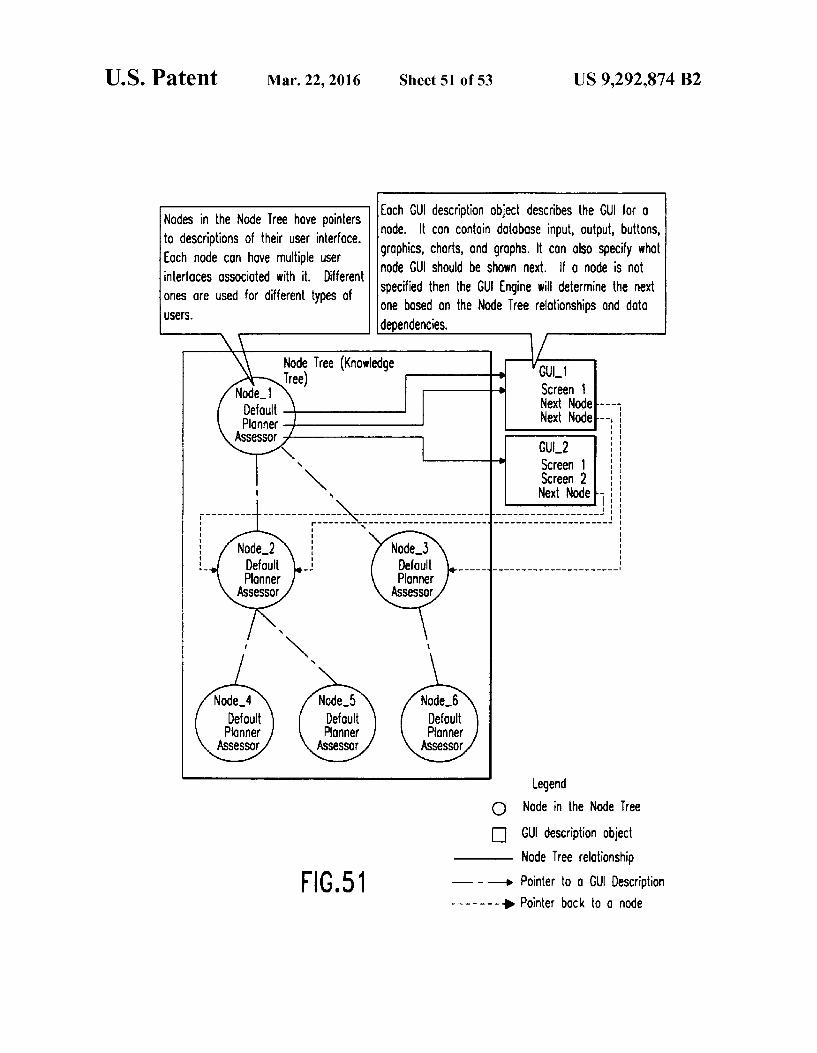
Nodes in the Node Tree have pointers to descriptions of their user interface. Eoch node con hove multiple user interfoCes Ossocioted with it. Different Ones are used for different types of USS.
Node Defoult Plonner
Assessor
Node 2 Defoult Plonner
Assessor
Node 5 Defoult Ponner
ASSessor
FIG.51
Each GUI description object describes the GUI for Q node. It con contoin dotobose input, output, buttons, grophics, chorts, ond grophs. It can olso specify whol node GUI should be shown next. If Onode is not specified then the GUI Engine will determine the next One bosed on the Node Tree relotionships ond doto dependencies.
Node Tree (Knowledge
S or w w w we w w w we was no g or was no or we w w row or sex w n w w or
Node 3
Pionner Assessor
Sheet 51 of 53 US 9,292.874 B2
Next Node--- Next Node---
CU-2 Screen 1 Screen 2 Next Node
Defoult l---------------------------
Node 6 Defoult Ponner
Assessor
Legend O Node in the Node Tree
GUI description object Node Tree relotionship
- - -D Pointer to O GUI Description Oa - O - A - o Pointer bock to O node
US 9,292.874 B2 U.S. Patent

US 9,292,874 B2 1.
METHOD AND APPARATUS FORRISK MANAGEMENT
This application is a continuation of U.S. application Ser. No. 09/853,690, filed May 14, 2001, now U.S. Pat. No. 7,308, 388, which is a divisional of U.S. application Ser. No. 09/453, 509, filed Dec. 3, 1999, now U.S. Pat. No. 7,231,327. The entireties of all of the aforementioned applications are incor porated herein by reference.
BACKGROUND
1. Field of the Invention The invention is related to the management of risk in gen
eral and more particularly to an apparatus and method of managing risks associated with terrorism.
2. Related Art Risk can be defined as probability vulnerability. Probabil
ity is the probability that an undesirable event will occur. Vulnerability is susceptibility to the event multiplied by the consequences associated with that event. Managing risk involves the process of determining the risk and taking steps to decrease the risk by decreasing the probability or vulner ability, or both. Managing risk is an important task faced by people in many different situations. Insurance companies and financial planners manage risk to capital when deciding when to insure and what stocks on bonds to include in a portfolio. Homeowners manage risk when deciding whether to pur chase a burglar alarm system. One particularly important form of risk management is terrorism prevention.
Terrorism is a world-wide problem. Unfortunately, many in the United States associate terrorism with certain Arabian and/or Islamic nations and view the threat of terrorism from this limited framework. However, as recent events such as the Oklahoma City bombing have demonstrated, terrorism is not limited to any particular nation, religion, political system, or ideology. Today, the problem has become far more complex and is rapidly changing. One problem faced by those with responsibility for assess
ing the threat of terrorism and its prevention is the lack of suitable tools to help them perform their tasks. Known tools generally fall into one of two categories: a) terrorist attack damage assessors; and b) terrorist attack likelihood predictors (i.e., probability calculators). The first type of tool, terrorist attack damage assessors (i.e., consequence calculators), are generally computer based. These tools attempt to answer the questions like “What will happen if a car carrying a 500 pound bomb explodes at the front door of my building?” (Blast model tools) and “What will happenifa 50 gallon drum of nerve gas is opened in the parking garage?” (“CBR' - chemical, biological and radiological-tools). The tools, which typically employ complex computer modeling algo rithms such as those found in CAD/CAM programs, have three important drawbacks. First, they require detailed infor mation (which can be difficult, time consuming and expen sive to obtain) to construct the model and are often not flexible enough to handle situations in which the detailed data is not available. It is likely that data required to use these tools on the Murrah building in Oklahoma City would still not be col lected at this point due to the time and costs associated with collecting Such data. Second, these tools require expertise on the part of the user. Third, and perhaps most importantly, programs such as these provide no guidance as to the likeli hood that the attack will succeed (the accessability), the likely location of an attack (e.g., the front or rear of the building, which building, etc., the type of weapon (explosive, chemical,
5
10
15
25
30
35
40
45
50
55
60
65
2 biological or radiological) likely to be used, and how to pre vent or at least minimize the occurrence of the attack in the first place. The second type of tool, terrorist attack likelihood predic
tors, are typified by paper and pencil questionnaires provided by government agencies to remote locations. These tools attempt to answer the question “How likely am I to be attacked by terrorists?” The form of the tool is generally a series of questions such as "Do you have any nuclear material at your facility?”, “Are you located in an urban, suburban or rural area'? And “Are you a military or civilian installation? These questionnaires award a certain number of points based on each answer and base the likelihood of terrorist attack on the total number of points. These tools also suffer from sev eral serious drawbacks. While they may tell you that an attack is likely, they provide no guidance as to the nature of the attack and how to prevent it, provide no indication as to whether the attack will be successful, and provide no indica tion of the consequence of a successful attack.
Another problem faced by those charged with preventing terrorism is the lack of flexibility in adapting anti-terrorism plans. It has become the practice of many institutions to formulate an anti-terrorism plan that defines a number of threat levels. These plans are typically prepared by outside agencies or consulting firms based on individual knowledge and experience. Updating the plans based on changed circum stances requires the individual security specialists to be recalled, which is expensive and time consuming. Further more, the plans may not be appropriate for changing circum stances. By way of example, there may be great differences between a plan for high threat of terrorist activity on a military installation that was designed to protect mission-critical assets such as a weapons system and a plan for a high threat of terrorist activity on that same military installation when the high-threat condition is caused by a visit from a head of state or because of threatened attacks on troops rather than the weapons system. Furthermore, the source of the threat may also change its nature. A plan devised to stop a Suicide car bomb attack favored by one known terrorist group may not be effective for a chemical attack favored by another terrorist group.
Changes to the plan may also become necessary because the site has expanded, or because of changes to the physical Surroundings (e.g., new developments have been built in close proximity to a site previously surrounded by woods). Plan changes are also necessitated by the frequent changes to AT/FP doctrine, enunciated in sources such as DoD 2000. 16, the Joint Service Integrated Vulnerability Assessment (JSIVA) Team standard operating procedures, and the J34 Installation AT/FP Planning Template, due to the evolving nature of the threat and lessons learned from previous attacks.
SUMMARY
The aforementioned deficiencies have been overcome to a great extent by the present invention which provides an inte grated risk management tool. The integrated risk manage ment tool uses a persistent object database to store informa tion about actors (individuals and/or groups), physical Surroundings, historical events and other information. The risk management tool also includes a decision Support system that uses data objects from the database and advanced deci sion theory techniques, such as Bayesian Networks, to infer the relative risk of an undesirable event. As part of the relative risk calculation, the tool uses a simulation and gaming envi ronment in which artificially intelligent actors interact with the environment to determine susceptibility to the undesired
US 9,292,874 B2 3
event. Finally, the tool includes an open “plug-in' architec ture that allows the tool to interface with existing conse quence calculators. The tool also provides facilities for pre senting data in a user-friendly manner as well as report generation facilities.
In preferred embodiments, the invention takes the form of a Software program that may be run on a personal computer or workstation that allows users to evaluate the risk of a terrorist attack at their site, determine their vulnerability to a terrorist attack, assess the damage caused by a successful terrorist attack, and select countermeasures to prevent terrorist attacks. The program provides the user with importing, draw ing and modeling tools to allow the user to quickly and easily build a model of the site of interest in both 2 and 3 dimensions. Once the site model is established, simulation is performed to generate information about threat scenarios. The simulation can be viewed by the user from whatever eye-point the user chooses. In the simulation, the user selects a weapons system and location for a terrorist attack, Such as a car bomb at the rear of the building. The simulation constructs and analyzes possible routes that the terrorist may take to reach the loca tion, taking into consideration the site model and all site specific information such as the existence of roads, car barri ers, guard Stations, hills, etc. The simulation then selects the most probable route and calculates the likelihood of success, or accessability. The program will allow the user to modify the site model to add physical countermeasures (including hardening the target, denying access to the target, etc.) and re-run the simulation to determine the effectiveness of the COuntermeasures.
The system also provides an artificial intelligence risk assessment tool to help users manage risk. After the simula tions have been run, the risk assessment tool determines rela tive risk based on the probability of an attack and the Vulner ability of a site to an attack. Vulnerability is partially based on Susceptibility, which in turn is partially based on the access ability as determined by the simulation described above; and partially based on a consequence calculation. The use in highly preferred embodiments of physical modeling and physics-based accessability calculations from the 3D simu lation/gaming environment in the calculation of relative risk is seen as a particularly advantageous embodiment of the invention. In highly preferred embodiments, the risk assess ment tool is implemented using a Bayesian influence net work. The network is based upon input from experts in the anti-terrorism field. The program can also provide damage assessments to the
user under the user's control—in other words, the conse quence calculation portion of the problem can be used inde pendently of the risk management process as a whole. Pro vided with the program are two built-in analysis tools: 1) a first order blast-assessment tool; and 2) a first order down wind CBR hazard prediction tool. However, the program is built on a plug-in model. That is, the program is designed to interface with industry standard programs so that the standard programs will accept input from the invention and return the desired information (e.g., blast effects). In this manner, the program incorporates improvements to these programs as they occur without the need to update the program code. The user is allowed to specify a weapon system and delivery point, in response to which the system performs the damage calcu lations.
Preferred embodiments of the invention allow users to produce, view and print industry-standard reports as well as custom reports. Planners can develop AT/FP site plans in a standard J34. Installation AT/FP Planning Template format. Assessors can log observations and produce out-briefs and
5
10
15
25
30
35
40
45
50
55
60
65
4 reports in JSIVA formats. Highly, preferred embodiments of the invention produce custom reports in JSIVA formats. More highly, preferred embodiments of the invention produce cus tom reports with detailed data on risk and other items.
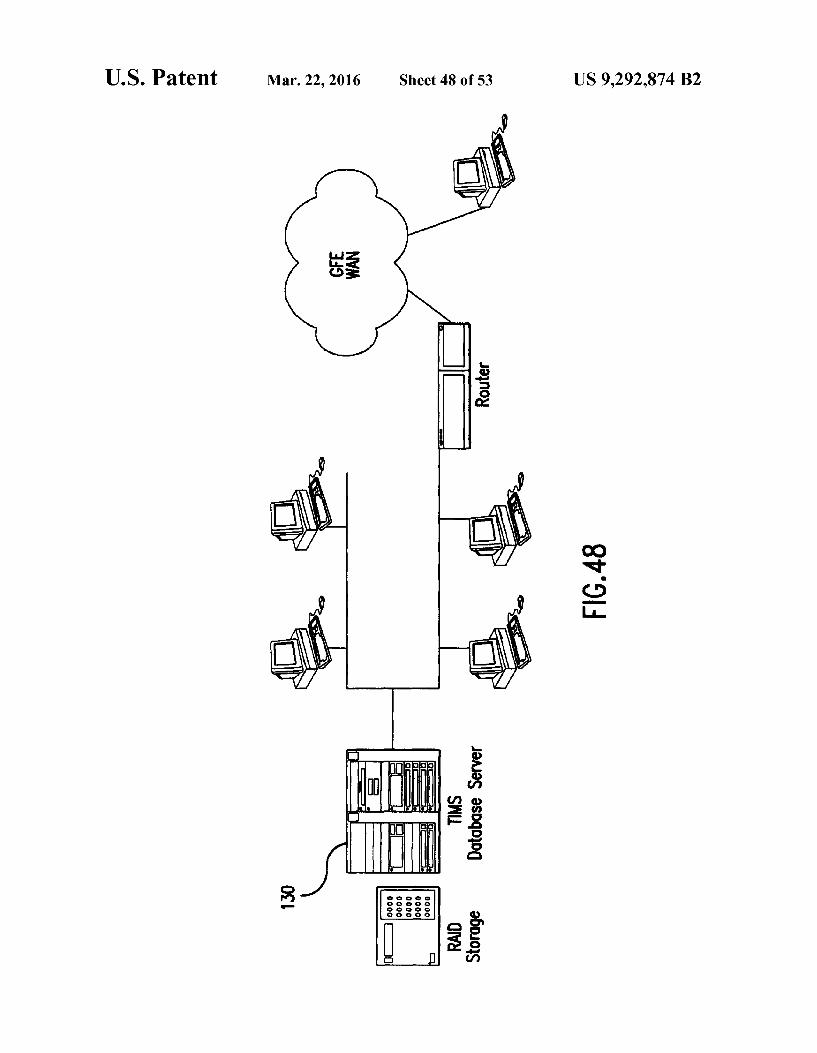
Preferred embodiments of the invention provide a theater level information management system (TIMS 130) that allows senior commanders to view information pertaining to multiple sites under their command. Access to the data is provided through a web-accessible browser interface. Pre ferred embodiments of the present invention also include an editing tool that allows modification of the database, the GUI 202, and the output of the system.
BRIEF DESCRIPTION OF THE DRAWINGS
The foregoing and other features and advantages of the invention will be more readily understood with reference to the following drawings in which:
FIG. 1 is a schematic diagram of an automated Vulnerabil ity assessment tool comprising the VAT, the VAT Editor, and the TIMS, according to one embodiment of the present inven tion.
FIG. 2 is a block diagram of the architecture of the VAT of FIG 1. FIG.3 is a view of a screen from a graphical user interface
of the VAT according to a preferred embodiment of the inven tion.
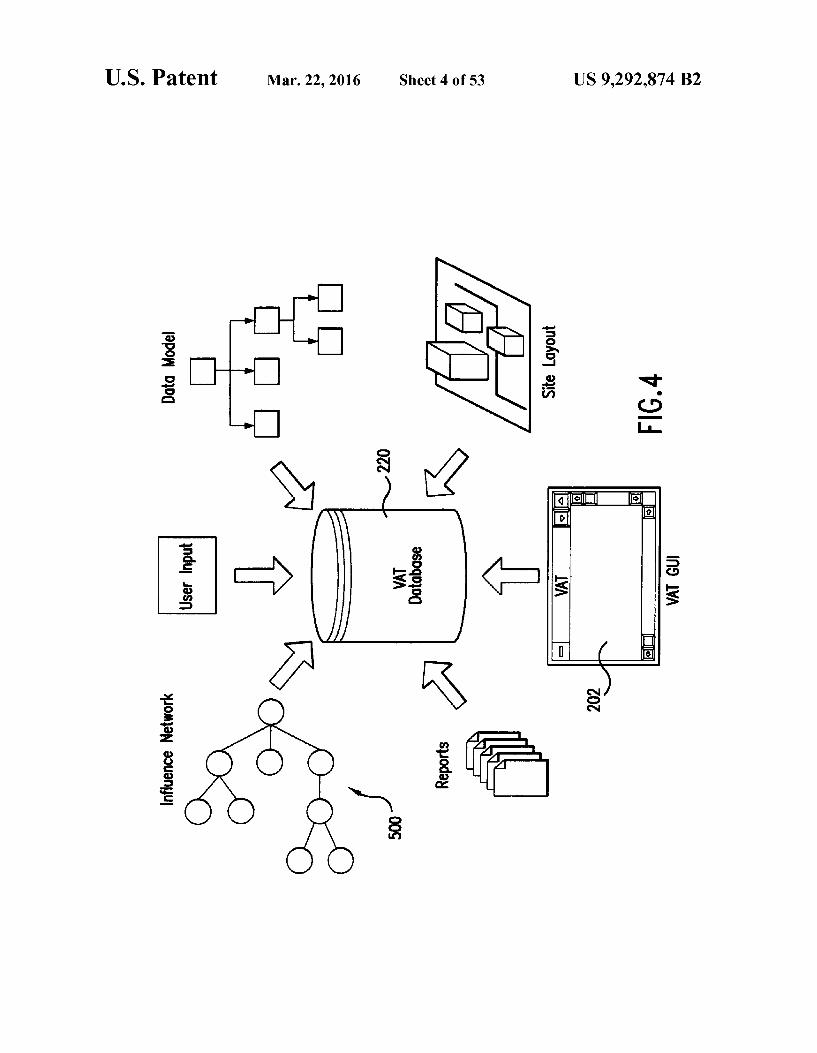
FIG. 4 is a symbolic diagram showing contents of the VAT database.
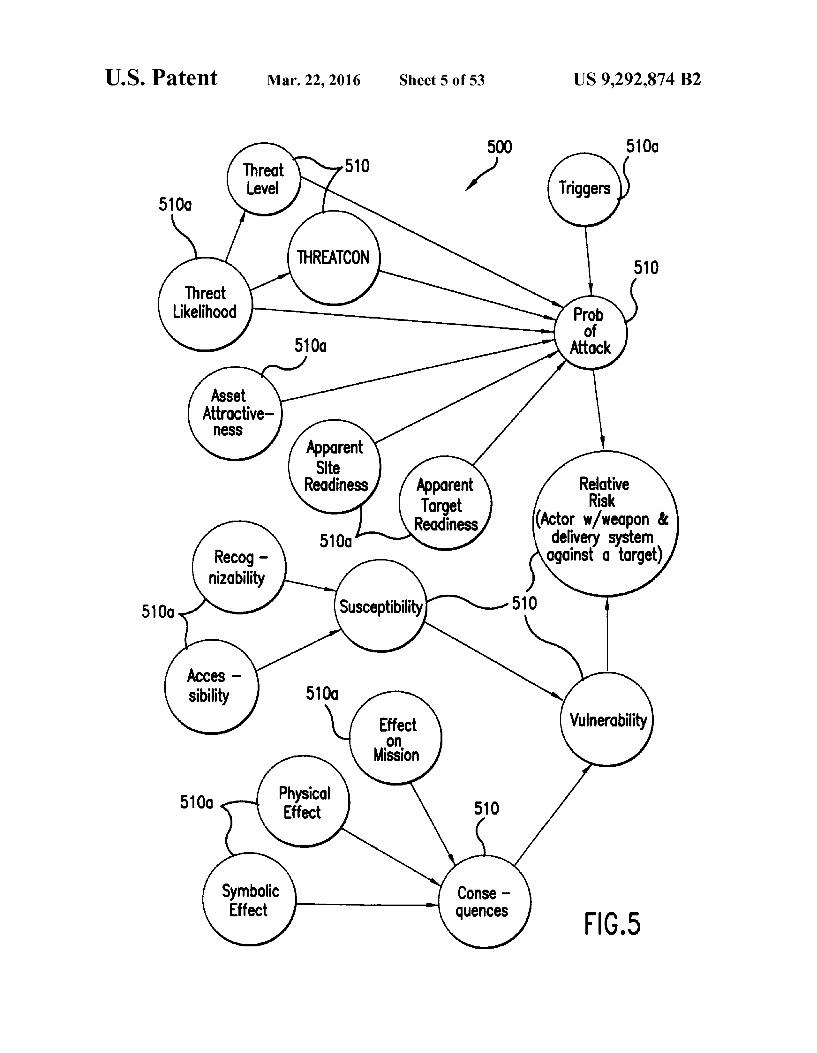
FIG.5 is a diagram of a risk influence network according to a preferred embodiment of the invention.
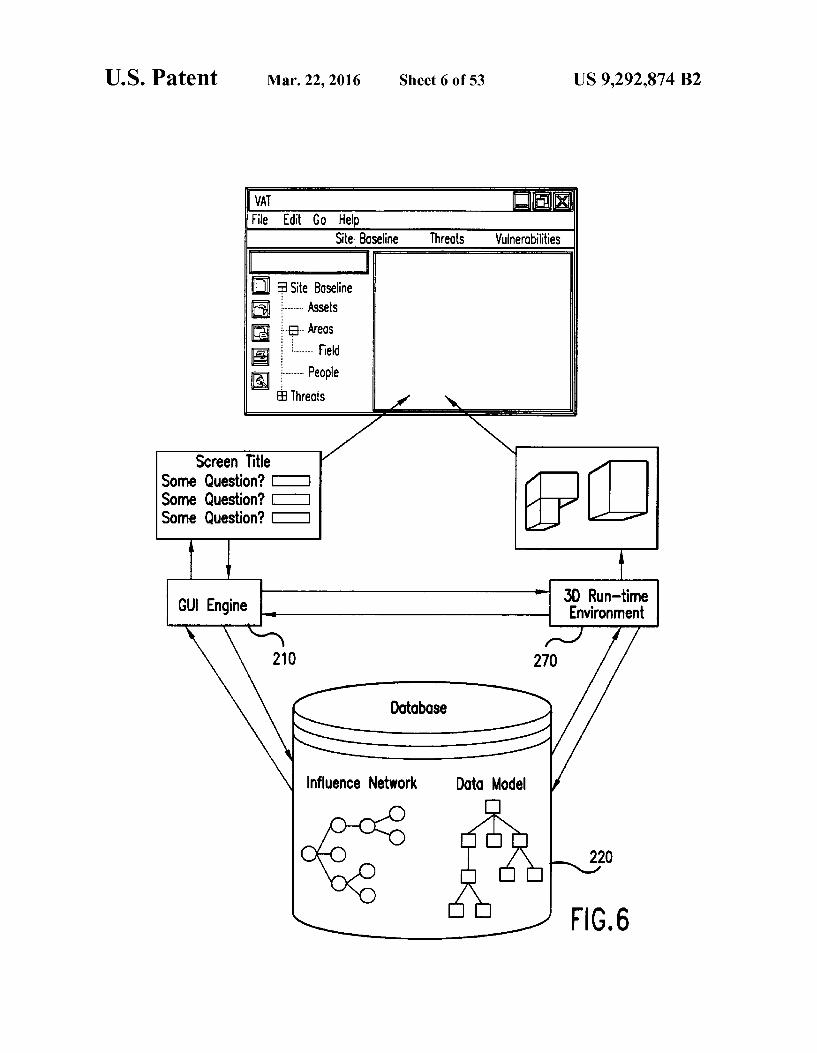
FIG. 6 is a symbolic diagram showing inputs to the VAT database.
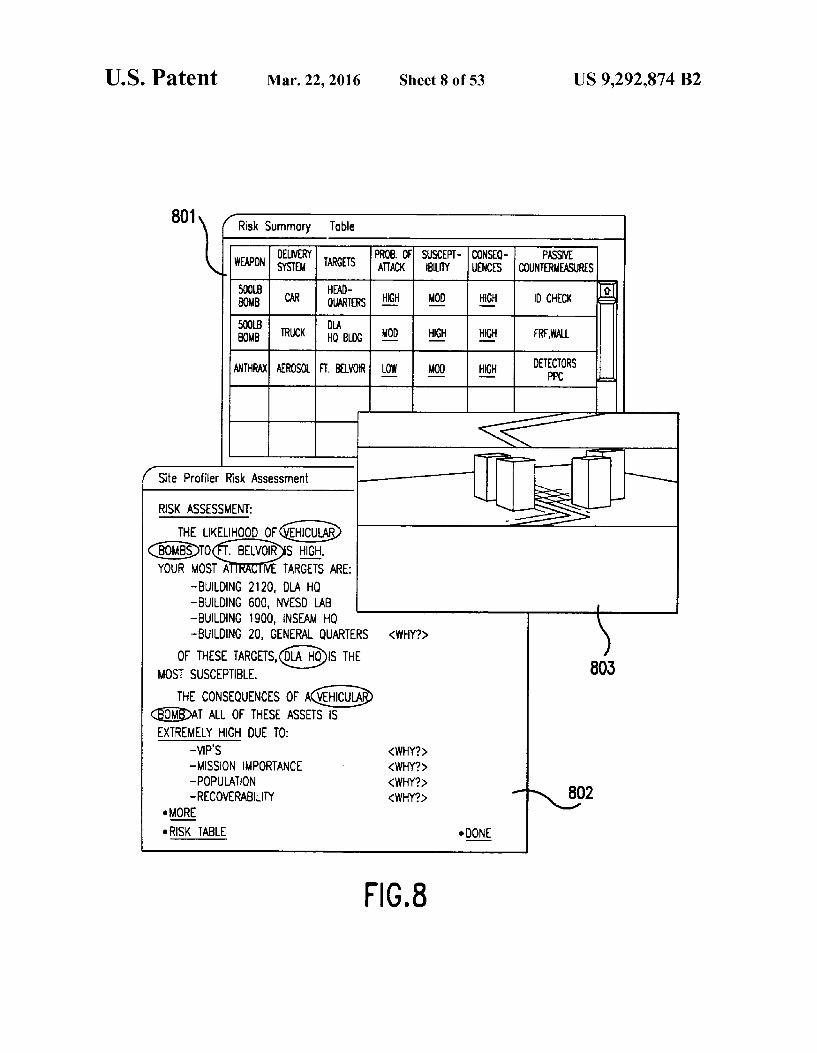
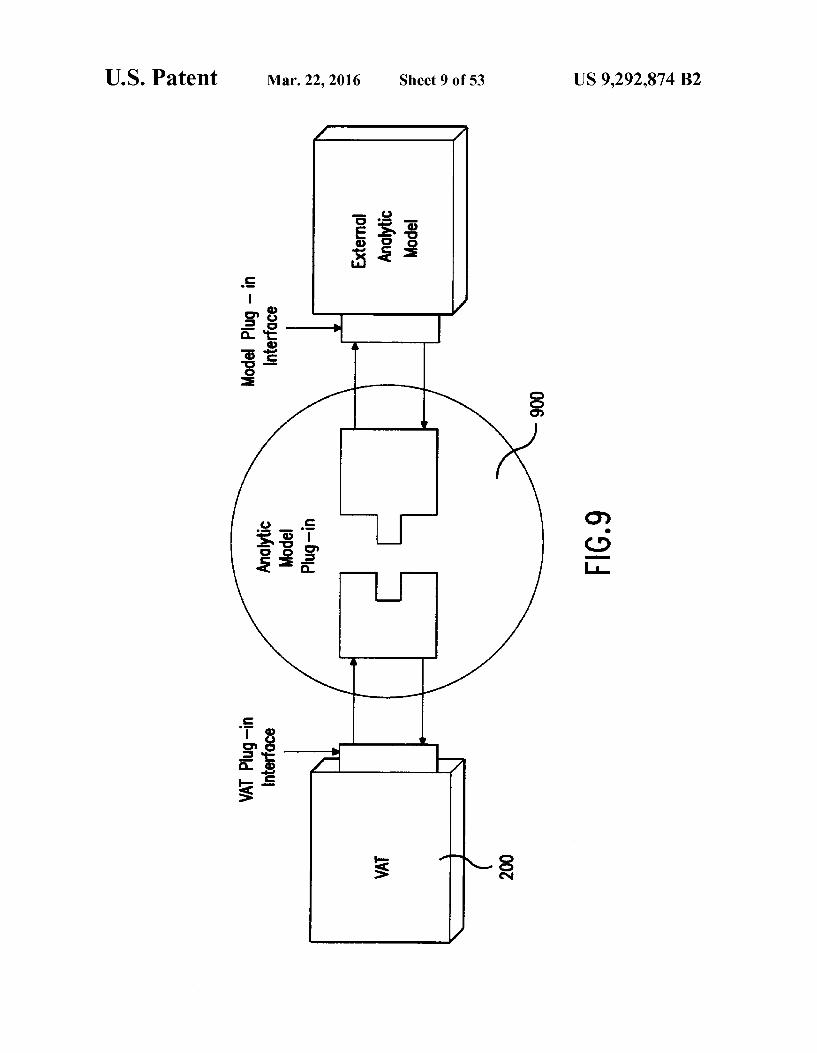
FIG. 7 is an exemplary illustration of a 3D builder screen. FIG. 8 is a view of screens generated by the GUI. FIG. 9 is a symbolic view of the plug-in architecture. FIG.10 is a symbolic view of the report generation process. FIG. 11 is a schematic view of the interaction of the VAT
Editor with other system components. FIG. 12 is a block diagram showing connection of the
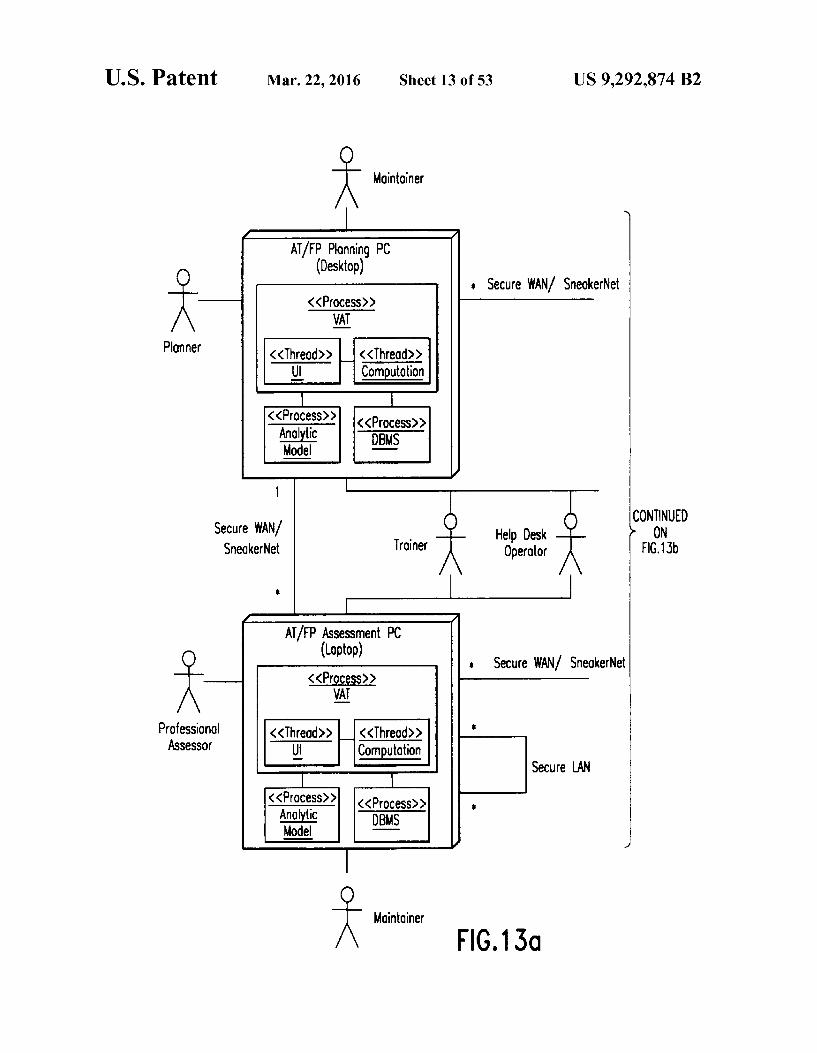
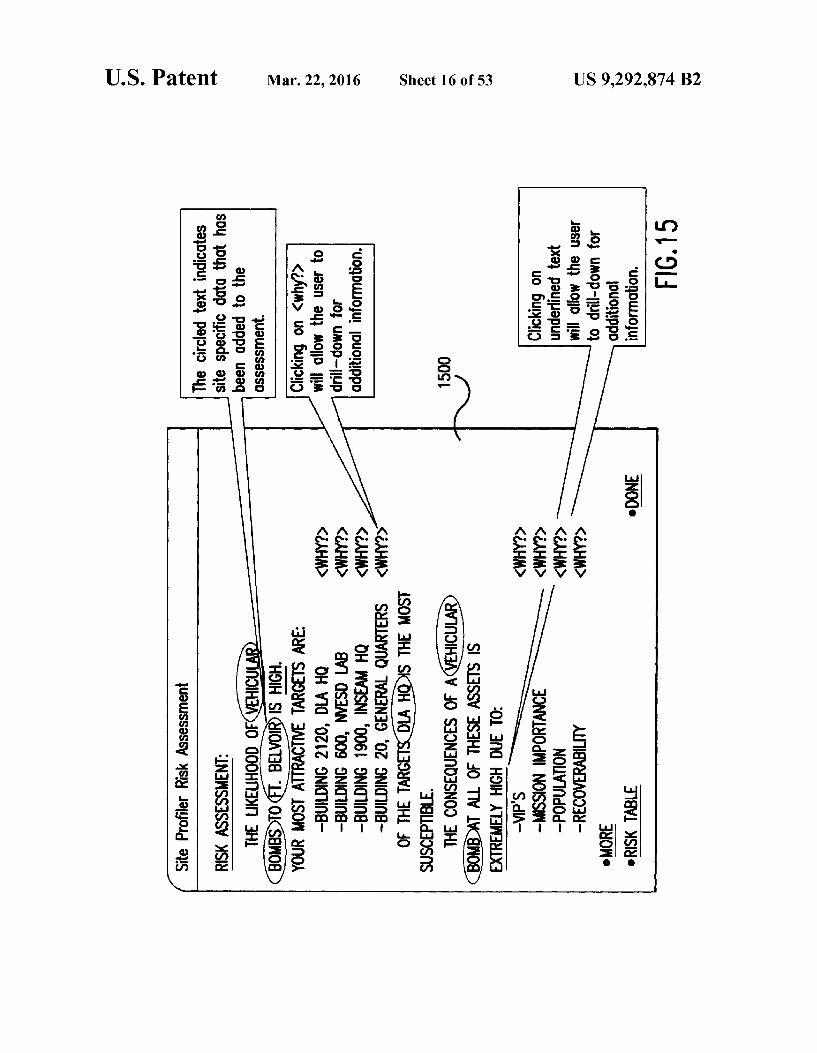
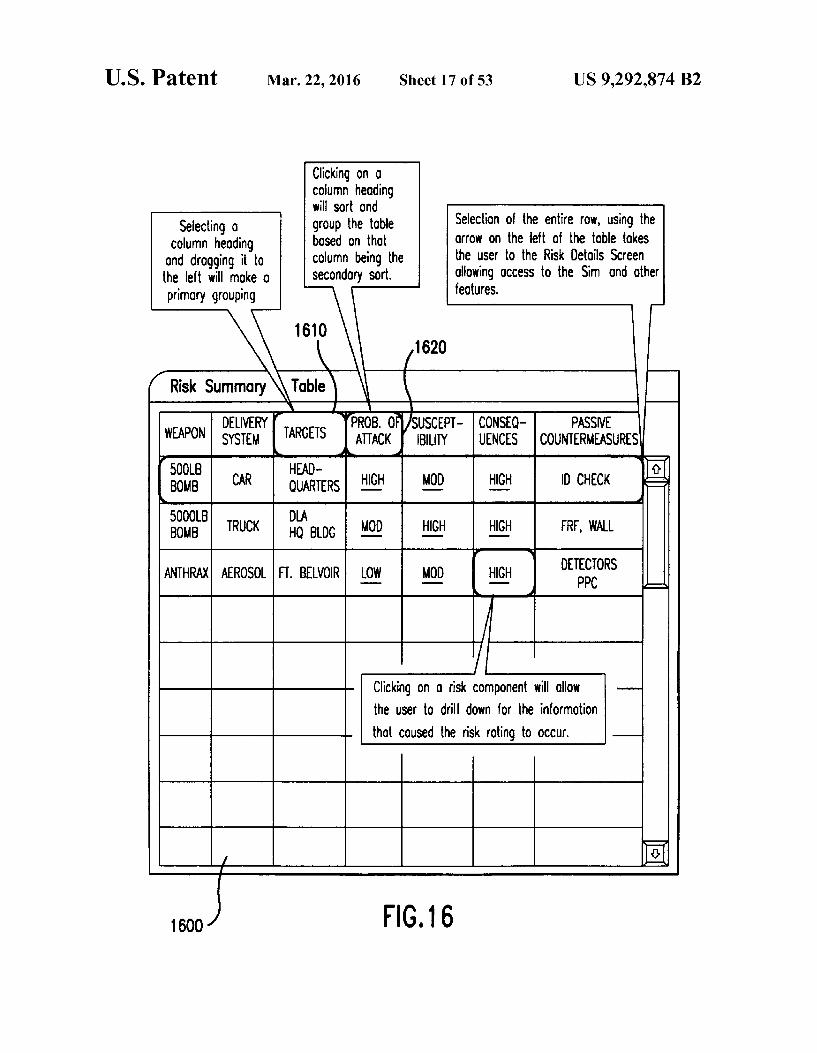
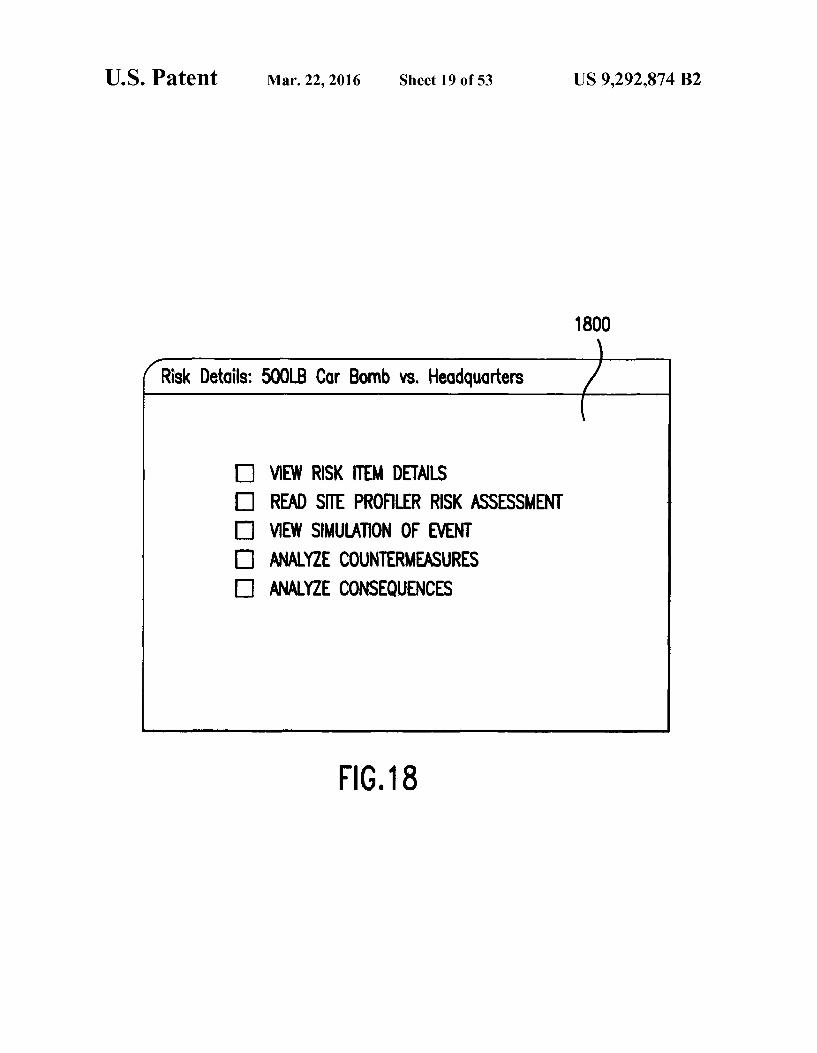
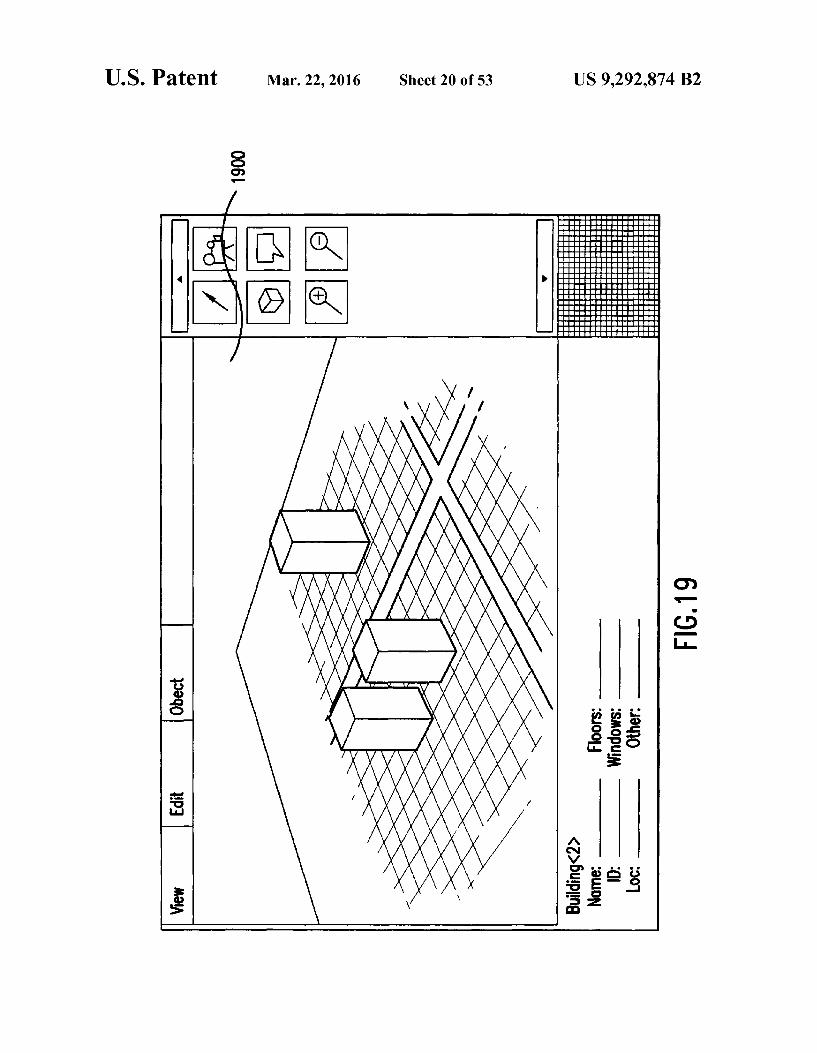
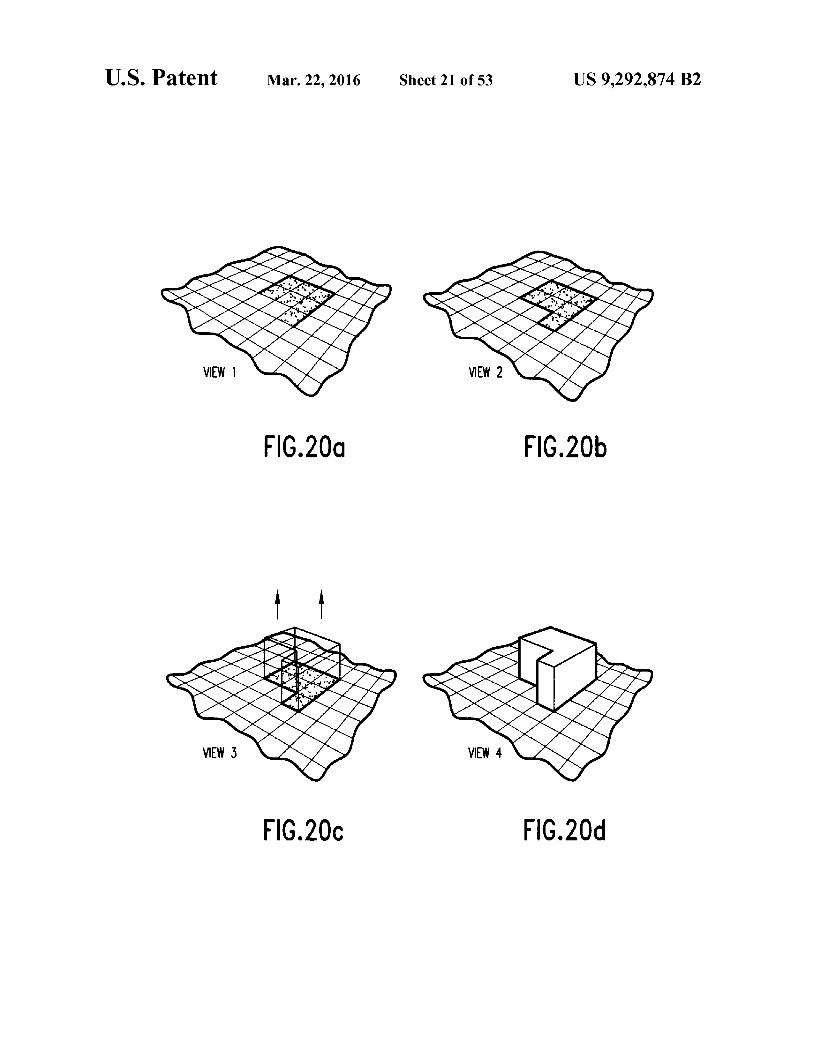
TIMS to remote computers/terminals. FIG. 13 is a user/AVAT interconnection diagram. FIG. 14 is a review of a Planner Interface screen format. FIG. 15 is a review of the Risk Assessment Screen. FIG. 16 is a review of the Risk Summary Table Screen. FIG. 17 is a review of the “Probability of Attack” Screen. FIG. 18 is a review of the Risk Detail Screen. FIG. 19 is a view of the 3D Viewer Screen. FIGS. 20 a-dare screen views illustrating the construction
of a 3D object. FIG.21 is a block diagram of the Approach Vector Process. FIG.22 is a flow diagram of the Risk Management Process. FIG. 23 is a data flow diagram of Blast and Fragment
plug-in data flows. FIG. 24 is a data flow diagram of Chemical/Biological/
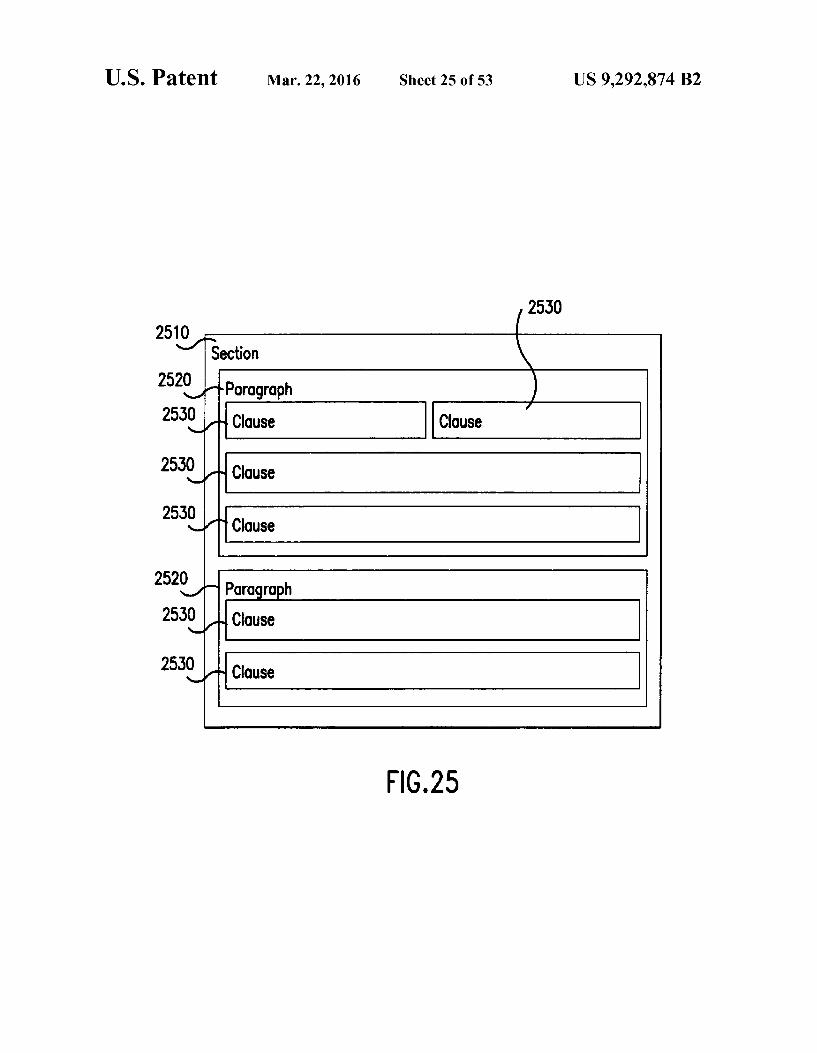
Radiological plug-in data flows. FIG. 25 is a schematic diagram of a user created report
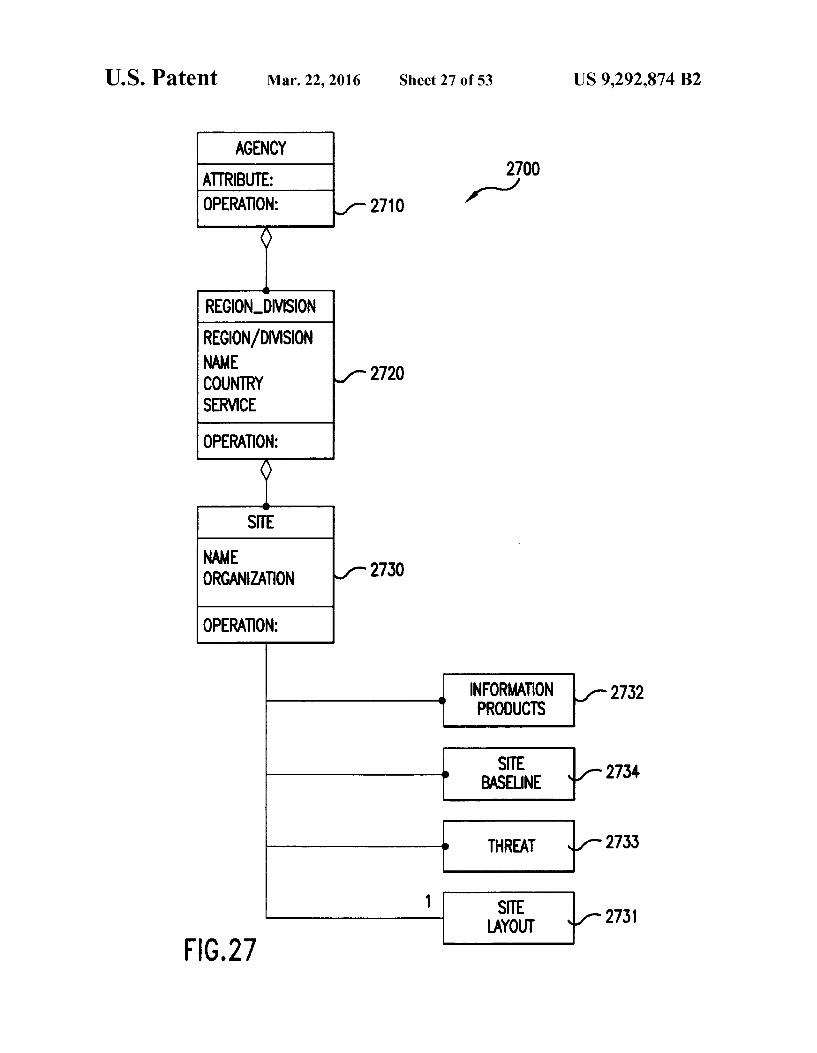
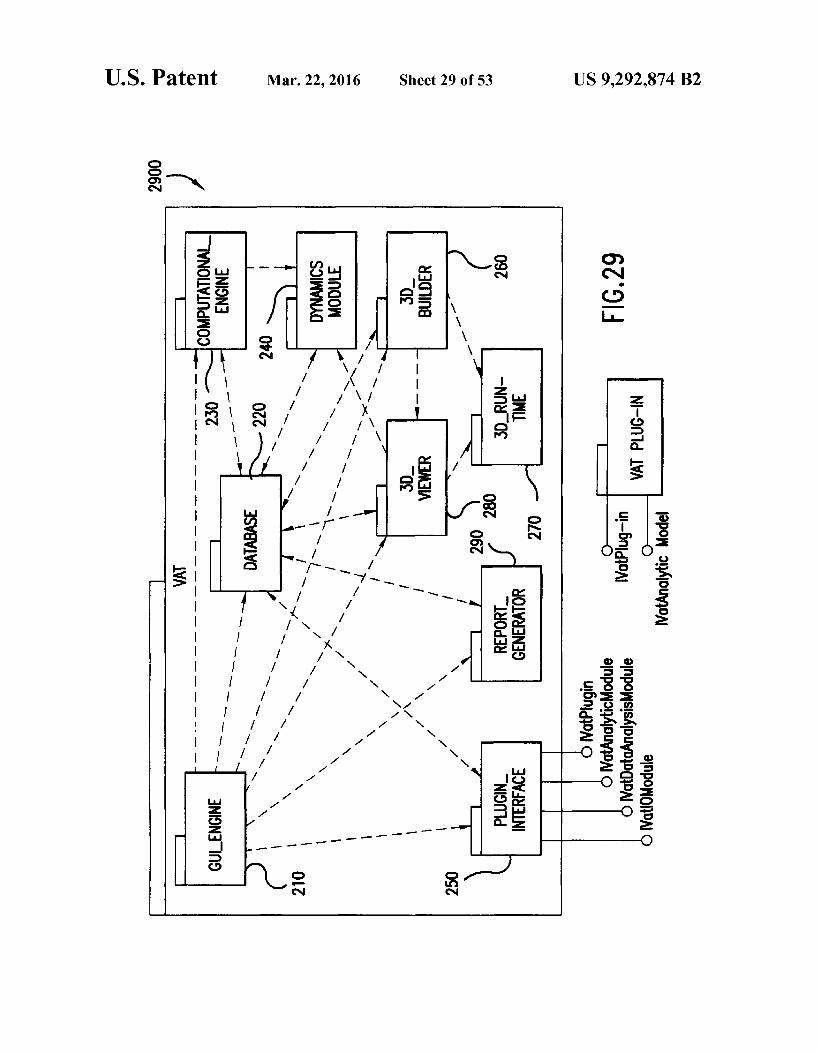
format. FIG. 26 is a block diagram of the VAT Data Model. FIG. 27 is a block diagram of the Meta Data Model. FIG. 28 is a symbolic diagram of Meta Data Model. FIG.29 is a block diagram of the VAT showing dependency
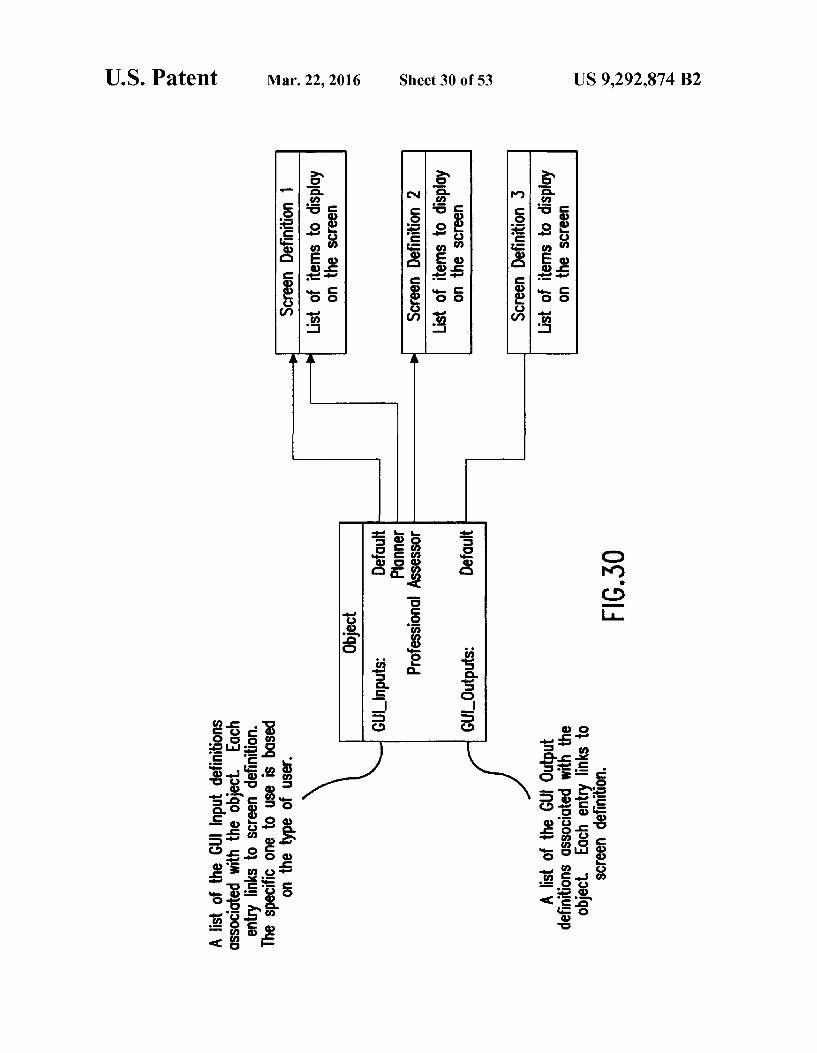
relationships. FIG. 30 is an object association diagram of the database. FIG. 31 is a table of exemplary screen definitions. FIG. 32 is a process diagram of the navigational override
process.

US 9,292,874 B2 5
FIG.33 is a block diagram of the risk management process. FIG.34 is a block diagram showing risk steps and influence
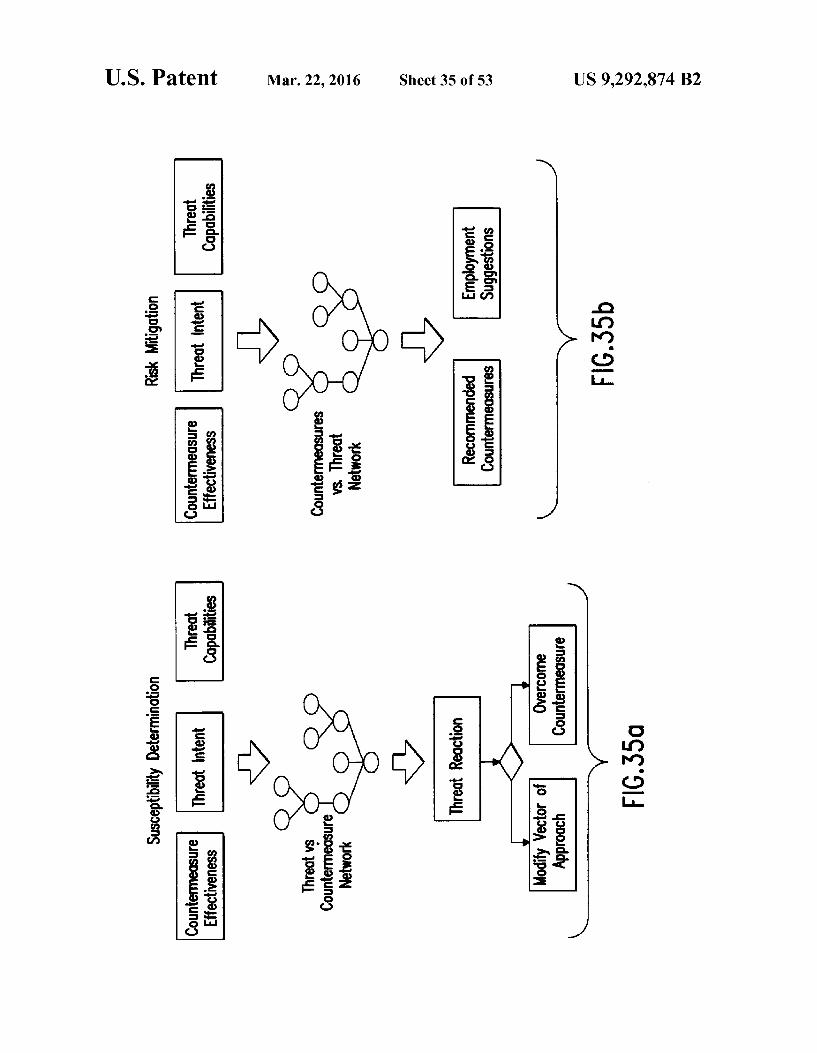
network interaction. FIGS. 35a and 35b are susceptibility determination and
risk mitigation process diagrams, respectively. FIG. 36 is a diagram showing the relationship between the
Influence Network, the graphical user interface, and calcula tions made against the model.
FIG. 37 is a flowchart showing calculation of approach VectOrS.
FIG.38 is a block diagram of the Dynamics Module. FIG. 39 is an object model to relational model conversion
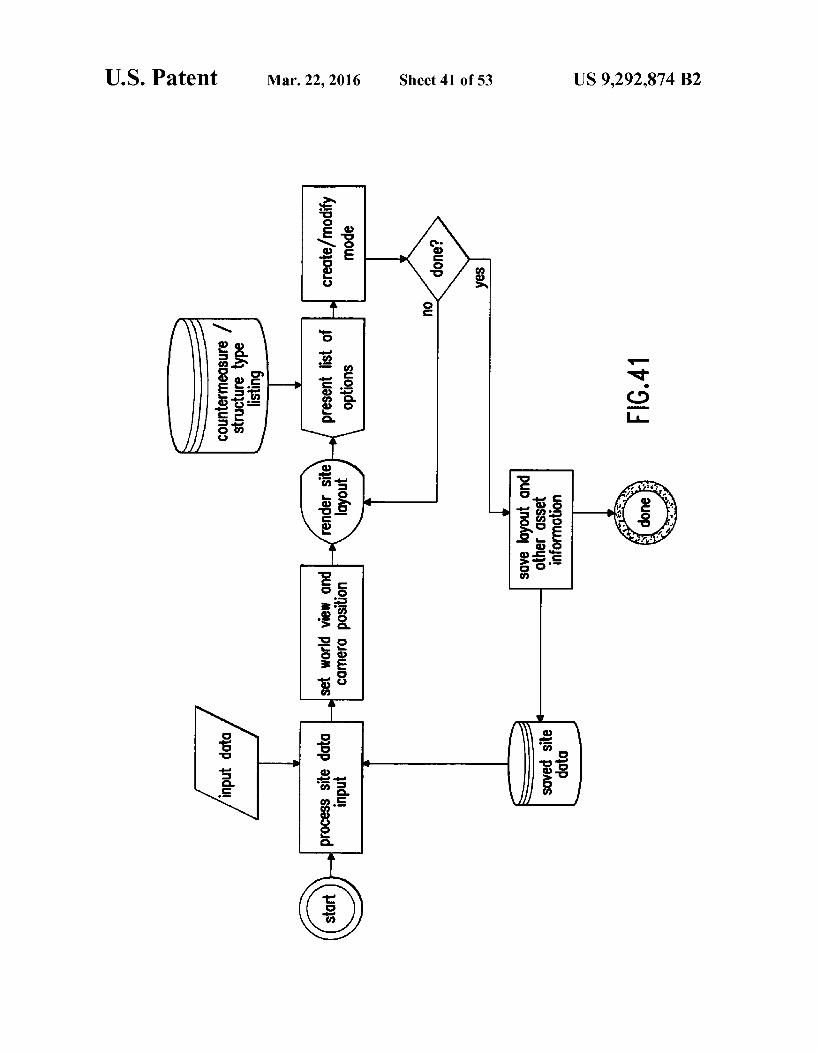
map. FIG. 40 is a class diagram of the Relational Data Model. FIG. 41 is a flowchart of the 3D Builder Process. FIG. 42 is a flowchart of the 3D Viewer Process. FIG. 43 is a block diagram of the 3D Run-time Environ
ment.
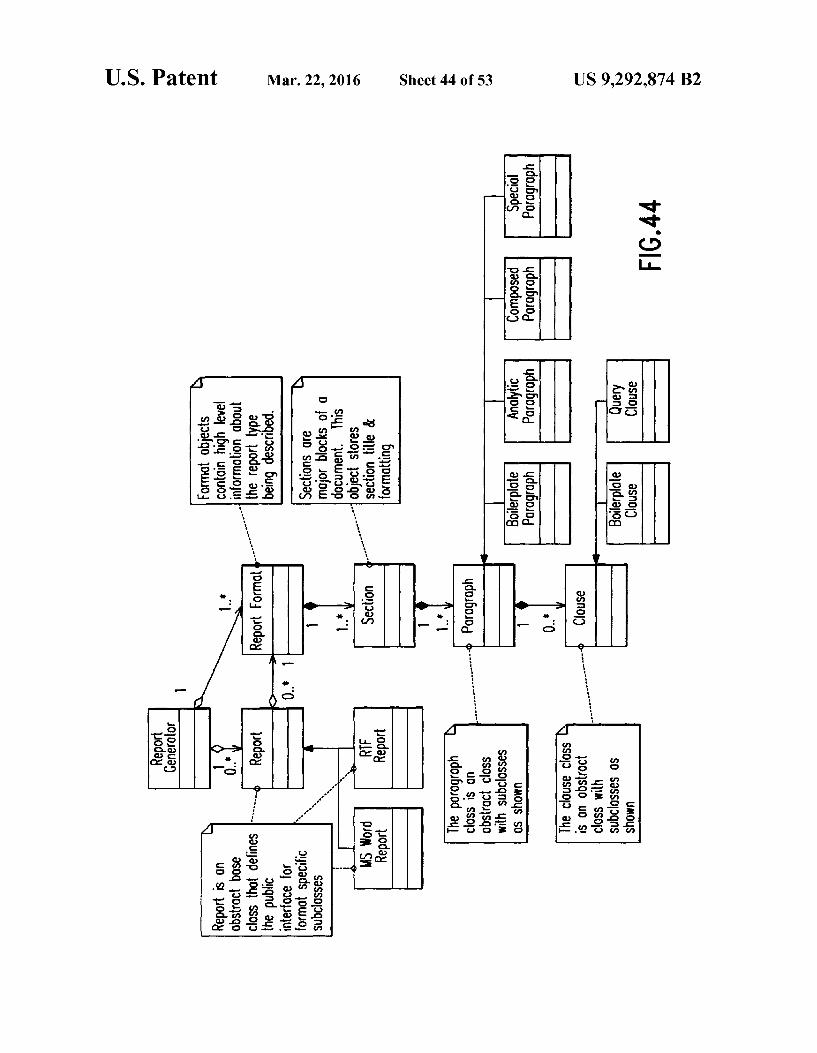
FIG. 44 is a block diagram of the VAT Report Generator Subsystem.
FIG. 45 is a schematic diagram of the VAT Plug-in Inter face Class Structure.
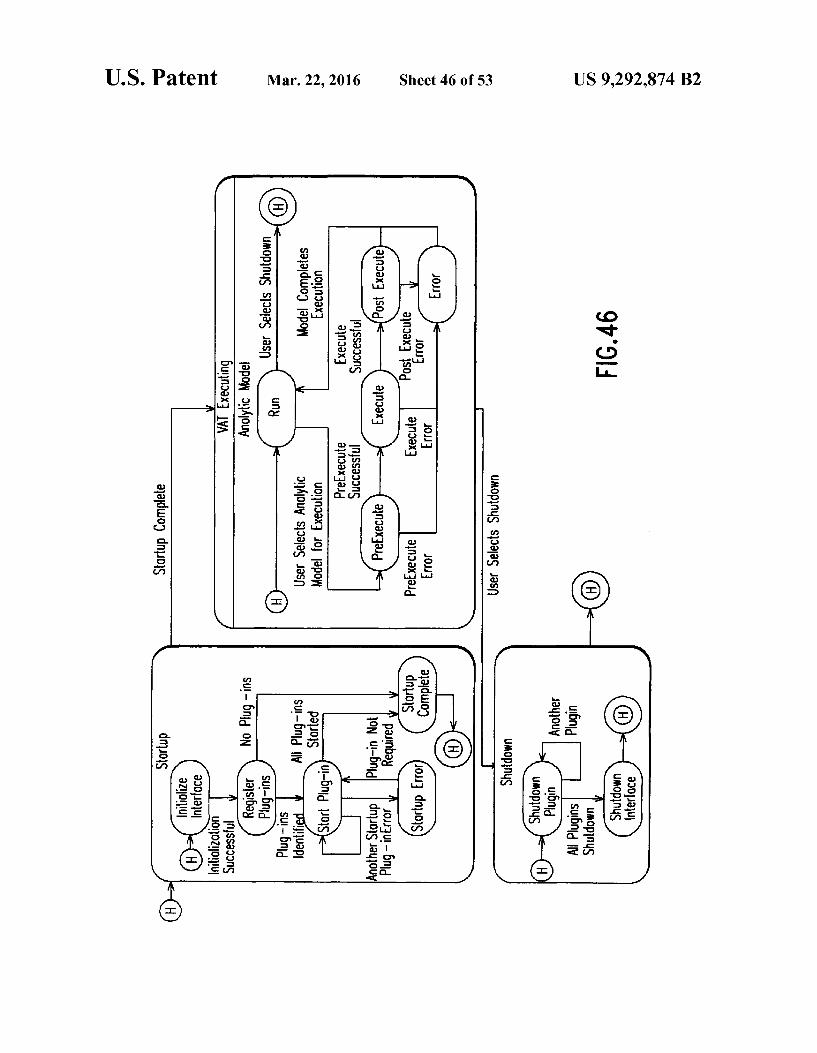
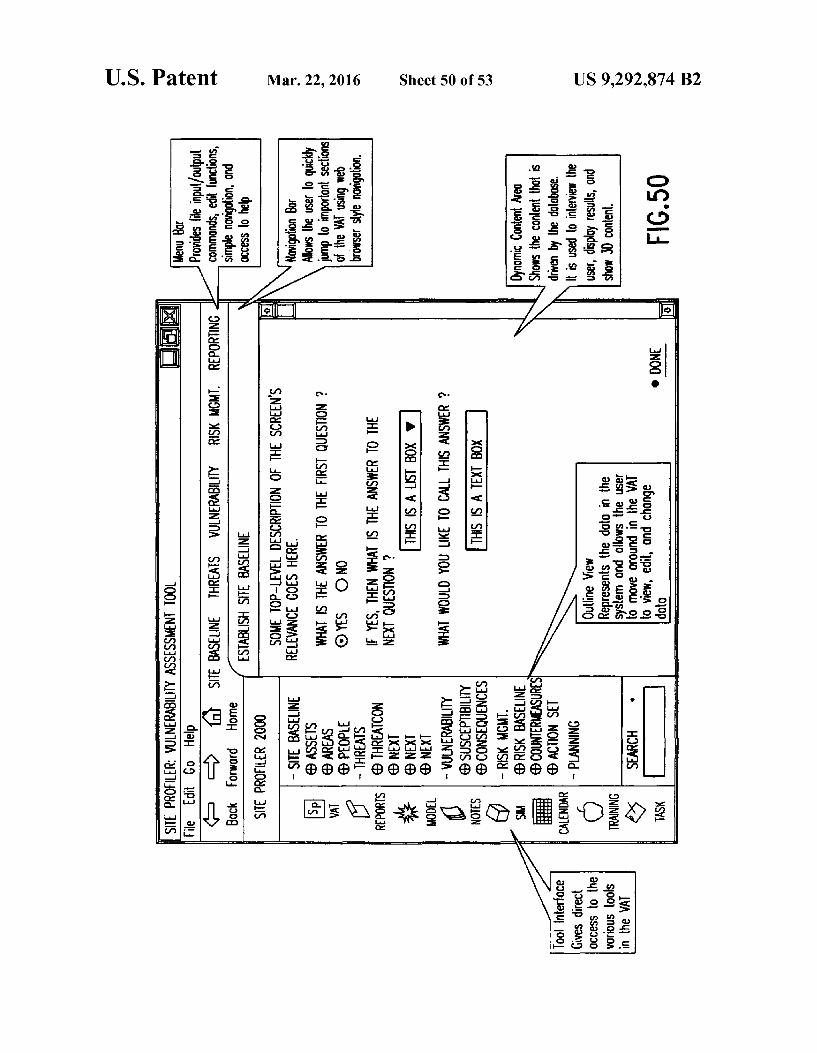
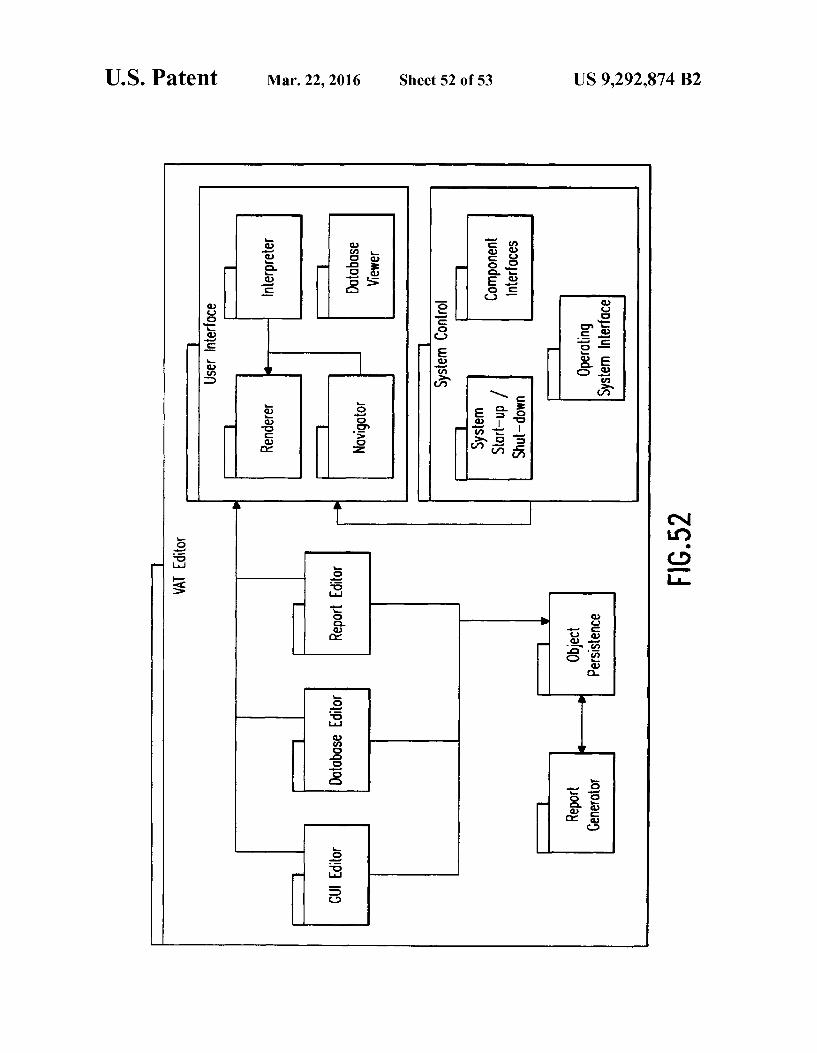
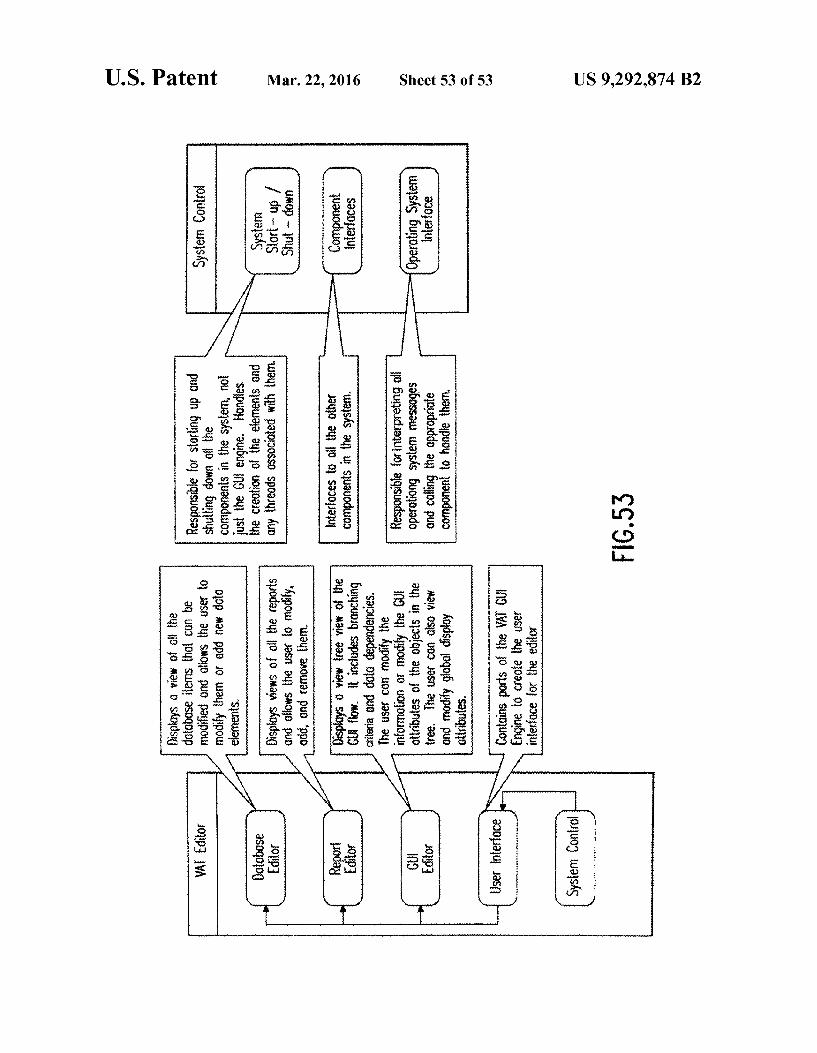
FIG. 46 is a VAT plug-in state diagram. FIG. 47 is a review of the TIMS Browser Screen. FIG. 48 is a TIMS Client-Server network diagram. FIG. 49 is a view of the VAT Editor Modes Screens. FIG.50 is a view of a user interface screen. FIG. 51 is a node-GUI relational diagram. FIG. 52 is a package diagram of the VAT Editor. FIG. 53 is a block diagram of the VAT Editor.
DETAILED DESCRIPTION
The present invention will be discussed with reference to preferred embodiments of risk management programs. Spe cific details, such as graphical user interfaces, report formats, etc., are set forth in order to provide a thorough understanding of the present invention. The preferred embodiments dis cussed herein should not be understood to limit the invention.
Although the invention has many uses, it finds particular utility in the terrorism risk management arena. Thus, the invention will be discussed in connection with terrorism risk management embodiments. However, as will be discussed further below, the invention is useful in many fields and is not limited to terrorism risk management embodiments.
Referring now to FIG. 1, an automated vulnerability assessment tool (AVAT) 100 includes a vulnerability assess ment tool (VAT) 200, a theater information management sys tem (TIMS) 130, and a VAT Editor 150. In preferred embodi ments, the tool may be run on a personal computer or workstation. Each of these component parts of the AVAT 100 will be discussed in further detail below. The Vulnerability Assessment Tool The VAT 200 presents a single interface to the user that
accesses a powerful underlying architecture. This architec ture, shown in FIG. 2, is a complex integration of modules that are collectively employed to meet the needs of the VAT 200 users. FIG. 2 shows the modules that comprise the VAT 200, the VATs 200 external interfaces, and the relationships among the components. This complex architecture is better understood by a description of how the system is used.
Users must first interface with the system through a con sistent and effective user interface. The users are not expert computer operators or technical experts, so the mode of com munication must be straightforward and easily understood by the layman. The GUI 202 provides a web-like interface to the system with easy navigation references, screens that are
5
10
15
25
30
35
40
45
50
55
60
65
6 simple and logically organized, and based on a dialog with the user rather than a form-based input. The VAT 200 User Inter face exemplary screen 300 depicted in FIG. 3 illustrates what the user interface looks like as the user enters information. This screen 300 allows direct access at all times to the tools associated with the VAT 200 and provides a structured or non-linear progression through the data entry interview, depending on user choice. The GUI Engine 210, shown in FIG. 2, (the term engine in
a software context relates to a program that provides a specific capability, but is easily modifiable to Support various imple mentations. A "GUI Engine' is simply a program to interact with the user graphically, without requiring scripted user interface screens. A Web browser is a good example of a GUI Engine 210 the browser displays any Hypertext Markup Language (HTML) document and its links without them being programmed in the browser) allows user interface con tent to be different for each user while the structure of the interface 202 remains the same. This allows the VAT 200 to communicate differently with Planners and Professional Assessors, or even among the Services. For example, the Planner interface 204 contains instruction, examples, and a more verbose dialog to elicit the same information that the Professional Assessor may be able to enter through a simple form provided by the Professional Assessor interface 206. This allows the user interface 202 to be individualized, ensur ing that the data is entered and displayed correctly for all users, but efficiently and quickly for expert users. The GUI Engine 210 receives all of the screens, questions,
and display data through the Database module 220. The Data base module 220 is a relational database that contains all of the data used by the VAT 200, whether entered by the user, or calculated by the VAT 200, as shown in FIG. 4. Driving the GUI 202 from the Database module 220 allows the user interface 202 to be dynamic, customizable, and readily updateable without reprogramming the user interface 202.
Although the GUI's 202 first task is to elicit data from the user through the interview process, the primary objective of the GUI 202 is to interface with the underlying Computa tional Engine 230 module, shown in FIG. 2. The Computa tional Engine 230 combines user-entered data, along with data stored in the Database module 220, to calculate risk and all of its underlying components. The Computational Engine 230 uses elaborate artificial intelligence and simulation algo rithms to analyze and assess the specific targets, threats, Vul nerabilities, and ultimately, the risks at a user's site. The foundation for the Computational Engine 230 is the
Influence Network 500 shown in FIG. 5. This network 500 shows all of the nodes 510,510a that ultimately affect the risk of a given threat against a given target. The values for each of the nodes 510, 510a are combined using probability and statistics equations that account for the weighting of the vari ous nodes and the uncertainty in their values. The network 500 also provides results without requiring all of the data to be known. Thus, if the user does not have information for the detailed leaf nodes 510a the network 500 can adapt and solve the network 500 based on higher level data. The VAT 200 architecture allows nodes 510, 510a and
sub-nodes (not shown in FIG. 5) of the network 500 to be turned-on as new information is available. With additional information, the confidence in the results should increase. For example, the likelihood of an attack may not change as the user adds additional information at the leaf nodes 510a, but we can be more confident in the threat likelihood if it is backed up by supporting information. This flexibility allows users to gain quick insights into their risks and improve on their risk assessment as additional information is available.

US 9,292,874 B2 7
This network 500 also provides a rigorous, quantitative calculation of risks. The network 500 provides an intuitive representation of the factors that the calculation considers. It can be readas, Leaf nodeX influences branch nodeY, which, in turn, influences node Z. The network 500 is capable of handling influences that cannot be quantitatively described. Thus, if one cannot be sure how much the anniversary of the Branch Davidian incident will affect the Probability of Attack (via the “Triggers' LeafNode 510a), one can still include it in the network 500 calculation by simply stating that it may increase the probability. The implementation of the network 500 in the Computational Engine 230 also allows for the network 500 to be changed or modified without re-program ming. Thus, if experts or events indicate that a new factor should be considered, it can be added to the risk network 500 by creating a new node object in the Database 220.
The network 500 provides an integrated representation of the factors that impact the specific risks at a site in a manner that can be understood by subject matter experts (to validate the model) and interpreted by the VAT 200 so that results can be displayed in a meaningful manner to VAT 200 users. The data used by the network 500, as well as the network 500 itself, can be modified and upgraded by modifying the data base 220 without deriving a new equation or reprogramming the VAT 200 artificial intelligence (AI) algorithms. Many of the inputs to the network 500 can come directly
from the GUI 202. Other inputs are derived from databases or are provided from intermediate AI, simulation, or model cal culations. Threat vectors, blast consequences and accessibil ity of a target are all examples of nodes that require additional complex calculations to be conducted. The Computational Engine 230 manages all of these calculations. When the cal culation involves the physics-based interaction of objects (i.e., like driving a truck), the Dynamics module 240 (shown in FIG. 2) is used to calculate the forces, speed, acceleration, and other relevant physical parameters. When the calculation requires detailed modeling of weapons effects the Computa tional Engine 230 accesses external models through the Plug in Interface 250 and uses the results of the model in the consequence nodes of the network 500. Each network node is stored in the Database module 220. Much of the data required by the Computational Engine
230 is spatial in nature. In order to analyze specific terrorist threats, the Computational Engine 230 relies on a 3D repre sentation of the user's site. This site is developed using the 3D Builder module 260. Like the GUI Engine 210, the 3D Builder module 260 is driven by the Database module 220 and all of the information entered into the 3D Builder 260 is stored in the Database module 220. Thus, all of the interfaces in the software are tightly integrated with a single database, as shown in FIG. 6. The 3D Builder 260, a screen shot 700 of which is shown in
FIG. 7, provides an interface for the user to build a 3D rep resentation of his site. The 3D Builder 260 imports files from computer aided design (CAD) programs or images and uses them as the outline for the site layout. The user can then build virtual representations of the buildings, roads, and perimeters of the site and identify population centers, VIPs, and countermeasures. This virtual representation of the site is stored in the Database module 220 and is used by the Com putational Engine 230 to compute threat vectors and the accessibility of assets and by the Analytic Models to calculate weapon effects against targets.
The GUI 202 must also display complex risk, spatial, tem poral, cost, and probabilistic data to the user in a useful and effective manner. Because the terrorist threat is often so vague and multi-dimensional, the information display must present
5
10
15
25
30
35
40
45
50
55
60
65
8 simplified representations of the information and allow the user to interact with the information to see how the data is inter-related what kinds of assets are most Susceptible to a certain threat, which threats bear the highest consequences, and so on. Information from the risk influence network 500 and information in the Database module 220 can be inter preted and displayed in many combinations and representa tions. The GUI 202 provides sortable tables, text interpreta tions of data, 3D animations of scenarios, and graphs like the screens 801, 802,803 shown in FIG.8. The GUI 202 provides web-like capability to drill-down into any high level informa tion presented by the GUI 202. For example, if the probability of attack for a given threat is described in the GUI 202 as high, the user will be able to click on high and drill-down to the nodes that caused the value to be high (e.g., Organiza tionX is active in your area, they have Y weapon capabilities, and Zholy day is a trigger for this threat).
Understanding risk and the inter-relationships among threat, critical assets, and Vulnerabilities is essential to devel oping an AT/FP plan. The Computational Engine 230 inter prets threat data and recommends countermeasures to the user that should be used to reduce the threat or the conse quences of an attack. These countermeasures are not limited to hardening of assets (blast walls, FRF, etc.) but include COuntermeasures to:
Deter the threat from acting, Deny access to the target, Detect the threat or event, Mitigate the consequences of an event, Interdict the threat, and Respond to the event. The Database module 220 retains the relationships among
these countermeasures and procedures and the threats that they counter to allow the user to develop a defensive posture. The 3D Builder 260 allows the user to specifically place countermeasures and optimize their placement to be most effective against the threat. The VAT 200 allows the user to consider costs when
employing countermeasures to manage risk. The VAT 200 does not provide a detailed cost modeling or cost benefit analysis capability; however, for classes of countermeasures the user may select, the VAT Database 220 is populated with initial cost and recurring cost parameters. The values for these parameters are defined as none, low, moderate, or high. The database also contains fields for the user to enter dollar costs for specific countermeasures, if desired. These costs can be printed in custom reports or viewed in risk Summary tables to sort and rank risk mitigation strategies by cost. Much of the risk data presented to the user is generated by
the Computational Engine 230. However, when considering risk, one of the most important considerations is the conse quence of a specific threat against a specific target. The results of a threat-target pair must be analyzed to determine the casualties and damage that would result from the event so that this data can be used in the risk network 500. Rather than developing a simple routine or a new weapons model, the VAT 200 uses existing blast and nuclear, chemical, biological, and radiological (NCBR) models to calculate the consequences used by the Computational Engine 230. In preferred embodi ments, six models will be included with the VAT 200: AT Planner from U.S. Army Corps of Engineers Water ways Experiment Station
FP Tool from Naval Surface Warfare Center, Dahlgren, Va. Blast/FXTM from TRW, Inc. Blast Card (Look-up table) from TSWG HPAC from Defense Threat Reduction Agency (DTRA) CBR Card (Look-up table) from Titan Corporation
US 9,292,874 B2 9
The plug-in interface 250 provides a mechanism 900 (shown symbolically in FIG. 9) to send the model data from the VAT 200 that is needed to properly execute the model. The results of the model calculations are then sent back to the VAT 200 where they are interpreted and used by the risk network 500 and presented to the user. All of this happens without the user having to launch another program, learn how to use each of the external models, or enter the same information over again in another application. The VAT 200 architecture allows other developers to inter
face to the VAT 200 and provide new models and capabilities that were not initially built in to the VAT 200. This flexible architecture ensures that the VAT 200 is not limited to yester day's state-of-the-art, but rather, that it can be upgraded through plug-ins to take advantage of evolving models and data. Much like the model plug-ins, the data used by the decision network 500, the GUI 202 screens, and the database 220 itself can be modified by the VAT 200 support organiza tion. Thus, as doctrine or the understanding of the terrorist threat improves, the VAT 200 can be readily modified to use this new information.
The VAT Database 220 can be exported from the system. This will not only allow for back-ups of the data, but also allows the Database 220 to be exchanged among users. This will allow Professional Assessors to import an installations existing VAT Database 220 and use that as the starting point for their assessment—thereby eliminating the need to re enter data.
All of the data entered by the user and the information calculated by the system is stored in the Database module 220. This information is therefore available for export and dissemination to reports and other applications as shown in FIG. 10. The VAT 200 will provide, at a minimum, the report formats from the JSIVA Report and the AT/FP Installation Planning Template. Information from the VAT 200 will be used to populate these reports and the user will be able to finish the reports by writing the remaining required text. This document will then be saved to the database and will be available in Microsoft WordTM format for reproduction. The VAT 200 will also provide the flexibility for users to create custom reports or to save out and print VAT 200 risk assess ment reports. VAT 200 Editor
In order to make this modification possible, the AVAT 100 Suite design provides a flexible architecture of component modules and a suite of tools (referred to herein as the VAT Editor 150) that can be used to modify the system. These tools allow the VAT 200 support organization to modify the VAT 200 without having to rely on the system developer or wade through millions of lines of code. Since all of the components of the system are tightly integrated with the Database module 220, the VAT Editor 150 essentially provides away to modify the existing database 220 to change the GUI 202, Computa tional Engine 230, report output, etc., a shown in FIG. 11. Theater Information Management System (TIMS) The VAT 200 information is also available to Senior Com
manders via the TIMS 130 to compare among the sites within their area of responsibility (AOR). The TIMS 130 is a web based application that allows Senior Commanders to view top-level threat, Vulnerability, and risk data from multiple VAT databases 220. These databases are stored in the TIMS 130 database that can be located on any web network 1200. The Senior Commander will access this database through a web browser client on any connected computer 1210 as shown in FIG. 12. Data from the TIMS 130 can be compared, sorted, searched, and graphed. The TIMS 130 will be built
5
10
15
25
30
35
40
45
50
55
60
65
10 using industry standard web technologies so that it can be integrated with other web applications.
Through the Plug-in Interface 250, the VAT 200 can also exchange data with other applications. This will allow the VAT 200 to import and export data to the JSIVA Information System (JIS) and other similar applications. This will ensure that users who have an investment in other applications will be able to effectively migrate to the VAT 200 and that users of all of the applications will be able to exchange data. While it may not be possible or desirable to provide an exchange mechanism for all of the data among the VAT 200 and other systems, the Plug-in Interface 250 will minimize the amount of re-entry of existing data. AVAT 100 Suite Deployment The VAT 200, TIMS 130, and the VAT Editor 150 may be
deployed for, by way of non-limiting example, the identified users as shown in FIG. 13. FIG. 13 shows the typical configu rations for each user and the interfaces among the users. User Interface Design A preferred embodiment of a VAT 200 interface design is
illustrated in FIG. 3. This design provides a web-like inter face. The main content 310 window displays the interview, calculated results, and the 3D scene to the user. The panel320 to the left of the main content window 310 provides an outline view for context and to allow the user to navigate the appli cation as he/she desires. The toolbox 330 on the far left of the screen 300 provides ready access to major components of the system including external analytic models, the simulation, and output reports.
FIG. 14 and FIG. 15 are examples of the types of screens that appear in the main content window. The typical Planner Interface Screen 1400, as shown in FIG. 14, has large fonts, natural English, and establishes context for questions and information before they are presented. The Risk Assessment Screen 1500, shown in FIG. 15, is a
notional representation of an intelligent natural language rep resentation of risk data provided by the Computational Engine 230. This screen 1500 can be customized for each site or user, uses natural English, and interprets the risk network 500 data like an expert would. This interface allows the user to click on words like “High' to see the underlying informa tion that influenced that determination. This screen can be printed or used in custom output reports. The Risk Summary Table 1600, shown in FIG.16, provides
a powerful mechanism for the user to interact with risk data and understand the risks to their site. Clicking on data within the table 1600 displays detailed supporting information. Selecting a row allows the user to see all of the details for that row or to view a simulation of the event represented by that OW.
Clicking on one of the first three column headings from the Risk Summary Table 1600 makes that column the primary grouping function. This allows the user to see risks grouped by weapon, delivery system, and target. Clicking on any other column heading makes that column the secondary sort. Therefore, clicking on the “Targets' column heading 1610 and then clicking on the “Prob of Attack’ column heading 1620 would group all of the risks by target and sort them according to their probability of attack as shown in the screen 17OO in FIG. 17. The Risk Detail Screen 1800, as shown in FIG. 18, is
accessed by clicking on the value of any of the calculations represented in the Risk Summary Table 1600. In this example, the user clicked “High in the “Prob of Attack” column of the 500 pound car bomb against the Headquarters row. This screen shows all of the detailed information for 500 pound car bombs. The user can click on “more' for any of the
US 9,292,874 B2 11
statements that support the “High' assessment to see the information that they are based on. This data is derived from the Risk Influence Network 500. The Risk Detail Screen 1800 can also be accessed through the outline view.
After accessing the data in tabular form, the user can then view scenarios in a 3D simulation/gaming environment in order to gain more insight into the threat vector as played against his/her site layout and countermeasure setup.
The 3D Viewer 280 allows the user of the VAT 200 to play various threat scenarios against his/her site. The site layout is read in from the database as constructed in the 3D Builder 260. The Computational Engine 230 is then invoked to cal culate threat vectors, and the resulting data displayed on top of the layout in a three-dimensional view. The user is then able to select a vector based on delivery type, risk value, or other such factors, and play the threat against the site in a realistic manner so that the consequences can be viewed. After the threat vector has been played, the user can then switch to the 3D Builder 260 mode to add countermeasures, move countermeasures, or make other changes, and then run the simulations again as he/she builds up a site layout and plan. FIG. 19 displays a simplified example of a 3D Viewer Screen 1900. The 3D Builder 260 allows the user to construct his base in
the VAT 200 system for use with the various modules to calculate Vulnerability and mitigate risk. The user is pre sented with a palette of standard 3D construction tools, cam era movement options, and structure types to build. The coun termeasure library and structure types are read in from the database, and the list is presented to the user so he can select a structure to build, maintaining the notion of a dynamic interface to the user based upon the information in the Data base module 220. The user then uses the tool to build up the site on top of a base image of the layout (Scanned-in map. perhaps) or use a base AutoCAD DXF file if applicable, to add countermeasures, and to define the site perimeter. An exemplary interface to the 3D Builder module 260 of
the VAT 200 is shown in FIG. 7. After all buildings and structures are placed on the map, the road network can be drawn in using line segments, and any bodies of water can be placed. If any structure requires additional information (Such as number of people inside, etc.), the text area below the 3D view is used for text input that will be stored with the object. The user can then place any existing countermeasures such as cameras, guard posts, or jersey barriers for each THREAT CON level to set the site baselines. The site is then saved out into the database when all structures and countermeasures are placed. The process of building a structure is outlined in FIG. 20.
From the scanned in image, or just the bare grid layout, the user selects, point by point, the outline of the base of the structure (View 1). The system then fills in the outline and creates a solid 2D polygon (View 2). The user is then able to pull up on this polygon with motion of the mouse to extrude the shape into the third dimension up to the required height (number of stories or exact height) (View 3), and the system displays a final rendered building with shading and textures applied (View 4). Building other structures follows a similar method, with differences based on scale? orientation of the object. Smaller objects, or objects that cover large areas are "painted in using an object brush. For example, water is painted in as one would paint with a certain colorina Standard 2D drawing program. Jersey barriers, for example, are placed one at a time; each "paint spot' showing up as one barrier. Once placed, it can then be moved or rotated as desired.
10
15
25
30
35
40
45
50
55
60
65
12 Influence Network 500 The Influence Network 500, shown in FIG. 5, provides the
VAT 200 with a knowledge base from which to determine risk. The network 500 is comprised of all of the nodes 510, 510a that ultimately affect the risk of a given threat against a given target. A node is defined as a piece of data used to influence other data in the network 500. Using probabilistic inference, the nodes 510,510a in the network 500 are com bined to calculate belief. This belief is interpreted as the probability of a certain result occurring, based on all of the data available to make a determination. This determination can be made using either complete or partial data. Thus, if the user does not enter data for all of the detailed leaf nodes 510a, the network 500 can adapt to solve the problem based on the data entered. One of the more common techniques for representing
probabilistic knowledge in a network 500 involves Bayesian networks. Using Bayesian techniques, the Influence Network 500 is made up on a series of nodes 520, 510a with connec tions between each other. A node can have parents (nodes that cause an effect) and children (nodes that are affected), but the network 500 can not contain cycles (circular paths among nodes). Nodes without parents are considered leaf nodes 510a, and are typically where evidence is added to evaluate the network 500. Each node 510,510a is assigned a set of possible states, along with the probability of the state occur ring. These probabilities reside in a structure called the con ditional probability table, and represent the influences of prior beliefs on the decision. For leaf nodes 510a, there are no parents to affect the node's state, so the conditional probabil ity table simply contains probabilities of the node occurring. These values are set by the evidence assigned from external data.
Children nodes have effects attributed to them from their parent nodes, so their probability tables are far more complex. For each possible combination of inputs from the node's parents, the table contains a probability of occurrence for each possible output of the node. As evidence is posted to the leaf nodes, the probabilities ripple throughout the network 500 as belief propagates. Evidence can also be posted to child nodes, and belief can then propagate backwards to its parents. This powerful feature allows belief to be refined in the net work 500 at any level.
Initially, the conditional probability tables of all nodes in the network 500 are initialized to a default state, which is an expected bias in the answers. As evidence is posted to the network 500, these probabilities are refined and the network 500 produces answers in which we have more confidence. In this manner, partial data can be used to refine beliefs, with the initial probabilities responsible for “filling in the gaps’ of missing data. Using advanced Statistical techniques, the con fidence of each probability can also be computed. This con fidence is extremely beneficial for justification of answers. Because of the subjective nature of various data used by the system, defense of the system's results is vital.
Although the probabilistic inference of the network 500 requires complex mathematical operations, the structure of the network 500 is simple to represent. This presents flexibil ity in the VAT 200 design, allowing the network 500 to be configurable from the object database 220. With this tech nique, each node 510,510a of the network 500 is aware of its parents, children, and where it receives its data. Using these “smart” nodes, the network 500 structure can be stored in the database 220 and manipulated externally by the VAT Editor 150. By presenting the node structure to the user in an under
standable manner, the user can modify the behavior of the

US 9,292,874 B2 13
Influence Network 500. This is extremely beneficial to the VAT 200, as data refinement is vital to the survivability of the tool. As data becomes available, decisions made by the net work 500 can be modified to produce answers that are more accurate. In addition, if it becomes apparent that more data is 5 necessary to produce an answer, nodes can be added to the network 500 to refine beliefs. These nodes can only derive their data from the GUI 202, but by adding the node to the network 500 and modifying the tables of all nodes that it affects, the network 500 behavior can be altered.
Data used by the network 500 comes from several different locations. Data entered by the user directly into the GUI 202, as well as data resulting from the database and from calcula tions made by the Computational Engine 230, the Dynamics module 240, and external models are all used by the network 500. By providing data from various sources, the decisions made by the influence network 500 are highly robust, depen dent not only upon user knowledge, but also on statistics, simulation, and physics. 2O
Because of the strong involvement between the Computa tional Engine 230 and the Influence Network 500, the Com putational Engine 230 is responsible for constructing and maintaining the network 500. User inputs to the GUI 202 are posted directly to the network 500, but the Computational 25 Engine 230 coordinates any other input, resulting from cal culations or external models. Vectors of Approach The vectors of approach that are calculated by the VAT 200
determine the accessibility of a specific target to a specific 30 threat (an actor with a weapon system). These vectors not only provide valuable data to the relative risk determination of the VAT 200, but when displayed graphically they provide a powerful tool for the user in understanding the Vulnerabili ties to their site. In order to compute the vectors of approach, 35 a specific threat and target must be selected by the user. Using this data, the VAT 200 analyzes the threat and asset charac teristics, the site layout, and the physical security measures to determine all possible approach vectors to the target. The calculation of these approach vectors is a multi-step 40
process that takes into consideration the terrain, the layout of the site, physical capabilities of the threat delivery system, and the reasoning process of the threat actor. FIG. 21 outlines the complete process for creating the approach vectors. The primary algorithmic techniques employed in creating these 45 vectors are: a weighted graph search algorithm, first-order physics, decision theory, and pattern recognition.
Using the layout of the site and terrain, the weighted-graph search algorithm searches for a path between two points, avoiding obstacles and impassible areas. First-order physics 50 are applied to ensure realism in the chosen path. Decision theory is applied to determine the reactions of the threat upon encountering countermeasures. Once all of the possible paths have been computed, a pattern recognition algorithm elimi nates redundant vectors. 55 Risk Management
Risk management support is provided in the VAT 200 by allowing the user to modify the site baseline based on the determination of Vulnerabilities to specific threats. Once the user builds the baseline, characterizes assets and determines 60 specific threats, the VAT 200 walks him/her through a suscep tibility determination and consequence analysis. Suscepti bilities and consequences, coupled with the probability of a specific threat attack, make up the relative risk of a target against that threat. In order to perform risk management, the 65 user must reduce the Susceptibility of a target to an attack, the likely consequences of an attack, and/or the probability of the
10
15
14 attack occurring. All of these can be reduced through the employment of countermeasures or asset relocation.
FIG. 22 provides an overview of the risk management process. Based on the current site baseline and the Vulner abilities determined by the VAT 200, the user is presented with countermeasures to employ across their installation. By targeting the placement of these countermeasures against the specific Vulnerabilities, the user can reduce risk. To assist in this process, the VAT 200 analyzes the threat and suggests countermeasures that can best reduce the components of risk associated with the threat. Comparing the effectiveness of the countermeasure against the threat accomplishes this. Coun termeasures that are most effective against the threat are presented to the user, along with Suggestions for Successful employment. These countermeasures are not limited to hard ening of assets (blast walls, Mylar on windows, etc.) but include countermeasures to:
Deter the threat from acting Deny access to the target Detect the threat or event Mitigate the consequences of an event Interdict the threat Respond to the event As countermeasures are added and removed to affect the
risk, the site baseline is ultimately modified. The new baseline is then used to produce updated Susceptibility and conse quence determinations. Other risk management options such as asset relocation will also be permitted. This cyclic process highlights the iterative nature of risk management and its application to planning. The VAT 200 also allows the user to consider costs when
managing risk. Preferred embodiments the VAT 200 do not provide a detailed cost modeling or cost benefit analysis capability; however, for classes of countermeasures the user may select, the VAT Database 220 is populated with initial cost and recurring cost parameters. The values for these parameters are defined as none, low, moderate, or high. The database also contains fields for the user to enter dollar costs for specific countermeasures, if desired. These costs can be printed in custom reports or viewed in risk Summary tables to sort and rank risk mitigation strategies by cost. Analytic Models The VAT 200 uses analytic models to calculate the conse
quences of likely threat scenarios. The Influence Network 500 requires an assessment of the consequences of an event in order to calculate the overall risk. For preferred embodiments the VAT 200 potential consequences are simply damage to assets and human casualties. From these results, the risk network 500 calculates additional parameters such as the mission impact and the symbolic Victory the terrorist may receive based on biasing values the user has entered for the affected assets. The VAT 200 User Group selected the models that will be
provided with the initial release of the VAT 200. The VAT Plug-in interface 250 is also capable of interfacing with other models via the Analytic Models Interface. Table Abelow lists the models that are supported by preferred embodiments of the VAT 200. Other models may also be supported.
TABLE A
Analytic Models Analytic Models
Model Sources
AT Planner U.S. Army Engineers Waterways Experiment Station
US 9,292,874 B2 15
TABLE A-continued
Analytic Models Analytic Models
Model Sources
FP Tool Naval Surface Warfare Center, Dahlgren, Virginia
Blast FXTM TRW, Incorporation Blast Card (Look-up Table) TSWG HPAC DTRA CBR Card (Look-up Table) Titan Corporation
A design goal is to make the interaction of the VAT 200 with external models appear transparent to the end user. To support that goal, the VAT 200 provides all of the set-up data required by the models in the correct format and interprets the damage and casualties calculated by the model. As a result, although the data required from the user by the VAT 200 may be simple, the interaction of the VAT 200 and external models is quite complex. This complexity is due to several important issues. The VAT 200 and each of the analytic models represent the
same features in different ways requiring complex data transformations.
The analytic models have limiting assumptions that the VAT 200 must track and present to users.
The VAT 200 must ultimately accept data from the analytic models. The VAT 200 software has no means to validate this data.
Compounding these issues is that the VAT 200 is written to accept data from models that calculate consequences for all kinds of weapons systems. The VAT 200 includes plug-in modules that allow interfacing to six models covering blast, chemical, biological, and radiological agent scenarios. How ever, third party developers may produce plug-ins that inter face with other kinds of models in the future. Therefore, the VAT 200 must consider other kinds of models in its use of analytic models. The sections below describe the approach that the VAT 200 takes for each of the model interfaces present in preferred embodiments of the VAT 200. Consequence Model Plug-Ins Most plug-ins available in preferred embodiments of the
VAT 200 pertain to casualty estimation and damage assess ment. This ensemble falls naturally into two classes: those designed for estimating the consequences of blast and frag menting weapons, and those which calculate the conse quences of chemical, biological, or radiological weapons. The ensemble of blast and fragment consequence calcula
tors is diverse principally in the target dimension, the weap ons themselves for the purposes of VAT 200 being substan tially described by their net explosive weight and the presence or absence of efficient provisions for fragments. Targets, on the other hand, and particularly buildings, vary enormously in their sizes, shapes, construction details, the care in which they were constructed, their age, and their outfitting. In addition, Surrounding buildings and natural terrain features can mark edly intensify or diminish blast and fragment effects on a given building and on its occupants. The presence of build ings can shield people in the open from fragments, can chan nel weapon fragments at Some people, and can contribute building fragments (especially but not exclusively glass frag ments) to the injury-inducing or lethal objects flying through the air in the wake of an explosion.
In contrast to the blast and fragment family of weapon target encounters, the CBR family is knit together by the dependence of all of them on wind-borne travel from release
10
15
25
30
35
40
45
50
55
60
65
16 point to target. In the CBR family the variety is provided by the method of dispersal, meteorological/terrain effects, and by the varying quantities/qualities of the agents themselves. Conceptual Data Flow Between VAT 200 and Blast and Frag ment Analytic Models As FIG. 23 illustrates, data is exchanged between Analytic
Models and the VAT 200 through the Plug-in Interface mod ule 250. Blast and fragment analytic models model one or several physical phenomena. These include air blast, frag mentation, structural response, and casualty or personnel haZ ard mechanics. All of the blast and fragment analytic models preferred embodiments address building damage in some fashion or another. In order to function they need three cat egories of inputs or assumptions. These categories are the characteristics of the weapon, the characteristics of the build ing being analyzed, and the geometric and geographic context for the weapon and the building. A full real-world description of a weapon includes its net
explosive weight, its shape, its containment vessel, boosters Such as the presence of bottles of acetylene, and additional fragment generators that came with the weapon. Where the weapon is concealed, as in the case of explosives concealed in an automobile or in the sides and bottom of a Suitcase, the distribution of the explosives can affect the shape and power of the explosion.
Buildings have a host of features relevant to the calculation of damage. The detail with which the VAT 200 user charac terizes buildings may not match the detail for a given analytic model. One option is to group buildings into general classes (e.g. two-story, box-walled building). This general character ization could be provided to models equipped to expand that into a representative building. Alternatively, VAT 200 could do the expansion and send the representative building details to an analytic model. For either alternative there will be a reduction of predictive accuracy relative to providing actual details. A contrasting case for building construction is when the VAT 200 user provides greater detail than an analytic model is equipped to use. In addition, population within a building, may have multiple representations: the total popu lation in the building, numbers of people in each bay of a building, or individuals’ specific positions within the build ing. This discussion highlights the need for the VAT 200 Plug-in to provide the appropriate transformation of variables between potentially disparate data fields. The geometric and geographic context for weapon-target
pairs is also potentially much richer than some models are capable of processing. However, the user may not possess all of the information that a model could use to refine its predic tions and where the missing information is required, either the analytic model or VAT 200 will make reasonable assumptions that will be clearly explained to the user. VAT 200 expects the following output from blast and frag
ment models: Structural damage: Casualty information; and Information keyed to the geography showing the extent of
the various effects of the explosion. Conceptual Data Flow Between VAT 200 and CBR Analytic Models
FIG. 24 illustrates the data flows for the chemical, biologi cal and radiological (CBR) plug-in models. The atmosphere is the vehicle for dispersion of CBR agents after release. Atmospheric dilution, interaction with water or with other Substances in the atmosphere, and in the case of biological pathogens, exposure to Sunlight, all act to degrade the toxicity of one or another of these agents. CBR effects calculations
US 9,292,874 B2 17
require (in order of priority) agent release specifics, meteo rological conditions, terrain, and time of day. CBR Substance release information includes agent type,
amount, mechanism for release, and delivery mechanisms. The release mechanism describes how and how well an agent is aerosolized (e.g., explosive charge, spray, etc.) while deliv ery mechanism is the means of introducing the weapon sys tem to the target (e.g. letter bomb, aircraft, etc.). VAT 200 needs casualties and “damage' resulting from
CBR attacks. Damage is partly the result of casualties, espe cially casualties to key and essential personnel, but it can also be the result of denial of use of facilities or an area and equipment until decontamination has been performed.
Casualty information can be provided several ways. One is simply a count of dead and incapacitated. An analytic model provides such numbers on the basis of that portion of supplied population databases which applies to the installation in ques tion. A second method of expression is to provide geographi cally keyed data expressing the lethality density of the sub stance as a function of time. From the latter, VAT 200 is able to calculate its own casualty information taking into account building-by-building and area occupancy as a function of time of day. Even when the analytic model counts the casu alties the geographic data is still useful for assessing second ary mission impact (i.e. “damage'). It should be noted that preferred embodiments of the VAT 200 do not model or use the details of the interior of buildings or related heating and ventilation systems so the effects on personnel inside of buildings from CBR releases will be approximated by a stan dard mitigation factor. However, standard procedures rel evant to minimizing the casualties inside of buildings from CBR releases (e.g. turn off air conditioning or ventilation system) are provided. Top-Level Descriptions of Consequence Model Plug-Ins
Blast and Fragment Models Bomb Card
General Description TSWG’s Bomb Card, analytically represented in VAT 200,
provides ranges for building evacuation and ranges for with drawal of people in the open. Both are indexed on a progres sion of common or likely terrorist explosive devices, ranging from 5 pound pipe bombs to 60,000 pound semi-trailer trucks. The building evacuation distances are purely a func tion of net explosive weight. The open air evacuation dis tances are a composite of predicted effects from case shrap nel, thrown vehicle fragments, and glass breakage. Mechanics of Use VAT 200 will supply only type of bomb and net explosive
weight in TNT equivalent pounds to the Bomb Card model due to the simplicity of the Bomb Card “model” approach (i.e., a simple look-up table). The Bomb Card does not use any geometric and geo
graphic information beyond the XY coordinates of the burst—for example height of detonation and presence of blast walls or nearby reflective natural or artificial features are not taken into account. Most importantly, no account whatever is taken of the character or construction of buildings.
The Bomb Card will return information about building damage and potential for casualties to personnel in the open. AT Planner General Description AT Planner, a product of the U.S. Army Engineer Water
ways Experiment Station, was developed to aid engineers in evaluating Force Protection issues from terrorist and saboteur attack. In its native mode it is a GUI-based interactive tool. Features include the ability to make building retrofit recom mendations and the ability to recommend barriers to stop
10
15
25
30
35
40
45
50
55
60
65
18 vehicles of a specified size with a specified distance for accel eration. Three-dimensional views showing building damage are available in the GUI 202 version and it is possible to request standoff distance calculations for specified buildings, specified damage types such as roof wall failure or glass breakage, and for weapons of a specified net explosive weight. Mechanics of Use AT Planner can use precise positions of persons outside of
buildings, detailed window distribution information, treats building occupants only by calculating injury potentials in the interior bay by bay, and can incorporate the mitigating effects of blast walls close to the point of detonation. Threats are specified in net explosive weight of the equivalent TNT charge. However, detonations inside of building are not mod eled and AT Planner does not use height of burst or weapon fragmentation data, and its ability to represent irregularly shaped buildings is limited. AT Planner's products include casualty information for
outside individuals, coded panel-by-panel damage informa tion for buildings, and a three-dimensional representation of building damage. VAT 200 will use these data to determine detailed consequences for threat-target pairs. Blast/FXTM General Description
Blast/FXTM was developed by TRW Inc. (formerly BDM Inc.) for the Federal Aviation Administration as a tool to model the effects of explosives against buildings and the people in them. Features include the ability to predict severity of injury to individuals at precise locations inside the build ing. Buildings may be described in Substantial engineering and architectural detail and fragment characteristics of weap ons are also modeled. Weapons can be described by energetic chemical and net
explosive weight (describing one in terms of the TNT equiva lent net explosive weight is sufficient). Fragmenting capabil ity can be inferred from the casing but also fragment sizes can be specified, so that the model can accommodate weapons with bundled shrapnel such as nails. Mechanics of Use Of the ensemble of plug-in information pertinent to the
general blast and fragment consequence projection task, Blast/FXTM is alone among the VAT 200 analytic models in being able to take into account the specific locations of indi viduals within buildings.
Extensive building construction detail can also be used by Blast/FXTM: beams, columns, floors, and walls can be described for multiple levels by dimension, by category of material, and in the case of reinforced concrete, by the rebar spacing. Windows can be described by size and glazing mate rial. Instead of requiring this level of construction detail from users, the VAT 200 will provide representative construction details corresponding to the generic building class selected by the user since preferred embodiments of the VAT 200 do not include the modeling of the interior of buildings.
Blast/FXTM’s products returned to VAT 200 include the mortality or severity of injury to each person included in the scenario, component by component damage information, and three-dimensional views of the blast area with damage and casualties color coded (plus associated data to Support this visualization). FPTOO1 General Description FP Tool is a product of the Naval Surface Warfare Center
(NSWC), Dahlgren, Va. Unlike AT Planner and Blast/FXTM, FP Tool uses the TNT Standard methodology instead of the Kingery-Bulmash algorithms for its calculations. NSWC

US 9,292,874 B2 19
chose the TNT Standard in order to increase the accuracy of the calculations, especially for reflected air blast and elevated burst situations. Of the three blast and fragment models interoperable with preferred embodiments of the VAT 200, only FP Tool takes height of burst into account. The FP Tool also precisely models air blast-pressure decay but even with FP Tool the prediction is apt to be conservative.
Explosions internal to buildings may be modeled in the FP Tool. Exterior wall panel damage is predicted while interior walls are ignored in the calculation of this damage. The cur rent release uses eardrum damage and fragment-skin penetra tion as metrics for air blast personnel casualty. The travel and consequences of fragments of the buildings themselves are not modeled in the current release of FP Tool: only casing fragments are considered. Fragment trajectories are calcu lated both for bursts outside and for bursts inside of buildings. When a fragment reaches an impediment, penetration is cal culated on the basis of the fragment and the construction of the impediment. Casualties to people from fragments are calculated on the basis of probability of hit for personnel in hazard Volumes rather than on the basis of precise positions of occupants. FP Tool also calculates probabilities of equipment destruction from fragments. Mechanics of Use Of the ensemble of plug-in information pertinent to the
general blast and fragment consequence projection task, the FP Tool can use weapon size, three-dimensional burst posi tion information; multiple buildings; and barrier information. Building generic type, percentage of glass, and population density are usable but more extensive construction details are not. Equipment type and fragility can be used, if provided.
Results passed from FP Tool to VAT 200 include air blast information, building collapse information, building frag ment information, building damage information, equipment casualty information, and personnel casualty information. Chemical/Biological/Radiological (CBR) Models CBR Card General Description The CBR Card provides a quick look assessment for casu
alties related to the use of CBR agent releases. The purpose of this application is to provide a range of probable conse quences from typical CBR attacks. The Card provides actual “Lethal Dosage 50' (L/Ds) values for a given release. L/Dso is the dose for which 50% of the affected population is likely to die from the given exposure. It should be noted that the casualties will take place over a variable time frame depend ing on the agent: chemical agents act very quickly (within minutes to hours) while biological and radiological may take days to weeks to kill. However, the dosage calculation will be determined assuming that the personnel in the area remain there for 30 minutes after the release. The CBR Card is meant to provide a rough estimate of the consequence from a CBR attack and also to provide insight into crucial aspects of CBR releases. While the Bomb Card focused on standoff as the primary countermeasure to blast, the CBR Card will show the relative importance of time and situational awareness as criti cal weapons against CBRagent releases. Time is critical since if personnel can don a gas mask immediately upon being notified of a release then the hazard from CB releases is fairly minimal. Similarly, for radiological agents, limiting time exposed to the agent is the only way to prevent casualties for unprotected personnel.
The primary factors considered in developing the data to create the CBR Card are:
Source, release mechanism, amount of agent, delivery mechanism, and meteorological conditions.
5
15
25
35
40
45
50
55
60
65
20 The CBR Card permits several chemical agents to be
selected: chlorine, VX, and GB. These three were selected because they span the likely threats in four relevant dimen sions: availability, persistence, lethality, and history of use.
Chlorine is a representative industrial chemical agent meeting the test of easy availability. It is a toxic industrial material that has been discussed as a terrorist threat for years. It is lethal, its dense gas characteristics enable a cloud to linger in the absence of wind, and it is readily available. Moreover large tanker trucks are not uncommon, so incon spicuous delivery is plausible. Because of its likely packaging as a tanker truck the likely scenario is for a large amount of chlorine (tens of thousands of kilograms) to be released by a Small explosive rupturing the tanker near the target. The other two characteristics important to chemical weap
ons are relative lethality in small doses and persistence. No one chemical agent is best at both, so VX is included in the CBR card to represent the persistent chemical agents and GB Sarin is included to represent the agents of highest lethality. The two conditions of midnight release and noontime
release were selected to show the disparity between the dis persion and the degradation of CBR releases under differing meteorological conditions. Midnight release means no turbu lence and no wind. The resulting transport and dispersion occurs because of a physical phenomena called meander which is the random fluctuation of wind azimuth coupled with random variations of a small wind speed. (That is to say, it really is not physically possible to have absolute calm conditions.) Meander creates a slow moving erratic cloud that may eventually cover a large area. The noontime release conditions provide a turbulent atmosphere with a four-knot wind. This condition provides a situation where the initial release will quickly produce a fairly directional plume of ground effects. The wind speed of four knots was selected to provide a reasonable ground footprint over minutes to hours without diluting the release too quickly.
Unless there is a continual release, turbulence, and expo sure to water vapor will cause these effects to be fairly short lived. In comparison to biological and radiological agents, chemical agents need to be brought right to the victim in order to work. For them the delivery mechanism is an important factor. That is why the CBR Card expands the three represen tative chemical agent cases to a variety of agent/delivery mechanism combinations such as aircraft drop, Van Spray, and Suitcase bomb. One agent, anthrax, is sufficient to represent biological
warfare agents. Anthrax is a worst case choice because as a spore it is relatively resistant to ultraviolet light so it has a long linger time (relative to other biological agents) and is also more lethal than most other biological agents. It is also readily available and, unlike the chemical agents, it can kill at a long distance from its point of release. Three different, plausible delivery mechanisms are used—aircraft spray, van spray, and backpack spray.
For the radiological threat, Cobalt 60 is a likely source due to its availability from medical applications. One delivery method is used (Suitcase bomb) for its application since in any other form it would be very dangerous to the terrorist employ ing it and an explosive release provides an effective way to spread a small amount of material quickly. Mechanics of Use The two parameters that the CBR Card will require from
the user will be direction of prevailing wind and location of the source. The data produced from the series of CBR sce narios described above will be applied to the site within VAT

US 9,292,874 B2 21
200 with these two pieces of data. In this way, personnel affected by the release may be calculated and provided as a consequence term and, if requested by the user, plotted on the site map. The prevailing wind condition is very important for CB releases since it specifically identifies the region at risk from a CB release. However, the user may experiment using different wind azimuths to determine the severity of a CBR attack during non-nominal meteorological conditions (i.e., the user may perform what-if analyses).
The CBR Card does not consider terrain effects. All sce nario runs assume flat terrain. This simplification could obvi ously be important especially for very hilly terrain and urban aaS.
The example threats provided in the CBR Cardgive abroad range of potential threats with limited resolution. If any of these scenarios produce event consequences marginally acceptable or unacceptable, it is recommended that a more detailed examination of the scenario by considered by using the high fidelity CBR transport and dispersion model, HPAC, described in the next section. Hazard Prediction and Assessment Capability (HPAC) General Description The high fidelity transport and dispersion engine within the
Hazard Prediction and Assessment Capability (HPAC) appli cation normally requires over 100 independent parameters to perform a detailed calculation. However, the resolution of the information that will be available for a given site and scenario will not have much of this relevant information. The source of the release must be identified to include agent, agent dissemi nation device, and amount. HPAC has standard attributes of the agents stored in its databases to provide an initial release cloud. The transport and dispersion of this cloud, and its resulting lethality, is largely an effect of the environment into which this agent is released. VAT 200 does not need terrain and meteorological conditions to run but HPAC needs some values for these parameters. HPAC can either determine typi cal meteorological conditions for the site's geographic loca tion and season of the year from its own resident databases or a default file will be made available for modification. In addition, the terrain will affect the transport and dispersion but VAT 200 assumes flat terrain. Data from HPAC will be typical contours showing the extent of a cloud's growth scaled to dose levels representative of physical impairment and/or high probability of death. Mechanics of Use HPAC is capable of using every bit of the agent cloud, time
and meteorology, and geographic data that VAT 200 will supply. Some users of VAT 200 will be unable to provide information in detail and so will instead characterize weap ons, weather, and geography by generic category. Together, VAT 200 and HPAC will extrapolate from these to the details HPAC’s computation engine requires in order to run. The present release of HPAC does not directly calculate
casualty information. VAT 200 will receive geographic lethal ity and incapacitation information from HPAC that it will then use both for casualty and for mission impact assessment. External Interfaces The VAT 200 provides a mechanism that allows end users
to enhance the functionality provided by the VAT 200 on delivery. The VAT Plug-in module interface allows third par ties to create software modules that extend the VAT 200's capabilities beyond those delivered as part of the standard VAT 200 installation. There are currently three variants of plug-in modules: Analytic Model plug-ins, Data Analysis plug-in modules, and I/O plug-in modules. The following sections discuss the VAT 200’s Plug-in module interface and
10
15
25
30
35
40
45
50
55
60
65
22 the capabilities of each of the plug-in types in an overview fashion that attempts to provide context for the other sections of this specification. Plug-In Module Interface The VAT 200’s external interface mechanism is con
structed around the notion of software plug-in modules which provide enhanced behavior for the VAT 200 in specific areas of functionality: new analytic models, new textual data inter pretation paragraphs, or new Sources to import or export data to or from the VAT 200. Software plug-in modules are binary objects built from compiled code that adheres to standards defined for the AVAT 100 Suite.
In general terms, for all plug-in modules, the VAT 200 expects a base level of functionality that manages the low level interface with the VAT 200 software. On top of that functionality, the VAT 200 expects that a plug-in will imple ment additional functionality that will allow the plug-in to provide enhanced behavior for the VAT 200 software. The overarching design principle for the Plug-in module
interface design is to make it easy for third party programmers to develop plug-ins for different situations, not precluding the possibility that more than one plug-in of a particular type (e.g. two analytic model plug-ins and/or three analysis module plug-ins) may be registered with the VAT 200 and potentially be running concurrently with the others. Analytic Models Interface The VAT 200 Analytic Models Interface will allow module
developers to create interfaces to external analytic models and interface them with the VAT 200. Through the Analytic Models Interface the VAT 200 will be capable of exporting munitions, terrain, geometry and other information in the VAT Database 220 for analytic models to use in their calcu lations. A major design goal for this interface is that the user will
not be required to interact with an external models native interface (if any exists) in order to use it or its results in VAT 200 risk calculations. As a result, the VAT 200 Analytic Mod els Interface provides a number of control functions that allow the VAT 200 to control the execution of a compliant Analytic Model.
After execution, the VAT 200 expects to receive results from the model. The kinds of information that an Analytic Model can return to the VAT 200 are listed below.
TABLE B
Analytic Model Information Table
Value Description
Consequence to Life
The effect on the human population in the area Surrounding the event. This value is used in the influence network 500 to affect the overall risk value.
Consequence to The effect on the assets affected by the event. This Assets value is used in the influence network 500 to affect the
overall risk value. 2D, 3D, and 4D Data values returned to the VAT 200 that allow the (3D + time) VAT 200 to visualize the results of a model execution. data objects Data Items used to annotate the visualization of data Annotations returned from an analytic model.
Data Analysis Module Interface In Support of the user created report format requirement,
the VAT 200 exposes the Data Analysis modules interface. The VAT 200 uses Data Analysis modules to interpret the results of user-entered data and formulate statements about that data. Throughout the interview process for Professional Assessors and Planners and during the creation of output
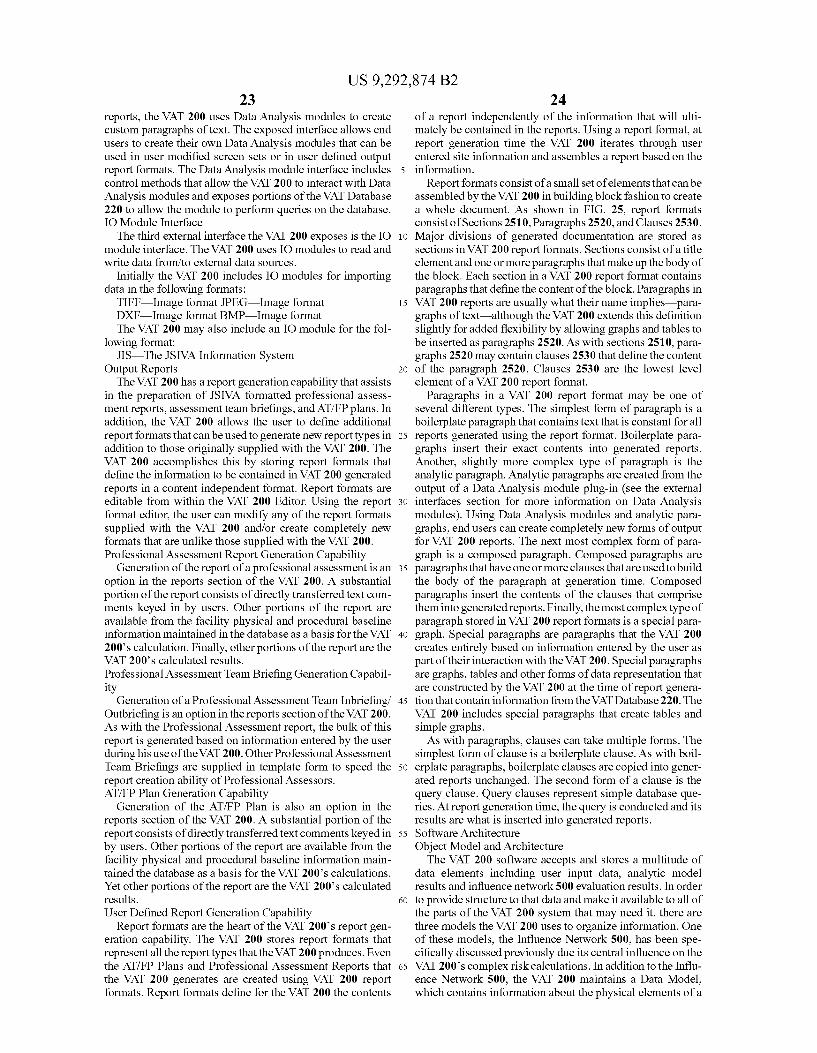
US 9,292,874 B2 23
reports, the VAT 200 uses Data Analysis modules to create custom paragraphs of text. The exposed interface allows end users to create their own Data Analysis modules that can be used in user modified screen sets or in user defined output report formats. The Data Analysis module interface includes control methods that allow the VAT 200 to interact with Data Analysis modules and exposes portions of the VAT Database 220 to allow the module to perform queries on the database. IO Module Interface The third external interface the VAT 200 exposes is the IO
module interface. The VAT 200 uses IO modules to read and write data from/to external data Sources.
Initially the VAT 200 includes IO modules for importing data in the following formats:
TIFF Image format JPEG Image format DXF Image format BMP Image format The VAT 200 may also include an IO module for the fol
lowing format: JIS. The JSIVA Information System
Output Reports The VAT 200 has a report generation capability that assists
in the preparation of JSIVA formatted professional assess ment reports, assessment team briefings, and AT/FP plans. In addition, the VAT 200 allows the user to define additional report formats that can be used to generate new report types in addition to those originally supplied with the VAT 200. The VAT 200 accomplishes this by storing report formats that define the information to be contained in VAT 200 generated reports in a content independent format. Report formats are editable from within the VAT 200 Editor. Using the report format editor, the user can modify any of the report formats supplied with the VAT 200 and/or create completely new formats that are unlike those supplied with the VAT 200. Professional Assessment Report Generation Capability
Generation of the report of a professional assessment is an option in the reports section of the VAT 200. A substantial portion of the report consists of directly transferred textcom ments keyed in by users. Other portions of the report are available from the facility physical and procedural baseline information maintained in the database as a basis for the VAT 200's calculation. Finally, other portions of the report are the VAT 200S calculated results. Professional Assessment Team Briefing Generation Capabil ity
Generation of a Professional Assessment Team Inbriefing/ Outbriefing is an option in the reports section of the VAT 200. As with the Professional Assessment report, the bulk of this report is generated based on information entered by the user during his use of the VAT 200. Other Professional Assessment Team Briefings are Supplied in template form to speed the report creation ability of Professional Assessors. AT/FP Plan Generation Capability
Generation of the AT/FP Plan is also an option in the reports section of the VAT 200. A substantial portion of the report consists of directly transferred text comments keyed in by users. Other portions of the report are available from the facility physical and procedural baseline information main tained the database as a basis for the VAT 200's calculations. Yet other portions of the report are the VAT 200's calculated results. User Defined Report Generation Capability
Report formats are the heart of the VAT 200's report gen eration capability. The VAT 200 stores report formats that representall the report types that the VAT 200 produces. Even the AT/FP Plans and Professional Assessment Reports that the VAT 200 generates are created using VAT 200 report formats. Report formats define for the VAT 200 the contents
10
15
25
30
35
40
45
50
55
60
65
24 of a report independently of the information that will ulti mately be contained in the reports. Using a report format, at report generation time the VAT 200 iterates through user entered site information and assembles a report based on the information.
Reportformats consist of a small set of elements that can be assembled by the VAT 200 in building block fashion to create a whole document. As shown in FIG. 25, report formats consist of Sections 2510, Paragraphs 2520, and Clauses 2530. Major divisions of generated documentation are stored as sections in VAT 200 report formats. Sections consist of a title element and one or more paragraphs that make up the body of the block. Each section in a VAT 200 report format contains paragraphs that define the content of the block. Paragraphs in VAT 200 reports are usually what their name implies para graphs of text—although the VAT 200 extends this definition slightly for added flexibility by allowing graphs and tables to be inserted as paragraphs 2520. As with sections 2510, para graphs 2520 may contain clauses 2530 that define the content of the paragraph 2520. Clauses 2530 are the lowest level element of a VAT 200 report format.
Paragraphs in a VAT 200 report format may be one of several different types. The simplest form of paragraph is a boilerplate paragraph that contains text that is constant for all reports generated using the report format. Boilerplate para graphs insert their exact contents into generated reports. Another, slightly more complex type of paragraph is the analytic paragraph. Analytic paragraphs are created from the output of a Data Analysis module plug-in (see the external interfaces section for more information on Data Analysis modules). Using Data Analysis modules and analytic para graphs, end users can create completely new forms of output for VAT 200 reports. The next most complex form of para graph is a composed paragraph. Composed paragraphs are paragraphs that have one or more clauses that are used to build the body of the paragraph at generation time. Composed paragraphs insert the contents of the clauses that comprise them into generated reports. Finally, the most complex type of paragraph stored in VAT 200 report formats is a special para graph. Special paragraphs are paragraphs that the VAT 200 creates entirely based on information entered by the user as part of their interaction with the VAT 200. Special paragraphs are graphs, tables and other forms of data representation that are constructed by the VAT 200 at the time of report genera tion that contain information from the VATDatabase 220. The VAT 200 includes special paragraphs that create tables and simple graphs. As with paragraphs, clauses can take multiple forms. The
simplest form of clause is a boilerplate clause. As with boil erplate paragraphs, boilerplate clauses are copied into gener ated reports unchanged. The second form of a clause is the query clause. Query clauses represent simple database que ries. At report generation time, the query is conducted and its results are what is inserted into generated reports. Software Architecture Object Model and Architecture The VAT 200 software accepts and stores a multitude of
data elements including user input data, analytic model results and influence network 500 evaluation results. In order to provide structure to that data and make it available to all of the parts of the VAT 200 system that may need it, there are three models the VAT 200 uses to organize information. One of these models, the Influence Network 500, has been spe cifically discussed previously due its central influence on the VAT 200's complex risk calculations. In addition to the Influ ence Network 500, the VAT 200 maintains a Data Model, which contains information about the physical elements of a
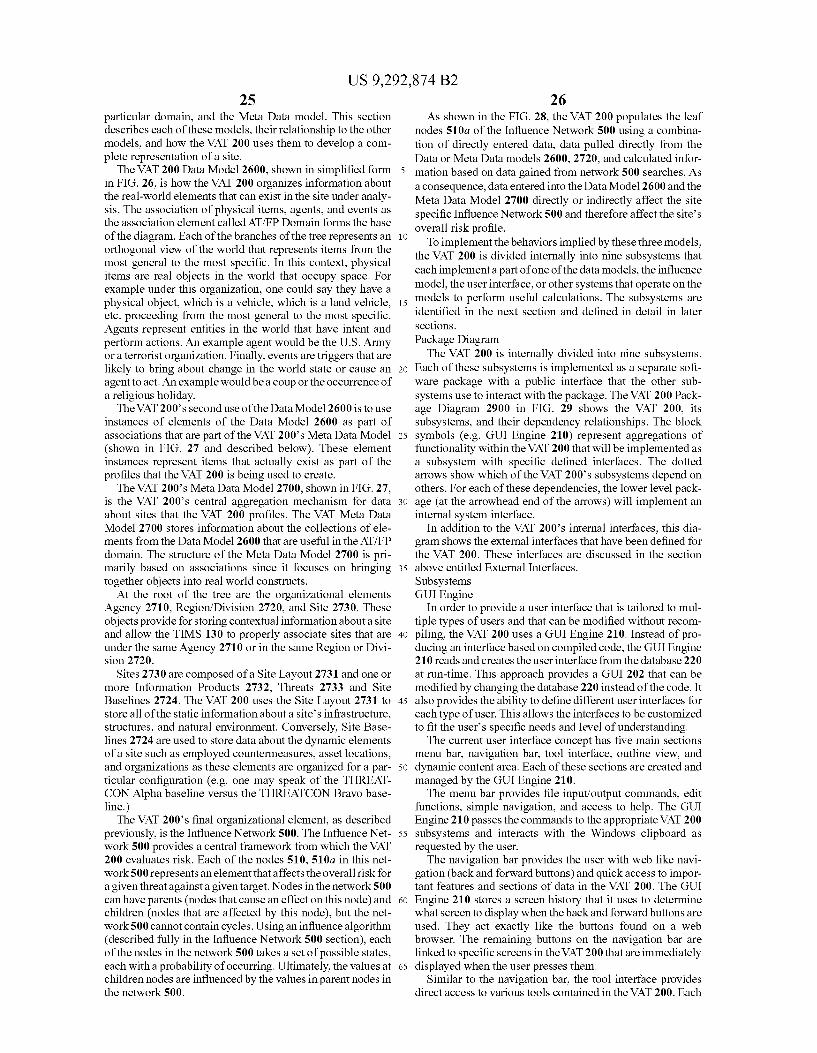
US 9,292,874 B2 25
particular domain, and the Meta Data model. This section describes each of these models, their relationship to the other models, and how the VAT 200 uses them to develop a com plete representation of a site.
The VAT 200 Data Model 2600, shown in simplified form in FIG. 26, is how the VAT 200 organizes information about the real-world elements that can exist in the site under analy sis. The association of physical items, agents, and events as the association element called AT/FP Domain forms the base of the diagram. Each of the branches of the tree represents an orthogonal view of the world that represents items from the most general to the most specific. In this context, physical items are real objects in the world that occupy space. For example under this organization, one could say they have a physical object, which is a vehicle, which is a land vehicle, etc. proceeding from the most general to the most specific. Agents represent entities in the world that have intent and perform actions. An example agent would be the U.S. Army or a terrorist organization. Finally, events are triggers that are likely to bring about change in the world State or cause an agent to act. An example would be a coup or the occurrence of a religious holiday. The VAT 200’s Second use of the DataModel 2600 is to use
instances of elements of the Data Model 2600 as part of associations that are part of the VAT 200's Meta Data Model (shown in FIG. 27 and described below). These element instances represent items that actually exist as part of the profiles that the VAT 200 is being used to create. The VAT 200's Meta Data Model 2700, shown in FIG. 27,
is the VAT 200's central aggregation mechanism for data about sites that the VAT 200 profiles. The VAT Meta Data Model 2700 stores information about the collections of ele ments from the Data Model 2600 that are useful in the AT/FP domain. The structure of the Meta Data Model 2700 is pri marily based on associations since it focuses on bringing together objects into real world constructs.
At the root of the tree are the organizational elements Agency 2710, Region/Division 2720, and Site 2730. These objects provide for storing contextual information about a site and allow the TIMS 130 to properly associate sites that are under the same Agency 2710 or in the same Region or Divi Sion 2720.
Sites 2730 are composed of a Site Layout 2731 and one or more Information Products 2732, Threats 2733 and Site Baselines 2724. The VAT 200 uses the Site Layout 2731 to store all of the static information about a site's infrastructure, structures, and natural environment. Conversely, Site Base lines 2724 are used to store data about the dynamic elements of a site such as employed countermeasures, asset locations, and organizations as these elements are organized for a par ticular configuration (e.g. one may speak of the THREAT CON Alpha baseline versus the THREATCON Bravo base line.) The VAT 200’s final organizational element, as described
previously, is the Influence Network 500. The Influence Net work 500 provides a central framework from which the VAT 200 evaluates risk. Each of the nodes 510,510a in this net work 500 represents an element that affects the overall risk for a given threat against a given target. Nodes in the network 500 can have parents (nodes that cause an effect on this node) and children (nodes that are affected by this node), but the net work 500 cannot contain cycles. Using an influence algorithm (described fully in the Influence Network 500 section), each of the nodes in the network 500 takes a set of possible states, each with a probability of occurring. Ultimately, the values at children nodes are influenced by the values in parent nodes in the network 500.
10
15
25
30
35
40
45
50
55
60
65
26 As shown in the FIG. 28, the VAT 200 populates the leaf
nodes 510a of the Influence Network 500 using a combina tion of directly entered data, data pulled directly from the Data or Meta Data models 2600, 2720, and calculated infor mation based on data gained from network 500 searches. As a consequence, data entered into the DataModel 2600 and the Meta Data Model 2700 directly or indirectly affect the site specific Influence Network 500 and therefore affect the site's overall risk profile. To implement the behaviors implied by these three models,
the VAT 200 is divided internally into nine subsystems that each implementapart of one of the data models, the influence model, the user interface, or other systems that operate on the models to perform useful calculations. The Subsystems are identified in the next section and defined in detail in later sections. Package Diagram The VAT 200 is internally divided into nine subsystems.
Each of these Subsystems is implemented as a separate soft ware package with a public interface that the other sub systems use to interact with the package. The VAT 200 Pack age Diagram 2900 in FIG. 29 shows the VAT 200, its Subsystems, and their dependency relationships. The block symbols (e.g. GUI Engine 210) represent aggregations of functionality within the VAT 200 that will be implemented as a subsystem with specific defined interfaces. The dotted arrows show which of the VAT 200's subsystems depend on others. For each of these dependencies, the lower level pack age (at the arrowhead end of the arrows) will implement an internal system interface.
In addition to the VAT 200's internal interfaces, this dia gram shows the external interfaces that have been defined for the VAT 200. These interfaces are discussed in the section above entitled External Interfaces. Subsystems GUI Engine
In order to provide a user interface that is tailored to mul tiple types of users and that can be modified without recom piling, the VAT 200 uses a GUI Engine 210. Instead of pro ducing an interface based on compiled code, the GUI Engine 210 reads and creates the user interface from the database 220 at run-time. This approach provides a GUI 202 that can be modified by changing the database 220 instead of the code. It also provides the ability to define different user interfaces for each type of user. This allows the interfaces to be customized to fit the user's specific needs and level of understanding. The current user interface concept has five main sections
menu bar, navigation bar, tool interface, outline view, and dynamic content area. Each of these sections are created and managed by the GUI Engine 210. The menu bar provides file input/output commands, edit
functions, simple navigation, and access to help. The GUI Engine 210 passes the commands to the appropriate VAT 200 subsystems and interacts with the Windows clipboard as requested by the user. The navigation bar provides the user with web like navi
gation (back and forward buttons) and quick access to impor tant features and sections of data in the VAT 200. The GUI Engine 210 stores a screen history that it uses to determine what screen to display when the back and forward buttons are used. They act exactly like the buttons found on a web browser. The remaining buttons on the navigation bar are linked to specific screens in the VAT 200 that are immediately displayed when the user presses them.
Similar to the navigation bar, the tool interface provides direct access to various tools contained in the VAT 200. Each

US 9,292,874 B2 27
of the buttons, when pressed, instructs the GUI Engine 210 to activate a specific VAT 200 tool and display its interface. The outline views two purposes are to represent the data in
the system and to allow the user to move around in the VAT 200 to view, edit, and change data. The GUI Engine 210 populates the outline as data is entered into the system and as the VAT 200 needs information from the user. The informa tion is displayed in an outline form to better organize and manage its representation.
Users can use the outline to jump to information that they need to change or enter simply by clicking on a line in the outline view. This instructs the GUI Engine 210 to display the screen that contains the proper information. The most important part of the interface is the dynamic
content area. This portion of the interface contains the screens that:
Interview the user Allow the user to view and modify data Display results, charts, and graphs Display 3D graphics for building the site and simulating it The GUI Engine 210, shown in FIG. 6, reads information
from the database and creates screens to allow the user to interact with the system. This area, like the rest of the inter face, is completely controlled by the GUI Engine 210, but the 3D Engine 210 is also capable of writing information to it. Whenever the 3D Builder 260 or Viewer 280 is needed, the GUI Engine 210 provides agraphics context to the 3D Engine 210 so that it can display graphics in the dynamic content area. The GUI Engine 210 creates and manages all the tool bars that are required to operate the 3D Builder 260 and Viewer 280. It passes the commands issued by the user to the 3D subsystem for processing. This provides a consistent interface to the user and relieves the 3D sub-system from the duties of handling user input. The GUI Engine 210 handles multiple screen definition
sets so that each one can be customized to fit a specific set of users, but it does not require that every screen be customized. Instead the engine Supports default Screens in addition to user type specific screens. This provides a mechanism where the GUI Engine 210 uses a default screen anytime a user type specific one does not exist. This makes the engine 210 more flexible and defining custom screens less time consuming.
Each object in the system that requires user interaction has a least one screen associated with it. This is the default screen to be used by the GUI Engine 210. In addition to that screen each object can have other screens associated with it to be used by a specific type VAT 200 user as shown in FIG. 30. As mentioned throughout this section, the GUI Engine 210
uses screen definitions to define what the dynamic content area of the user interface should contain. These definitions define what the screen should contain, but not explicitly how it should be displayed or laid out. This has two main advan tages:
The user interface is more flexible. Defining screens is much simpler. The screen definitions such as the definition 3100 shown in
FIG. 31, consist of a list of what should be shown on the screen, but not how it should be laid out. This approach frees modification users from the duties of having to graphically lay out each screen so that they can better concentrate on the content of the screen. It also allows the GUI Engine 210 to be more flexible by allowing it to adapt the screen to the size and style of the window available. It furthermore allows the engine to decide, based on the type of data to be input to output, what is the best way to display it.
The GUI Engine 210 uses the screen definition 3100 to determine what to display on the screen. To determine how to
10
15
25
30
35
40
45
50
55
60
65
28 display the information, it checks the type of data and deter mines what input or output device to use. For example, if the definition 3100 specified that the user's name should be entered, the GUI Engine 210 would check the database and know that this is a string. It would then use a text-input box on the screen for the user to type the information into. If on the other hand the definition 3100 specified that the user's rank be entered (and a list of acceptable ranks exist), the engine would use a selection box so that the user would not need to type in the answer. This technique is applied to all of the items in the list until the entire Screen composition is known. At this point the GUI Engine 210 uses rules similar to a web
browser to layout the information on the screen. It determines the spacing between lines, knows to emphasize the title of the screen, etc. Once this process is finished, the engine displays the screen to the user and handles all the interactions.
In addition to interpreting the screen content, the GUI Engine 210 is also responsible for determining what screen to show when. The user can jump to specific screens by using the navigation bar, outline, and toolbar, but this is only part of the navigational process. During the interview for example, the user will press a done or next button to indicate that they are ready to proceed to the next screen. The GUI Engine 210 is responsible for finding it.
There are three methods that the engine uses during navi gation. The first is to jump to a user-specified screen as described above. The second is to look at data dependencies in the object model and influence network 500. Many of these objects require information about other objects. The GUI Engine 210 uses this information to determine what object screen the user should see next. But, this method alone may not produce a coherent progression of screens. The GUI Engine 210 is equipped with one final naviga
tional method. In addition to specifying what to display on a screen, a screen definition can also specify other screens to be displayed. This allows it to override the default behavior of the system in order to provide a directed Screen progression. A sample diagram of this process is shown in FIG. 32. Computational Engine The Computational Engine 230 subsystem of the VAT 200
is responsible for providing Support to the risk determination and mitigation processes. During these processes, the Com putational Engine 230 builds and maintains the structure of the influence network 500, in addition to performing calcu lations to support decision-making. FIG. 33 illustrates the many steps of risk determination and analysis with which the Computational Engine 230 is involved. The key to the knowledge of the VAT 200 lies in the Influ
ence Network 500. This network 500 embodies the factors that the VAT 200 relies upon in making decisions during risk determination and mitigation. Risk determination is com posed of four major components: criticality determination, threat determination, Susceptibility determination, and con sequence analysis. Risk mitigation is comprised of counter measure effectiveness analysis and consequence analysis. Each of these distinct components interacts with the influence network 500 in order to make decisions, and each decision made affects the rest of the Influence Network 500. Through the data interaction between these components, the Influence Network 500 is capable of calculating the relative risk of a particular target against a particular threat. FIG.34 illustrates the interaction between these steps of the risk process and the Influence Network 500.
In addition to interacting with the primary VAT 200 Influ ence Network 500, the susceptibility determination and risk mitigation components also make use of local networks in order to make complex decisions, as shown in FIGS. 35a, b.
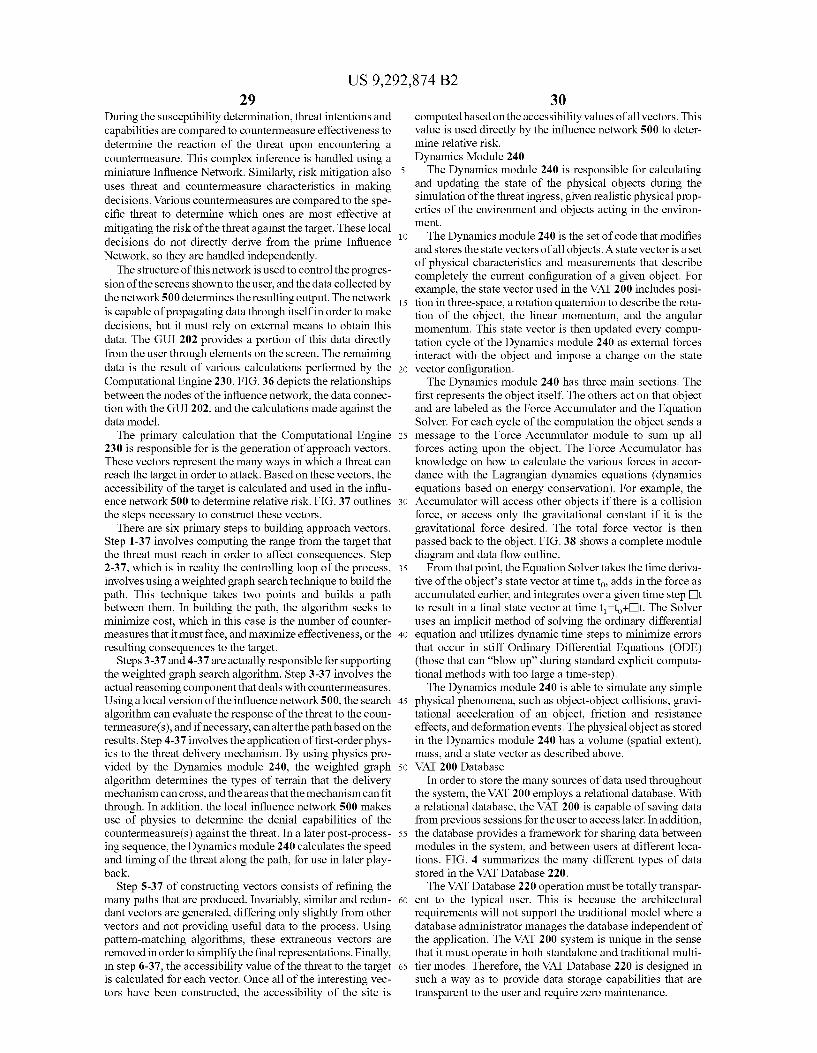
US 9,292,874 B2 29
During the Susceptibility determination, threat intentions and capabilities are compared to countermeasure effectiveness to determine the reaction of the threat upon encountering a countermeasure. This complex inference is handled using a miniature Influence Network. Similarly, risk mitigation also uses threat and countermeasure characteristics in making decisions. Various countermeasures are compared to the spe cific threat to determine which ones are most effective at mitigating the risk of the threat against the target. These local decisions do not directly derive from the prime Influence Network, so they are handled independently. The structure of this network is used to control the progres
sion of the screens shownto the user, and the data collected by the network 500 determines the resulting output. The network is capable of propagating data through itselfin order to make decisions, but it must rely on external means to obtain this data. The GUI 202 provides a portion of this data directly from the user through elements on the screen. The remaining data is the result of various calculations performed by the Computational Engine 230. FIG. 36 depicts the relationships between the nodes of the influence network, the data connec tion with the GUI 202, and the calculations made against the data model. The primary calculation that the Computational Engine
230 is responsible for is the generation of approach vectors. These vectors represent the many ways in which a threat can reach the target in order to attack. Based on these vectors, the accessibility of the target is calculated and used in the influ ence network 500 to determine relative risk. FIG. 37 outlines the steps necessary to construct these vectors.
There are six primary steps to building approach vectors. Step 1-37 involves computing the range from the target that the threat must reach in order to affect consequences. Step 2-37, which is in reality the controlling loop of the process, involves using a weighted graph search technique to build the path. This technique takes two points and builds a path between them. In building the path, the algorithm seeks to minimize cost, which in this case is the number of counter measures that it must face, and maximize effectiveness, or the resulting consequences to the target.
Steps 3-37 and 4-37 are actually responsible for supporting the weighted graph search algorithm. Step 3-37 involves the actual reasoning component that deals with countermeasures. Using a local version of the influence network 500, the search algorithm can evaluate the response of the threat to the coun termeasure(s), and if necessary, can alter the path based on the results. Step 4-37 involves the application of first-order phys ics to the threat delivery mechanism. By using physics pro vided by the Dynamics module 240, the weighted graph algorithm determines the types of terrain that the delivery mechanism can cross, and the areas that the mechanism can fit through. In addition, the local influence network 500 makes use of physics to determine the denial capabilities of the countermeasure(s) against the threat. In a later post-process ing sequence, the Dynamics module 240 calculates the speed and timing of the threat along the path, for use in later play back.
Step 5-37 of constructing vectors consists of refining the many paths that are produced. Invariably, similar and redun dant vectors are generated, differing only slightly from other vectors and not providing useful data to the process. Using pattern-matching algorithms, these extraneous vectors are removed in order to simplify the final representations. Finally, in step 6-37, the accessibility value of the threat to the target is calculated for each vector. Once all of the interesting vec tors have been constructed, the accessibility of the site is
10
15
25
30
35
40
45
50
55
60
65
30 computed based on the accessibility values of all vectors. This value is used directly by the influence network 500 to deter mine relative risk. Dynamics Module 240 The Dynamics module 240 is responsible for calculating
and updating the state of the physical objects during the simulation of the threatingress, given realistic physical prop erties of the environment and objects acting in the environ ment.
The Dynamics module 240 is the set of code that modifies and stores the state vectors of all objects. A state vector is a set of physical characteristics and measurements that describe completely the current configuration of a given object. For example, the state vector used in the VAT 200 includes posi tion in three-space, a rotation quaternion to describe the rota tion of the object, the linear momentum, and the angular momentum. This state vector is then updated every compu tation cycle of the Dynamics module 240 as external forces interact with the object and impose a change on the state vector configuration. The Dynamics module 240 has three main sections. The
first represents the object itself. The others act on that object and are labeled as the Force Accumulator and the Equation Solver. For each cycle of the computation the object sends a message to the Force Accumulator module to Sum up all forces acting upon the object. The Force Accumulator has knowledge on how to calculate the various forces in accor dance with the Lagrangian dynamics equations (dynamics equations based on energy conservation). For example, the Accumulator will access other objects if there is a collision force, or access only the gravitational constant if it is the gravitational force desired. The total force vector is then passed back to the object. FIG.38 shows a complete module diagram and data flow outline. From that point, the Equation Solver takes the time deriva
tive of the objects state vector at time to adds in the force as accumulated earlier, and integrates over a given time step it to result in a final state vector at time t-to-Dt. The Solver uses an implicit method of solving the ordinary differential equation and utilizes dynamic time steps to minimize errors that occur in stiff Ordinary Differential Equations (ODE) (those that can “blow up' during standard explicit computa tional methods with too large a time-step). The Dynamics module 240 is able to simulate any simple
physical phenomena, Such as object-object collisions, gravi tational acceleration of an object, friction and resistance effects, and deformation events. The physical object as stored in the Dynamics module 240 has a volume (spatial extent), mass, and a state vector as described above. VAT 200 Database
In order to store the many sources of data used throughout the system, the VAT 200 employs a relational database. With a relational database, the VAT 200 is capable of saving data from previous sessions for the user to access later. In addition, the database provides a framework for sharing data between modules in the system, and between users at different loca tions. FIG. 4 summarizes the many different types of data Stored in the VAT Database 220. The VAT Database 220 operation must be totally transpar
ent to the typical user. This is because the architectural requirements will not support the traditional model where a database administrator manages the database independent of the application. The VAT 200 system is unique in the sense that it must operate in both standalone and traditional multi tier modes. Therefore, the VAT Database 220 is designed in Such a way as to provide data storage capabilities that are transparent to the user and require Zero maintenance.

US 9,292,874 B2 31
VAT 200 architecture is predominantly object-oriented in nature. A relational database is not object-oriented, but is organized by tables. In order to implement an object-oriented application design the use of a relational database conversion code is required. The code is commonly referred to as a mapping code because it is used to map the application objects to relational entities in the database. Depending on the application, the effort to develop the mapping code can be substantial. The goal of the VAT 200 is to minimize the mapping code effort, while maintaining complete function ality with vendor independence. FIG. 39 depicts the object to-entity relationship.
The VAT 200 application incorporates a database broker to perform the necessary object-to-relational mapping func tions. The broker is a distinct module in the VAT 200 appli cation performing mapping functions, therefore encapsulat ing database access code. This approach provides a transparent conversion of the relational model into the VAT 200’s object model. Modifications to the relational model only require modification to the broker. The database broker handles all data storage and retrieval
functions for the VAT 200 application, therefore housing the necessary database communication code. Regardless of the selected database, the interface between the VAT 200 appli cation and broker remains constant. The relational data model is implemented by defining rela
tional entities for the VAT 200 object classes as shown in FIG. 40. Each entity is designed to support the object model as efficiently as possible. The methods and aggregation features of the object model become incorporated into the database broker. The relational data model begins as a logical model defining the necessary entities and appropriate relationships between.
From the logical model, physical models can be created for any Supported relational database. 3D Builder/Viewer The VAT 200 contains the capability to render a site layout
in a three-dimensional manner. This includes two modes of operation. The first is a 3D view that allows the user to construct a site or add objects to a site (3D Builder 260). The second allows the user to view a simulation run in a 3D environment (3D Viewer 280). The Builder 260 and Viewer 280 are two modes of operation built on top of the 3D Run time environment 270, which is based on the OpenGL graph ics library. Both use the same underlying rendering tech niques, while presenting to the user different functionality. This allows the code base to be shared between the Builder 260 and the Viewer 280, resulting in a smaller memory foot print, easier transition between Builder 260 and Viewer 280 portions of the VAT 200, and a consistent 3D interface. The 3D Builder 260 allows the user to construct his base in
the VAT 200 system for use with the various modules to calculate Vulnerability and mitigate risk. The user is pre sented with a palette of standard 3D construction tools, cam era movement options, and structure types to build. The coun termeasure library and structure types are then read in from the database, and the list presented to the user in an appropri ate menu so he can select a structure to build. The user then uses the tool to build up his site on top of a base image of the layout (scanned-in map, perhaps) or use a base AutoCAD DXF file if applicable. A flow diagram of the builder process is shown in FIG. 41. The Viewer 280 allows the user to view the site layout as
constructed in the Builder 260, then displays the results of the computational cycle that calculates risk to various assets on the layout. This information is displayed as “threat vectors’ on the layout, or representations of paths that a threat delivery
10
15
25
30
35
40
45
50
55
60
65
32 mechanism would take. Each of these paths can be selected by the user, and the threat scenario can then be played out, including the consequence display at the end based upon data received from the external blast or CB models. A flow dia gram of the Viewer 280 process is shown in FIG. 42. The 3D Viewer 280 and 3D Builder 260 both sit on top of
the base 3D Run-time engine as outlined in the previous section. Each interacts with different sub-modules of the Run-time to alter the user interaction, rendering mode, and display options. The Viewer 280, while interacting with the Computational Engine 230 and Dynamics module 240, com municates with the non-physical data structures to populate the threat vector display list. It also interacts with the camera model to change the view upon user request, as well as makes calls to the rendering engine itself to change display modes (switch to wire-frame mode, map textures differently, etcet era). The Builder 260, on the other hand, needs to access the structure of static data to populate the terrain and structure information (static polygons), while also communicating with the rendering engine and the camera model. The Builder 260, upon initial startup, takes input from a 2D
image or a 2D AutoCAD file (DXF). This is then used as the base of the modeling session, which allows the user to build on top of the actual site layout in order to bring it into the third dimension. The DXF file is parsed and translated into an internal format, and all 3D information generated by the Builder 260 is kept in an internal format for maximum effi ciency. When the user is finished, the model is then saved out into a common 3D file format that can be stored into the data store (object persistence mechanism), and pulled up later in the Viewer 280. All asset characteristic information is imbed ded into the 3D-file format so that all information is in one location. 3D Run-Time Environment
Both the 3D Viewer 280 and the 3D Builder 260 are based upon the same 3D Run-time Environment 270 (also referred to herein as the 3D simulation/gaming environment) that handles the rendering of the scene. The 3D engine stores texture information, polygonal models, and lighting informa tion needed to render the scene quickly and realistically. A detailed look at the sub-modules of the 3D-Run-time Envi ronment 270 is found in FIG. 43. The 3D Engine takes input from the database to retrieve the
site layout as built by the Builder, or from the current polygon structure that the user has constructed in the case of the Builder. The texture images are stored and linked from indi vidual polygons, and the geometry of the layout and buildings are stored separately from the geometry of the mobile objects Such as trucks. The polygons for static data Such as the terrain and buildings are stored in a manner that is geared toward quick rendering, while the objects that move do not necessar ily remain in the same physical area during the simulation, and so cannot take advantage of the spatially-ordered data structure. A Binary Space Partitioning (BSP) tree is then used to store the terrain and structure polygons to allow for the quickest rendering of a large Scene while allowing for rapid view-frustum culling and level of detail control. BSP trees allow all polygons to be stored in a tree structure that is branched based upon spatial position, so polygons close to one another in physical space are close in data space as well. These techniques are used to allow for faster rendering speeds on the limited hardware of the PC platform. The models used to draw all auxiliary vehicles and struc
tures are kept in a model library within the 3D-rendering module to facilitate the addition of new models. The truck models, for example, will not be stored integrated in with the site layout, but will be stored separately to allow addition or

US 9,292,874 B2 33 34
changes to the truck model. The site terrain and additional paragraph, and clause has enough information to create its geometry are exportable to a common model interchange output. If qualification Succeeds, then the Subsystem actually format (DXF) for viewing in an external model viewer inde- creates the report. pendent of the VAT 200. If qualification fails, then the subsystem returns with a
The rendering engine uses the OpenGL graphics Applica- 5 failed qualification message. Reports that fail qualification tion Programming Interface, or API. This library of graphics may still be generated, however, some information may be
indicated as being missing or incomplete. During generation of a report for which the format qualification failed, those sections, paragraphs, or clauses that failed will insert a quali
10 fication failure message in the output report that indicates that the required source data was not available. Plug-In Interface
routines has become the industry standard for fast real-time graphics, and is Supported by most video hardware to provide acceleration and keep most of the graphics pipeline process ing tasks off of the CPU. OpenGL provides a robust set of primitive calls to render polygons with realistic lighting, shading, and texturing effects, Z-buffering, and other The VAT Plug-in Interface 250 exposes portions of VAT advanced graphics features. The graphics library lends itself 200 functionality to allow end users to enhance the capabili tO a scene graph approach for storing polygons and trans- is ties of the VAT 200 beyond those that are delivered with the forms internally, while also allowing for a BSP tree or other VAT 200. The VAT Plug-in Interface 250 subsystem exposes spatial structure to exist internally since OpenGL does not four interfaces which collectively allow the user to enhance deal with higher-level polygon Sorting or organization. A VAT 200 behavior in three areas: adding additional analytic scene graph is a technique used to store rotations and trans- models, adding additional textual interpreters, and adding lations in a tree structure. This structure allows changes at a 20 additional data input and output converters. In general terms, higher level to affect all objects below the node; organizing plug-ins are self-registering Microsoft COM objects that rotations and translations in an efficient manner. implement the VAT Plug-in Interface and at least one of the Report Generator Module other VAT Plug-in Interfaces 250. The Report Generator module of the VAT 200 is respon- The static structure of the VAT Plug-in interface 250 sub
sible for the creation of electronic and printed output from the 25 system is shown in The Plug-In Interface Class Structure as VAT 200 system. The report generator is driven based on shown in FIG. 45. The plug-in interface is structured to sup inputs from the user interface that indicate the report type to port the four exposed interfaces; each external interface is generate and the desired output format. The report generator represented internally by a class that provides the methods to always operates on the active dataset for the VAT 200. interact across the interface. In addition to the interface The Report Generator module is built around the design 30 classes, a higher level class plug-in interface implements
concepts expressed in the User Defined Report Generation control for the plug-in interface and provides the public inter Capability section. As described in that section, report for- face for the VAT Plug-in Interface module 250. mats form the heart of the report generation capability whose During VAT 200 startup, the VAT 200 initializes the VAT structure is reflected in its class hierarchy as shown in FIG. 25. Plug-in Interface module 250, which then proceeds to register Report Format and FIG. 44, VAT Report Generator module. 35 all plug-ins that are located in the VAT 200 system plug-ins In addition to the Report Format, Section, Paragraph and directory and those in the user plug-ins directory. Each reg Clause object classes discussed in the User Defined Report istered plug-in is then started by the VAT 200 to allow it to Generation Capability section; the Report Generator module perform any resource allocation and startup processing that adds a class for the report that forms the public interface for may be required. After VAT 200 processing has completed, creating reports in multiple formats, a report generator class 40 this process is reversed. Each plug-in is shutdown to allow it that forms the public interface for the subsystem, and several to free any resources it may have acquired during the VAT 200 subclasses which implement the specific behaviors for para- execution, and the VAT plug-in interface 250 is shutdown. graph types, clause types, and output formats. Run-time processing varies depending on the type of plug The report generator object defines the public interface for in. As shown in FIG. 46, while the VAT 200 is running the
the Report Generator module. It is the only object in this 45 plug-in is dormant. When the user requests an analytic model subsystem that persists throughout a VAT 200 execution. execution, however, the plug-in proceeds through three states. Other objects in the subsystem are instantiated and destroyed The pre-execute state allows a plug-in module to performany as necessary when generating reports or creating user-defined data gather/reformatting required for an impending model report formats. execution. After completing pre-execution processing, the The report object is an abstract object that is never instan- 50 VAT 200 proceeds through the execute state wherein the VAT
tiated. Instead, it defines the public interface to several sub- 200 would actually execute the external model, and the post classes that deal with the specifics of particular output for- execute state where the VAT 200 allows the analytic module mats. This indirect approach allows the VAT 200 to be more plug-in to perform any post processing and data collection. easily expanded in the future to include support for additional TIMS output file format types. Initially, the VAT 200 will be capable 55 Interface Design of creating documents in RTF, and Microsoft Word 97TM The TIMS 130 is composed of seven screens: formats. Login screen A similar approach has been taken with the paragraph and Welcome (splash) screen
clause objects. Abstract base classes form the interface to Browse screen these classes, while specific Subclass objects allow for spe- 60 Search screen cific behaviors for different paragraph and clause types. Summary screen When the user requests to generate a report, the GUI 202 Compare screen
sends the report format, the desired output type, and option- Notes screen ally, an output file name. Report generation occurs in two The login screen allows the user entry into the system stages: qualification and creation. During the qualification 65 based on a login ID and a password. Once logged in, a splash stage the report generation Subsystem performs a walk- screen welcomes the user to the system and offers a list of through of the report format and verifies that each Section, possible menu selections. The browse screen 4700 is shown

US 9,292,874 B2 35
in FIG. 12. The browse screen 4700 gives the user the ability to sort the site entries based on several different methods. The user can also search the sites for particular information using the search screen. Once the user had decided upon a particular site and report, the Summary Screen outlines all of the infor mation available from that site. Using the compare screen, the user can perform side-by-side comparisons of different report entries, either from the same site or from different sites. At any time, the user can capture comments or memos for later use with the notes Screen. Software Architecture The TIMS 130 provides the user the capability to view
individual VAT 200 sessions from multiple sites. The TIMS 130 also allows the user to sort, search and browse the data from the individual VAT 200 sessions by categories such as threat type, risk, score and others.
FIG. 12 is an overview of user interaction with the TIMS 130. Results from local VAT 200 sessions are transferred to the TIMS 130, in the form of the VAT Database 220, and stored in a database along with sessions from other sites. The TIMS 130 user can then analyze these various sessions using several browse and search techniques. Each session is view able by selecting the Summary option, which displays a brief overview of the session's report and the information collected during the session presented in the form of charts and tables. At any point, the user can access a notes screen to capture comments for later review. The TIMS 130 database architecture is similar to the local
VAT 200 with minor enhancements in order to support the TIMS 130 operational requirements. The TIMS 130 is imple mented on a high performance database server supporting multiple clients. The TIMS 130 database is designed to sup port the storage and access of multiple VAT 200 sessions from multiple sites. Each session is individually identified within the database supporting the TIMS 130 operational require ments. The Database Management System (DBMS) handles data concurrency, integrity and user authentication of the TIMS 130 sessions.
Through the user-friendly interface of the TIMS 130, the user can perform many tasks to understand the information collected from the local sites, including:
Browsing data The user can scroll through all of the information sessions collected from the local sites
Searching The user can search for particular sets of data based on specific information, such as a site or a date
Ranking and sorting The user can sort the data and assign rankings based on categories such as threat type, risk score, remediation cost, target types, and Vulnerabilities.
Comparison The user can compare report sessions between the Professional Assessor and Planner, across differ ent dates, and through other means.
Because of the web-enabled capability of the TIMS 130, a client-server arrangement is used as depicted in FIG. 48. The TIMS 130 server handles the reception and storage of the local VAT 200 sessions, capturing each separate VAT Data base 220 into one comprehensive data store. The user then accesses the collection of VAT 200 data by pointing their Web browser to the TIMS 130 server. The server also handles login and password authentication before allowing VAT 200 data to be viewed. VAT. Editor
The AVAT 100 Suite includes an editor that is capable of modifying the VAT 200 user interface, database, and reports formats. The editor is a standalone application that interfaces with the VAT Database 220 in order to make all of the avail able modifications. This is possible because the user interface
5
10
15
25
30
35
40
45
50
55
60
65
36 definitions and reportformats for the VAT 200 are all stored in the database instead of being compiled into the VAT 200 executable. The VAT Editor 150 is capable of creating and editing the
user interface Screens and can define screens that are tailored to different types of users. It can edit the database to add object instances into the data model and modify the influence network 500. Finally, the VAT Editor 150 can create, edit, and delete report formats to create new and customized reports to meet future needs. User Interface Design The VAT Editor 150 will allow the user to both view and
change many aspects of the VAT 200 application. It is designed to allow a knowledgeable user to customize and extend the VAT 200 to address future user needs. The tool will have a mode for viewing and modifying the VAT 200 user interface, database, and output report formats. Each mode displays an overall picture of the item being edited and pro vides a toolbar on the left to issue edit commands. A mockup of the interface is shown in FIG. 11. The User Interface Editing mode presents the user with a
representation of the current screen flow in the system. It then allows the user to modify the flow of the screens, the content of the screens, and the look and feel of the application. Because the flow and contents of the screens are highly dependent on the contents and structure of the database, the Database 220 mode is always available to the user for refer CCC.
The Database Editing mode provides the user with the ability to view and move around the database and its contents. It is capable of showing both the data model and the influence network 500. From there the user can select a class or node to view and/or modify. The Report Format Editing mode allows the user to view
the format of the reports in the VAT 200. They can then create new reports from Scratch, create new reports from existing report formats, and edit existing report formats. The VAT Editor 150 will display the sections, paragraphs, and clauses that comprise the reportformat. The user can then select items to edit and/or insert new items from a list. The screen listing the three editing modes is shown in FIG. 49. User Interface Editing
There are two aspects of the User Interface that can be modified: the dynamic content and the overall look and feel as shown in FIG. 50. Nodes in the influence network 500 and the objects in the
data model 2600 drive the dynamic content of the user inter face, shown above. Each of these items has one or more GUI 202 definitions associated with it as shown in FIG. 51.
Each GUI 202 definition is also associated with a specific user type that will use it. The user is able to:
Create and edit user types Create and edit the GUI 202 definitions that the GUI
Engine 210 associates with each user type for each node and data model object.
The GUI 202 definitions completely describe the dynamic content for the given object. Using the VAT Editor 150 the user is able to specify. The title for the screen Screen breaks Static text Data input and output fields including: Associated prompts and questions Where the data is stored in the database How it should be entered including:
Size limits Type limitations Choice lists Default values
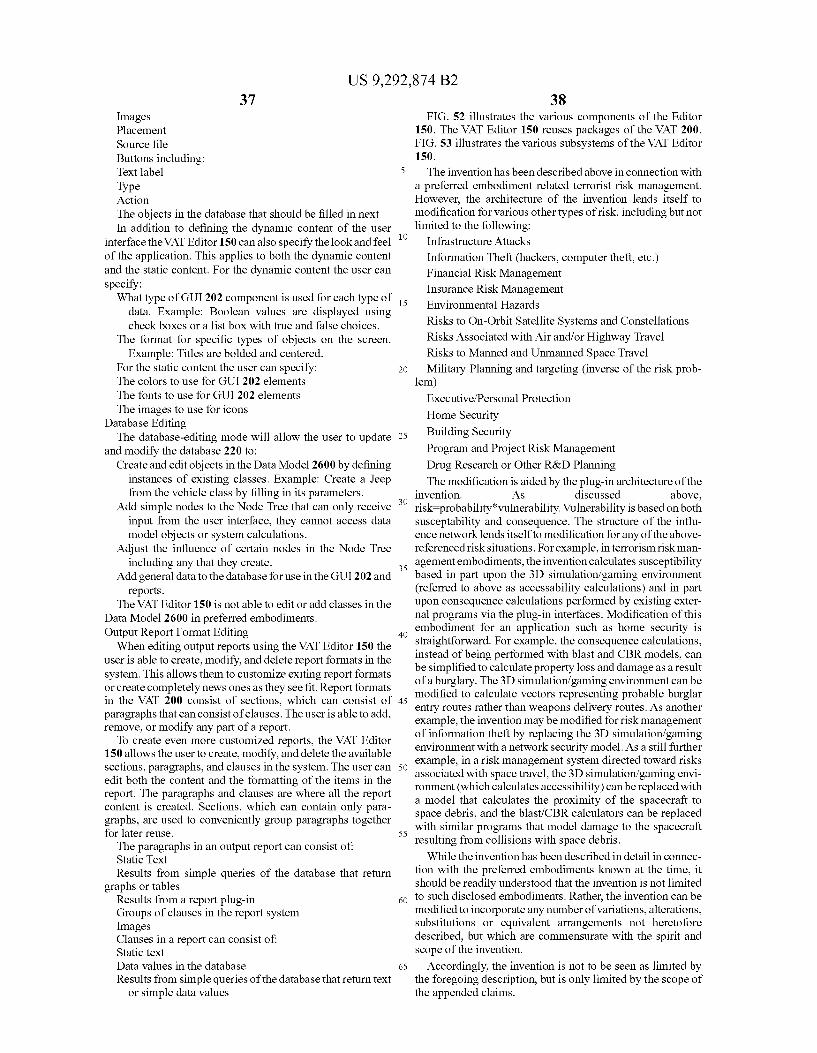
US 9,292,874 B2 37
Images Placement Source file Buttons including: Text label 5 Type Action The objects in the database that should be filled in next In addition to defining the dynamic content of the user
interface the VAT Editor 150 can also specify the look and feel of the application. This applies to both the dynamic content and the static content. For the dynamic content the user can specify: What type of GUI 202 component is used for each type of
data. Example: Boolean values are displayed using check boxes or a list box with true and false choices.
The format for specific types of objects on the screen. Example: Titles are bolded and centered.
For the static content the user can specify: The colors to use for GUI 202 elements The fonts to use for GUI 202 elements The images to use for icons
Database Editing The database-editing mode will allow the user to update
and modify the database 220 to: Create and edit objects in the DataModel 2600 by defining
instances of existing classes. Example: Create a Jeep from the vehicle class by filling in its parameters.
Add simple nodes to the Node Tree that can only receive input from the user interface, they cannot access data model objects or system calculations.
Adjust the influence of certain nodes in the Node Tree including any that they create.
Addgeneral data to the database for use in the GUI 202 and reports.
The VAT Editor 150 is notable to edit or add classes in the Data Model 2600 in preferred embodiments. Output Report Format Editing When editing output reports using the VAT Editor 150 the
user is able to create, modify, and delete report formats in the system. This allows them to customize exiting report formats or create completely news ones as they see fit. Report formats in the VAT 200 consist of sections, which can consist of 45 paragraphs that can consist of clauses. The user is able to add, remove, or modify any part of a report.
To create even more customized reports, the VAT Editor 150 allows the user to create, modify, and delete the available sections, paragraphs, and clauses in the system. The user can 50 edit both the content and the formatting of the items in the report. The paragraphs and clauses are where all the report content is created. Sections, which can contain only para graphs, are used to conveniently group paragraphs together for later reuse. The paragraphs in an output report can consist of: Static Text Results from simple queries of the database that return
graphs or tables Results from a report plug-in Groups of clauses in the report system Images Clauses in a report can consist of Static text Data values in the database Results from simple queries of the database that return text
or simple data values
10
15
25
30
35
40
55
60
65
38 FIG. 52 illustrates the various components of the Editor
150. The VAT Editor 150 reuses packages of the VAT 200. FIG. 53 illustrates the various subsystems of the VAT Editor 150. The invention has been described above in connection with
a preferred embodiment related terrorist risk management. However, the architecture of the invention lends itself to modification for various other types of risk, including but not limited to the following:
Infrastructure Attacks
Information Theft (hackers, computer theft, etc.) Financial Risk Management Insurance Risk Management Environmental Hazards
Risks to On-Orbit Satellite Systems and Constellations Risks Associated with Air and/or Highway Travel Risks to Manned and Unmanned Space Travel Military Planning and targeting (inverse of the risk prob
lem) Executive/Personal Protection
Home Security Building Security Program and Project Risk Management Drug Research or Other R&D Planning The modification is aided by the plug-in architecture of the
invention. AS discussed above, risk probability vulnerability. Vulnerability is based on both Susceptability and consequence. The structure of the influ ence network lends itself to modification for any of the above referenced risk situations. For example, interrorism risk man agement embodiments, the invention calculates Susceptibility based in part upon the 3D simulation/gaming environment (referred to above as accessability calculations) and in part upon consequence calculations performed by existing exter nal programs via the plug-in interfaces. Modification of this embodiment for an application Such as home security is straightforward. For example, the consequence calculations, instead of being performed with blast and CBR models, can be simplified to calculate property loss and damage as a result of a burglary. The 3D simulation/gaming environment can be modified to calculate vectors representing probable burglar entry routes rather than weapons delivery routes. As another example, the invention may be modified for risk management of information theft by replacing the 3D simulation/gaming environment with a network security model. As a still further example, in a risk management system directed toward risks associated with space travel, the 3D simulation/gaming envi ronment (which calculates accessibility) can be replaced with a model that calculates the proximity of the spacecraft to space debris, and the blast/CBR calculators can be replaced with similar programs that model damage to the spacecraft resulting from collisions with space debris.
While the invention has been described in detail in connec tion with the preferred embodiments known at the time, it should be readily understood that the invention is not limited to such disclosed embodiments. Rather, the invention can be modified to incorporate any number of variations, alterations, Substitutions or equivalent arrangements not heretofore described, but which are commensurate with the spirit and Scope of the invention.
Accordingly, the invention is not to be seen as limited by the foregoing description, but is only limited by the scope of the appended claims.
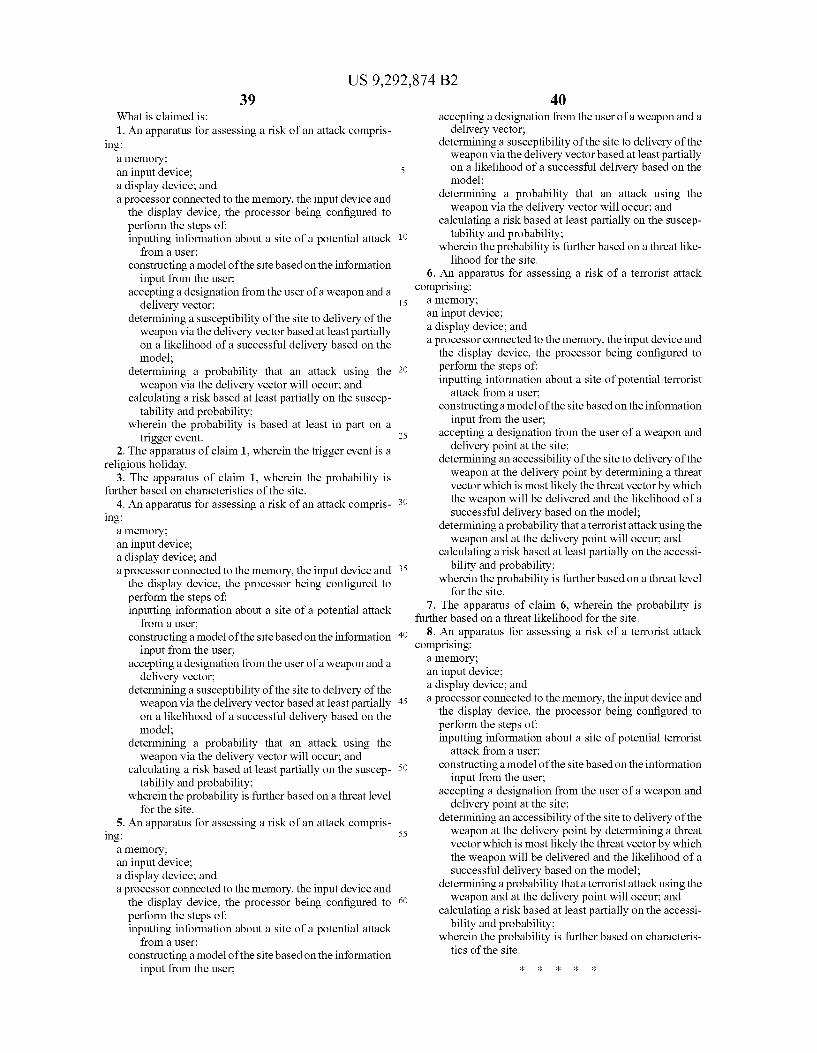
US 9,292,874 B2 39
What is claimed is: 1. An apparatus for assessing a risk of an attack compris
ing: a memory; an input device; a display device; and a processor connected to the memory, the input device and
the display device, the processor being configured to perform the steps of: inputting information about a site of a potential attack
from a user; constructing a model of the site based on the information
input from the user; accepting a designation from the user of a weapon and a
delivery vector; determining a susceptibility of the site to delivery of the weapon via the delivery vector based at least partially on a likelihood of a successful delivery based on the model;
determining a probability that an attack using the weapon via the delivery vector will occur; and
calculating a risk based at least partially on the suscep tability and probability;
wherein the probability is based at least in part on a trigger event.
2. The apparatus of claim 1, wherein the trigger event is a religious holiday.
3. The apparatus of claim 1, wherein the probability is further based on characteristics of the site.
4. An apparatus for assessing a risk of an attack compris ing:
a memory; an input device; a display device; and a processor connected to the memory, the input device and
the display device, the processor being configured to perform the steps of: inputting information about a site of a potential attack
from a user; constructing a model of the site based on the information
input from the user; accepting a designation from the user of a weapon and a
delivery vector; determining a susceptibility of the site to delivery of the weapon via the delivery vector based at least partially on a likelihood of a successful delivery based on the model;
determining a probability that an attack using the weapon via the delivery vector will occur; and
calculating a risk based at least partially on the suscep tability and probability;
wherein the probability is further based on a threat level for the site.
5. An apparatus for assessing a risk of an attack compris ing:
a memory; an input device; a display device; and a processor connected to the memory, the input device and
the display device, the processor being configured to perform the steps of: inputting information about a site of a potential attack
from a user; constructing a model of the site based on the information
input from the user;
10
15
25
30
35
40
45
50
55
60
40 accepting a designation from the user of a weapon and a
delivery vector; determining a susceptibility of the site to delivery of the weapon via the delivery vector based at least partially on a likelihood of a successful delivery based on the model;
determining a probability that an attack using the weapon via the delivery vector will occur; and
calculating a risk based at least partially on the suscep tability and probability;
wherein the probability is further based on a threat like lihood for the site.
6. An apparatus for assessing a risk of a terrorist attack comprising:
a memory; an input device; a display device; and a processor connected to the memory, the input device and
the display device, the processor being configured to perform the steps of: inputting information about a site of potential terrorist
attack from a user; constructing a model of the site based on the information
input from the user; accepting a designation from the user of a weapon and
delivery point at the site: determining an accessibility of the site to delivery of the weapon at the delivery point by determining a threat vector which is most likely the threat vector by which the weapon will be delivered and the likelihood of a successful delivery based on the model;
determining a probability that a terrorist attack using the weapon and at the delivery point will occur; and
calculating a risk based at least partially on the accessi bility and probability;
wherein the probability is further based on a threat level for the site.
7. The apparatus of claim 6, wherein the probability is further based on a threat likelihood for the site.
8. An apparatus for assessing a risk of a terrorist attack comprising:
a memory; an input device; a display device; and a processor connected to the memory, the input device and
the display device, the processor being configured to perform the steps of: inputting information about a site of potential terrorist
attack from a user; constructing a model of the site based on the information
input from the user; accepting a designation from the user of a weapon and
delivery point at the site: determining an accessibility of the site to delivery of the weapon at the delivery point by determining a threat vector which is most likely the threat vector by which the weapon will be delivered and the likelihood of a successful delivery based on the model;
determining a probability that a terrorist attack using the weapon and at the delivery point will occur; and
calculating a risk based at least partially on the accessi bility and probability:
wherein the probability is further based on characteris tics of the site.
ck k k k k