120110 littleport masterplan - desk research resul
TRANSCRIPT

Agenda Item 6 - page 1
AGENDA ITEM NO 6TITLE: Littleport Masterplan - Desk Research Results
Committee: Littleport Masterplan Working Party
Date: 12th January 2010
Author: Principal Sustainable Development Officer/Infrastructure andProjects Officer
[J285]
1.0 ISSUE
1.1 To receive reports and a presentation on the results of the desk researchwhich has been carried out to date for the Littleport Masterplan.
2.0 RECOMMENDATION
2.1 It is recommended that the Working Party note and comment on the issuesidentified as appropriate.
3.0 BACKGROUND
3.1 The first stage of the Littleport Masterplan preparation process is theidentification of key issues which the Masterplan should be investigating.Over the last three months officers have interviewed a series of stakeholdersto seek their views about the town, as well as carrying out substantial deskresearch to help identify some of these issues.
4.0 THE REPORT
4.1 The appendices to this document contain a series of reports which have beenproduced as a result of this research:-
Littleport Infrastructure and Constraints AssessmentLittleport Socio/economic IssuesLittleport Townscape AppraisalCurrent Strategic Planning Policy in relation to LittleportLittleport Community Aspirations Summary ReportLittleport Masterplan Meetings with Key Stakeholders
4.2 The Infrastructure and Projects Officer will give a presentation to the meetingabout the key issues and conclusions which have been drawn from thesereports.

Agenda Item 6 - page 2
5.0 FINANCIAL IMPLICATIONS
5.1 There are no direct costs arising out of this report.
6.0 APPENDICES
6.1 Appendix 1 Littleport Infrastructure and Constraints AssessmentAppendix 2 - Littleport Socio/economic IssuesAppendix 3 - Littleport Townscape Appraisal (map to be displayed at
meeting)Appendix 4 - Current Strategic Planning Policy in relation to LittleportAppendix 5 - Littleport Community Aspirations Summary ReportAppendix 6 - Littleport Masterplan Meetings with Key Stakeholders
Background Documents
Strategic DevelopmentCommittee minutes15/4/08, 17/6/08, 21/4/09
Location
Room FF102The Grange,Ely
Contact Officer
Sally BonnettInfrastructure and Projects Officer(01353) 665555E-mail:[email protected]

Agenda Item 6 – page 3
Appendix 1 - Littleport Infrastructure and Constraints Assessment
Archaeology
Location and Topography
The name ‘Littleport’ simply means ‘small town’. The term ‘port’ does not necessarily meanthat docking facilities are available in the location, although given the proximity of theroddon (a former river channel) to the island, some form of facilities are to be expected.
The town and parish of Littleport lies to the north of the district of East Cambridgeshirewhere it abuts the County of Norfolk. The total area of the parish is 7406 hectares (18301acres) making it one of the largest parishes in Cambridgeshire. The actual village lies inthe south of the parish on the canalized course of the River Great Ouse.
The town sits on an island of 400 hectares that rises to a maximum height of 20m ASL,and is separated from the main Ely island by Wood fen. Other areas of high groundinclude Apes Hall and Butchers Hill, and a ‘peninsula’ of land projects from the main islandroughly along the Wisbech Road towards St Matthew ’s Church. The remainder of theparish comprises fen. Until the construction of the Ouse Cut in 1827, the River Ousefollowed a meandering route through the fen that is now known as the Old Croft River.This ran through Littleport, touching the main island and meandered past Apes Hallthrough the parish northwards. Although parts of the Old Croft still contain water, thecourse of the river and its tributaries through the parish is mainly marked by a network ofroddons and the location of field boundaries. The other main settlements beside the maintown are Little Ouse, a small hamlet on the Little Ouse river on the Norfolk border andBlack Horse Drove. However there are numerous scattered farms and isolated dwellings inthe parish.
The historic core of Littleport has been taken as an area of 10km² stretching from TL55500 / 85500 to TL 58000 / 88000. This area covers most of the current built up area andperiphery, the length of the Old Croft roddon close to the town and much on the mainisland. A small area of the surrounding fen to the north is also included.
History
Littleport town itself has its origins in the mediaeval period. Nevertheless, activity frommost periods of activity are known from the area and parish.
A Solutre style flint blade dating from the Upper Palaeolithic was found on Burnt Fen. TheEnglish Rivers Palaeolithic Survey did not cover this part of the Ouse Valley, but finds fromthis period are not unknown. The earliest sites as opposed to finds are from the Mesolithic.These are clustered in the south-east of the parish in the vicinity of Burnt Fen, and centredon Peacock’s farm. This coincides with the Ouse roddon, suggesting that this was theattraction for settlement. These sites lie below the peat deposits on in areas where thepeat has been exposed to reveal the underlying clay. Most of these sites are also belowthe water table, and environmental evidence has been forthcoming, providing excellentevidence for the nature of the area ‘pre-fen’.
In the Neolithic period, again activity is located along the roddon but also on the mainisland. In addition, activity is located for the first time on the islands at Butchers Hill and
Agenda Item 6 – page 4
Apes Hall. Neolithic sites are discovered beneath the lower layers of peat, at a depth ofaround 4m below sea level.
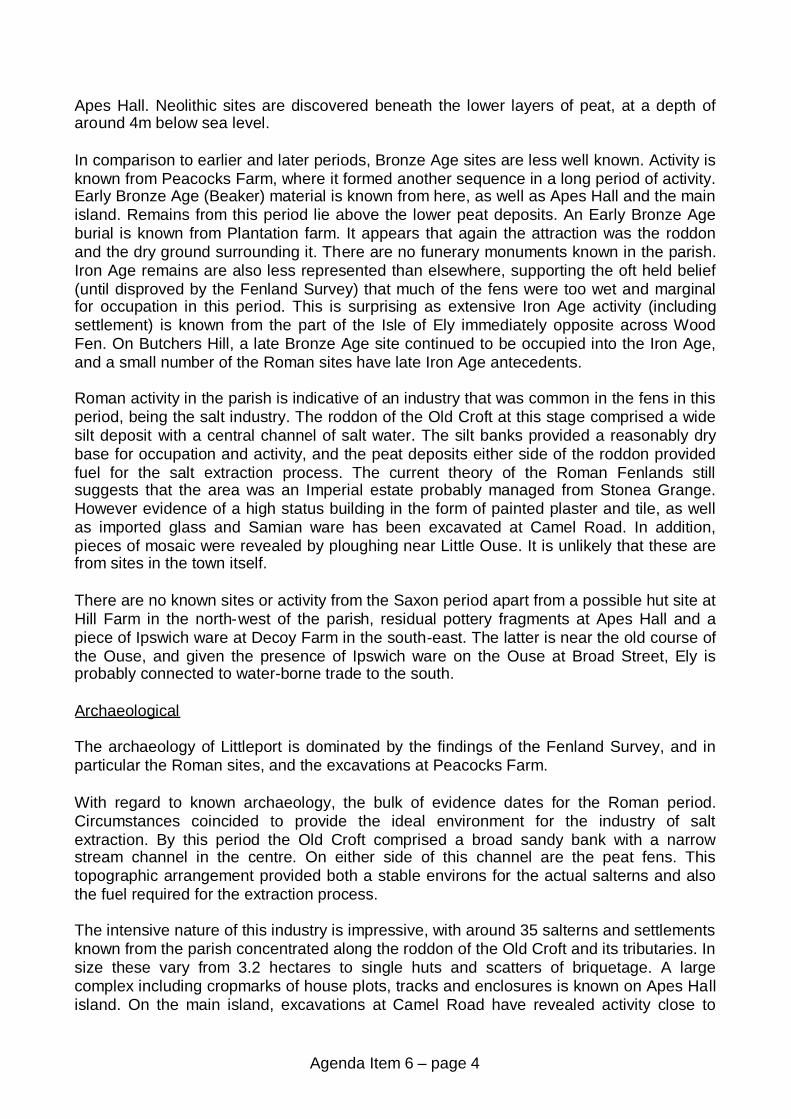
In comparison to earlier and later periods, Bronze Age sites are less well known. Activity isknown from Peacocks Farm, where it formed another sequence in a long period of activity.Early Bronze Age (Beaker) material is known from here, as well as Apes Hall and the mainisland. Remains from this period lie above the lower peat deposits. An Early Bronze Ageburial is known from Plantation farm. It appears that again the attraction was the roddonand the dry ground surrounding it. There are no funerary monuments known in the parish.Iron Age remains are also less represented than elsewhere, supporting the oft held belief(until disproved by the Fenland Survey) that much of the fens were too wet and marginalfor occupation in this period. This is surprising as extensive Iron Age activity (includingsettlement) is known from the part of the Isle of Ely immediately opposite across WoodFen. On Butchers Hill, a late Bronze Age site continued to be occupied into the Iron Age,and a small number of the Roman sites have late Iron Age antecedents.
Roman activity in the parish is indicative of an industry that was common in the fens in thisperiod, being the salt industry. The roddon of the Old Croft at this stage comprised a widesilt deposit with a central channel of salt water. The silt banks provided a reasonably drybase for occupation and activity, and the peat deposits either side of the roddon providedfuel for the salt extraction process. The current theory of the Roman Fenlands stillsuggests that the area was an Imperial estate probably managed from Stonea Grange.However evidence of a high status building in the form of painted plaster and tile, as wellas imported glass and Samian ware has been excavated at Camel Road. In addition,pieces of mosaic were revealed by ploughing near Little Ouse. It is unlikely that these arefrom sites in the town itself.
There are no known sites or activity from the Saxon period apart from a possible hut site atHill Farm in the north-west of the parish, residual pottery fragments at Apes Hall and apiece of Ipswich ware at Decoy Farm in the south-east. The latter is near the old course ofthe Ouse, and given the presence of Ipswich ware on the Ouse at Broad Street, Ely isprobably connected to water-borne trade to the south.
Archaeological
The archaeology of Littleport is dominated by the findings of the Fenland Survey, and inparticular the Roman sites, and the excavations at Peacocks Farm.
With regard to known archaeology, the bulk of evidence dates for the Roman period.Circumstances coincided to provide the ideal environment for the industry of saltextraction. By this period the Old Croft comprised a broad sandy bank with a narrowstream channel in the centre. On either side of this channel are the peat fens. Thistopographic arrangement provided both a stable environs for the actual salterns and alsothe fuel required for the extraction process.
The intensive nature of this industry is impressive, with around 35 salterns and settlementsknown from the parish concentrated along the roddon of the Old Croft and its tributaries. Insize these vary from 3.2 hectares to single huts and scatters of briquetage. A largecomplex including cropmarks of house plots, tracks and enclosures is known on Apes Hallisland. On the main island, excavations at Camel Road have revealed activity close to

Agenda Item 6 – page 5
where the roddon closes on the island. The date range of this site covers the wholeRoman period, and also a wider range of agricultural/industrial activity
The excavations at Camel Road are one of two large scale pieces of archaeologicalfieldwork that have taken place in the historic core under modern conditions, with thesecond being at Highfields Farm. Of the two, Camel Road has provided the greatestamount of data. The excavations at Camel Road took place in 1997 and 1998, and havenot been fully published as yet. The vicinity is known as an area of Roman activity, with theFenland Survey recording earthworks of a probable Roman date. The evacuationsrevealed a possible saltern site and ancillary structures, although the finds includedSamian pottery, slip wares, glass, imported stone, roof, floor and flue tile, and paintedplaster. These indicate the presence of a higher status residence or site nearby, with thepossibility being mooted that the overseer for the salt industry may have lived in the area.
Elsewhere around Camel Road, more recent work has located a palaeo-channel of the OldCroft that contains large amounts of pottery shards. This is suggestive of a nearby kiln andpottery industry. Horningsea ware has also been discovered, although interestingly nocoins, which is unusual for a high status site. Camel Road marks the area where the OldCroft met the higher ground of the main island, and as such it is expected that this andadjoining areas would be of high archaeological potential. However most of this lies underthe current town. On the Camel Road site, the stratigraphy comprised 20-35 cm ofoverburden, with approximately 60 cm of archaeological deposits overlying the alluvial siltsthat formed the natural. Water logging was encountered at 70-80 cm below the groundlevel, but although this may offer potential for preservation of environmental andarchaeological features this was beyond the depths of most of the deposits.
Highfields Farm comprises around 80 hectares of land that was evaluated prior todevelopment. The area covers the north and northwest slopes of the main island, includingwhat is almost the highest point. It was expected that this area would reveal muchevidence of earlier activity and occupation, especially as modern development oragriculture had not disturbed the site. However, surprisingly the site had little on it.
Geophysical survey proved that the soils were unresponsive beyond the identification ofridge and furrow. The hilltop area revealed some Neolithic activity, including PeterboroughWare pottery. The hilltop also attracted some Bronze Age activity, with a single cremation,flints and Beaker pottery. These finds suggest that the hilltop may have been an attractionor focus for activity in these periods. The lower slopes towards the fen edge revealedpossible Late Iron Age / Roman ditches, probably field boundaries, confirming that thenorthern fen edge was an area of activity in this period, but again not the actual hill itself.After these ditchers, the only other activity comprised ridge and furrow dating from the 14thcentury.
The lack of activity on the main island is curious, as it would be expected that this areawould be the main focus for occupation in the area. However it is worth noting thatelsewhere in the region, such as at Ely, the main focus for prehistoric settlement was thewestern slope of the island, which this work did not really touch on. Even so however, thelack of any activity on the hilltop is still unusual, and the only conclusion is that Littleportwas not heavily occupied until the Roman period. A small piece of work at Millpit Furlong,on the eastern slope, also revealed nothing.

Agenda Item 6 – page 6
Elsewhere within the historic core, little archaeology has taken place. Evaluations atplaces along Wisbech Road have confirmed that the north side was marginal land and toowet for occupation. It is unfortunate that the estate to the south side was not subject to aprogramme of archaeological investigation as it was built before the advent of PPG16.Very little in Saxon or mediaeval material is known from the core apart from potteryscatters and a well of possible mediaeval origin. Other finds comprise stray finds andfieldwalking results.
Outside the historic core the archaeology is dominated by the Roman sites on the roddon,Apes Hall and also the prehistoric sites at Peacock’s Farm. These confirm that the mainareas of activity were away from the actual island and centred along the water courses.The roddon network is extensive in Littleport parish, thus providing potential for manyaspects of archaeology in the area.
Prehistoric
Prehistoric remains within the historic core are minimal. It would be anticipated that thehigher ground on the main island would be attractive to settlement from this period, but hisdoes not appear to have been the case. However it is possible that very early featuresremain undiscovered, especially on the areas of exposed gravel. The highest point of theisland does appear to have had a focal role but this was not particularly intensive.However it did indicate that Neolithic and Bronze Age activity lies in the vicinity. It appearsthat the later Iron Age saw settlement along the northern fen edge, predating Romanremains in this area. Field boundaries have been found along the higher ground, showingthe use of the area for agriculture. However it is interesting to note that the main activitylies on the north, aw ay from the settlement on Ely island and on the Old Croft. Thissuggests that the main catalyst for settlement here was access to the river.
Roman
Although the main features of Roman occupation lie along the roddon network and not inthe historic core, there are sufficient remains within the historic core to draw a picture ofRoman period Littleport. It has been seen how Iron Age remains probably exist along thenorthern fen edge, with field systems stretching onto the island. This pattern of permanentRoman settlement being predated by Iron Age occupation can be seen elsewhere in theCounty, and as a result it is likely that remains of settlement, agriculture and burial are tobe found on this part of the island. However, the main Roman site that has beenexcavated on this side of the island, Camel Road, did not reveal anything predating thisperiod. This is because the site lay on the very edge of the fen, and as such was probablytoo marginal for Iron Age occupation. River channels are known from the site, thevulnerability of which was demonstrated by the residues of flooding in the 2nd and 3rdcenturies. Analysis of aerial photographs and more recent work here has shown thepresence of palaeochannels, some of which contain Roman pottery.
The finds at Camel Road suggest the proximity of a high status site, possibly a villa. This isindicated by the painted plaster, flue tile and imported stone, whereas the pottery foundincludes imported wares. It is likely that the salt industry was controlled from such aresidence, especially if the fens were an imperial estate as has been suggested. It is likelythat the river again was the main focus for settlement and activity, although the presenceof field boundaries at Highfields farm and evidence of changing land use at Camel Roaddemonstrates that this was not the only attraction or activity in the area.

Agenda Item 6 – page 7
Anglo-Saxon & Mediaeval
There are no Saxon sites known in the historic core, and very little known in the remainderof the parish. The watercourse would have been of interest, and given activity elsewhere inthe fens it is unlikely that this island and surrounding area would be overlooked. It is mostlikely that the later Saxon settlement lies beneath the current town. Although it has to bepointed out that the limited extent of mediaeval dry land does reduce the potential area forsettlement. The mediaeval village grew around a core centered on the parish church;presumably the manor centre was also nearby. It is likely that the village w as alignedeast-west, with the church to the west and an upper and lower road (High Street andWellington Road respectively). The numerous small roads and alleys that connect the twoare testament to this.
Wellington Road follows the 5m contour, so all land to the north of this would be marginalin its potential for waterlogging until the fens were drained fully. This stretch abuts onto theOld Croft, and perhaps an analogy with Broad Street in Ely might be possible, with themain route marking the fen edge and ancillary roads and houses leading from this to theriver proper. The main island of Littleport was apparently given over to arable farming, asMidlands style ridge and furrow stretches over the whole of the ground. The furlongsmarking out strips can still be seen in parts of the current field system. Given the small sizeof the island it is unlikely that three was any significant ‘extra-mural’ settlement. This isupheld by the need to reclaim and settle Apes Hall by the 13th century; pressures of landuse were increasing. Interestingly, there is no evidence of ridge and furrow at Apes Hall,suggesting that the pressure may also have been on the need for pasture for the manor.
Post-Mediaeval & Industrial
It is likely that before the advent of fen drainage programmes, Littleport suffered becauseof its position. Although it is situated on the main river route, it lies too close too Ely to be aviable port in its own right. Also, the islands on which it is built are in effect fairly isolated.The land routes elsewhere into the fens bypass here, and in effect it remained a small,relatively isolated island off the northern tip of the main Isle of Ely.
However, the main impetus for growth most likely came from the readiness with which thesurrounding fen could be drained. As has been seen, this process began in the late Saxonand mediaeval period, and although initially with the higher islands it spread into the moremarginal areas. The canalisation of the Ouse would have created an environment forreclamation, as the greater the outflow of water through the main channel the moreeffective boundary drains will be. Before the arrival of the Dutch engineers in the 17thcentury, Littleport was probably at the forefront of drainage and reclamation on a localscale. The wide ranging solutions put in place by Vermuyden and reinforced byincreasingly technological means of pumping water created the thousands of acres offarmland seen today in the parish. This was the impetus for the expansion of Littleport untilin the late 19th century it was a service centre for a network of scattered farms andcommunities that probably covered most of the parish. The main crops were the usual fenproduce of oats, potatoes and mustard, although the 1801 census records a ‘Hemp Field’.
Changes in agricultural practice and the labour market saw an end to this. Littleport didhave other industry, with the Hope Brothers shirt factory employing 300+ people as well asmaking a contribution to public life. However the factory has closed, and although an
Agenda Item 6 – page 8
industrial presence remains in the town, the agricultural role of the town has declined,although it is still an important local centre.
Conclusion
The island is potentially of very high archaeological significance but so far has revealedoccupation of very low intensity. It is quite possible that Littleport is an example of goodconditions not being fully exploited in prehistoric times, and it is true also that Romanactivity appears to have been specifically related to a natural resource on that islandsrather than the need for general living space. However the archaeology of Littleportremains to be understood. Much of the area on the fen edge, an area of very highsensitivity, has been developed, and the sites along the roddons and palaeo-channels aresubjected to heavy plough damage. Given the paucity of settlement in the main areas onthe island then it is possible that much of the resource of the town has already been lost.
The services infrastructure (water, sewerage) any new development may necessitatecould have archaeological implications and this will need to be given due consideration.
Cambridgeshire Extensive Urban Survey: Littleport. Draft Report 30/05/2001.
Conservation Area and Listed Buildings

Agenda Item 6 – page 9
Listed Buildings
Church of St George Church Lane Littleport Ely, CambsBarn, rear of No 5 High Street Littleport Ely, CambsNo 5 High Street Littleport Ely, CambsNo 29 High Street Littleport Ely, CambsBarn and outbuildings rear of No 15 Main Street Littleport Ely, CambsFenland No 15 Main Street Littleport Ely, CambsNo 3 Station Road Littleport Ely, Cambs
Conclusion
In addition to the above listed buildings and the conservation area, there are a number ofbuildings of local interest in Littleport and these will impact on any development proposalsfor the town centre. A Conservation Area Appraisal of Littleport is to be carried out in 2010and the results of this will need to be incorporated in the masterplan.
Swan flight Routes
Migrating swans do not follow set flight corridors or routes when they return to Welneyduring the winter months. They also leave the reserve to feed on surrounding farm landduring the day so there is a constant coming and going in all directions. (RSPB).

Agenda Item 6 – page 10
The WWT has recently launched its Super Whooper Project that aims to determine themigration routes that the swans take, the heights and speeds at which they fly, and theeffects of weather conditions on their flight patterns. They have fitted satellite trackingdevices to whooper swans caught in different parts of the country, to track them fromBritain to Iceland over the migratory period. These include 15 swans from Welney. Oncethe project is complete and the data analysed more information about swan flight routeswill be available.
Both the RSPB and WWT do not envisage future development in Littleport having animpact on swan flight routes, though the Super Whooper Project finding will be able toconfirm this.
Aeroplane Flight Paths
To the east of the County there is the main flightpath / controlled airspace for both RAFMildenhall and RAF Lakenheath, which are American Airbases.
DRAINAGE AND FLOOD RISK ISSUES
Flood Risk
The two principal sources of flood risk in the ECDC area are overtopping of the main riverembankments and breaching of the main river embankments. Although other sources offlooding exist (e.g. from surface water run-off or IDB pump failure), these two principalsources constitute the main risk of extensive damage to property and risk to life.
Overtopping is when the bank full capacity of the river channel has been reached, henceflood waters spill out of the channel over the embankments inundating the surroundingland. Breaching of raised earth embankments can result from overtopping of theembankments either by weiring or wave action, give rise to erosion of the landward faceleading to a catastrophic collapse of the embankment. The worst case scenario of abreach occurring will be when the water level in the river is at, or exceeding theembankment crest, meaning the maximum volume of water will inundate the surroundingland at very high velocities.
A Strategic Flood Risk Assessment (SFRA) was undertaken for the East Cambridgeshirearea in 2005 by Atkins (Report No 5031051/073/dg/051). This summarised the results ofextensive analysis of the river and flood models and flood defences in the area andconcluded with the production of more detailed flood maps for the East Cambridgeshirearea. It should be noted that the SFRA was undertaken prior to the publication of PlanningPolicy Statement 25 “Development and Flood Risk” (PPS 25) in 2006. Although the SFRAtakes some account of the future effects of climate change, it may be subject to furtherreview.
Currently a large proportion of Littleport is in Flood Zone 3 as described in paragraph 30 ofPlanning Policy Guidance Note 25 Development and Flood Risk (PPG25) (Ref 1). TheEnvironment Agency Flood Map shows that the majority of the Littleport area is locatedwithin the 100 year fluvial undefended floodplain

Agenda Item 6 – page 11

Agenda Item 6 – page 12
SettlementName
Source ofFlood Risk
Mechanism ofFlooding
Flood Defences Effect of ClimateChange
Accuracy ofAssessment
Littleport Principal sourceof flood risk is abreach from theBedford Ouse orEly Ouse.
There are twoterminalpumpingstations (TPS)that feed theSTW at CamelRoad andWisbech Road(Source: AnglianWater) (l).
Surface waterdrainage (m).
Breaching orovertopping ofBedford Ouse andEly Ouse defences.Littleport was floodedduring 1947 and1937events. During 1937Junction White HartLane and StationRoad under at least6”of water (Source: ElyGroup of IDBs) (k).
Both TPS’s have aCSO which outfallstothe ditch. Small riskin times of flood thatthe water passes theTPS via this outfallreducing ability topump which mayhavefoul floodingimplications for thelocal area (Source:Anglian Water).
Bedford Ouse isprotected to atleast 100 years,embankments arewell maintained(ref 17).
Standard ofProtection offeredfrom the Ely Ousealong this sectionis at least 100years (ref 9).
Environment Agencyflood defences andIDB pumping stationsare each designedfor a specifiedstandard ofprotection and designlife. The standard ofprotection and designlife vary across theDistrict for eachdefence or pumpingstation. The existingdefences/pumping stationshave not beendesigned toaccommodateclimate change.Climate change isnow recognised andnewdefences/pumpingstations are beingdesigned toaccommodate thepredicted increasesin depth and durationof flooding. DEFRA
Assessmentuses outputfrom 2dmodelling. Thismethod is themost reliable ofthose used inthis study andwill provide anappropriaterepresentationof flood process.

Agenda Item 6 – page 13
Localised recurringflooding fromnonfree-flowingwatercourses. Allsurface water fromVictoria Street areaisdischarged into anunmaintainedwatercourse.Croft/Holmeswatercourses notfree-flowing. Overtopping of HolmesRiver bank due toincreased waterlevels caused byhighways flooding.Floods gardens inCity Road andVictoria Street(Source:LittleportParish Council).
guidance,FCDPAG4,recommends thatwhen appraisingflood defence orpumping stationschemes to allow fora 20% increase onwatercourse flow byyear 50.Any increase inwatercourse floweffectively reducesthe standard ofprotection providedby the defence orpumping station.Any defenceprotected by flooddefences or pumpingstations need toconsider the futureimplications ofclimate change. Thisis especially truewhen thedevelopmentexceeds the designlife of the existingflooddefences/pumpingstations. For advice,consult with theEnvironment Agencyand IDB.
ECDC Strategic Flood Risk Assessment – Atkins
The purpose of the flood maps, in conjunction with PPS 25, is to steer new development toareas at the lowest probability of flooding (Zone 1). This is known as the Sequential Test.As part of this test, PPS 25 categorises different land uses into a “vulnerability” class,ranging from Essential Infrastructure, Highly Vulnerable, More Vulnerable, Less Vulnerableand Water compatible Development.
If a proposed development site is of a certain size or is located in an area at high risk offlooding, then a Flood Risk Assessment will need to be undertaken to accompany theplanning submission for the development. This will need to consider the flood risk to thesite, the vulnerability of the land use to flooding, and risks to occupants among otherthings. The table below shows the general advice for planners when considering if adevelopment is acceptable in an area at risk of flooding.91

Agenda Item 6 – page 14
92 S a3aSection 3 – Research Studies Ely Masterplan AppendicesThe Exception Test is a measure of whether the value of a new development outweighsthe potential flood risk that it may have. It should contain a review of all other availablesites to demonstrate that the chosen site is the preferable one, and it needs to be written inconjunction with local authority planners. Ultimately the decision regarding then ExceptionTest lies with the local authority.
Although any decision on land allocation will need to be based on the specific flood riskcharacter of the site, it is possible to group the settlements into three broad flood riskcategories. Littleport is classified as Category 2 - “ Settlements within an area protected toan appropriate minimum standard of defence and partially inundated by flooding from abreach”.
These settlements lie within the fens area, and are protected to an appropriate minimumstandard. However, in the very unlikely event of a breach to the Bedford or Ely Ousesystems, property on the slope of the settlements would be inundated. Furtherdevelopment in these slope locations would also be inundated by a breach flood.
Drainage - Surface Water
The Kerridge District lies to the west of the Ely Ouse River and north of LeytonsCatchwater. This District lies at the bottom of the south eastern slope of the Fen IslandTown of Littleport. Surface water from the town of Littleport is intercepted by the PadnalCatchwater Drain (maintained by the Board), which discharges by gravity into the ElyOuse. Catchwaters prevent intercepted surface water being pumped by the Board, oroverwhelming of pumping plant causing flooding within the District.
All surface water from Victoria Street area is discharged into an unmaintainedwatercourse. The Croft/Holmes Watercourses are not free-flowing and this results inlocalised recurring flooding. Over topping of Holmes River bank due to increased waterlevels caused by highways flooding often floods gardens in City Road and Victoria Street(Source:Littleport Parish Council). Anglian Water have had past sewer flooding incidentsreported on Silt Road, Camel Road, City Road and The Hythe in Littleport. Their pastreported flooding have on record was in 2006.

Agenda Item 6 – page 15
Any development in Littleport is likely to increase the impermeable area and thereforeresult in an increase of surface water runoff following rainfall. This, in turn, would increasethe potential for downstream flooding unless mitigation is provided.
In line with the recommendations of PPS 25, new development is generally expected toattenuate surface water runoff to existing or even “Greenfield” rates. Greenfield runoffrates are the theoretical rates from an undeveloped site. Any attenuation of surface waterwould also need to take account of the future effects of climate change through increasedrainfall intensities.
The most preferable methods of attenuation are Sustainable Drainage Systems (SuDS)whichinclude grassed swales, balancing ponds, detention basins, soakaways, permeablepaving, cellular storage, green roofs and others. These are all methods of storing orinfiltrating rainfallrunoff without increasing peak runoff rates and therefore not increasing the risk ofdownstream flooding. Any sites identified for expansion in and around Littleport shouldconsider at an early stage the runoff that will be generated and the opportunities forutilising different forms of SuDS. Some SuDS can have a large footprint, such asbalancing ponds and detention basins, and therefore would need to be included at theearliest stage of the masterplan process.3 – Research Studies Ely Masterplan AppendicesDrainage – Foul Water
The Core Strategy Amendment – Preferred Options paper, produced by EastCambridgeshireDistrict Council has a section on sewage treatment in Chapter 6. This states the following:
Littleport - New allocations outside the current development envelope may require localreinforcements of the water supply network. Littleport sewage treatment works is atcapacity and requires upgrading, and local reinforcements are also required to the foulsewerage network. It is therefore requested that new allocations should be phased tocome forward post-2011.
Conclusion
Flood risk is the biggest constraint to the future development of Littleport. Any areas forexpansion will need an assessment of flood risk undertaken for them in accordance withPPS 25 and the SFRA. Given the location of the areas at high risk of flooding, the mostappropriate areas for future development would seem to be to the south and west ofLittleport, with the areas close to the river and to the north being particularly restricted.With regard to sewerage and drainage, consideration should be given to alternativemethods of sewage treatment where possible, such as the utilisation of reed-bed systemsor similar to provide secondary and tertiary treatment
CONTAMINATED LAND ISSUES
Geology

Agenda Item 6 – page 16
Introduction
The British Geological Survey map, Sheet 173, (Ely – Solid and Drift) shows the Town ofLittleport to be underlain by the Boulder Clay. In turn, this is underlain by the KimmeridgeClay over the Ampthill Clay, both from the Jurassic period. During the Cretaceous andJurassic era much of the area was covered with shallow tropical and sub-tropical seas.
Towards the north and the south east of the Town, there are areas of Glacial Sand andGravel south of the city. The Quaternary glaciations of 250 000 to 18 000 years ago sawice sheets up to several thousand feet thick cover the district. Following the retreat of theice, when temperate climates returned and the broad glaciated hollow that was to becomeFenland was in filled with mud and peat.
Era Period Formation TypicalThickness(metres)
Cainozoic Quaternary Glacial Sandand Gravel
0 to 10
Cainozoic Quaternary GlacialBoulder Clay
0 to 10
Mesozoic Cretaceous LowerGreensand-WoburnSands
0 to 10
Mesozoic Jurassic KimmeridgeClay
15 to 46
Mesozoic Jurassic Ampthill Clay 20-50
Table1: Geological Succession Expected at the Site According to the BGS Map
Foundation Assessment
From the information obtained, Glacial Boulder Clay is likely to be encountered and itappears as though shallow strip foundations may be a suitable solution for any proposedlow-rise residential and commercial buildings providing no trees are in close proximity.Glacial Boulder Clay generally encountered at the depth at which shallow spreadfoundations would be constructed, is described as firm to stiff thus indicating an undrainedshear strength of approximately 75 to 150 kN/m2. However, Boulder Clay can be variablein its strength and material properties thus affecting the foundation design solution. As withall long established residential settlements many areas have been redeveloped manytimes which can result in ancient fill, there are also areas of slit, both of which is likely toneed engineered foundation designs.This can be confirmed following a ground investigation.3 – Research StudiesRecommendations for Ground Investigation
Before any potential sites are developed, a ground investigation will be required in order toassess the ground and groundwater conditions at the site and establish geotechnicalparameters for foundation design. Boreholes and trial pits are likely to be the most suitableform of exploratory holes for the ground conditions in order to produce engineering
Agenda Item 6 – page 17
geology logs and to provide samples for geotechnical and geoenvironmental testing. Thescope of the works will need to be such that it meets the requirements of BS5930(1999)/EN Eurocode 7.
Hydrogeology & Hydrology
Littleport is predominantly underlain by geological formations classed as Non-Aquifers. AMinor Aquifer exists to the south of the village, comprising the Glacial Sand and GravelUnit of the Lowestoft Formation.
Geological formations comprising major aquifers are considered to be highly permeableusually with a known or probable presence of significant fracturing. They may be highlyproductive and able to support large abstractions for public water supply and otherpurposes. The groundwater may be abstracted to produce large quantities of potablewater or could be important for local supplies and as a possible future groundwaterresource. These aquifers provide base flow to rivers.
Although minor aquifers are unlikely to yield quantities of water substantial enough forabstraction, these aquifers are important for base flow to rivers and could be utilised forlocal supply.
The surface water bodies located predominantly to the east of Littleport, comprising theRiver Great Ouse, are potential sensitive receptors to any contamination, as are thedrains and ditches that feed into this river.
Contaminated Land
Areas considered for re-development would require contaminated land assessments to beundertaken. As a minimum, Planning Policy Statement PPS23 requires that a desk studyand site walkover are undertaken to constitute a preliminary investigation which providesan initial assessment of land contamination risks.
Where risks are identified, investigations would follow a tiered approach as follows:
Phase I Preliminary Investigation and risk assessment (Desk Study) Phase II Exploratory / Main Investigation and risk assessment (intrusive
ground investigation and monitoring) Quantitative Risk Assessment Phase III Development and Implementation of Remediation Strategy Verification of remedial works (and long-term monitoring if required)
Re-development of brownfield sites carries greater risk of contaminated land, althoughpotential for contamination also arises at land with previous agricultural uses and evengreenfield sites. The majority of developments for residential purposes will require anassessment for the potential for land contamination, as will a lot of commercialdevelopments.
Sites where significant investigation and remedial works will most commonly be arequirement through the planning process would include many sites across Littleport. The

Agenda Item 6 – page 18
sites would include areas identified as having potentially polluting historic uses or currentuse, typically comprising small industrial units (e.g. garages, filling stations, yards, depots,smithy’s) as well as allotments, coal yards and landfills.
Developments would require consideration on a site-by-site basis, through which anyremediation required would be dealt with under the planning system.
Noise and Air Quality Issues
Noise
The major noise sources in Littleport include roads (especially those that currentlyaccommodate heavy traffic such as the A10), the railway and certain types of industrialdevelopments. Proposals to introduce noise sensitive receptors to any area, in the form ofnew residential properties, hospitals or schools, must be carefully considered and as far aspracticable they should be located away from existing noise sources.
Planning Policy Guidance 24 (PPG 24) guides local authorities in England on the use oftheir planning powers to minimise the adverse impact of noise. It outlines theconsiderations to be taken into account in determining planning applications both for noisesensitive developments and for those activities, which generate noise. The impact of noisecan be a material consideration in the determination of planning applications, and as such,if existing or proposed noise levels are found to be too high planning permission will berefused or noise control conditions applied.
PPG24 has a number of annexes that gives greater detailed guidance, which includes:
Noise exposure categories for dwellingsAn explanation of noise levelsGives detailed guidance on the assessment of noise from different sourcesGives examples of planning conditionsSpecifies noise limitsAdvises on potential insulation of buildings against external noise.
With respect to road traffic noise the Highways Agency implements the Governmentspolicy, which is to mitigate the effects of noise arising from traffic on the strategic network.Where new trunk roads are proposed the Highways Agency will undertake noiseassessments and using the document “The Calculation of Road Traffic Noise” they areable to assess entitlement of individual properties to noise insulation measures. Concernsabout increased traffic noise from existing trunk roads is dealt with by the HighwaysAgency having a target to resurface the network progressively with quieter materials. Inaddition they have a “Noise Mitigation Programme” which aims to address the mostpressing noise problems nationally.
Under the Environmental Protection Act 1990 the local authority can deal with complaintsof noise nuisance from existing commercial or residential premises. Investigations areundertaken, which may include noise monitoring, to establish the most appropriate form ofaction, whether that is the provision of advice, the recommendation for mediation or as alast resort the service of formal notices and any subsequent enforcement action that maybe required.

Agenda Item 6 – page 19
Air Quality
Air quality assessment work carried out by East Cambridgeshire District Council under theLocal Air Quality Management framework shows that air quality in Littleport is generallygood and achieves the national objectives. It is therefore unlikely that air quality will be aconstraint to development although there are exceptions to this;
The main potential constraint with regard to air quality will relate to any trafficimpacts of development. Any significant increase in traffic along roads with nearbyresidential properties may cause a problem. Assessment on a case by case basiswill need to be carried out.
Any new industrial installations, especially those regulated under the EnvironmentalPermitting Regulations 2007 and the Pollution Prevention and Control Act 1999,may require Air Quality Impact Assessments to be carried out to ascertain whetherany significant impacts will arise from the development and if so whether anymitigation measures are appropriate.
In addition to the Local Air Quality Management framework, any proposeddevelopments close to potential sources of nuisance, including odour, will requireconsideration to minimise the potential for nuisance to arise.
Ecology
Nationally Designated Sites
The Ouse Washes SSSI

Agenda Item 6 – page 20
http://www.natureonthemap.org.uk/map.aspx?m=sssi
The Ouse Washes are a designated SSSI and also have significant internationalimportance – see below.
Shippea Hill SSSI
http://www.natureonthemap.org.uk/map.aspx?m=sssi
Shippea Hill is important for the studies of Flandrian sea-level change and environmentalhistory in the Fenland through the integration of palynological, sedimentological andarchaeological investigations. It is a key location for dating the classic ‘Fen Claytransgression’ of the southern Fenland. Historically it is also important in the application ofmultidisciplinary research methods in environmental reconstruction.
Internationally designated sites
The Ouse Washes is designated a Special Protection Area, Special Area of Conservationand Ramsar Site which has been identified as being of national and international

Agenda Item 6 – page 21
importance for the breeding, feeding, wintering or the migration of rare and vulnerablespecies of birds found within European Union countries.
County Designated Sites
Within Littleport the Little Ouse River is designated a County Wildlife Site. County Wildlifesites are those sites considered to be of particular local importance for nature conservationat County, rather than national level.
Key Landscape Views
The following views were identified as memorable by the Littleport Partnership during ameeting held on 14th June 2006:
The view of Ely Cathedral from Grange LaneThe View of sunset from the River Great OuseThe Views of the countryside from the schoolsThe view of St George’s Church from Station Road and from the A10General sunset views from the town looking out to the FensAreas around Little Ouse – Shippea HillView from PadnalView of boat moorings from Sandhill BridgeView from Grange Lane across Little Downham
Conclusions
The areas identified above are particularly sensitive and significant wildlife areas and assuch due consideration should be given when proposing development in and around them.

Agenda Item 6 – page 22
Appendix 2 - Littleport Socio-Economic Summary Report
Demographics
Littleport has a population of 8130, which makes up almost 10% of the District population.
Whilst the population of Littleport East (5200) is not forecast to increase between 2007-2021, the population will age. By 2021 29% of the population will be aged 65+ (anincrease of 8% from 2007), The number of people aged 65+ in the district will increase at asimilar rate from 16.7% in 2007 to 24.3% in 2021. 48% will be aged 25-64 (a decrease of4%), 10% will be aged 15-24 (a decrease of 1.5%) and 15% will be aged 0-14 (a decreaseof 4%).
The ward of Littleport West is expected to increase by 75% by 2021 from 2800-4900; butthe age structure is more stable. The proportion of the population aged 65+ will remain thesame at 18% in 2007 and 2021. By 2021 51% will be aged 25-64 (an increase of 5%),12% will be aged 15-24 (a decrease of 2%) and 18% will be aged 0-14 (a decrease of3%).
The district population is forecast to increase by 2.6% by 2021. 81.5% of this growth isforecast to occur in Littleport West due to major housing development.
Littleport does not appear to have significantly high numbers of older people within thecommunity. The number of residents within other age categories is similar to the nationalaverage. The largest age group is 25-44 years in both wards.
The Output Area Classification (OAC) is a system that distils key results from the 2001Census for the whole of the UK at output area level to indicate the character of local areas.57% of Littleport East residents live in areas classified as ‘Countryside’, defined as:
“Residents in these rural areas are likely to work from home and to be employed inagriculture or fishing. They often live in detached houses; in households with more thanone car. Areas are less densely populated than other parts of the country”.
52% Littleport West residents live in Blue Collar Communities defined as:
“Housing in these areas is more likely to be terraced housing rather than flats andresidents mainly rent from the public sector. There is a high proportion of 5-14 year olds.Residents tend to have fewer higher educational qualifications than the national average.A high proportion work in manufacturing, retail or construction”.
Health
Life expectancy for Littleport residents is slightly lower than that nationally. The majority ofLittleport residents regard themselves as in good or fairly good health. Only 9% of thepopulation reported not being in good health (the same as the national average) and 17%Littleport West and 18% Littleport East residents have a limiting long-term illness (thenational average is 18%).
Agenda Item 6 – page 23
Though estimated binge drinking and estimated smoking levels are high, they are in linewith the national average. Obesity levels are higher, a quarter of people in Littleport Eastand 28% of people in Littleport West are estimated to be obese (compared to 20%nationally).
Teenage Pregnancy Rates are higher than they are nationally but particularly so inLittleport West. For the time period 2003-2005 Littleport West had a teenage conceptionrate that was the 15th highest in the county (NHS Cambridgeshire).
Unemployment and benefits
Unemployment in Littleport is lower than it is nationally; the trend is an increase in thefigures, which is higher for Littleport West than East in the long term but the change hasbeen smaller in Littleport West in the short-term
Figures show that for every job centre vacancy there are 4 claimants from Littleport Westand 6 from Littleport East (national average is 5). This indicates that althoughunemployment is low there are not enough jobs in Littleport for those currently without ajob.
With regard to benefits, there are significant differences between the two Littleport wards.Claims from Littleport East for every type of benefit are lower than the level nationally, insome instances significantly lower.
Claims from Littleport West for bereavement, carers and lone parents benefits are higherthan the district and national average, particularly for lone parent benefits (2.53 claims per1000 residents, compared to 0.99 for Littleport East and 1.92 nationally) and workingbenefits are higher than the district number (14.86 claims for Littleport West, 8.9 for EastCambs.)
With the exception of Severe Disablement and State Benefit, the number of claimants foreach of the various benefits is higher from Littleport West than Littleport East. Althoughthe number of claimants from both wards is lower than the national figure for IncapacityBenefit, Income Support and Job Seekers Allowance, for Attendance Allowance, PensionCredits and the State Pension it is much higher.
Compared with the district figures all claims for Littleport West are higher except thenumber of State Pension claimants, yet the number of pension credit claimants is almostdouble district figure. Claimant numbers for all types of benefit are higher from LittleportEast, in particular severe disablement benefit claimants and pension credit claimantnumbers.
Deprivation and inequality
Littleport has some of the highest scores for deprivation compared to other areas in thedistrict, in particular in ‘Education, skills and training’ and ‘income deprivation’. LittleportWest has an average education score of 41.19 compared to Littleport East’s score of29.99 and the national average score of 21.57.

Agenda Item 6 – page 24
Access to services
Access to services is very good for Littleport residents with the exception of access to asecondary school.
Economy
The largest industry in Littleport is Agriculture, accounting for 20% of industries in LittleportWest and 18% in Littleport East. Compared to national figures there are higher numbers ofagriculture, motor trade (Littleport West) and Production (Littleport West) industries inLittleport, but lower numbers of property and business, hotels and restaurant businessesand in Littleport West retail businesses. In Littleport West businesses are confined toseven types only, agriculture, motor trade, production, property & business, retail andwholesale, there are no education, finance, health, hotels & restaurant, communication orpublic administration and defence enterprises. Industries are more varied in Littleport East,though there are no education, finance or health businesses. The mix of retail provision inthe town centre is limited.
All businesses in Littleport East have fewer than 20 employees, 86% have less than 4.75% of businesses in Littleport West also have less than 4 employees. There are no largebusinesses in Littleport employing 200 or more people (31% people nationally areemployed in large businesses). 92% of Littleport East and 83% Littleport West businessesare micro businesses (employing less than 10 people), the national average in 85%.
Littleport has significantly lower levels of employment in knowledge driven services andknowledge driven sectors than nationally. Littleport West does have slightly higher thanaverage levels of employment in knowledge driven production sectors. 26% ofemployment in Littleport West is in medium-high tech companies, well above the nationalaverage of 2%. Employment in high-tech and R & D companies is very low, as it isnationally.
92% of commercial and industrial floor space in Littleport West is for industrial use; thenational average is 65%. There is no retail floor space in Littleport West. In Littleport East65% is industrial and 26% retail. Both wards have less office floor space than nationally.
The retail vacancy rate in Littleport is low, 1.7% but footfall is declining, though it didincrease slightly in 2009.
Labour Market
There are 1,500 jobs in Littleport spread pretty evenly across the two wards. 28.5% are inPrimary, manufacturing and construction sectors and 71.5% in services.
The employment rate in both wards is higher than nationally, 65% in Littleport West and68% in Littleport East compared with 62% nationally. It is particularly high amongstfemales in Littleport East and males in both wards. The economic activity rate is alsohigher overall for both wards. Littleport has fewer students, both economically active andinactive than the district or nationally.
As at October 2009 Littleport East had the highest number of unemployed people in thedistrict (113/3.6%). Littleport West has the highest proportion of unemployment 3.7%.

Agenda Item 6 – page 25
Over a third (35%) of unemployed people in Littleport West are aged 16-24, the figure forLittleport East, and nationally is 27% and 26% respectively. Littleport West has fewerpeople aged 50 and over in unemployment –10% compared with 16% Littleport East and19% nationally. Interestingly in Littleport East there are no unemployed people who havenever had a job, whereas 9% of the unemployed in Littleport West and 9% of unemployedpeople nationally have never worked.
The self-employment rate is slightly higher than it is nationally as is the percentage ofpeople working from home in Littleport East (it is slightly lower in Littleport West). 20% ofworkers in Littleport East and 21% in Littleport West work 49+ hours a week compared to16% nationally. Incomes are higher in Littleport East than West, where net weekly incomeis £18 lower than the national average.
Around half the working population of Littleport East and West travel less than 10km towork or work from home. This figure is similar for the district, but higher nationally, at67.4%. However, whilst only 7.7% of people nationally travel between 20-40 km to work,22.9% of Littleport East and 23.6 Littleport West residents travel the same distance. Thiscould be due to the rural nature of the area and the fact that fewer jobs are availablelocally. Despite close proximity to a train station, only 6% Littleport East and 7% LittleportWest workers use public transport to get to work compared with 15% nationally. Almost75% of Littleport residents travel to work by car.
The industries that employ the most Littleport residents are public services and real estate.The breakdown of industry of employment for Littleport residents is similar to thatnationally with the exception of employment in banking and public services, where inLittleport it is lower and employment in agriculture where rate for Littleport is higher.
When looking at the workplace figures there are many more differences. The industriesthat employ the most of the workplace workforce are manufacturing at Littleport West(35%) and retail in Littleport East (20%). Nationally the largest group are employed in retail(17%). Industries where employment in Littleport is higher than nationally are construction,education, health, other services (Littleport East only), Transport (Littleport East only) andLittleport West has higher levels of employment in manufacturing and textiles. Rates ofemployment in banking, public administration, real estate, engineering and highereducation are lower in Littleport than nationally.
Littleport has fewer people than nationally who are employed in higher and intermediatemanagerial/professional, supervisory, clerical, juniormanagerial/administrative/professional roles, but a higher number of people who areskilled manual workers, semi-skilled and unskilled manual workers.
Skills
Qualification levels across the parish are very low. 40% of residents from Littleport Westand 35% of residents from Littleport East have no qualifications compared to the nationalaverage of 31%. Levels of those qualified to NVQ 1 are higher and NVQ 2 is similar to thenational average. However, only 10% and 12% Littleport West and East residentsrespectively are qualified to NVQ level 4 and 5 (degree level) compared with 21%nationally.
Agenda Item 6 – page 26
GCSE attainment is also low across the parish – particularly in Littleport West where only38.9% of pupils gained 5 or more GCSEs A*-C grade, compared to 52% of Littleport Westpupils and 60% of pupils nationally (2001). In 2006, 30% of Littleport East and 31% ofLittleport West pupils did not obtain any GCSE passes above Grade D. The countyaverage was 17% (NHS Cambridgeshire.)
Higher Education participation levels are low, but the retention and success rates of thosewho do participate are higher that the national figure.
Littleport has no secondary school or community education facility. 410 pupils are bussedto City of Ely Community College.
Housing
The County Council estimates that there are 3620 dwellings in Littleport with planningpermission for a further 743 between 2009-2021.
Of the current dwellings are differences in tenure between the two wards, owneroccupancy is lower in Littleport West and renting, especially socially rentedaccommodation is high (29% compared to 14% in Littleport East and 19% nationally).House prices are lower than the national and district average but there are issues aroundaffordability for first time buyers.
With regard to household composition, the biggest proportion in both wards is marriedcouple households with dependent children. The figure for this and married couplehouseholds with no children is higher than the national average. There are also high levelsof cohabiting with no children households, low numbers of one person households, andlower than average numbers of lone parent households.
Littleport has 9 communal residences of these 6 are care homes catering for adults of allages in need of care/nursing (planning permission has recently been granted for anothercare home). These homes provide spaces for 172 residents. In addition to these there are3 sheltered housing schemes with a combined total of 49 bungalows and 65 flats.
Littleport has very few second homes but a large proportion of empty homes, especially inLittleport East where 3.71% of all homes are empty compared to 2.95% in Littleport Westand 1.88% nationally. 2.2% of these are long-term empty homes (a 10th of all the districtslong term empty homes).
Building on the Highfields site has stalled in recent months. 225 dwellings have beencompleted out of the total 650 (as of 20 Oct 09). Only 8 have been completed sinceNovember 2007; 5 completed in 2008 (Oct/Nov); 3 completed in 2009(Aug).
Public Transport
Littleport itself is very well served by public transport, however many areas of thehinterland do not have any public transport services or only have one bus service a week.
Open Spaces/Sports Facilities and Play Areas

Agenda Item 6 – page 27
Littleport is fortunate to have a large leisure centre with a good range of indoor facilities,including a main and secondary sports hall, fitness suite and squash courts, as well as 36acres of outdoor pitches including floodlit all weather facilities. A large number of clubsoperate out of Littleport Leisure Centre. In statistical terms there is a small deficit ofrecreational space, the amount available being just below the National Playing FieldsAssociation Standard of 2.4 hectares per 1000 population.
There is also a shortage of play areas in Littleport and across the district generally andthere are issues regarding the quality of existing play facilties.
Differences between Littleport East and Littleport West wards
Littleport East Littleport WestPopulation forecast to decrease by 2021 Population forecast to increase by almost
double by 2021‘Countryside’ ‘Blue Collar Community’
High teenage pregnancy rateLow number of benefit claims Higher number of benefit claims
High skills deprivation score (IMD)Industrial/commercial floor space – 65%industrial 26% retail
Industrial/commercial floor space – 92%industrial no retailHigh unemployment amongst 16-24 yearolds
Most people employed in retail Most people employed in manufacturingOwner Occupancy low, social renting high
Information still to be addedIn -migration data, investor confidence, levels of business start up and inward investment, competition locally andregionallyMap of Littleport East and West wards.

Agenda Item 6 – page 28
Appendix 4: Current Strategic Planning Policy in relation to Littleport
Regional Spatial Strategy – East of England Plan
East of England Regional Assembly (EERA) is the regional planning body of theEast of England and has a statutory duty to prepare and implement the RegionalSpatial Strategy, known in this area as the East of England Plan. This sets out thenumber of new homes and jobs which need to be planned for in the region.
The current plan, which covers the period to 2021, requires 6,170 additionaldwellings to be built in East Cambridgeshire, (taking into account past completions),a build rate of 360 dwellings per year (from 2006).
The East of England Plan is being revised however, to set new targets for the periodto 2031. Consultation in respect of this review is currently underway. EERA areexploring a range of scenarios for future growth, which could require EastCambridgeshire to accommodate anything between 7,760 and 15,000 new dwellingsin the period to 2031 (ie. build rates of between 390 per year to 750 per year).
The East of England Plan identifies the north of East Cambridgeshire as an areawhere the economic prospects need to be addressed. It also highlights the floodrisk and biodiversity issues relating to the whole of the Fens area.
A draft revised East of England Plan is anticipated in March/April 2009, with formalapproval scheduled in 2011.
East Cambridgeshire Core Strategy – LDF policies.
The East Cambridgeshire Core Strategy sets the strategic policies for the EastCambridgeshire district. The Core Strategy was recently approved as a sounddocument by the Government Inspector, following an examination in public, and isdue to be considered for adoption by Full Council on 20th October 2009.
It covers the period to 2025 and is based on the current East of England Plangrowth targets. A summary of the Core Strategy policies, as they affect Littleport, isset out below.
Spatial portrait;
Over the last 20 years the role of the district’s three market towns as local service,employment and commercial centres has increasingly become subject tocompetition from Cambridge and other nearby large towns. Additional measures aretherefore needed to sustain the vitality and secure revitalisation of these towns.Some regeneration initiatives have already been implemented including town centreenvironmental enhancement schemes in Ely, Soham and Littleport. Littleport waspreviously part of the European Objective 2 Transitional area and benfitted fromObjective 2b funding.

Agenda Item 6 – page 29
Littleport’s population is 7,800 and it serves a local catchment with lower scales ofcommercial and retail provision compared to Ely. It has a thriving high street and agood range of employment opportunities. It has had some recent housing growthwith the Highfields development and it also has the advantage of rail links. There isa recreation ground but no public park or market place
Core Strategy Policies
CS1 – Spatial Strategy- development should be focussed in ‘market towns’- development in locations with a range of services, shops and employment
opportunities reduces out-commuting and need to travel, reducing carbonemissions.
CS2 – Housing- In Littleport further land outside the current settlement boundary will not be
required for housing development- 1700 dwellings required between 2001 and 2025.- Anticipated windfall developments for Littleport – 199 dwellings- Large sites within settlement boundary - potential for 230 dwellings
CS3 – Gypsy and Traveller SitesTo be determined through Site Allocations Development Plan Document
CS4 – Employment- Sufficient outstanding employment land allocations in Littleport.- Currently 9.8ha unused employment allocations- Suitability of existing employment allocations needs to be reassessed.- 3.95 outstanding commitments as at 31.03.07- Additional job growth achieved via policies for tourism, retail, and rural
economy- Office development (B1a) encouraged to locate in the centre of market towns
CS5 – Retail and Town Centre Uses- Town centres need to be vibrant and attractive, offer a range of retail, leisure
and other ‘town centre uses’ which meet the needs of the community andvisitors. PPS6 makes town centres the focus of development.
- Littleport serves a local hinterland and Core Strategy therefore proposeslimited retail and leisure which is focussed on local needs and aidsregeneration of the town centre
- A need for 350 sq m of convenience (food and drink) retail floorspaceidentified for Littleport (which the recent planning consent for the Co-op willfulfil).
- Littleport town centre is tightly constrained by residential development andthere are no obvious opportunities for edge of centre development

Agenda Item 6 – page 30
CS6 – EnvironmentNo Littleport specific policies
- County wildlife site – Little Ouse River- Minimise resource use, increase energy efficiency, reduce carbon emissions,
sustainable methods of construction. Provide a range of services andfacilities so that there is less need to out-commute
- Protect and enhance the natural and built environment- Improve biodiversity- Encourage greater public access
CS7 – Infrastructure- New development proposals create demand for infrastructure and community
services/facilities. Planning system can help secure funding from developers– planning obligations
- Policy S3 seeks retention of important community services and facilites- Policy S1 seeks retention of retail function of town centres- Public realm enhancements in the market towns
CS8 – Access- Reduce the need to travel, especially by car- Improved public transport, cycling and walking networks
CS11 – Littleport- Littleport is a key area for shopping, leisure, and business activity in the
ditrict- A need for some additional convenience retail floorspace – 350 sq m- Potential opportunities for housing development on brownfield and greenfield
sites within settlement boundary- Growth needs additional infrastructure; extension to existing 2 primary
schools, identify land for a new primary school, enhanced sewage treatment,upgrading healthcare with expansion of doctors surgery, improvements tohighway/walking/cycling/public transport networks.
Inspectors Report on the East Cambridgeshire Core Strategy.
The approach adopted for Littleport by the Core Strategy, for primarily regenerationrather than significant growth, was affirmed by the Inspector at the Examination inPublic of the Core Strategy. She commented:-
“Policy CS 11, the core policy for Littleport, sets out a strategy tobring forward long-standing allocations and commitments in thetown and encourage greater self-containment through growth inlocal employment and service provision. The Council describes thisas a regeneration strategy.”

Agenda Item 6 – page 31
“While (Littleport) has long-standing commitments for housing and employment anddoubts have been raised about their attractiveness to the market, there has been areasonable level of activity in the past two years. The CS’s focus on regeneration ofthe town, to maintain and foster this impetus while not proposing any newallocations, is a realistic and sound approach.”
On balance, the CS’s approach to housing growth in Littleport issound, and it would not be appropriate to seek large new housingallocations outside the settlement boundary while the regenerationstrategy is bedding-in. Therefore, Littleport can be expected tomake a limited contribution to addressing the shortfall in identifiedsites (to compensate for the reliance on windfalls referred to inIssue 2 above). Policy CS 11 already acknowledges that someredevelopment opportunities will arise within the settlementboundary and this offers scope to identify additional sites.Nonetheless the policy requires some amendment to accord withPolicy CS 2 and I recommend accordingly [RC12].
Housing Statistics
Core Strategy identifies capacity for 1670 dwellings.468 dwellings already completed between 2001 and 2008.Outstanding commitments of 849 dwellings including 426 dwellings on HighfieldFarm.Estimated capacity on large potential sites within Littleport for 278 dwellings.
Majority of development can take place on sites already allocated in the currentlocal plan or on sites with outstanding planning permissions within the townboundaries.
Outstanding commitments:Total with planning permission, Highfield Farm = 650.Total without full planning permission = 128.
Committed sites with outstanding planning permissions in 2007:Padnal former industrial estate = 18/23 outstanding.Beech Court and Parsons Lane = 159/159 outstanding.Parsons Lane Garages = 13/13 outstandingLand at rear of Ely Road = 13/13 outstanding.
Committed sites with permission granted since 2007;Land rear of Wisbech Road = 24.40 Wisbech Road = 35.Old station goods yard = 30.
Brownfield windfall sites within settlement;57 outstanding 2007

Agenda Item 6 – page 32
Greenfield windfall sites;Land adjacent Wisbech Road = 16,Land north of Grange Lane = 71,12 Woodfen Road = 14,Land adjacent to 4 Ely Road = 35,Land west of 4 Ely Road = 94
NB Inspectors report on Core Strategy directs that windfall sites should not beincluded in the calculation for number of dwellings to be delivered in the district overthe first ten years of the plan period. Above figures for Littleport need to bereviewed to take this into account.

Agenda Item 6 – page 33
Appendix 5 - Littleport Community Aspirations Summary Report
This paper summarise some of the key results from previous consultation work carried outby the Littleport Partnership in the period 2000-2005.
The Littleport Partnership was a community group which was set up in the late 1990’s toassist in the regeneration of Littleport Market Town, under the branding of “Our Town, OurFuture”. It met regularly until 2006 when funding resource to enable the group to functionbecame more restricted. Nevertheless it achieved a substantial amount of work and itcarried out extensive consultation to obtain the views of local people about the futureneeds of their community. It therefore provides some useful background information forthe Littleport Masterplan.
The Littleport Partnership identified the following as key areas to address:-employment and training,enhancing the village environment,integrating the new residents from Highfields,involving the outlying communities,creating a positive image to boost both business and community confidence in
Littleport,creating a safer community,addressing youth issues.
Particular projects that local people prioritised were provision of vocational training,increasing the number of car park spaces, facilitating better access to service e.g. doctorssurgery, encouraging a programme of events for residents and to attract tourists, workingwith Police Community support officers to reduce anti social behaviour, and addressingtransport and other issues of the outlying community areas such as Little Ouse and BlackHorse Drove.
A Hinterland Survey in 2005 consulted those living in the hamlets surrounding Littleportand confirmed that a lack of retail facilities and public transport were the greatest issuesfaced by these communities. Respondents with children indicated that their children wereunable to take part in after school activities, the main reasons being distance betweenhome/school, lack of transport home and expense.
A 2006 Quality of life reports high levels of satisfaction with Littleport as a place to live –85% were very or fairly satisfied and feel that it is a place where people from differentbackgrounds and communities can live together harmoniously. In the last twelve months,71% of Littleport residents have done tasks on an unpaid basis for someone who is not arelative, and in turn 38% have had a task done for them.
Respondents were particularly satisfied with the quality and amount of naturalenvironment, the level of leisure services available and the level of social and healthservices available.They were not satisfied with the level of public transport available or the job the police aredoing in the neighbourhood. People living in Littleport do not feel that they can influencedecisions affecting their local area. Teenagers hanging around on the streets, peopleusing or dealing drugs and vandalism, graffiti other deliberate damage to property orvehicles are seen as a problem in the town.
Agenda Item 6 – page 34
The car is most popular mode of transport that people use for work, leisure activities,shopping and other activities, though almost as many walk to access leisure facilities anddo their shopping. More people use the bus than the train and very few cycle.
Of those that do drive to work, 59% travel up to 25 miles, 23% travel 11-25 miles. Justover half of those who are car passengers travel up to 25 miles, 23% travel 6-10 miles, apattern repeated by those using taxis. 69% travel to work via bus a distance of between 2-25 miles again 11-25 miles the most common distance. Those using the train travel either11-25 miles (to Cambridge?) or 51-100 miles (to London?). As would be expected walkingand cycling are only done over short distances – up to 5 miles.
People find it easy to access local shops, a post office, chemist, local hospital, public openspace, train station, library, sports or leisure centre, bank or cash-point, and counciloffices. Only accessing a theatre or cinema got a mixed response.
The Place Survey conducted in 2008 echoes many of the findings of the Quality of Lifesurvey. It also revealed that people who live in Littleport are satisfied with their local areaas a place to live (78% Littleport East residents, 81.1% Littleport West residents) and thatLittleport is a place where people from different backgrounds get on well together, thoughagain, a number of people perceive drug misuse and drunk or rowdy behaviour as aproblem. Perceptions of anti-social behaviour are higher than district and nationalaverages in Littleport West.
The survey also reports low levels of inclusion and involvement and satisfaction with publicservices, especially in Littleport West. Only 3% of Littleport West and 6.3% Littleport Eastresidents have taken part in a civic activity in their area in the last 12 months compared to15.2% across the district and 14% nationally. Only 5.9% of Littleport West and 19.3%Littleport East residents have participated in regular volunteering in their area in the last 12months compared to 26.7% across the district and 23.2% nationally. These statisticssuggest that measures and approaches to specifically engage these communities willneed to be considered when developing consultation activities for the Littleport Masterplan.
The Local Futures Child Well-being profile looks at how well children are doing in sevendifferent domains of their life: health, education, crime, material well being, housingenvironment and children in need. In terms of child well-being average scores LittleportEast is ranked 2260 out of 7932 wards, Littleport West 2594, and indicates that Littleportunderperforms compared to both district and national standards on the overall child well-being score, and this is particularly an issue in relation to the education scores.

Agenda Item 6 – page 35
Appendix 6 - Littleport Masterplan Meetings with Key Stakeholders
To date meetings have been held with representatives of:
Anglian WaterADeC (Arts Development In East Cambridgeshire)Business Link EastCambridgeshire County Council (education, planning and transport departments)ECDC Conservation OfficerEnvironment AgencyFirst Capital ConnectECDC Head of HousingECDC Principal Sports and Leisure OfficerSustransWildlife Trust
Meeting with Anglian Water - 30th November 2009
Waste Water
Currently AW have consent for discharge flow of up to 1,300 cu m per day. Theyare dealing with higher flow levels, but meet required water quality issues.Upgrades to work are planned which will take flow up to 2,476 cu m per day,together with local network upgrades.
The upgrade to current sewage works are approved by Offwat, and contained inthe March 2010-March 2015 business plan. These upgrades will cope with thelevels of growth envisaged in the LDF.
Any growth beyond these levels will need to be considered separately. AW are notallowed to provide for ‘speculative’ growth above levels in statutorily approvedplans.
Site allocations – AW have offered to review list of potential sites in advance,provide information on which pumping stations this would affect and assist inprioritisation process in site selection.
Surface Water
Localised flooding - will look to improve where possible.
SUDS – AW are promoting these for all developments, essential in green field andmuch preferred for brownfield, commercial etc. No trigger point for their provision –AW would wish to see them for all developments.
Water Supply

Agenda Item 6 – page 36
This is less sensitive to growth issues and they are able to supply as demandrequires.
They have a 25-year management plan in place. A deficit is forecast by 2035, butmitigated by the long-term plans for Fenland Water Transfers and ‘Education inWater Efficiency’.
Water Cycle Strategy - being undertaken by ENTEC. Looks at future growth, andidentifies blockers to development in the form of inadequate sewage works. Willidentify blockers to growth and which sewage treatment works will need upgrading.Work is in early scoping stages, with a first draft produced in July 09.
Meeting with ADeC - 26th November 2009
Littleport is quite an active community, ADeC regularly work on and off there.
Youth Forum – run activities with Cambridgeshire County Council Young PeoplesServices, Fenland Jam, Littleport Players, Field Theatre Group, occasional cinemafilm screening.
Information regarding future requirements is available in ECDC EastCambridgeshire Infrastructure Investment Strategy Report and the Arts Councils ‘AStandard Charge Approach’ document. Toolkit re planning for arts in newdevelopments available on Living Places website. Shows how demand for culturalfacilities can be assessed.
Current big issue – lack of appropriate space, especially for evening activities
Would like to see a building similar to the Arkenstall Centre, but bigger. Darlingtonhas a combined arts facility and swimming pool
Arts is competing with different sectors of the church for local business support
Childcare is an issue in Littleport
Meeting with Business Link East – 1st December 2009
Business Link find the area hard to penetrate in order to provide business support.Difficult to engage with local businesses compared to other areas eg Herts. Put thisdown to culture – local people tend to be more independent and less inclined toseek support.
Premises – no major concerns about premises issues. Those out on WisbechRoad/e-Space/Henry Crabb Road are good quality.
In town centre the premises tend to be run down and unattractive. Not perceived asan area an up and coming business would want to invite a customer to visit – doesnot impress.

Agenda Item 6 – page 37
Railway area – potential to do more in this area, very few facilities around thestation at the moment. Could develop as significant employment hub. Look atDownham as an example of facilities they have provided eg shop, platform facilities,etc. Potential to ‘lift’ town.
Image of Littleport – not seen as an employment centre, no reputation
Skills – not aware of any local concerns about lack of skills
Employment location – image of town centre, looks run down, does not impressclients. No central meeting place i.e. coffee shop
Involve VIRSA to encourage refitting and upgrading of shops, achieving betterquality in Littleport.
Meeting with Cambs County Council – 20th November 2009
County wish to know details of how the proposed growth levels in all of theMasterplans fit into the statutory LDF process. County need to know which levels ofgrowth to plan for when developing services such as education, transport etc anddetails of where this growth will be – will it all be in Ely, Littleport and Soham or willsome of it be in the villages?
Queried whether the Littleport Masterplan would be housing growth led oremployment growth with housing to support the employment growth? (An issuewhich will be considered during the masterplan development process).
RSS Joint County Response – County view is for focus on employment led growthas essential for sustainability. County see growth taking place in south of theCounty. Market towns are a possibility but only if employment development canalso be provided.
Education – can present options for a range of population levels. The case for asecondary school in Littleport is marginal, but the LDF level of growth will potentiallycreate demand for 600 places which is sufficient to justify a secondary schoolprovision.
With regard to skills, post 16 education will become the County Councilsresponsibility from April 2010, so situation will be clearer then
Network Rail – are understood to have proposals for Littleport station (stationrefurbishment?). Power supply restrictions, plus stretches of single track limitamount of 8 carriage way traffic. However car tends to be mode of choice for mostpeople – in Cambridge it is the walk to/from the station that puts some people offtravelling by rail.
From planning perspective, environmental capacity, traffic capacity and air qualityissues are key considerations.
Environment – precautionary approach, green infrastructure strategy issues.

Agenda Item 6 – page 38
Transport – no major issues, other than restrictions on access onto the bypass.Some points around accessibility to outpatients services at Addenbrookes.
The stakeholder workshop held for Ely Masterplan was felt useful by the Countyand they would be interested in similar for Littleport.
Meeting with ECDC Conservation Officer - 2nd December 2009
Town Centre – appearance of shops is run down. Also needs a better mix ofshops.
Should encourage usage of the upper floors of buildings.
Carrying out a conservation area appraisal – due to complete mid 2010.
6 listed buildings in Littleport – Church is the most important. 7 buildings of localinterest
District wide design guidance SPD Shop Fronts will also soon be available.
Important townscapeso Pub entrance to Main Streeto Library entrance to Main Streeto St Georges Church
Streetscape features/public furniture are generally OK – were upgraded in 2000-2005 period.
Sites to tackle include:-o Laburnham Lodgeo Old medical centre in Granby St – Potential for mixed use.o Back of Ironmongerso Garage opposite the pub at the crossroads.
Would positively encourage mixed use/employment uses of town centre sites.
Meeting with Environment Agency – 26th November 2009
Have recently produced updated flood maps - Flood Zone 3 now larger, with areasto the north and south particularly affected.
Any new development should incorporate efficiency measures – ideally build tolevel 4 or 5 of Code for Sustainable Homes. SuDS should be included in newdevelopments wherever possible.
Moorings - probably at capacity along river as need to keep river traffic free flowing– possible capacity offline, maybe at Marina?

Agenda Item 6 – page 39
No other constraints – some ground water vulnerability in the area south of GrangeLane but can be addressed by providing appropriate drainage.
Meeting With First Capital Connect – 9th December 2009
Rail usage from Littleport is increasing
Annual passenger numbers (a return journey counts as 2)o 2007/2008 – 148,836o 2006/2007 – 146,218
an increase of 2,618 journeys between the 2006/7 and 2007/8 years.
For comparison King’s Lynn - 680,230, Downham Market – 361,434, Waterbeach250,039. Ely passenger levels are around 1.5 million.
Attraction of Littleport – parking is cheaper and easier to get a space (though localreports of people parking on approach roads as car park full). Plus more likely to geta seat on the train.
Praised facilities at Downham station – people travel to Downham from Norwich,Dereham and Swaffham, people from King’s Lynn drive to Watlington for similarreasons as above.
Most people possibly going to London?
Extend car park – would increase usage – but land ownership/purchase issues
Can extend cycle racks by adding additional ones under disabled ramp – peoplecurrently chaining their bike to ramp pillars
Waiting room/shelter - Need specific one (as at Waterbeach) due to narrowplatform. Cost £25,000 – currently have £2,000 towards this from ECDC.Investigate potential CCC/S106 contribution, plus First Capital Connect budgets
Discussed possibility of increasing parking charges at Littleport – extra incomecould be put towards station improvements. Increase of £1 regarded as feasible.
Re increased facilities - Coffee cart at Waterbeach is very popular. First CapitalConnect to approach to see if would consider a month trial at Littleport as a firststep.
Meeting with ECDC Head of Housing – 16th November 2009
Demand for housing is not as high in Littleport as in other parts of the District, andthere tends to be a demand from local families rather than outsiders. Good supplyof bedsits in Littleport, but there is a need for more 4-5 bed houses in the area.
160 Littleport residents currently on waiting list, including 35 for 3, 4 and 5 bed. Thelist also includes a lot of single people and couples in low housing need who are

Agenda Item 6 – page 40
presumably hoping for something better than a bedsit. If there is no localconnection criteria, any of the 1500 applicants on the Cambridgeshire HousingRegister, or applicants on the sub-regional register with an East Cambs connectioncan apply for homes but it is not the most popular area, it does not attract incomersso easily
Highfields - currently 78 affordable units, (of approx 200 completions). Currentlystalled due to recession, kick start funding needed and applied for.
Parsons Lane - 33 rented units (all now let) plus 14 shared ownership currentlybeing offered, up to 18 HomeBuy Direct Shared Equity and approx 150 private.Persimmons are selling the market homes, but slowly in the current recession.Have also provided accommodation for adults with learning disabilities.
Wisbech Road redevelopment –12 x 1 bed and 8 x 2bed units – all rentedSanctuary Hereward. Shared ownership opportunities limited while the mortgagemarket is so difficult
Mow Fen Drove – rural exception site of around 13 units initially but ownersintentions unclear
Ten Mile Bank – rural exception site with consent for 8, but currently stalledbecause it was turned down for grant.
Site rear of Padnal caravan park – potential exception site but depends on Countyhighways who have concerns about the junction of Padnal and Victoria Street
Station Yard site – has outline consent and a S106 requiring 30% affordableprovision (6 units?)
Key Players – Sanctuary Housing, Circle Anglia, Axiom,
Townlands Charity have some 26 properties, targeted at over 50’s, potential toextend?
Beech Court – sheltered housing scheme off Wisbech Road, requires an upgrade.
Caravan Park – privately owned, retirement homes only.
General Issues – Barriers to location in Littleport, access to educational facilities isdifficult, and reputation for local drugs issues.
Littleport is a place with limited turnover, local people do not tend to want to moveaway, and relatively few people from other communities want to move in. As aresult there are 2 or even 3 generations of the same family with tenancies on thesame estate.
Meeting with ECDC Sports and Leisure Principal Officer – 15th December 2009

Agenda Item 6 – page 41
There is a shortage of play areas in Littleport and across the district generally andthere are issues around the quality of existing ones.
Play area near medical centre has been updated recently but area could be betterused for leisure e.g. a perimeter path to allow people to walk around it.
A large central feature in addition to the town play area is needed in Littleport.ECDC has secured funding for an ADI Zone to be installed in Littleport (linked toOlympics). Parish Council to decide location – possibly opposite new primaryschool?
Any play/sports space to be provided at Highfields?
Littleport is fortunate to have a large leisure centre, but it still has potential toconvert some underused facilities to offer local people additional activities e.g.could convert some of unused squash courts into dance studio and hold exerciseclasses in the space (these are very popular in Ely). Could also use space toincrease gym suite.
Lots of clubs operate out of Littleport Leisure Centre (Ely Netball club use courts)football and cricket teams have junior sections.
Potential impact of the new district leisure facility proposed at Downham Rd in Elyon facilities at Littleport Leisure needs to be investigated.
Any deficits - golf/driving range
CCCYPS area partnership are focusing on Littleport. East Cambs HealthPartnership also focussing on Littleport and will be appointing a health advisor forthe town. They are also conducting research into social marketing in Littleport, dueto commence Jan 2010.
Meeting with Sustrans - 8th December 2009
Noted Core Strategy has sustainability emphasis – cycling provision meets thisrequirement plus meets the health agenda.
‘Cycle friendly communities’
Essential to have links between new development and key destinations eg schools,station, employment sites, medical centre, library.
Need to consider how Ely and Littleport work together
Suggestion – close the old A10 route between Ely and Littleport to normal trafficand use this as bus, emergency and cycle way only. Would enable easy accessbetween new housing areas in North of Ely, Littleport and any school location ineither community.
Essential to ensure cycle route to major employment sites.

Agenda Item 6 – page 42
Leisure route – explore potential to link Littleport into the National Cycle Route fromCambridge to Kings Lynn. Currently runs via Little Downham/Welney/Denver toKings Lynn but, if land ownerships could be sorted, could run through Littleport.
Need for cycle parking facilities at all key destinations.
Dense housing is more sustainable
Make it easier to walk/cycle rather than drive
Sustrans have funding available for grant scheme – Links to Schools – matchfunding basis.
The Wildlife Trust – Phone call 2nd December 2009
Has not had much involvement with Littleport – but gave a talk to Littleport Societyin the last year.
Not a significant amount of green infrastructure in the town - appears to be limited interms of provision of public footpaths, areas in which to walk or cycle.
Does not see a need for a ‘Country Park’ type facility.
However opportunities to increase informal green space and wildlife areas shouldbe encouraged. Need to look beyond formal open space provision with formalplays areas, urban parks etc but likely to be small scale.
Could not see that any development at Littleport would have an impact on Welneyor Bedford Levels.