120123market barriers to solar in michigan...
TRANSCRIPT
1
White Paper: Market Barriers to Solar in Michigan Authors: Emily Miller, Erin Nobler, Christopher Wolf, and Elizabeth Doris
FINAL DRAFT 1/23/12
Contents Acknowledgments ................................................................................................................................................................ 2
List of Acronyms .................................................................................................................................................................... 2
I. Executive Summary .................................................................................................................................................... 3
II. Introduction ................................................................................................................................................................... 4
III. Renewable Energy in Michigan ........................................................................................................................ 5
Michigan’s Renewable Energy Policy and Program Environment ............................................................. 7
IV. Methodology ............................................................................................................................................................. 9
V. Permitting ....................................................................................................................................................................... 9
A. Efforts in other states: case studies & analysis ....................................................................................... 10
B. Potential Policy Impact in Michigan ............................................................................................................ 15
VI. Tax Treatment ...................................................................................................................................................... 17
A. Michigan Property Tax Background ............................................................................................................ 17
B. Legislative History .............................................................................................................................................. 21
C. Potential Policy Impact in Michigan ............................................................................................................ 21
VII. Conclusion .............................................................................................................................................................. 24
References ............................................................................................................................................................................. 25
2
Acknowledgments This work is produced with support from the US Department of Energy Solar Market Transformation Team, through the Public Utility Commission Technical Assistance Project managed in coordination with the National Renewable Energy Laboratory. The authors are grateful to the assistance of Jason Coughlin of the National Renewable Energy Laboratory in providing valuable guidance and feedback on the report. We also wish to thank John Miller of SRA International, supporting the Department of Energy Solar Market Transformation Team, for his review of this report. Any errors or omissions are the fault of the authors.
List of Acronyms BAU—Business as Usual
BoS—Balance of System
COSEIA—Colorado Solar Energy Industry Association
EPA—Environmental Protection Agency
MPSC—Michigan Public Service Commission
PV – Photovoltaics
REC—Renewable Energy Credit/Certificate
RPS—Renewable Portfolio Standard
3
I. Executive Summary The solar industry in the United States is at a turning point; the cost of PV hardware has declined substantially in recent years, placing new attention on reducing the balance of system (BoS) costs of solar that now contribute to a growing percentage of installation expenses. BoS refers to all the costs associated with a PV system except for the module, such as permitting, interconnection, and incentives, among other things. How states address these costs through the creation of a favorable policy and regulatory environment is proving to be a critical determinant of a thriving statewide solar market.
The Michigan Public Service Commission identified two potential issues limiting the number of solar installations in the state: inconsistent permitting processes by jurisdiction and varying interpretations of the tax code for solar systems. This report evaluates the effect current Michigan policies have on permitting and tax treatment of commercial and residential PV installations. It then analyzes successful policy implementation in other states and hypothesizes how those policies, if implemented in Michigan, would affect the solar market in the state.
The lack of a streamlined permitting process for similar systems across regional or statewide groups can be burdensome to installers, system owners, and the jurisdictions that process the permit applications. This limits market expansion for PV systems as BoS costs make up a larger share of the total cost of PV. As evidenced by efforts in Colorado, Vermont, and California, permitting reform is a low-‐cost, low-‐risk solution to a market barrier that has the potential to provide Michigan an opportunity to lead the solar industry as BoS factors become an increasingly important driver of solar market growth. Permitting reform is typically taken on by the state legislature or state agencies. Doing so has the potential to expand the Michigan solar market an additional 5 to 13 % beyond BAU market projections, inducing economic growth at a low cost to the initiating agency.
Property tax incentives reduce the overall cost of PV to property owners by keeping the assessed value of a home or business at the level it was prior to PV installation. In Michigan, residential system owners are not offered a tax exemption for PV systems. In the commercial and industrial sectors, an exemption is available but not currently functioning properly due to an interpretation difference between the legislative and implementing bodies. This can be addressed by rewording the real or personal property elements of the statute, as is done in other states. Adding residential systems to the exemption will lend further support to the solar market and enhance deployment of PV systems. This addition has not been shown to be burdensome in other states and has contributed to the growth of solar markets. Collaboration between the state legislature and Treasury would ensure
4
consistency. The Michigan Assessors Association could address the county assessors to ensure proper understanding of the policy and implementation.
Taking steps to address permitting and tax issues through collaboration may stimulate solar market growth in Michigan. Process consistency and predictable policies enable business to operate efficiently. By making PV installations easier to complete through reduced BoS costs, Michigan becomes a more attractive location for manufacturers and installers. As PV module costs decline and BoS costs make up a greater share of the cost of solar, action today on these issues will prove beneficial in the long-‐term, providing Michigan an opportunity to establish a leadership position in the solar industry.
II. Introduction Solar resources account for a growing share of the electricity portfolio in the United States. This growth is observed in both utility-‐scale installations and in small-‐scale, distributed systems at residences and in commercial operations. This market expansion is fueled by a decrease in the total installed cost of solar power systems over time, as well as federal, state and local policies. However, financial and bureaucratic impediments remain as barriers to implementation.
In Michigan, the state’s Public Service Commission (MPSC) identified two potential issues limiting the number of installations in the state. First, differing permitting processes across jurisdictions, including requirements and permit fees, have led to uncertainty for system owners and installers. These inconsistent and potentially complex requirements can cause installation delays, inefficiencies, and additional costs for system owners, installers, developers and permitting authorities. Second, lack of clarification in interpretations of the Michigan tax treatment of renewable energy systems, in combination with utility production-‐based incentives, are resulting in investor uncertainty.
This report evaluates the challenges associated with permitting and tax treatment of residential and small-‐scale commercial solar photovoltaics (PV) in Michigan and identifies potential policy changes that could reduce the barrier of uncertainty caused by the challenges. Strategies employed by other states and cities are examined to estimate potential impacts of market barrier reduction strategies in Michigan.
Case studies provide the comparative policy analysis framework to assess if the strategies used lead to market expansion or contraction. The examples from other states suggest that permitting reform can stimulate market growth. Options for reducing the barriers include capping the allowable permit fees, improving the transparency of the process by providing information online or through trainings, and standardizing the criteria for permits for small systems that exhibit similar characteristics. For tax treatment, state examples demonstrate
5
that how a solar system is categorized—whether real or personal property—must be consistent between state tax authorities and any legislated tax incentives so as to remove confusion and uncertainty for system owners or tax equity partners.
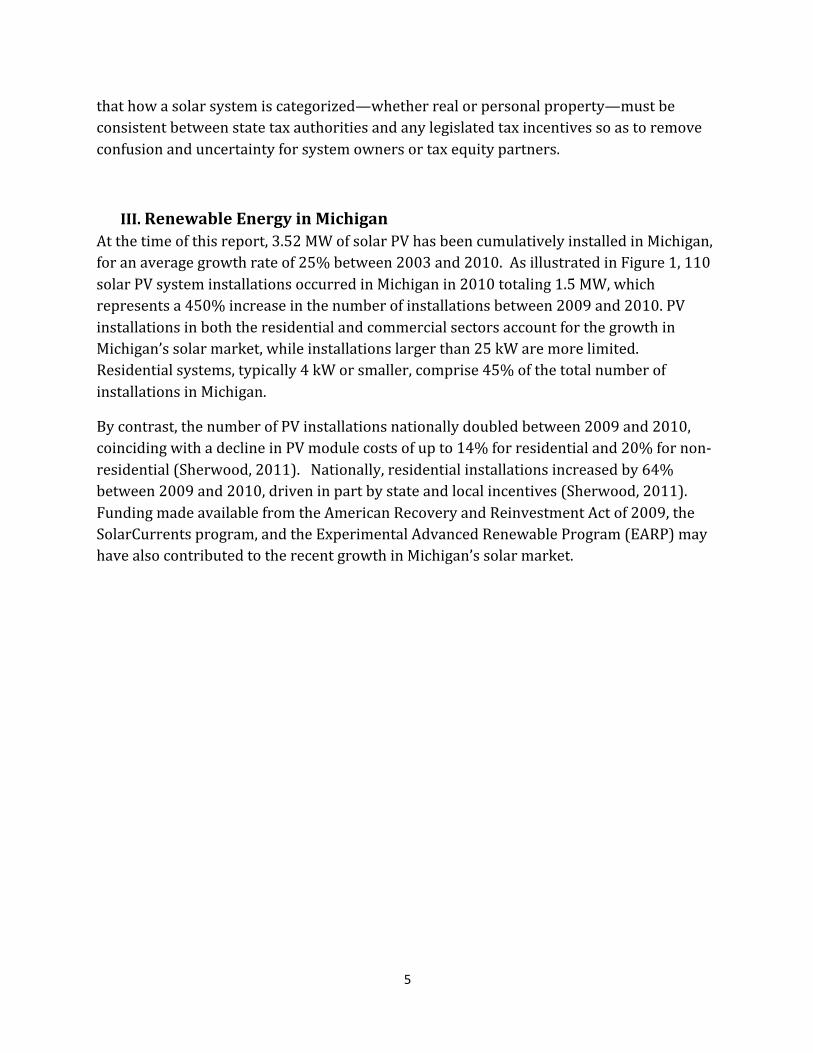
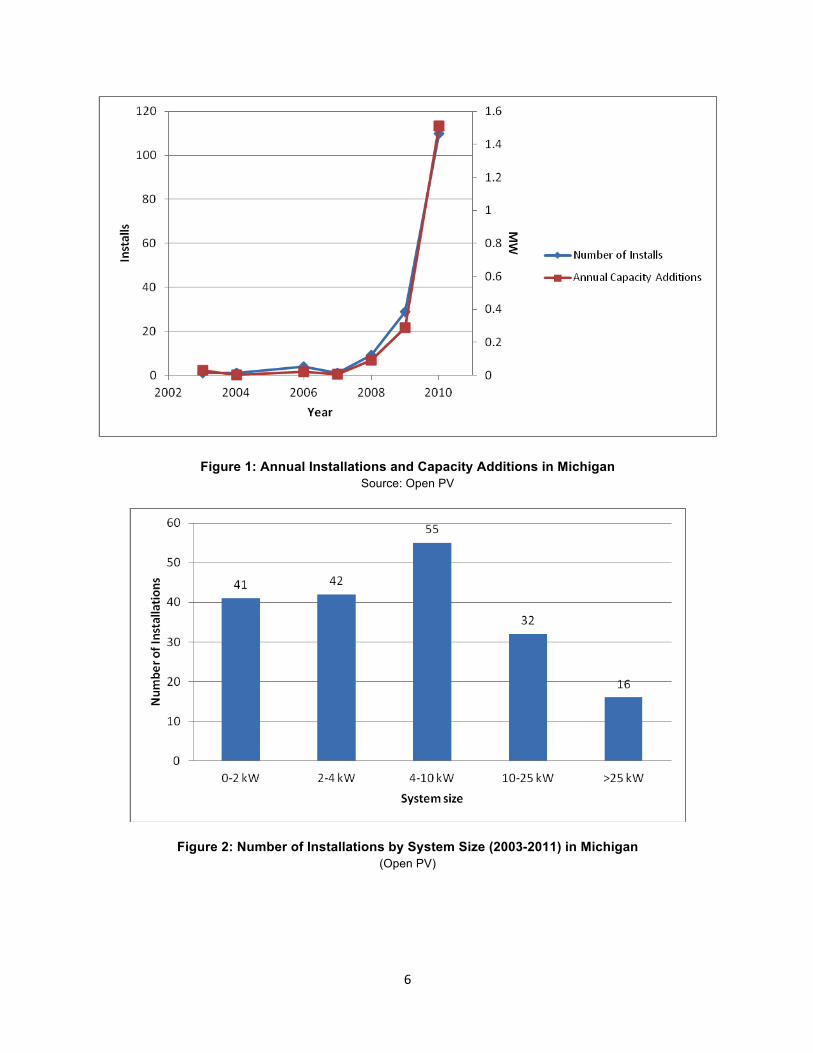
III. Renewable Energy in Michigan At the time of this report, 3.52 MW of solar PV has been cumulatively installed in Michigan, for an average growth rate of 25% between 2003 and 2010. As illustrated in Figure 1, 110 solar PV system installations occurred in Michigan in 2010 totaling 1.5 MW, which represents a 450% increase in the number of installations between 2009 and 2010. PV installations in both the residential and commercial sectors account for the growth in Michigan’s solar market, while installations larger than 25 kW are more limited. Residential systems, typically 4 kW or smaller, comprise 45% of the total number of installations in Michigan.
By contrast, the number of PV installations nationally doubled between 2009 and 2010, coinciding with a decline in PV module costs of up to 14% for residential and 20% for non-‐residential (Sherwood, 2011). Nationally, residential installations increased by 64% between 2009 and 2010, driven in part by state and local incentives (Sherwood, 2011). Funding made available from the American Recovery and Reinvestment Act of 2009, the SolarCurrents program, and the Experimental Advanced Renewable Program (EARP) may have also contributed to the recent growth in Michigan’s solar market.
6
Figure 1: Annual Installations and Capacity Additions in Michigan Source: Open PV
Figure 2: Number of Installations by System Size (2003-2011) in Michigan (Open PV)
7
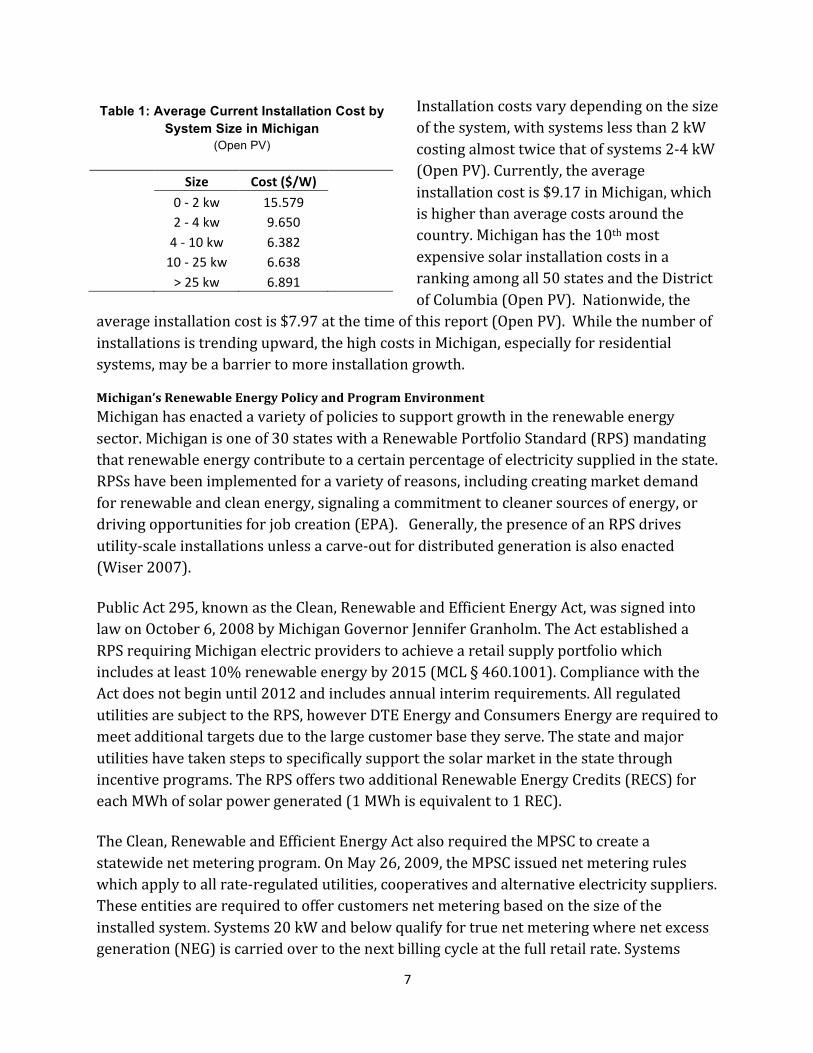
Table 1: Average Current Installation Cost by System Size in Michigan
(Open PV)
Size Cost ($/W)
0 -‐ 2 kw 15.579
2 -‐ 4 kw 9.650
4 -‐ 10 kw 6.382
10 -‐ 25 kw 6.638 > 25 kw 6.891
Installation costs vary depending on the size of the system, with systems less than 2 kW costing almost twice that of systems 2-‐4 kW (Open PV). Currently, the average installation cost is $9.17 in Michigan, which is higher than average costs around the country. Michigan has the 10th most expensive solar installation costs in a ranking among all 50 states and the District of Columbia (Open PV). Nationwide, the
average installation cost is $7.97 at the time of this report (Open PV). While the number of installations is trending upward, the high costs in Michigan, especially for residential systems, may be a barrier to more installation growth.
Michigan’s Renewable Energy Policy and Program Environment Michigan has enacted a variety of policies to support growth in the renewable energy sector. Michigan is one of 30 states with a Renewable Portfolio Standard (RPS) mandating that renewable energy contribute to a certain percentage of electricity supplied in the state. RPSs have been implemented for a variety of reasons, including creating market demand for renewable and clean energy, signaling a commitment to cleaner sources of energy, or driving opportunities for job creation (EPA). Generally, the presence of an RPS drives utility-‐scale installations unless a carve-‐out for distributed generation is also enacted (Wiser 2007).
Public Act 295, known as the Clean, Renewable and Efficient Energy Act, was signed into law on October 6, 2008 by Michigan Governor Jennifer Granholm. The Act established a RPS requiring Michigan electric providers to achieve a retail supply portfolio which includes at least 10% renewable energy by 2015 (MCL § 460.1001). Compliance with the Act does not begin until 2012 and includes annual interim requirements. All regulated utilities are subject to the RPS, however DTE Energy and Consumers Energy are required to meet additional targets due to the large customer base they serve. The state and major utilities have taken steps to specifically support the solar market in the state through incentive programs. The RPS offers two additional Renewable Energy Credits (RECS) for each MWh of solar power generated (1 MWh is equivalent to 1 REC).
The Clean, Renewable and Efficient Energy Act also required the MPSC to create a statewide net metering program. On May 26, 2009, the MPSC issued net metering rules which apply to all rate-‐regulated utilities, cooperatives and alternative electricity suppliers. These entities are required to offer customers net metering based on the size of the installed system. Systems 20 kW and below qualify for true net metering where net excess generation (NEG) is carried over to the next billing cycle at the full retail rate. Systems
8
above 20 kW up to and including 150 kW qualify for modified net metering. Under modified net metering, the customer only receives the generation portion of the full retail rate for any net excess generation they produced on-‐site.
The Michigan net metering program is considered a success, receiving a grade of “A” (Freeing the Grid, 2011). In mid 2009 the program had 137 participants and then jumped to 254 participants by the end of December that same year (MPSCb). Participation continued to grow and as of December 2010 the program had over 620 participants (MPSCc). As evidenced by Michigan’s experience and the 14 other states that received an “A” grade, net metering policies enable customer-‐sited distributed generation and thus residential market expansion (Freeing the Grid, 2011).
The RPS created certainty in the renewable energy market and prompted the utilities to offer incentives for solar power installation and production because production incentives result in the generation of renewable energy credits (REC) that are eligible for RPS compliance. DTE Energy, Michigan’s largest investor-‐owned utility, launched the SolarCurrents Program in 2009 which offered a one-‐time $2.40 per WDC installed rebate for solar power systems between 1kW and 20 kW. Additionally, SolarCurrents features a production incentive offering $0.11 per kWh for the duration of a 20-‐year contract. This production incentive is in exchange for RECs produced by the system. DTE Energy offered a retroactive rebate at discounted rates for systems installed from 2005 onward. The program was overwhelmingly popular, and as of May 5, 2011, DTE Energy discontinued the program stating they had reached their goal of 5 MW.
Consumers Energy began the Experimental Advanced Renewable Energy Program (EARP) August 27, 2009. This program is purely performance-‐based and is available for residential systems between 1 kW and 20kW and for non-‐residential systems between 1 kW and 150 kW. The first two phases of the program contracted approximately 2000 kW of solar power capacity. The extension of this project is limited to 3,000 kW; 1,500 kW designated for residential systems and the remaining 1,500 kW for non-‐residential systems. Participants in the program receive between $0.200 per kWh and $0.259 per kWh depending on on the interest in the prior round of the program and whether or not the installation will use both Michigan labor and Michigan materials as defined in the Commission's temporary order in Case No. U-‐15800 (MPSCd).. Contracts are for 15 years.
The expansion of the solar market in Michigan coincided with the advent of statewide policies to encourage installations. The implementation of the RPS, net metering, and utility incentive programs appears to have enabled solar market growth in Michigan, yet case studies will demonstrate that more levers are available to Michigan policymakers,
9
regulators, and industry representatives that have the potential to enable Michigan’s solar market leadership.
IV. Methodology This report uses comparative policy analysis techniques to estimate the impact that potential solar policies have on a given solar market in Michigan. The current conditions in Michigan, as presented in the previous section, provide a comprehensive picture of the state’s solar market and its future potential. From this baseline level, policy alternatives are applied to Michigan’s baseline case to estimate potential market impacts.
Case studies from other states and cities are used to gather qualitative and quantitative information about the market changes experienced in those locations as a result of policy changes. Because no two policy environments are identical, policies are applied in consideration of the variety of unique factors that may also affect market adoption such as state renewable portfolio standards, utility incentives, or state political and economic climate.
For the purposes of this report, the word “policy” as applied to the solar market is broadly defined. It may describe a minor change in local process or major statewide legislative action. In the case of statewide permitting reform, the two existing statewide laws in Colorado and Vermont were enacted only in the last few months, so measurable data about market impact is not yet available.
V. Permitting Permits ensure that safety and engineering standards for PV systems are met. Most local jurisdictions require building, electrical, and other permits before installation. These necessary processes have the potential to create market barriers for the development of renewable energy. Transparent permitting processes and fees can reduce potential information barriers to solar development. In Michigan, installers assert that the process by which permits are obtained can be time-‐consuming and unclear. By some accounts, the time and money required to understand permitting requirements and process applications comprises half of the time and cost of an installation (Bacon, B., 2011). Because this process differs by jurisdiction, it can present an obstacle to installations and a deterrent to prospective system owners. Some communities in Michigan do not have an established protocol or requirements for solar, which requires installers to spend time coordinating and negotiating with local officials to determine exact project requirements.
10
Many aspects of the permitting process are designed to ensure public safety, but some aspects are extraneous given current market and technology conditions. The lack of a streamlined process for similar systems across regional or statewide groups can be burdensome not only to installers and system owners, but also to the jurisdictions that process the permit applications. This may present a limitation in expanding the market for distributed renewable energy systems as balance of system costs make up a larger share of the cost of PV (Bony et al, 2010; AECOM, 2011). The solar industry has grown organically, and local jurisdictions have had to adapt their planning and inspection system to an evolving technology. In some cases, staff lack experience with renewable energy systems and associated system safety, which can lead to a lengthy review process (Pitt, 2008). While construction contracting requirements are set at the state level, the codes and standards for PV are such that there is the potential to adopt state or even national safety standards that would not conflict with the variability in state contracting requirements (DOE). In addition to the cost associated with labor such as researching permitting rules and filling our permit applications, the fees for permits vary between jurisdictions and can often be a significant cost for a small installation. This may be reflected in the high cost for installations up to 2 kW in Michigan, which is nearly twice the cost of slightly larger systems (Table 1). Solar permit fees are determined by the permitting agency or local jurisdiction. Commonly, fees are established through 1) a flat-‐fee method, which charges the same fee regardless of size; 2) a valuation method, which is based on the cost of the solar system; or 3) a combination of the two (DOE). In its January 2011 analysis of the cost of permitting, SunRun calculated that, on average nationally, the entire permitting process accounts for $2,516 per residential installation, or $0.50 per watt (2011). The types of costs factored into this assessment were extensive: the labor cost of completing permit application and submitting it in person, paying permit fee, labor associated with understanding different building requirements between jurisdictions, field inspections and labor time waiting for inspectors, sales and marketing costs associated with reduced customer referrals and cancellations due to delays (SunRun, 2011).
A. Efforts in other states: case studies & analysis Several cities and states have taken action to streamline the solar permitting process by using a variety of cost control, process and transparency-‐promoting mechanisms. Two major strategies are employed: limiting the costs of permits and streamlining the process of permitting through template forms, quicker processing times, or online submission options. The following section reviews selected actions taken by states and cities around the country.
11
1. State initiatives: Colorado and Vermont In 2011, Vermont and Colorado took legislative action to simplify the permit process and limit solar permit and related fees. The two states took different approaches to addressing this market barrier. Colorado opted for a legislative solution to extend a price cap on solar permitting and revise the law to increase its enforceability. Vermont’s approach is also legislative, but focuses less on fee caps and more on increasing process transparency with the purpose of reducing installer uncertainty in development. Because of the recent nature of this act, it is not possible to draw direct conclusions from installation data, but it is illustrative of a legislative option. The Colorado legislature passed Senate Bill 117 in 2008 to limit permit fees on solar PV installations, establishing different fee caps for residential and non-‐residential. At the time, disparities in permit fees were observed across the state, and installers expressed concern at the cost disparity limiting the potential and credibility of this burgeoning industry (Brown, 2008). However, the Colorado Solar Energy Industries Association (COSEIA) observed through its business members that despite the passage of the bill, rising permit fees were becoming a major impediment for consumers and businesses (Bacon, B., 2011). COSEIA pointed to analysis that one out of four Colorado cities and counties charged permit fees in excess of the cap dictated by SB08-‐117. Loopholes were exploited to exceed the cap for residential solar by as much as $1,500 in some jurisdictions, making it difficult to ascertain any reliable market impact from the policy after 2008. Greentech Media reported that permit fees in the state had doubled in 2010 (Wesoff, 2011 b). While the hard costs associated with solar PV had decreased in the state, permit fees were on the rise in many communities. Furthermore, non-‐residential, small-‐scale installations were facing large permit fees. For example, a project to outfit 31 Douglas County schools was stalled because of an unexpected assessment of $400,000 in permit fees (Bacon, B., 2011). Additionally, regulatory paperwork and uncertain local government processes were adding expense to the soft costs (i.e. administrative, permitting, inspection) of a solar transaction. In promoting the passage of new legislation that would renew the permit fee cap with enforcement, COSEIA pointed to the anecdotal evidence that communities with lower permit fees tend to have more solar job creation and that rising fees would make Colorado less business-‐friendly. What became known as the Fair Permit Act passed in May 2011 with overwhelming support (House 64-‐1; Senate 32-‐2) just as the previous permit fee limitation act (SB08-‐117) was to end (COSEIA). The Fair Permit Act extended for seven years the $500 residential cap and $1,000 non-‐residential cap on permit, plan review, and other fees
12
associated with installations. In order to close the loopholes of the previous act, process transparency is created such that local governments are required to clearly identify all fees and taxes assessed. For systems greater than 2 MW, local governments cannot charge more than the actual costs incurred for processing a permit (ASES, 2011). Vermont took a different approach to permitting in the Vermont Energy Act of 2011. Instead of focusing on costs, Vermont instituted a permitting process designed to indirectly reduce the BoS costs for solar installations less than 5 kW in an effort to spur residential installations. Small-‐scale solar customers now file a registration document and certificate of compliance with grid connection requirements. The local utility then has 10 days to raise any issues related to interconnection. Many have applauded Vermont’s effort as a micro-‐policy approach that will achieve the kind of uniformity and consistency needed to enable solar market growth (Wesoff, 2011). Because the legislative actions in Vermont and Colorado occurred just months before the writing of this report, data are not yet available to measure market impact of these leading state laws or if one approach is more effective than another. Colorado’s approach is more direct, impacting permitting jurisdictions with specific transparency requirements for fees and taxes and limiting the uncertainty experienced by installers and potential system owners. The Colorado law also affects a much larger group of solar stakeholders because it established limitations for installations both large and small. Vermont’s approach is specifically targeted to expedite the process for small systems (5 kW or less), thus not addressing any challenges experienced by all other installation sizes. The approach is also an indirect one, putting the onus on the utility involved in interconnection to raise objection or else allow the installation to proceed. The appropriate approach or combination of tactics may ultimately depend on the unique policy context of a region or state, unless forthcoming installation data in Colorado and Vermont support one approach over another. The only substantial statewide estimates of permitting reform are derived from an analysis by AECOM, a technical and management support services firm, on the potential effect of streamlined permitting in California. The scenario evaluated in AECOM’s California analysis represents a more dramatic policy approach than those enacted in Colorado or Vermont. It assumes adoption of the expedited permitting process proposed by the Solar America Board for Codes and Standards (Solar ABCs)1 and automation of aspects of the 1 The Solar ABCs provide a framework for streamlining the permit process. The Solar ABCs’ Expedited Permit Process outlines a method for local jurisdictions to confidently and efficiently approve building permits for small PV systems of less than 15 kW, simplifying the application requirements for the installer and saving time for the jurisdiction reviewing the permit (Brooks, 2009). Applying the expedited process to small projects mitigates the inability of small-‐scale installations to absorb permitting costs, and acknowledges the
13
permitting process such as electronic permit submittal (AECOM, 2011). In this scenario, if California adopted a streamlined permitting process statewide, an additional 132,000 systems—or a 13 percent increase—relative to market projections could occur (2011). The data gleaned from this analysis provide insight into the potential market and economic effects elsewhere and will be discussed later in the report.
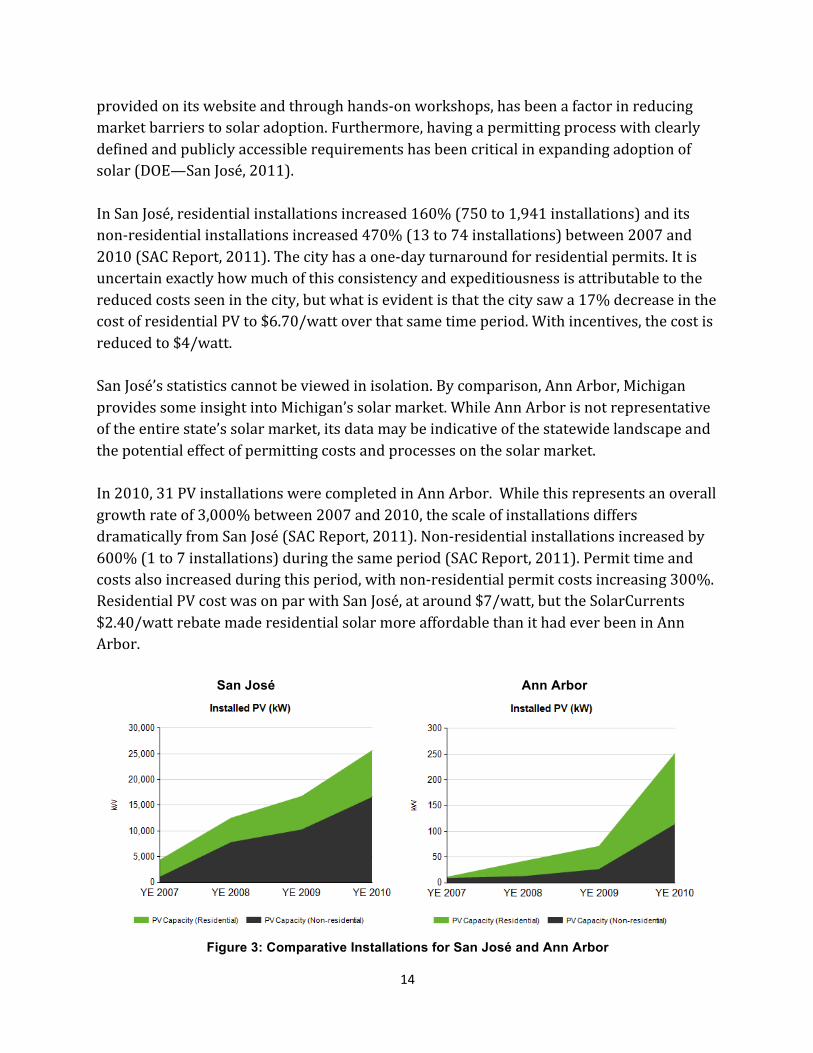
2. San José, California & Ann Arbor, Michigan At the municipal level, San José, California is one of several cities that have taken action to address the permitting process. Some credit the city with expanding the community solar market through system changes and stakeholder engagement. Currently, San José is considered one of the least expensive cities for solar installations in California (SunRun, 2011). In 2008 and 2009, San José teamed with SolarTech, a solar industry consortium, to hold Renewable Energy Permitting Symposia that convened leaders in the solar industry and permitting and safety disciplines (building, code, fire) to discuss ways in which the permitting process could be improved (DOE-‐San José). The stakeholder-‐driven approach resulted in a new process for the jurisdiction, described below. A major finding in San José has been that providing more information about the permitting process up front to applicants ensures the permitting and inspection process is more efficient. The city’s Building Department took the initiative to reduce permit costs, provide over-‐the-‐counter permitting for smaller residential installations, and provide training for installers about the process. The city’s simple checklist for PV system electrical permits allows applicants to determine whether or not their system meets certain criteria so permits can be waived. Furthermore, the city schedules post-‐installation inspection during a 2-‐hour window. Conversely, in many jurisdictions, contractors are expected to wait for up to eight hours for an inspector to arrive, costing an average of $121 per installation (SunRun, 2011). This increases costs to the installer which is typically passed on to the customer in the form of higher prices. A standardized permitting template has the potential to guide local governing bodies to a more uniform solar ordinance and inspection standard process to reduce the time and expense of solar installations. The city observed that its transparency of information, similarities in engineering of the smaller systems (Brooks, 2009). The complexity of larger projects warrants a less standardized, more flexible review process. According to SunRun’s stakeholder analysis group, there is wide support for the Solar ABCs standards because it is in both the installer’s and the jurisdiction’s best interests (2011).
14
provided on its website and through hands-‐on workshops, has been a factor in reducing market barriers to solar adoption. Furthermore, having a permitting process with clearly defined and publicly accessible requirements has been critical in expanding adoption of solar (DOE—San José, 2011). In San José, residential installations increased 160% (750 to 1,941 installations) and its non-‐residential installations increased 470% (13 to 74 installations) between 2007 and 2010 (SAC Report, 2011). The city has a one-‐day turnaround for residential permits. It is uncertain exactly how much of this consistency and expeditiousness is attributable to the reduced costs seen in the city, but what is evident is that the city saw a 17% decrease in the cost of residential PV to $6.70/watt over that same time period. With incentives, the cost is reduced to $4/watt. San José’s statistics cannot be viewed in isolation. By comparison, Ann Arbor, Michigan provides some insight into Michigan’s solar market. While Ann Arbor is not representative of the entire state’s solar market, its data may be indicative of the statewide landscape and the potential effect of permitting costs and processes on the solar market. In 2010, 31 PV installations were completed in Ann Arbor. While this represents an overall growth rate of 3,000% between 2007 and 2010, the scale of installations differs dramatically from San José (SAC Report, 2011). Non-‐residential installations increased by 600% (1 to 7 installations) during the same period (SAC Report, 2011). Permit time and costs also increased during this period, with non-‐residential permit costs increasing 300%. Residential PV cost was on par with San José, at around $7/watt, but the SolarCurrents $2.40/watt rebate made residential solar more affordable than it had ever been in Ann Arbor. San José Ann Arbor
Figure 3: Comparative Installations for San José and Ann Arbor
15
Source: SAC Report, 2011
The large jump in installations is attributable to the DTE SolarCurrents program, which contributed to 29 of the 31 installations completed in 2010. The success of SolarCurrents may have balanced the impact of the increase in permit costs and time, and demonstrates a connection between cost reduction and market expansion. Out of the total installations in 2010 in Ann Arbor, 94% are attributed to SolarCurrents, suggesting that only 6% of the market would adopt solar at around $7/watt in Michigan.
B. Potential Policy Impact in Michigan The main strategies employed in the case studies are streamlining the process and limiting permit fees. In either case, transparency of information simplifies the process and indirectly reduces BoS costs and barriers to market growth. Reduced costs for solar installations have the most direct effect on solar market expansion, and cost reduction can be achieved through both streamlined processes and permit fee caps. The aggregation of these hardware and non-‐hardware costs adds, on average, $0.50/watt or $2,516 per residential install (SunRun, 2011). As hardware costs decline, the BoS costs will become increasingly more important for the adoption of solar. As evidenced by the case studies, permitting can be addressed fairly easily and with bipartisan support.
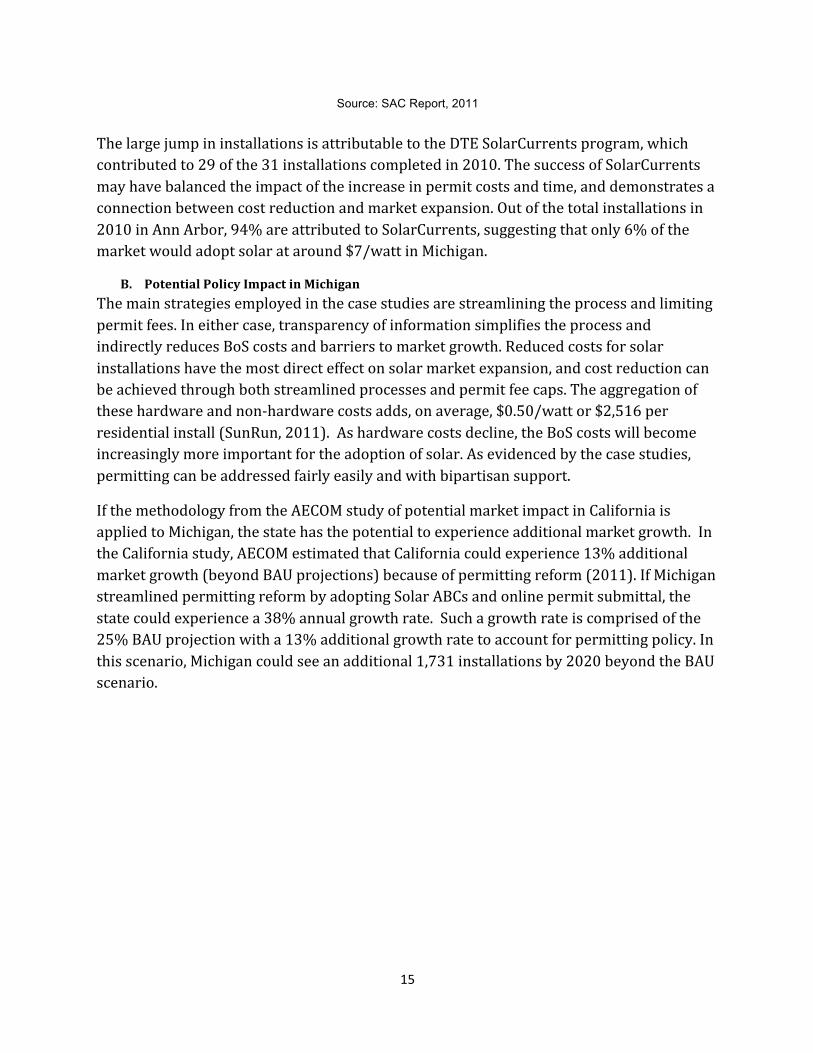
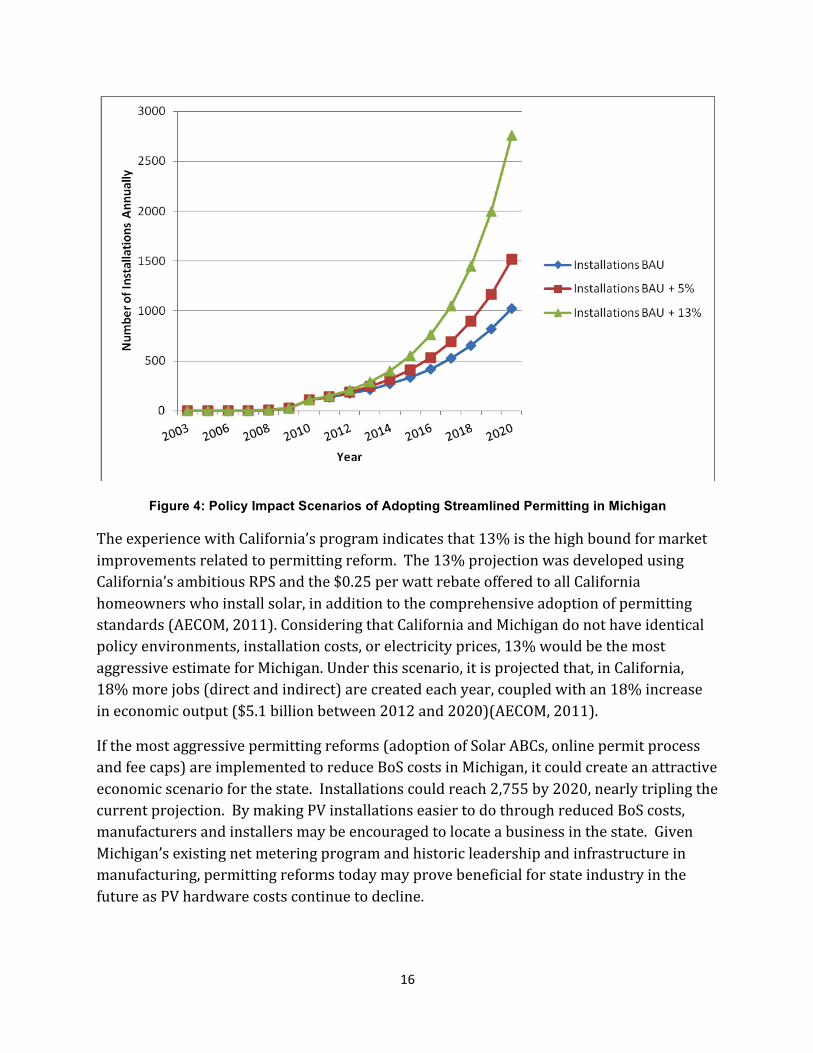
If the methodology from the AECOM study of potential market impact in California is applied to Michigan, the state has the potential to experience additional market growth. In the California study, AECOM estimated that California could experience 13% additional market growth (beyond BAU projections) because of permitting reform (2011). If Michigan streamlined permitting reform by adopting Solar ABCs and online permit submittal, the state could experience a 38% annual growth rate. Such a growth rate is comprised of the 25% BAU projection with a 13% additional growth rate to account for permitting policy. In this scenario, Michigan could see an additional 1,731 installations by 2020 beyond the BAU scenario.
16
Figure 4: Policy Impact Scenarios of Adopting Streamlined Permitting in Michigan
The experience with California’s program indicates that 13% is the high bound for market improvements related to permitting reform. The 13% projection was developed using California’s ambitious RPS and the $0.25 per watt rebate offered to all California homeowners who install solar, in addition to the comprehensive adoption of permitting standards (AECOM, 2011). Considering that California and Michigan do not have identical policy environments, installation costs, or electricity prices, 13% would be the most aggressive estimate for Michigan. Under this scenario, it is projected that, in California, 18% more jobs (direct and indirect) are created each year, coupled with an 18% increase in economic output ($5.1 billion between 2012 and 2020)(AECOM, 2011).
If the most aggressive permitting reforms (adoption of Solar ABCs, online permit process and fee caps) are implemented to reduce BoS costs in Michigan, it could create an attractive economic scenario for the state. Installations could reach 2,755 by 2020, nearly tripling the current projection. By making PV installations easier to do through reduced BoS costs, manufacturers and installers may be encouraged to locate a business in the state. Given Michigan’s existing net metering program and historic leadership and infrastructure in manufacturing, permitting reforms today may prove beneficial for state industry in the future as PV hardware costs continue to decline.
17
There is no usable data available on adoption of a partial permitting solution, so an arbitrary 5% lower bound is selected for this analysis. This low bound reflects that changes in streamlining the system or lowering fees will induce some market changes, but not as much as would a comprehensive solution. This scenario could result in 1,500 PV installations by 2020, or 492 additional installations above the BAU scenario.
Solar permitting is a collective action problem in that a change to the system benefits everyone, but no one is incentivized to initiate the change. Determining the initiating party is perhaps the most important step in streamlining the process. In San José, the local permitting authority engaged stakeholders to discuss the issues in the city. In Michigan’s case, the MPSC, state energy office, and legislature could collaborate to initiate the process of identifying best practices in permitting and providing the information to jurisdictions. Permitting reform is a low-‐cost, low-‐risk solution to a market barrier that has the potential to provide Michigan an opportunity to lead the solar industry as BoS factors become an increasingly important part of solar market growth.
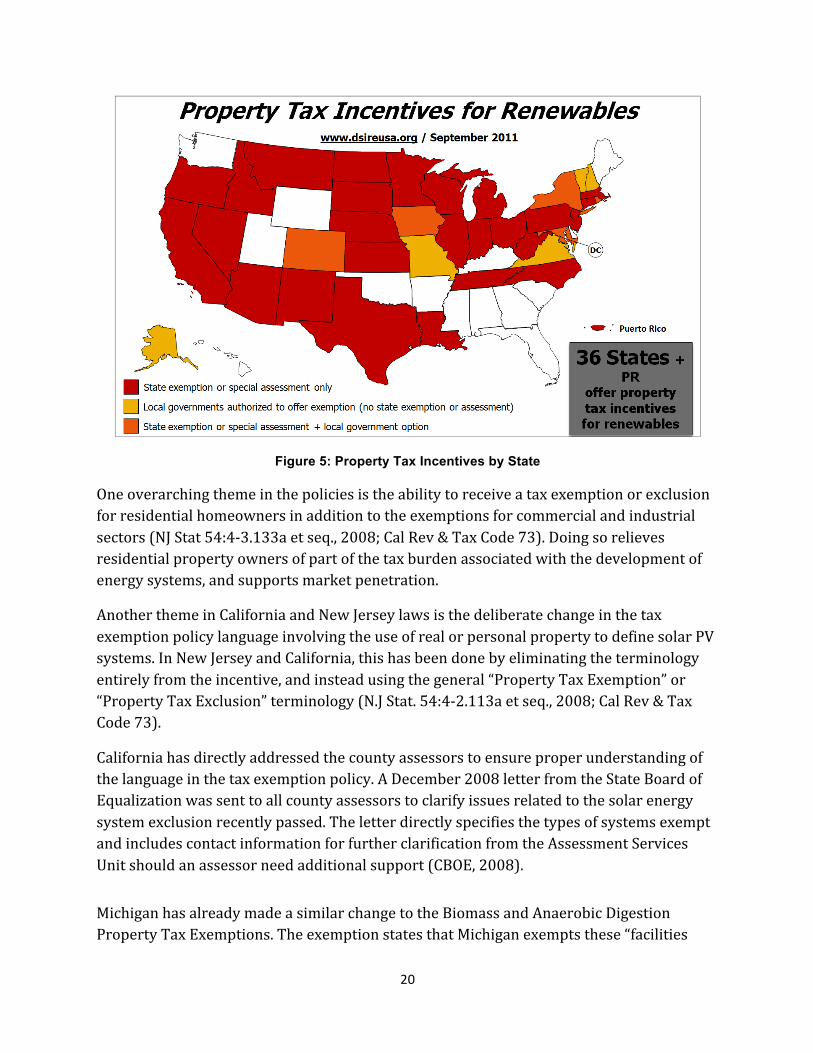
VI. Tax Treatment Tax policy has been used at the local, state and federal level as a tool to support solar installations (DSIRE, 2011). Property tax incentives eliminate the overall cost to property owners by ensuring that the renewable energy system has no impact on the assessed value. Currently, 36 states and Puerto Rico offer some form of property tax incentives for renewable energy systems (DSIRE, 2011). In Michigan, the tax exemption is limited to commercial and industrial sectors and isn't currently functioning due to an interpretation difference between the legislative and implementing bodies. That problem can be solved by changing the wording regarding the real or personal property in the statute, as other states have done. Adding residential systems to the exemption could lend further support to the solar market and enhance deployment of PV systems. This addition has not been shown to be particularly burdensome in other states and has contributed to the growth of those markets.
A. Michigan Property Tax Background In 2002, Michigan began implementing an Alternative Energy Personal Property Tax Exemption (AEPPTE) classifying installed PV systems in the commercial and industrial sectors as exempt from statewide personal property taxes (M.C.L § 211.9). In accordance with the Michigan Tax System, personal property is defined as “a broad array of assets, including most equipment, furniture, and fixtures used by business. In addition, electric transmission and distribution equipment, gas transmission and distribution equipment, and oil and pipelines are all considered personal property” (M.C.L § 211.1).

18
In 2008, the Michigan State Tax Commission concluded that PV systems are to be considered real property and “should be assessed as an improvement to the real property on which they are located” (Michigan Department of Treasury, 2008). The exception to this rule is PV systems located on property owned by someone other than the owner of the solar system. For this situation, “the solar array should be assessed on the personal property roll” (Michigan Department of Treasury, 2008).
In a ruling in line with the Michigan State Tax Commission, the Michigan Department of Treasury determined that PV systems assessed as personal property will not be exempt because they do not meet the definitional requisites of the exemption (Michigan Department of Treasury, 2008). This decision limits the ability of Michigan taxpayers to utilize this benefit intended for solar installations and effectively nullifies the exemption and the legislative intent.
Semantic problems result in the inconsistency in tax exemptions granted which may be responsible for the inability of some commercial and industrial PV system owners to receive a tax exemption. A system assessed as real property could be denied an exemption because the policy states that only systems defined as personal property will be exempt. Similarly, a system could be denied exemption because it was assessed as personal property and not recognized by the Department of Treasury based on their definition of a system being considered real property. The inconsistent assessment of PV systems as real or personal property creates a discrepancy that confuses both assessors and system owners alike.
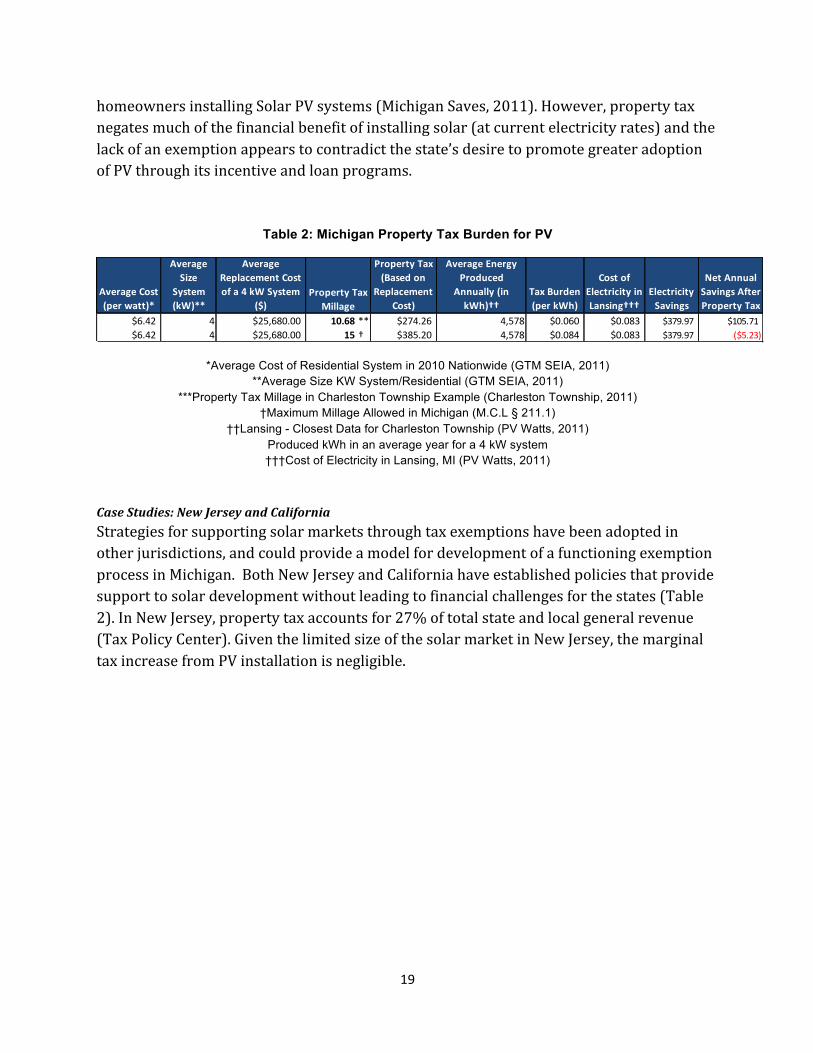
As of October 2011, Michigan does not have a tax exemption policy in place for residential PV system owners. Currently, residential homeowners with PV systems installed on their properties are receiving a property tax assessment that includes the replacement costs of the system (Nobler, E., 2011). For example, a 4 kW residential system at the average cost per watt nationally would cost the system owner $25,680 (Table 2). Millage rates are used to evaluate property taxes and are based on an amount per $1000. Based on a 10.68 mill example from Charleston Township, this system would create an additional $274.26 property tax burden, which translates into $0.06 per kWh. Using the maximum 15 mill rate allowed by Michigan Tax law, the burden would increase to $0.084 (Table 2). Lansing has a current cost per kWh for energy of $0.083 (PV Watts, 2011). The taxes associated with an average size system in Lansing using the 15 mill rate would essentially double the cost per kWh to a homeowner installing a solar PV system. This tax burden may create a significant disincentive for homeowners to implement PV systems on their homes.
Michigan is actively promoting solar installations on residential properties through the Michigan Saves incentive program, which provides home energy loans of up to $20,000 to
19
homeowners installing Solar PV systems (Michigan Saves, 2011). However, property tax negates much of the financial benefit of installing solar (at current electricity rates) and the lack of an exemption appears to contradict the state’s desire to promote greater adoption of PV through its incentive and loan programs.
Table 2: Michigan Property Tax Burden for PV
Average Cost (per watt)*
Average Size
System (kW)**
Average Replacement Cost of a 4 kW System
($)
Property Tax (Based on
Replacement Cost)
Average Energy Produced
Annually (in kWh)††
Tax Burden (per kWh)
Cost of Electricity in Lansing†††
Electricity Savings
Net Annual Savings After Property Tax
$6.42 4 $25,680.00 10.68 *** $274.26 4,578 $0.060 $0.083 $379.97 $105.71$6.42 4 $25,680.00 15 † $385.20 4,578 $0.084 $0.083 $379.97 ($5.23)
Property Tax Millage
*Average Cost of Residential System in 2010 Nationwide (GTM SEIA, 2011) **Average Size KW System/Residential (GTM SEIA, 2011)
***Property Tax Millage in Charleston Township Example (Charleston Township, 2011) †Maximum Millage Allowed in Michigan (M.C.L § 211.1)
††Lansing - Closest Data for Charleston Township (PV Watts, 2011) Produced kWh in an average year for a 4 kW system †††Cost of Electricity in Lansing, MI (PV Watts, 2011)
Case Studies: New Jersey and California Strategies for supporting solar markets through tax exemptions have been adopted in other jurisdictions, and could provide a model for development of a functioning exemption process in Michigan. Both New Jersey and California have established policies that provide support to solar development without leading to financial challenges for the states (Table 2). In New Jersey, property tax accounts for 27% of total state and local general revenue (Tax Policy Center). Given the limited size of the solar market in New Jersey, the marginal tax increase from PV installation is negligible.
20
Figure 5: Property Tax Incentives by State
One overarching theme in the policies is the ability to receive a tax exemption or exclusion for residential homeowners in addition to the exemptions for commercial and industrial sectors (NJ Stat 54:4-‐3.133a et seq., 2008; Cal Rev & Tax Code 73). Doing so relieves residential property owners of part of the tax burden associated with the development of energy systems, and supports market penetration.
Another theme in California and New Jersey laws is the deliberate change in the tax exemption policy language involving the use of real or personal property to define solar PV systems. In New Jersey and California, this has been done by eliminating the terminology entirely from the incentive, and instead using the general “Property Tax Exemption” or “Property Tax Exclusion” terminology (N.J Stat. 54:4-‐2.113a et seq., 2008; Cal Rev & Tax Code 73).
California has directly addressed the county assessors to ensure proper understanding of the language in the tax exemption policy. A December 2008 letter from the State Board of Equalization was sent to all county assessors to clarify issues related to the solar energy system exclusion recently passed. The letter directly specifies the types of systems exempt and includes contact information for further clarification from the Assessment Services Unit should an assessor need additional support (CBOE, 2008).
Michigan has already made a similar change to the Biomass and Anaerobic Digestion Property Tax Exemptions. The exemption states that Michigan exempts these “facilities
21
from real and personal property taxes” (DSIRE Biomass 2010). This more generalized terminology eliminates the confusion regarding the type of property, and focuses on the technology being exempt.
B. Legislative History There have been several unsuccessful attempts to introduce legislation that addresses the complicated nature of tax treatment of solar in Michigan. On April 12, 2011, a bill was introduced by Senator Tonya Schuitmaker to amend Section 211.9(i) of The General Property Tax Act (Act 206 of 1893) to exempt residential alternative energy systems from personal property tax (Michigan Senate Bill 328). As of the writing of this paper, the bill was referred to the Committee on Energy and Technology, but no further action has been taken. However, the bill appears to lack clarification regarding the difference between real and personal property tax that has been problematic in the past. If it were to pass, it would not address the confusion regarding the property tax exemption policy and the uncertainty would remain surrounding the current implementation of the law.
C. Potential Policy Impact in Michigan Regardless of the classification of real or personal property, agreement between the Treasury and the legislature on how PV systems are treated is essential to remove confusion and uncertainty from the process of installing and owning PV in Michigan. By clarifying the classification of PV systems for tax purposes, additional system owners would become eligible to receive the benefits outlined in the exemptions. This could result in an increase in solar PV installations as the cost of installing a PV system becomes more competitive with the cost of traditional energy sources in Michigan.
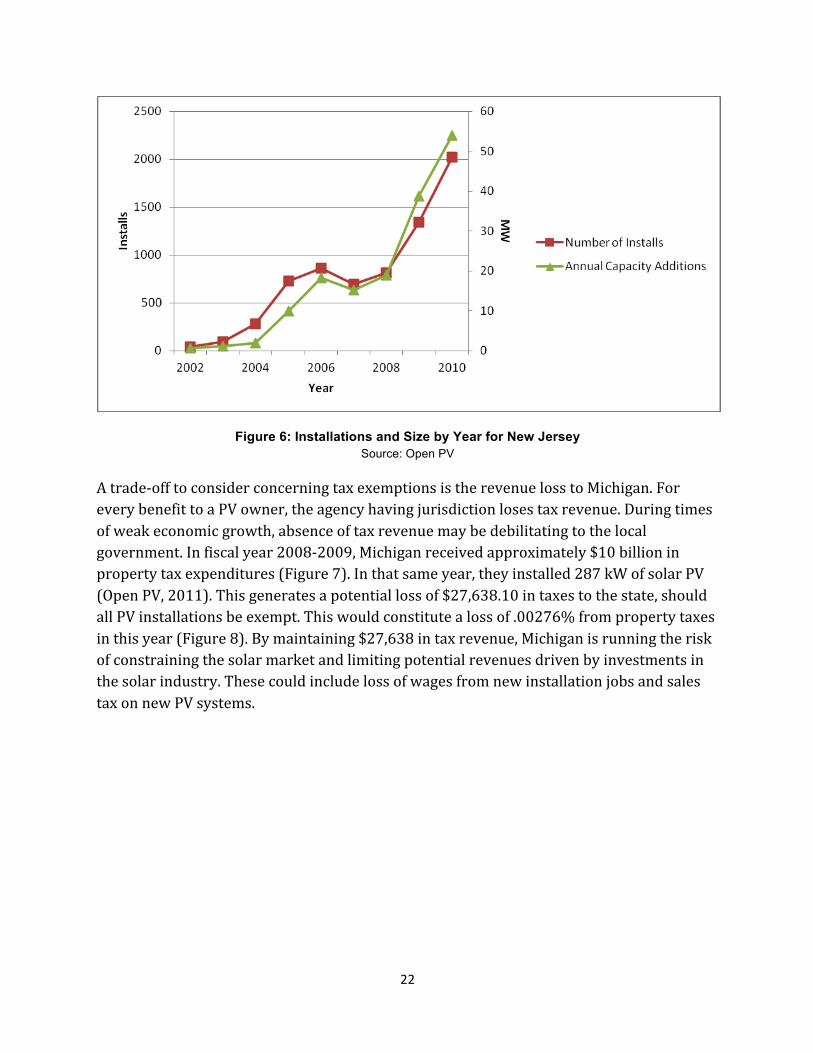
Waiving the tax for resident PV system owners could decrease the tax burden as much as $0.084/kWh (Table 2). This could be a significant incentive for homeowners who consider purchasing solar PV for their homes. In New Jersey, installations increased by 65% between 2008 and 2009 (Figure 4). This upsurge was stimulated by policies that helped reduce market barriers that stimulated the market. Included in these policies was the property tax exemption policy for renewable energy systems (NJ Stat 54:4-‐3.133a et seq. 2008). While it is impossible to directly tie tax treatment or exemptions to the increase in installations, the decrease in price as a result of the exemption could be a positive influence in the market. If this policy is adopted in Michigan, it will help decrease the financial burden that system owners are currently experiencing from increased taxes.
22
Figure 6: Installations and Size by Year for New Jersey Source: Open PV
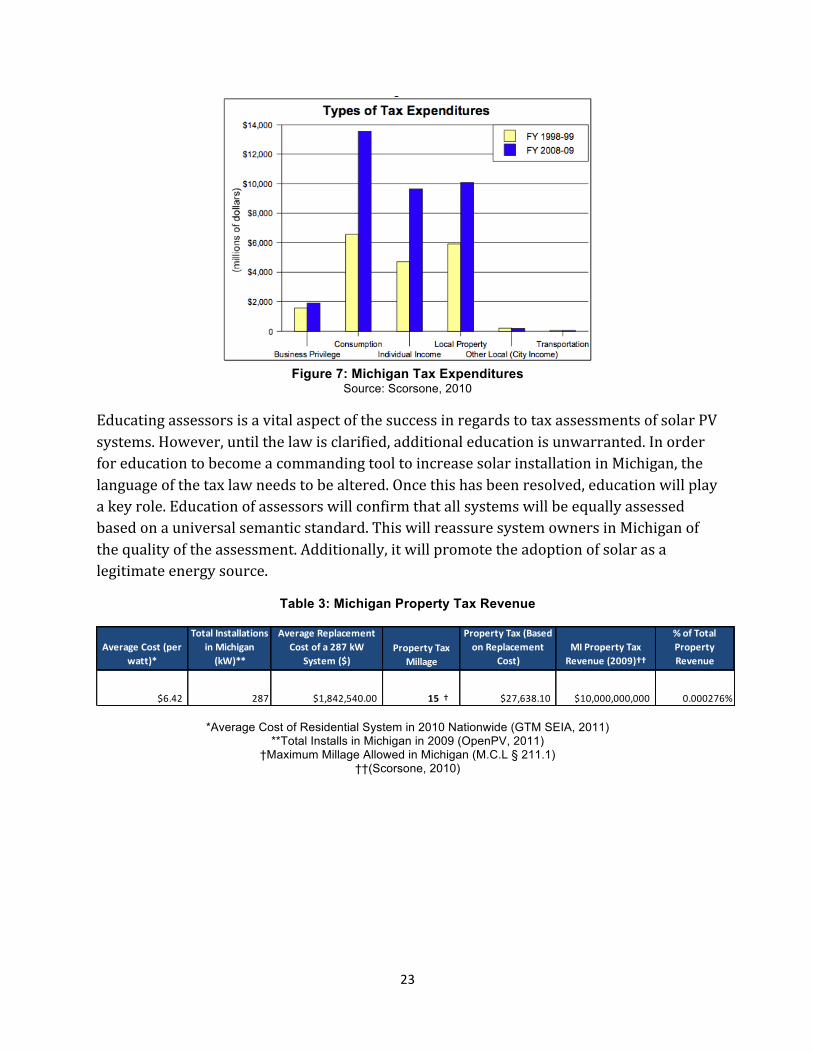
A trade-‐off to consider concerning tax exemptions is the revenue loss to Michigan. For every benefit to a PV owner, the agency having jurisdiction loses tax revenue. During times of weak economic growth, absence of tax revenue may be debilitating to the local government. In fiscal year 2008-‐2009, Michigan received approximately $10 billion in property tax expenditures (Figure 7). In that same year, they installed 287 kW of solar PV (Open PV, 2011). This generates a potential loss of $27,638.10 in taxes to the state, should all PV installations be exempt. This would constitute a loss of .00276% from property taxes in this year (Figure 8). By maintaining $27,638 in tax revenue, Michigan is running the risk of constraining the solar market and limiting potential revenues driven by investments in the solar industry. These could include loss of wages from new installation jobs and sales tax on new PV systems.
23
Figure 7: Michigan Tax Expenditures
Source: Scorsone, 2010
Educating assessors is a vital aspect of the success in regards to tax assessments of solar PV systems. However, until the law is clarified, additional education is unwarranted. In order for education to become a commanding tool to increase solar installation in Michigan, the language of the tax law needs to be altered. Once this has been resolved, education will play a key role. Education of assessors will confirm that all systems will be equally assessed based on a universal semantic standard. This will reassure system owners in Michigan of the quality of the assessment. Additionally, it will promote the adoption of solar as a legitimate energy source.
Table 3: Michigan Property Tax Revenue
Average Cost (per watt)*
Total Installations in Michigan (kW)**
Average Replacement Cost of a 287 kW
System ($)
Property Tax (Based on Replacement
Cost)MI Property Tax Revenue (2009)††
% of Total Property Revenue
$6.42 287 $1,842,540.00 15 † $27,638.10 $10,000,000,000 0.000276%
Property Tax Millage
*Average Cost of Residential System in 2010 Nationwide (GTM SEIA, 2011) **Total Installs in Michigan in 2009 (OpenPV, 2011)
†Maximum Millage Allowed in Michigan (M.C.L § 211.1) ††(Scorsone, 2010)
24
VII. Conclusion The problems experienced in Michigan around permitting and tax treatment are distinct issues, but the impacts and potential solutions have similarities. The state has experienced growth in solar from 2009-‐2011 despite the costs to install solar in Michigan being higher than the national average. This indicates a public interest in increased development of solar and changes to the current permitting and tax treatment rules could increase the size of the market by reducing installer uncertainty. As evidenced by the case studies, a simple change that makes information more accessible and transparent—either through clarification of the rules or making information accessible online—can make meaningful progress in reducing the barriers to solar adoption.
In the case of permitting, adopting the expedited permit process is a low-‐risk, low-‐cost solution to a segment of the problem. Doing so has the potential to expand the Michigan solar market by 5 to 13% beyond market projections, inducing economic growth at a low cost to the initiating agency. Furthermore, streamlining the permit process benefits all parties involved by reducing uncertainty, time and cost.
In regards to tax policy, the legislative intent to develop commercial and industrial solar markets does not correspond to implementation. Eliminating the disagreement between incentive language and Treasury categorization has the potential to reduce this complex market barrier. Once a standard policy is in place, education and public outreach will enable widespread awareness and acceptance of the regulation. Additionally, including a tax exemption for residential homeowners similar to policies implemented in California and New Jersey, would eliminate a portion of the $0.084/kWh tax from an average residential PV system in Michigan (Figure 5).
Taking steps to address permitting and tax issues may stimulate further solar market growth in Michigan. Process consistency and predictable policies enable businesses to operate efficiently. By making PV installations easier to do through reduced BoS costs, Michigan becomes a more attractive location for manufacturers and installers. As PV hardware costs decline and BoS costs make up a greater share of the cost of solar, action today on these issues will prove beneficial in the long-‐term, providing Michigan an opportunity to establish a leadership position in the solar industry.
25
References [26 USC § 25D] (2005). Federal Residential Renewable Energy Tax Credit. Retrieved from: http://www.dsireusa.org/incentives/incentive.cfm?Incentive_Code=US37F&re=1&ee=0
[AECOM]. (July 2011). Economic and Fiscal Impact Analysis of Residential Solar Permitting Reform. AECOM. Retrieved from: http://www.sunrunhome.com/uploads/media_items/aecom-‐executive-‐summary.original.pdf
[ASES] (May 5, 2011). Colorado Limits Solar Permit Fees. American Solar Energy Society. Retrieved from: http://ases.org/index.php?option=com_myblog&show=Colorado-‐limits-‐solar-‐permit-‐fees.html&Itemid=27
Bacon, B. (October 6, 2011) Email communication to Emily Miller from Colorado State Senator Bob Bacon. Bony, L., Doig, S., Hart, C., Maurer, E. and S. Newman. (September 2010). Achieving Low-‐Cost Solar PV: Industry Workshop Recommendations for Near-‐Term Balance of System Cost Reductions. Rocky Mountain Institute. Retrieved from: http://www.rmi.org/Content/Files/BOSReport.pdf
Brooks, B. (October 2009). Expedited Permit Process for PV Systems. Solar America Board for Codes and Standards. Retrieved from: http://solarabcs.org/about/publications/reports/expedited-‐permit/pdfs/Expermitprocess.pdf
Brown, K. (March 28, 2008). Proposed law would cap fees for solar permits. Boulder County Business Report. Retrieved from: http://www.bcbr.com/article.asp?id=92286 [Cal Rev & Tax Code 73] (1999). California Revenue and Taxation Code 73. [CBOE]. California Board of Equalization. (2008) Property and Special Taxes Deparment. Letter to County Assessors Regarding Solar Energy System Exclusion Form. Retrieved from: http://www.boe.ca.gov/proptaxes/pdf/lta08071.pdf [Charleston Township 2011] Charleston Township, Kalamazoo County, Michigan. (October 25, 2011). Property Tax Assessment, Parcel 08-‐28-‐126-‐020. Retrieved from: www.charlestontownship.org/ [DOE] (January 2011). Solar Powering Your Community: A Guide for Local Governments. U.S. Department of Energy. Retrieved from: http://solaramericacommunities.energy.gov/resources/guide_for_local_governments/
26
[DOE Ann Arbor] (September 2011). Solar in Action: Challenges and Successes on the Path toward a Solar-‐Powered Community—Ann Arbor. U.S. Department of Energy. Retrieved from: http://solaramericacommunities.energy.gov/pdfs/ann_arbor.pdf
[DOE San José] (September 2011). Solar in Action: Challenges and Successes on the Path toward a Solar-‐Powered Community—San José. U.S. Department of Energy. Retrieved from: http://solaramericacommunities.energy.gov/pdfs/san_jose.pdf
[DSIRE, 2011] Database of State Incentives for Renewables and Efficiencies. (2011). Property Tax Incentives for Renewables. Retrieved from: http://www.dsireusa.org/summarymaps/index.cfm?ee=1&RE=1 [DSIRE Biomass 2010] Database of State Incentives for Renewables and Efficiencies. (2010). Biomass Gasification and Methane Digester Property Tax Exemption. Retrieved from http://dsireusa.org/incentives/incentive.cfm?Incentive_Code=MI22F&re=1&ee=1 [DSIRE Michigan 2010] Database of State Incentives for Renewables and Efficiencies. (2010). Alternative Energy Personal Property Tax Exemption. Retrieved from http://dsireusa.org/incentives/incentive.cfm?Incentive_Code=MI18F&re=1&ee=1 [EPA] (April 2009) Renewable Portfolio Standards Fact Sheet. Environmental Protection Agency. Retrieved from:http://www.epa.gov/chp/state-‐policy/renewable_fs.html [Freeing the Grid] (October 2011). Freeing the Grid: Best Practices in State Net Metering Policies and Interconnection Procedures. The Vote Solar Initiative and Network for New Energy Choices. Retrieved from: www.freeingthegrid.org [GTM SEIA, 2011] Greentech Media & Solar Energy Industries Association. (September 28, 2011). U.S. Solar Market Insight Q2 2001 Report. Retrieved from http://www.greentechmedia.com/research/solarinsight
Sherwood, L. (June 2011) U.S. Solar Market Trends 2010. Interstate Renewable Energy Council. Retrieved from: http://www.irecusa.org/wp-‐content/uploads/2011/06/IREC-‐Solar-‐Market-‐Trends-‐Report-‐June-‐2011-‐web.pdf [M.C.L § 211.1] M.C.L 211.1 et seq.; 1893 PA 206; Sec 3 and 6, Art. 9, state Constitution. [M.C.L § 211.9] The General Property Tax Act, Act 206 of 1893, Mich. Comp. Laws § 211.9. [MCL § 460.1001]. Renewable Portfolio Standard. [Michigan Saves] (October 25, 2011). Michigan Saves Home Energy Loan Facts and FAQs. Retrieved from:
27
http://www.michigansaves.org/Customers/HomeEnergyLoanProgram/LoanFactsandFAQs.aspx Michigan Senate Bill 328 (2011) [MPSCa] (January 4, 2011). MPSC: Michigan Electric Utilities on Track to Meet Renewable Energy Standard. Michigan Public Service Commission. Retrieved from: http://www.michigan.gov/mpsc/0,4639,7-‐159-‐16393-‐248833-‐-‐,00.html [MPSCb] (January 4, 2011). Michigan’s Net Metering Program Gets an “A”. Michigan Public Service Commission. Retrieved from: http://www.michigan.gov/mpsc/0,4639,7-‐159-‐16393-‐248836-‐-‐,00.html
[MPSCc] (n.d.). Michigan’s Net Metering Program. Michigan Public Service Commission. Retrieved from: http://www.michigan.gov/documents/mpsc/net_metering_handout_2010_Energy_Fair_330553_7.pdf [MPSCd] (December 4, 2008). Case No. U-‐1580. Michigan Public Service Commission. Retrieved from: http://efile.mpsc.state.mi.us/efile/docs/15800/0001.pdf [NJ Stat 54:4-‐3.133a et seq.] NJ Stat 54:4-‐3.133a et seq. (2008). Nobler,E. (October 12, 2011). Phone conversation with Andrew Brix [Open PV] (n.d.) Open PV. National Renewable Energy Laboratory. Retrieved from: http://openpv.nrel.gov/index Pitt, D. (2008). Taking the Red Tape Out of Green Power. New York, NY: Network for New Energy Choices. Retrieved from: http://www.newenergychoices.org/index.php?sd=rt&page=redTape
[PV Watts, 2011] National Renewable Energy Laboratory Renewable Resources Data Center. (2011). PV Watts. Retrieved from http://rredc.nrel.gov/solar/calculators/PVWATTS/version1/US/code/pvwattsv1.cgi Scorsone, Eric. (April 2010). The Michigan Economy And State Revenue: A 10-‐Year History (1999-‐2009). Retrieved from: http://www.senate.michigan.gov/sfa
[SAC Report] van den Akken, T. (Forthcoming). Identification and Tracking of Market Development Metrics Across the 25 Solar America Cities. Critigen.
28
State of Michigan, Department of Treasury. (2008). Small Home and Farm Alternative Energy Systems. Lansing, Michigan. State Tax Commission.
[SunRun]. (January 2011). The Impact of Local Permitting on the Cost of Solar Power. SunRun. Retrieved from: www.sunrunhome.com/permitting
Tax Policy Center, State and Local Government Data Query System, Retrieved from : http://www.taxpolicycenter.org/briefing-‐book/state-‐local/specific/property.cfm
Wesoff, E. (May 31, 2011). Has Vermont solved the solar permitting problem? Greentech Media. Retrieved from: http://www.greentechmedia.com/articles/read/has-‐vermont-‐solved-‐the-‐solar-‐permitting-‐problem/
Wesoff, E. (June 15, 2011). Colorado joins Vermont in Solar Permit Price War. Greentech Media. Retrieved from: http://www.greentechmedia.com/articles/read/colorado-‐joins-‐vermont-‐in-‐solar-‐permit-‐price-‐war/