1234-loud financeiros/nos_1h17... · maria cláudia teixeira de azevedo (4) non-executive member 0...
TRANSCRIPT

1
1234-Lo ud

2

3
1H17 Highlights 4
Governing 6
Bodies
Management 7 Report
Capital Markets 7
Business Review 13
Consolidated Financial Review 18
Risks and Uncertainties for Future Periods 26
Consolidated Financial 32 Statements
T
A
B
L
E
O
F
C
O
N
T
E
N
T
S

4
1H17 Highlights

5
Strong year over year Revenue and Cash Flow growth in 1H17 led by solid operational performance with
growth still coming through in core RGUs;
+ 177.5 thousand RGU net adds of which:
+ 12.7 thousand pay TV, +16.7 thousand fixed, -4.0 thousand DTH;
+ 26.4 thousand fixed voice;
+ 43.4 thousand fixed broadband;
+ 93.4 thousand mobile.
+ 3.5% growth in Consolidated Revenues; 769.4 million euros
+4.8% growth in Consolidated EBITDA; 300.3 million euros
+ 41.1% yoy in Net Income; 71.8 million euros
+ 41% EBITDA–CAPEX; 127.5 million euros
Free Cash Flow Before Dividends, Financial Investments and Own Shares Acquisition; 102.1 million
euros; +4.3x
Consolidated CAPEX – 11.9%; 172.8 million euros

6
As at the date of this report, 20 July 2017, NOS’ Governing Bodies had the following
composition:
Governing Bodies
7
Capital Markets
NOS’ Share Performance
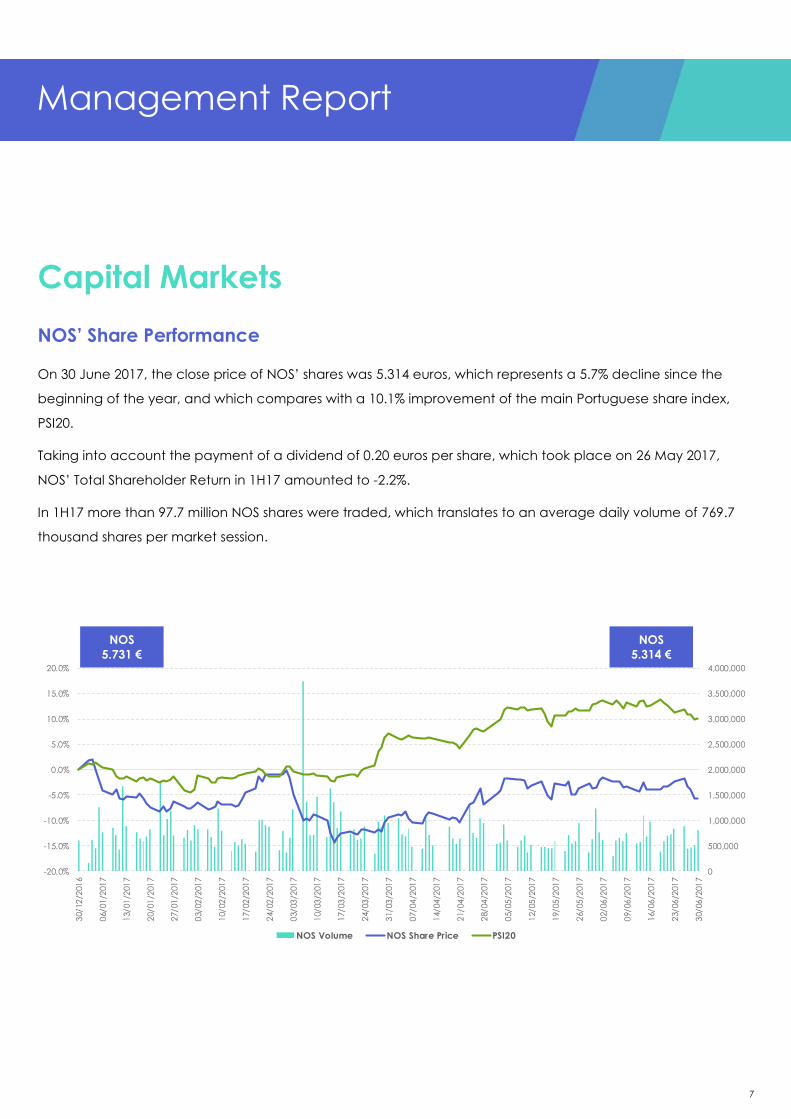
On 30 June 2017, the close price of NOS’ shares was 5.314 euros, which represents a 5.7% decline since the
beginning of the year, and which compares with a 10.1% improvement of the main Portuguese share index,
PSI20.
Taking into account the payment of a dividend of 0.20 euros per share, which took place on 26 May 2017,
NOS’ Total Shareholder Return in 1H17 amounted to -2.2%.
In 1H17 more than 97.7 million NOS shares were traded, which translates to an average daily volume of 769.7
thousand shares per market session.
0
500,000
1,000,000
1,500,000
2,000,000
2,500,000
3,000,000
3,500,000
4,000,000
-20.0%
-15.0%
-10.0%
-5.0%
0.0%
5.0%
10.0%
15.0%
20.0%
30/12
/201
6
06/01
/201
7
13/01
/201
7
20/01
/201
7
27/01
/201
7
03/02
/201
7
10/02
/201
7
17/02
/201
7
24/02
/201
7
03/03
/201
7
10/03
/201
7
17/03
/201
7
24/03
/201
7
31/03
/201
7
07/04
/201
7
14/04
/201
7
21/04
/201
7
28/04
/201
7
05/05
/201
7
12/05
/201
7
19/05
/201
7
26/05
/201
7
02/06
/201
7
09/06
/201
7
16/06
/201
7
23/06
/201
7
30/06
/201
7
NOS Volume NOS Share Price PSI20
Management Report
NOS
5.731 €
NOS
5.314 €
8
As such, the daily average volume of NOS in 1H17 represents 0.15% of its total number of shares outstanding.
The highest price at which NOS shares were traded this semester was 5.816 euros (on 3 January 2017), while
their lowest trade price was 4.771 euros (on 16 March 2017).
As previously mentioned, the main Portuguese share index, PSI20, posted in 1H17 an increase of 10.1%.
Additionally, the Spanish index, IBEX35, increased by 11.7%. FTSE100 (United Kingdom) posted an increase of
2.4%, while other main European indexes had a slightly less positive performance than PSI20, with CAC40
(France) and DAX (Germany) improving by 5.3% and 7.4%, respectively, during 1H17.
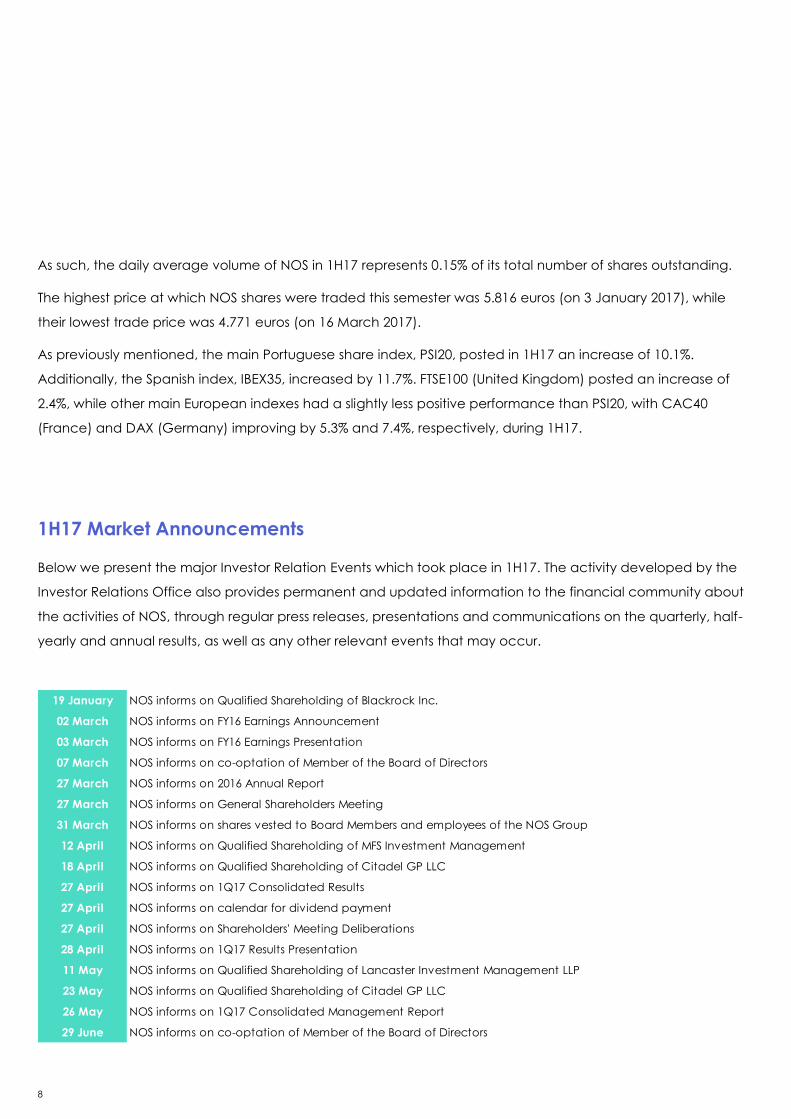
1H17 Market Announcements
Below we present the major Investor Relation Events which took place in 1H17. The activity developed by the
Investor Relations Office also provides permanent and updated information to the financial community about
the activities of NOS, through regular press releases, presentations and communications on the quarterly, half-
yearly and annual results, as well as any other relevant events that may occur.
19 January NOS informs on Qualified Shareholding of Blackrock Inc.
02 March NOS informs on FY16 Earnings Announcement
03 March NOS informs on FY16 Earnings Presentation
07 March NOS informs on co-optation of Member of the Board of Directors
27 March NOS informs on 2016 Annual Report
27 March NOS informs on General Shareholders Meeting
31 March NOS informs on shares vested to Board Members and employees of the NOS Group
12 April NOS informs on Qualified Shareholding of MFS Investment Management
18 April NOS informs on Qualified Shareholding of Citadel GP LLC
27 April NOS informs on 1Q17 Consolidated Results
27 April NOS informs on calendar for dividend payment
27 April NOS informs on Shareholders' Meeting Deliberations
28 April NOS informs on 1Q17 Results Presentation
11 May NOS informs on Qualified Shareholding of Lancaster Investment Management LLP
23 May NOS informs on Qualified Shareholding of Citadel GP LLC
26 May NOS informs on 1Q17 Consolidated Management Report
29 June NOS informs on co-optation of Member of the Board of Directors

9
1H17 Main Investor Relations Events
It also provides all clarifications to the financial community in general - shareholders, investors (both institutional
and retail) and analysts, also assisting and supporting the exercise of the shareholders rights. The Investor
Relations Office promotes regular meetings of the executive management team with the financial community
through the participation in specialized conferences, roadshows, both in Portugal or in major international
financial centers, and often meets with investors who visit Portugal.
NOS’ legal representative for Capital Markets is Maria João Carrapato.
Any interested parties are invited to request information from the Investor Relations Office, using the following
contacts:
Rua Actor António Silva, nº 9
1600-404 Lisboa
Ph. / Fax: +(351) 21 782 47 25 / +(351) 21 782 47 35
E-mail: [email protected]
12 January Haitong Iberian Conference in London
02 February Santander Iberian Conference in Madrid
09/10 March Roadshow in London
16 March Roadshow in Madrid
22 March Citigroup Telecoms Conference in London
30/31 March Roadshow in Paris
24/25 May Roadshow in NY
01 June Berenberg TMT Conference in Zurich
02 June Roadshow in Dublin
26 June Roadshow in London

10
Governing Bodies Shareholdings
Under the terms and for the purposes of Article 9, Paragraph a) and numbers 6 and 7 of Article 14 of CMVM
Regulation 5/2008, and according to the information provided to the Company by the Governing Bodies, NOS
hereby informs on the shareholdings of the members of its Governing Bodies, including the Audit and Finance
Committee and the Alternate and In Office Statutory Auditors, at 30 June 2017:
Acquisitions * Disposals Unit Price * Date
Jorge Manuel de Brito Pereira Chairman of the Board of Directors 0 - - - - 0
Miguel Nuno Santos Almeida Chairman of the Executive Committee 21,025 18,000 - 5.413 € 04/05/2017 39,025
18,327 - 5.413 € 04/05/2017
- 18,327 5.500 € 04/05/2017
10,501 - 5.413 € 04/05/2017
- 10,501 ** 05/05/2017
André Nuno Malheiro dos Santos Almeida Executive Member 15,603 10,930 - 5.413 € 04/05/2017 26,533
Ana Paula Garrido de Pina Marques Executive Member 7,709 10,501 - 5.413 € 04/05/2017 18,210
Cônjuge 11,206 6,435 - 5.413 € 04/05/2017 17,641
Luís Moutinho do Nascimento (1) Executive Member 80 - - - - 80
4,706 - 5.413 € 04/05/2017
- 18,422 ** 05/05/2017
Ângelo Gabriel Ribeirinho dos Santos Paupério (2) Non-executive Member 0 - - - - 0
ZOPT, SGPS, SA 268,644,537 268,644,537
António Domingues Non-executive Member 0 - - - - 0
António Bernardo Aranha da Gama Lobo Xavier (3) Non-executive Member 0 - - - - 0
BPI, SA 14,275,509 14,275,509
ZOPT, SGPS, SA 268,644,537 268,644,537
Catarina Eufémia Amorim da Luz Tavira Van-Dúnem Non-executive Member 0 - - - - 0
João Pedro Magalhães da Silva Torres Dolores Non-executive Member 0 - - - - 0
Joaquim Francisco Alves Ferreira de Oliveira Non-executive Member 0 - - - - 0
Lorena Solange Fernandes da Silva Fernandes Non-executive Member 0 - - - - 0
Maria Cláudia Teixeira de Azevedo (4) Non-executive Member 0 - - - - 0
ZOPT, SGPS, SA 268,644,537 268,644,537
Mário Filipe Moreira Leite da Silva (5) Non-executive Member 0 - - - - 0
ZOPT, SGPS, SA 268,644,537 268,644,537
Paulo Cardoso Correia da Mota Pinto Chairman of the Fiscal Board 0 - - - - 0
Eugénio Luís Lopes Franco Ferreira Member of the Fiscal Board 0 - - - - 0
Patrícia Andrea Bastos Teixeira Lopes Couto Viana Member of the Fiscal Board 0 - - - - 0
Luís Filipe da Silva Ferreira Substitute Member of Fiscal Board 0 - - - - 0
Ernst & Young Audit & Associados, SROC, S.A. Statutory Auditor 0 - - - - 0
Ricardo Filipe de Frias Pinheiro Statutory Auditor 0 - - - - 0
Paulo Jorge Luís da Silva Substitute Statutory Auditor 0 - - - - 0
(5) M ário Filipe M oreira Leite da Silva is member of the Board of Directors of ZOPT, SGPS, S.A., company holding, on 30 June 2017 a share correspondent to 52.15% of the share capital and voting rights of NOS.
* Share acquisitions with a 90% discount under the Short and M edium Term Variable Remuneration Regulation of NOS, SGPS, S.A.
** P lease refer to the announcement made on NOS' institutional website at www.nos.pt/ir for further detail.
(4) M aria Cláudia Teixeira de Azevedo is member of the Board of Directors of ZOPT, SGPS, S.A., company holding a share, on 30 June 2017, correspondent to 52.15% of the share capital and voting rights of NOS, and member of Board of Dircetors and Executive Committee of Sonaecom, SGPS, S.A..
Manuel Ramalho Eanes Executive Member 0 0
(2) Ângelo Gabriel Ribeirinho dos Santos Paupério is member of the Board of Directors of ZOPT, SGPS, S.A., which owned, on 30 June 2017 a share correspondent to 52.15%of the share capital and voting rights of NOS and a member of the Board of Directors and Executive Committee of Sonaecom, SGPS,
S.A..
(3) António Bernardo Aranha da Gama Lobo Xavier is member of the Board of Directors and Executive Committee of Sonaecom, SGPS, S.A..
(1) Luís M outinho do Nascimento was co-opted as Executive M ember of the Board of Directors on 29 June 2017.
Name Position/Job
Shares
Balance 31-12-20161H17 Transactions
Balance 30-06-2017
117,392José Pedro Faria Pereira da Costa
Jorge Filipe Pinto Sequeira dos Santos Graça Executive Member 13,716 0
Executive Member 117,392

11
Qualified Shareholdings
Under the terms of paragraph c) of number 1 of article 9 of the Regulation 5/2008 of the Portuguese Securities
Committee (CMVM), NOS hereby informs on its qualified shareholdings held by third parties, which have been
reported to the Company.
The structure of NOS’ Social Qualified Shareholdings disclosed to the company, was, in 30 June 2017, as follows:
ZOPT, SGPS, SA (1) 268,644,537 52.15%
Banco BPI, SA (2) 14,275,509 2.77%
Blackrock, Inc 11,562,497 2.24%
MFS Investment Management 11,049,477 2.14%
Norges Bank 10,891,068 2.11%
Total Identified 316,423,088 61.42%
(1) According to paragraphs b) and c) of number 1of article 20º and article 21º of the Portuguese Securities Code, a qualified shareholding of 52.15% of the share capital
and voting rights of NOS, SGPS, S.A. as calculated in the terms of article 20º of the Portuguese Securities Code, is attributable to ZOPT, Sonaecom and the fo llowing
companies: a. This qualified holding is attributable to the companies Kento Holding Limited (“ Kento” ) and Unitel International Holdings, BV (“ Unitel International” ), as
well as to M rs. Isabel dos Santos, under the terms of articles 20(1)(b) and (c) and 21of the Portuguese Securities Code, being (i) Kento and Unitel International directly
and indirectly contro lled by M rs. Isabel dos Santos and (ii) ZOPT contro lled together by its shareholders Kento, Unitel International and Sonaecom as a result o f the
shareholders agreement entered into between these entities; b. The aforementioned qualified holding is also attributable to Sonaecom and all entities in a contro l
relationship with Sonaecom, namely SONTEL, BV, Sonae Investments, BV, SONAE, SGPS, S.A., EFANOR INVESTIM ENTOS, SGPS, S.A. and to M r. Belmiro
(2) Under the terms of paragraph 1of article 20º of the Portuguese Securities Code, the voting rights corresponding to 2.77%of NOS' share capital, held by Banco
BPI's Pension Fund, are attributable to Banco BPI.
Note: The calculation of the voting rights corresponding to each shareholder does not consider own shares held by the Company.
Shareholders Number of Shares% Share Capital and
Voting Rights
A detailed record of the qualified shareholdings’ announcements can be found at NOS’ corporate website, at
www.nos.pt/ir.

12
Transactions of Own Shares
By the end of 1H17, NOS held, within the scope of its Employee Share Plan and the Regulation on Short and
Medium Term Variable Remuneration, aimed at NOS employees, 2,047,752 own shares.
The table below summarizes NOS’ own shares transactions, which took place until 30 June 2017:
Description Number of Shares
Balance as at 1 January 2017 3,017,603
Share Incentive Scheme - Distribution 969,851
Balance as at 30 June 2017 2,047,752

13
Business Review
NOS continues to strengthen market share in almost all of its core services as reflected in the most recent data
published by ANACOM, for end 1Q17. NOS´ share of mobile subscribers was 24.4%, 1.6 pp greater than last
year. Share of fixed internet and voice services grew by 0.8pp and 1.6pp to 37.7% and 35.1%, respectively whilst
pay TV market share remained stable at 43.5%.
Total RGUs grew by 5.8% yoy to 9.25 million services with net adds of 177.5 thousand in 1H17. The primary source
of RGU growth for NOS is the network expansion project that NOS initiated in 2014, together with marginal
growth in the HFC footprint. By the end of 1H17 NOS covered a total of 3.787 million households with its fixed
network, of which 449 thousand with FttH and the remaining 3.338 million with its Docsis 3.0 HFC network. NOS
covered an additional 23.2 thousand households in 1H17.
The Pay TV base continued to post healthy growth to 1,613 thousand subscribers, +2.5% yoy. During 1H17, fixed
access customers grew by 16.7 thousand subscribers to 1.282 million, representing 34% penetration of NOS’
total network coverage. In new network geographies covered since the merger, penetration now stands at
24%, with some locations reaching close to 50%1.
Fixed network rollout of own and competitors’ ftth networks in areas previously covered only by satellite is, as
anticipated, starting to reflect on the DTH customer base, with NOS posting negative net adds of 4.0 thousand
in 1H17. Offers based on DTH are more vulnerable to fixed NGN solutions given their higher Internet speeds and
quality and interactivity of TV solutions. This is a trend that is set to continue although mitigated by customer
migration wherever possible to NOS’ own fixed network.
Customers continue to take up convergent solutions, albeit at a slower pace due to the already high level of
penetration at 47.1% of the fixed network and 44.1% of the total customer base. Progressively more households
are upgrading to the higher end UMA interface with its more sophisticated features amongst which its voice
controled remote, advanced search functionalities, NOS’ cloud sharing service and 4K viewing capabilities
amongst others, acting as key differentiators versus other offers in the market.
Fixed Broadband and Voice services continued to post good growth of 43.4 thousand RGUs and 26.4 thousand
RGUs respectively. By the end of 1H17, penetration of fixed broadband services measured as a proportion of
1 The penetration rate refers to customer activations in new FttH geographies.

14
the fixed customer base was 76.7% and penetration of fixed voice services was 86.7%, reflecting the maturity of
the market in terms of bundled offers.
Growth in convergence, stand-alone mobile segment, and B2B services are the main drivers of mobile RGU
growth with an additional 93.4 thousand net adds during 1H17. Demand for speed and higher data
allowances increases quarter after quarter with the growth in the number of smartphones, 72% at the end of
1H17, and particularly of 4G enabled devices which stood at 59%. Monthly average data usage on
smartphones has grown by 77% to 1,540MB and by 69% to 1,910MB for 4G enabled devices.
Residential fixed access revenues per user (ARPU) grew by 2.3% yoy to 44.4 euros, reflecting continued growth
in average RGUs per account, increased traffic revenues and primarily the annual price increase implemented
at the end of 2016. Somewhat dampening these positive effects, ARPU comparison with the previous year was
impacted primarily by lower termination rates (this effect will no longer be material going forward), lower
revenues from discretionary subscription to premium services and lower contribution of VoD, amongst others.
Adjusting for these impacts, base ARPU would have grown by 3.8% yoy.
RGU yoy growth in B2B was 8.0% in 1H17 reaching 1.453 million services. NOS’ strategy for the business segment
is to continue to acquire its fair share of new accounts coming to the market whilst at the same time seeking to
protect the value of legacy accounts and increase share of wallet of telecom and IT spend in existing
accounts with full service solutions for the various subsegments. Although still a relatively small source of
business revenues, yoy growth in IT service revenues has been very strong. A number of transformational
projects are being implemented which are supportive of more value driven growth albeit slower than in
previous years. The operational model in B2B sub segments has been revisited to guarantee that NOS is present
in the most margin relevant stages of the customer relationship, becoming a producer rather than a pure
reseller of services where relevant. NOS is well positioned to capture value from innovative services developing
technological solutions supported by leading network assets and service platforms and strong institutional
partnerships when appropriate. Continuous and open product and service innovation and excellence in
service delivery are the foundations upon which NOS differentiates itself in the market. Total B2B and Wholesale
revenues posted a 3.5% increase yoy. Business customer revenues posted growth of 2.9% and revenues from
wholesale improved yoy by 4.4%. The Wholesale business has a different revenue and margin profile from the
Corporate and Mass Business Segment, tending to present material volatility over the course of the year.
A source of revenues that has been diminishing in past periods is Mass Calling Services (MCS) due to the
marketwide decline of this business.
15
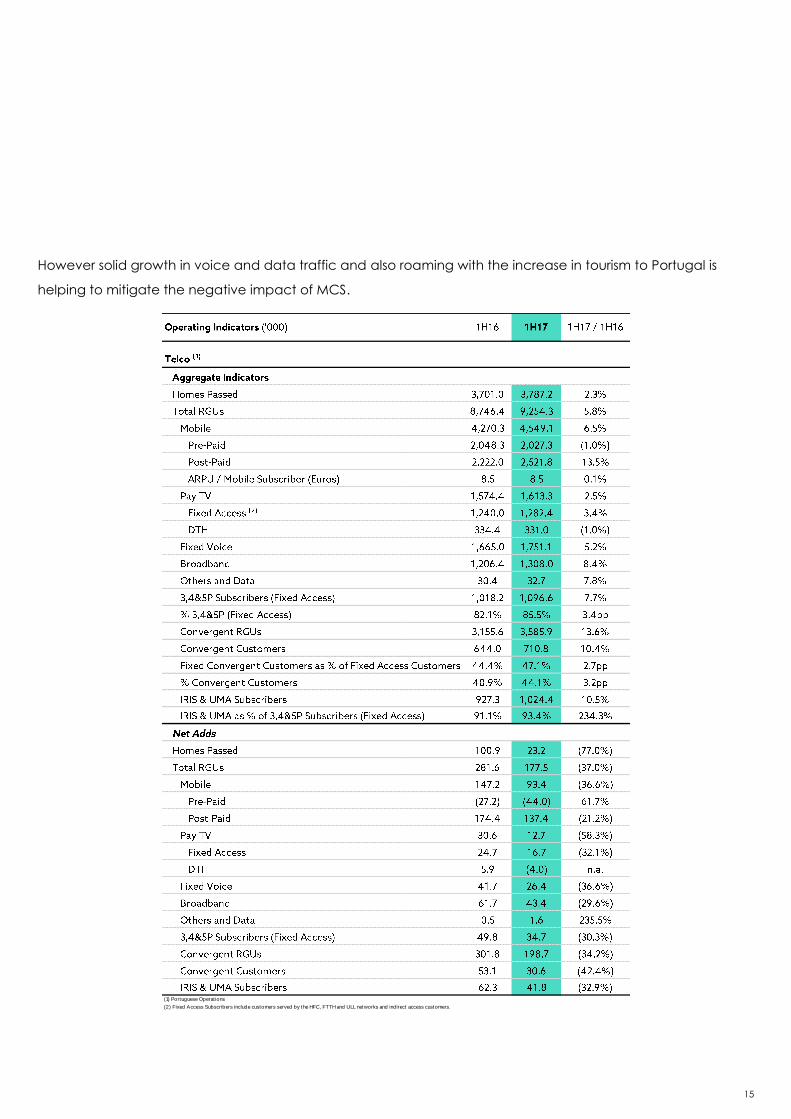
However solid growth in voice and data traffic and also roaming with the increase in tourism to Portugal is
helping to mitigate the negative impact of MCS.
(1) Portuguese Operat ions
(2) Fixed Access Subscribers include customers served by the HFC, FTTH and ULL networks and indirect access customers.

16

17
Cinemas and Audiovisuals
(1) Portuguese Operat ions
NOS’ Cinema ticket sales posted yoy growth of 15.2% to 4.743 million tickets in 1H17, slightly below the
performance of the market as a whole which improved by 15.7%[1]. Average revenue per ticket posted a slight
yoy increase of 0.4% to 4.8 euros in 1H17.
The most successful films exhibited in 1H17 were “The Fate of the Furious”, “Beauty and the Beast”, “Fifty Shades
Darker”, “The Boss Baby” and “Pirates of the Caribbean: Dead Men Tell No Tales”.
NOS’ gross box-office revenues grew by 15.7% in 1H17, which compares with 16.8% yoy growth for the market
as a whole. NOS continues to maintain its leading market position, with a market share of 61.6% in terms of gross
revenues in 1H17. Cinema Exhibition revenues improved by 15.3% yoy in 1H17 to 31.5 million euros.
Revenues in the Audiovisuals division increased by 11.9% yoy to 37.0 million euros in 1H17. This improvement in
revenues was driven primarily by the positive yoy performance in Cinema Distribution and VoD, partially offset
by a decline in the Homevideo area. Of the top 10 cinema box-office hits in 1H17, NOS distributed 5, “The Fate
of the Furious”, “Beauty and the Beast”, “Fifty Shades Darker”, “Pirates of the Caribbean: Dead Men Tell No
Tales”, and “Guardians of the Galaxy Vol. 2”, therefore maintaining its leading position.
[1] Source: ICA – Portuguese Institute For Cinema and Audiovisuals

18
Consolidated Financial Review
Consolidated Income Statement
(1) Includes operat ions in M ozambique.
(2) Commercial costs include commissions, market ing and publicity expenses and costs of equipment sold.
(3) EBIT = Income Before Financials and Income Taxes.

19
Operating Revenues
Consolidated Operating Revenues grew by 3.5% yoy to 769.4 million euros, with telco revenues growing by
3.0%, Audiovisuals by 11.9% and Cinema revenues by 15.3%.
In the telco operation, Consumer Revenues grew by 4.5% in 1H17 to 464.5 million euros, reflecting a
combination of higher growth in Residential revenues driven by continued take-up of convergent bundles and
the full impact of the price increases and a pick-up in the pace of growth of stand alone personal revenues
that have consolidated the inflection of the negative growth trend of past quarters reflecting less migration to
integrated bundles with the slowdown in convergent take-up and the impact of the price increases.
Business and Wholesale Revenues grew by 3.5% yoy to 213.1 million euros. Excluding Wholesale revenues,
Business revenues grew by 3.0%, driven by good RGU performance, acquisition of new accounts and the price
increase at the start of the year. Wholesale Revenues posted growth of 4.4% yoy due to strong performance of
wholesale voice, data and roaming traffic volumes, offsetting in full the continued decline of the low margin
mass calling service business which represented just 2% of total Business and Wholesale Revenues in 1H17,
compared with almost 5% in 1H16.
Year on year telco revenue comparisons should be adjusted to reflect the regulatory impacts of lower MTRs
which have been progressively coming down over the past years. The last relevant cut ocurred in April 2016
when SMS MTRs declined 32.5% to €0.0083. The most recent cut to voice MTRs occurred already at the start of
July 2017 with a reduction of 7.4% to €0.0075 per minute. Adjusting for MTR cuts in yoy telco revenue
comparison in 1H17, growth would have been 3.6%. In addition, midway through 1Q17, and as a result of the
implementation of a remedy imposed at the time of the merger, NOS sold Optimus’ FttH network to Vodafone,
and consequently has ceased to receive a wholesale revenue stream.
Movie going has been very strong yoy in 2017 to date, with revenues for the first six months up by 15.3% in the
cinema business and by 11.9% in the audiovisuals division.

20
Consolidated Operating Costs
Total Operating Costs increased by 2.7% to 469.0 million euros in 1H17, representing 61.0% of Total Revenues,
down 0.4 p.p. in comparison with 1H16 despite the significant yoy increase in premium sports content costs.
Excluding Direct Costs, Operating Costs were down 3.6% yoy reflecting a combination of operating leverage
from topline growth, efficiencies being achieved across the board and the release of a provision as explained
below.
The 6.2% decline in 1H17 Wages and Salaries is explained essentially by differences in employee variable
remuneration and by a temporary reduction in headcount.
Direct costs posted a significant increase of 9.5% yoy to 240.1 million euros due to higher programming costs as
a result of more expensive premium sports content and the revision of the Sport TV distribution model from the
start of the new football season in 2H16. In addition, Wholesale traffic related costs increased significantly yoy
along with the higher volume of activity over last year.
Commercial costs declined by 8.4% to 40.6 million euros, reflecting a combination of higher advertising costs
due to more advertising activity and a lower level of equipment costs driven by fewer handsets sold, as
reflected in the level of revenues generated and due to a lower yoy level of non-capitalized commissions.
Other Operating Costs were down 1.3% on 1H16, with an increase in support services and maintenance and
repairs costs partially offsetting the reduction in supplies and external services and the release of a provision in
the amount of close to 7 million euros during 2Q17 after the courts decided in favour of NOS in 2Q17 in a
pending legal dispute regarding fixed termination terms with ANACOM.
Consolidated EBITDA posted yoy growth of 4.8% yoy to 300.3 million euros representing an EBITDA margin of
39.0% compared with 38.6% in 1H16 and despite the aforementioned increase in premium sports content costs
as from 2H16.
Telco EBITDA recorded growth of 4.6% to 275.6 milion euros representing an EBITDA margin as a percentage of
revenues of 37.7%, up 0.6 pp over 1H16. Audiovisuals and Cinemas EBITDA grew by 7.1% yoy to 24.7 million
euros led by the strong revenue growth as explained above.

21
Net Income
Net Income grew by 41.1% in 1H17 to 71.8 million euros.
In addition to the EBITDA growth described above, the most material contribution to the yoy variation remains
the more positive constribution to results from NOS’ share of Associates and Joint Ventures which grew to 9.0
million euros in 1H17 compared with negative 9.7 million euros in 1H16. This improvement in contribution is the
result of a combination of the better exchange rate environment at ZAP together with a price increase and
cost savings that helped drive improved results of the operation and also due to the change to the distribution
model in 2H16 in Sport TV driving more positive financial results. The increase in Depreciations and Amortizations
is explained, as in previous periods, primarily by the large investments made in network assets and customer
acquisition costs and also by write-offs driven by investment in network renewal. Net Financial Expenses were
down by 3.3% yoy, thanks to the decline of the all-in average cost of NOS’ Net Financial Debt to 2.1% in 1H17
from 2.3% in 1H16. Income Tax provision amounted to 10.7 million euros in 1H17 representing an effective tax
rate of 12.9%. The volatility in tax rate varies due to a combination of factors of which the most relevant being
accounting of deferred taxes and the contribution of the Share of Associates and Joint Ventures line.
CAPEX

22
Total Group CAPEX declined by 11.9% yoy to 172.8 million euros in 1H17, representing 22.5% of Consolidated
Revenues.
Telco CAPEX fell by 12.6% to 155.3 million euros, representing 21.2% of Telco Revenues, down from 25.0% in
1H16. Technical CAPEX which includes network expansion, upgrade and integration related investments, was
78.4 million euros in 1H17, down by 10.7% yoy and representing 10.7% of telco revenues. Technical CAPEX does
not follow a linear pattern quarter on quarter due to the specifics and phasing of projects underway. The
second half of the year is set to be more intense in terms of execution, the main expansionary or non recurrent
projects in the pipeline being mobile investments to meet additional coverage and capacity requirements, the
Docsis 3.1 upgrade of the HFC network and some IT investment projects, namely the development of a new
CRM system and integration related projects.
Customer Acquisition CAPEX of 76.9 million euros, down 14.4% yoy, represented 10.5% of telco revenues,
compared with 12.6% in 1H16. The decline in Customer Related CAPEX is mainly a result of the lower level of
commercial activity driving a lower level of gross adds as explained in the operational section of this report.

23
Cash Flow
EBITDA – CAPEX increased by 41% to 127.5 million euros in 1H17, representing 16.6% as a percentage of
revenues, a very material increase led by the 4.8% increase in EBITDA and the lower yoy level of CAPEX, as
discussed previously. Investment in working capital and non cash items in the quarter was lower than that of
1H16 and as such the increase in EBITDA-CAPEX was almost entirely passed through to Operating Cash Flow
which grew by 106.3% to 106.7 million euros.
Total FCF before dividends, financial investments and own shares acquisitions was 102.1 million euros in 1H17,
representing a very material increase from the 23.9 million euros recorded in 1H16. Due to the FY16 dividend
payment made in 2Q17 of 102.6 million euros, total FCF was negative by 0.5 million euros in 1H17.

24
Consolidated Balance Sheet
Capital Structure
At the end of 1H17, Net Financial Debt stood at 1,114.2 million euros.
Total financial debt was 1,116.3 million euros, which was offset with a cash and short-term investment position
on the balance sheet of 2.0 million euros. At the end of 1H17, NOS also had 285 million euros of unissued
commercial paper programmes. For 1H17, the all-in average cost of NOS’ Net Financial Debt amounted to
2.1%, which compares with 2.3% in 1H16.
During the 1H17 NOS executed two financing deals to refinance existing lines:
In March, a new commercial paper program with a maximum amount of 75M Euros and maturing in
2021, with Banco Milllennium bcp; and
In June, a new commercial paper program with a maximum amount of 100M Euros, 50% of which
amortized in 2021, and the remaining in 2023, with Banco Santander Totta.

25
Net Financial Gearing was 52.1% at the end of 1H17 and Net Financial Debt / EBITDA (last 4 quarters) now
stands at 2.0x. The average maturity of NOS’ Net Financial Debt at the end of 1H17 was 3.1 years.
Taking into account the loans issued at a fixed rate, the interest rate hedging operations in place, and the
negative interest rate environment, as at 30 June 2017, the proportion of NOS’ issued debt paying interest at a
fixed rate is approximately 67%.
(1) Net Financial Gearing = Net Financial Debt / (Net Financial Debt + Total Shareholders' Equity).

26
Risks and Uncertainties for Future Periods The Company is exposed to economic, financial and legal risks incidental to its business activities.
In the context of ERM - Enterprise Risk Management -, NOS implements risk management cycles biannually, on
average. In these cycles the major risks are reviewed and prioritised, updating them and subjecting them to an
evaluation by the Executive Committee aimed at classifying them according to their likelihood and impact. For
the most critical risks, an analysis of risk drivers and of risk triggers may additionally be made, supplemented by
identification of existing controls and of new actions for the management of these risks. The Company has
been implementing activities that help to mitigate risks to levels of acceptance sought and laid down by the
Executive Committee.
NOS classifies and groups types of risks using a BRM - Business Risk Model. This BRM incorporates a Risk Dictionary
that can be used to systematically identify the risks that affect the Company (common language), define and
group risks in categories and also facilitate the identification of the main risk drivers.
The main types of risks, identified within the scope of NOS BRM, and the corresponding strategies that have
been adopted for their management will now be described.
Economic Risks
Economic Environment - The Company is still, although in a lower degree, exposed to the challenging social
and economic environment experienced in Portugal during the last years and consequently to a general
reduction in consumption. In this context, there is a risk of the market share, in clients and/or revenue, may be
affected by the high unemployment rate and the reduction in private and public consumption. NOS has
carefully monitored this risk and adopted strategies that have been helping the increase of clients and counter
the drop in revenue visible in the Portuguese telecomunications market until the end of 2016. NOS has also
been paying attention to the identification of other opportunities, in conjunction with the competition and
technological innovation risk response strategies that are described below.

27
Competition – This risk is related to the potential reduction in the prices of products and services, reduction in
market share, loss of customers, increasing difficulty in obtaining and retaining customers. The management of
competition risk has involved a strategy of investing in constant improvement in quality, distinctiveness and
innovation for the products and services provided, as well as in its protection from competition, diversification
of supply, combination of offers related with different businesses of NOS and the strengthening of the portfolio
of broadcasting rights and the respective provision of contents as well as the constant monitoring of customer
preferences and/or needs. In addition, the synergies and complementarities resulting from the process of
operational integration of the companies that led to the current composition of NOS Group has been a
structuring factor to mitigate the risk of competition in the communication business and they have been
allowing the growth acceleration in several segments of clients, particularly the attainment of major clients in
the business segment and for the strong increase of share in mobile phone clients. These factors also allow the
reinforcement of the competitive position of NOS Group before the eventual movements of consolidation or
acquisiton in the industry of electronic communication by the competitors.
Technological Innovation – This risk is associated with the need for investment in increasingly competitive
services (multimedia services, messaging services, multiplatform TV services, cloud services, infrastructure and
information technology services, etc.), which are subject not only to accelerated changes in technology but
also to the actions of the players which act outside of the tradiditional communications market, like the OTT
(over-the-top players) Operators. NOS believes that having an optimised technical infrastructure is a critical
success factor that helps to reduce potential failures in the leverage of technological developments. The
Company has managed this risk with the aim of ensuring that the technologies and businesses in which it is
investing are accompanied by a similar development in demand and consequently an increasing in the use of
the new services by customers.
28
Business Interruption and Catastrophic Losses (Business Continuity Management) - Since the businesses of NOS
are based above all on the use of technology, potential failures in technical-operational resources (network
infrastructures, information systems applications, servers, etc.) may cause a significant risk of business
interruption, if they are not well managed. This may imply other risks for the Company, such as adverse impacts
on reputation, on the brand, on revenue integrity, on customer satisfaction and on service quality, which may
lead to the loss of customers. In the electronic communications sector, business interruption and other
associated risks may be aggravated because the services are in real time (voice, data/internet and TV), and
customers typically have low tolerance for interruptions. Under the BCM - Business Continuity Management
programme, NOS has implemented Business Continuity management processes that cover buildings, network
infrastructures and the most critical activities that support communications services, for which it develops
resilience strategies, continuity plans and actions, and incident/crisis management procedures. The continuity
processes may be periodically subject to impact and risk analysis, as well as audits, tests and simulations. NOS
has also been developing the coordination with external official entities for catastrophic scenarios, critical
infrastructure protection and communication in crisis, including the cooperation with the National Authority for
Civil Protection.
Confidentiality, Integrity and Availability (Information Security Management) - Bearing in mind that NOS is the
biggest corporate group in the area of communications and entertainment in the country, its businesses make
intensive use of information and of information and communication technologies that are typically subject to
security risks, such as availability, integrity, confidentiality and privacy. Just like other operators, NOS is
increasingly exposed to cybersecurity risks, related to external threats to the electronic communications
networks and to the surrounding cyberspace. Under the ISM - Information Security Management programme,
NOS has an Information Security Committee (GRC – Governance Risk and Compliance Committee) that is
authorised by the Executive Committee to, among other responsibilities, monitor the risks associated with
security, propose rules and organise awareness campaigns. The different business units, under the supervision of
the Committee, develop a plan of internal actions with the aim of consolidating information security
management processes and controls.

29
For specific issues related to the confidentiality and privacy of personal data, the Company has a Chief
Personal Data Protection Officer (CPDPO) who is responsible for compliance with laws and regulations
applicable to data processing, acts in the name of the Company in interaction with the national regulatory
authority for data protection (CNPD - National Commission for Data Protection) and promotes the adoption of
data protection principles, in line with international standards and best practices. Employees and partners
assume obligations of confidentiality, secrecy and protection of personal data and must not transmit to any
third parties the data to which they have access in the course of and as a result of their duties. The obligations
are reinforced through the signature of terms of liability by its staff and partners, as well as through
communication and sensibilization actions and holding of specialized training internal courses on security and
privacy. In addition, the Company has some business segments and processes, namely related to customer
management (support, billing and collection), and to services of data centres of NOS Sistemas (housing
service), certified to ISO 27001 - Information Security Management Systems.
Service Fraud (Management of Telecommunications Fraud) - Customer or third party fraud is a common risk in
the comunications sector. Perpetrators of fraud may take advantage of the potential vulnerabilities of the
network process or of the communications service. In view of this situation, NOS has a team dedicated to
Service Fraud and Security Management. In order to encourage secure use of communications services, it has
developed various initiatives and implemented controls, including the provision of an internal platform with
information on security risks and service fraud, as well as the continuous improvement of processes to monitor
and mitigate these risks. Fraud controls are implemented to prevent anomalous situations of fraudulent use or
situations of misuse (piracy) with a direct impact on revenue. NOS has also joined initiatives developed by the
GSM Association (GSMA), including the GSMA Fraud Forum and the GSMA Security Group.
Revenue and Cost Assurance (Enterprise Business Assurance) - Electronic comunications businesses are subject
to inherent operational risks associated with the assurance and monitoring of customer revenue and costs,
from a viewpoint of revenue flows and platform integrity. Billing processes perform revenue controls, with
regard to invoicing quality. NOS also has a Revenue Assurance area that applies processes to control revenue
integrity (underinvoicing or overinvoicing) and cost control with the aim of presenting a consistent chain of
revenue and costs, from the moment the customer enters our provisioning systems, involving the provision of
the communications service, up to the time of invoicing and charging.

30
Financial Risks
Tax – The Company is exposed to changes in tax legislation and varied interpretations of the application of tax
and tax related regulations in several ways. The Finance Department contributes to management of this risk,
monitoring all tax regulations and seeking to guarantee maximum tax efficiency. This department may also be
supported by external consultants whenever the questions being analysed are more critical and, for this
reason, require interpretation by an independent entity.
Credit and Collections – These risks are associated with a reduction in receipts from customers due to possible
ineffective or deficient operation of collection procedures and/or changes in the legislation that regulates the
provision of essential services and have an impact on the recovery of customer debts. The current adverse
economic climate also significantly contributes to the worsening of these risks. They are mitigated through the
definition of a monthly plan of collection actions, their follow-up and validation and the review of results.
Where necessary, the procedure and the timings of these actions are adjusted to ensure the receipt of
customer debts. The aim is to ensure that the amounts owed are effectively collected within the periods
negotiated without affecting the financial health of the Company. In addition, NOS has credit insurance and
specific areas for Credit Control, Collections and Litigation Management and, regarding some business
segments, also subscribes credit insurances.

31
Legal Risks
Legal and Regulatory – Regulatory aspects are important in the electronic comunications business, subject to
the abovementioned specific rules , as well as new regulations (examples: pre-contractual and contractual
information within electronic communications, safety and integrity of networks and electronic communications
services, etc…) mainly imposed by the sector regulator ANACOM (National Communications Authority). On an
European level there are also regulations that have a relevant effect on the market, notably those measures
established under the strategy of the Digital Single Market, including reviewing directives that transversely
affect business (examples: audiovisual services, e-commerce, etc…), the effectiveness of new regulations on
access and conectivity (examples: elimination of roaming charges, net neutrality protection, etc.), the new
directives and specific regulations on cybersecurity and privacy (examples: safety of networks and information,
personal data protection, electronic communication safety, etc.) and, mostly, the future of European
Electronic Communications Code, which intends to hold in a single document the main leading regulations on
the electronic communications market (examples: spectrum, 5G implementation, universal service, level
playing field OTT, consumer protection, and governance of national and European authorities, etc.). NOS has
to comply with regulatory frameworks defined on a European level that have a direct effect in Portugal. In
addition to specific rules related to the comunications sector, NOS is also subject to horizontal legislation,
including competition law. The Legal and Regulatory Department assists in the management of these risks,
monitoring changes in applicable laws and regulations, given the threats and opportunities they represent for
the competitive position of NOS in the business sectors in which it operates.
Lisbon, 20 july 2017
The Board of Directors

32
Consolidated statement of financial position
at 31 December 2016 and 30 June 2017
(Amounts stated in thousands of euros)
As a standard practice, only the annual accounts are audited, the semestral results are not audited separately.
The Notes to the Financial Statements form an integral part of the consolidated statement of financial position
as at 30 June 2017.
Chief Accountant Board of Directors
ASSETS
NON - CURRENT ASSETS
Tangible assets 7 1,158,181 1,137,717
Investment property 663 662
Intangible assets 8 1,158,779 1,149,008
Investments in jointly controlled companies and associated companies 9 7,888 16,612
Accounts receivable - other 10 6,489 6,761
Tax receivable 11 3,617 1,029
Available-for-sale financial assets 77 77
Deferred income tax assets 12 117,302 113,938
Derivative financial instruments 17 6 -
TOTAL NON - CURRENT ASSETS 2,453,002 2,425,804
CURRENT ASSETS:
Inventories 13 51,043 35,937
Accounts receivable - trade 14 348,926 362,955
Accounts receivable - other 10 15,814 18,277
Tax receivable 11 2,861 1,326
Prepaid expenses 15 84,391 75,821
Non-current assets held-for-sale 16 24,237 -
Derivative financial instruments 17 54 17
Cash and cash equivalents 18 2,313 2,010
TOTAL CURRENT ASSETS 529,639 496,343
TOTAL ASSETS 2,982,641 2,922,147
SHAREHOLDER'S EQUITY
Share capital 19.1 5,152 5,152
Capital issued premium 19.2 854,219 854,219
Own shares 19.3 (18,756) (12,728)
Legal reserve 19.4 1,030 1,030
Other reserves and accumulated earnings 19.4 112,031 96,911
Net income 90,381 71,827
EQUITY BEFORE NON - CONTROLLING INTERESTS 1,044,057 1,016,411
Non-controlling interests 20 9,041 9,440
TOTAL EQUITY 1,053,098 1,025,851
LIABILITIES
NON - CURRENT LIABILITIES
Borrowings 21 972,003 1,031,437
Provisions 22 146,287 133,474
Accounts payable 26 21,551 19,842
Tax payable 11 1,298 1,298
Accrued expenses 23 9,185 9,069
Deferred income 24 4,138 3,922
Derivative financial instruments 17 4,027 2,709
Deferred income tax liabilities 12 10,206 8,737
TOTAL NON - CURRENT LIABILITIES 1,168,696 1,210,488
CURRENT LIABILITIES:
Borrowings 21 224,692 167,087
Accounts payable - trade 25 238,828 209,682
Accounts payable - other 26 68,733 54,897
Tax payable 11 23,957 32,983
Accrued expenses 23 174,514 194,980
Deferred income 24 30,123 26,144
Derivative financial instruments 17 - 35
TOTAL CURRENT LIABILITIES 760,847 685,808
TOTAL LIABILITIES 1,929,543 1,896,296
TOTAL LIABILITIES AND SHAREHOLDER´S EQUITY 2,982,641 2,922,147
30-06-2017NOTES 31-12-2016
Consolidated Financial Statements

33
Consolidated statement of income by nature
for the quarters and semesters ended on 30 June 2016 and 2017
(Amounts stated in thousands of euros)
As a standard practice, only the annual accounts are audited, the semestral results are not audited separately.
The Notes to the Financial Statements form an integral part of the consolidated statement of income by nature
for the semester ended on 30 June 2017.
Chief Accountant Board of Directors
REVENUES:
Services rendered 353,785 702,870 370,296 732,546
Sales 13,996 31,086 15,037 29,870
Other operating revenues 5,030 9,158 3,038 6,954
27 372,811 743,114 388,371 769,370
COSTS, LOSSES AND GAINS:
Wages and salaries 28 21,896 45,721 20,698 42,888
Direct costs 29 110,380 219,204 126,296 240,114
Costs of products sold 30 10,745 24,916 10,596 21,466
Marketing and advertising 5,202 13,526 8,105 14,544
Support services 31 21,965 45,662 22,928 46,455
Supplies and external services 31 46,218 90,892 44,221 89,034
Other operating losses / (gains) 152 270 184 354
Taxes 7,304 14,342 7,873 15,659
Provisions and adjustments 32 290 2,050 (9,270) (1,485)
Depreciation, amortisation and impairment losses 7, 8 and 34 98,536 193,829 103,450 206,738
Reestructuring costs 2,980 5,344 2,232 3,840
Losses / (gains) on sale of assets, net (48) (85) 111 70
Other losses / (gains) non recurrent net 647 748 2,171 3,954
326,267 656,419 339,594 683,631
46,544 86,695 48,777 85,739
Net losses / (gains) of affiliated companies 9 and 33 3,288 9,653 (3,622) (8,971)
Financial costs 35 4,682 8,137 6,058 10,969
Net foreign exchange losses / (gains) 508 413 104 107
Net other financial expenses / (income) 35 1,680 3,684 (941) 754
10,158 21,887 1,599 2,859
INCOME BEFORE TAXES 36,386 64,808 47,178 82,880
Income taxes 12 9,931 13,899 6,355 10,658
NET CONSOLIDATED INCOME 26,455 50,909 40,823 72,222
ATTRIBUTABLE TO:
NOS Group Shareholders 26,480 50,896 40,392 71,827
Non-controlling interests 20 (25) 13 431 395
EARNINGS PER SHARES
Basic - euros 36 0.05 0.10 0.08 0.14
Diluted - euros 36 0.05 0.10 0.08 0.14
NOTES
INCOME BEFORE FINANCIAL RESULTS AND TAXES
6M 16 2º QUARTER 17 6M 172º QUARTER 16

34
Consolidated statement of comprehensive income
for the quarters and semesters ended on 30 June 2016 and 2017
(Amounts stated in thousands of euros)
As a standard practice, only the annual accounts are audited, the semestral results are not audited separately.
The Notes to the Financial Statements form an integral part of the consolidated statement of comprehensive
income for the semester ended on 30 June 2017.
Chief Accountant Board of Directors
NET CONSOLIDATED INCOME 26,455 50,909 40,824 72,223
OTHER INCOME
ITENS THAT MAY BE RECLASSIFIED SUBSEQUENTLY TO THE INCOME STATEMENT:
Accounting for equity method 9 (247) (978) (5) (49)
Fair value of interest rate swap 17 (495) (2,507) 607 1,367
Deferred income tax - interest rate swap 17 111 564 (137) (308)
Fair value of equity swaps 17 - - 123 90
Deferred income tax - equity swap 17 - - (28) (20)
Fair value of exchange rate forward 17 246 66 - -
Deferred income tax - exchange rate forward 17 (71) (19) - -
Currency translation differences and others (88) (682) (20) (35)
INCOME RECOGNISED DIRECTLY IN EQUITY (544) (3,556) 540 1,045
TOTAL COMPREHENSIVE INCOME 25,911 47,353 41,364 73,268
ATTRIBUTABLE TO:
NOS Group Shareholders 25,962 47,366 40,933 72,873
Non-controlling interests (51) (13) 431 395
25,911 47,353 41,364 73,268
2nd
QUARTER 17 6M 17NOTES 2nd
QUARTER 16 6M 16

35
Consolidated statement of changes in shareholders’ equity
for the semesters ended on 30 June 2016 and 2017
(Amounts stated in thousands of euros)
As a standard practice, only the annual accounts are audited, the semestral results are not audited separately.
The Notes to the Financial Statements form an integral part of the consolidated statement of changes in
shareholders' equity for the semester ended on 30 June 2017.
Chief Accountant Board of Directors
SHARE
CAPITAL
CAPITAL
ISSUED
PREMIUM
OWN SHARES
DISCOUNTS
AND PREMIUMS
LEGAL
RESERVE
OTHER
RESERVES
AND
ACUMULATED
EARNINGS
NET INCOME
5,152 854,219 (10,559) 3,556 119,004 82,720 9,430 1,063,522
Result appropriation
Transfers to reserves - - - (2,526) 85,246 (82,720) - -
Dividends payed - - - - (82,121) - - (82,121)
Aquisition of own shares 19.3 - - (20,676) - - - - (20,676)
Distribution of own shares - share incentive scheme 19.3 - - 9,518 - (10,279) - - (761)
Distribution of own shares - other remunerations 19.3 - - 2,745 - (211) - - 2,534
Share plan - costs incurred in the period and others 40 - - - - 1,429 - (7) 1,422
Comprehensive Income - - - - (3,556) 50,896 13 47,353
5,152 854,219 (18,971) 1,030 109,512 50,896 9,436 1,011,274
5,152 854,219 (18,756) 1,030 112,031 90,381 9,041 1,053,098
Result appropriation
Transfers to reserves - - - - 90,381 (90,381) - -
Dividends payed - - - - (102,617) - - (102,617)
Distribution of own shares - share incentive scheme 19.3 - - 5,743 - (5,406) - - 337
Distribution of own shares - other remunerations 19.3 - - 285 - (79) - - 206
Share plan - costs incurred in the period and others 40 - - - - 1,388 - 3 1,391
Comprehensive Income - - - - 1,045 71,827 395 73,267
Others - - - - 168 - - 168
5,152 854,219 (12,728) 1,030 96,911 71,827 9,440 1,025,851
BALANCE AS AT 1 JANUARY 2016
BALANCE AS AT 30 JUNE 2016
BALANCE AS AT 1 JANUARY 2017
NOTES
BALANCE AS AT 30 JUNE 2017
NON -
CONTROLLIN
G INTERESTS
TOTAL
ATTRIBUTABLE TO THE SHAREHOLDERS OF THE NOS GROUP

36
Consolidated statement of cash flows
for the semesters ended on 30 June 2016 and 2017
(Amounts stated in thousands of euros)
As a standard practice, only the annual accounts are audited, the semestral results are not audited separately.
The Notes to the Financial Statements form an integral part of the consolidated statement of cash flows for the
semester ended on 30 June 2017.
Chief Accountant Board of Directors
OPERATING ACTIVITIES
Collections from clients 898,806 895,570
Payments to suppliers (628,172) (512,984)
Payments to employees (58,707) (60,089)
Receipts / (Payments) relating to income taxes (5,983) (407)
Other cash receipts / (payments) related with operating activities 46,067 (38,242)
CASH FLOW FROM OPERATING ACTIVITIES (1) 252,011 283,848
INVESTING ACTIVITIES
CASH RECEIPTS RESULTING FROM
Financial investments 9 25,347 -
Tangible assets 982 1,904
Intangible assets 10 39
Available-for-sale financial assets 16 - 29,776
Interest and related income 4,921 2,769
31,260 34,488
PAYMENTS RESULTING FROM
Financial investments 9 (25,347) -
Tangible assets (128,217) (107,245)
Intangible assets (90,399) (87,823)
(243,963) (195,068)
(212,703) (160,580)
FINANCING ACTIVITIES
CASH RECEIPTS RESULTING FROM
Borrowings 303,507 150,000
303,507 150,000
PAYMENTS RESULTING FROM
Borrowings (215,000) (145,027)
Lease rentals (principal) (9,924) (14,394)
Interest and related expenses (16,152) (15,552)
Dividends 19.4 (82,121) (102,617)
Aquisition of own shares 19.3 (20,676) -
(343,873) (277,590)
(40,366) (127,590)
Change in cash and cash equivalents (4) = (1) + (2) + (3) (1,058) (4,322)
Effect of exchange differences (200) 56
Cash and cash equivalents at the beginning of the period (29,348) (13,877)
(30,606) (18,143)
Cash and cash equivalents 18 1,261 2,010
Bank overdrafts 21 (31,867) (20,153)
(30,606) (18,143)
6M 17
CASH FLOW FROM INVESTING ACTIVITIES (2)
CASH FLOW FROM FINANCING ACTIVITIES (3)
CASH AND CASH EQUIVALENTS AT THE END OF THE PERIOD
CASH AND CASH EQUIVALENTS AT THE END OF THE PERIOD
NOTES 6M 16

37
Notes to the consolidated financial statements as at 30 June 2017
(Amounts stated in thousands of euros, unless otherwise stated)
1. Introductory note
NOS, SGPS, S.A. ("NOS", “NOS SGPS” or "Company"), formerly named ZON OPTIMUS, SGPS, S.A. (“ZON
OPTIMUS”) and until 27 August 2013 named ZON Multimédia – Serviços de Telecomunicações e Multimédia,
SGPS, S.A. (“ZON”), with Company headquarters registered at Rua Actor António Silva, nº9, Campo Grande,
was established by Portugal Telecom, SGPS, S.A. ("Portugal Telecom") on 15 July 1999 for the purpose of
implementing its multimedia business strategy.
During the 2007 financial year, Portugal Telecom proceeded with the spin-off of ZON through the attribution of
its participation in the company to their shareholders, which became fully independent from Portugal
Telecom.
During the 2013 financial year, ZON and Optimus, SGPS, S.A. ("Optimus SGPS") have merged through the
incorporation of Optimus SGPS into ZON. Thereafter, the Company adopted the designation of ZON OPTIMUS,
SGPS, S.A..
On 20 June 2014, as a result of the launch of the new brand “NOS” on 16 May 2014, the General Meeting of
Shareholders approved the change of the Company’s name to NOS, SGPS, S.A..
The businesses operated by NOS and its associated companies, form the "NOS Group" or "Group", which
includes cable and satellite television services, voice and Internet access services, video production and sale,
advertising on Pay TV channels, cinema exhibition and distribution, the production of channels for Pay TV,
management of data centers and consulting services in IT.
NOS shares are listed on the Euronext Lisbon market. The Group’s shareholder structure as at 30 June 2017 is
shown in Note 19.
Cable and satellite television in Portugal is mainly provided by NOS Comunicações, S.A. (“NOS SA”) and its
subsidiaries, NOS Açores and NOS Madeira. These companies carry out: a) cable and satellite television
distribution; b) the operation of the latest generation mobile communication network, GSM/UMTS/LTE; c) the
operation of electronic communications services, including data and multimedia communication services in
general; d) IP voice services ("VOIP" - Voice over IP); e) Mobile Virtual Network Operator (“MVNO”), and f) the
provision of consultancy and similar services directly or indirectly related to the above mentioned activities
and services. The business of NOS SA, NOS Açores and NOS Madeira is regulated by Law no. 5/2004 (Electronic
Communications Law), which establishes the legal regime governing electronic communications networks
and services.
NOSPUB and NOS Lusomundo TV operate in the television and content production business, and currently
produce films and series channels, which are distributed, among other operators, by NOS SA and its

38
subsidiaries. NOSPUB also manages the advertising space on Pay TV channels and in the cinemas of NOS
Cinemas.
NOS Audiovisuais and NOS Cinemas, together with their associated companies, operate in the audiovisual
sector, which includes video production and sale, cinema exhibition and distribution, and the
acquisition/negotiation of Pay TV and VOD (video-on-demand) rights.
NOS Sistemas is a company dedicated to data center management and consulting services in IT.
NOS Inovação main activities are conducting and stimulating scientific activities of R&D (it owns all the
intellectual property developed within the NOS Group, intending to guarantee the return of the initial
investment through the commercialization of patents and concessions regarding commercial operation, as a
result of the creation of new products and services), the demonstration, disclosure, technology and training
transfers in the services and information management domains as well as fixed and mobile solutions of the
latest generation of TV, internet, voice and data solutions.
A listing of the other Group companies and their respective business is included in this report. (Annexes)
The notes of this annex follow the same sequence in which the items appear in the consolidated financial
statements.
The consolidated financial statements for the semester ended on 30 June 2017 were approved by the Board
of Directors and their issue authorised on 20 July 2017.
The Board of Directors believe that the financial statements give a true and fair view of the Company’s
operations, financial performance and cash flows.
2. Accounting policies
The principal accounting policies adopted in the preparation of the financial statements are described below.
These policies were consistently applied to all the financial years presented, unless otherwise indicated.
2.1. Principles of presentation
The consolidated financial statements of NOS were prepared in accordance with the International Financial
Reporting Standards (“IFRS”) issued by the International Accounting Standards Board (“IASB”), and
Interpretations issued by the International Financial Reporting Committee (“IFRIC”) or by the previous Standing
Interpretations Committee (“SIC”), adopted by the European Union, in force as at 1 January 2017.
These consolidated financial statements have been prepared in accordance with IAS 34 Interim Financial
Reporting ("IAS 34"). Accordingly, these financial statements do not include all the information required by IFRS
and should be read in conjunction with the consolidated financial statements for the year ended on 31
December 2016.

39
The consolidated financial statements are presented in euros as this is the main currency of the Group's
operations. The financial statements of subsidiaries located abroad were converted into euros in accordance
with the accounting policies described in Note 2.3.19.
The consolidated financial statements were prepared on a going concern basis from the ledgers and
accounting records of the companies included in the consolidation (Annex A)), using the historical cost
convention, adjusted where necessary for the valuation of financial assets and liabilities (including derivatives)
at their fair value (Note 2.3.22).
In preparing the consolidated financial statements in accordance with IFRS, the Board used estimates,
assumptions and critical judgments with impact on the value of assets and liabilities and the recognition of
income and costs in each reporting period. Although these estimates were based on the best information
available at the date of preparation of the consolidated financial statements, current and future results may
differ from these estimates. The areas involving a higher element of judgment and estimates are described in
Note 3.
In the preparation and presentation of the consolidated financial statements, the NOS Group declares that it
complies explicitly and without reservation with IAS/IFRS reporting standards and related SIC/IFRIC
interpretations as approved by the European Union.
Changes in accounting policies and disclosures
The following standards and interpretations, with mandatory application in future financial years endorsed by
the European Union, at the date of approval of these financial statements:
IFRS 9 (new), “Financial instruments – classification and measurement” (effective for annual periods
beginning on or after 1 January 2018). The initial phase of IFRS 9 forecasts two types of measurement:
amortised cost and fair value. All equity instruments are measured at fair value. A financial instrument is
measured at amortised cost only if the company has it to collect contractual cash flows and the cash
flows represents principal and interest. Otherwise, financial instruments are valued at fair value through
profit and loss.
IFRS 15 (new), “Revenue from Contracts with Customers” (effective for annual periods beginning on or
after 1 January 2018). This standard establishes a single, comprehensive framework for revenue
recognition. The framework will be applied consistently across transactions, industries and capital markets,
and will improve comparability in the ‘top line’ of the financial statements of companies globally. IFRS 15
replaces the following standards and interpretations: IAS 18 Revenue, IAS 11 Construction Contracts, IFRIC
13 Customer Loyalty Programmes, IFRIC 15 Agreements for the Construction of Real Estate, IFRIC 18
Transfers of Assets from Customers and SIC-31 Revenue — Barter Transactions Involving Advertising Services.
The Group is calculating the impact of these changes and will apply these standards as soon as they become
effective.

40
The following standards, interpretations, amendments and revisions, have not yet been endorsed by the
European Union, at the date of approval of these financial statements:
IFRS 14 (new), “Regulatory Deferral Accounts” (effective for annual periods beginning on or after 1 January
2016). This standard’s main purpose is to improve comparability of financial reports for companies in
regulated markets, allowing the companies that currently record assets and liabilities in result of the
regulation from the markets where they operate, in accordance with the adopted accounting principles,
to not have the need to eliminate those assets and liabilities in the first time adoption of the IFRS. The
endorsement by the European Union is suspended.
IAS 7 (amendment), "Cash Flow Statements" (effective for annual periods beginning on or after 1 January
2017). This standard requires that the entity discloses information about changes in liabilities related to
financing activities, including: (i) changes in financing cash flows; (ii) changes resulting from obtaining or
losing control of subsidiaries or other businesses; (iii) the effect of changes in exchange rates; (iv) fair value
changes; and (v) other changes.
IAS 12 (amendment), “Recognition of deferred tax assets of unrealised losses” (effective for annual periods
beginning on or after 1 January 2017). The amendments clarify when it should be recognized an asset for
deferred tax arising from unrealised losses.
Improvements in International Financial Reporting Standards (2014-2016 cycle effective for periods
beginning on or after 1 January 2017/2018). These improvements involve the review of various standards.
These amendments will have no material impact on the consolidated financial statements.
The following standards, interpretations, amendments and revisions, with mandatory application in future
financial years have not yet been endorsed by the European Union, at the date of approval of these financial
statements:
IFRS 2 (amendment), “Classification and measurement of share-based payments transactions” (effective
for annual periods beginning on or after 1 January 2018). These amendments incorporate in the standard
guidance regarding the treatment of payments based on shares and settled in cash, which follow the
same approach of payments based and settled in shares.
IFRS 4 (amendment), “Applying IFRS 9 Financial Instruments with IFRS 4 Insurance Contracts” (effective for
annual periods beginning on or after 1 January 2018). The amendments complement the current options in
the standard that can be used to bridge the concern related with the temporary volatility of the results.
IFRS 10 and IAS 28 (amendments), “Sale or Contribution of Assets between an Investor and its Associate or
Joint Venture” (effective date to be designated). The amendments address an acknowledged
inconsistency between the requirements in IFRS 10 and those in IAS 28, in dealing with the sale or
contribution of assets between an investor and its associate or joint venture.

41
IFRS 15 (clarification), “Revenue from contracts with customers" (effective for annual periods beginning on
or after 1 January 2018). The clarifications presented are about the transition and not about changes in the
underlying principles of the standard.
IFRS 16 (new), “Leasings” (effective for annual periods beginning on or after 1 January 2019, with early
application option). This standard sets out recognition, presentation and disclosure of leasing contracts,
defining a single accounting model. Aside from contracts shorter than 12 months, leases should be
accounted as an asset and a liability.
IFRS 17 (new), “Insurance Contracts” (effective for annual periods beginning on or after 1 January 2021).
IFRS 17 establishes the principles for the recognition and measurement of insurance contracts to ensure
consistency across companies who issue insurance contracts globally.
IAS 40 (amendment), “Investment property transfers” (effective for annual periods beginning on or after 1
January 2018). The amendments clarify if a property under construction or development, which was
previously classified as Inventories, can be transferred to investment property when there is an evident
change in use.
IFRIC 22 (interpretation), “Foreign currency transactions and advance consideration” (effective for periods
beginning on or after 1 January 2018). Interpretations clarify the accounting for transactions that include
the receipt or payment of advance consideration in a foreign currency.
IFRIC 23 (interpretation), “Uncertainty over income tax treatments” (effective for annual periods beginning
in or after 1 January 2019) ). The interpretation is to be applied to the determination of taxable profit (tax
loss), tax bases, unused tax losses, unused tax credits and tax rates, when there is uncertainty over income
tax treatments under IAS 12. The interpretation does not apply to taxes or levies outside the scope of IAS
12, nor does it specifically include requirements relating to interest and penalties associated with uncertain
tax treatments.
The Group is calculating the impact of these changes and will apply these standards as soon as they become
effective, or previously when permitted.
2.2. Bases of consolidation
Controlled companies
Controlled companies were consolidated by the full consolidation method. Control is deemed to exist when
the Group is exposed or has rights, as a result of their involvement, to a variable return of the entity's activities,
and has capacity to affect this return through the power over the entity. Namely, when the Company directly
or indirectly holds a majority of the voting rights at a General Meeting of Shareholders or has the power to
determine the financial and operating policies. In situations where the Company has, in substance, control of
other entities created for a specific purpose, although it does not directly hold equity in them, such entities are
consolidated by the full consolidation method. The entities in these situations are listed in Annex A).

42
The interest of third parties in the equity and net profit of such companies’ income is presented separately in
the consolidated statement of financial position and in the consolidated statement, respectively, under the
item “Non-controlling Interests” (Note 20).
The identifiable acquired assets and the liabilities and contingent liabilities assumed in a business combination
are measured initially at fair value at the acquisition date, irrespective of the existence of non-controlled
interests. The excess of acquisition cost over the fair value of the Group’s share of identifiable acquired assets
and liabilities is stated in Goodwill. Where the acquisition cost is less than the fair value of the identified net
assets, the difference is recorded as a gain in the income statement of the period in which the acquisition
occurs.
The interests of minority shareholders are initially recognised at their proportion of the fair value of the
identifiable assets and liabilities.
On the acquisition of additional equity shares in companies already controlled by the Group, the difference
between the share of capital acquired and the corresponding acquisition value is recognised directly in
equity.
Where an increase in position in the capital of an associated company results in the acquisition of control, with
the latter being included in the consolidated financial statements by the full consolidation method, the share
of the fair values assigned to the assets and liabilities, corresponding to the percentages previously held, is
considered as part of the purchase price, with the difference between the accounting value of the position in
the associated company and the fair value of said position being recognised in the income statement.
The directly attributable transaction costs are recognised immediately in profit or loss.
The results of companies acquired or sold during the year are included in the income statements as from the
date of acquisition or until the date of their disposal, respectively.
Intercompany transactions, balances, unrealised gains on transactions and dividends distributed between
Group companies are eliminated. Unrealised losses are also eliminated unless the transaction shows evidence
of impairment of the transferred asset.
Where necessary, adjustments are made to the financial statements of controlled companies in order to align
their accounting policies with those of the Group.
Jointly controlled companies
The classification of investments as jointly controlled companies is determined based on the existence of
shareholder agreements which show and regulate the joint control. Financial investments of jointly controlled
companies (Annex C)) are stated by the equity method. Under this method, financial investments are adjusted
periodically by an amount corresponding to the share in the net profits of jointly controlled companies, as a
contra entry in “Losses / (gains) of affiliated companies” in the income statement before financial results and
taxes. Direct changes in the post-acquisition equity of jointly controlled companies are recognised as the
value of the shareholding as a contra entry in reserves, in equity.

43
Additionally, financial investments may also be adjusted for recognition of impairment losses.
Any excess of acquisition cost over the fair value of identifiable net assets and liabilities (goodwill) is recorded
as part of the financial investment of jointly controlled companies and subject to impairment testing when
there are indicators of loss of value. Where the acquisition cost is less than the fair value of the identified net
assets, the difference is recorded as a gain in the income statement in the period in which the acquisition
occurs.
Losses in jointly controlled companies which exceed the investment made in them are not recognised, except
where the Group has entered into undertakings with that company.
Dividends received from these companies are recorded as a reduction in the value of the financial
investments.
Associated companies
An associated company is a company in which the Group exercises significant influence through participation
in decisions about its financial and operating policies, but in which does not have control or joint control.
Any excess of the acquisition cost of a financial investment over the fair value of the identifiable net assets is
recorded as goodwill and is added to the value of the financial investment and its recovery is reviewed
annually or whenever there are indications of possible loss of value. Where the acquisition cost is less than the
fair value of the identified net assets, the difference is recorded as a gain in the statement of comprehensive
income in the period in which the acquisition occurs.
Financial investments of associated companies (Annex B)) are stated by the equity method. Under this
method, financial investments are adjusted periodically by an amount corresponding to the share in the net
profits of associated companies, as a contra entry in “Losses / (gains) of affiliated companies” in the income
statement. Direct changes in the post-acquisition equity of associated companies are recognised as the value
of the shareholding as a contra entry in reserves, in equity. Additionally, financial investments may also be
adjusted for recognition of impairment losses.
Losses in associated companies which exceed the investment made in them are not recognised, except
where the Group has entered into undertakings with that associated company.
Dividends received from these companies are recorded as a reduction in the value of the financial
investments.
Balances and transactions between group companies
Balances and transactions as well as unrealised gains between Group companies, and between them and
the parent company, are eliminated in the consolidation.
The part of unrealised gains arising from transactions with associated companies or jointly controlled
companies attributable to the Group is eliminated in the consolidation. Unrealised losses are similarly
eliminated except where they show evidence of impairment of the transferred asset.

44
2.3. Accounting policies
2.3.1. Segment reporting
As stipulated in IFRS 8, the Group presents operating segments based on internally produced management
information.
Operating segments are reported consistently with the internal management information model provided to
the chief operating decision maker of the Group, who is responsible for allocating resources to the segment
and for assessing its performance, and for taking strategic decisions.
2.3.2. Classification of the statement of financial position and income statement
Realisable assets and liabilities due in less than one year from the date of the statement of financial position
are classified as current in assets and liabilities, respectively.
In accordance with IAS 1, "Restructuring costs", "Losses / (gains) on disposal of assets " and "Other losses /
(gains)” reflect unusual expenses that should be disclosed separately from the usual lines items, to avoid
distortion of the financial information from regular operations.
2.3.3. Tangible assets
Tangible assets are stated at acquisition cost, less accumulated depreciation and impairment losses, where
applicable. Acquisition cost includes, in addition to the purchase price of the asset: (i) costs directly
attributable to the purchase; and (ii) the estimated costs of decommissioning and removal of the assets and
restoration of the site, which in Group applies to the cinema operation business, telecommunication towers
and offices (Notes 2.3.12 and Note 7).
Estimated losses resulting from the replacement of equipment before the end of its useful life due to
technological obsolescence are recognised by a deduction from the corresponding asset as a contra entry in
profit and loss. The costs of current maintenance and repairs are recognised as a cost when they are incurred.
Significant costs incurred on renovations or improvements to the asset are capitalised and depreciated over
the corresponding estimated payback period when it is probable that there will be future economic benefits
associated with the asset and when these can be measured reliably.
Non-current assets held for sale
Non-current assets (or discontinued operations), are classified as held for sale if their value is realisable through
a sale transaction rather than through their continued use.
This situation is deemed to arise only where: (i) the sale is highly probable and the asset is available for
immediate sale in its present condition; (ii) the Group has given an undertaking to sell; and (iii) it is expected
that the sale will be realised within 12 months. In this case, non-current assets are valued at the lesser of their
book value or their fair value less the sale costs.
From the time that certain tangible assets become deemed as “held for sale”, the depreciation of such assets
ceases and they are classified as non-current assets held for sale. Gains and losses on disposals of tangible

45
assets, corresponding to the difference between the sale price and the net book value, are recognised in
results in “Losses / (gains) on disposals of assets”.
Depreciation
Tangible assets are depreciated from the time they are completed or ready to be used. These assets, less their
residual value, are depreciated by the straight-line method, in twelfths, from the month in which they become
available for use, according to the useful life of the assets defined as their estimated utility.
The depreciation rates used correspond to the following estimated useful lives:
2.3.4. Intangible assets
Intangible assets are stated at acquisition cost, less accumulated amortisation and impairment losses, where
applicable. Intangible assets are recognised only where they generate future economic benefits for the
Group and where they can be measured reliably.
Intangible assets consist mainly of goodwill, satellite and distribution network capacity utilisation rights,
customer portfolios, costs incurred in raising customers’ loyalty contracts, telecom and software licenses,
content utilisation rights and other contractual rights.
Goodwill
Goodwill represents the excess of acquisition cost over the net fair value of the assets, liabilities and contingent
liabilities of a subsidiary, jointly controlled company or associated company at the acquisition date, in
accordance with IFRS 3.
Goodwill is recorded as an asset and included in “Intangible assets” (Note 8) in the case of a controlled
company or in the case in which the excess of cost has been originated by a merger, and in “Financial
investments in group companies” (Note 9) in the case of a jointly controlled company or an associated
company.
Goodwill is not amortised and is subject to impairment tests at least once a year, on a specified date, and
whenever there are changes in the test’s underlying assumptions at the date of the statement of financial
position which may result in a possible loss of value. Any impairment loss is recorded immediately in the income
statement in “Impairment losses” and is not liable to subsequent reversal.
2016 2017
(YEARS) (YEARS)
Buildings and other constructions 2 - 50 2 - 50
Technical equipment:
Network Installations and equipment 7 - 40 7 - 40
Terminal equipment 2 - 8 2 - 8
Other telecommunication equipment 3 - 10 3 - 10
Other technical equipment 1 - 16 1 - 16
Transportation equipment 3 - 4 3 - 4
Administrative equipment 2 - 10 2 - 10
Other tangible assets 4 - 8 4 - 8

46
For the purposes of impairment tests, goodwill is attributed to the cash-generating units to which it is related
(Note 8), which may correspond to the business segments in which the Group operates, or a lower level.
Internally generated intangible assets
Internally generated intangible assets, including expenditure on research, are expensed when they are
incurred. Research and development costs are only recognised as assets where the technical capability to
complete the intangible asset is demonstrated and where it is available for use or sale.
Industrial property and other rights
Assets classified under this item relate to the rights and licenses acquired under contract by the Group to third
parties and used in realising the Group's activities, and include:
Satellite capacity utilisation rights;
Distribution network utilisation rights;
Telecom licenses;
Software licenses;
Customer portfolios;
Costs incurred in raising customers’ loyalty contracts (i.e. commissions incurred in customer acquisition,
portability costs, negative margin in equipment sales, etc.);
Content utilisation rights;
Other contractual rights.
The signing of contracts related with sports content originate rights that are, initially, classified as contractual
commitments.
The content exploration rights are recorded in the consolidated statement of financial position, as intangible
assets, where the following conditions are fulfilled: (i) there is control over the content, (ii) the Company has
the right to choose the way to explore the content and (iii) it is available for exhibition.
In the specific case of broadcasting rights of sports competitions, these are recognised as assets where the
necessary conditions to organize each sports competition are present, which occurs in the homologation date
of the participating teams in the competition that is being held in the sports season to be initiated, by the
organizing entity, taking into consideration that it is from that date that the conditions for the recognition of an
asset are present, namely, the unequivocal attainment of the exploration rights of the games of the stated
season. In this situation, the stated rights are recognised in the income statement in “Depreciation, amortisation
and impairment losses”, by the linear method, by twelfths, starting from the beginning of the month in which
they are available for use.

47
Intangible assets in-progress
Group companies periodically carry out an impairment assessment of intangible assets in-progress. This
impairment assessment is also carried out whenever events or changes in circumstances indicate that the
amount at which the asset is recorded may not be recoverable. Where such indications exist, the Group
calculates the recoverable value of the asset in order to determine the existence and extent of the
impairment loss.
Amortisation
These assets are amortised by the straight-line method, in twelfths, from the beginning of the month in which
they become available for use.
The amortisation rates used correspond to the following estimated useful lives:
2.3.5. Impairment of non-current assets, excluding goodwill
Group companies periodically carry out an impairment assessment of non-current assets. This impairment
assessment is also carried out whenever events or changes in circumstances indicate that the amount at
which the asset is recorded may not be recoverable.
Where such indications exist, the Group calculates the recoverable value of the asset in order to determine
the existence and extent of the impairment loss.
The recoverable value is estimated for each asset individually or, if that is not possible, assets are grouped at
the lowest levels for which there are identifiable cash flows to the cash-generating unit to which the asset
belongs. Each of the Group’s businesses is a cash-generating unit, except for the assets allocated to the
cinema exhibition business which are grouped into regional cash-generating units.
The recoverable amount is calculated as the higher of the net sale price and the current use value. The net
sale price is the amount that would be obtained from the sale of the asset in a transaction between
independent and knowledgeable entities, less the costs directly attributable to the sale. The current use value
is the current value of the estimated future cash flows resulting from continued use of the asset or of the cash-
generating unit. Where the amount at which the asset is recorded exceeds its recoverable value, it is
recognised as an impairment loss.
2016 2017
(YEARS) (YEARS)
Rights of using capacities Period of the
contract
Period of the
contract
Telecom licences 30 to 33 30 to 33
Software licences 1 to 8 1 to 8
Customer portfolios 5 to 6 5 to 6
Costs incurred in raising costumers loyalty contractsLoyalty contract
period
Loyalty contract
period
Content utilization rights Period of the
contract
Period of the
contract
Others 1 to 8 1 to 8

48
The reversal of impairment losses recognised in previous years is recorded when there are indications that
these losses no longer exist or have decreased. The reversal of impairment losses is recognised in the statement
of comprehensive income in the year in which it occurs. However, an impairment loss can only be reversed up
to the amount that would be recognised (net of amortisation or depreciation) if no impairment loss had been
recorded in previous years.
2.3.6. Financial assets
Financial assets are recognised in the statement of financial position of the Group on the trade or contract
date, which is the date on which the Group undertakes to purchase or sell the asset.
Initially, financial assets are recognised at their fair value plus directly attributable transaction costs, except for
assets at fair value through profit or loss where transaction costs are recognised immediately in profit or loss.
These assets are derecognised when: (i) the Group’s contractual rights to receive their cash flows expire; (ii)
the Group has substantially transferred all the risks and benefits associated with their ownership; or (iii) although
it retains part but not substantially all of the risks and benefits associated with their ownership, the Group has
transferred control of the assets.
Financial assets and liabilities are offset and shown as a net value when, and only when, the Group has the
right to offset the recognised amounts and intends to settle for the net value.
The Group classifies its financial assets into the following categories: financial investments at fair value through
profit or loss, financial assets available for sale, investments held to maturity and borrowings and receivables.
The classification depends on management’s intention at the time of their acquisition.
Financial assets at fair value through profit and loss
This category includes non-derivative financial assets acquired with the intention of selling them in the short
term. This category also includes derivatives that do not qualify for hedge accounting purposes. Gains and
losses resulting from changes in the fair value of assets measured at fair value through profit or loss are
recognised in results in the year in which they occur under “Losses / (gains) on financial assets”, including the
income from interest and dividends.
Financial assets available for sale
Financial assets available for sale are non-derivative financial assets which: (i) are designated as available for
sale at the time of their initial recognition; or (ii) do not fit into the other categories of financial assets above.
They are recognised as non-current assets except where there is an intention to sell them within 12 months
following the date of the statement of financial position.
Shareholdings other than shares in Group companies, jointly controlled companies or associated companies
are classified as financial investments available for sale and are recognised in the statement of financial
position as non-current assets.

49
Investments are initially recognised at their acquisition cost. After initial recognition, investments available for
sale are revalued at their fair value by reference to their market value at the date of the statement of financial
position, without any deduction for transaction costs that may occur until their sale. In situations where
investments are equity instruments not listed on regulated markets and for which it is not possible to reliably
estimate their fair value, they are maintained at acquisition cost less any impairment losses.
The potential resulting capital gains and losses are recognised directly in reserves until the financial investment
is sold, received or otherwise disposed of, at which time the accumulated gain or loss previously recognised in
equity is included in the income statement.
Dividends on equity instruments classified as available for sale are recognised in results for the year under
“Losses / (gains) on financial assets”, where the right to receive the payment is established.
Investments held to maturity
Investments held to maturity are classified as non-current investments except where they mature in less than 12
months from the date of the statement of financial position. This item includes investments with defined
maturities which the Group has the intention and ability to keep until that date. Investments held to maturity
are valued at amortised cost, less any impairment losses.
Borrowing and receivables
The assets classified in this category are non-derivative financial assets with fixed or determinable payments
not listed on an active market.
Accounts receivable are initially recognised at fair value and subsequently valued at amortised cost, less
adjustments for impairment, where applicable. Impairment losses on customers and accounts receivable are
recorded where there is objective evidence that they are not recoverable under the initial terms of the
transaction. The identified impairment losses are recorded in the income statement under “Provisions and
adjustments”, and subsequently reversed by results, when the impairment indicators reduce or cease to exist.
Cash and cash equivalents
The amounts included in “Cash and cash equivalents” correspond to the amounts of cash, bank deposits,
term deposits and other investments with maturities of less than three months which may be immediately
realisable and with a negligible risk of change of value.
For the purposes of the statement of cash flows, “Cash and cash equivalents” also includes bank overdrafts
included in the statement of financial position under “Borrowings” (where applicable).
2.3.7. Financial liabilities and equity instruments
Financial liabilities and equity instruments are classified according to their contractual substance irrespective
of their legal form. Equity instruments are contracts that show a residual interest in the Group’s assets after
deducting the liabilities. The equity instruments issued by Group companies are recorded at the amount

50
received, net of the costs incurred in their issue. Financial liabilities and equity instruments are recognised only
when extinguished, i.e. when the obligation is settled, cancelled or extinguished.
Borrowings
Loans are stated as liabilities at their nominal value, net of the issuance costs of the loans. Financial charges,
calculated in accordance with the effective rate of interest, including premiums payable, are recognised in
accordance with the accruals principle.
Accounts payable
Accounts payable are recognised initially at their fair value and subsequently at amortised cost in
accordance with the effective interest rate method. Accounts payable are recognised as current liabilities
unless they are expected to be settled within 12 months from the date of the statement of financial position.
Derivative financial instruments
See accounting policy 2.3.9.
2.3.8. Impairment of financial assets
At the date of each statement of financial position, the Group examines whether there is objective evidence
that a financial asset or group of financial assets is impaired.
Financial assets available for sale
In the case of financial assets classified as available for sale, a significant or prolonged decline in the fair value
of the instrument below its cost is considered as an indicator that the instrument is impaired. If any similar
evidence exists for financial assets classified as available for sale, the accumulated loss – measured as the
difference between the acquisition cost and the current fair value, less any impairment of the financial asset
that has already been recognised in results – is removed from equity and recognised in the income statement.
Impairment losses on equity instruments recognised in results are not reversed through the income statement.
Customers, other debtors and other financial assets
Adjustments are made for impairment losses when there are objective indications that the Group will not
receive all the amounts to which it is entitled under the original terms of the contracts. Various indicators are
used to identify impairment situations, such as default analysis, financial difficulties of the debtor, including
probability of insolvency of the debtor.
The adjustment for impairment losses is calculated as the difference between the recoverable value of the
financial asset and its value in the statement of financial position and is stated in profit and loss for the year.
The value of these assets in the statement of financial position is reduced to the recoverable amount by
means of an adjustments account. When an amount receivable from customers and other debtors is
considered non recoverable, it is written off using the adjustments account for impairment losses. The
subsequent recovery of amounts that have been written off is recognised in profit and loss.

51
When there are receivables from customers or other debtors that are overdue, and these are subject to
renegotiation of their terms, these are no longer regarded as overdue and become treated as new
receivables.
2.3.9. Derivative financial instruments
The Group has a policy of contracting derivative financial instruments with the objective of hedging the
financial risks to which it is exposed, resulting from variations in exchange rates and interest rates. The Group
does not contract derivative financial instruments for speculative purposes, and the use of this type of financial
instruments complies with the internal policies determined by the Board.
In relation to financial derivative instruments which, although contracted in order to provide hedging in line
with the Group’s risk management policies, do not meet all the requirements of IAS 39 – Financial instruments:
recognition and measurement in terms of their classification as hedge accounting or which have not been
specifically assigned to a hedge relationship, the related changes in fair value are stated in the income
statement for the period in which they occur.
Derivative financial instruments are recognised on the respective trade date at their fair value. Subsequently,
the fair value of the derivative financial instruments is revalued on a regular basis, and the gains or losses
resulting from this revaluation are recorded directly in profit and loss for the period, except in the case of
hedge derivatives. Recognition of the changes in fair value of hedge derivatives depends on the nature of the
risk hedged and the type of hedge used.
Hedge accounting
The possibility of designating a derivative financial instrument as a hedging instrument meets the requirements
of IAS 39 - Financial instruments: recognition and measurement.
Derivative financial instruments used for hedging purposes can be classified as hedges for accounting
purposes where they cumulatively meet the following conditions:
a) At the start date of the transaction, the hedge relationship is identified and formally documented,
including the identification of the hedged item, the hedging instrument and the evaluation of
effectiveness of the hedge;
b) There is the expectation that the hedge relationship is highly effective at the start date of the transaction
and throughout the life of the operation;
c) The effectiveness of the hedge can be reliably measured at the start date of the transaction and
throughout the life of the operation;
d) For cash flow hedge operations, it must be highly probable that they will occur.
Exchange rate and interest rate risk
Where expectations of changes in exchange rates and interest rates so warrant, the Group aims to anticipate
any adverse impact through the use of derivatives. Operations that qualify as cash flow hedging instruments

52
are stated in the statement of financial position at their fair value and, where they are considered to be
effective hedges, the changes in the fair value of the instruments are initially stated as a contra entry in equity
and subsequently reclassified as financial costs.
Where hedge transactions are ineffective, they are stated directly in profit and loss. Accordingly, in net terms
the cash flows associated with the hedged operations are accrued at the rate applying to the contracted
hedge operation.
When a hedge instrument expires or is sold, or when the hedge ceases to fulfil the criteria required for hedge
accounting, the accumulated variations in the fair value of the derivative in reserves are shown in profit and
loss when the operation hedged also affects profit and loss.
2.3.10. Inventories
Inventories, which mainly include mobile phones, customer terminal equipment, DVDs and content
broadcasting rights are valued at the lower of their cost or net realisable value.
The acquisition cost includes the invoice price, freight and insurance costs, using the weighted average cost
as the method of costing goods sold.
Inventories are adjusted for technological obsolescence, as well as for the difference between the purchase
cost and the net realisable value, whichever is the lower, and this reduction is recognised directly in the
income statement.
The net realisable value corresponds to the normal sale price less restocking costs and selling costs.
The differences between the cost and the corresponding net realisable value of inventories, where this is less
than the cost, are recorded as operating costs in “Cost of goods sold”.
Inventories in transit, since they are not available for consumption or sale, are separated out from other
inventories and are valued at their specific acquisition cost.
The signing of contracts related with sports content originate rights that are, initially, classified as contractual
commitments.
The content broadcasting rights are recorded in the consolidated statement of financial position, as
Inventories, in the event of the nonexistence of full right over the way of exploration of the asset, by the
respective value of cost or net realisable value, whenever it is lower, where programmatic content has been
received and is available for exhibition or use, according to contractual conditions, given that the necessary
conditions for the organization of each sports competition are present, which occurs in the homologation date
of the participating teams in the competition that is being held in the sports season to be initiated, by the
organizing entity. The stated rights are recognised in the income statement in “Direct costs: Exhibition costs”,
on a systematic basis given the pattern of economic benefits obtained through their commercial exploration.
Due to the agreement between the three national operators of reciprocal availability, for several sports
seasons, of sports content (national and international) owned by them (Note 37), NOS considered the

53
recognition of the costs, excluding those divided by the remaining operators, on a systematic basis, given the
pattern of economic benefits obtained through their commercial exploration.
2.3.11. Subsidies
Subsidies are recognised at their fair value where there is a reasonable assurance that they will be received
and Group companies will meet the requirements for their award.
Operating subsidies, mainly for employee training, are recognised in the statement of comprehensive income
by deduction from the corresponding costs incurred.
Investment subsidies are recognised in the statement of financial position as deferred income.
If the subsidy is considered as deferred income, it is recognised as income on a systematic and rational basis
during the useful life of the asset.
2.3.12. Provisions and contingent liabilities
Provisions are recognised where: (i) there is a present obligation arising from past events and it is likely that in
settling that obligation the expenditure of internal resources will be necessary; and (ii) the amount or value of
such obligation can be reasonably estimated. Where one of the above conditions is not met, the Group
discloses the events as a contingent liability unless the likelihood of an outflow of funds resulting from this
contingency is remote, in which case they are not disclosed.
Provisions for legal procedures taking place against the Group are made in accordance with the risk
assessments carried out by the Group and by their legal advisers, based on success rates.
Provisions for restructuring are only recognised where the Group has a detailed, formal plan identifying the
main features of the restructuring programme and after these facts have been reported to the entities
involved.
Provisions for dismantling costs, removal of assets and restoration of the site are recognised when the assets
are installed, in line with the best estimates available at that date. The amount of the provisioned liability
reflects the effects of the passage of time and the corresponding financial indexing is recognised in results as a
financial cost.
Obligations that result from onerous contracts are registered and measured as provisions. There is an onerous
contract when the Company is an integral part of the provisions of an agreement contract, which entail costs
that cannot be avoided and which exceed the economic benefits derived from the agreement.
Provisions for potential future operating losses are not covered.
Contingent liabilities are not recognised in the financial statements, unless the exception provided under IFRS 3
business combination, and are disclosed whenever there is a good chance to shed resources including
economic benefits. Contingent assets are not recognised in the financial statements, being disclosed when
there is a likelihood of a future influx of financial resources.

54
Provisions are reviewed and brought up to date at the date of the statement of financial position to reflect the
best estimate at that time of the obligation concerned.
2.3.13. Leases
Leasing contracts are classified as: (i) finance leases, if substantially all the risks and benefits incident to
ownership of the corresponding assets concerned have been transferred; or (ii) operating leases, if
substantially all risks and rewards incident to ownership of those assets have not been transferred.
The classification of leases as finance or operating leases is made on the basis of substance rather than
contractual form.
The assets acquired under finance leases and the corresponding liabilities are recorded using the financial
method, and the assets, related accumulated depreciation and pending debts are recorded in accordance
with the contractual finance plan. In addition, the interest included in the rentals and the depreciation of the
tangible and intangible assets are recognised in the income statement for the period to which they relate.
In the case of operating leases, the rentals due are recognised as costs in the income statement over the
period of the leasing contract.
2.3.14. Income tax
NOS is covered by the special tax regime for groups of companies, which covers all the companies in which it
directly or indirectly owns at least 75% of the share capital and which simultaneously are resident in Portugal
and subject to Corporate Income Tax (IRC).
The remaining subsidiaries not covered by the special tax regime for groups of companies are taxed
individually on the basis of their respective taxable incomes and the applicable tax rates.
Income tax is stated in accordance with the IAS 12 criteria. In calculating the cost relating to income tax for
the period, in addition to current tax, allowance is also made for the effect of deferred tax calculated in
accordance with the liability method, taking into account the temporary differences resulting from the
difference between the tax basis of assets and liabilities and their values as stated in the consolidated financial
statements, and the tax losses carried forward at the date of the statement of financial position. The deferred
income tax assets and liabilities were calculated on the basis of the tax legislation currently in force or of
legislation already published for future application.
As stipulated in the above standard, deferred income tax assets are recognised only where there is
reasonable assurance that these may be used to reduce future taxable profit, or where there are deferred
income tax liabilities whose reversal is expected to occur in the same period in which the deferred income tax
assets are reversed. At the end of each period an assessment is made of deferred income tax assets, and
these are adjusted in line with the likelihood of their future use.
55
The amount of tax to be included either in current tax or in deferred tax resulting from transactions or events
recognised in equity accounts is recorded directly under those items and does not affect the results for the
period.
In a business combination the deferred tax benefits acquired are recognised as follows:
a) The deferred tax benefits acquired recognised in the measurement period of one year after the date of
merger and that result from new information about facts and circumstances that existed at the date of
acquisition are recorded against the goodwill carrying amount related to the acquisition. If the goodwill
carrying amount is null, any remaining deferred tax benefits are recognised in the income statement.
b) All the other acquired deferred tax benefits performed are recognised in the income statement (or, when
applicable, directly in shareholders’ equity).
2.3.15. Share-based payments
The benefits granted to employees under share purchase or share option incentive plans are recorded in
accordance with the requirements of IFRS 2 – Share-based payments.
In accordance with IFRS 2, since it is not possible to reliably estimate the fair value of the services received from
employees, their value is measured by reference to the fair value of equity instruments in accordance with
their share price at the grant date.
The cost is recognised, linearly over the period in which the service is provided by employees, under the
caption “Wages and salaries” in the income statement, with the corresponding increase in “Other reserves” in
equity.
The accumulated cost recognised at the date of each statement of financial position up to the vesting
reflects the best estimate of the number of own shares that will be vested, weighted by the tire elapse
between the grant and the vesting. The impact on the income statement each year corresponds to the
accumulated cost valuation between the beginning and the end of the year.
In turn, benefits granted on the basis of shares but paid in cash lead to the recognition of a liability valued at
fair value at the date of the statement of financial position.
2.3.16. Equity
Legal reserve
Portuguese commercial legislation requires that at least 5% of annual net profit must be appropriated to a
legal reserve until it represents at least 20% of the share capital. This reserve is not distributable, except in case
of liquidation, but can be used to absorb losses, after having exhausted all other reserves and to increase share
capital.
56
Share premium reserves
Issue of shares corresponds to premiums from the issuance or capital increases. According to Portuguese law,
share premiums follow the treatment given to the "Legal reserve", that is, the values are not distributable,
except in case of liquidation, but can be used to absorb losses after having exhausted all other reserves and to
increase share capital.
Reserves for plans of medium term incentive
According to IFRS 2 - "Share-based payments", the responsibility with the medium-term incentive plans settled
by delivery of own shares is recorded as credit under "Reservations for mid-term incentive plans" and such
reserve is not likely to be distributed or used to absorb losses.
Hedging reserves
Hedging reserve reflects the changes in fair value of derivative financial instruments as cash flow hedges that
are considered effective, and they are not likely to be distributed or be used to absorb losses.
Own shares reserves
The "Own shares reserves” reflect the value of the shares acquired and follows the same legal regime as the
legal reserve. Under Portuguese law, the amount of distributable reserves is determined according to the
individual financial statements of the company prepared in accordance with IFRS. In addition, the increases
resulting from the application of fair value through equity components, including its application through the
net profit can only be distributed when the elements that originated them are sold, exercised liquidated or
when the end their use, in the case of tangible assets or intangible assets.
Own shares
The own shares are recorded at acquisition cost as a deduction from equity. Gains or losses on the sale of own
shares are recorded under "Other reserves".
Other reserves and retained results
This item includes the results available for distribution to shareholders and earnings per fair value in financial
instruments increases, financial investments and investment properties, which, in accordance with paragraph 2
of article 32 of the CSC, will only be available for distribution when the elements or rights that originated them
are sold, exercised, terminated or settled.
2.3.17. Revenue
The main types of revenue of NOS subsidiaries are as follows:
i) Revenues of Telecommunications Services:
Cable television, fixed broadband and fixed voice: The revenues from services provided using the fibre
optic cable network result from: (a) basic channel subscription packages that can be sold in a bundle
with fixed broadband/fixed voice services; (b) premium channel subscription packages and S-VOD; (c)

57
terminal equipment rental; (d) consumption of content (VOD); (e) traffic and voice termination; (f) service
activation; (g) sale of equipment; and (h) other additional services (ex: firewall, antivirus).
Satellite television: Revenues from the satellite television service mainly result from: (a) basic and premium
channel subscription packages; (b) equipment rental; (c) consumption of content (VOD); (d) service
activation; and (e) sale of equipment.
Mobile broadband and voice services: Revenues from mobile broadband Internet access services and
mobile voice services result mainly from monthly subscriptions and/or usage of the Internet and voice
service, as well as the traffic associated with the type chosen by the client.
ii) Advertising revenue: Advertising revenues mainly derive from the attraction of advertising for Pay TV
channels to which the Group has publicity rights and in cinemas. These revenues are recognised from
when they are received, taken off any discounts given.
iii) Film showings and distribution: Distribution revenue pertains to the distribution of films to film exhibitors not
distributed by the Group, that are included in the film showings, whilst income from film showings mostly
derive from cinema ticket sales and the product sales in the bars; the film showings revenue includes the
revenue from ticket sales and bar sales respectively.
iv) Revenue from producing and distributing channel content: Revenue from production and distribution
essentially includes the sale of DVDs, the sale of content and the distribution of television channels
subscriptions to third parties and count from the time at which they are sold, shown and made available
for distribution to telecommunications operators, respectively.
v) Consultancy and datacenter management: information systems consultancy and datacenter
management are the major services rendered by NOS Sistemas.
Revenue from selling equipment are included when the buyer takes on the risks and advantages of taking
possession of goods and the value of the benefits are reasonably quantified.
Revenue from equipment rental is recognised linearly over the rental agreement, except in the case of
instalment sales which are accounted as credit sales.
The Group attributes to its customers, loyalty points which might be exchanged, over a limited time period, for
discounts in equipment purchase. These points represent a deferred liability, until the date when the points are
definitely converted into benefits, as its utilization implies an additional retention. The fair value of the liability is
calculated based on an estimated utilisation point rate and an average cost per point, taking into
consideration the available points at the date of each report.
Revenue from telecom services subscriptions (TV, internet, mobile and fixed voice services bundle subscription,
individually or as a bundle) is recognised linearly over the subscription period.
Revenue related with traffic, roaming, data usage, audiovisual content and others is recognised when the
service is rendered. The Group also offers various personalised solutions, particularly to its corporate customers
58
in telecom management, access, voice and data transmission services. These personalised solutions are also
recognised when the service is rendered.
Revenue is measured by the fair value of the amount received or receivable, taking into consideration that
revenue is recorded net of any commercial and quantity discounts granted by the entity.
Unless demanded or allowed by IFRS, the compensation of revenues and costs is not performed, namely, when
it reflects the nature of the transaction or other event.
The compensation of revenues and costs is performed in the following situations:
(i) When the gross inflows from economic benefits do not result in equity increases to the Group, i.e.,
the amount charged to the customer is equal to the amount delivered to the partner. This situation
is applicable to the revenue obtained by the invoicing special services operators, in these cases the
amounts charged on account of the capital are not revenue; and,
(ii) When the counterpart is not a “customer” but a partner who shares the risks and benefits of
developing a product or services in order for it to be commercialised. Thus, a counterpart of a
contract will not be a customer if, for instance, the counterpart has hired from NOS to participate in
an activity or process in which the parties in the contract share the risks and benefits instead of
obtaining the Group’s ordinary activities result. These cases are designated collaborative
arrangements. This situation is applicable to revenues from operators affected by the reciprocal
availability agreement regarding broadcasting rights of sports content.
Discounts granted to customers related with loyalty programmes are allocated to the entire retention contract
to which the customer is committed to. Therefore, the discount is recognised as the goods and services are
made available to the customer.
Amounts that have not been invoiced for are included based on estimates. The differences between the
estimated amounts and the actual amounts, which are normally imaterial, are recorded in the next financial
year.
Until 31 December 2014, revenue from penalties, due to inherent uncertainties, was recorded only at the
moment when it was received, and the amount was disclosed as a contingent asset (Note 39). From 1 January
2015, Revenue from penalties is recognised taking into account an estimated collectability rate taking into
account the Group's collection history.
Interest revenue is recognised using the effective interest method, only where they generate future economic
benefits for the Group and where they can be measured reliably.
2.3.18. Accruals
Group’s revenues and costs are recognised in accordance with the accruals principle, under which they are
recognised as they are generated or incurred, irrespective of when they are received or paid.
59
The costs and revenues related to the current period and whose expenses and income will only occur in future
periods are registered under “Accounts receivable – trade”, “Accounts receivable – other”, “Deferred costs”,
“Accrued expenses” and “Deferred income”, as well as the expenses and income that have already
occurred that relate to future periods, which will be recognised in each of those periods, for the corresponding
amount.
The costs related to the current period and whose expenses will only occur in future periods are registered
under “Accrued expenses” when it is possible to estimate with certainty the related amount, as well as the
timing of the expense’s materialization. If uncertainty exists related to any of these aspects, the value is
classified as Provisions (Note 2.3.12).
2.3.19. Assets, liabilities and transactions in foreign currencies
Transactions in foreign currencies are converted into the functional currency at the exchange rate on the
transactions dates. On each accounting date, outstanding balances (monetary items) are updated by
applying the exchange rate prevailing on that date. The exchange rate differences in this update are
recognised in the income statement for the year in which they were calculated, under “Net foreign exchange
losses / (gains)“. Exchange rate variations generated on monetary items which constitute enlargement of the
investment denominated in the functional currency of the Group or of the subsidiary in question are
recognised in equity. Exchange rate differences on non-monetary items are classified in “Other reserves” in
equity.
The financial statements of subsidiaries denominated in foreign currencies are converted at the following
exchange rates:
The exchange rate obtained on the date of the statement of financial position for the conversion of assets
and liabilities;
The average exchange rate in the period for the conversion of items in the income statement;
The average exchange rate in the period, for the conversion of cash flows (in cases where the exchange
rate approximates to the real rate, and for the remaining cash flows the rate of exchange at the date of the
operations is used);
The historical exchange rate for the conversion of equity accounts.
Exchange differences arising from the conversion into euros of the financial statements of subsidiaries
denominated in foreign currencies are included in equity under “Other reserves”.
At 31 December 2016 and 30 June 2017, assets and liabilities expressed in foreign currencies were converted
into euros using the following exchange rates of such currencies against the euro, as published by the Bank of

60
Portugal:
In the semesters ended at 30 June 2016 and 2017, the income statements of subsidiaries expressed in foreign
currencies were converted to euros at the average exchange rates of the currencies of their countries of
origin sagainst the euro, which are as follows:
2.3.20. Financial charges and borrowings
Financial charges related to borrowings are recognised as costs in accordance with the accruals principle,
except in the case of loans incurred (whether these are generic or specific) for the acquisition, construction or
production of an asset that takes a substantial period of time (over one year) to be ready for use, which are
capitalised in the acquisition cost of that asset.
2.3.21. Investment property
Investment property mainly includes buildings held to generate rents rather than for use in the production or
supply of goods or services, or for administrative purposes, or for sale in the ordinary course of business. These
are measured initially at cost.
Subsequently, the Group uses the cost model for the valuation of investment property since use of the fair
value model would not result in material differences.
An investment property is eliminated from the statement of financial position on disposal or when the
investment property is taken permanently out of use and no financial benefit is expected from its disposal.
2.3.22. Fair value measurement
The Group measures part of the financial assets, such as financial assets available for sale, and some of its non-
financial assets, such as investment properties, at fair value on the date of the financial statements.
The fair value measurement assumes that the asset or liability is exchanged in an orderly transaction among
market participants to sell the asset or transfer the liability at the measurement date under current market
conditions. The fair value measurement is based on the assumption that the transaction to sell the asset or
transfer the liability may occur:
- On the main market of the assets and liabilities, or
US Dollar 1.0541 1.1412
Angolan Kwanza 184.4750 184.4900
British Pound 0.8562 0.8793
Mozambican Metical 74.5400 68.9500
Canadian Dollar 1.4188 1.4785
Swiss Franc 1.0739 1.0930
Real 3.4305 3.7600
31-12-2016 30-06-2017
Angolan Kwanza 179.7303 184.9362
Mozambican Metical 59.6117 71.3583
6M 16 6M 17

61
- In the absence of a primary market, it is assumed that the transaction occurs in the most advantageous
market. This is what maximizes the amount that would be received to selling asset or minimizes the amount that
would be paid to transfer the liability, after considering transaction costs and transport costs.
Because different entities and businesses within a single entity can have access to different markets, the main
or most advantageous market for the same asset or liability can vary from one entity to another, or even
between businesses within the same entity, but it is assumed that they are accessible to the Group.
The fair value measurement uses assumptions that market participants use in defining price of the asset or
liability, assuming that market participants would use the asset to maximize its value.
The Group uses valuation techniques appropriate to the circumstances whenever there is information to
measure the fair value, maximizing the use of relevant observable inputs and minimizing the use of
unobservable inputs.
All assets and liabilities measured at fair value or of which disclosure is mandatory, are rated on a fair value
hierarchy, which ranks data in three levels to be used in the measurement at fair value, and detailed below:
Level 1 – Listed and unadjusted market prices, in active markets for identical assets or liabilities that the entity
can access at the measurement date;
Level 2 - valuation techniques using inputs that aren’t quoted, but which are directly or indirectly observable;
Level 3 - valuation techniques using inputs not based on observable market data, based on unobservable
inputs.
The fair value measurement is classified in the same fair value hierarchy level at the lowest level of input which
is significant to the measurement as a whole.
2.3.23. Assets and liabilities offsetting
Financial assets and liabilities are offset and presented at the net amount when, and only when, the Group
has the right to offset the recognised amounts and intends to settle for the net amount.
2.3.24. Employee benefits
Personnel expenses are recognised when the service is rendered by employees independently of their date of
payment. Here are some specificities:
a) Termination of employment. The benefits for termination of employment are due for payment when there is
cessation of employment before the normal retirement date or when an employee accepts leaving
voluntarily in exchange for these benefits. The Group recognizes these benefits when it can be shown to
be committed to a termination of current employees according to a detailed formal plan for termination
and there is no realistic possibility of withdrawal or these benefits are granted to encourage voluntary
redundancy. Where the benefits of cessation of employment are due more than 12 months after the
balance sheet date, they are updated to their present value.

62
b) Holiday, holiday allowances and bonuses. According to the labor law, employees are entitled to 22 days
annual leave, as well as one month of holiday allowances, rights acquired in the year preceding payment.
These liabilities of the Group are recorded when incurred, independently of the moment of payment, and
are reflected under the item "Accounts payable and other".
c) Labor Compensation Fund (FCT) and the Labour Compensation Guarantee Fund (FGCT). Based on the
publication of Law No 70/2013 and subsequent regulation by Order No. 294-A / 2013, entered into force on
1 October the Labor Compensation Fund schemes (FCT) and the Guarantee Fund Compensation of Labor
(FGCT). In this context, companies that hire a new employee are required to deduct a percentage of the
respective salary for these two new funds (0.925% to 0.075% and the FCT for FGCT), in order to ensure, in the
future, the partial payment of compensation for dismissal. Considering the characteristics of each Fund,
the following is considered:
- The monthly deliveries to FGCT, made by the employer are recognised as expense in the period to which
they relate.
- The monthly deliveries to FCT, made by the employer are recognised as a financial asset of the entity,
measured at fair value with changes recognised in the respective results.
2.3.25. Statement of cash flows
The statement of cash flows is prepared in accordance with the direct method. The Group classifies under
“Cash and cash equivalents” the assets with maturities of less than three months and for which the risk of
change in value is negligible. For purposes of the statement of cash flows, the balance of cash and cash
equivalents also include bank overdrafts included in the statement of financial position under "Borrowings".
The statement of cash flows is divided into operating, investing and financing activities.
Operating activities include cash received from customers and payments to suppliers, staff and others related
to operating activities. Under "Other cash receipts / (payments) related with operating activity" are included
the amounts received in 2016 and 2017, and subsequent payments regarding credit assignments without
recourse, coordinated by the Banco Comercial Português and Caixa Geral de Depósitos, and these
operations do not involve any change in the accounting treatment of the underlying receivables or in the
relationship with their clients.
The cash flows included in investing activities include acquisitions and disposals of investments in subsidiaries
and cash received and payments arising from the purchase and sale of tangible and intangible assets,
amongst others.
Financing activities include cash received and payments relating to borrowings, the payment of interest and
similar costs, finance leases, the purchase and sale of own shares and the payment of dividends.
63
2.3.26. Subsequent events
Events occurring after the date of the statement of financial position which provide additional information
about conditions that existed at that date are taken into account in the preparation of financial statements
for the year.
Events occurring after the date of the statement of financial position which provide information on conditions
that occur after that date are disclosed in the notes to the financial statements, when they are materially
relevant.
3. Judgments and estimates
3.1. Relevant accounting estimates
The preparation of consolidated financial statements requires the Group’s management to make judgments
and estimates that affect the statement of financial position and the reported results. These estimates are
based on the best information and knowledge about past and/or present events, and on the operations that
the Company considers may it may implement in the future. However, at the date of completion of such
operations, their results may differ from these estimates.
Changes to these estimates that occur after the date of approval of the consolidated financial statements will
be corrected in the income statement in a prospective manner, in accordance with IAS 8 - "Accounting
Policies, Changes in Accounting Estimates and Errors".
The estimates and assumptions that imply a greater risk of giving rise to a material adjustment in assets and
liabilities are described below:
Entities included in the consolidation perimeter
To determine the entities to be included in the consolidation perimeter, the Group assesses the extent to which
it is exposed, or has rights, to variability in returns from its involvement with that entity and can take possession
of them through the power it holds over this entity.
The decision that an entity must be consolidated by the Group requires the use of judgment, estimates and
assumptions to determine the extent to which the Group is exposed to return variability and the ability to take
possession of them through its power.
Other assumptions and estimates could lead to the Group's consolidation perimeter being different, with direct
impact on the consolidated financial statements.

64
Impairment of non-current assets, excluding goodwill
The determination of a possible impairment loss can be triggered by the occurrence of various events, such as
the availability of future financing, the cost of capital or other market, economic and legal changes or
changes with an adverse effect on the technological environment, many of which are beyond the Group’s
control.
The identification and assessment of impairment indicators, the estimation of future cash flows and the
calculation of the recoverable value of assets involve a high degree of judgment by the Board.
Impairment of goodwill
Goodwill is subjected to impairment tests annually or whenever there are indications of a possible loss of value,
in accordance with the criteria described in Note 8. The recoverable values of the cash-generating units to
which goodwill is allocated are determined on the basis of the calculation of current use values. These
calculations require the use of estimates by management.
Intangible and tangible assets
The life of an asset is the period during which the Company expects that an asset will be available for use and
this should be reviewed at least at the end of each financial year.
The determination of the useful lives of assets, the amortisation/depreciation method to be applied and the
estimated losses resulting from the replacement of equipment before the end of its useful life due to
technological obsolescence is crucial in determining the amount of amortisation/depreciation to be
recognised in the consolidated income statement each year.
These three parameters are defined using management’s best estimates for the assets and businesses
concerned, and taking account of the practices adopted by companies in the sectors in which the Group
operates.
The capitalised costs with the audiovisual content distribution rights acquired for commercialisation in the
various windows of exhibition are amortised over the period of exploration of the respective contracts.
Additionally, these assets are subject to impairment tests whenever there are indications of changes in the
pattern generation of future revenue underlying each contract.
Provisions
The Group periodically reviews any obligations arising from past events which should be recognised or
disclosed. The subjectivity involved in determining the probability and amount of internal resources required to
meet obligations may give rise to significant adjustments, either due to changes in the assumptions made, or
due to the future recognition of provisions previously disclosed as contingent liabilities.
Deferred income tax assets
Deferred income tax assets are recognised only where there is strong assurance that there will be future
taxable income available to use the temporary differences or where there are deferred tax liabilities whose

65
reversal is expected in the same period in which the deferred tax assets are reversed. The assessment of
deferred income tax assets is undertaken by management at the end of each period taking account of the
expected future performance of the Group.
Impairment of account receivables
The credit risk on the balances of accounts receivable is assessed at each reporting date, taking account of
the customer’s history and their risk profile. Accounts receivable are adjusted for the assessment made by
management and the estimated collection risks at the date of the statement of financial position, which may
differ from the effective risk incurred.
Fair value of financial assets and liabilities
When the fair value of an asset or liabilities is calculated, on an active market, the respective market price is
used. Where there is no active market, which is the case with some of the Group’s financial assets and
liabilities, valuation techniques generally accepted in the market, based on market assumptions, are used.
The Group uses evaluation techniques for unlisted financial instruments such as derivatives, financial
instruments at fair value through profit and loss, and assets available for sale. The valuation models that are
used most frequently are discounted cash flow models and options models, incorporating, for example,
interest rate and market volatility curves.
For certain types of more complex derivatives, more advanced valuation models are used containing
assumptions and data that are not directly observable in the market, for which the Group uses internal
estimates and assumptions.
3.2. Errors, estimates and changes to accounting policies
During the semesters ended at 30 June 2016 and 2017 no material errors, estimates and accounting policies
were recognised relating to previous years.
4. Changes in the consolidation perimeter
During the semester ended on 30 June 2016, the changes in the consolidated perimeter were as follow:
1) On 18 January 2016, ZON Finance BV was liquidated, which had no impact on the Group’s consolidated
financial statements.
During the semester ended on 30 June 2017, the changes in the consolidated perimeter were as follow:
1) On 24 February 2017, MEO became part of Sport TV’s shareholders, NOS SGPS owns a share of 25% of
Sport TV;

66
2) On 29 March 2017, the companies NOS Internacional, SGPS (“NOS Internacional SGPS”) and NOS
Audiovisuais, SGPS (“NOS Audio SGPS”) were constituted, being 100% owned by NOS SGPS.
5. Segment reporting
The business segments are as follows:
Telco – TV, Internet (fixed and mobile) and voice (fixed and mobile) services rendered and includes the
following companies: NOS Technology, NOS Towering, Per-mar, Sontária, NOS SGPS, NOS Açores, NOS
Communications, NOS Madeira, NOSPUB, NOS SA, NOS Lusomundo TV, Teliz Holding, NOS Sistemas, NOS
Sistemas España, NOS Inovação and NOS Internacional SGSP.
Audiovisual – the supply of video production services and sales, cinema exhibition and distribution and the
acquisition/negociation of Pay TV and VOD (video-on-demand) rights and includes the following
companies: NOS Audiovisuais, NOS Cinemas, Lusomundo Moçambique, Lda ("Lusomundo Moçambique"),
Lusomundo Imobiliária 2, S.A. ("Lusomundo Imobiliária 2"), Lusomundo Sociedade de Investimentos
Imobiliários, SGPS, S.A. (“Lusomundo SII”), Empracine – Empresa Promotora de Atividades
Cinematográficas, Lda (“Empracine”) and NOS Audio SGPS.
Assets and liabilities by segment at 31 December 2016 and 30 June 2017 are shown below:

67
TELCO AUDIOVISUALS ELIMINATIONS GROUP
ASSETS
NON - CURRENT ASSETS:
Tangible assets 1,145,456 12,725 - 1,158,181
Intangible assets 1,061,081 97,698 - 1,158,779
Investments in jointly controlled companies and associated companies 91,177 13,731 (97,020) 7,888
Accounts receivable - other 55,358 26,520 (75,389) 6,489
Deferred income tax assets 103,434 13,868 - 117,302
Other non-current assets 3,700 663 - 4,363
TOTAL NON - CURRENT ASSETS 2,460,206 165,205 (172,409) 2,453,002
CURRENT ASSETS:
Inventories 36,687 14,356 - 51,043
Account receivables 346,689 66,374 (48,323) 364,740
Prepaid expenses 81,993 2,398 - 84,391
Other current assets 26,560 1,010 (418) 27,152
Cash and cash equivalents 798 1,515 - 2,313
TOTAL CURRENT ASSETS 492,727 85,653 (48,741) 529,639
TOTAL ASSETS 2,952,933 250,858 (221,150) 2,982,641
SHAREHOLDER'S EQUITY
Share capital 5,152 28,699 (28,699) 5,152
Capital issued premium 854,219 - - 854,219
Own shares (18,756) - - (18,756)
Legal reserve 1,030 1,087 (1,087) 1,030
Other reserves and accumulated earnings 83,518 69,526 (41,013) 112,031
Net income 84,837 31,347 (25,803) 90,381
EQUITY BEFORE NON - CONTROLLING INTERESTS 1,010,000 130,659 (96,602) 1,044,057
Non-controlling interests 8,982 22 37 9,041
TOTAL EQUITY 1,018,982 130,681 (96,565) 1,053,098
LIABILITIES
NON - CURRENT LIABILITIES:
Borrowings 995,074 52,318 (75,389) 972,003
Provisions 139,505 6,782 - 146,287
Accrued expenses 9,185 - - 9,185
Other non-current liabilities 30,556 458 - 31,014
Deferred income tax liabilities 9,738 468 - 10,206
TOTAL NON - CURRENT LIABILITIES 1,184,059 60,026 (75,389) 1,168,696
CURRENT LIABILITIES:
Borrowings 254,689 609 (30,606) 224,692
Accounts payable 288,169 31,071 (11,679) 307,561
Tax payable 19,842 4,533 (418) 23,957
Accrued expenses 157,170 23,837 (6,493) 174,514
Other current liabilities 30,022 101 - 30,123
TOTAL CURRENT LIABILITIES 749,892 60,151 (49,196) 760,847
TOTAL LIABILITIES 1,933,950 120,177 (124,585) 1,929,543
TOTAL LIABILITIES AND SHAREHOLDER´S EQUITY 2,952,933 250,858 (221,150) 2,982,641
31-12-2016

68
The results by segment and investments in tangible and intangible assets for the semesters ended on 30 June
2016 and 2017 are shown below:
TELCO AUDIOVISUALS ELIMINATIONS GROUP
ASSETS
NON - CURRENT ASSETS:
Tangible assets 1,125,868 11,849 - 1,137,717
Intangible assets 1,051,529 97,479 - 1,149,008
Investments in jointly controlled companies and associated companies 103,438 16,244 (103,070) 16,612
Accounts receivable - other 51,566 24,584 (69,389) 6,761
Deferred income tax assets 100,205 13,733 - 113,938
Other non-current assets 1,106 662 - 1,768
TOTAL NON - CURRENT ASSETS 2,433,712 164,551 (172,459) 2,425,804
CURRENT ASSETS:
Inventories 35,009 928 - 35,937
Account receivables 367,619 76,120 (62,507) 381,232
Prepaid expenses 73,588 2,320 (87) 75,821
Other current assets 400 943 - 1,343
Cash and cash equivalents 630 1,380 - 2,010
TOTAL CURRENT ASSETS 477,246 81,691 (62,594) 496,343
TOTAL ASSETS 2,910,958 246,242 (235,053) 2,922,147
SHAREHOLDER'S EQUITY
Share capital 5,152 32,749 (32,749) 5,152
Capital issued premium 854,219 - - 854,219
Own shares (12,728) - - (12,728)
Legal reserve 1,030 1,087 (1,087) 1,030
Other reserves and accumulated earnings 49,238 75,748 (28,075) 96,911
Net income 91,540 21,029 (40,742) 71,827
EQUITY BEFORE NON - CONTROLLING INTERESTS 988,451 130,613 (102,653) 1,016,411
Non-controlling interests 9,381 21 38 9,440
TOTAL EQUITY 997,832 130,634 (102,615) 1,025,851
LIABILITIES
NON - CURRENT LIABILITIES:
Borrowings 1,052,567 48,258 (69,388) 1,031,437
Provisions 127,219 6,255 - 133,474
Accrued expenses 9,069 - - 9,069
Other non-current liabilities 27,313 458 - 27,771
Deferred income tax liabilities 8,245 492 - 8,737
TOTAL NON - CURRENT LIABILITIES 1,224,413 55,463 (69,388) 1,210,488
CURRENT LIABILITIES:
Borrowings 190,949 14,026 (37,888) 167,087
Accounts payable 263,602 19,021 (18,044) 264,579
Tax payable 31,875 1,108 - 32,983
Accrued expenses 176,673 25,336 (7,029) 194,980
Other current liabilities 25,614 654 (89) 26,179
TOTAL CURRENT LIABILITIES 688,713 60,145 (63,050) 685,808
TOTAL LIABILITIES 1,913,126 115,608 (132,438) 1,896,296
TOTAL LIABILITIES AND SHAREHOLDER´S EQUITY 2,910,958 246,242 (235,053) 2,922,147
30-06-2017

69
Transactions between segments are performed on market terms and conditions in a comparable way to
transactions performed with third parties.
2º QUARTER 16 6M 16 2º QUARTER 16 6M 16 2º QUARTER 16 6M 16 2º QUARTER 16 6M 16
REVENUES:
Services rendered 342,721 678,780 23,126 48,094 (12,062) (24,004) 353,785 702,870
Sales 10,456 23,133 3,555 7,974 (15) (21) 13,996 31,086
Other operating revenues 5,040 9,256 285 498 (295) (596) 5,030 9,158
358,217 711,169 26,966 56,566 (12,372) (24,621) 372,811 743,114
COSTS, LOSSES AND GAINS:
Wages and salaries 19,349 40,731 2,547 4,990 - - 21,896 45,721
Direct costs 114,839 226,835 5,611 12,362 (10,070) (19,993) 110,380 219,204
Costs of products sold 10,697 24,812 51 113 (3) (9) 10,745 24,916
Marketing and advertising 5,742 14,061 1,159 2,816 (1,699) (3,351) 5,202 13,526
Support services 21,878 45,514 466 895 (379) (747) 21,965 45,662
Supplies and external services 41,315 81,001 5,123 10,411 (220) (520) 46,218 90,892
Other operating losses / (gains) 123 229 29 41 - - 152 270
Taxes 7,275 14,279 30 64 (1) (1) 7,304 14,342
Provisions and adjustments 202 1,218 88 832 - - 290 2,050
221,420 448,680 15,104 32,524 (12,372) (24,621) 224,152 456,583
EBITDA 136,797 262,489 11,862 24,042 - - 148,659 286,531
Depreciation, amortisation and impairment losses 88,876 173,820 9,660 20,009 - - 98,536 193,829
Other losses / (gains), net 3,530 5,905 49 102 - - 3,579 6,007
44,391 82,764 2,153 3,931 - - 46,544 86,695
Net losses / (gains) of affiliated companies 3,480 10,209 (192) (556) - - 3,288 9,653
Financial costs 4,548 7,878 134 259 - - 4,682 8,137
Net foreign exchange losses / (gains) 185 (4) 323 417 - - 508 413
Net losses / (gains) on financial assets (5,611) (5,611) (4,592) (4,592) 10,203 10,203 - -
Net other financial expenses / (income) 1,663 3,648 17 36 - - 1,680 3,684
4,265 16,120 (4,310) (4,436) 10,203 10,203 10,158 21,887
INCOME BEFORE TAXES 40,126 66,644 6,463 8,367 (10,203) (10,203) 36,386 64,808
Income taxes 9,426 12,927 505 972 - - 9,931 13,899
NET INCOME 30,699 53,716 5,958 7,395 (10,203) (10,203) 26,455 50,909
CAPEX 7,838 92,734 (1,973) 8,227 - - 5,865 100,961
EBITDA - CAPEX 128,959 169,755 13,835 15,815 - - 142,794 185,570
2º QUARTER 17 6M 17 2º QUARTER 17 6M 17 2º QUARTER 17 6M 17 2º QUARTER 17 6M 17
REVENUES:
Services rendered 348,515 704,219 26,826 52,963 (12,234) (24,636) 370,296 732,546
Sales 10,517 21,343 4,585 8,665 (65) (138) 15,037 29,870
Other operating revenues 3,050 7,049 290 506 (302) (601) 3,038 6,954
369,271 732,611 31,701 62,134 (12,601) (25,375) 388,371 769,370
COSTS, LOSSES AND GAINS:
Wages and salaries 18,147 37,927 2,551 4,961 - - 20,698 42,888
Direct costs 127,602 243,738 8,718 16,622 (10,024) (20,246) 126,296 240,114
Costs of products sold 10,522 21,345 74 130 - (9) 10,596 21,466
Marketing and advertising 7,902 14,372 2,083 3,914 (1,880) (3,742) 8,105 14,544
Support services 22,778 46,170 544 1,069 (393) (783) 22,928 46,455
Supplies and external services 39,245 79,260 5,280 10,369 (304) (595) 44,221 89,034
Other operating losses / (gains) 171 330 13 24 - - 184 354
Taxes 7,579 15,319 294 340 - - 7,873 15,659
Provisions and adjustments (8,747) (951) (523) (534) - - (9,270) (1,485)
225,199 457,510 19,034 36,895 (12,601) (25,375) 231,631 469,029
144,072 275,101 12,667 25,239 - - 156,740 300,341
Depreciation, amortisation and impairment losses 94,098 188,074 9,352 18,664 - - 103,450 206,738
Other losses / (gains), net 4,438 7,653 76 212 - - 4,514 7,864
INCOME BEFORE FINANCIAL RESULTS AND TAXES 45,536 79,374 3,239 6,363 - - 48,776 85,739
Net losses / (gains) of affiliated companies (3,369) (8,458) (252) (513) - - (3,622) (8,971)
Financial costs 5,913 10,695 145 274 - - 6,058 10,969
Net foreign exchange losses / (gains) 108 111 (4) (4) - - 104 107
Net losses / (gains) on financial assets (25,113) (25,113) (15,629) (15,629) 40,742 40,742 - -
Net other financial expenses / (income) (949) 733 7 21 - - (941) 754
(23,410) (22,032) (15,733) (15,851) 40,742 40,742 1,599 2,859
INCOME BEFORE TAXES 68,946 101,406 18,972 22,214 (40,742) (40,742) 47,177 82,880
Income taxes 5,927 9,472 427 1,186 - - 6,355 10,658
NET INCOME 63,019 91,934 18,545 21,028 (40,742) (40,742) 40,822 72,222
CAPEX 77,598 155,296 8,078 17,503 - - 85,676 172,799
EBITDA - CAPEX 66,474 119,805 4,589 7,736 - - 71,064 127,542
INCOME BEFORE FINANCIAL RESULTS AND TAXES
EBITDA
ELIMINATIONS
GROUPTELCO
TELCO AUDIOVISUALS GROUP
AUDIOVISUALS ELIMINATIONS

70
6. Financial assets and liabilities classified in accordance with the IAS 39
categories – financial instruments: recognition and measurement
The accounting policies set out in IAS 39 for financial instruments were applied to the following items:
LOANS AND
ACCOUNTS
RECEIVABLE
AVAILABLE-
FOR-SALE
FINANCIAL
ASSETS
INVESTMENTS
HELD-TO-
MATURITY
DERIVATIVES
ASSETS
Available-for-sale financial assets - 77 - -
Derivative financial instruments (Note 17) - - - 60
Accounts receivable - trade (Note 14) 348,926 - - -
Accounts receivable - other (Note 10) 19,201 - - -
Cash and cash equivalents (Note 18) 2,313 - - -
TOTAL FINANCIAL ASSETS 370,440 77 - 60
LIABILITIES
Borrowings (Note 21) - - - -
Derivative financial instruments (Note 17) - - - 4,027
Accounts payable - trade (Note 25) - - - -
Accounts payable - other (Note 26) - - - -
Accrued expenses (Note 23) - - - -
TOTAL FINANCIAL LIABILITIES - - - 4,027
31-12-2016
OTHER
FINANCIAL
LIABILITIES
TOTAL
FINANCIAL
ASSETS AND
LIABILITIES
NON
FINANCIAL
ASSETS AND
LIABILITIES
TOTAL
ASSETS
Available-for-sale financial assets - 77 - 77
Derivative financial instruments (Note 17) - 60 - 60
Accounts receivable - trade (Note 14) - 348,926 - 348,926
Accounts receivable - other (Note 10) - 19,201 3,102 22,303
Cash and cash equivalents (Note 18) - 2,313 - 2,313
TOTAL FINANCIAL ASSETS - 370,577 3,102 373,679
LIABILITIES
Borrowings (Note 21) 1,196,695 1,196,695 - 1,196,695
Derivative financial instruments (Note 17) - 4,027 - 4,027
Accounts payable - trade (Note 25) 238,828 238,828 - 238,828
Accounts payable - other (Note 26) 90,132 90,132 152 90,284
Accrued expenses (Note 23) 183,699 183,699 - 183,699
TOTAL FINANCIAL LIABILITIES 1,709,354 1,713,381 152 1,713,533
31-12-2016

71
Considering its nature, the balances of the amounts to be paid and received to/from state and other public
entities were considered outside the scope of IFRS 7. Also, the captions of “Deferred costs” and “Deferred
income” were not included in this note, as the nature of such balances are not included in the scope of IFRS 7.
The Board of Directors believes that the fair value of the breakdown of financial instruments recorded at
amortised cost or registered at the present value of the payments does not differ significantly from their book
value. This decision is based on the contractual terms of each financial instrument.
The Group’s activity is subject to a variety of financial risks, such as market risk, credit and liquidity risk and
economical and judicial risks, which are described in the Management Report at 31 December 2016.
LOANS AND
ACCOUNTS
RECEIVABLE
AVAILABLE-
FOR-SALE
FINANCIAL
ASSETS
INVESTMENTS
HELD-TO-
MATURITY
DERIVATIVES
ASSETS
Available-for-sale financial assets - 77 - -
Derivative financial instruments (Note 17) - - - 17
Accounts receivable - trade (Note 14) 362,955 - - -
Accounts receivable - other (Note 10) 9,996 - - -
Cash and cash equivalents (Note 18) 2,010 - - -
TOTAL FINANCIAL ASSETS 374,961 77 - 17
LIABILITIES
Borrowings (Note 21) - - - -
Derivative financial instruments (Note 17) - - - 2,744
Accounts payable - trade (Note 25) - - - -
Accounts payable - other (Note 26) - - - -
Accrued expenses (Note 23) - - - -
TOTAL FINANCIAL LIABILITIES - - - 2,744
30-06-2017
OTHER
FINANCIAL
LIABILITIES
TOTAL
FINANCIAL
ASSETS AND
LIABILITIES
NON
FINANCIAL
ASSETS AND
LIABILITIES
TOTAL
ASSETS
Available-for-sale financial assets - 77 - 77
Derivative financial instruments (Note 17) - 17 - 17
Accounts receivable - trade (Note 14) - 362,955 - 362,955
Accounts receivable - other (Note 10) - 9,996 15,042 25,038
Cash and cash equivalents (Note 18) - 2,010 - 2,010
TOTAL FINANCIAL ASSETS - 375,055 15,042 390,097
LIABILITIES
Borrowings (Note 21) 1,198,524 1,198,524 - 1,198,524
Derivative financial instruments (Note 17) - 2,744 - 2,744
Accounts payable - trade (Note 25) 209,682 209,682 - 209,682
Accounts payable - other (Note 26) 74,543 74,543 196 74,739
Accrued expenses (Note 23) 204,049 204,049 - 204,049
TOTAL FINANCIAL LIABILITIES 1,686,798 1,689,542 196 1,689,738
30-06-2017
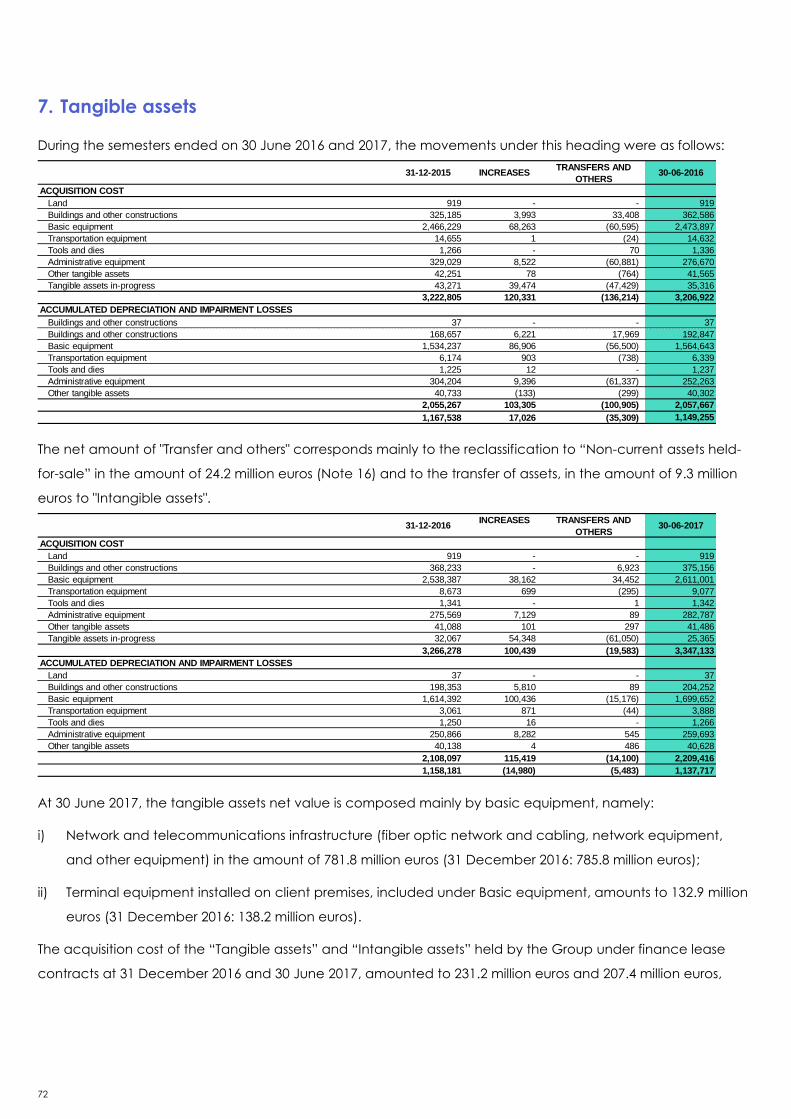
72
7. Tangible assets
During the semesters ended on 30 June 2016 and 2017, the movements under this heading were as follows:
The net amount of "Transfer and others" corresponds mainly to the reclassification to “Non-current assets held-
for-sale” in the amount of 24.2 million euros (Note 16) and to the transfer of assets, in the amount of 9.3 million
euros to "Intangible assets".
At 30 June 2017, the tangible assets net value is composed mainly by basic equipment, namely:
i) Network and telecommunications infrastructure (fiber optic network and cabling, network equipment,
and other equipment) in the amount of 781.8 million euros (31 December 2016: 785.8 million euros);
ii) Terminal equipment installed on client premises, included under Basic equipment, amounts to 132.9 million
euros (31 December 2016: 138.2 million euros).
The acquisition cost of the “Tangible assets” and “Intangible assets” held by the Group under finance lease
contracts at 31 December 2016 and 30 June 2017, amounted to 231.2 million euros and 207.4 million euros,
ACQUISITION COST
Land 919 - - 919
Buildings and other constructions 325,185 3,993 33,408 362,586
Basic equipment 2,466,229 68,263 (60,595) 2,473,897
Transportation equipment 14,655 1 (24) 14,632
Tools and dies 1,266 - 70 1,336
Administrative equipment 329,029 8,522 (60,881) 276,670
Other tangible assets 42,251 78 (764) 41,565
Tangible assets in-progress 43,271 39,474 (47,429) 35,316
3,222,805 120,331 (136,214) 3,206,922
ACCUMULATED DEPRECIATION AND IMPAIRMENT LOSSES
Buildings and other constructions 37 - - 37
Buildings and other constructions 168,657 6,221 17,969 192,847
Basic equipment 1,534,237 86,906 (56,500) 1,564,643
Transportation equipment 6,174 903 (738) 6,339
Tools and dies 1,225 12 - 1,237
Administrative equipment 304,204 9,396 (61,337) 252,263
Other tangible assets 40,733 (133) (299) 40,302
2,055,267 103,305 (100,905) 2,057,667
1,167,538 17,026 (35,309) 1,149,255
31-12-2015 INCREASES 30-06-2016TRANSFERS AND
OTHERS
INCREASES
ACQUISITION COST
Land 919 - - 919
Buildings and other constructions 368,233 - 6,923 375,156
Basic equipment 2,538,387 38,162 34,452 2,611,001
Transportation equipment 8,673 699 (295) 9,077
Tools and dies 1,341 - 1 1,342
Administrative equipment 275,569 7,129 89 282,787
Other tangible assets 41,088 101 297 41,486
Tangible assets in-progress 32,067 54,348 (61,050) 25,365
3,266,278 100,439 (19,583) 3,347,133
ACCUMULATED DEPRECIATION AND IMPAIRMENT LOSSES
Land 37 - - 37
Buildings and other constructions 198,353 5,810 89 204,252
Basic equipment 1,614,392 100,436 (15,176) 1,699,652
Transportation equipment 3,061 871 (44) 3,888
Tools and dies 1,250 16 - 1,266
Administrative equipment 250,866 8,282 545 259,693
Other tangible assets 40,138 4 486 40,628
2,108,097 115,419 (14,100) 2,209,416
1,158,181 (14,980) (5,483) 1,137,717
31-12-2016 30-06-2017TRANSFERS AND
OTHERS

73
and their net book value as of those dates amounted to 112.9 million euros and 102.0 million euros,
respectively.
Tangible and intangible assets include interests and other financial expenses incurred directly related to the
construction of certain tangible or intangible assets in progress. At 30 June 2017, total net value of these costs
amounted to 15.3 million euros (31 December 2016: 15.2 million euros). The amount capitalised in the period
ended on 30 June 2017 amounted to 0.3 million euros (31 December 2016: 1.1 million euros).
8. Intangible assets
In the semesters ended on 30 June 2016 and 2017, the movements under this heading were as follows:
The amount of "Transfer and others" corresponds, mainly, to the transfer of assets, in the amount of 9.3 million
euros from "Tangible assets".
At 30 June 2017, the item "Industrial property and other rights" includes mainly:
(1) A net amount of 131.0 million euros (31 December 2016: 135.2 million euros) mainly related to the
investment, net of amortisation, made in the development of the UMTS network by NOS SA, including: (i)
41.5 million euros (31 December 2016: 42.8 million euros) related to the license, (ii) 13.9 million euros (31
December 2016: 14.3 million euros) related to the agreement signed in 2002 between Oni Way and the
other three mobile telecommunication operators with activity in Portugal, (iii) 4.3 million euros (31
December 2016: 4.4 million euros) related to the Share Capital of “Fundação para as Comunicações
Móveis’’, established in 2007, under an agreement entered with Ministério das Obras Públicas, Transportes
e Comunicações and the three mobile telecommunication operators in Portugal; (iv) 60.7 million euros (31
December 2016: 62.6 million euros) related with the programme “Initiatives E”; and (v) the net amount of
31-12-2015 INCREASESTRANSFERS AND
OTHERS30-06-2016
ACQUISITION COST
Industrial property and other rights 1,489,997 37,235 86,003 1,613,235
Goodwill 641,599 - - 641,599
Intangible assets in-progress 30,589 38,490 (32,250) 36,829
2,162,185 75,725 53,753 2,291,663
ACCUMULATED AMORTISATION AND IMPAIRMENT LOSSES
Industrial property and other rights 979,470 90,511 43,872 1,113,853
Other intangible assets 4,156 - 569 4,725
983,626 90,511 44,441 1,118,578
1,178,559 (14,786) 9,312 1,173,085
31-12-2016 INCREASESTRANSFERS AND
OTHERS30-06-2017
ACQUISITION COST
Industrial property and other rights 1,697,035 35,024 46,692 1,778,751
Goodwill 641,599 - (199) 641,400
Intangible assets in-progress 33,374 37,336 (37,481) 33,229
2,372,008 72,360 9,012 2,453,380
ACCUMULATED AMORTISATION AND IMPAIRMENT LOSSES
Industrial property and other rights 1,208,450 91,318 38 1,299,806
Intangible assets in-progress 4,779 - (213) 4,566
1,213,229 91,318 (175) 1,304,372
1,158,779 (18,958) 9,187 1,149,008

74
7.2 million euros (31 December 2016: 7.4 million euros) corresponding to the valuation of the license in the
fair value allocation process resulting from the merger;
(2) A net amount of 92.1 million euros (31 December 2016: 94.0 million euros) corresponding to the current
value of future payments related with the acquisition of rights of use for frequencies (spectrum) bands of
800 MHz, 1800 MHz, 2600 MHz, which will be used to develop 4th generation services (LTE - Long Term
Evolution) and a net amount of 3.2 million euros (31 December 2016: 3.3 million euros) corresponding to
the valuation of the license in the fair value allocation process resulting from the merger;
(3) A net amount of 51,9 million euros (31 December 2016: 51.0 million euros) relating to the contract for the
exclusive acquisition of satellite capacity celebrated between NOS SA and Hispasat, which is recorded as
a finance lease;
(4) Net amounts of approximately 54.8 million euros (31 December 2016: 56.9 million euros) and 20.7 million
euros (31 December 2016: 20.9 million euros) corresponding to the capitalised costs related to customers’
loyalty contracts and future rights to use movies and series, respectively;
(5) A net amount of approximately 11.5 million euros (31 December 2016: 16.4 million euros) corresponding to
the valuation of Optimus customer portfolio under the fair value allocation process resulting from the
merger.
Impairment tests on goodwill
Goodwill was allocated to the cash-generating units of each reportable segment, as follows:
In 2016 impairment tests were performed based on assessments in accordance with the discounted cash flow
method, which corroborate the recoverability of the book value of the Goodwill. The amounts in these
assessments are based on the historical performances and forecast growth of the businesses and their
markets, incorporated in medium to long term plans approved by the Board.
These estimates are based on the following assumptions:
* EBITDA = Operational result + Depreciation and amortisation (CAGR – average 5 years)
Telco 564,998 564,799
Audiovisuals 76,601 76,601
641,599 641,400
30-06-201731-12-2016
NOS NOS
AUDIOVISUALS CINEMAS
Discount rate (before taxes) 7.3% 7.3% 7.3%
Assessment period 5 years 5 years 5 years
EBITDA* Growth 4.8% -0.9% 1.8%
Perpetuity growth rate 1.5% 1.5% 1.5%
TELCO
SEGMENT
AUDIOVISUALS SEGMENT
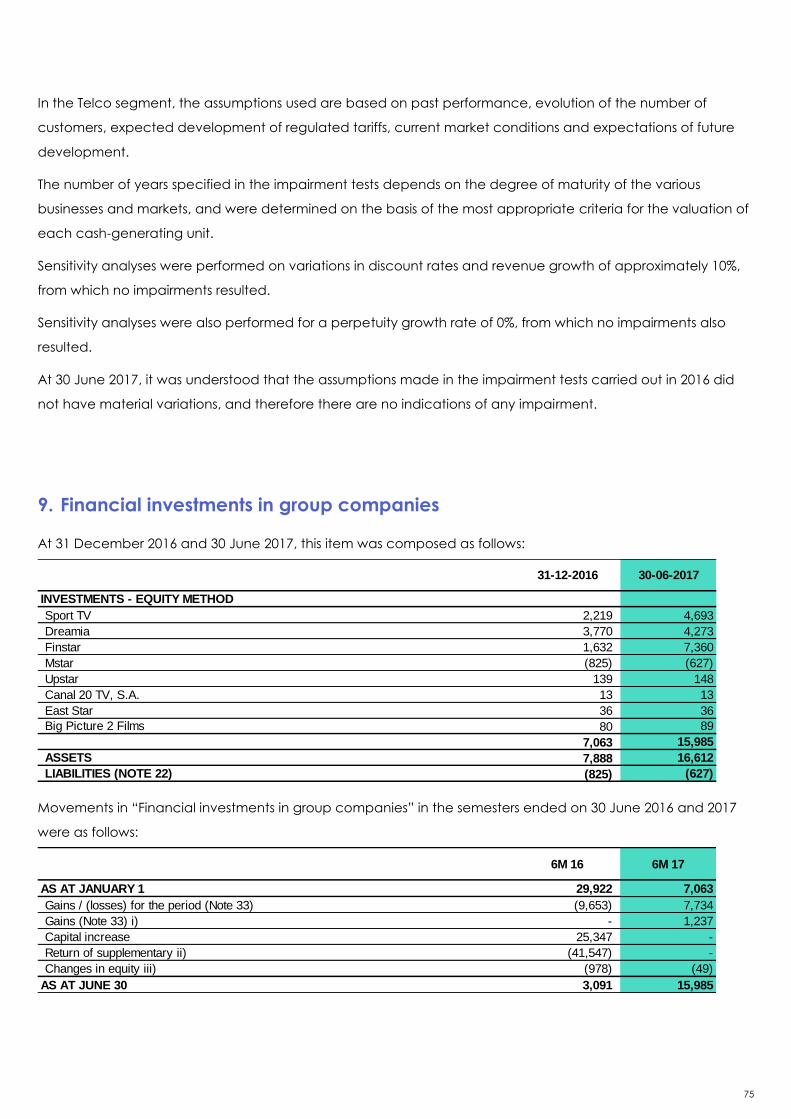
75
In the Telco segment, the assumptions used are based on past performance, evolution of the number of
customers, expected development of regulated tariffs, current market conditions and expectations of future
development.
The number of years specified in the impairment tests depends on the degree of maturity of the various
businesses and markets, and were determined on the basis of the most appropriate criteria for the valuation of
each cash-generating unit.
Sensitivity analyses were performed on variations in discount rates and revenue growth of approximately 10%,
from which no impairments resulted.
Sensitivity analyses were also performed for a perpetuity growth rate of 0%, from which no impairments also
resulted.
At 30 June 2017, it was understood that the assumptions made in the impairment tests carried out in 2016 did
not have material variations, and therefore there are no indications of any impairment.
9. Financial investments in group companies
At 31 December 2016 and 30 June 2017, this item was composed as follows:
Movements in “Financial investments in group companies” in the semesters ended on 30 June 2016 and 2017
were as follows:
INVESTMENTS - EQUITY METHOD
Sport TV 2,219 4,693
Dreamia 3,770 4,273
Finstar 1,632 7,360
Mstar (825) (627)
Upstar 139 148
Canal 20 TV, S.A. 13 13
East Star 36 36
Big Picture 2 Films 80 89
7,063 15,985
ASSETS 7,888 16,612
LIABILITIES (NOTE 22) (825) (627)
30-06-201731-12-2016
AS AT JANUARY 1 29,922 7,063
Gains / (losses) for the period (Note 33) (9,653) 7,734
Gains (Note 33) i) - 1,237
Capital increase 25,347 -
Return of supplementary ii) (41,547) -
Changes in equity iii) (978) (49)
AS AT JUNE 30 3,091 15,985
6M 176M 16

76
i) Gains generated by the entrance of MEO in the share capital of Sport TV (Note 4).
ii) During the first quarter of 2016, Sport TV returned supplementary payments in the amount of 41.5 million
euros through the delivery of cash in the amount of 25.3 million euros and the assignment of credits in the
amount of 16.2 million euros.
iii) Amounts related to changes in equity of the companies registered by the equity method of consolidation
are mainly related to foreign exchange impacts of the investment in other currencies than euro.
The Group's interest in the results and assets and liabilities of the jointly controlled companies and associated
companies in the period ended on 31 December 2016 and the semester ended on 30 June 2017 is as follows:
Note: consolidated adjustments are reflected in the indicators presented in the table above.
ENTITY ASSETS LIABILITIES EQUITY REVENUE NET INCOME % HELD
GAIN/(LOSS)
ATTRIBUTED
TO THE
GROUP
Sport TV* 162,219 155,561 6,658 150,429 (11,342) 33.33% (3,781)
Dreamia 15,085 7,546 7,539 3,790 1,314 50.00% 657
Finstar 206,721 201,281 5,440 229,535 (7,983) 30.00% (2,395)
Mstar 7,148 9,898 (2,750) 19,946 (3,703) 30.00% (1,111)
Upstar 169,448 168,986 462 117,163 141 30.00% 42
Canal 20 TV, S.A. 27 1 26 - (9) 50.00% (5)
East Star 137 17 120 - - 30.00% -
Big Picture 2 Films 2,530 2,130 400 9,679 205 20.00% 41
563,315 545,420 17,895 530,542 (21,377) (6,550)
ENTITY ASSETS LIABILITIES EQUITY REVENUE NET INCOME % HELD
GAIN/(LOSS)
ATTRIBUTED
TO THE
GROUP
Sport TV* 100,398 81,624 18,774 94,463 4,950 25.00% 1,238
Dreamia 15,752 7,206 8,546 2,280 1,007 50.00% 504
Finstar 246,093 221,561 24,532 146,420 19,063 30.00% 5,719
Mstar 8,829 10,919 (2,090) 10,157 853 30.00% 256
Upstar 199,944 199,451 493 55,254 30 30.00% 9
Canal 20 TV, S.A. 27 1 26 - - 50.00% -
East Star 137 17 120 - - 30.00% -
Big Picture 2 Films 2,599 2,155 444 4,671 45 20.00% 9
573,779 522,934 50,845 313,245 25,948 7,734
2017
2016
* The share capital is adjusted, in return of liabilities, in the amount of 5.1 million euros due to supplementary payments made by other shareholder
above his equity.
* The share capital is adjusted, in return of liabilities, in the amount of 10.2 million euros due to supplementary payments made by other
shareholder above his equity.

77
10. Accounts receivable – other
At 31 December 2016 and 30 June 2017, this item was composed as follows:
The summary of the movements in impairment of other receivables is as follows:
11. Taxes payable and receivable
At 31 December 2016 and 30 June 2017, these items were composed as follows:
(i) In the semester ended on 30 June 2017, the amount of 2,588 thousands of euros was reclassified under
the heading of provision (Note 22).
(ii) The items include positive balances, to be paid in 2017 and 2018, in the total amount of 2.6 million
euros, following the Group’s adhesion to the optional regime of revaluation of fixed tangible assets and
investment property in 2016.
CURRENT NON CURRENT CURRENT NON CURRENT
Accounts receivables i) 13,560 7,317 13,677 7,589
Advances of suppliers 3,102 - 5,322 -
16,662 7,317 18,999 7,589
Impairment of other receivable (848) (828) (722) (828)
15,814 6,489 18,277 6,761
30-06-201731-12-2016
AS AT JANUARY 1 2,115 1,676
Increases (Note 32) 7 3
Others (347) (129)
AS AT JUNE 30 1,775 1,550
6M 176M 16
RECEIVABLE PAYABLE RECEIVABLE PAYABLE
NON CURRENT
Value-added tax (Note 39.2) 3,617 - 3,617 -
Provisions (i) - - (2,588) -
Corporate Income taxes (ii) - 1,298- 1,298
3,617 1,298 1,029 1,298
CURRENT
Value-added tax 974 18,633 905 17,210
Corporate Income taxes (ii)1,457 1,298
- 9,779
Personnel income tax witholdings- 1,980
- 2,906
Social Security contributions - 1,895 - 2,986
Others 430 151 421 102
2,861 23,957 1,326 32,983
6,478 25,255 2,355 34,281
30-06-201731-12-2016

78
At 31 December 2016 and 30 June 2017, the amounts of IRC (Corporate Income Tax) receivable and payable
were composed as follows:
12. Income tax expense
NOS and its associated companies are subject to IRC - Corporate Income Tax - at the rate of 21% on taxable
amount (taxable profit less eventual tax losses subject to deduction), plus IRC surcharge at the maximum rate
of 1.5% on taxable profit, giving an aggregate rate of approximately 22.5%. Additionally, following the
introduction of austerity measures approved by Law 66-B/2012 of 31 December, and respective addendum
published by Law 2/2014 of 16 January, the rate (“State surcharge”) of 3% will be applied to the company’s
taxable profit between 1.5 million euros and 7.5 million euros, by 5% to the company’s taxable profit which
exceeds 7.5 million euros up to 35 million euros, and by 7% to the company’s taxable profit above 35 million
euros.
In the calculation of taxable income, amounts which are not fiscally allowable are added to or subtracted
from the book results. These differences between accounting income and taxable income may be of a
temporary or permanent nature.
NOS is taxed in accordance with the special taxation regime for groups of companies (RETGS), which covers
the companies in which it directly or indirectly holds at least 75% of their share capital and which fulfill the
requirements of Article 69 of the IRC Code.
The companies covered by the RETGS in 2017 are:
• NOS (parent company)
• Empracine
• Lusomundo Imobiliária 2
• Lusomundo SII
• NOS Açores
• NOS Audiovisuais
• NOS Cinemas
• NOS Inovação
Estimated current tax on income (20,113) (18,752)
Payments on account 15,070 953
Withholding income taxes 4,565 4,087
Others (661) 2,635
(1,139) (11,077)
30-06-201731-12-2016

79
• NOS Lusomundo TV
• NOS Madeira
• NOSPUB
• NOS Comunicações SA
• NOS Sistemas
• NOS Technology
• NOS Towering
• Per-mar
• Sontária
Under current legislation, tax declarations are subject to review and correction by tax authorities for a period
of four years, except where tax losses have occurred or tax benefits have been obtained, whose term, in these
cases, matches the deadline to use them. It should be noted that in the event of inspections, appeals or
disputes in progress, these periods may be suspended.
The Board of Directors of NOS, based on information from its tax advisers, believes that these and any other
revisions and corrections to these tax declarations, as well as other contingencies of a fiscal nature, will not
have a significant effect on the consolidated financial statements as at 30 June 2017.
A) Deferred tax
NOS and its associated companies have reported deferred tax relating to temporary differences between the
taxable basis and the book amounts of assets and liabilities, and tax losses carried forward at the date of the
statement of financial position.

80
The movements in deferred tax assets and liabilities for the semesters ended on 30 June 2016 and 2017 were as
follows:
At 30 June 2017, the deferred tax assets related to the other provisions and adjustments are mainly due to:
i) Impairments and acceleration of amortisations beyond the acceptable fiscally and other adjustments in
fixed tangible assets and intangible assets, amounted to 58.9 million euros (31 December 2016: 59.3 million
euros);
ii) Other provisions amounted to 13.9 million euros (31 December 2016: 16.4 million euros).
At 30 June 2017, the deferred tax liability related to the revaluation of assets relates mainly to the appreciation
of customers’ portfolio, telecommunications licenses and other assets of Optimus Group companies.
INCOME
(NOTE B)
EQUITY
(NOTE 17)
DEFERRED INCOME TAX ASSETS
Doubtful accounts receivable 7,704 675 - 8,379
Inventories 2,573 2 - 2,575
Other provision and adjustments 71,616 936 - 72,552
Intragroup gains 23,918 1,232 - 25,150
Liabilities recorded as part of the allocation of fair value to the liabilities
acquired in the merger8,638 (99) - 8,539
Derivatives 772 - 550 1,322
Tax incentives 7,318 (5,648) - 1,670
122,539 (2,902) 550 120,187
DEFERRED INCOME TAX ASSETS
Revaluations of assets as part of the allocation of fair value to the assets
acquired in the merger11,156 (1,524) - 9,632
Others 2,583 (172) 5 2,411
13,739 (1,696) 5 12,043
NET DEFERRED TAX 108,800 (1,206) 545 108,144
INCOME
(NOTE B)
EQUITY
(NOTE 17)
DEFERRED INCOME TAX ASSETS
Doubtful accounts receivable 7,380 226 - 7,606
Inventories 2,482 84 - 2,566
Other provision and adjustments 75,704 (2,885) - 72,819
Intragroup gains 23,034 (275) - 22,759
Liabilities recorded as part of the allocation of fair value to the liabilities
acquired in the merger7,801 (227) -
7,574
Derivatives 901 41 (328) 614
Tax incentives - - -
117,302 (3,036) (328) 113,938
DEFERRED INCOME TAX LIABILITIES
Reavaluation of fixed assets 2 - - 2
Revaluations of assets as part of the allocation of fair value to the assets
acquired in the merger7,879 (1,486) -
6,393
Derivatives 10 (10) - -
Others 2,315 27 - 2,342
10,206 (1,469) - 8,737
NET DEFERRED TAX 107,096 (1,567) (328) 105,201
30-06-2016
31-12-2016
DEFERRED TAXES
OF THE PERIOD
30-06-2017
31-12-2015
DEFERRED TAXES
OF THE PERIOD

81
At 30 June 2017, deferred tax assets were not recognised in the amount of 1.8 million euros, corresponding
mainly to tax incentives.
Deferred tax assets were recognised where it is probable that taxable profits will occur in future that may be
used to absorb tax losses or deductible tax differences. This assessment was based on the business plans of the
Group’s companies, which are regularly revised and updated.
At 30 June 2017, the tax rate used to calculate the deferred tax assets relating to tax losses carried forward
was 21% (2016: 21%). In the case of temporary differences, the rate used was 22.5% (2016: 22.5%) increased to
a maximum of 5.46% (2016: 5.46%) of state surcharge when the taxation of temporary differences in the
estimated period of application of the state surcharge was perceived as likely. Tax benefits, related to
deductions from taxable income, are considered 100%, and in some cases, their full acceptance is conditional
upon the approval of the authorities that grants such tax benefits.
Under the terms of Article 88 of the IRC Code, the Company is subject to autonomous taxation on a series of
charges at the rates set out in that Article.
Under the terms of current legislation in Portugal, tax losses generated from 2012 to 2013 and from 2014 to 2016
may be carried forward for a period of five years and twelve years, respectively, after their occurrence and
may be deducted from taxable profits generated during that period, up to a limit of 75% of the taxable profit,
in 2012 and 2013, and 70% of taxable profit, from 2014 to 2016. For tax losses generated on or after 1 January
2017 they can be carried forward for a period of five years up to a limit of 70% of taxable income.
B) Effective tax rate reconciliation
In the quarters and semesters ended on 30 June 2016 and 2017, the reconciliation between the nominal and
effective rates of tax was as follows:
2nd
QUARTER 16 6M 16 2nd
QUARTER 17 6M 17
Income before taxes 36,386 64,808 47,178 82,880
Statutory tax rate 22.5% 22.5% 22.5% 22.5%
ESTIMATED TAX 8,187 14,582 10,615 18,648
Permanent differences i) 895 2,318 (737) (1,859)
Differences in tax rate of group companies (715) (1,427) (1,692) (2,759)
Income tax related to previous years (380) (4,011) (795) (828)
Tax benefits ii) (226) (1,726) (2,018) (5,098)
State surcharge 1,974 3,633 2,036 3,404
Autonomous taxation 170 386 199 404
Provisions (Note 22) 18 107 (1,233) (1,174)
Others 8 37 (20) (80)
INCOME TAXES 9,931 13,899 6,355 10,658
Effective Income tax rate 27.3% 21.4% 13.5% 12.9%
Income tax 10,287 12,698 3,050 9,091
Deferred tax (356) 1,201 3,305 1,567
9,931 13,899 6,355 10,658

82
i) At 30 June 2016 and 2017 the permanent differences were composed as follows:
ii) This item corresponds to the amount of deferred taxes and the use of tax benefits for which there was no
record of deferred taxes: SIFIDE (Business Research and Development Tax Incentives System), a tax benefit
introduced by Law 40/2005 of 3 August, of the RFAI (Investment Tax Incentive Regime) introduced by Law
10/2009 of 10 March and of the CFEI (Tax Credit for Extraordinary Investment) introduced by Law 49/2013 of
16 July. Under the terms of the IRC (Corporate Income Tax) Code, the tax paid may not be less than 90% of
the amount which would result if the Company did not benefit from tax benefits. Therefore, this amount
corresponds to that difference, given that the amount is recorded in the controlling company under the
Special Taxation Regime for Groups of Companies, and the tax benefits are recorded in the controlled
companies.
13. Inventories
At 31 December 2016 and 30 June 2017, this item was composed as follows:
The decrease in “Inventories – Audiovisuals” is justified, mainly, by the cost recognition of broadcasting rights
acquired under the new sports content contracts (Note 37.3) of one semester (Note 26).
The movements occurred in impairment adjustments were as follows:
2nd
QUARTER 16 6M 16 2nd
QUARTER 17 6M 17
Equity method (Note 33) 3,288 9,653 (3,622) (8,971)
Others 693 651 344 707
3,981 10,304 (3,278) (8,264)
22.5% 22.5% 22.5% 22.5%
895 2,318 (737) (1,859)
INVENTORIES
Telco 45,075 43,852
Audiovisuals 15,491 1,790
60,566 45,642
IMPAIRMENT OF INVENTORIES
Telco (8,388) (8,843)
Audiovisuals (1,135) (862)
(9,523) (9,705)
51,043 35,937
30-06-201731-12-2016
AS AT JANUARY 1 9,640 9,523
Increase and decrease - Cost of products sold (Note 30) 95 256
Others (74) (74)
AS AT JUNE 30 9,661 9,705
6M 176M 16
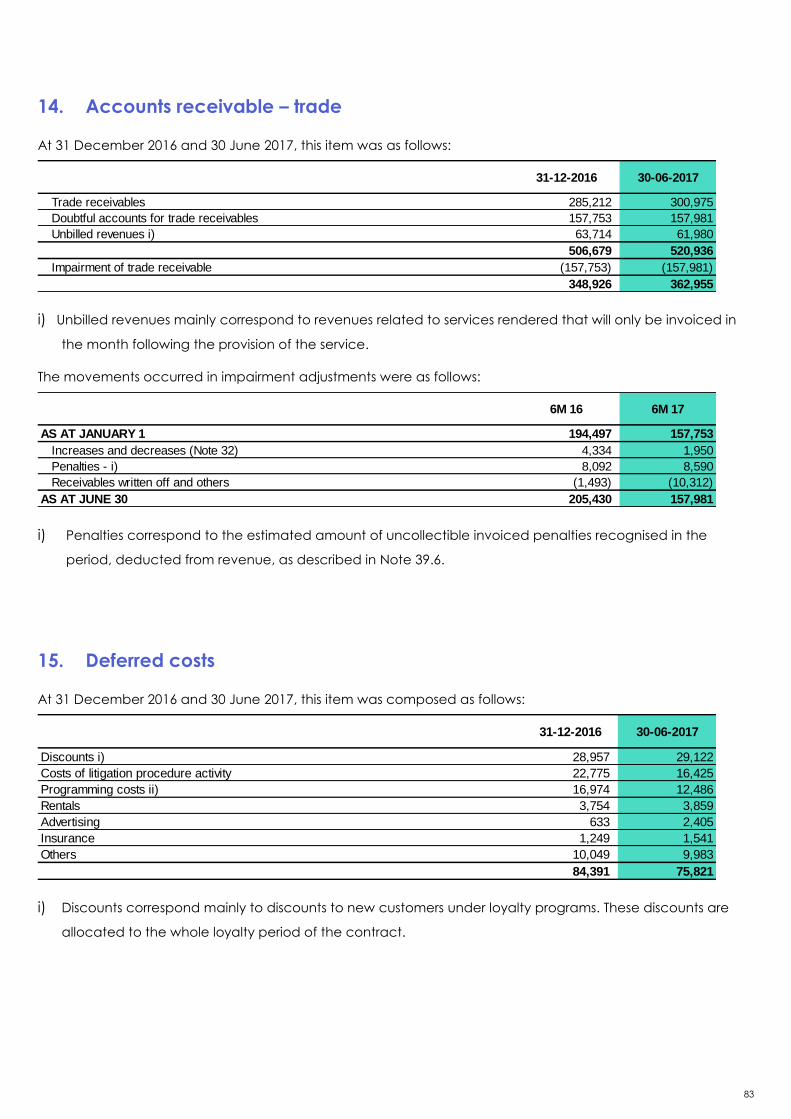
83
14. Accounts receivable – trade
At 31 December 2016 and 30 June 2017, this item was as follows:
i) Unbilled revenues mainly correspond to revenues related to services rendered that will only be invoiced in
the month following the provision of the service.
The movements occurred in impairment adjustments were as follows:
i) Penalties correspond to the estimated amount of uncollectible invoiced penalties recognised in the
period, deducted from revenue, as described in Note 39.6.
15. Deferred costs
At 31 December 2016 and 30 June 2017, this item was composed as follows:
i) Discounts correspond mainly to discounts to new customers under loyalty programs. These discounts are
allocated to the whole loyalty period of the contract.
Trade receivables 285,212 300,975
Doubtful accounts for trade receivables 157,753 157,981
Unbilled revenues i) 63,714 61,980
506,679 520,936
Impairment of trade receivable (157,753) (157,981)
348,926 362,955
30-06-201731-12-2016
AS AT JANUARY 1 194,497 157,753
Increases and decreases (Note 32) 4,334 1,950
Penalties - i) 8,092 8,590
Receivables written off and others (1,493) (10,312)
AS AT JUNE 30 205,430 157,981
6M 176M 16
Discounts i) 28,957 29,122
Costs of litigation procedure activity 22,775 16,425
Programming costs ii) 16,974 12,486
Rentals 3,754 3,859
Advertising 633 2,405
Insurance 1,249 1,541
Others 10,049 9,983
84,391 75,821
30-06-201731-12-2016

84
16. Non-current assets held-for-sale
At 31 December 2016, this item corresponds to NOS Comunicações S.A. FTTH network assets, located in the
metropolitan areas of Lisbon and Oporto, on which Vodafone has exercised its purchase option, on 25
February 2016, as per the statement of non-opposition decision by the Competition Authority to the operation
of merger between ZON and Optimus of 26 August 2013.
At 31 January 2017, the purchase and sale agreement was signed. The agreed and received sale price
amounted to 24.2 million euros, and did not give rise to any gains/losses.
17. Derivative financial instruments
Exchange rate derivatives
At the date of the statement of the financial position there were foreign currency forwards open for 4,512
thousand euros (2016: 1,032 thousand euros), the fair value is the negative amount of 35 thousand euros (2016:
positive amount of 37 thousand euros).
Interest rate derivatives
At 30 June 2017, NOS had contracted three interest rate swaps totaling 300 million euros (2016: 375 thousand
euros), whose maturities expire in 2017 (one swap in the amount of 50 million euros) and 2019 (two swaps in the
amount of 250 million euros). The fair value of interest rate swaps, is the negative amount of 2.7 million euros
(2016: negative amount of 4.0 million euros) was recorded in liabilities, against shareholder’s equity.
Own shares derivatives
At 30 June 2017, NOS had contracted five own shares derivatives, in the amount of 2,318 thousand euros
(2016: 2,041) maturing in March 2018, 2019 and 2020, in order to cover the delivery of share plans liquidated in
cash.
CURRENT NON CURRENT CURRENT NON CURRENT
Interest rate swaps 375,000 - - - 4,027
Equity Swaps 2,041 17 6 - -
Exchange rate forward 1,032 37 - - -
378,073 54 6 - 4,027
CURRENT NON CURRENT CURRENT NON CURRENT
Interest rate swaps 300,000 - - - 2,660
Equity swaps 2,318 17 - - 49
Exchange rate forward 4,512 - - 35 -
306,829 17 - 35 2,709
31-12-2016
LIABILITIES
30-06-2017
LIABILITIES
NOTIONAL
ASSETS
NOTIONAL
ASSETS
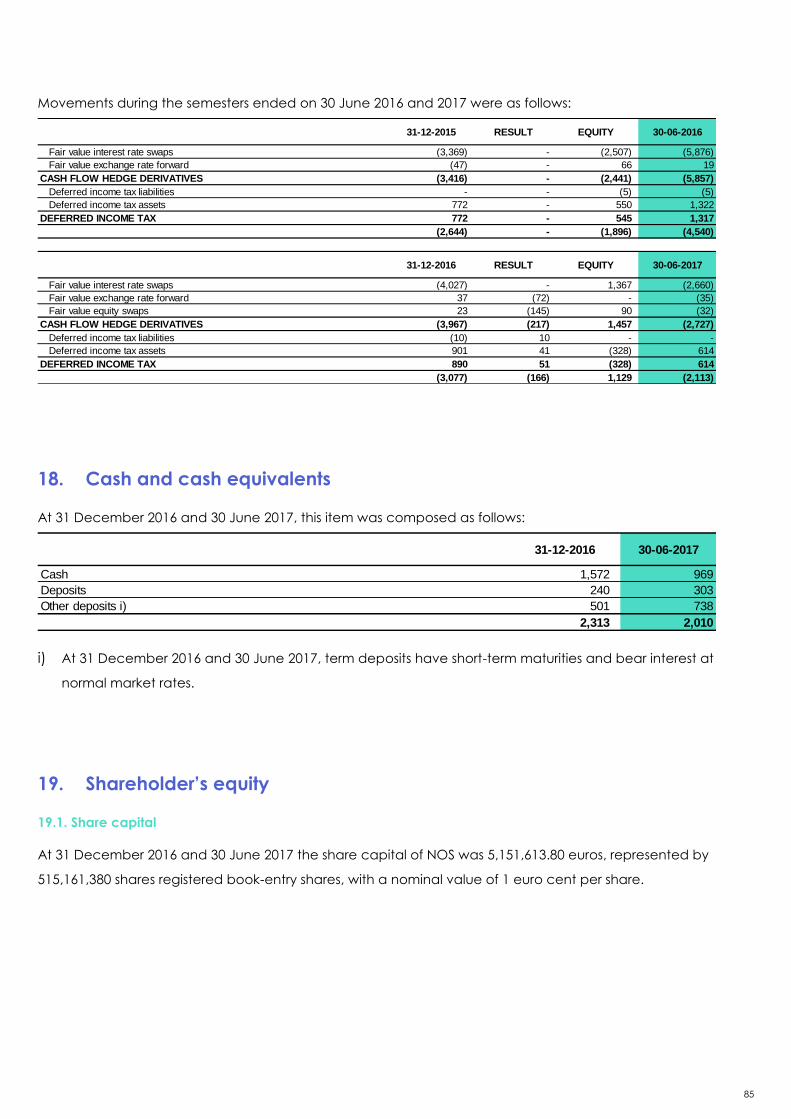
85
Movements during the semesters ended on 30 June 2016 and 2017 were as follows:
18. Cash and cash equivalents
At 31 December 2016 and 30 June 2017, this item was composed as follows:
i) At 31 December 2016 and 30 June 2017, term deposits have short-term maturities and bear interest at
normal market rates.
19. Shareholder’s equity
19.1. Share capital
At 31 December 2016 and 30 June 2017 the share capital of NOS was 5,151,613.80 euros, represented by
515,161,380 shares registered book-entry shares, with a nominal value of 1 euro cent per share.
Fair value interest rate swaps (3,369) - (2,507) (5,876)
Fair value exchange rate forward (47) - 66 19
(3,416) - (2,441) (5,857)
Deferred income tax liabilities - - (5) (5)
Deferred income tax assets 772 - 550 1,322
772 - 545 1,317
(2,644) - (1,896) (4,540)
Fair value interest rate swaps (4,027) - 1,367 (2,660)
Fair value exchange rate forward 37 (72) - (35)
Fair value equity swaps 23 (145) 90 (32)
(3,967) (217) 1,457 (2,727)
Deferred income tax liabilities (10) 10 - -
Deferred income tax assets 901 41 (328) 614
890 51 (328) 614
(3,077) (166) 1,129 (2,113)
CASH FLOW HEDGE DERIVATIVES
DEFERRED INCOME TAX
31-12-2016 RESULT 30-06-2017
30-06-201631-12-2015
CASH FLOW HEDGE DERIVATIVES
DEFERRED INCOME TAX
EQUITY
RESULT EQUITY
Cash 1,572 969
Deposits 240 303
Other deposits i) 501 738
2,313 2,010
30-06-201731-12-2016

86
The main shareholders as of 31 December 2016 and 30 June 2017 are:
(1) In accordance with subparagraphs 1.b) and 1.c) of Article 20 and Article 21 of the Portuguese Securities
Code, a qualified shareholding of 52.15% of the share capital and voting rights of company, is attributable
to ZOPT, Sonaecom and the following entities:
a. Kento Holding Limited and Unitel International Holdings B.V., as well as Isabel dos Santos, being (i) Kento
Holding Limited and Unitel International Holdings, B.V., companies directly and indirectly controlled by
Isabel dos Santos, and (ii) ZOPT, a jointly controlled company by its shareholders Kento Holding Limited,
Unitel International Holdings B.V. and Sonaecom under the shareholder agreement signed between them;
and,
b. Entities in a control relationship with Sonaecom, namely, SONTEL, BV, SONAE Investments BV, SONAE, SGPS,
S.A., EFANOR Investimentos, SGPS, S.A. and Belmiro Mendes de Azevedo, also due of such control and of
the shareholder agreement mentioned in a.
(2) Under the terms of paragraph 1 of Article 20 of the Portuguese Securities Code, the voting rights
corresponding to 2.77% of NOS share capital, held by Banco BPI Pension Fund and BPI Vida - Companhia
de Seguros de Vida, S.A are attributable to Banco BPI.
19.2. Capital issued premium
On 27 August 2013, and following the completion of the merger between ZON and Optimus SGPS, the
Company's share capital was increased by 856,404,278 euros, corresponding to the total number of issued
shares (206,064,552 shares), based on the closing market price of 27 August 2013. The capital increase is
detailed as follows:
i) share capital in the amount of 2,060,646 euros;
ii) premium for issue of shares in the amount of 854,343,632 euros.
Additionally, the premium for issue of shares was deducted in the amount of 125 thousand euros related to
costs with the respective capital increase.
The capital issued premium is subject to the same rules as for legal reserves and can only be used:
a) To cover part of the losses on the balance of the year that cannot be covered by other reserves;
b) To cover part of the losses carried forward from the previous year that cannot be covered by the net
income of the year or by other reserves;
NUMBER OF
SHARES
% SHARE
CAPITAL
NUMBER OF
SHARES
% SHARE
CAPITAL
ZOPT, SGPS, SA (1) 268,644,537 52.15% 268,644,537 52.15%
Banco BPI, SA (2) 14,275,509 2.77% 14,275,509 2.77%
Blackrock, Inc 10,349,515 2.01% 11,562,497 2.24%
MFS Investment Management - - 11,049,477 2.14%
Norges Bank 10,891,068 2.11% 10,891,068 2.11%
TOTAL 304,160,629 59.04% 316,423,088 61.42%
30-06-201731-12-2016

87
c) To increase the share capital.
19.3. Own shares
Company law regarding own shares requires the establishment of a non-distributable reserve of an amount
equal to the purchase price of such shares, which becomes frozen until the shares are disposed of or
distributed. In addition, the applicable accounting rules determine that gains or losses on the disposal of own
shares are stated in reserves.
At 30 June 2017 there were 2,047,752 own shares, representing 0.3975% of the share capital (31 December
2016: 3,017,603 own shares, representing 0.5858% of the share capital).
Movements in the semesters ended on 30 June 2016 and 2017 were as follows:
19.4. Reserves
Legal reserve
Company law and NOS’s Articles of Association establish that at least 5% of the Company’s annual net profit
must be used to build up the legal reserve until it corresponds to 20% of the share capital. This reserve cannot
be distributed except in the event of liquidation of the company, but it may be used to absorb losses after all
other reserves have been exhausted, or for incorporation in the share capital.
Other reserves
Under Portuguese law, the amount of distributable reserves is determined according to the individual financial
statements of the company prepared in accordance with IAS / IFRS. Thus, on 30 June 2017, NOS had reserves
which by their nature are considered distributable in the amount of approximately 49.7 million euros, not
including the net income.
Dividends
The General Meeting of Shareholders held on 26 April 2016 approved a proposal by the Board of Directors for
payment of an ordinary dividend per share of 0.16 euros, totaling 82,426 thousand euros. The dividend
attributable to own shares, totaling 305 thousand euros.
QUANTITY VALUE
BALANCE AS AT 1 JANUARY 2016 1,666,482 10,559
Acquisition of own shares 3,312,503 20,676
Distribution of own shares - share incentive scheme (1,497,256) (9,518)
Distribution of own shares - other remunerations (429,540) (2,745)
BALANCE AS AT 30 JUNE 2016 3,052,189 18,971
BALANCE AS AT 1 JANUARY 2017 3,017,603 18,756
Distribution of own shares - share incentive scheme (923,953) (5,743)
Distribution of own shares - other remunerations (45,898) (285)
BALANCE AS AT 30 JUNE 2017 2,047,752 12,728
DIVIDENDS
Dividends 82,426
Dividends of own shares (305)
82,121

88
The General Meeting of Shareholders held on 27 April 2017 approved a proposal by the Board of Directors for
payment of an ordinary dividend per share of 0.20 euros, totaling 103,032 thousand euros. The dividend
attributable to own shares, totaling 415 thousand euros.
20. Non-controlling interests
The movements of the non-controlling interests occurred during the semesters ended on 30 June 2016 and
2017 and the results attributable to non-controlling interests for the year are as follows:
DIVIDENDS
Dividends 103,032
Dividends of own shares (415)
102,617
31-12-2015ATTRIBUTABL
E PROFITS OTHERS 30-06-2016
NOS Madeira Comunicações 6,739 50 (6) 6,783
NOS Açores Comunicações 2,632 (37) - 2,595
Lusomundo SII 23 - - 23
Empracine - - - -
Lusomundo Imobiliária 2, SA 36 - (1) 35
9,430 13 (7) 9,436
31-12-2016ATTRIBUTABL
E PROFITS OTHERS 30-06-2017
NOS Madeira Comunicações 6,450 503 2 6,956
NOS Açores Comunicações 2,533 (108) 1 2,426
Lusomundo SII 23 - - 23
Empracine - - - -
Lusomundo Imobiliária 2, SA 35 - - 35
9,041 395 3 9,440

89
21. Borrowings
At 31 December 2016 and 30 June 2017, the composition of borrowings was as follows:
During the semester ended on 30 June 2017, the average cost of debt of the used lines was approximately
2.1% (2016: 2.2%).
21.1. Debenture loans
At 31 December 2016 and 30 June 2017, the Company has the following bonds issued, totaling 585 million
euros, with maturity after one year:
i) A bond loan in the amount 100 million euros organised by BPI bank in May 2014 and maturing in
November 2019. The loan bears interest at variable rates, indexed to Euribor and paid semiannually.
ii) A bond loan organised by four financial institutions in September 2014, amounting to 175 million euros and
maturing in September 2020. The loan bears interest at variable rates, indexed to Euribor and paid
semiannually.
iii) A private placement in the amount of 150 million euros organised by BPI bank and Caixa - Banco de
Investimento in March 2015 maturing in March 2022. The loan bears interest at variable rates, indexed to
Euribor and paid semiannually.
iv) Two bond issues organised by Caixabank amounting to 50 million euros each, and both maturing in June
2019. The first issue, held in June 2015, pays interest quarterly at a fixed rate. The issue made in July 2015,
bears interest at a variable rate indexed to Euribor and paid semiannually.
v) A bond issue in the amount of 60 million euros, signed in June 2016 and organised by ING, whose maturity
occurs in June 2023. The issue bears interest at a variable rate indexed to Euribor and paid semiannually
At 30 June 2017, an amount of 1,102 thousand euros, corresponding to interest and commissions, was
deducted from this amount and recorded in the item Loans - accruals and deferrals.
CURRENT NON CURRENT CURRENT NON CURRENT
LOANS - NOMINAL VALUE 196,216 876,667 138,486 943,333
Debenture loan - 585,000 - 585,000
Commercial paper 150,000 200,000 100,000 285,000
Foreign loans 30,027 91,667 18,333 73,333
Bank overdrafts 16,189 - 20,153 -
LOANS - ACCRUALS AND DEFERRALS 204 (4,890) 165 (3,944)
FINANCIAL LEASES 28,272 100,226 28,436 92,048
Long Term Contracts 10,785 71,287 11,161 65,445
Other 17,487 28,939 17,275 26,603
224,692 972,003 167,087 1,031,437
30-06-201731-12-2016

90
21.2. Commercial paper
At 30 June 2017, the Company has borrowings of 385 million euros in the form of commercial paper, of which
100 million euros issued without underwriting securities. The total amount contracted, under underwriting
securities, is of 570 million euros, corresponding to ten programmes, with six banks, which bear interest at
market rates. Commercial paper programmes with maturities over 1 year totaling 285 million euros are
classified as non-current, since the Company has the ability to unilaterally renew current issues on or before the
programmes’ maturity dates and because they are underwritten by the organizer. As such, this amount,
although having a current maturity, it was classified as non-current for presentation purposes in the financial
position statement.
At 30 June 2017, an amount of 534 thousand euros, corresponding to interest and commissions, was deducted
to this amount and recorded in the item Loans - accruals and deferrals.
21.3. Foreign loans
At 31 December 2016, the escrow account signed with Caixa Geral de Depósitos bears interest at a variable
rate indexed to Euribor and paid monthly amounted to 10 million euros. At 30 June 2017, this funding line is not
in use.
In November 2013, NOS signed a Finance Contract with the European Investment Bank in the amount of 110
million euros to support the development of the mobile broadband network in Portugal. In June 2014 the total
amount of funds was used. This contract matures in a maximum period of 8 years from the use of the funds,
with partial amortisations of 18,300 thousand euros per year from June 2017.
Additionally, at 30 June 2017, an amount of 2,143 thousand euros was deducted from this amount,
corresponding to the benefit associated with the fact that the loan is at a subsidised rate.
21.4. Financial leases
On 31 December 2016 and 30 June 2017, the long-term contracts are mainly related to contracts signed by
NOS SA for the acquisition of exclusive satellite use, to the contracts signed by NOS SA and NOS Technology
related to the purchase of rights to use the distribution network and the contract signed by NOS Cinemas
regarding the acquisition of digital equipment.
These medium and long term agreements under which the group has the right to use a specific asset are
recorded as finance leases in accordance with IAS 17 - Leases and IFRIC 4 - Determining whether an
arrangement contains a lease.

91
Financial leases – payments
Financial leases – present value
All bank borrowings contracted (with the exception of EIB loan of 110 million euros, bond loan in the amount
50 million euros and finance leases) are negotiated at variable short term interest rates and their book value is
therefore broadly similar to their fair value.
The maturities of the loans obtained are as follows:
22. Provisions and adjustments
At 31 December 2016 and 30 June 2017, the provisions were as follows:
i) The amount under the item Litigation and other corresponds to provisions to cover the legal and tax claims
of which stand out:
Until 1 year 33,779 33,048
Between 1 and 5 years 85,895 71,372
Over 5 years 30,615 35,012
150,289 139,432
Future financial costs (21,791) (18,948)
PRESENT VALUE OF FINANCE LEASE LIABILITIES 128,498 120,484
30-06-201731-12-2016
Until 1 year 28,272 28,436
Between 1 and 5 years 72,081 60,185
Over 5 years 28,145 31,863
128,498 120,484
30-06-201731-12-2016
UNTIL 1 YEARBETWEEN 1
AND 5 YEARSOVER 5 YEARS UNTIL 1 YEAR
BETWEEN 1
AND 5 YEARSOVER 5 YEARS
Debenture loan 1,183 372,339 209,872 1,245 522,713 59,940
Commercial paper 149,651 200,000 - 99,466 247,500 37,500
Foreign loans 29,397 71,317 18,249 17,787 71,736 -
Bank overdrafts 16,189 - - 20,153 - -
Financial Leases 28,272 72,081 28,145 28,436 60,185 31,863
224,692 715,737 256,266 167,087 902,134 129,303
30-06-201731-12-2016
Litigation and other - i) 57,697 49,669
Financial investments - ii) 825 627
Dismantling and removal of assets - iii) 29,694 29,592
Contingent liabilities - iv) 33,486 32,490
Contingencies - other - v) 24,585 21,095
146,287 133,474
30-06-201731-12-2016

92
a. Future credits transferred: for the year ended at 31 December 2010, the subsidiary NOS SA was notified of
the Report of Tax Inspection, where it is considered that the increase, when calculating the taxable profit
for the year 2008, of the amount of 100 million euros, with respect to initial price of future credits
transferred to securitization, is inappropriate. Given the principle of periodisation of taxable income, NOS
SA was subsequently notified of the improper deduction of the amount of 20 million euros in the
calculation of taxable income between 2009 and 2013. Given that the increase made in 2008 was not
accepted due to not complying with Article 18 of the CIRC, also in the years following, the deduction
corresponding to credits generated in that year, will eliminate the calculation of taxable income, to meet
the annual amortisation hired as part of the operation (20 million per year during 5 years). NOS SA
challenged the decisions regarding the 2008, 2009, 2010, 2011 and 2012 fiscal year and will appeal for the
judicial review in due time the decision regarding the 2013 fiscal year. Regarding the year 2008, the
Administrative and Fiscal Court of Porto has already decided unfavorably, in March 2014. The company
has appealed;
b. Infringement proceedings due to an alleged failure, by NOS SA, to apply the resolutions taken by
ANACOM on 26 October 2005, concerning termination rates for fixed calls. Following a deliberation of
Board of Directors of the regulator, in April 2012, a fine of approximately 6.5 million euros was applied to
NOS SA; NOS SA has appealed for the judicial review of the decision and the court has declared, in
January 2017, the nullity of the process (based on the violation of NOS, SA’s right of defense). In April 2014
ANACOM notified NOS SA of a new judicial process, based on the same accusations. This process was a
repetition of the initial one. In September 2014, ANACOM, based on the same facts, fined NOS SA in the
amount of 6.5 million euros. This second decision was contested by NOS SA. In May 2015, it was acquitted
by the Court of First Instance, which entirely revoked the decision by ANACOM and the fine which had
been applied. Following this, in May 2015 ANACOM appealed the decision, which was ruled by summary
decision as unfounded in May 2017, confirming NOS SA’s acquittal. No part appealed on the court’s final
judgment so that the proceedings became final and unappealable at the end of May 2017.In the
quarter ended on 30 June 2017 the full amount of the provision, corresponding to 6.5 million euros, was
reversed.
c. Supplementary Capital: the fiscal authorities are of the opinion that NOS SA has broken the principle of
full competition under the terms of (1) of Article 58 of the Corporate Tax Code (CIRC) – currently Article 63
–, by granting supplementary capital to its subsidiary NOS Towering, without having been remunerated at
a market interest rate. In consequence, it has been notified, with regard to the years 2004, 2005, 2006 and
2007 of corrections to the determination of its taxable income in the total amount of 20.5 million euros.
NOS SA contested the decision with regard to all the above mentioned years. As for the year 2004, the
Court has decided favorably. This decision is concluded (favorably), originating a reversal of provisions, in
2016, in the amount of 1.3 million euros plus interest. As for the years 2006 and 2007, the Oporto Fiscal and
Administrative Court has already decided unfavorably. The company has contested this decision and the
final decision of the processes is still pending;

93
ii) The amount under the item "Financial investments" corresponds to the liabilities assumed, in addition to the
investment made, by the Group in jointly controlled companies and associated companies (Note 9);
iii) The amount under the item "Dismantling and removal of assets "refers to the estimated future costs
discounted to the present value, related with the termination of the use of the space where there are
telecommunication towers and cinemas;
iv) The amount in the item "Contingent liabilities" refers to several provisions recorded for present but not likely
obligations, related to the merger by incorporation of Optimus SGPS, namely:
(1) Extraordinary contribution toward the fund for the compensation of the net costs of the universal service of
electronic communications (CLSU): The Extraordinary contribution toward the fund for the compensation
of the net costs of the universal service of electronic communications (CLSU) is legislated in Articles 17 to 22
of Law nr 35/2012, of 23 August. From 1995 until June 2014, MEO, SA (former PTC) was the sole provider for
the universal service of electronic communications, having been designated administratively by the
government, i.e. without a tender procedure, which constitutes an illegality, by the way acknowledged by
the European Court of Justice who, through its decision taken in June 2014, condemned the Portuguese
State to pay a fine of 3 million euros for illegally designating MEO. In accordance with Article 18 of the
abovementioned Law 35/2012 of 23 August, the net costs incurred by the operator responsible for
providing the universal service, approved by ANACOM, must be shared between other companies who
provide, in national territory public communication networks and publicly accessible electronic
communications services. NOS is therefore within the scope of this extraordinary contribution given that
MEO has been requesting the payment of CLSU to the compensation fund of the several periods during
which it was responsible for providing the services. In accordance with law, the compensation fund can be
activated to compensate the net costs of the electronic communications universal service, relative to the
period before the designation of the provider by tender, whenever, cumulatively (i) there are net costs,
considered excessive, the amount of which is approved by ANACOM, following an audit to their
preliminary calculation and support documents, which are provided by the universal service provider, and
(ii) the universal service provider requests the Government compensation for the net costs approved under
the terms previously mentioned.
- In 2013, ANACOM deliberated to approve the final results of the CLSU audit presented by MEO,
relative to the period from 2007 to 2009, in a total amount of 66.8 million euros, a decision which
was contested by NOS. In January 2015, ANACOM issued the settlement notes to NOS SA, NOS
Madeira and NOS Açores in the amount of 18.6 million euros, which were contested by NOS and
for which a bail was presented by NOS SGPS (Note 37) to avoid Tax Execution Proceedings. The
guarantees have been accepted by ANACOM.
- In 2014, ANACOM deliberated to approve the final results of the audit to CLSU presented by MEO,
relative to the period from 2010 to 2011, in a total amount of 47.1 million euros, a decision also
contested by the NOS. In February 2016, ANACOM issued the settlement notes to NOS SA, NOS
Madeira and NOS Açores, in the amount of 13 million euros, which were also contested and for
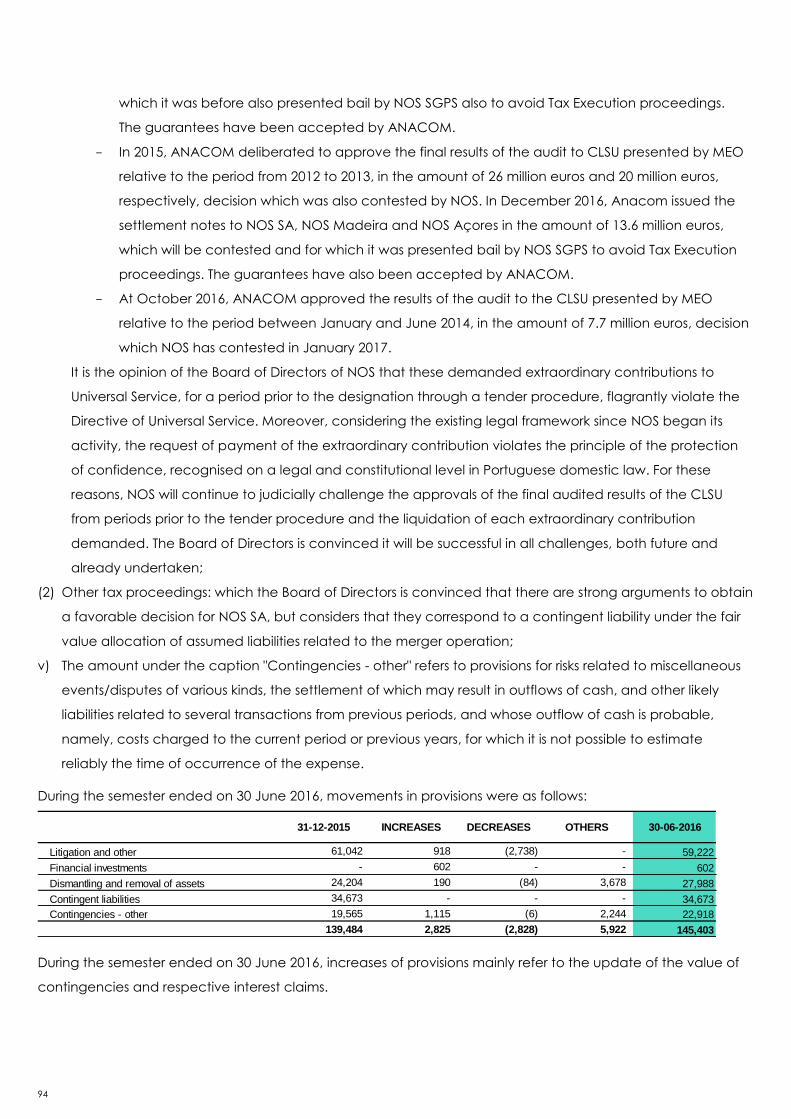
94
which it was before also presented bail by NOS SGPS also to avoid Tax Execution proceedings.
The guarantees have been accepted by ANACOM.
- In 2015, ANACOM deliberated to approve the final results of the audit to CLSU presented by MEO
relative to the period from 2012 to 2013, in the amount of 26 million euros and 20 million euros,
respectively, decision which was also contested by NOS. In December 2016, Anacom issued the
settlement notes to NOS SA, NOS Madeira and NOS Açores in the amount of 13.6 million euros,
which will be contested and for which it was presented bail by NOS SGPS to avoid Tax Execution
proceedings. The guarantees have also been accepted by ANACOM.
- At October 2016, ANACOM approved the results of the audit to the CLSU presented by MEO
relative to the period between January and June 2014, in the amount of 7.7 million euros, decision
which NOS has contested in January 2017.
It is the opinion of the Board of Directors of NOS that these demanded extraordinary contributions to
Universal Service, for a period prior to the designation through a tender procedure, flagrantly violate the
Directive of Universal Service. Moreover, considering the existing legal framework since NOS began its
activity, the request of payment of the extraordinary contribution violates the principle of the protection
of confidence, recognised on a legal and constitutional level in Portuguese domestic law. For these
reasons, NOS will continue to judicially challenge the approvals of the final audited results of the CLSU
from periods prior to the tender procedure and the liquidation of each extraordinary contribution
demanded. The Board of Directors is convinced it will be successful in all challenges, both future and
already undertaken;
(2) Other tax proceedings: which the Board of Directors is convinced that there are strong arguments to obtain
a favorable decision for NOS SA, but considers that they correspond to a contingent liability under the fair
value allocation of assumed liabilities related to the merger operation;
v) The amount under the caption "Contingencies - other" refers to provisions for risks related to miscellaneous
events/disputes of various kinds, the settlement of which may result in outflows of cash, and other likely
liabilities related to several transactions from previous periods, and whose outflow of cash is probable,
namely, costs charged to the current period or previous years, for which it is not possible to estimate
reliably the time of occurrence of the expense.
During the semester ended on 30 June 2016, movements in provisions were as follows:
During the semester ended on 30 June 2016, increases of provisions mainly refer to the update of the value of
contingencies and respective interest claims.
Litigation and other 61,042 918 (2,738) - 59,222
Financial investments - 602 - - 602
Dismantling and removal of assets 24,204 190 (84) 3,678 27,988
Contingent liabilities 34,673 - - - 34,673
Contingencies - other 19,565 1,115 (6) 2,244 22,918
139,484 2,825 (2,828) 5,922 145,403
31-12-2015 30-06-2016INCREASES DECREASES OTHERS

95
The movement recorded in Others in the amount of 3.7 million under the heading Dismantling and removal of
assets, was recorded by counterpart of Tangible assets and results mainly from the increase in provisions for
dismantling of assets in result of the change of the rate used in the update for the present value of the liability.
In addition, the movements recorded in "Other" in the amount of 2.2 million euros refers mainly to the use of
provisions set aside for compensation to employees and the reclassification of cost estimates in relation to
which can not be estimated with high reliability the time of implementation of the expenditure in the amount
of 2.8 million euros.
During the semester ended on 30 June 2017, movements in provisions were as follows:
During the semester ended on 30 June 2017, increases mainly refer to provisions for tax proceedings plus
interest and charges, namely, resulting from the unfavorable decision of a lawsuit relating to the year 2007.
Nevertheless, an appeal against this decision was filled by the company.
During the semester ended on 30 June, decreases of provisions mainly refer to the reversal of provisions for
litigation in result of favourable decisions and agreements achieved, namely, the process with Anacom
mentioned above.
The movement recorded in Others in the amount of 2.6 million euros, under Litigation and others, was
recorded by counterpart of the asset (Note 11). In addition, the movements recorded in "Other" in the amount
of 4.8 million euros refers mainly to the use of provisions set aside for compensation to employees, in the
amount of 2.2 million euros, and the reclassification of cost estimates in relation to which can not be estimated
with high reliability the time of implementation of the expenditure in the amount of 2.6 million euros.
The net movements for the semester ended on 30 June 2016 and 2017 reflected in the income statement
under Provisions and adjustments were as follows:
Litigation and other 57,697 6,074 (11,515) (2,588) 49,669
Financial investments 825 - (198) - 627
Dismantling and removal of assets 29,694 312 (93) (320) 29,592
Contingent liabilities 33,486 - (996) - 32,490
Contingencies - other 24,585 1,442 (125) (4,806) 21,096
146,287 7,828 (12,927) (7,715) 133,473
30-06-201731-12-2016 INCREASES DECREASES OTHERS
Provisions and adjustments (Note 32) (2,314) (3,448)
Financial investments (Note 9) 602 (198)
Other losses / (gains) non-recurrent 1,071 1,409
Interests - dismantling 106 219
Other interests 425 (1,906)
Income tax (Note 12) 107 (1,174)
INCREASES AND DECREASES IN PROVISIONS (3) (5,098)
6M 176M 16

96
23. Accrued expenses
At 31 December 2016 and 30 June 2017, these items were composed as follows:
i) Under the fair value allocation process of to the assets and liabilities of the Optimus Group, contractual
obligations were identified relating to long-term contracts whose prices are different from market prices.
This amount relates to the medium and long-term portion of the fair value adjustment of these contracts.
ii) Invoices to be billed by operators, mainly international operators, regarding interconnection costs related
with international traffic and roaming services.
iii) Amounts related to ANACOM licences and other ICA fees, whose invoices will be issued in subsequent
periods.
24. Deferred income
At 31 December 2016 and 30 June 2017, this item was composed as follows:
NON CURRENT
Contractual obligations i) 8,776 8,457
Others 409 612
9,185 9,069
CURRENT
Invoices to be issued by operators ii) 43,630 56,227
Vacation pay and bonuses 25,005 18,578
Investments in tangible and intangible assets 17,272 14,191
Content and film rights 15,841 18,135
ANACOM taxes and Cinema Law iii) 66 13,721
Costs of litigation procedure activity 13,066 13,706
Advertising 12,670 14,687
Programming services 11,806 12,675
Comissions 8,380 5,562
Rentals 5,835 5,694
Energy and water 3,696 3,502
Maintenance and repair 2,007 2,998
Other accrued expenses 1,622 3,189
Professional services 13,618 12,115
174,514 194,980
30-06-201731-12-2016
CURRENT NON CURRENT CURRENT NON CURRENT
Advanced billing i) 29,491 - 25,512 -
Investment subsidy ii) 632 4,138 632 3,922
30,123 4,138 26,144 3,922
30-06-201731-12-2016

97
i) This item relates mainly to the billing of Pay TV services regarding the following month to the report period
and amounts received from NOS Comunicações’ customers, related with the recharges of mobile phones
and purchase of telecommunications minutes as of yet unused.
ii) Deferred income related to the implicit subsidy when the EIB loans were obtained at interest rates below
market value (Note 21).
25. Accounts payable - trade
At 31 December 2016 and 30 June 2017, this item was composed as follows:
26. Accounts payable - other
At 31 December 2016 and 30 June 2017, this item was composed as follows:
i) NOS Comunicações, S.A. materialised a credit assignment transaction, that was coordinated by Banco
Comercial Português and Caixa Geral de Depósitos, through which it ceded future credits to be generated
by a portfolio of Corporate customers, in the amount of 55.6 million euros. In the semester ended on 30
June 2017, the balance amounted to 36.4 million euros. This does not imply any change in the accounting
treatment of the receivables or in the relationship with their customers.
Suppliers current account 232,305 205,199
Invoices in reception and conference 6,523 4,483
238,828 209,682
30-06-201731-12-2016
NON CURRENT
Assignment of receivables without resources i) 21,551 19,842
21,551 19,842
CURRENT
Fixed assets suppliers 34,772 35,633
Assignment of receivables without resources i) 18,624 16,579
Football games broadcasting rights ii) 13,500 -
Advances from customers 152 196
Others 1,685 2,489
68,733 54,897
90,284 74,739
30-06-201731-12-2016
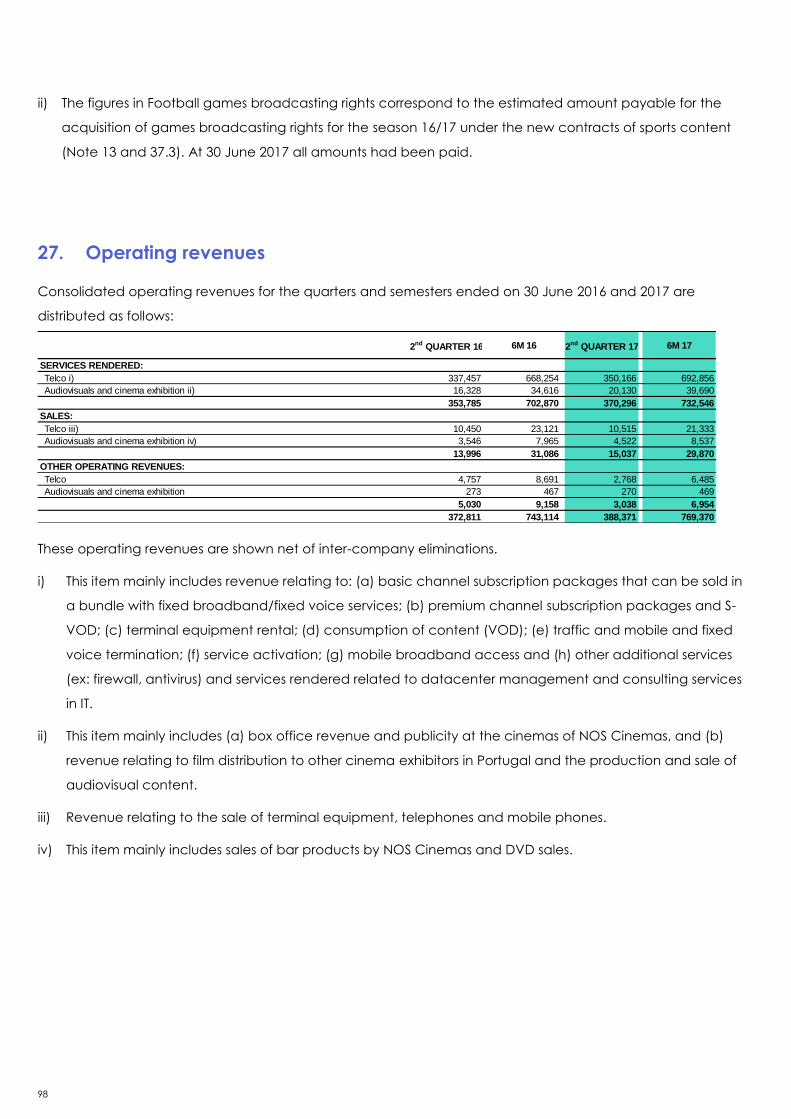
98
ii) The figures in Football games broadcasting rights correspond to the estimated amount payable for the
acquisition of games broadcasting rights for the season 16/17 under the new contracts of sports content
(Note 13 and 37.3). At 30 June 2017 all amounts had been paid.
27. Operating revenues
Consolidated operating revenues for the quarters and semesters ended on 30 June 2016 and 2017 are
distributed as follows:
These operating revenues are shown net of inter-company eliminations.
i) This item mainly includes revenue relating to: (a) basic channel subscription packages that can be sold in
a bundle with fixed broadband/fixed voice services; (b) premium channel subscription packages and S-
VOD; (c) terminal equipment rental; (d) consumption of content (VOD); (e) traffic and mobile and fixed
voice termination; (f) service activation; (g) mobile broadband access and (h) other additional services
(ex: firewall, antivirus) and services rendered related to datacenter management and consulting services
in IT.
ii) This item mainly includes (a) box office revenue and publicity at the cinemas of NOS Cinemas, and (b)
revenue relating to film distribution to other cinema exhibitors in Portugal and the production and sale of
audiovisual content.
iii) Revenue relating to the sale of terminal equipment, telephones and mobile phones.
iv) This item mainly includes sales of bar products by NOS Cinemas and DVD sales.
SERVICES RENDERED:
Telco i) 337,457 668,254 350,166 692,856
Audiovisuals and cinema exhibition ii) 16,328 34,616 20,130 39,690
353,785 702,870 370,296 732,546
SALES:
Telco iii) 10,450 23,121 10,515 21,333
Audiovisuals and cinema exhibition iv) 3,546 7,965 4,522 8,537
13,996 31,086 15,037 29,870
OTHER OPERATING REVENUES:
Telco 4,757 8,691 2,768 6,485
Audiovisuals and cinema exhibition 273 467 270 469
5,030 9,158 3,038 6,954
372,811 743,114 388,371 769,370
2nd
QUARTER 16 6M 172nd
QUARTER 176M 16

99
28. Wage and salaries
In the quarters and semesters ended on 30 June 2016 and 2017, this item was composed as follows:
In the semesters ended on 30 June 2016 and 2017, the average number of employees of the companies
included in the consolidation was 2,512 and 2,487, respectively. At 30 June 2017, the number of employees of
the companies included in the consolidation was 2,516.
The costs of compensations paid to employees, since they are non-recurring costs, are recorded in the item
Restructuring costs.
29. Direct costs
In the quarters and semesters ended on 30 June 2016 and 2017, this item was composed as follows:
The increase in Exhibition costs is justified, mainly, by the new contracts of sports content (Note 37.3) and the
revision of Sport TV’s distribution rights model.
30. Cost of products sold
In the quarters and semesters ended on 30 June 2016 and 2017, this item was composed as follows:
Remuneration 16,448 35,194 15,585 32,559
Social taxes 4,317 8,572 4,184 8,395
Social benefits 329 649 464 956
Others 802 1,306 465 978
21,896 45,721 20,698 42,888
6M 172nd
QUARTER 176M 162nd
QUARTER 16
Exhibition costs 41,906 84,465 52,726 103,906
Traffic costs 51,043 99,706 56,287 102,249
Capacity costs 11,960 24,630 11,687 23,527
Shared advertising revenues 3,840 7,082 4,124 7,571
Others 1,631 3,321 1,472 2,861
110,380 219,204 126,296 240,114
2nd
QUARTER 17 6M 176M 162nd
QUARTER 16
Costs of products sold 10,549 24,821 10,357 21,210
Inventories impairment (Note 13) 196 95 239 256
10,745 24,916 10,596 21,466
2nd
QUARTER 17 6M 176M 162nd
QUARTER 16

100
31. Support services and supplies and external services
In the quarters and semesters ended on 30 June 2016 and 2017, this item was composed as follows:
32. Provisions and adjustments
In the quarters and semesters ended on 30 June 2016 and 2017, this item was composed as follows:
33. Losses / (gains) of affiliated companies
In the quarters and semesters ended on 30 June 2016 and 2017, this item was composed as follows:
SUPPORT SERVICES:
Call centers and customer support 8,146 16,829 7,547 16,091
Information systems 4,923 9,851 4,331 8,780
Administrative support and other 8,896 18,982 11,050 21,584
21,965 45,662 22,928 46,455
SUPPLIES AND EXTERNAL SERVICES:
Maintenance and repair 11,313 21,814 11,180 22,969
Rentals 11,013 22,042 10,492 21,655
Electricity 5,257 10,485 5,915 10,671
Commissions 2,774 5,921 1,986 4,639
Professional services 2,966 5,887 3,151 6,227
Communications 1,997 3,991 1,895 3,647
Installation and removal of terminal equipment 1,993 3,920 2,760 5,499
Other supplies and external services 8,905 16,832 6,842 13,727
46,218 90,892 44,221 89,034
2nd
QUARTER 17 6M 176M 162nd
QUARTER 16
Provisions (Note 22) (524) (2,314) (7,811) (3,448)
Impairment of account receivables - trade (Note 14) 796 4,334 (1,482) 1,950
Impairment of account receivables - other (Note 10) 2 7 17 3
Others 16 23 6 10
290 2,050 (9,270) (1,485)
2nd
QUARTER 17 6M 176M 162nd
QUARTER 16
EQUITY METHOD (NOTE 9)
Sport TV 3,222 5,777 (954) (2,474)
Dreamia (180) (508) (257) (504)
Finstar 188 4,040 (2,241) (5,719)
Mstar 71 403 (175) (256)
Upstar (1) (11) - (9)
Others (12) (48) 4 (9)
3,288 9,653 (3,622) (8,971)
2nd
QUARTER 17 6M 176M 162nd
QUARTER 16

101
34. Depreciation, amortisation and impairment losses
In the quarters and semesters ended on 30 June 2016 and 2017, this item was composed as follows:
35. Financing costs and other financial expenses / (income)
In the quarters and semesters ended on 30 June 2016 and 2017, financing costs and other financial expenses /
(income) were composed as follows:
Interest earned mainly corresponds to default interests charged to customers.
In the second quarter of 2017, in the sequence of agreements achieved regarding litigation, provisions for
default interests were reversed in Others under Net other financial expenses /(income) (Note 22).
TANGIBLE ASSETS
Buildings and other constructions 3,158 6,221 2,914 5,810
Basic equipment 45,734 86,906 50,200 100,436
Transportation equipment 445 903 446 871
Tools and dies 7 12 8 16
Administrative equipment 4,887 9,396 4,173 8,282
Other tangible assets (289) (133) 85 4
53,942 103,305 57,826 115,419
INTANGIBLE ASSETS
Industrial property and other rights 44,587 90,511 45,624 91,318
44,587 90,511 45,624 91,318
INVESTIMENT PROPERTY
Investment property 7 13 - 1
7 13 - 1
98,536 193,829 103,450 206,738
2nd
QUARTER 17 6M 176M 162nd
QUARTER 16
FINANCING COSTS:
INTEREST EXPENSE:
Borrowings 4,087 8,282 4,078 8,136
Finance leases 1,588 2,974 1,312 2,885
Derivatives 544 975 737 1,362
Others 437 736 1,085 1,334
6,656 12,967 7,213 13,717
INTEREST EARNED (1,974) (4,830) (1,155) (2,748)
4,682 8,137 6,058 10,969
NET OTHER FINANCIAL EXPENSES / (INCOME):
Comissions and guarantees 1,197 2,580 1,261 2,453
Others 483 1,104 (2,202) (1,699)
1,680 3,684 (941) 754
2nd
QUARTER 17 6M 176M 162nd
QUARTER 16

102
36. Net earnings per share
Earnings per share for the quarters and semesters ended on 30 June 2016 and 2017, were calculated as follow:
In the periods above there were no diluting effects on net earnings per share, so the diluted earnings per share
are equal to the basic earnings per share.
37. Guarantees and financial undertakings
37.1. Guarantees
At 31 December 2016 and 30 June 2017, the Group had furnished sureties, guarantees and comfort letters in
favor of third parties corresponding to the following situations:
i) At 31 December 2016 and 30 June 2017, this amount relates to guarantees issued by NOS in connection
with the loans from EIB.
ii) At 31 December 2016 and 30 June 2017, this amount relates to guarantees demanded by the tax
authorities in connection with tax proceedings contested by the Company and its subsidiaries (Note 39.2).
iii) At 31 December 2016 and 30 June 2017, this amount mainly relates to guarantees provided in connection
with Municipal Wayleave Tax proceedings and guarantees provided to cinema owners, and bank
guarantees given to providers of satellite capacity renting services.
In connection with the finance obtained by Upstar from Novo Banco, totaling 20 million euros, NOS signed a
promissory note, proportional to the participation held, of 30% of the loan. At 30 June 2017 the debt amounted
to 4.4 million euros.
In connection with the finance obtained by Upstar from Banco Comercial Português, totaling 10 million euros,
NOS signed a promissory note, proportional to the participation held, of 30% of the loan.
Additionally, during 2014, in connection with a contract between Upstar and a supplier of TV contents, NOS
signed a personal guarantee, in the form of a partial endorsement, proportional to NOS’s shareholder position
of 30%, as a counter guarantee of a guarantee by Novo Banco in the amount of 30 million dollars, to pledge
Consolidated net income attributable to shareholders 26,480 50,896 40,392 71,827
Number of ordinary shares outstanding during the period (weighted average) 512,980,433 513,183,946 513,013,757 512,712,028
Basic earnings per share - euros 0.05 0.10 0.08 0.14
Diluted earnings per share - euros 0.05 0.10 0.08 0.14
2nd
QUARTER 17 6M 176M 162nd QUARTER 16
Financial instituitions i) 110,264 110,264
Tax authorities ii) 14,850 13,712
Others iii) 12,288 11,539
137,402 135,515
30-06-201731-12-2016

103
the fulfillment of the contract’s obligations. At 30 June 2017, the active amount of the guarantee is 7.5 million
euros, as a result of the supplier having partially activated the guarantee in January and May 2017, in the
amount of 12.5 million and 10 million dollars, respectively, payed afterwards with the company’s own funds.
During 2015, NOS issued a comfort letter to Caixa Geral de Depósitos as part of an issue of a bank guarantee
to Sport TV amounting to 23.1 million euros. At 30 June 2017, the active amount of bank guarantees ascends to
4.1 million euros. During the month of July the guarantee will be reduced in 50%, and the remainder in January
2018.
During the first semesters of 2015, 2016 and 2017, and following the settlement note to CLSU 2007-2009, 2010-
2011 and 2012-2013, NOS constituted guarantees in favor of the Universal Service Compensation Fund in the
amount of 23.6 million euros, 16.7 million euros and 17.4 million euros, respectively, in order to prevent the
introduction of tax enforcement proceedings in order to enforce recovery of the amounts paid.
On September 2016, NOS constituted guarantees on behalf of Sport TV, to the The Football Association League
Limited in the amount of 29.1 million euros, which, at 30 June 2017, amounted to 19.9 million euros.
NOS provided a guarantee to Warner Brothers, under the cinema distribution contract renewal for national
territory and African Portuguese speaking countries.
In addition to the guarantees required by the tax authorities, sureties were set up for the current fiscal
processes. NOS was a surety for NOS SA up to the amount of 15.3 million euros.
37.2. Operating leases
The rentals due on operating leases have the following maturities:
37.3. Other undertakings
Covenants
Of the loans obtained (excluding finance leases), in addition to being subject to the Group complying with its
operating, legal and fiscal obligations, 100% are subject to cross-default clauses, Pari Passu clauses and
negative pledge clauses and 80% to ownership clauses.
In addition, approximately 46% of the total loans obtained require that the consolidated net financial debt
does not exceed 3 times consolidated EBITDA, approximately 4% of the total loans obtained require that the
consolidated net financial debt does not exceed 3.5 times consolidated EBITDA, and approximately 6% of the
total loans obtained require that the consolidated net financial debt does not exceed 4 times consolidated
EBITDA.
AUTOMATIC
RENEWAL
UNTIL 1
YEAR
BETWEEN
1 AND 5
YEARS
OVER 5
YEARS
AUTOMATIC
RENEWAL
UNTIL 1
YEAR
BETWEEN
1 AND 5
YEARS
OVER 5
YEARS
Stores, movie theatre and other buildings 1,170 16,994 41,164 19,888 1,203 24,123 52,849 18,448
Telecommunication towers and rooftops 1,732 19,557 52,684 20,972 1,937 21,780 55,252 18,967
Equipment - 1,338 2,848 - - 3,301 7,201 -
Vehicles - 3,828 5,044 - - 2,057 2,437 -
2,902 41,717 101,740 40,860 3,140 51,261 117,739 37,415
30-06-201731-12-2016

104
The EIB loan amounting to 110 million euros, maturing in 2022, is intended exclusively to finance the investment
project to support the development of mobile broadband network in Portugal. This amount shall not, under
any circumstances, exceed 50% of the project cost.
Assignment agreements football broadcast rights
In December 2015, NOS signed a contract with Sport Lisboa e Benfica - Futebol SAD and Benfica TV, SA of
television rights of home matches of football NOS’ league, broadcasting rights and distribution of Benfica TV
Channel. The contract began in 2016/2017 sports season and has an initial duration of three years and may be
renewed by decision of either party to a total of 10 sports seasons, with the overall financial consideration
reaching the amount of 400 million euros, divided into progressive annual amounts.
Also in December 2015, NOS signed a contract with Sporting Clube de Portugal - Futebol SAD and Sporting
and Communication Platforms, S.A. for the assignment of the following rights:
1) TV broadcasting rights and multimedia home games of Sporting SAD;
2) The right to explore the static and virtual advertising at Stadium José Alvalade;
3) The right of transmission and distribution of Sporting TV Channel;
4) The right to be its main sponsor.
The contract will last 10 seasons concerning the rights indicated in 1) and 2) above, starting in July 2018, 12
seasons in the case of the rights stated in 3) starting in July 2017 and 12 and a half seasons in the case of the
rights mentioned in 4) beginning in January 2016, with the overall financial consideration amounting to 446
million euros, divided into progressive annual amounts.
Also in December 2015, NOS SA has signed contracts regarding the television rights of home senior team
football games with the following sports clubs:
1) Associação Académica de Coimbra – Organismo Autónomo de Futebol, SDUQ, Lda
2) Os Belenenses Sociedade Desportiva Futebol, SAD
3) Clube Desportivo Nacional Futebol, SAD
4) Futebol Clube de Arouca – Futebol, SDUQ, Lda
5) Futebol Clube de Paços de Ferreira, SDUQ, Lda
6) Marítimo da Madeira Futebol, SAD
7) Sporting Clube de Braga – Futebol, SAD
8) Vitória Futebol Clube, SAD
The contracts wil begin in the 2019/2020 sports season and last up to 7 seasons, with the exception of the
contract with Sporting Clube de Braga - Futebol, SAD which lasts 9 seasons.

105
During the year of 2016, NOS SA has signed contracts regarding the television rights of home senior team
football games with the following sports clubs:
1) C. D. Tondela – Futebol, SDUQ, Lda
2) Clube Futebol União da Madeira, Futebol, SAD
3) Grupo Desportivo de Chaves – Futebol, SAD
4) Sporting Clube da Covilhã – Futebol, SDUQ, Lda
5) Clube Desportivo Feirense – Futebol, SAD
6) Sport Clube de Freamunde – Futebol, SAD
7) Sporting Clube Olhanense – Futebol, SAD
8) Futebol Clube de Penafiel, SDUQ, Lda
9) Portimonense Futebol, SAD
The contracts wil begin in the 2019/2020 sports season and last up to 3 seasons.
In May 2016, NOS and Vodafone have agreed on reciprocal availability, for several sports seasons, of sports
content (national and international) owned by the companies, in order to assure to both companies, the
availability of broadcasting rights of the sports clubs home football games, as well as the broadcasting and
distribution rights of sports and sports clubs channels, whose rights are owned by each of the companies in
each moment. The agreement came into force from the beginning of the sports season 16/17, assuring access
to Benfica’s channel and Benfica’s home football games to NOS’ and Vodafone’s clients, independent from
the channel where these football games are broadcast.
Considering that the contract signed allowed for the possibility of extending the agreement to the other
operators, in July 2016 MEO and Cabovisão joined the agreement, ending the lack of availability of Porto
Canal in the NOS’s channel grid, assuring that every Pay TV client can have access to every relevant sports
content, regardless of which operator they use.
Following the agreement signed with the remaining operators, as a counterpart of the reciprocal provision of
rights, the global costs are shared according with retailer telecommunications revenues and Pay TV market
shares.
The estimated cash flows are estimated as follows:
* Includes games and channels broadcasting rights, advertising and others.
Estimated cash flows with the contracts signed bt NOS with the sport entities * 46.5 M€ 1,103 M€
NOS estimated cash flows for the contracts signed by NOS (net of the amounts
charged to the operators) and for the contracts signed by the remaining operators21.2 M€ 625 M€
Seasons 2017/18 following

106
38. Related parties
38.1. Balances and transactions between related parties
Transactions and balances between NOS and companies of the NOS Group were eliminated in the
consolidation process and are not subject to disclosure in this note.
The balances at 31 December 2016 and 30 June 2017 and transactions in the semesters ended on 39 June
2016 and 2017 between NOS Group and its associated companies, joint ventures and other related parties are
as follows:
Balances at 31 December 2016
ACCOUNTS
RECEIVABLES
ACCOUNTS
PAYABLE
ACCRUED
EXPENSES
DEFERRED
INCOME
PREPAID
EXPENSES
SHAREHOLDERS
BPI 1,614 (18) - - -
ASSOCIATED COMPANIES
Big Picture 2 Films 5 104 193 - -
Sport TV 4,971 9,634 3,454 - 13,745
JOINTLY CONTROLLED COMPANIES
Dreamia Holding BV 2,892 - - - -
Dreamia SA 2,471 1,157 293 - -
Finstar 9,550 - - 2 -
Mstar 1 - - - -
Upstar 17,880 25 - - -
ZAP Cinemas 419 - - - -
ZAP Media 3,451 - - - -
OTHER RELATED PARTIES
Digitmarket 78 273 - - 151
Itrust - Cyber Security and Intellig. , S.A. 50 931 (5) - -
Modelo Continente Hipermercados 1,233 114 142 - 4
MDS - Corretor de Seguros 83 - - - 143
SC-Consultadoria 131 - - 4 -
Sonae Ind., Prod. e Com.Deriv.Madeira 106 - - - -
Sierra Portugal 509 (19) - - 331
Sonae Center II 762 187 - 9 -
Sonaecom 107 - 270 - -
UNITEL 1,824 1,229 1,441 - -
We Do Consulting-Sist. de Informação 93 2,527 - 2 18
Worten - Equipamento para o Lar 2,773 - 703 - 4
OTHER RELATED PARTIES 882 313 (12) 1 190
51,885 16,457 6,479 18 14,586
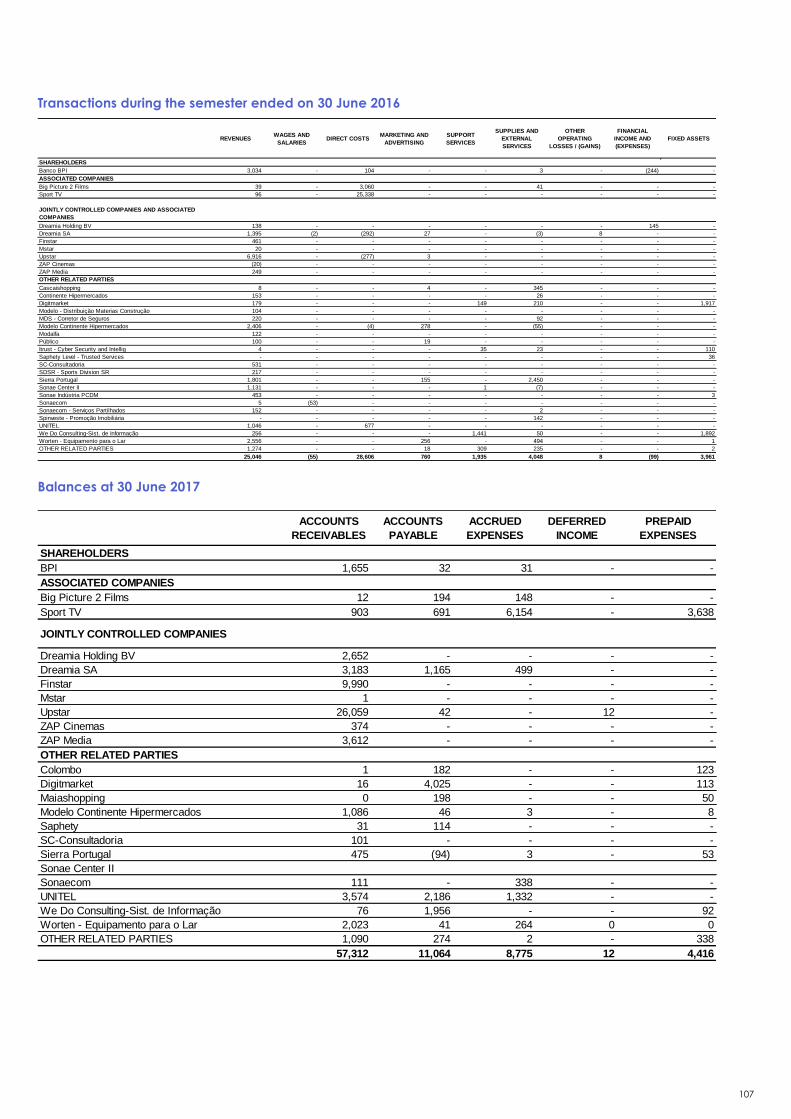
107
Transactions during the semester ended on 30 June 2016
Balances at 30 June 2017
REVENUESWAGES AND
SALARIESDIRECT COSTS
MARKETING AND
ADVERTISING
SUPPORT
SERVICES
SUPPLIES AND
EXTERNAL
SERVICES
OTHER
OPERATING
LOSSES / (GAINS)
FINANCIAL
INCOME AND
(EXPENSES)
FIXED ASSETS
SHAREHOLDERS
Banco BPI 3,034 - 104 - - 3 - (244) -
ASSOCIATED COMPANIES
Big Picture 2 Films 39 - 3,060 - - 41 - - -
Sport TV 96 - 25,338 - - - - - -
JOINTLY CONTROLLED COMPANIES AND ASSOCIATED
COMPANIES
Dreamia Holding BV 138 - - - - - - 145 -
Dreamia SA 1,395 (2) (292) 27 - (3) 8 - -
Finstar 461 - - - - - - - -
Mstar 20 - - - - - - - -
Upstar 6,916 - (277) 3 - - - - -
ZAP Cinemas (20) - - - - - - - -
ZAP Media 249 - - - - - - - -
OTHER RELATED PARTIES
Cascaishopping 8 - - 4 - 345 - - -
Continente Hipermercados 153 - - - - 26 - - -
Digitmarket 179 - - - 149 210 - - 1,917
Modelo - Distribuição Materias Construção 104 - - - - - - - -
MDS - Corretor de Seguros 220 - - - - 92 - - -
Modelo Continente Hipermercados 2,406 - (4) 278 - (55) - - -
Modalfa 122 - - - - - - - -
Público 100 - - 19 - - - - -
Itrust - Cyber Security and Intellig 4 - - - 35 23 - - 110
Saphety Level - Trusted Services - - - - - - - - 36
SC-Consultadoria 531 - - - - - - - -
SDSR - Sports Division SR 217 - - - - - - - -
Sierra Portugal 1,801 - - 155 - 2,450 - - -
Sonae Center II 1,131 - - - 1 (7) - - -
Sonae Indústria PCDM 453 - - - - - - - 3
Sonaecom 5 (53) - - - - - - -
Sonaecom - Serviços Partilhados 152 - - - - 2 - - -
Spinveste - Promoção Imobiliária - - - - - 142 - - -
UNITEL 1,046 - 677 - - - - - -
We Do Consulting-Sist. de Informação 256 - - - 1,441 50 - - 1,892
Worten - Equipamento para o Lar 2,556 - - 256 - 494 - - 1
OTHER RELATED PARTIES 1,274 - - 18 309 235 - - 2
25,046 (55) 28,606 760 1,935 4,048 8 (99) 3,961
ACCOUNTS
RECEIVABLES
ACCOUNTS
PAYABLE
ACCRUED
EXPENSES
DEFERRED
INCOME
PREPAID
EXPENSES
SHAREHOLDERS
BPI 1,655 32 31 - -
ASSOCIATED COMPANIES
Big Picture 2 Films 12 194 148 - -
Sport TV 903 691 6,154 - 3,638
JOINTLY CONTROLLED COMPANIES
Dreamia Holding BV 2,652 - - - -
Dreamia SA 3,183 1,165 499 - -
Finstar 9,990 - - - -
Mstar 1 - - - -
Upstar 26,059 42 - 12 -
ZAP Cinemas 374 - - - -
ZAP Media 3,612 - - - -
OTHER RELATED PARTIES
Colombo 1 182 - - 123
Digitmarket 16 4,025 - - 113
Maiashopping 0 198 - - 50
Modelo Continente Hipermercados 1,086 46 3 - 8
Saphety 31 114 - - -
SC-Consultadoria 101 - - - -
Sierra Portugal 475 (94) 3 - 53
Sonae Center II
Sonaecom 111 - 338 - -
UNITEL 3,574 2,186 1,332 - -
We Do Consulting-Sist. de Informação 76 1,956 - - 92
Worten - Equipamento para o Lar 2,023 41 264 0 0
OTHER RELATED PARTIES 1,090 274 2 - 338
57,312 11,064 8,775 12 4,416
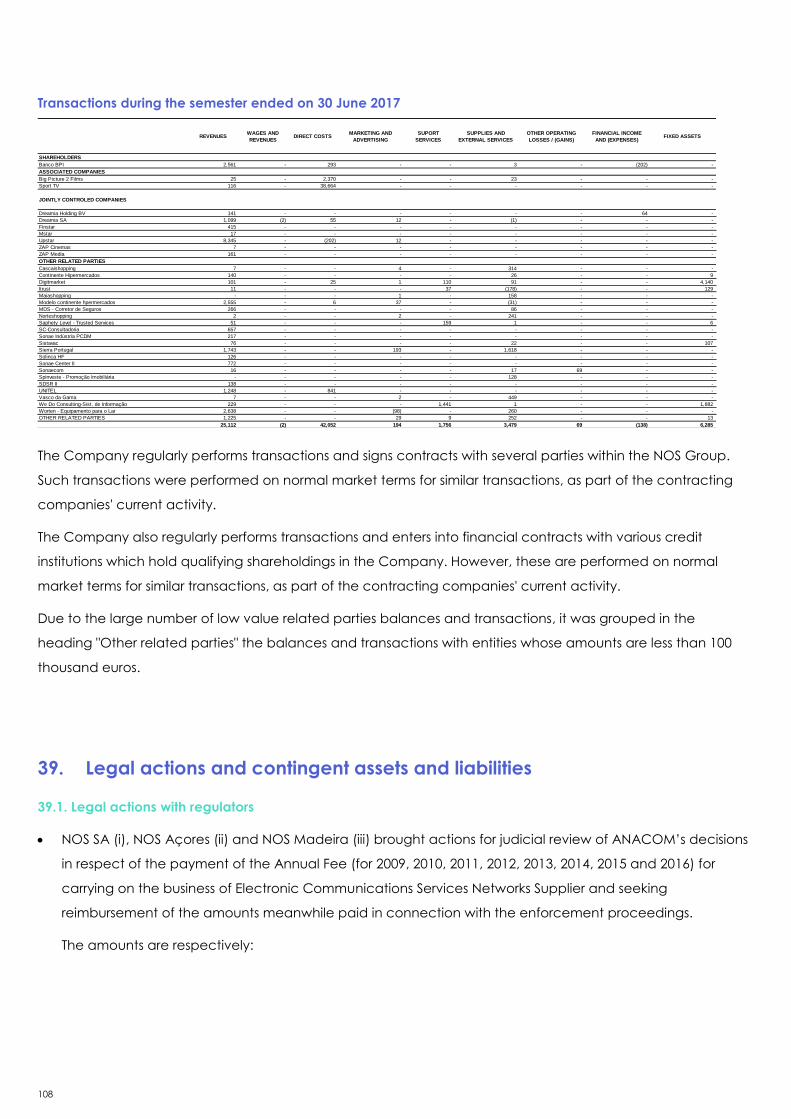
108
Transactions during the semester ended on 30 June 2017
The Company regularly performs transactions and signs contracts with several parties within the NOS Group.
Such transactions were performed on normal market terms for similar transactions, as part of the contracting
companies' current activity.
The Company also regularly performs transactions and enters into financial contracts with various credit
institutions which hold qualifying shareholdings in the Company. However, these are performed on normal
market terms for similar transactions, as part of the contracting companies' current activity.
Due to the large number of low value related parties balances and transactions, it was grouped in the
heading "Other related parties" the balances and transactions with entities whose amounts are less than 100
thousand euros.
39. Legal actions and contingent assets and liabilities
39.1. Legal actions with regulators
NOS SA (i), NOS Açores (ii) and NOS Madeira (iii) brought actions for judicial review of ANACOM’s decisions
in respect of the payment of the Annual Fee (for 2009, 2010, 2011, 2012, 2013, 2014, 2015 and 2016) for
carrying on the business of Electronic Communications Services Networks Supplier and seeking
reimbursement of the amounts meanwhile paid in connection with the enforcement proceedings.
The amounts are respectively:
REVENUESWAGES AND
REVENUESDIRECT COSTS
MARKETING AND
ADVERTISING
SUPORT
SERVICES
SUPPLIES AND
EXTERNAL SERVICES
OTHER OPERATING
LOSSES / (GAINS)
FINANCIAL INCOME
AND (EXPENSES)FIXED ASSETS
SHAREHOLDERS
Banco BPI 2,561 - 293 - - 3 - (202) -
ASSOCIATED COMPANIES
Big Picture 2 Films 25 - 2,370 - - 23 - - -
Sport TV 116 - 38,664 - - - - - -
JOINTLY CONTROLED COMPANIES
Dreamia Holding BV 141 - - - - - - 64 -
Dreamia SA 1,099 (2) 55 12 - (1) - - -
Finstar 415 - - - - - - - -
Mstar 17 - - - - - - - -
Upstar 8,345 - (202) 12 - - - - -
ZAP Cinemas 7 - - - - - - - -
ZAP Media 161 - - - - - - - -
OTHER RELATED PARTIES
Cascaishopping 7 - - 4 - 314 - - -
Continente Hipermercados 140 - - - - 26 - - 9
Digitmarket 101 - 25 1 110 91 - - 4,140
Itrust 11 - - - 37 (178) - - 129
Maiashopping - - - 1 - 158 - - -
Modelo continente hpermercados 2,555 - 6 37 - (31) - - -
MDS - Corretor de Seguros 266 - - - - 86 - - -
Norteshopping 2 - - 2 - 241 - - -
Saphety Level - Trusted Services 51 - - - 159 1 - - 6
SC-Consultadoria 657 - - - - - - - -
Sonae Indústria PCDM 217 - - - - - - - -
Sistavac 76 - - - - 22 - - 107
Sierra Portugal 1,743 - - 193 - 1,618 - - -
Solinca HF 126 - - - - - - - -
Sonae Center II 772 - - - - - - - -
Sonaecom 16 - - - - 17 69 - -
Spinveste - Promoção Imobiliária - - - - - 128 - - -
SDSR II 138 - - - - - - - -
UNITEL 1,248 - 841 - - - - - -
Vasco da Gama 7 - - 2 - 449 - - -
We Do Consulting-Sist. de Informação 229 - - - 1,441 1 - - 1,882
Worten - Equipamento para o Lar 2,638 - - (98) - 260 - - -
OTHER RELATED PARTIES 1,225 - - 29 9 252 - - 13
25,112 (2) 42,052 194 1,756 3,479 69 (138) 6,285

109
o NOS SA: 2009: 1,861 thousand euros, 2010: 3,808 thousand euros, 2011: 6,049 thousand euros, 2012:
6,283 thousand euros, 2013: 7,270 thousand euros, 2014: 7,426 thousand euros, 2015: 7,253 thousand
euros and 2016: 8,242 thousand euros;
o NOS Açores: 2009: 29 thousand euros, 2010: 60 thousand euros, 2011: 95 thousand euros, 2012: 95
thousand euros, 2013: 104 thousand euros, 2014: 107 thousand euros, 2015: 98 thousand euros and
2016: 105 thousand euros;
o NOS Madeira: 2009: 40 thousand euros, 2010: 83 thousand euros, 2011: 130 thousand euros, 2012:
132 thousand euros, 2013: 149 thousand euros, 2014: 165 thousand euros, 2015: 161 thousand euros
and 2016: 177 thousand euros,
This fee is a percentage decided annually by ANACOM (in 2009 it was 0.5826%) of operators’ electronic
communications revenues. NOS SA, NOS Açores and NOS Madeira claim, i) defects of
unconstitutionality and illegality related with the inclusion, in the calculation of costs, of the provisions
constituted by Anacom related to litigation (including challenges in court to the charge of the fee) and
ii) that only revenues from the electronic communications business per se, subject to regulation by
ANACOM, should be considered for the purposes of the application of the percentage and the
calculation of the fee payable, and that revenues from television content should be excluded.
On 18 December 2012 a ruling was passed on the proceedings instigated by NOS SA for the annual
rate of 2009, for which the appeal was upheld, with no prior hearing, condemning ICP-ANACOM to pay
the costs. ANACOM appealed and by decision of July 2013, this appeal was not upheld.
The remaining proceedings are awaiting trial and/or decision.
During the first quarter of 2017, NOS was notified by ANACOM, of the opening of an administrative
infraction proceeding related with price update announcements, at the end of 2016. At the date of
approval of these financial statements, it is not possible to determine the scope of the proceeding and,
therefore, its outcome. The group’s Board of Directors considers it is not likely that the outcome of this
proceeding will affect significantly the Group's financial statements.
39.2. Tax authorities
During the course of the 2003 to 2016 financial years, some companies of the NOS Group were the subject of
tax inspections for the 2001 to 2014 financial years. Following these inspections, NOS SGPS, as the controlling
company of the Tax Group, and companies not covered by Tax Group, were notified of the corrections made
to the Group's tax losses, to VAT and stamp tax and to make the payments related to the corrections made to
the above exercises. The total amount of the notifications unpaid is about 20 million euros, added interest and
charges. Note that the Group considered that the corrections were unfounded, and contested the amounts
mentioned. The Group provided the bank guarantees demanded by the tax authorities in connection with
these proceedings, as stated in Note 37.

110
At the end of year 2013 and taking advantage of the extraordinary settlement scheme of tax debts, the
Group settled 7.7 million euros. This amount was recorded as "Taxes receivable" non-current net of the provision
recorded (Note 11).
As belief of the Board of Directors of the Group, supported by our lawyers and tax advisors, the risk of loss of
these proceedings is not likely and the outcome thereof will not affect materially the consolidated position.
39.3. Actions by MEO against NOS SA, NOS Madeira and NOS Açores and by NOS SA against MEO
In 2011, MEO brought an action in Lisbon Judicial Court against NOS SA, claiming payment of 10.3 million
euros, as compensation for alleged undue portability of NOS SA in the period between March 2009 and
July 2011. NOS SA lodged a contest and reply, having started the expert evidence, that the Court however
declared void. The hearing was held in late April and early May 2016, having a ruling been delivered last
September, which judged the action partially founded, based not on the existence of undue portability,
but on the mere delay of the documentation shipment. NOS was condemned to pay, approximately 5.3
million euros, a decision which NOS appealed and it’s pending at the Lisbon Judicial Court.
MEO made three court notices to NOS SA (April 2013, July 2015 and March 2016), three to NOS Açores
(March and June 2013 and May 2016) and three to NOS Madeira (March and June 2013 and May 2016), in
order to stop the prescription of alleged damages resulting from claims of undue portability, absence of
response time to requests submitted to them by MEO and alleged illegal refusal of electronic portability
requests.
MEO doesn’t indicate in all notifications the amounts in which it wants to be financially compensated,
realizing only part of these, in the case of NOS SA, in the amount of 26 million euros (from August 2011 to
May 2014), in the case of NOS Açores, in the amount of 195 thousand euros and NOS Madeira, amounting
to 817 thousand euros.
In 2011, NOS SA brought an action in Lisbon Judicial Court against MEO, claiming payment of 22.4 million
euros, for damages suffered by NOS SA, arising from violations of the Portability Regulation by MEO, in
particular, the large number of unjustified refusals of portability requests by MEO in the period between
February 2008 and February 2011. The court declared the compulsory performance of expert evidence. At
the same time, experts who will be tasked with the economic and financial expertise have been
appointed, and this should begin soon.
It is the understanding of the Board of Directors, supported by lawyers who monitor the process, that there
is, in substance, a good chance of NOS SA winning the action, due to the fact that MEO has already been
convicted for the same offense, by ICP – ANACOM. Nevertheless, it is impossible to determine the
outcome of the action. However, in the event of this instance being acquitted, trial costs, under NOS’
responsibility, may amount to 1,150 thousand euros.
111
39.4. Action against NOS SGPS
In 2014, a NOS SGPS provider of marketing services has brought a civil lawsuit seeking a payment of about
1,243 thousand euros, by the alleged early termination of contract and for compensation.
This instance was acquitted due to passive illegitimacy of NOS SGPS, decision confirmed by superior Courts
and that, meanwhile, was concluded.
Afterwards, the same company brought a new civil lawsuit based on the same facts, but this time, against
NOS Comunicações. NOS appealed in September 2016.
About the major issue, it is the understanding of the Board of Directors that the arguments used by the author
are not upheld, reason why it is the belief of the Board that the outcome thereof will not affect materially the
consolidated position.
39.5. Action against Sport TV
Action brought by Cogeco Cable INC., former shareholder of Cabovisão, against Sport TV, NOS SGPS and
a third party, requesting, among others: (i) joint condemnation of the three institutions to pay
compensation for damages caused by anti-competitive conduct, guilty and illegal, between 3 August
2006 and 30 March 2011, specifically for the excess price paid for Sport TV channels by Cabovisão, in the
amount of 9.1 million euros; (ii) condemnation for damages corresponding to the remuneration of capital
unavailable, in the amount 2.4 million euros; and (iii) condemnation for damages corresponding to the loss
of business from anti-competitive practices of Sport TV, in connection with the enforcement proceedings.
NOS contested the action and a preliminary hearing took place in the beginning of June. Currently the
parties are preparing the questions to submit to the European Court of Justice
It is the understanding of the Board of Directors, corroborated by the lawyers overseeing the case, that, for
reasons of formal nature, it is not likely that NOS will be directly responsible in this case.
Cabovisão brought an action against Sport TV, in which it requests compensation from the latter for alleged
losses resulting from abuse of a dominant position, amounting to 18 million euros, added capital and
interests that will be due as of 31 December 2014, and lost profits. The Board of Directors of Sport TV and
lawyers, who monitor the process, predict a favorable outcome, not estimating impacts in the accounts, in
addition to those already registered.
39.6. Contractual penalties
The general conditions that affect the agreement and termination of this contract between NOS and its
clients, establish that if the products and services provided by the client can no longer be used prior to the
end of the binding period, the client is obliged to immediately pay damages.
Until 31 December 2014, revenue from penalties, due to inherent uncertainties was recorded only at the
moment when it was received, so at 30 June 2017, the receivables by NOS SA, NOS Madeira and NOS Açores

112
amount to a total of 79,923 thousand euros. During the semester ended on 30 June 2017, 1,028 thousand euros
related to 2014 receivables were received and recorded in the income statement.
From 1 January 2015, revenue from penalties is recognised taking into account an estimated collectability rate
taking into account the Group's collection history. The penalties invoiced are recorded as accounts
receivable and amounts determined as uncollectible are recorded as impairment by deducting revenue
recognised upon invoicing (Note 14).
39.7. Interconnection tariffs
At 30 June 2017, accounts receivable and accounts payable include 37,139,253 euros and 29,913,608 euros,
respectively, resulting from a dispute between the subsidiary NOS SA and, essentially, the operator MEO –
Serviços de Comunicação e Multimédia, S.A. (previously named TMN – Telecomunicações Móveis Nacionais,
S.A.), in relation to the indefinition of interconnection tariffs, recorded in 2001. In the lower court, the decision
was favorable to NOS SA. The Court of Appeal, on appeal, rejected the intentions of MEO. However, MEO
again appealed to the Supreme Court, for final and permanent decision, who upheld the decision of the
“Tribunal da Relação” (Court of Appeal), thus concluding that the interconnection prices for 2001 were not
defined. The settlement of outstanding amounts will depend on the price that will be established.
40. Share incentive scheme
On 23 April 2014, the General Meeting approved the Regulation on Short and Medium Term Variable
Remuneration, which establishes the terms of the Share Incentive Scheme ("NOS Plan"). This plan aimed at
more senior employees with the vesting taking place three years after the shares being awarded, assuming
that the employee is still with the company during that period.
In addition to the NOS Plan above mentioned, at 30 June 2017, are still unvested:
(i) The Share Incentive Scheme approved by the General Meetings of Shareholders on 27 April 2008
("Standard Plan"). The Standard Plan is aimed at eligible members selected by the responsible bodies,
regardless of the roles they perform. In this plan the vesting period for the assigned shares is five years,
starting twelve months after the period to which the respective assignment relates, at a rate of 20% a year,
as long as the employee stays in the company during each of these five periods.

113
As at 30 June 2017, the unvested plans are:
During the semester ended on 30 June 2017, the movements that occurred in the plans, are detailed as
follows:
(1) Refers mainly to correction made for dividends paid, exit of employees not entitled to the vesting of shares
and other adjustments resulting from the way the shares are vested.
The share plans costs are recognised over the year between the awarding and vesting date of those shares.
The responsibility is calculated taking into consideration the share price at award date of each plan, however
for the Mainroad plan, the award date is the date of the acquisition (the time of conversion of Sonaecom
shares plans into NOS shares plans). As at 30 June 2017, the outstanding responsibility related to these plans is
4,741 thousand euros and is recorded in Reserves, in the amount of 3,948 thousand euros, for plans liquidated
in shares and in Accrued expenses, in the amount of 793 thousand euros, for plans liquidated in cash.
The costs recognised in previous years and in the period, and its liabilities are as follows:
41. Subsequent events
Until the date of the approval of this document, there were no other significant subsequent events that merit
disclosure in this report.
These financial statements are a translation of the financial statements originally issued in Portuguese, in
accordance with International Financial Reporting Standards (IAS / IFRS) as adopted by the European Union
NUMBER OF
SHARES
STANDARD PLAN
Plan 2013 60,035
NOS PLAN
Plan 2015 687,538
Plan 2016 762,280
Plan 2017 842,159
STANDARD
PLAN
MAINROAD
PLANNOS PLAN
BALANCE AS AT 31 DECEMBER 2016: 180,067 41,958 2,303,014
MOVEMENTS IN THE PERIOD:
Awarded - - 834,211
Vested (117,296) (41,958) (764,699)
Cancelled / elapsed / corrected (1) (2,736) - (80,549)
BALANCE AS AT 30 JUNE 2017: 60,035 - 2,291,977
Costs recognised in previous years related to plans as at 31 December 2016 1,199 6,317 7,516
Costs of plans vested in the period (781) (3,760) (4,541)
Costs recognised in the period and others 375 1,391 1,766
TOTAL COST OF THE PLANS 793 3,948 4,741
RESERVES TOTALACCRUED
EXPENSES

114
and the format and disclosures required by those Standards, some of which may not conform to or be
required by generally accepted accounting principles in other countries. In the event of discrepancies, the
Portuguese language version prevails.
42. Annexes
A) Companies included in the consolidation by the full consolidation method
(a) Company established on March 2017.
EFFECTIVE DIRECT EFFECTIVE
31-12-2017 30-06-2017 30-06-2017
NOS, SGPS, S.A. (Holding) Lisbon Management of investments - - - -
Empracine - Empresa Promotora de Atividades
Cinematográficas, Lda.Lisbon Movies exhibition
Lusomundo
SII100% 100% 100%
Lusomundo - Sociedade de investimentos
imobiliários SGPS, SALisbon Management of Real Estate NOS 100% 100% 100%
Lusomundo Imobiliária 2, S.A. Lisbon Management of Real EstateLusomundo
SII100% 100% 100%
Lusomundo Moçambique, Lda. Maputo Movies exhibition and commercialization of other public events NOS Cinemas 100% 100% 100%
NOS Sistemas, S.A. ('NOS Sistemas') Lisbon Rendering of consulting services in the area of information systems NOS SA 100% 100% 100%
NOS Sistemas España, S.L. Madrid Rendering of consulting services in the area of information systems NOS SA 100% 100% 100%
NOS Açores Comunicações, S.A. Ponta DelgadaDistribution of television by cable and satellite and operation of
telecommunications services in the Azores areaNOS SA 84% 84% 84%
NOS Audiovisuais, SGPS, S.A. LisbonManagement of social participations in other companies as an
indirect form of economic activity NOS 100% 100% 100%
NOS Communications S.à r.l Luxembourg Management of investments NOS 100% 100% 100%
NOS Comunicações, S.A. Lisbon
Implementation, operation, exploitation and offer of networks and
rendering services of electronic comunications and related
resources; offer and commercialisation of products and equipments
of electronic communications
NOS 100% 100% 100%
NOS Inovação, S.A. Matosinhos
Achievement and promotion of scientific activities and research
and development as well as the demonstration, dissemination,
technology transfer and formation in the fields of services and
information systems and fixed solutions and last generation mobile,
television, internet, voice and data, and licensing and engineering
services and consultancy
NOS 100% 100% 100%
NOS Internacional, SGPS, S.A. LisbonManagement of social participations in other companies as an
indirect form of economic activity NOS 100% 100% 100%
NOS Lusomundo Audiovisuais, S.A. LisbonImport, distribution, commercialization and production of audiovisual
productsNOS 100% 100% 100%
NOS Lusomundo Cinemas , S.A. Lisbon Movies exhibition and commercialization of other public events NOS 100% 100% 100%
NOS Lusomundo TV, Lda. LisbonMovies distribution, editing, distribution, commercialization and
production of audiovisual products
NOS
Audiovisuais100% 100% 100%
NOS Madeira Comunicações, S.A. FunchalDistribution of television by cable and satellite and operation of
telecommunications services in the Madeira areaNOS SA 78% 78% 78%
NOSPUB, Publicidade e Conteúdos, S.A. Lisbon Comercialization of cable tv contents NOS SA 100% 100% 100%
NOS TECHNOLOGY – Concepção, Construção
e Gestão de Redes de Comunicações, S.A.
('Artis')
Matosinhos
Design, construction, management and exploitation of electronic
communications networks and their equipment and infrastructure,
management of technologic assets and rendering of related
services
NOS 100% 100% 100%
NOS TOWERING – Gestão de Torres de
Telecomunicações, S.A. (‘Be Towering’)Lisbon
Implementation, installation and exploitation of towers and other sites
for the instalment of telecommunications equipmentNOS 100% 100% 100%
Per-Mar – Sociedade de Construções, S.A.
('Per-Mar')Lisbon
Purchase, sale, renting and operation of property and commercial
establishmentsNOS 100% 100% 100%
Sontária - Empreendimentos Imobiliários, S.A.
('Sontária')Lisbon
Realisation of urbanisation and building construction, planning,
urban management, studies, construction and property
management, buy and sale of properties and resale of purchased
for that purpose
NOS 100% 100% 100%
Teliz Holding B.V. Amsterdam Management of group financing activities NOS 100% 100% 100%
HEADQUARTERS ACTIVITYSHARE
HOLDER
PERCENTAGE OF OWNERSHIP
COMPANY

115
B) Associated companies
C) Jointly controlled companies
Financial investments whose participation is less than 50% were considered as joint arrangements due to
shareholder agreements that confer joint control.
D) Companies recorded at cost
a) The financial investments in these companies are fully provisioned.
EFFECTIVE DIRECT EFFECTIVE
31-12-2016 30-06-2017 30-06-2017
Big Picture 2 Films, S.A. OeirasImport, distribution, commercialization and production of
audiovisual products
NOS
Audiovisuais20.00% 20.00% 20.00%
Canal 20 TV, S.A. Madrid Produção e Distribuição de direitos de produtos televisivos NOS 50.00% 50.00% 50.00%
Sport TV Portugal, S.A. Lisbon
Conception, production, realization and commercialization of
sports programs for telebroadcasting, purchase and resale of the
rights to broadcast sports programs for television and provision of
publicity services
NOS 33.33% 25.00% 25.00%
HEADQUARTERS ACTIVITYSHARE
HOLDER
PERCENTAGE OF OWNERSHIP
COMPANY
EFFECTIVE DIRECT EFFECTIVE
31-12-2016 30-06-2017 30-06-2017
Dreamia Holding B.V. Amsterdam Management of investmentsNOS
Audiovisuais50.00% 50.00% 50.00%
Dreamia - Serviços de Televisão, S.A. LisbonConception, production, realization and commercialization of
audiovisual contents and provision of publicity services
Dreamia
Holding BV50.00% 100.00% 50.00%
East Star Ltd Port Louis
Management of investments involved in the development, operation
and marketing, through any technological means, of
telecommunications, television and audiovisual products and
services
Teliz Holding
B.V.30.00% 30.00% 30.00%
FINSTAR - Sociedade de Investimentos e
Participações, S.A.Luanda
Distribution of television by satellite, operation of
telecommunications services
Teliz Holding
B.V.30.00% 30.00% 30.00%
MSTAR, SA MaputoDistribution of television by satellite, operation of
telecommunications servicesNOS 30.00% 30.00% 30.00%
Upstar Comunicações S.A. Vendas Novas
Electronic communications services provider, production,
commercialization, broadcasting and distribution of audiovisual
contents
NOS 30.00% 30.00% 30.00%
ZAP Media S.A. Luanda
Projects development and activities in the areas of entertainment,
telecommunications and related technologies, the production and
distribution of the contents and the design, implementation and
operation of infrastructure and related facilities
FINSTAR 30.00% 100.00% 30.00%
ZAP Cinemas, S.A. Luanda
Projects development and activities in the areas of entertainment,
telecommunications and related technologies, the production and
distribution of the contents and the design, implementation and
operation of infrastructure and related facilities
FINSTAR 30.00% 100.00% 30.00%
ZAP Publishing, S.A. Luanda
Projects development and activities in the areas of entertainment,
telecommunications and related technologies, the production and
distribution of the contents and the design, implementation and
operation of infrastructure and related facilities
ZAP Media 30.00% 100.00% 30.00%
HEADQUARTERS ACTIVITYSHARE
HOLDER
PERCENTAGE OF OWNERSHIP
COMPANY
EFFECTIVE DIRECT EFFECTIVE
31-12-2016 30-06-2017 30-06-2017
Turismo da Samba (Tusal), SARL (a) Luanda n.a. NOS 30.00% 30.00% 30.00%
Filmes Mundáfrica, SARL (a) Luanda Movies exhibition NOS 23.91% 23.91% 23.91%
Companhia de Pesca e Comércio de
Angola (Cosal), SARL (a)Luanda n.a. NOS 15.76% 15.76% 15.76%
Caixanet – Telecomunicações e
Telemática, S.A.Lisbon Telecommunication services NOS 5.00% 5.00% 5.00%
Apor - Agência para a Modernização do
PortoOporto Development of modernizing projects in Oporto NOS 3.98% 3.98% 3.98%
Lusitânia Vida - Companhia de Seguros,
S.A ("Lusitânia Vida")Lisbon Insurance services NOS 0.03% 0.03% 0.03%
Lusitânia - Companhia de Seguros, S.A
("Lusitânia Seguros")Lisbon Insurance services NOS 0.04% 0.02% 0.02%
HEADQUARTERS ACTIVITYSHARE
HOLDER
PERCENTAGE OF OWNERSHIP
COMPANY

116
Limited review Report prepared by Auditor
registered in CMVM

117
In accordance with Article 246, paragraph 1, c) of the Securities Code, the Board of Directors of NOS, SGPS,
SA, whose name and roles are listed below, declare that, to their knowledge:
a) The first half 2017 accounts, were elaborated in compliance with the applicable accounting standards,
accurately and truthfully portraying the assets and liabilities, situation and results, as well as those of the
companies included in its consolidation perimeter;
b) The management report faithfully portrays the important events occurred in First Half 2017 and its impact on
the accounts and, when applicable, contains a description of the main risks and uncertainties for the following
six months.
Lisbon, 20 July 2017
Jorge Brito Pereira
(Chairman of the Board of Directors)
Miguel Nuno Santos Almeida
(Chairman of the Executive Committee)
José Pedro Faria Pereira da Costa
(Vice President, Member of the Executive Committee)
Ana Paula Garrido de Pina Marques
(Member of the Executive Committee)
André Nuno Malheiro dos Santos Almeida
(Member of the Executive Committee)
Statement by the Board of Directors under the terms of
Article 246, Paragraph 1, c), of the Securities Code

118
Jorge Filipe Santos Graça
(Member of the Executive Committee)
Luis Moutinho do Nascimento
(Member of the Executive Committee)
Manuel Ramalho Eanes
(Member of the Executive Committee)
Ângelo Gabriel Ribeirinho dos Santos Paupério
(Member of the Board of Directors)
António Bernardo Aranha da Gama Lobo Xavier
(Member of the Board of Directors)
António Domingues
(Member of the Board of Directors)
Catarina Eufémia Amorim da Luz Tavira Van-Dúnem
(Member of the Board of Directors)
João Torres Dolores
(Member of the Board of Directors)
Joaquim Francisco Alves Ferreira de Oliveira
(Member of the Board of Directors)
Lorena Solange Fernandes da Silva Fernandes
(Member of the Board of Directors)
Maria Cláudia Teixeira de Azevedo
(Member of the Board of Directors)
Mário Filipe Moreira Leite da Silva
(Member of the Board of Directors)

119
(English version of the Portuguese original. In the event of discrepancy, the Portuguese original shall prevail)
Within the scope of its competences, under the terms of Article 246, Paragraph 1, c) of the Portuguese
Securities Code, the Fiscal Board declares that, to its knowledge:
a) the first half 2017 accounts, were elaborated in compliance with the applicable accounting standards,
accurately and truthfully portraying the assets and liabilities, situation and results of NOS, SGPS, S.A., as well
as those of the companies included in its consolidation perimeter;
b) the management report faithfully portrays the important events occurred in First Half 2017 and its impact on
the accounts and contains a description of the main risks and uncertainties for the following six months.
Lisbon, 20 July 2017
Paulo Cardoso Correia da Mota Pinto
(Chairman of the Fiscal Board)
Patrícia Teixeira Lopes
(Member of the Fiscal Board)
Eugénio Ferreira
(Member of the Fiscal Board
Statement by the Fiscal Board under the terms of Article
246, Paragraph 1, c), of the Securities Code

120
Rua Ator António Silva, 9
1600-404 Lisboa
Portugal