1.25 111111 - ncjrs.gov survey data ... a firearm is stolen, and the number of firearms stolen, ......
TRANSCRIPT

'" , if
I
f
""
National Criminal Justice Reference Service i--------------~~~-----------------------------------------------
! nCJrs This microfiche was produced from documents received for inclusion in the NCJRS data base. Since NCJRS cannot exercise control over the physical condition of the documents submitted, the individual frame quality will vary. The resolution chart on this frame may be used to evaluate the document quality.
1.0
111111.1
\\\\\1.25 111111.4 111111.6
MICROCOPY RESOLUTION TEST CHART NATIONAL BUREAU Of STA,~DARDS-19b3 A
Microfilming procedures used to create this fiche comply with the standards set forth in 41CFR 101-11.504.
Points of view or opinions stated in this document are those of the author{s) and do not represent the official position or policies of the U. S. Department of Justice.
National Institute of Justice United States Department of Justice Washington, D. C. 20!)31
7/6/84
DATA ON HAND,GUN USE .IN ILLINOIS . October 1981
.. . . . ~ "
I:,'') .. :.. .' . ... '. ." 1 • \ .~ • • • '," "'.~ .... .'~ u. . " 1" .
, ,.,' '" '. . ~.... .. ~ . . \.
~, ~1
.,. ','.~
.' --.'~. " ~ ~ ',t • _" • -t
• • •• ,l..
~ ""t.' ..' ~" Q;.~
~, ' ':!,', ........ ~... ,.' ,'. ',' l~
w , • ~;. ; I • ,- •• ' " .":, I. " ',; ~ ~
• • ':. .' ",' ,. .. '; , .... ~ ." • ~ .. -,l (' .... ,""~~
If you have issues viewing or accessing this file contact us at NCJRS.gov.
:1
l
---------------..-----------~-~-.- . •
-
I:.~ ] I.: ] .;J I_I J I~I ] I ] .I J I~: ] I: ] I ] I: ] I: ]
I~' 1 I~~ ]
DATA ON HANDiGUN USE IN ILLINOIS
October 1981
By Carolyn R. Block and
Louise S. Miller
ILLINOIS CRIMINAL JUSTICE INFORMATION AUTHORITY William Gould, Chairman
J. David Coldren, Executive Director
U.S. Department of Justice National Institute of Justice
This documenl has been reproduced exaclly as received from Ihe person or organization originating II POints of view or opinions stated In this document are those of the authors and do not necessarily represent the oHlcml position or policies of the National Institute of Justice.
Permission to reproduce this copyrighted material has been
grtnrnhois Criminal Justice Infonnation .... fiuthority .-~----.--~----.-- .--
to the National Criminal Justice Reference S8Ivice (NCJRS).
Further reproduction outside of the NCJRS system requires permisSion 01 the copyright owner
This is a reprint of a report originally published by the Statistical Analysis Center of the Illinois Law Enforcement Commission. On January 1, 1983 the powers and duties of the Law Enforcement Commission were transferred to the Illinois Criminal Justice Information Authority.

------~----~------~---------.. -~~------
Contents
Page
Introduction ................................................. ~.;
Lost or Stolen Handguns ...................................... 1 Deaths in Firearm Accidents .................................. 3 Firearm Use to Resist Violent Crime .......................... 6
NRA Survey Data ...................... ,................... 6 Resisting Robbery ........................................ 9 Resisting Rape ........................................... 14
Printed by authority 9f the State of Illino;s June 1983 - second printing
50 copies Pr; nti ng Order Number: 83-11

...-. ---.-..oIII(..-:o-----r--.--- ......----......,~ ~~---------------------..... -------.----------------------------------------~--- - - - ---
I: ]; [I ];
I I]; II)
I I
111 I 1 111 I]
II 111 I I 1 II]
[I]
rll [11 [II [[I
[II
I J I "I
INTRODUCTION
This report was written in response to questions raised by the Judiciary II Subco~nittee on Handguns of the Illinois General Assembly. The information necessary to answer many of these questions, such as data on stolen handguns, firearm accidental deaths, and the outcome of victims' use of handguns to resist violent crime, are often unavailable or difficult for policy makers or the public to obtain.
In this report, the Statistical Analysis Center attempts to determine what data are available on handgun use in Illinois. If the data are available, the report discusses their quality and provides som~ examples of the data and some suggestions for their interpretation.
This report could not have been written without the help and cooperation of a number of people, including Larry Dykstra, Sergeant Tim Tidmarsh of the Chicago Police Department, Paul Blackman of the National Rifle Association, Dr. Robert Stein, Chief Medical Examiner of Cook County, Mark Karlin of the Committee for Handgun Control, Jean Spadafora of the National Safety Council, Richard Block, Wes Skogan, M. Joan McDermott, Pauline Bart, and the entire staff of the Statistical Analysis Center.
This report is a response to certain questions on handgun use, and not a comprehensive survey of handgun data. For a survey of Illinois data on firearm availability and firearm owners, see another Statistical Analysis Center report, "Guide to Illinois Firearm Data. II For a rev i ew of othey· state and f edera 1 1 aws, see J. Blose and P. J. Cook, "Regulating Handgun Transfers," Center for the Study of Policy Analysis, Duke University, 1980.
~\'

~-------. ----------~--------------~.~--~--------------~-------------------~
I ~1 I· ];
, ..
[ ~];
[.1
[ ]
I J
ILLINOIS LAW ENFORCEMENT COMMISSION I '\) ',I It 'I I I I·' 1\ I h: '->11)1 I 'I \ " \
( I lIt \( ,I ) II I IN( )J', I ,( II ,\ Ii ,
\ I.' l I ,·1 I ,I,( )
October 2, 1981
Representative Emil J. Soucek, Chairman Judiciary II Subcommittee on Handguns Illinois General Assembly 4428 Harvey Avenue Western Springs, Illinois 60558
Dear Representative Soucek:
I was grateful for the opportunity to attend the hearings of your subcommittee held on Tuesday, September IS. A recurring theme in the hearings seemed to be the 'lack of data on the use of handguns. In particular, I noticed people on both sides mentioning the lack of data on the following points:
- The number of handguns kept at home "under the pillow" that are stolen in burglaries in Illinois.
- The number of people killed in handgun accidents in Illinois.
- The number of people in Illinois who successfully defend themselves in a violent crime witt- ' handgun.
- The number of people in Illinois who try to defend themselves in a violent crime with a handgun, but who fail and are injured or killed.
In response to the Subcommittee's interest in such data, the Statistical Analysis Center has found that some accurate and potentially informative data sources do exist. We have compiled some of these data into the attached report.
I hope you will find this information to be useful. If you would like a more detailed analysis of any of the data sets, or if you have additional questions about crime data, please call me.
CRB:om Attachment
Si ncerel y, 4 ~, 'l$foJ<:-Carolyn Rebecca Block, Ph.D. Senior Analyst Statistical Analysis Center

.------- --------------------~-------~-- ~ ~--~----------------------------------------------~------------------~~-------
[,]
l..1 I. ] I: ] (11
I]. l .' (' ] [I]
II] II] II] ~I] [I)
III (II ~ ~ I rI ~ I [1 ~ r<
LOST OR STOLEN HANDGUNS
The Illinois Department of Law Enforcement (OLE) collects information on the number of reported criminal offenses in which
a firearm is stolen, and the number of firearms stolen, from each
of the more than one thousand police jurisdictions in Illinois, except Chicago. 1 The data have been collected monthly since 1972,
and include information on the type of firearm, such as handgun, and the criminal offense. The Statistical Analysis Center maintains an edition of this OLE file, and can compile reports containing information for total Illinois, any county or court circuit,
or any individual jurisdiction. 2
Information on handguns stolen in violent and property crimes in the Chicago collar counties (the metropolitan area
excluding Chicago) and the downstate counties appears in Table 1.
We have separated crimes occurring in residences from crimes
occurring elsewhere. In 1978 and again in 1979, about fifteen hundred offenses in which a handgun was stolen were reported to
police, and about thirty-five hundred handguns were stolen in
these residential crimes. In many of these criminal incidents,
more than one handgun was stolen.
IThere are 1070 police jurisdictions in Illinois, 714 of which report data directly to OLE. The rest report through another agency, such as a sheriff's office.
2Los t or stolen firearm data are not available for Chicago.
1

I ] l ] I,]
('] - ,
['] - ,
(I]
i 11 -I ]' I '
ill - ,
I
['] - 1
(iJ _ f'
[ '] _ D
[ , J . '"
[ :~ I [ ~ I [ ") • I'
[ : I f
['I
Table 1
HANDGUNS REP~R¥~D LOST OR STOLEN DURING CRIMINAL OFFENSESa Illinois outside of Chicago
Residential b
1978 1979
Incidents Handguns Incidents Handguns Stolen Stolen
Collar Co~ntiesc 572 1,200 674 1,385 Downstate 972 2,092 1,105 2,414
Total e 1,544 3,292 1,779 3,799
Commercial/Otherb
Incidents Handguns Incidents Handguns Stolen Stolen
Collar Co~ntiesc 310 2,301 344 645 Downstate 437 1,104 511 1,070
Total e 747 3,405 855 1,715
Source: SAC edition of Illinois Uniform Crime Reports Property Loss Data.
aOffenses include Homicide, Rape, Robbery~ Burglary, Theft, Motor Vehicle Theft, Arson, Deception, Vandalism. Attempted offenses are excluded. More than one handgun may be stolen in one criminal incident.
b"Residential" place of occurrence includes private residences (including garage and yard), apartments, mobile homes, and co 11 ege res i dence halls. "Commerc i a 1 10ther" includes all other possible locations.
c"Collar Counties" include DuPage, Lake', McHenry, Will, and Cook Counties. Chicago Police Department totals are excluded from Cook County due to reporting inadequacies.
d"Downstate" includes all 97 counties not listed above.
ellTotal" does not include Chicago.
2

~-....... ---------~-----------.----~~--~~~ -~~~ un '2 I 4# •
f
t1 j:~
'I
t "
"
1 I ~.
( '~~1
1 [ ~ .
[ ~,1
[ ~"I [ r~1
[ .~ I [ .1
DEATHS IN FIREARM ACCIDENTS
Chicago Data
Little data exist on firearm accidents. Illinois statute
(Chapter 38, Section 206-3.2) requires medical personnel to report all firearm injuries known to them to the police. However, the Chicago Police Department does not normally keep tallies
of the number of reported firearm accidents. (Due to personnel shortages, police priorities on gunshot injury calls are to determine whether a crime was committed, and that the gun is properly registered.)
However, according to Sergeant Tim Tidmarsh of the Crime Analysis Unit of the Chicago Police Department (744-6240), the police conducted a study in early 1981, to determine the
number of non-fatal accidents, fatal accidents, and suicides with firearms in Chicago. The study, which was discontinued for lack of personnel, found the following:
Accidental injuries with a firearm
Accidental deaths with a fi rearm
POll CE PER IOD
123 Jan. 1 - Feb. 5 - March 5 -
Feb. 4, 1981 March 4, 1981 April 1, 1981
15
1
19
2
16
o
The office of the Medical Examiner of Cook County published yearly accidental deaths and suicides with a firearm totals in its "1977-1979 Annua 1 Report. II These numbers are:
SUICIDES ACCIDENTAL DEATHS by Gun Total 6y Gun ToEal
1977 197 493 6 1,752 1978 106 503 4 1,645 1979 196 431 3 1,660
3
~ I

--____ ~~-_r~-----~------------- -----~--- ~ --- ~ --~------------- ---------------------~~---
l.l l ]
lil I ] ['1 ('1 (')
1]-I -. I]
[I III I !J I RJ I~]
II) (II (II (II I~I
- ~ ~ ~
At present, the Medical Examiner's Office has monthly breakdowns of these data only for Cook County for 1977 and 1978. However~ the Office plans to computerize all of its past and present
data sometime in 1982. When the system is fully operational, it will be easier for the staff to answer requests for data. In the meantime, special permission is needed to access unpublished information. Write or call:
Roy Dames, Administrative Assistant Office of the Medical Examiner of Cook County 1828 West Polk Chicago, Illinois 60612 (312) 443-5010
The Chicago office of the Committee for Handgun Control
tries to gather firearm accident data when possible. Call Mark
Karlin, at (312) 641-5575.
National Data
The following agencies do not collect or maintain any fire
arm accident data:
The Chicago Board of Health (Department of Health)
The American Medical Association
However, the National Safety Council publishes a booklet containing data on accidental firearm deaths nationwide. Figure 1 shows the
pattern of change from 1968 through 1980 in the number of such
deaths.
4

~ ---~--.,.,.,""-------~-----~---------~---- - - ~ -----
r
\
~~~~~~~~~~~~~~~~~~~
.... ,': -~" -.1:-.." ~ .... -r-.... --r-~ -r .....r ~ ,-/--7-..r -L ,-,..:L-~ -J...... '-f -'!f;-'-I + '-' -+ '-.J-:*-I .... i t- I.-JI+ r....t-
Figure 1
UNITED STATES ACCIDENTRL FIREARM DEATHS, 1968-1980
Source: National Safety Council edition of National Center for Health Statistics death certificate totals. 1979 and 1980 totals are NSC estimates .
o o o ~ .... , ...
o o o
. • •••• ....... :. ' ... _ .................... "! ,,,., ....................... " .•• ,.
~ ....... ""." ...... " ............ ".~ .... --=~;...:::..;~
o o o N
_ 0
0 0
-0 x~ .... , ...... " ........ " .... .
<n :Co f-O a:o Will .. " .... 0-
l!.. DO
o 0:' u..!~ QJ~
4 ::l Z
o o g." .......... " ............................. .
o o g .............. " ........ , ... " ....... ,.
o o ~ ....... , ...... , ........... ,.~ .......... ' ..... , ., .... ,
o
. ." ,., ..... -................. ' .-............ ,." '''' .................................... :., , .. ,"" , ......... , ......... " ........ " ... "' ..... ,." ....................... .
................ , ......... " ................ " ....... ,., .................. ", .. ..
. .. -....... -.. ' .............. ~.'." .......... - ......... :
o
~tee~e-----I~sS~9----~le-7o-----.IS-71----~19-72------19r7S------19r7-y-----I'S7-S-----I'97-S-----IT97-7-----I's7-e-----I's-7S-----.1s-eo-----.------~
I LLI NCl IS LRW ENFClRCEMENT CClMM I SS I ClN ( CJ IS J STATISTICAL ANALYSIS CENTER GRAPH
YEARS, 1968-1980
• ....... -~ ... $, "
..
II· , l . I
l J . I J l . II) II) [11 III III [I]
[I J III
I Irl 1[1 ttl 11'1
I
(I I:
I'J
I l
FIREARM USE TO RESIST VIOLENT CRIME
The most serious violent crimes, those the FBI counts as violent Index crimes, are murder, forcible rape, aggravated assault and robbery. The following section discusses the use of a weapon to resist three of these -- rape, robbery, and those homicides that began as a robbery.
Although we discuss a general survey of "Use of a Gun for Protection", a specific discussion of homicides that began as assaults is beyond the scope of this report. In an assault, what begins as a simple argument may escalate through threat and counter-threat, violence and counter-violence, until someone is injured or killed. 1
It is often difficult to distinguish the victim from the offender, and the question of victim resistance is, therefore, difficult to define. In contrast, because the typical rObbery or forcible rape has a clearly defined victim and offender, the question of victim resistance is much more clearly defined.
Resistance occurs when a person who is threatened with rape or robbery by an aggressor attempts to prevent the rape or robbery. This section reviews the data available on the use of a firearm to resist such violent crimes.
NRA Survey Data
The National Rifle Association conducted two surveys in 1978 that included questions about gun use "for protection." Table 2 presents the findings from these surveys. In general, seven per cent of those interviewed said that someone in their household had "ever" used a gun fat' protecti on against a person.
1See R. L. Block, Violent Crime: Environment, Interaction and Death, Lexington Books, 1977, and M. Straus and R. Gelles, PhyslcaJ Violence in American Families, a 1976 national survey of 2143 households, data available from the Interuniversity Consortium for Political and Social Research, Ann Arbor, Michigan.
[,;1 [ . r I I I
r
I [I [ r 1 I rl [ I] L I] .[ I (I)
I :J [ IJ ( I"] I'):
• [I. • r. III .11
I
The figures in Table 2 should be treated very cautiously,
however, for the following reasons:
- No response rate is given. We do not know how many people refused to be interviewed or refused to respond to the
specific questions on gun use. The seven per cent figure
for protection against a person is based on the telephone survey, and response rates to telephone surveys are often very low.
- The samples were households of registered voters. Therefore, the findings can be generalized only to registered voters, not the general public, and only to households, not to individuals.
- The wording of the questions did not bound the answers in time. The householder was asked whether anyone in the household had lIeverll, in their lifetime, protected himself or herself with a gun. Therefore, these data cannot tell us the percent of people who used a gun for protection in any given year.
- What does II pro tection ll mean? The interview does not
define it, and leaves the definition to the person being interviewed. While protection probably includes incidents of protection against a threatened violent crime, it
probably also includes incidents having nothing to do with
a violent crime, such as frightening a trespasser off your property. It may also include robbers who used a gun
to protect themselves while committing a crime.
- The interview questions do not distinguish between
handguns and long guns .
- Neither survey obtained information on the outcome of gun
use for protection. If the gun were used to resist a threatened violent crime, was the resistance successful? Was the person's property stolen? Was the person injured,
and if so, how seriously? Obviously, persons who were killed in such an incident have a reduced chance of being inclu -d . I .•

..
L , JI 1'\ Iii Ii,
~
--~- --~--~~~----~-~-~--------
1 01 i pJ
,
I pi
I ;~I I ~J ( ~J [ ,I [ r J [I)
I J I
I,J ( rJ I,J I [I
IIJ II I[~ ~rl - I
Table 2
Use of a Gun for Protection NRA Surveys, 1978a
"Have you yourself or a member of your household ever used a gun, even
if it wasn't fired, for self-protection or for protection of property
at home, at work or elsewhere (except in military and police work)?"
Used to Protect Used to Protect agai nst a Person against a or Animal Person
(Per Cent) (Per Cent)
Total Sample 14% 7%
Urban/Rural Residence Big cities 9 3 Other citi es 15 12 Suburbs 12 6 Rural 18 8
Regional Residence Northeast 10 4 South 18 11 Midwest 12 3 West 15 10
Total N 2510 b 1010c
aSource: Two national surveys of samples of registered voter households conducted in May-June and December 1978 by Decision Making Informat'ion for the National Rifle Association, inserted into the Congressional Record on March 29,1979, and reprinted by the NRA as "0M! Poll Highlights." The first survey was conducted by personal interview. The second survey was a telephone follow-up conducted to verify the first. There is no information given on the response rate.
bThese figures are based on combined data from the two surveys.
cThese figures are based on data from the telphone survey only.

-------.-------------------------~ .. ----~--4F
Resisting Robbery
Generally, victim survey data are not suitable to analyze the consequences of a victim's resistance to a violent
crime. One possible consequence -- death -- is not measured. Although police aggregate statistics on homicides are, in
general, very detailed, they do not include information on the victim's resistance.
A study done in Chicago in 1975 is the only data set we
were able to find1
that contains information on all three stages in the interaction between the victim and offender in a violent crime:
1. The offender's threat, including the weapon and the crime (robbery, rape, etc.)
2. The victim's response, including resistance with a
weapon, other forceful resistance, and verbal or other resistance.
3. The eventual outcome, including whether or not the
threatened crime was actually carried out and whether or not the victim was injured or killed.
This study analyzed the outcomes of all attempted robberies
known to the police that occurred every fifth day of four police periods in Chicago. It did not include commercial robberies, robberies
-'-Philip J. Cook, in "The Effect of Gun Availability on Robbery and Robbery Murder," R. Haveman and B.B. Zellner (eds.), Policy Studies Review Annual 3(1979:743-781), compares aggregate robbery and robbery murder data sets, but does not trace each robbery attempt to its outcome, and has no information on resistance to a robbery murder.
9
J:,
~ II " . hI "f
1:1
;J
\:
~ _o ___ ~~ ----~ -~~ ----~ ~-~-------
[ ~J
[ b,1 [ PII·
l e"I· [ ~~J
[ C?I
[ ~J
[ ~J:
[ ! J [ [.
[~ [ [1
[ I]
[ [I
: [! [ ~I [ CI or .. ,
occurring to victims who ~ere not residents of Chicago or robberies not reported to the police. 1 The possible property outcomes of each attempted robbery were 1) that the victim's property would be stolen, in which case the attempted robbery would become an actual robbery, or 2) that the victim's property would not be stolen. Possible injury outcomes were 1) no injury, 2) some injury, but not hospitalized, 3) hos~italized and 4) killed, in which case the attempted robbery would become a robbery homicide. The results appear in Tables 3 and 4.
The consequences of resisting a robbery depend upon the offender's weapon. If the offender has a firearm, resistance will increase the victim's chance of being injured or killed from five per cent to 46 per cent. Resisters to a strongarm robbery have almost as high a chance of being injured or killed as resisters to a firearm robbery (42%), but they also stand a good chance of injury even if they do not resist (23%.) Victims of a robbery with a knife or other weapon have a good chance of injury or death if they do not resist (21%), and if they do resist, this chance increases to 64 per cent.
Even though resistance increases the chance of injury or death, it may protect the victim's property. Victims who do not resist are almost certain to have their property stolen (97% to 98%), but 19% of resisters to firearm robberies, 22% of resisters to knife and other robberies and 26% of resisters to strongarm robberies succeed in deterring the robbery attempt.
Does the weapon available to the victim affect the victim's ability to resist a robbery attempt successfully? Is resistance with a gun more effective than resistance with a knife or resistance with no weapon? The answer depends upon the offender's weapon. (See Table 4.)
IFor discussions of robbery victim survey data, see P.J. Cook, "A Strategic Analysis of Robbery", in W. Skogan (ed.) Sample Surveys of the Victims of Crime, Ballinger, 1976, and R.L. Block and C.R. Block, "Decisions and Data" 1 Journal of Criminal Law and Criminology, Winter 1980. --

--.. ------~--------------------~----------------------------------------------~----~ --
_'- 42; 4$2 •
[ ~J ,l J. l e,.)
[ c.J
[ ~]
[ .. ] i ] .. '"
[ ~] [ ~]:
[~]
[ cl r ,e]
r" ,,) [-' ~I:
r'" :1 [" ,~I [. :'1 [ ~:Ii
Table 3
CONSEQUENCES OF RESISTING A ROBBERY Chi cago. 1975
Offender's Weapon
Fi rearm Knife or Othera None (Stronqarm) Outcome of Vlctlm Keslstance"{ Vlctlm Reslstance. Vlctlm Reslstance? Robbery Attempt Yes No Yes No Yes No
Property Stolen? Yes 81% 98% 78% 97% 74% 98% No 19 2 22 3 26 2 -- -- -- -- --
(Total N)b (83) (600 ) (55) (115 ) (127) (308)
Victim I8jured? Yes 46% 5% 64% 21% 42% 23% No 54 95 36 79 58 77 -- --
(Total N)b (83) (598) (55) (115 ) (127 ) (307)
aIncludes knife, blunt instrument, or any other weapon.
bTotal N is slightly different for Property Stolen and Victim Injured, because it does not include the cases where the outcome or the resist-ance was unknown. See Table 4.
CUInjury" includes injured but not hospitalized, hospitalized, and killed.
Source: Coded from Chicago Police Department files of "offenses actually occurring," reported offenses minus those unfounded or referred to another, responsible, jurisdiction. Sample includes all robberies, attempted robberies and robbery homicides occurring every fifth day of police periods 3, 4, 5, and 6, 1975. See Richard Block, Violent Crime: Environment, Interaction and Death, Lexington-Heath 1977.
11
Total
N
1206 82 --
1288b
250 1035 --1285b

QI,J ell ,~I
I J I • t:;yl t" :
l, r~]:
l r,]
l "J [ J;
[ DVI
[ r] [ [J [ IJ [ ']
[ L. [ [I
[ ~I [~ ..
,.
Types of ~otal ResistancE N
Handgun 3 Long Gun 0 Othera 80 None 600 Unknown 5
Handgun 1 Long Gun a Othera 54 None 115 Unknown 3
Handgun 1 Long Gun a Othera 126 Non~ 308 Unknown 1
Table 4
Consequences of Resisting a Robbery Chicago, 1975
Outcome of Robbery Attempt Property Sto 1 en? Victim Injured?
No Yes No Some Hosp.
Offender Weapon: Firearm
2 1 0 a 3 a a a a a
14 66 45 12 20 11 589 570 13 13 1 4 a a 1
Offender Weapon: Kni fe or Other
1 a 1 a a a a a a a
11 43 19 13 22 3 112 91 7 17 a 3 1 1 a
Offender Weapon: None
1 a 1 a a a a a a 0
32 94 73 29 24 7 301 235 35 37 0 1 1 a 0
Death
a 0 3 2 3
0 a a a 1
a a a a 0
a Other resistance includes a weapon other than a gun, physical force, verbal resistance and running away.
Source: Coded fY-'om Chicago Police Department files of "offenses actually occurri n9, II reported offenses mi nus those unfounded or referred to another, responsible, jurisdiction. Sample includes all robberies, attempted robberies and robbery homicides occurring every fifth day of police periods 3,4,5 and 6, 1975. See Richard Block, Violent Crime: Environment, Interaction and Death, Lexington-Heath 1977.
· ~~I
~. 0.' [ P.J
[ ~.I [ ,~I [ ".J.
C'J
L pJ~ L 07]'
( ;,)
r V'I [ ;1 [ 'Ii
, ..-
[ ~I~ ..,..
[ :1
--------~--- - ----
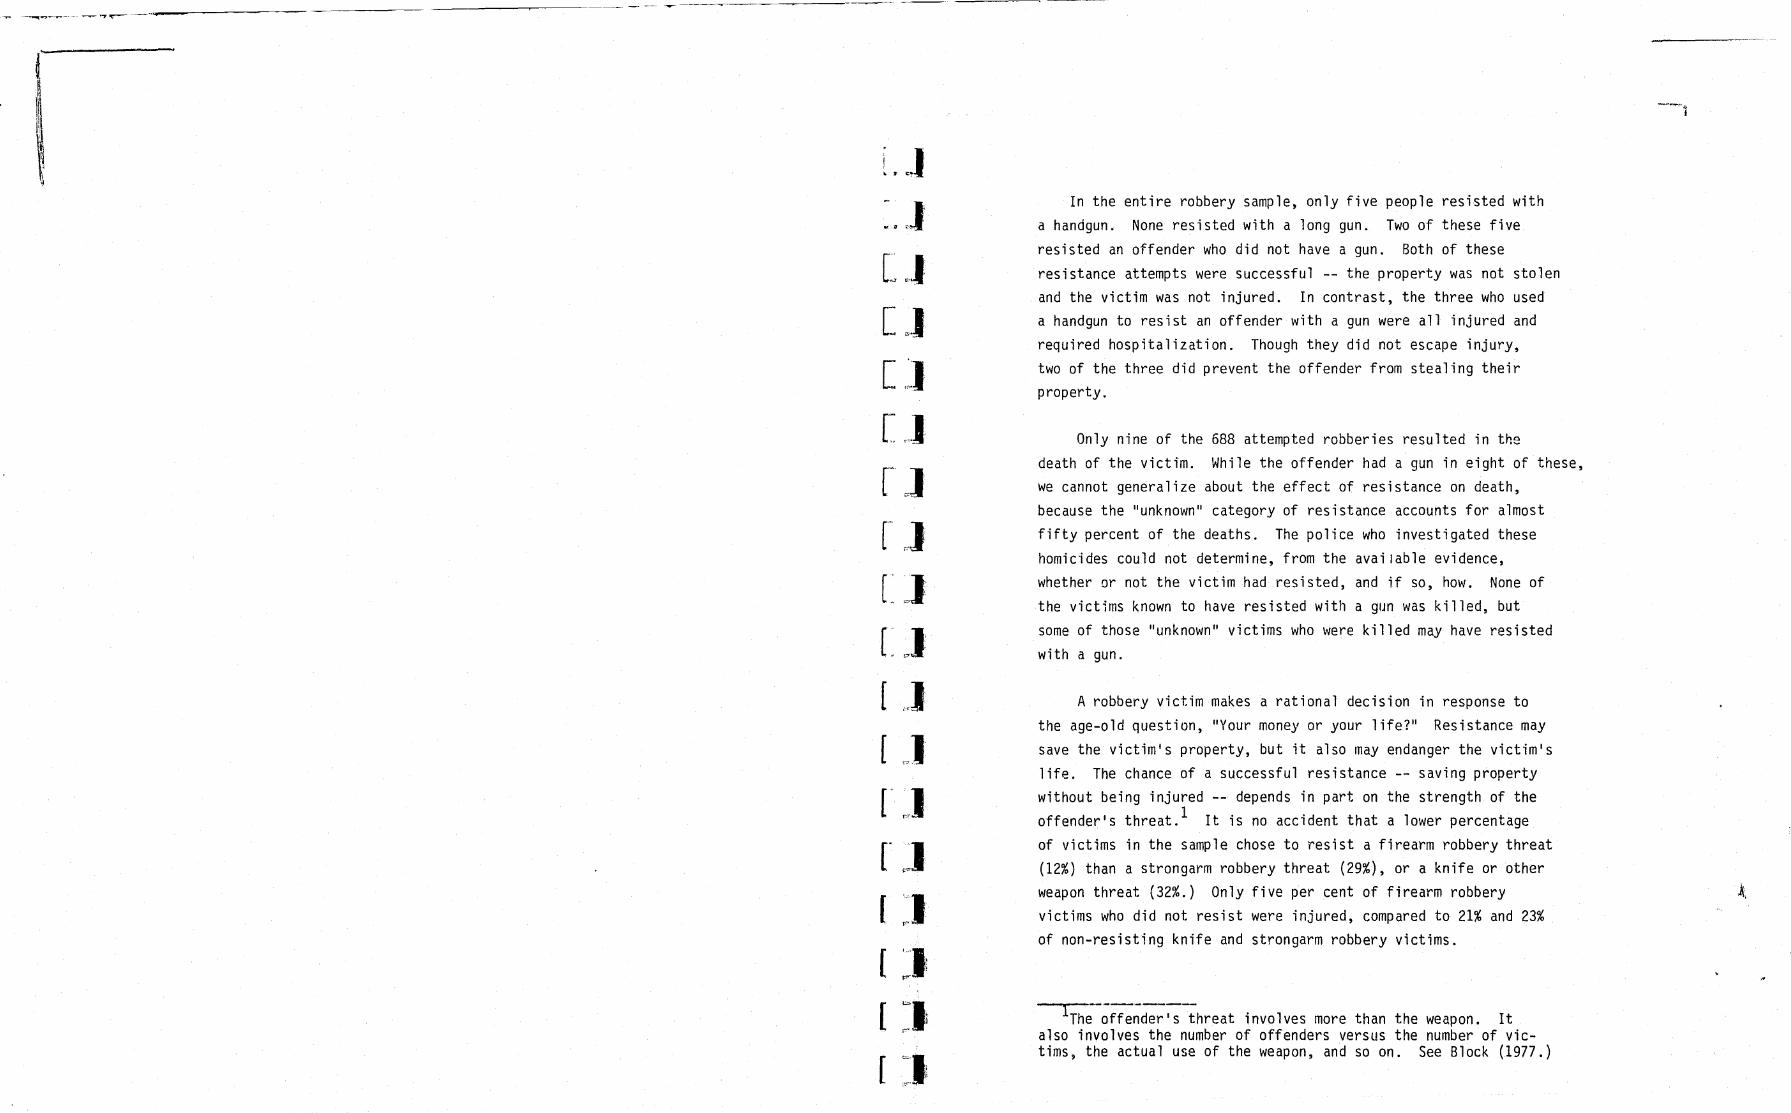
In the entire robbery sample, only five people resisted with a handgun. None resisted with a long gun. Two of these five resisted an offender who did not have a gun. Both of these resistance attempts were successful -- the property was not stolen and the victim was not injured. In contrast, the three who used a handgun to resist an offender with a gun were all injured and required hospitalization. Though they did not escape injury, two of the three did prevent the offender from stealing their property.
Only nine of the 688 attempted robberies resulted in the death of the victim. While the offender had a gun in eight of these, we cannot generalize about the effect of resistance on death, because the "unknown" category of resistance accounts for almost fifty percent of the deaths. The police who investigated these homicides could not determine, from the avai lable evidence, whether or not the victim had resisted, and if so, how. None of the victims known to have resisted with a gun was killed, but some of those "unknown" victims who were killed may have resisted with a gun.
A robbery victim makes a rational decision in response to the age-old question, "Your money or your life?" Resistance may save the victim1s property, but it also may endanger the victim1s life. The chance of a successful resistance -- saving property without being injured -- depends in part on the strength of the offender1s threat. 1 It is no accident that a lower percentage of victims in the sample chose to resist a firearm robbery threat (12%) than a strongarm robbery threat (29%), or a knife or other weapon threat (32%.) Only five per cent of firearm robbery victims who did not resist were injured, compared to 21% and 23% of non-resisting knife and strongarm robbery victims.
ITh;-;ffe~der~~hreat involves more than the weapon. It also involves the number of offenders versus the number of victims? the actual use of the weapon, and so on. See Block (1977.)

~- - - ---- -----~------- -- ~
LJ I ) i I ' ... ., ~
[ ~~)'
( J' [, ,,,I [ ~,I: [J
L <J' ! ~I' ' .. -~, .--
L .,.1 [ ,"I [ ,.n [ oD
[ ]1,
r ~'I:
r :~I:
r ~'m;,
In deciding whether or not to resist, the victim must weigh the available means of resistance against the robber's means of attack. Although a victim with a handgun may successfully resist a robber with a less lethal weapon, successful resistance against a robber with a gun is unlikely.
Resisting Rape
Very little data have been collected about victim gun use in resistance to rape. The most comprehensive· analysis of this nature comes from victimization and attitude data collected in 1974 and 1975 for the National Crime Survey, and published in a 1979 report entitled "Rape Victimization in 26 American Cities" by M. Joan McDermott. The 26 cities were all urban areas, and thus do not reflect the national rape rate. In the study, victim resistance was categorized into six types, one of which was "Used or Brandished Gun or Knife."
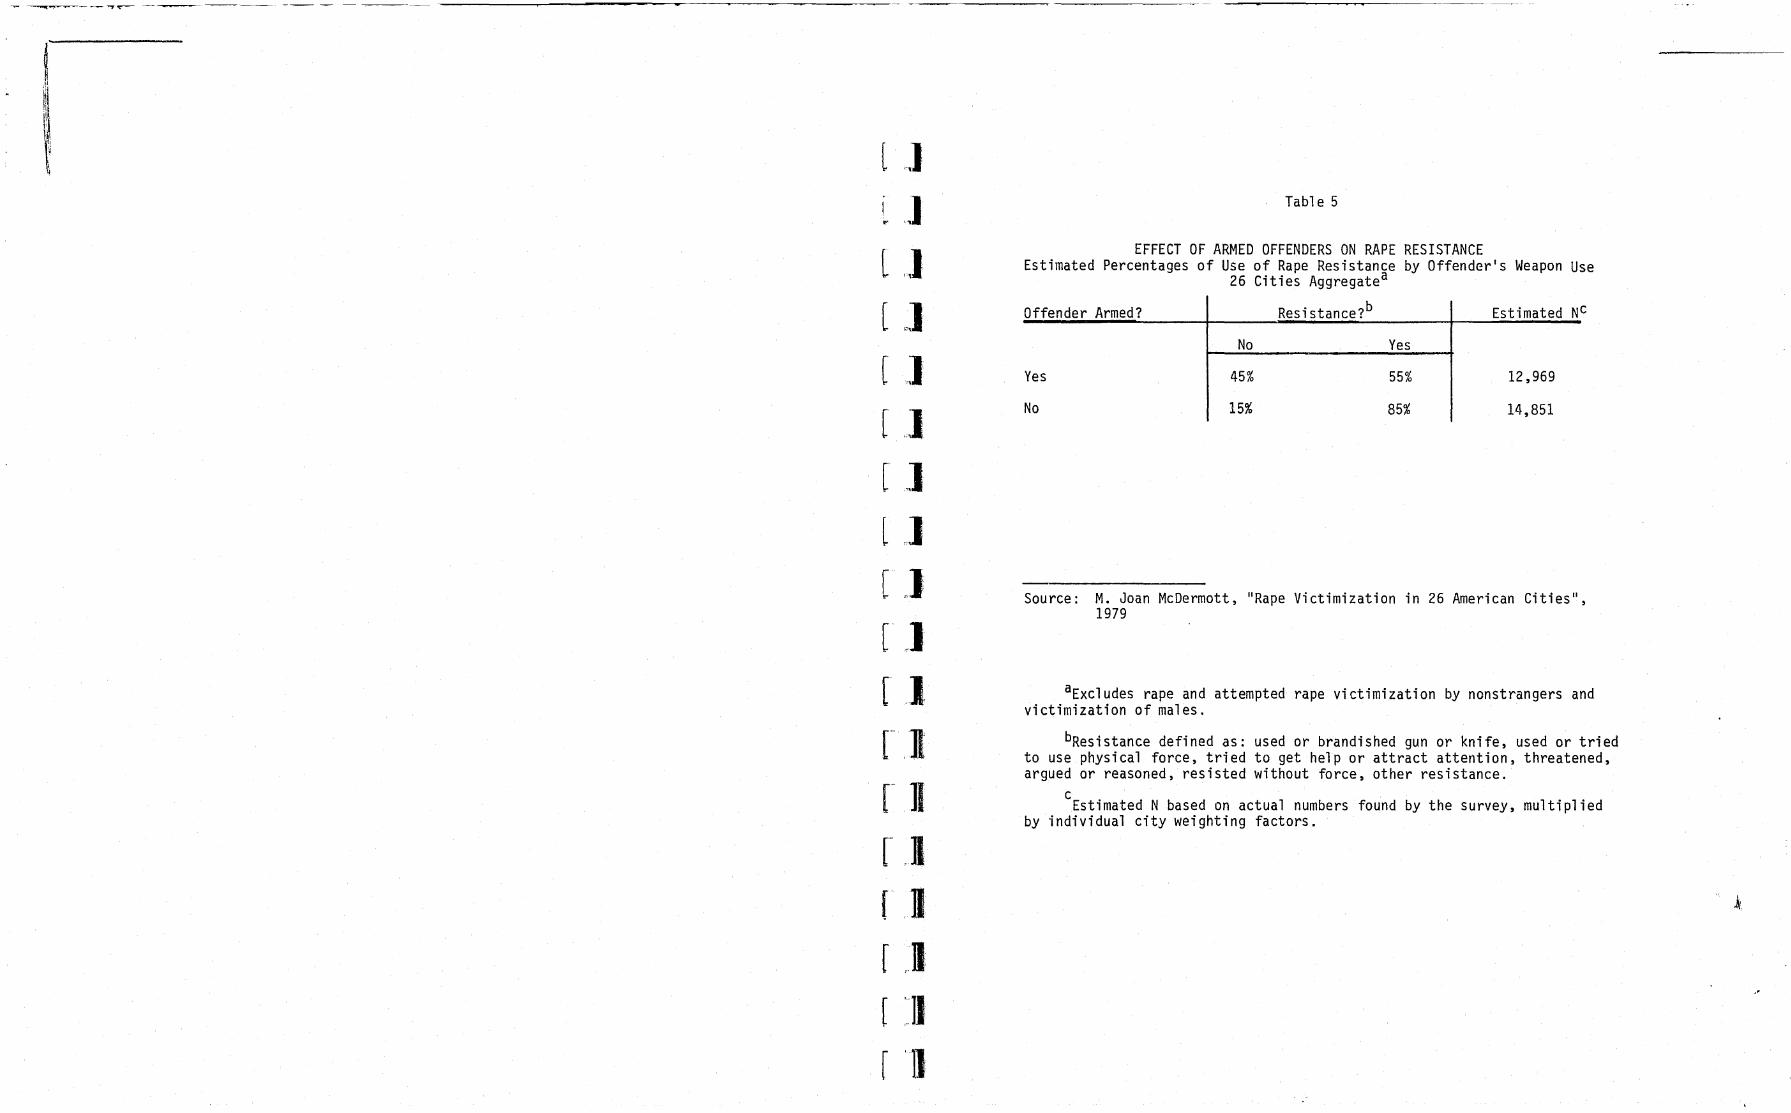
Attached are three tables containing data from the study. Table 5 shows estimated percentages of the number of victims who did and did not resist rape attacks, by whether or not the offender was armed.
Table 6 shows the outcome of rape attempts by whether or not the victim resisted. Clearly,' victim resistance increases the chances of rape avoidance in this study by an estimated 48 percent. Table 7 shows the outcome of rape attempts by type of victim resistance. Hardly any women in the survey used or brandished a gun or knife. The survey responses were so few that it was' impossible to make a statistically reliable estimate of the number.
In summarizing the findings, McDermott wrote (page 30): (the data) suggests that in a rape attack, the victim who manages to do something to protect herself has a much better chance of preventing the completion of the attack than the woman who does nothing. However, it is important to note that this finding alone is not sufficient basis for advising potential rape victims to use various methods of (resistance) .
~'.
"
------~--- ---
[ .]
l c]
[ ~]
[ ,]
[.J.
r JI r ]1 r .1 r . I r .D r ])
r '1
Tabl e 5
EFFECT OF ARMED OFFENDERS ON RAPE RESISTANCE Estimated Percentages of Use of Rape Resistance by Offender's Weapon Use
26 Cities Aggregatea
Offender Armed?
Yes
No
Resistance?b
No Yes
45% 55%
15% 85%
Estimated NC
12,969
14,851
Source: M. Joan McDermott, "Rape Victimization in 26 American Cities", 1979
aExcludes rape and attempted rape victimization by nonstrangers and victimization of males.
bResistance defined as: used or brandished gun or knife, used or tried to use physical force, tried to get help or attract attention, threatened, argued or reasoned, resisted without force, other resistance.
c . Estlmated N based on actual numbers found by the survey, multiplied
by individual city weighting factors.
.'

•
~~ ]
~~ ]
~:] r' ] : ~
~]
r] ;]
'0 •..
;:.
1 ;:
,] r :.1
[ Jl· [ ,.11
ru r ,.R
r ,I rll r rJI
Table 6
OUTCOME OF RESISTANCE TO RAPE ATTEMPTS Estimated Percentages of Use of R~sistance to Rape
26 Cities Aggregate
Resistance? Outcome Estimated N
No Yes
Rape
67% 19%
Attempted Rape
33% 81%
8,927 b 23,254
Source: M. Joan McDermott, "Rape Victimization in 26 American I Cities," 1979.
aExcludes rape and attempted rape by nonstrangers, and victimizations of males.
bThe estimated N of resistance is greater than the sum of the types of resistance in Tabie 7, bec~use victims could report using more than one type of resistance.

~ h t'
'" !a l:i U 'ffi
\~ [ ~] tj
l ;;]
l C]
( ,,]
[ .J [ ]
l ]
l ]
l ]
l ,]
l ]
[ '11
[ .]
l .. ] [ ']
r 'll "
'll n
Table 7
OUTCOME OF RAPE ATTEMPTS BY TYPE OF RESISTANCE 26 Cities Aggregate a
Type of Resistanceb Outcome Rape Attempted Rape
Used or brangished gun or knife
Used or tried to use physical force 26% 74%
Tried to get help or attract attention 22% 78%
Threatened, argued or reasoned 24% 76%
Evasive action 5% 95%
Other resistance 10% 90%
Estimated
10 ,390
11 ,242
5,116
6,730
1,278
Source: M. Joan McDermott, "Rape Vicitmization in 26 American Cities," 1979
aExcludes rape and attempted rape by non strangers and victimizations of males.
N
bThe sum of the estimated N's of the types of resistance is greater than the total estimated N for resistance in Table 6, because victims could report using more than one type of resistance.
CEstimate, based on about 50 or fewer sample cases, may be statistically unreliable.
7
44 $ 4 44
.~
I
•
[ .~l [ ,~J [ ~]
[~]
[ r;] [ -1
i?'"J,
[ ~]
[ ~J [ ".]
[ cc.J
[ ~J [ ,.],
[ ,.. ~JJi
[ .,U
[ Jl [ "11:
~JI,
A 1980 study, "Avoiding Rape: A Study of Victims and Avoiders" by Pauline Bart, produced similar results. Only one subject was carrying a weapon (mace) when attacked, but she could not get it
out of her purse in time to use it. Another victim managed to persuade her attacker into putting down his knife, and then was able to grab it and force him to flee. These are the only two cases, out of a sample size of 94, of women who were armed.
In summary, guns are very rarely used in rape resistance. In both the McDermott and Bart studies, few, if any, victims had a gun, let alone were able to use it. Neither study suggests that having a gun would, in fact, lead to successful resistance of a rape attack.

- ....... -~~-----~~ -~~--
I II'
I
-----------------------~---------.----~.~--~------~------------------------------------------------------------~------------------------~-~ ---
'L L,J [~ ( IJ
( IJ [ ,J [~ [~ [~ [~ [ ,~1 [ ~y]
[ ~~I [ ,,"1
[ rl [ ~I~ [ ~I
; ,
[ :1 I
~I
fl , ~I
CONCLUSION
Although data on handgun use are sparse, some data do exist. This report attempts to compile data that may help to answer some
of the most comonly asked questions about stolen handguns, accidents with handguns, and the use of handguns to resist robbery and rape.
The report finds that stolen handgun data do exist, for every Illinois area except Chicago. Three to four thousand handguns are stolen from residences each year in Illinois outside of Chicago.
Accidental firearm death data exist for Cook County, although accidental injury data do not. There are about five such deaths a year.
The quality of handgun resistance data is uneven, and the results of analysis must be interpreted cautiously. - However, the data that do exist indicate that handguns are very seldom used to resist
robbery, and almost never used to resist rape. The success of handgun resistance depends to a great extent on the offender's weapon.
19

; ; 4U 4% •
-. " :
\
.. \;.'Ii
,)