12.6.2014 kari suominen, cio -...
TRANSCRIPT

Technology, Innovation and Information at Fingrid
12.6.2014Kari Suominen, CIO

Agenda
• Fingrid in general• Innovative use of Technology and Information in running
the business• Fingrid's condition monitoring system• Current use cases with PI• Elvis
• Future plans• Elvis and PI• Datahub
12.6.2014 Kari Suominen

Fingrid is the Finnish transmission system operator(TSO)
3
We are responsible for the functioning of the entire power system inFinland. We keep the transmission grid in a good condition and construct iton the basis of the needs of the electricity market.
We transmit electricity continuously from electricity generating companiesto distribution network companies and industrial companies. 75% of theelectricity in Finland is transmitted in our grid.
We take care of the cross-border connections of electricity transmission.There are direct connections to Finland from Russia, Sweden, Norway andEstonia.
We promote the functioning of the electricity market by keeping thetransmission connections between various countries in working order.
12.6.2014 Kari Suominen
ICT
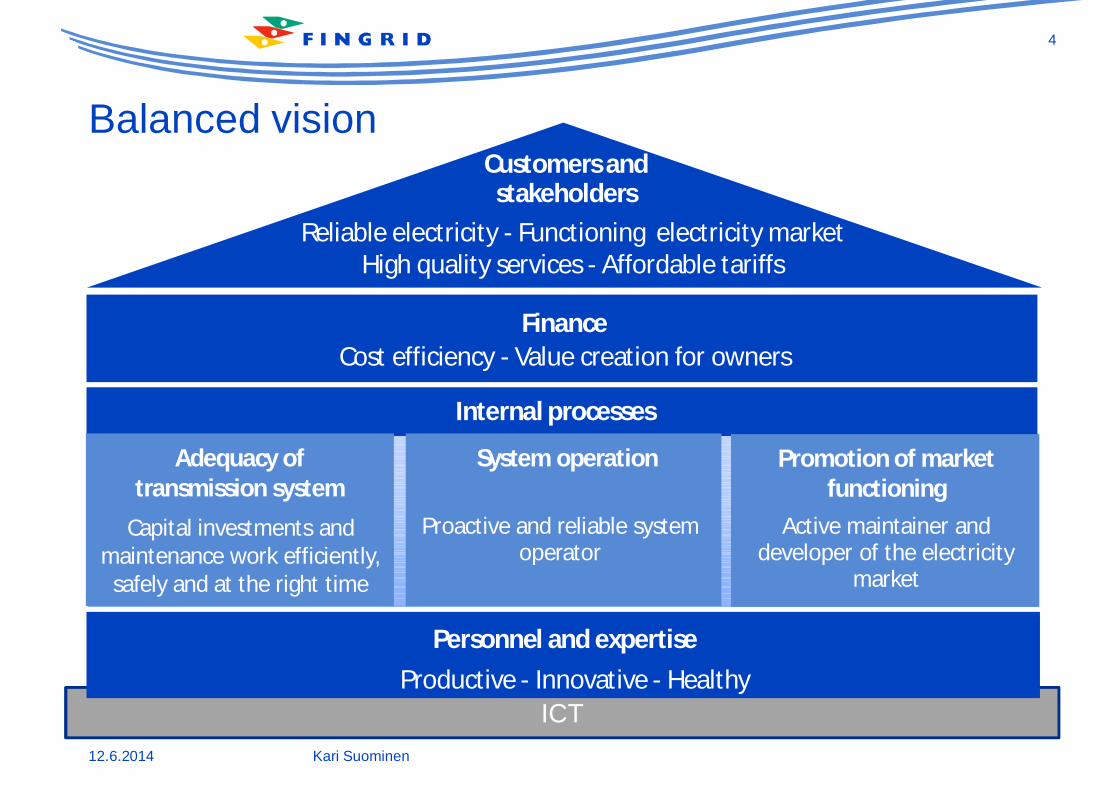
Balanced vision
4
Personnel and expertiseProductive - Innovative - Healthy
Reliable electricity - Functioning electricity marketHigh quality services - Affordable tariffs
Cost efficiency - Value creation for ownersFinance
Customers andstakeholders
Adequacy oftransmission system
System operation Promotion of marketfunctioning
Active maintainer anddeveloper of the electricity
market
Proactive and reliable systemoperator
Capital investments andmaintenance work efficiently,
safely and at the right time
Internal processes
12.6.2014 Kari Suominen

Fingrid in Brief
5
State of Finland;53,1 %
Other (institutionalinvestors); 14,8 %
Varma MutualPension
InsuranceCompany; 12,2 %
Mutual PensionInsuranceCompany
Ilmarinen; 19,9 %
Ownership (shares)
Trans-mission
lines(km)
Sub-stations
(qty)Transformers
(qty)
400 kV 4 300 39
1760
0M
VA
190
0M
VA
220 kV 2 600 19
370
0M
VA
110 kV 7 500 55
Total 14 400 113 44 5 23
• 1300 MW DC link between Finland and Sweden• 935 MW fast disturbance reserve power plants
Fingrid's power system
Fingrid's key figures 2013
12.6.2014 Kari Suominen

6
Efficient operating model
We develop thepower system inclose co-operation with ourcustomers.
We take care of powersystem operationourselves.
We are a proficientclient: we haveoutsourced theconstruction andmaintenance of thegrid to outside serviceproviders.
12.6.2014 Kari Suominen

Innovative use of Technology and Information inrunning the businessReal business cases from "Internet of things" and"big data" in Fingrid's Asset Management, PowerSystem Operations and Markets.
• Maximize the network reliability and minimize themaintenance and investment costs at the sametime
• Discover the weak performing assets,components and hidden defeacts as early aspossible
• Repairs, service schedules and replacementinvestments can be optimized
• Data analysis and exchange support newbusinesses like electric vehicle charging andmarket based development
7
12.6.2014 Kari Suominen

Video and security control
Management of measurements
Fingrid Application map
Customer andstakeholder
management
Finance
Intime
Management, budgeting and reporting
Cognos
eOffice
Twin
Underdevelopment In use SaaS
HR
Sympa
M2
Idea managementOrchidea
ICT & Communication
Microsoft ExchangeMicrosoft SharePoint
Efecte
Intranet Audio and video communication
ElectricityMarkets
Syspower
Basse
SystemOperation
GE XA
iSMS
Vaksi
NOIS
EAS
Aiolos
AssetManagement
Maximo
ArcGis
Syclo
IPS
Project budgetand management
Primavera
Grid planning
ODMS
PSS/E
CAPE
Tiima
LTJ
Ekstranetit
www.fingrid.fi
PI
Microsoft BizTalk
Microsoft Office
SyncAlarm
PsGuard
Ohjeistuswiki
Stina
Video monitoring Esmikko
PW
Messaging
Lync AD
ION
EMPS/Samlast
BID
Energy measuring
12.6.2014 Kari Suominen

Our vision of the Condition Monitoring System
• different kind of displays• traffic lights based on alarm values• gauges, embedded trend windows• drill-down UI
Smartvisualization
• differences between two points• maximum, minimum• ratios (e.g. gas ratios)• trend curves
Easyanalysis
tools
• notifications and alarms based ontrigger rules
• generate tasks to our assetmanagement system in the future
Automaticalarms
12.6.2014 Kari Suominen

How it works ?
SCADA
Analyzersreal-time datastorage
asset model displays
ERP/EAM
• Transformers, breakers, GIS, serie capacitors, reserve powerplants• ~ 5 years of online data and ~ 20 years of offline data is ready to be used• Light implementation by existing PI tools = system is easily configurable and
users can make own displays
PI Server PI Asset Framework PI Processbook
12.6.2014 Kari Suominen

How does it look like?
12.6.2014 Kari Suominen

Transformer fault
• Increasing oil gas ratio was noticed and taken under observation in May 2012.Strong correlation between LV current and oil gas ratio was detected by CMSand confirmed with diagnostics measurements. The early notice gave time toreact and remedial actions were launched in time.
12.6.2014 Kari Suominen
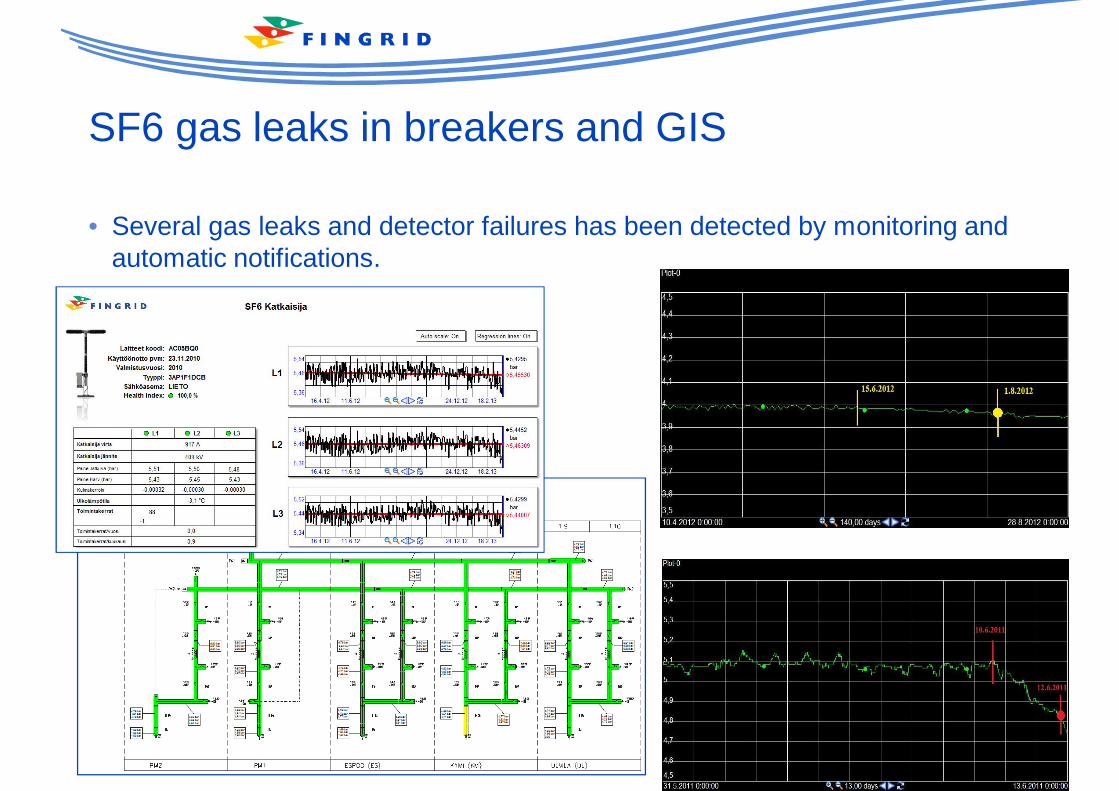
SF6 gas leaks in breakers and GIS
• Several gas leaks and detector failures has been detected by monitoring andautomatic notifications.

14
Health index analysis tool for substations• ‘Health index’ identifies the priority in
terms of additional maintenance orneed of renewal
• Especially essential when thepopulation of components is verylarge, e.g. circuit breakers anddisconnectors.
• Based on the defect statistics in theasset management system over a longtime period (>20 years) and weightingcoefficients
• The tool enables the user to update allthese views and visualize the affectsby changing easily the free choicefactors and source variables.
• This analysis can strengthen alreadyknown component weaknesses butmay also point out additional needs forfurther clarification from differentperspectives.
12.6.2014 Kari Suominen

22.1.2013 Elvis for CS /M Stenstrand
15

Databanksutilisation ofdatabases
16
Shared access to vital information- outsourcing is based on efficient knowledge management
Stakeholdersco-operation
occupational safety
Fingrid’s specialiststeam work
Co-operation forumsTrainingDevelopment projectsRegular meetings
Grid modelsAnalysis andplanning toolsGISEAM
Extranet for data managementCompilation, storage and use
of mobile data
16
12.6.2014 Kari Suominen

ELVIS high level objectives
• Increasing operative efficiency– Increasing proactivity in calculations, monitoring and maintenance
• Single source for power system information– Improving information access and usability within stakeholders
• Adding cost aspect to operation and power system components– Enhanced business planning through operational cost analytics
• Platform for further system development with modern solutions– Mobile solutions and data analysis to support Asset Management and Power system
operations
17
A more efficient tool for Fingrid's asset and operation management byreplacing existing tailor-made grid information systems by integratedbest-of-breed standard software products
12.6.2014 Kari Suominen
12.6.2014 Kari Suominen
18
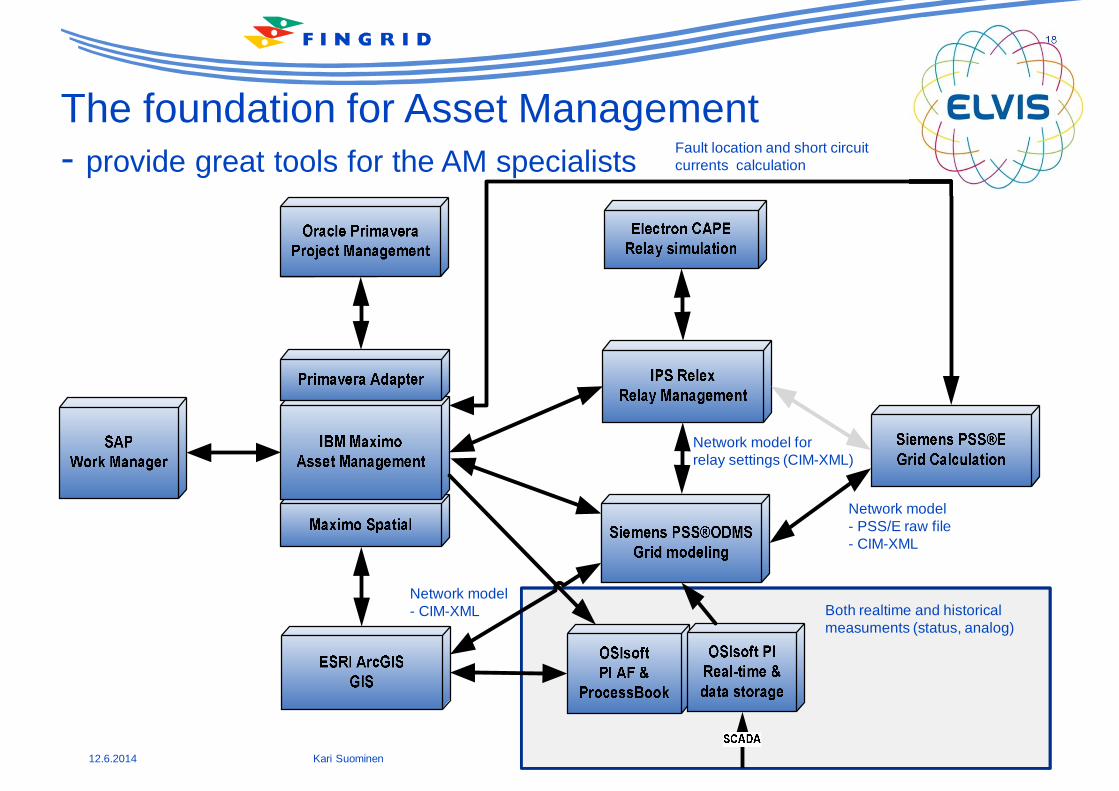
Both realtime and historicalmeasuments (status, analog)
Network model forrelay settings (CIM-XML)
Network model- PSS/E raw file- CIM-XML
Fault location and short circuitcurrents calculation
Network model- CIM-XML
The foundation for Asset Management- provide great tools for the AM specialists

ELVIS will bring us new things
• Common grid model which is synchronized with asset management, operationsplanning, long term planning and network protection analysis
• All switch gear modeled with real and accurate description of components in the grid.Lot's of additional information about the grid model.
Common accurate grid model
• Accurate planning grid model linked to real time status and metering data.• Preparing of calculation model is easy by using status and metering data from the past.
Better utilization of saved measuring data
• Attributes for grid components available through the map• Visualization of real time power and voltage measurements using colours on grid model
or map
Better visualization of data, grid status and results
• Common database about future projects where schedules are in sync through thesystems
• Easy to build different scenarios
Common model about the future
12.6.2014 Kari Suominen
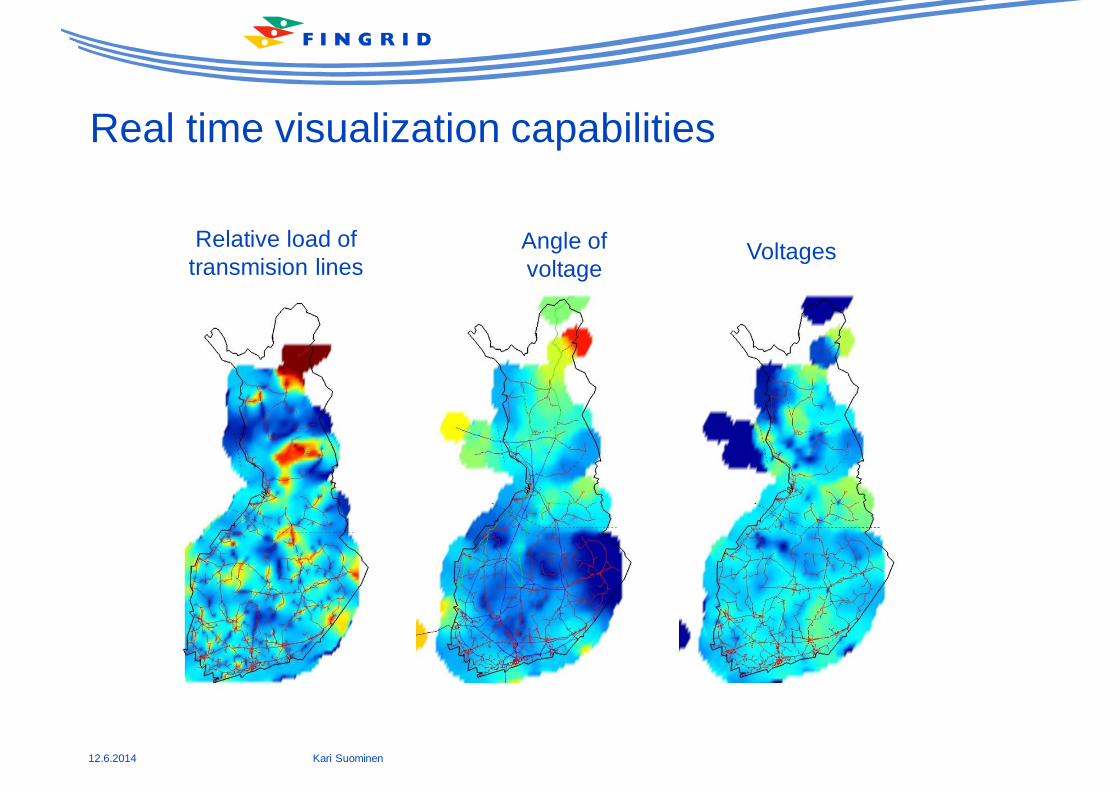
Relative load oftransmision lines
Angle ofvoltage
Voltages
Real time visualization capabilities
12.6.2014 Kari Suominen

Datahub for market data exchange
21
12.6.2014 Kari Suominen
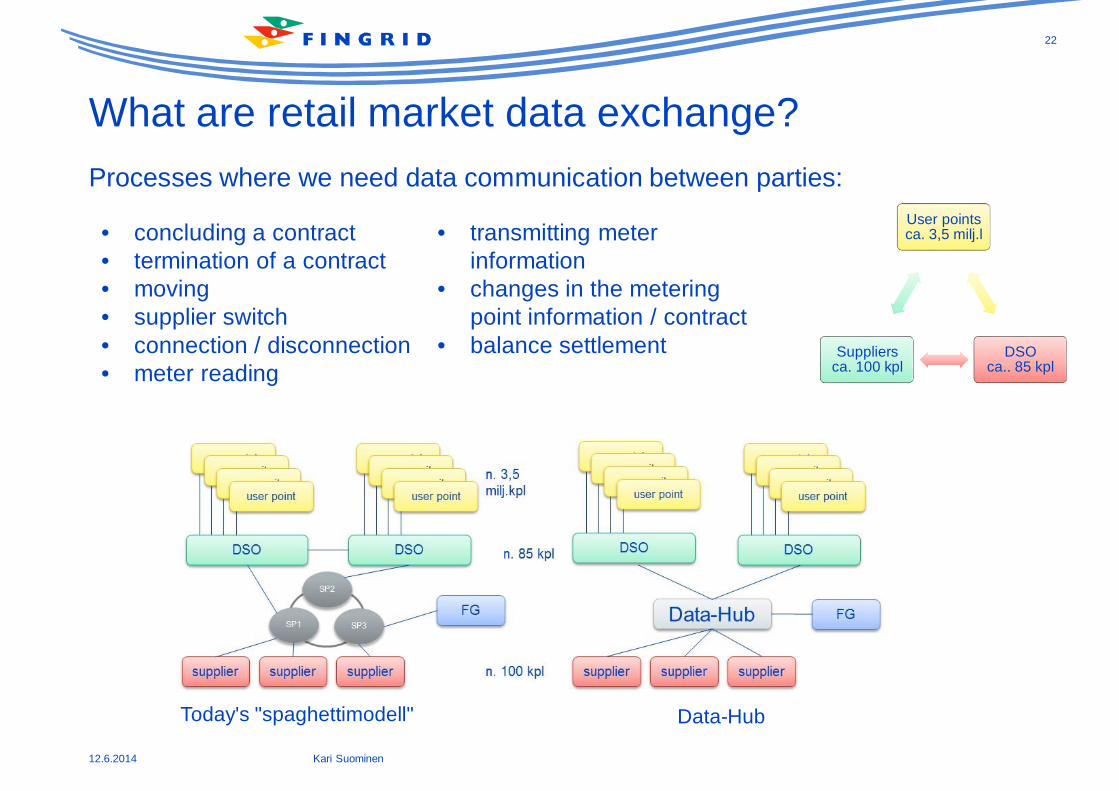
What are retail market data exchange?
User pointsca. 3,5 milj.l
DSOca.. 85 kpl
Suppliersca. 100 kpl
Processes where we need data communication between parties:
• concluding a contract• termination of a contract• moving• supplier switch• connection / disconnection• meter reading
• transmitting meterinformation
• changes in the meteringpoint information / contract
• balance settlement
22
12.6.2014 Kari Suominen
Today's "spaghettimodell" Data-Hub

Possible functionalities of a datahub
• Primary functionalities:– measurement database– quality control– DSO's balance settlement– metering point registery– key market processes– legislative reporting
• Possible additional functionalities:– open interfaces– connect/re-connect operations– larger metering point registery/multiutility support– enable co-billing– New businesses, such as electric
vehicle charging, market based development
23
12.6.2014 Kari Suominen
Fingrid's next steps 2014-2015
• Improvement• Additional internal resources to PI development and a solid PIarchitecture
• New improvements based on user experience and feedback e.gImprovements to delivered displays
• Elvis R2 and R3 are connecting PI with components like ODMSand ArcGIS
• Bigdata study focusing on PI
• Datahub business case analysis and implementation
12.6.2014 Kari Suominen

Powering Finland.