12th kepan
TRANSCRIPT
Selected Abstracts for Oral Presentation
DOI: 10.5152/ClinSciNutr.2021.080321
12th KEPAN CONGRESS ABSTRACTS

SS01
Predictive Effect of a New Screening Tool for Nutritional Risk in Neonatal Intensive Care UnitNadir Yalçın1, Hasan Tolga Çelik2, Kutay Demirkan1, Şule Yiğit2
1Hacettepe University, Faculty of Pharmacy, Department of Clinical Pharmacy, Ankara, Turkey 2Hacettepe University, Faculty of Medicine, Neonatology Unit, Department of Child Health and Diseases, Ankara, Turkey
Objective: Hospitalized newborns are at increased risk of malnutrition and especially preterm infants often experience postnatal growth failure.1 It was aimed to evaluate the predictive effect of malnutrition risk on the initiation of parenteral nutrition (PN) and length of stay (LOS) while patients were admitted to neonatal intensive care unit (NICU) within 24 hours.
Methods: Neonatal Nutritional Screening Tool (NNST) was prospectively applied to all infants in the NICU within 24 hours of their hospitalization. The predictive effects of NNST and birth weight on LOS and PN administration were evaluated with Poisson regres-sion analysis. The study protocol was approved by the local Ethics Committee.
Results: Total of 303 patients with a mean gestational age of 35 weeks and 2 days and a mean birth weight of 2552 g were prospec-tively included in the study. According to the NNST, 27 (8.9%) of the patients had a high risk, 70 (23.1%) had a moderate risk, and 206 (68.0%) had a low nutritional risk. However, PN treatment was initiated in 118 (38.9%) of the patients. Even though, the mean LOS was 14 days for all patients, LOS was 2.7 times higher in patients with a high nutritional risk compared to patients with a low nutritional risk (p<0.001). In addition, probability of PN administration was 4.9 times higher in patients with a high nutritional risk compared to patients with a low nutritional risk (p=0.003).
Conclusion: NNST is a current, simple and practical tool that should be considered by clinicians in terms of predicting PN initiation and LOS for neonates.
Keywords: Neonatal intensive care unit, malnutrition risk, parenteral nutrition, length of stay
Reference
1. Johnson MJ, Pearson F, Emm A, et al. Developing a new screening tool for nutritional risk in neonatal intensive care. Acta Paediatr 2015; 104: e90-3.
SS02
A New Method in Estimating Muscle Mass in Sarcopenic Obesity: Ultrasonographic Muscle Measurement Adjusted with Body Mass IndexOlgun Deniz1, Zeynep Kahyaoğlu2, Merve Güner Oytun2, Arzu Okyar Baş2, Çağatay Çavuşoğlu2, Burcu Balam Doğu2, Mustafa Cankurtaran2, Meltem Halil21Bursa City Hospital, Palliative Care Unit, Internal Medicine and Geriatrics, Bursa, Turkey 2Hacettepe University Faculty of Medicine, Department of Internal Medicine, Division of Geriatrics, Ankara, Turkey
Objective: Sarcopenic obesity is the coexistence of sarcopenia and obesity in an individual. However, its definition and diagnosis are debated. Ultrasonography, which has been widely used in muscle evaluation in sarcopenia, has also been started to be used in sarcopenic obesity. In this study, we aimed to investigate the importance of ultrasonographic muscle measurements adjusted with body mass index (BMI) to diagnose sarcopenic obesity.
Methods: 145 community-dwelling older participants with a body mass index of 30 and above were included in this study. Com-prehensive geriatric assessment evaluating cognition, nutrition, mood, and functional status of the patients, as well as handgrip strength (HGS) and bioimpedance analysis (BIA), was performed. In six different types of muscle [gastrocinemius medialis (GM), rectus femoris (RF), rectus abdominis (RA), external abdominal oblique (EAO), internal abdominal oblique(IAO), transversus ab-dominis (TA)] ultra-sonographic evaluation of the patients was carried out. The results were noted by dividing the muscle mea-surements by the BMI of the patients. Sarcopenic obesity was diagnosed as low muscle strength (male<27 kg, female<16 kg) with a BMI ≥ of 30.
Results: The median age of the patients was 72 (65-89) and 82% (n=119) were women. Patients with sarcopenic obesity were older and had lower physical functionality. While anthropometric measurements (waist and hip circumference, BMI) related to obesity, and estimated muscle mass measurement obtained from bioimpedance analysis were similar in both groups, anthropometric parameters estimating muscle mass (calf circumference, middle-upper arm circumference) were lower in patients with sarcopenic obesity. All ul-
NUTRITION 12th KEPAN CONGRESS ABSTRACTS
S1

trasonographic muscle measurements adjusted with BMI were lower in the sarcopenic obese group, while the statistically significant measurement was found to be the cross-sectional area (CSA) of the rectus femoris (RF) muscle [0.12 (0.05-0.24) versus 0.15 (0.06-0.31), p=0.01]. Receiver operating characteristic (ROC) analysis suggested that the optimum cut-off point of BMI adjusted RF CSA for sarcopenic obesity was ≤ 0.128 cm2 with 65.12% sensitivity, 67.95% specificity (AUC: 0.643).
Conclusion: Ultrasonographic muscle measurement by adjusting the body mass index, especially for rectus femoris muscle, an easy, non-invasive, radiation-free, cheap, and easily portable method, may be used for sarcopenic obesity muscle assessment.
SS03
Evaluation of Gastrointestinal Failure with Gastric Ultrasound and I-FABP, Citrulline in Intensive CareSevda Onuk1, Tuğra Özer Özer2, Merve Özel3, Hilal Sipahioğlu1, Güven Kahriman4, Gülden Başkol3, Kürşat Gündoğan5, Aynur Akın6
1Kayseri State Hospital, Intensive Care, Kayseri, Turkey 2Department of Clinical Nutrition, Erciyes University, Health Sciences Institute, Kayseri, Turkey 3Department of Medical Biochemistry, Erciyes University, Faculty of Medicine, Kayseri, Turkey 4Department of Radiology, Erciyes University, Faculty of Medicine, Kayseri, Turkey 5Internal Diseases Intensive Care Unit, Erciyes University, Faculty of Medicine, Kayseri, Turkey 6Anesthesia Intensive Care Unit, Erciyes University, Faculty of Medicine, Kayseri, Turkey
Objective: Gastrointestinal (GI) failure is associated with intensive care stay and mortality. Currently, there is no single method that can reliably define gastrointestinal dysfunction. In this study, we aimed to evaluate critically ill patients hospitalized in the intensive care unit in terms of gastrointestinal failure by gastric ultrasonography and by measuring I-FABP and citrulline levels after initiating enteral feeding.
Methods: This study was carried out prospectively in Erciyes University Intensive Care Units. Patients between the ages of 18-80 years, who stayed in the intensive care unit for more than 48 hours and were fed with nasogastric or nasoduodenal tube, were in-cluded in the study. Anteroposterior (AP) and craniocaudal (CC) diameters of the patients were measured by ultrasonography and the gastric antral cross sectional area (CSA) was calculated with the following formula.
CSA=3,142 x (mean AP diameter x mean CC diameter)/4
Then, GRV was evaluated with aspiration method.
These measurements were made on the 24th hour, 3rd day and 5th day after the patients started feeding. At the same time, I-FABP and citrulline levels were measured by ELISA method.
Results: 39 patients were included in this study. The patients were divided into two groups according to their gastrointestinal symp-toms as those with and without GI failure. The mean age was 56±20 years. The most common reasons for admission to intensive care were respiratory failure (18) and sepsis/septic shock (9). The mean APACHE II score of the patients was 21±6. The duration of stay in the intensive care unit was 15.0 (4.0-95.0) days, and the number of days on mechanical ventilation was 14.0 (0-70.0). There was no difference in I-FABP and citrulline levels at 24th hour, 3rd day and 5th day in the groups with and without GI failure. In the measure-ments made by ultrasonography, AP diameter was greater in those with GI failure at 24th hour (p<0.05). There was no correlation between I-FABP and citrulline and AP and CC diameters.
Conclusion: In this study, it was concluded that I-FABP and citrulline levels are not useful in demonstrating GI failure, but AP mea-surement performed at 24th hour by ultrasonography can be used to determine GI failure.
Keywords: Gastrointestinal failure, gastric ultrasound, I-FABP, citrulline
Table (Continued)
Main variables Variables Total GI failure Non-GI failure p
IFABp Baseline 5.19 (3.23-204.40) 11.2 (3.63-204.40) 4.3 (3.23-94.56) 0.107
3rd day 6.44 (3.21-199.27) 5.52 (3.68-199.27) 6.54 (3.21-195.76) 1.000
5th day 4.93 (3.12-208.11) 4.37 (3.60-150.06) 6.02 (3.12-208.11) 0.302
Citrulline Baseline 6.35 (4.54-392.74) 9.19 (4.94-395.69) 6.17 (4.54-109.74) 0.478
3rd day 9.11(4.54-392.74) 18.07 (4.99-385.93) 5.94 (4.54-392.74) 0.194
5th day 9.36 (4.49-371.74) 6.61 (4.89-344.47) 11.63 (4.49-371.74) 0.685
12th KEPAN CONGRESS ABSTRACTS
S2

Table (Continued)
CC 24th hour 28.53±10.79 32.78±10.82 25.70±10.23 0.155
3rd day 30.45±9.64 31.48±8.08 29.84±10.85 0.753
5th day 34.04±6.49 35.75±2.34 31.77±10.22 0.473
AP 24th hour 18.54±8.21 23.12±7.56 15.49±7.39 0.038
3rd day 22.55±11.54 22.08±8.57 22.83±13.44 0.905
5th day 18.47±3.90 19.68±7.80 16.87±2.11 0.395
CSA 24th hour 4.87±3.01 5.81±3.83 4.11±2.07 0.286
3rd day 5.34±2.97 5.63±3.20 5.17±2.99 0.776
5th day 3.84±2.05 4.86±1.21 4.51±2.11 0.147
SS04
Associations of Sarcopenic Obesity versus Sarcopenia Alone with FunctionalityGulistan Bahat1, Cihan Kılıç1, Serdar Özkök1, Savaş Öztürk2, Mehmet Akif Karan1
1İstanbul University, İstanbul Faculty of Medicine, Department of Internal Medicine, Division of Geriatrics, İstanbul, Turkey 2İstanbul University, İstanbul Faculty of Medicine, Department of Internal Medicine, İstanbul, Turkey
Objective: There have been several attempts to come up with a global operational definition of sarcopenia (S), and consequently, a definition of S has been established, to some extent. That said, the definition of sarcopenic obesity (SO), which is defined as the presence of obesity+sarcopenia, remains obscure, hindering evaluations of the prevalence and relevance of SO. It has yet to be elucidated whether SO is associated with worse functionality when compared to S alone (S without obesity). In the present study, we compare SO and S alone in terms of their associations with functional measures through the application of alternative definitions of SO. As a secondary output, we document the prevalence of SO based on alternative definitions.
Methods: This retrospective cross-sectional study included community-dwelling adults over 60 years of age who presented as out-patients to a university hospital between 2012 and 2020. All were evaluated for body composition (bioimpedance analysis), hand-grip strength (Jamar hand dynamometer) and functional health status [activities of daily living (ADL), instrumental activities of daily living (IADL)]. The fat percentile method was used to define the obesity component of SO. Low muscle mass (LMM) was defined using two different adjustment methods of skeletal muscle mass (LMM adjusted by height2 or LMM adjusted by BMI). S was defined based on the EWGSOP2 definition, as probable S (low muscle strength) or confirmed S (low muscle strength+LMM). Accordingly, three alternative definitions of SO were applied based on three alternative definitions of S, i.e., “obesity+sarcopenia (probable)”, “obesity+sarcopenia (confirmed, LMM adjusted by height2)” and “obesity+sarcopenia (confirmed, LMM adjusted by BMI)”. The associations of SO and S alone with functional measures were examined with univariate analyses and adjusted multivariate analyses.
Results: Included in the study were 1,468 older adults (median age 75; 68.8% female). The prevalence of SO was very low (0.2%) based on the SO definition “obesity+ sarcopenia (confirmed, LMM adjusted by height2), but it was present at a considerable and comparable rate based on SO definition “obesity+sarcopenia (probable)” and SO definition “obesity+sarcopenia (confirmed, LMM adjusted by BMI)” (4.1%, 4.0%; respectively). As SO by “obesity+sarcopenia (confirmed, LMM adjusted by height2)” had an ignor-able prevalence, this definition of SO was excluded from further analyses. Multivariate analyses revealed that, when compared to the Non-S Non-Obese group, S alone definitions had odds ratio (OR) of 5.4 and 3.4 while SO definitions had an OR of 3.2 and 2.7 for impaired ADL, and an OR of 7.9 and 6.4, while SO definitions had an OR of 3.0 and 2.7 for impaired IADL. SO was thus found to be associated with a lower prevalence of impaired functional measures than that of S alone.
Conclusion: Our results suggest that the SO definition confirmed, LMM adjusted by height2 has an ignorable prevalence in popula-tions in which underweight or malnutrition is uncommon. Among sarcopenic older individuals, obesity may have a protective effect against the limitations of some functional measures, providing evidence of the possible protective effect of obesity in sarcopenic individuals.
Keywords: Sarcopenia, EWGSOP2, sarcopenic obesity, definition, fat percentile, functionality
SS05
Ultrastructural and Histopathological Investigation of the Damaging Effect of the Combination of Starvation and Parenteral Nutrition on the Small Intestines of Rabbits
12th KEPAN CONGRESS ABSTRACTS
S3

Kubilay Gürünlüoğlu1, Mehmet Demircan1, Mehmet Gül2, Semra Gürünlüoğlu3, Yusuf Türköz4
1İnönü University, Faculty of Medicine, Department of Pediatric Surgery, Malatya, Turkey 2İnönü University, Faculty of Medicine, Department of Medical Histology and Embryology, Malatya, Turkey 3Malatya Training and Research Hospital, Clinic of Pathology, Malatya, Turkey 4İnönü University, Faculty of Medicine, Department of Medical Biochemistry, Malatya, Turkey
Objective: Parenteral nutrition (PN) is a life-saving practice when the use of the gastrointestinal tract is not appropriate. Despite its great benefits, however, PN may cause several complications. In this study, we conducted histopathological and ultrastructural examinations of the effect of PN combined with starvation on the small intestines of rabbits.
Methods: Rabbits were divided into four groups. A fasting + PN group was left completely unfed and received all its daily required energy by PN through an intravenous central catheter. An oral feeding + PN group received half the necessary daily calories by oral feeding and the other half through PN. A semi-starvation group received only half the necessary daily calories by oral feeding and no PN. The fourth group, serving as a control, was supplied with its entire daily energy requirements through oral feeding. After 10 days, the rabbits were euthanized. Blood and small intestine tissue samples were collected from all groups. Blood samples were biochemically analysed, and tissue samples were examined by light and transmission electron microscopy.
Results: The fasting + PN group exhibited lower insulin levels, higher glucose levels, and increased systemic oxidative stress than the other groups. Ultrastructural and histopathological examinations revealed a significant increase in apoptotic activity in this group’s small intestines and a significant decrease in villus length and crypt depth. Severe damage to the intracellular organelles and nuclei of enterocytes was also observed.
Conclusion: PN combined with starvation appears to cause apoptosis in the small intestine due to oxidative stress and hyperglycae-mia, with destructive effects on small intestine tissue. Adding enteral nutrition to PN may reduce these destructive effects.
Keywords: Parenteral nutrition, starvation, small intestine, histopathology, oxidative stress
SS06
Sarcopenia in COVID 19 PatientsÖzlem Özkan Kuşcu1, Yunus Coşkun2, Fatma İnci Koca3
1Adana Seyhan Public Hospital, Clinic of Intensive Care, Adana, Turkey 2Adana State Training and Research Hospital, Clinic of Internal Diseases, Adana, Turkey 3Adana Seyhan Public Hospital, Clinic of Internal Diseases, Adana, Turkey
Objective: Sarcopenia is encountered in a significant portion of patients admitted to intensive care (1). Muscle mass should be evaluated for the diagnosis of sarcopenia; however, there is no gold standard inspection method. Cross-sectional surface area and lean mass measurements with computed tomography are considered valid, appropriate and widely used methods. Electrolyte ab-normalities and hypervolaemia are likely to be high in intensive care patients, so bioelectrical impedance analysis is not preferred in intensive care patients (2). In our study, we aimed to evaluate the erector spina muscle diameter and the disease course of intensive care patients with COVID 19 pneumonia.
Methods: All patients who were admitted due to Covid 19 pneumonia between June 2020 and September 2020 and had thorax imaging with computed tomography were included in the retrospective study. The demographic characteristics of the patients were obtained from the hospital database. Muscle mass evaluation was performed by measuring the cross-sectional area (CSA) of the erector spina muscle measured from the transverse process level of the second thoracic vertebra in the axial plane. Muscle density was evaluated using Hounsfield unit (HU). SPSS V20.0 was used for statistical analysis. Ethics committee approval was obtained for the study.
Results: Eighty patients were included in the study. Fortyseven of the patients included in the study were male (58.8%), thirtythree were female (41.3%); mean age 67±12 (30-93) years; APACHE II score mean value 25.14±5.90 (12-39) body mass index 26.5±8.7 (18-50); erector spina CSA 3.03±1.5 (1.5-5.49) cm²; length of intensive care stay 11.38±7.6 (2-32) days; The number of patients who died was 35 (43%). A statistically significant difference was found between the erector spina muscle CSA of male and female patients (p<0.001). When the patients were evaluated according to their body mass index, the CSA value was found to be statistically sig-nificantly higher in patients with a body mass index over 18 (p=0.013). There was no statistically significant difference between the muscle diameters of the patients who died and survived (p>0.05). HU value was 14±12 in female patients and 23±12 in male patients (p=0.010). The HU value did not differ significantly between the patients who died and who survived (p=0.28). Body mass index did not correlate with CSA, HU value and age (p>0.05). In patients with erector spina CSA below 1 cm², it was found that the length of intensive care stay was longer (p=0.09).
Results: Although sarcopenia is frequently seen in intensive care patients, it is overlooked. It is precautionary to determine the risk factors and regulate the treatment in these patients. In this study, we determined that the erector spina muscle diameter measured at the T2 level in thoracic tomography may be a determinant for the prediction of the length of ICU stay of ICU patients.
12th KEPAN CONGRESS ABSTRACTS
S4

References
1. Cruz-Jentoft AJ, Baeyens JP, Bauer JM, Boirie Y, Cederholm T, Landi F, Martin FC, Michel JP, Rolland Y, Schneider SM, Topinková E, Vandewoude M, Zamboni M. Sarcopenia: European consensus on definition and diagnosis: report of the European working group on sarcopenia in older people. Age Ageing 2010; 39: 412-23.
2. Kizilarslanoglu MC, Kuyumcu ME, Yesil Y, Halil M. Sarcopenia in critically ill patients. J Anesthesia 2016; 30: 884-90.
SS07
Evaulation of Appetite, Malnutrition and Diet Quality Among Community-Dwelling Older Adults with and Without Sarcopenia Risk Merve Şeyda Karaçil Ermumcu1, Nilüfer Acar Tek2, Merve Esra Çıtar Dazıroğlu2, Nazlıcan Erdoğan Gövez2, Özge Mengi Çelik2
1Akdeniz University Faculty of Health Sciences, Department of Nutrition and Dietetics, Antalya, Turkey 2Gazi University Faculty of Health Sciences Department of Nutrition and Dietetics, Ankara, Turkey
Objective: This study aimed to evaulate appetite, malnutrition and diet quality among community-dwelling older people with and without sarcopenia risk
Methods: This is a cross-sectional population-based study consisted of 1070 (497 men and 573 women) elderly mean aged 69.0±6.80 years. Questionnaire including the demographic characteristics, health information, nutrition behaviours, Mini Nutrition Assessment-Short Form (MNA-SF) and Simplified Nutritional Appetite Questionnaire (SNAQ) and A Simple Questionnaire To Rap-idly Diagnose Sarcopenia (SCAR-F) was performed by face-to-face by researchers. Anthropometric measurements were measured by well-trained investigators, using standard measurement protocols. Daily food consumption was assessed using 24 hour dietary recall. The quality of dietary intake was assessed using the Healthy Eating Index (HEI) -2015.
Results: It was found that 46.4% of the elderly were men, 66.5 % of them live in the urban area (city center) and only 11.7% of them lived alone in this study. It was determined that 24.7% of the elderly have poor appetite and had a risk of more than 5% body weight loss within 6 months. It was stated that only 5.0% of the older people had good, 74.0% needed improvement and 21.0 % was poor diet quality. 26.2% of the individuals had the risk of malnutrition and 4.5% of them were malnourished. It was found that 29.7% of the elderly had sarcopenia risk. Older people with sarcopenia risk had lower scores of SNAQ (14.7±2.42; 16.4±2.10, p: 001), MNA (11.0±2.50; 12.6±1.70, p<0.001) and HEI-2015 (59.9±11.98;61.1±12.36, p: 0.975) than those without sarcopenia risk. Body weight (73.3±16.43 kg; 78.0±13.32 kg, p: 0.046), body mass index (28.3±6.41 kg/m2; 29.0±4.49 kg/m2, p<0.001) waist (95.4±17.45 cm; 98.3±13.56 cm, p<0.001), calf (37.4±7.73 cm; 38.0±6.31cm, p: 0.001), and upper middle arm circumferences (30.6±5.02 cm; 31.0±4.78 cm, p: 0.002) of elderly with sarcopenia risk were significantly lower than those without sarcopenia risk.
Conclusion: Although sarcopenia is a primarily disease of the elderly, it may develop secondary to depends on malnutrition, inactive life and cachexia. It is important to evaulate the related factors together in the prevention of sarcopenia in the elderly.
SS08
Assessment of Sarcopenia in Patients Newly Diagnosed with Overt and Subclinical Hyperthyroidism Ebru Engin1, Büşra Can2, Aslı Tufan2
1Marmara University, Faculty of Medicine, Department of Internal Diseases, İstanbul, Turkey 2Marmara University, Faculty of Medicine, Department of Internal Diseases, Division of Geriatrics, İstanbul, Turkey
Objective: Sarcopenia is a progressive and generalized skeletal muscle disease associated with adverse health outcomes. Thyroid dysfunctions have been shown to affect skeletal muscle physiology. In the present study, we aimed to evaluate the association be-tween hyperthyroidism and sarcopenia.
Methods: Thirteen patients with overt hyperthyroidism and 13 patients with subclinical hyperthyroidism presenting to Marmara Uni-versity Internal Medicine outpatient clinic between February 2020 and August 2020 were included in the study. Thirty people without thyroid dysfunction were selected as the control group. Written informed consent was obtained from all participants. Patients with an active infection, rheumatological/inflammatory disease, diabetes mellitus, drug use affecting body composition and thyroid func-tions, pacemaker, limb disability, prosthesis, and pregnancy were excluded from the study. Overt hyperthyroidism was defined as TSH<0.34 while fT4>1.12 ng/dL and/or fT3>4.37 ng/L. Subclinical hyperthyroidism was defined as TSH<0.34, while fT4 and fT3 were within the normal reference range (0.61-1.12 ng/dL for fT4; 2.6–4.37 ng/L for fT3). Gender, age, current diseases, medications, hab-its, height, and weight of the participants were recorded. SARC-F questionnaire was used for sarcopenia risk assessment. Handgrip strength measurement and chair stand test were used for the assessment of muscle strength. SMMI measurement with bioelectrical impedance analysis and calf circumference measurement were for the evaluation of muscle mass. 4-m gait speed test was performed for the assessment of physical performance.
12th KEPAN CONGRESS ABSTRACTS
S5

Results: Twenty-six patients with hyperthyroidism were included in the study. The median age of the patients was 44.9 (21-76); 16 patients (61.5%) were female and 10 (39.5%) were male. Handgrip strength and calf circumference were found to be significantly lower in the overt and subclinical hyperthyroidism group, compared to the control group (p=0.007; p=0.008, respectively). The presence of sarcopenia was significantly higher in the overt and subclinical hyperthyroidism group compared to the control group (p=0.007). The probability of sarcopenia was increased in the overt hyperthyroidism group compared to the subclinical hyperthyroid group (OR: 2.44, 95% CI: 0.26- 31.87). Higher levels of fT4 increased the likelihood of sarcopenia in hyperthyroid patients (OR: 6.0, 95% CI: 0.59-79.23). 88.2% of the patients with normal fT4 values had no sarcopenia (95% CI: 63.6% -98.5%).
Conclusion: There is a significant association between sarcopenia and hyperthyroidism, which is a common endocrine disorder. Clinicians should be aware that sarcopenia may occur secondary to hyperthyroidism and try to take preventive action.
SS09
The Relationship between Conut Score and Waist-to-Height Ratio and Cardiovascular Mortality RiskEsma Asil1, Mustafa Volkan Yilmaz1, Aylin Bayindir Gümüş1, Serkan Asil21Ankara University, Faculty of Health Sciences, Department of Nutrition and Dietetics, Ankara, Turkey 2Gülhane Training Research Hospital, Department of Cardiology, Ankara, Turkey
Objective: Nutritional status is an important factor for mortality and morbidity in cardiovascular diseases as well as in many diseases. Controlling Nutritional Status (CONUT) is a screening tool developed to evaluate the nutritional status of patients practically. It was aimed to evaluate the relationship between the SCORE classification used to determine the 10-year total cardiovascular disease (CVD) mortality risk and the CONUT score in this study.
Methods: 232 people with atherosclerotic heart disease (ASHD) or having the atherosclerotic heart disease risk factor participated in this cross-sectional study between September 2020 and January 2021. Body mass index (BMI) and waist-to-height ratio were calcu-lated after measuring the body weight, body height, and waist circumference of the participants. Nutritional status and 10-year total CVD mortality risk of the individuals were determined by the CONUT score and the SCORE risk model respectively.
Results: 129 male (55.6%) and 103 female (44.4%) participated in the study, and their mean age was 53.7±7.9 years. The mean body mass index of the participants was 29.7±5.3 kg/m2 (overweight 40.5%, obese 41.8%), and the mean waist-to-height ratio was 0.61±0.08. It was found that 5.6% of them had a malnutrition risk according to the CONUT score. 22.8%, 27.2%, 19.8%, and 30.2% of them were in low, moderate, high, and very high SCORE groups (10-year total CVD mortality risk). There were statistically signif-icant relationships between SCORE risk groups and both the CONUT score and waist-to-height ratio (p<0.05). Accordingly, in the “very high” group of 10-year total CVD mortality risk, the mean CONUT score was significantly higher than all other risk groups (low risk: 0.67±0.8, medium risk: 0.60±0.8, high risk: 0.67±0.9, very high risk: 1.33±0.9, p=0.000). Also, it was determined that the mean waist-to-height ratio in both the “high” and the “very high” groups was significantly higher than in the “low” group of 10-year total CVD mortality risk (0.63±0.08, 0.62±0.06, 0.59±0.09, respectively, p<0.05).
Conclusion: In the current study, it was detected that there was a notable relationship between the nutritional status and the SCORE 10-year total CVD mortality risk of the participants. Therefore, nutritional status should not be ignored in the evaluation of the gen-eral condition of atherosclerotic heart patients. It is possible to use the CONUT in a practical way to assess the nutritional status in clinics. In addition, it is important to evaluate the bodyweight of patients not only with BMI but also with other anthropometric calculations that give an idea about the body fat distribution such as waist-to-height ratio.
Keywords: Malnutrition, body mass index, waist-to-height ratio, atherosclerosis
SS10
The Frequency of Refeeding Hypophosphatemia in Patients with Inflammatory Bowel DiseaseNurhayat Tuğra Özer1, Gülten Can Sezgin2, Serap Şahin1, Gülşah Güneş Şahin1, Mustafa Alper Yurci2, Kadri Güven2, Kürşat Gündoğan3
1Department of Clinical Nutrition, Erciyes University, Health Sciences Institute, Kayseri, Turkey 2Department of Gastroenterology, Erciyes University, Faculty of Medicine, Kayseri, Turkey 3Department of Medical Intensive Care Unit, Erciyes University, Faculty of Medicine, Kayseri, Turkey
Objective: Refeeding Hypophosphatemia (RH) occur after the recommencement of feeding patients who prolonged starvation or malnourished. Inflammatory bowel disease (IBD), including ulcerative colitis (UC) and Crohn, has high risk for malnutrition depending on prognosis of the disease and hospitalization. So, RH may be encountered in IBD. We aimed to determination of incidence of RH and relationship between clinical and nutritional parameters.
12th KEPAN CONGRESS ABSTRACTS
S6
Methods: This prospective study was conducted in gastroenterology clinics. It was included patients who aged ≥ 18 years, with UC or Crohn and expected to hospital stay during>48 hours. Severity of disease was defined in UC by Truelove and Witts score and Crohn by Crohn’s Disease Activity Index score. Malnutrition was identified by Subjective Global Assessment. Serum phosphate levels follow up during 14 days after admission. Serum phosphate levels<2.0 mg/dl (0.65 mmol/L) was described as hypophosphatemia.
Results: A total of 50 patients (33 patients with UC, 17 patients with Crohn) were recruited. The mean age was 43.4±14.9 years. Ac-cording to Truelove and Witts Score, 37% and 10% of patients had moderate and severe UC, respectively. According to CDAI score, 24% and 12% of patients had moderate-severe and severe Crohn, respectively. Baseline phosphate levels was 3.5±0.91 mg/dl. The most common RH was determined in 7 patients (14%) in Day 5. In RH group, the sharpest decline in phosphate was found in Day 4 (2.3±0.57 mg/dl) and Day 5 (2.3±0.89 mg/dl) in first week, in Day 10 (2.1±0.81 mg/dl) during follow up. There were no differences in the severity of disease score among patients with RH and without RH (p>0.05). RH in patients with malnutrition was more frequent than other groups (p=0.001). Parenteral nutrition was received 53% of patients with RH. Patients who received PN had higher RH ratio than other groups (p=0.001).
Conclusion: RH was found in approximately half of patients with IBD. It should be closely monitored to patient with IBD especially had malnutrition.
SS11
Nutritional Practices and Mortality Relationship in COPDGüler Eraslan DoğanayUniversity of Health Sciences Ankara Atatürk Chest Diseases and Thoracic Surgery Training and Research Hospital, Ankara, Turkey
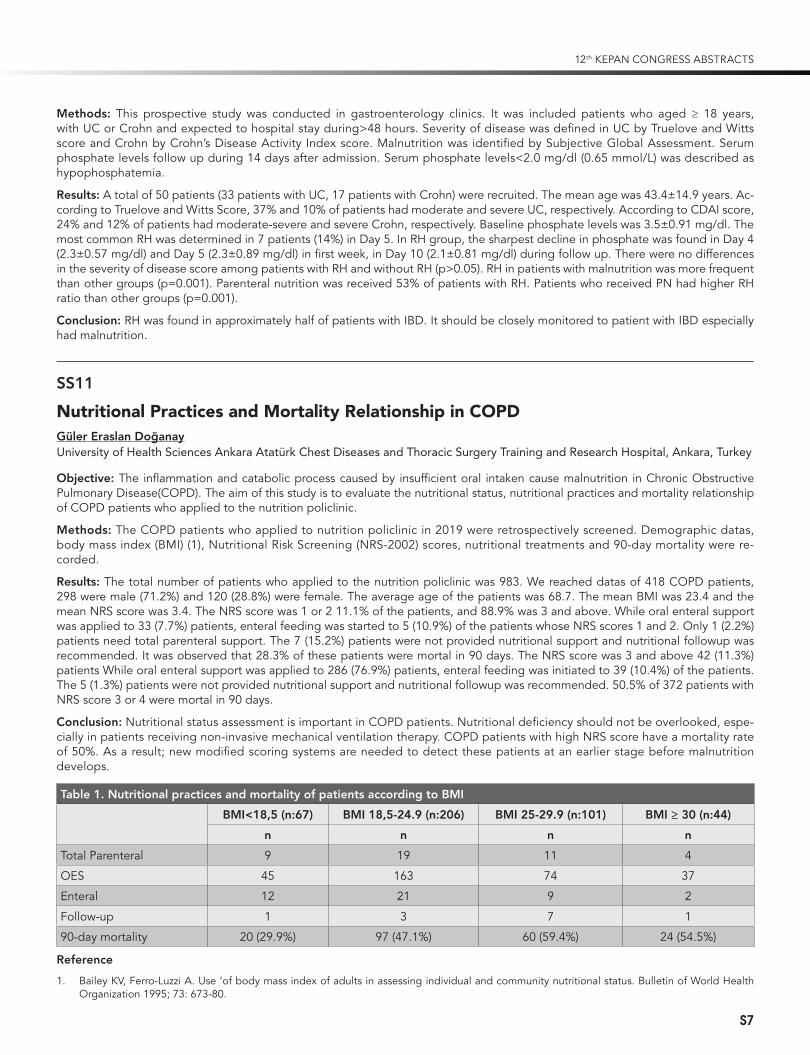
Objective: The inflammation and catabolic process caused by insufficient oral intaken cause malnutrition in Chronic Obstructive Pulmonary Disease(COPD). The aim of this study is to evaluate the nutritional status, nutritional practices and mortality relationship of COPD patients who applied to the nutrition policlinic.
Methods: The COPD patients who applied to nutrition policlinic in 2019 were retrospectively screened. Demographic datas, body mass index (BMI) (1), Nutritional Risk Screening (NRS-2002) scores, nutritional treatments and 90-day mortality were re-corded.
Results: The total number of patients who applied to the nutrition policlinic was 983. We reached datas of 418 COPD patients, 298 were male (71.2%) and 120 (28.8%) were female. The average age of the patients was 68.7. The mean BMI was 23.4 and the mean NRS score was 3.4. The NRS score was 1 or 2 11.1% of the patients, and 88.9% was 3 and above. While oral enteral support was applied to 33 (7.7%) patients, enteral feeding was started to 5 (10.9%) of the patients whose NRS scores 1 and 2. Only 1 (2.2%) patients need total parenteral support. The 7 (15.2%) patients were not provided nutritional support and nutritional followup was recommended. It was observed that 28.3% of these patients were mortal in 90 days. The NRS score was 3 and above 42 (11.3%) patients While oral enteral support was applied to 286 (76.9%) patients, enteral feeding was initiated to 39 (10.4%) of the patients. The 5 (1.3%) patients were not provided nutritional support and nutritional followup was recommended. 50.5% of 372 patients with NRS score 3 or 4 were mortal in 90 days.
Conclusion: Nutritional status assessment is important in COPD patients. Nutritional deficiency should not be overlooked, espe-cially in patients receiving non-invasive mechanical ventilation therapy. COPD patients with high NRS score have a mortality rate of 50%. As a result; new modified scoring systems are needed to detect these patients at an earlier stage before malnutrition develops.
Table 1. Nutritional practices and mortality of patients according to BMI
BMI<18,5 (n:67) BMI 18,5-24.9 (n:206) BMI 25-29.9 (n:101) BMI ≥ 30 (n:44)
n n n n
Total Parenteral 9 19 11 4
OES 45 163 74 37
Enteral 12 21 9 2
Follow-up 1 3 7 1
90-day mortality 20 (29.9%) 97 (47.1%) 60 (59.4%) 24 (54.5%)
Reference
1. Bailey KV, Ferro-Luzzi A. Use ‘of body mass index of adults in assessing individual and community nutritional status. Bulletin of World Health Organization 1995; 73: 673-80.
12th KEPAN CONGRESS ABSTRACTS
S7
SS12
The Relationship between Malnutrition and Mortality in COVID-19 PatientsEce Saygılı1, Osman Ekinci², Nezihe Gökşenoğlu², Zahide Keleş1
1Haydarpaşa Numune Training and Research Hospital, Nutritional Support Unit, İstanbul, Turkey 2Haydarpaşa Numune Training and Research Hospital, Department of Anaesthesiology and Reanimation, İstanbul, Turkey
Objective: Coronavirus disease 2019 (COVID-19) first appeared in Wuhan, China in December 2019 and was declared as a pan-demic by the World Health Organization (WHO) on March 11, 2020. That disease affecting all age groups has a severe course espe-cially in elderly people all over the world; It is observed that the need for intensive care and mortality are higher for this age group (1). Worldwide high consumption of diets high in saturated fats, sugar and refined carbohydrates (Western-style diet) damage the host’s defense against the virus by causing chronic inflammation, so this increases COVID-19 pathology and mortality (2) In studies conducted; Malnutrition is common in patients with a diagnosis of covid-19 (2, 3). In our study, it was aimed to investigate the rela-tionship between malnutrition and mortality in patients diagnosed with covid-19.
Methods: Patients diagnosed with COVID-19 who admitted to Haydarpaşa Numune Training and Research Hospital between April 1 and July 31, 2020 were included in our study. NRS 2002 is used for nutritional assessment. Patients with a score of 3 or more were evaluated at risk for malnutrition. We compared the mortality rate between two groups with and without malnutrition risk in patients covid 19 diagnosed.
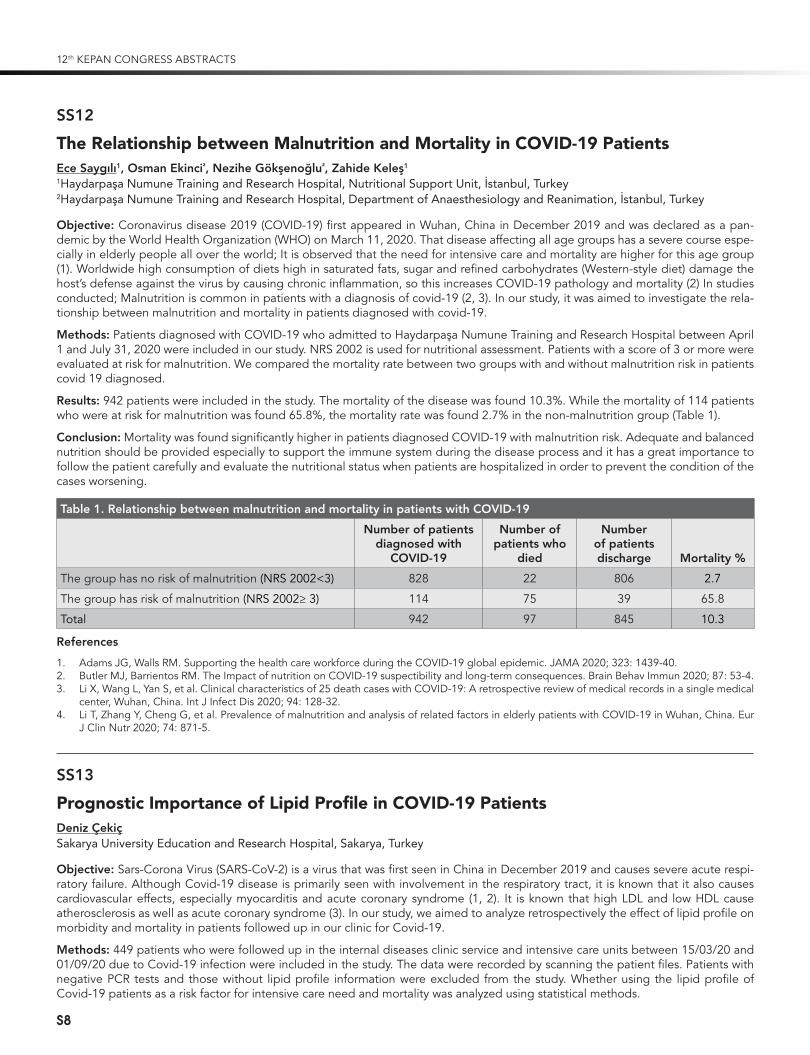
Results: 942 patients were included in the study. The mortality of the disease was found 10.3%. While the mortality of 114 patients who were at risk for malnutrition was found 65.8%, the mortality rate was found 2.7% in the non-malnutrition group (Table 1).
Conclusion: Mortality was found significantly higher in patients diagnosed COVID-19 with malnutrition risk. Adequate and balanced nutrition should be provided especially to support the immune system during the disease process and it has a great importance to follow the patient carefully and evaluate the nutritional status when patients are hospitalized in order to prevent the condition of the cases worsening.
Table 1. Relationship between malnutrition and mortality in patients with COVID-19
Number of patients diagnosed with
COVID-19
Number of patients who
died
Number of patients discharge Mortality %
The group has no risk of malnutrition (NRS 2002<3) 828 22 806 2.7
The group has risk of malnutrition (NRS 2002≥ 3) 114 75 39 65.8
Total 942 97 845 10.3
References
1. Adams JG, Walls RM. Supporting the health care workforce during the COVID-19 global epidemic. JAMA 2020; 323: 1439-40.2. Butler MJ, Barrientos RM. The Impact of nutrition on COVID-19 suspectibility and long-term consequences. Brain Behav Immun 2020; 87: 53-4.3. Li X, Wang L, Yan S, et al. Clinical characteristics of 25 death cases with COVID-19: A retrospective review of medical records in a single medical
center, Wuhan, China. Int J Infect Dis 2020; 94: 128-32.4. Li T, Zhang Y, Cheng G, et al. Prevalence of malnutrition and analysis of related factors in elderly patients with COVID-19 in Wuhan, China. Eur
J Clin Nutr 2020; 74: 871-5.
SS13
Prognostic Importance of Lipid Profile in COVID-19 PatientsDeniz ÇekiçSakarya University Education and Research Hospital, Sakarya, Turkey
Objective: Sars-Corona Virus (SARS-CoV-2) is a virus that was first seen in China in December 2019 and causes severe acute respi-ratory failure. Although Covid-19 disease is primarily seen with involvement in the respiratory tract, it is known that it also causes cardiovascular effects, especially myocarditis and acute coronary syndrome (1, 2). It is known that high LDL and low HDL cause atherosclerosis as well as acute coronary syndrome (3). In our study, we aimed to analyze retrospectively the effect of lipid profile on morbidity and mortality in patients followed up in our clinic for Covid-19.
Methods: 449 patients who were followed up in the internal diseases clinic service and intensive care units between 15/03/20 and 01/09/20 due to Covid-19 infection were included in the study. The data were recorded by scanning the patient files. Patients with negative PCR tests and those without lipid profile information were excluded from the study. Whether using the lipid profile of Covid-19 patients as a risk factor for intensive care need and mortality was analyzed using statistical methods.
12th KEPAN CONGRESS ABSTRACTS
S8

Results: The demographic characteristics of the patients are given in Table 1. Hypertension (HT) was the most common comorbid disease in 54.7% of the patients. The mean age was 65.8±14.9 years. The average age of the patients in need of intensive care (ICU) was 69.25±11.7 years, and the average age of the patients followed in the service was 57.58±17.3 years (p=0.009). The mean age of the patients who died was 71.05±10.9 years and the mean age of the patients who were healed was 60.9±15.9 years (p=0.00). Both results were found to be statistically significant. LDL levels were found to be 96.89 mg/dl in patients who died and 103.05 mg/dl (p=0.047) in patients who were healed, and this result was found to be statistically significant. Total cholesterol levels were 141.32 mg/dl in ICU patients, 162.34 mg/dl in clinic patients (p=0.00), 139.83 mg/dl in patients who died, and 154.36 mg/dl in healed patients (p=0.00). Both differences were statistically significant. The mean HDL level was 31.79 mg/dl in ICU patients, 38.53 in clinic patients (p=0.00); it was 32.08 mg/dl in the patients who died and 35.23 mg/dl in those who were healed (p=0.006). This difference was found to be statistically significant (Table 2).
Conclusion: Similarly, in the study conducted by Wei et al., when Covid-19 disease severity and LDL levels were examined, the average LDL/Total cholesterol levels of 394 patients with moderate levels were 91 mg/dl/173 mg/dl, while they were 69 mg/dl/125 mg/dl in 32 patients with critical levels. In the same study, it was observed that there was an reverse relationship between the de-crease in LDL levels and IL-6 and CRP levels. Although we do not have clear information about the pathogenesis, the effects on liver metabolism and the disruption of cholesterol flow by increasing proinflammatory cytokines in serum are seen as possible causes in Covid-19 patients [4]. Lipid profile changes in inflammations due to viral infection have been previously known. It is known that LDL levels in HIV increase and HDL levels decrease [5]. In conclusion, it should be taken into account that in the Covid-19 pandemic, the lipid profile may be useful in predicting the mortality and morbidity of the disease.
Keywords: Covid-19, dyslipidemia
References
1. Huang C, Wang Y, Li X, et al. Clinical features of patients infected with 2019 novel coronavirus in Wuhan, China. Lancet 2020; 395: 497-506.2. Oudit GY, Kassiri Z, Jiang C, et al. SARS-coronavirus modulation of myocardial ACE2 expression and inflammation in patients with SARS. Eur J
Clin Invest 2009; 39: 618-25.3. Expert Panel on Detection, Evaluation, and Treatment of High Blood Cholesterol in Adults. Executive Summary of The Third Report of The Na-
tional Cholesterol Education Program (NCEP) Expert Panel on Detection, Evaluation, And Treatment of High Blood Cholesterol In Adults (Adult Treatment Panel III). JAMA 2001; 285: 2486-97.
4. Wei X, Zeng W, Su J, et al. Hypolipidemia is associated with the severity of COVID-19. J Clin Lipidol 2020; 14. doi:10.1016/j.jacl.2020.04.008.5. Baker J, Ayenew W, Quick H, et al. High-Density Lipoprotein Particles and Markers of Inflammation and Thrombotic Activity in Patients with
Untreated HIV Infection. J Infect Dis 2010; 201: 285-92.
Table 1. Demographic characteristics
Total n=449 ICU n=318 Clinic n=131 p
Mean age (standard deviation) 65.8±14.9 (n=449) 69.25±11.7 (n=318) 57.58±17.3 (n=131) p=0.009
Sex Male, (n %) 269 (59.9%) 207 (65 %) 62 (47.3%)
Female, (n %) 180 (40.1%) 111 (35%) 69 (52.7%)
Total n=449 Death n=219 Recovery n=210 p
Mean age (standard deviation) 65.8±14.9 (n=449) 71.05±10.9 (n=219) 60.9±15.9 (n=230) p=0.00
Sex Female, (n %) 269 (59.9%) 144 (65.7%) 125 (54.3%)
Male, (n %) 180 (40.1%) 75 (34.3%) 104 (45.7%)M: mean value; SD: standard deviation; n: number; %: percentage; Min-Max (Median): minimum, maximum and median value
Table 2. Comparison of lipid profile of patients and mortality and ICU need
Parameter ICU Clinic p Death Recovery p
Ldl 99.40 (318) 102.23 (131) 0.405 96.89 (217) 103.05 (229) 0.047
Hdl 31.79 (321) 38.53 (132) 0.000 32.08 (219) 35.23 (231) 0.006
Total cholesterol 141.32 (320) 162.34 (132) 0.000 139.83 (219) 154.36 (230) 0.000Test: Independent T; n: number; Ldl: Low density lipoprotein; Hdl: High density lipoprotein
SS14
Use of NUTRIC and modified NUTRIC Score as a Prognostic Indicator in Critically ill COVID-19 Patients: A Retrospective Study
12th KEPAN CONGRESS ABSTRACTS
S9
Gülbahar Çalışkan, Pınar Küçükdemirci Kaya, Mustafa Dikici, Nermin Kelebek GirginMinistry of Health, Bursa City Hospital, Department of Anesthesiology and Intensive Care, Bursa, Turkey
Objective: When and how to implement nutrition therapy is still a controversial issue in critical illnesses. It is recommended to use variables related to current metabolic status instead of traditional screening tools (BMI, weight loss, etc.) to assess nutritional risk in intensive care units (ICU) (1). Heyland et al. (2) presented a new screening tool called Nutrition Risk in Critically Ill (NUTRIC) score, which was validated for ICU patients. However, due to the difficulty of obtaining IL-6 in clinical practice, the NUTRIC score was later validated without the use of IL-6, yielding the modified NUTRIC (mNUTRIC) score. SARS-CoV-2 infection causes significant morbidity and mortality as a result of acute respiratory complications. The risk is higher especially in the elderly, patient with multiple comorbid diseases (DM, hypertension, etc.) and individuals with malnutrition. In addition, muscle loss and weakness due to immobility and prolonged ICU stay may increase the risk of malnutrition in critically ill COVID-19 patients. Therefore, management and prevention of malnutrition should be included in the treatment of COVID-19 patients. However, the clinical evidence for the association be-tween nutritional risk assessment tools and clinical outcomes in patients with COVID-19 is limited. In addition, there are insufficient data to suggest that NUTRIC and the modified NUTRIC score can be used as a suitable tool in COVID-19 patients (3). We aimed to investigate the applicability of the NUTRIC and the mNUTRIC scores for assessing nutritional risks and predicting outcomes of these critically ill COVID-19 patients.
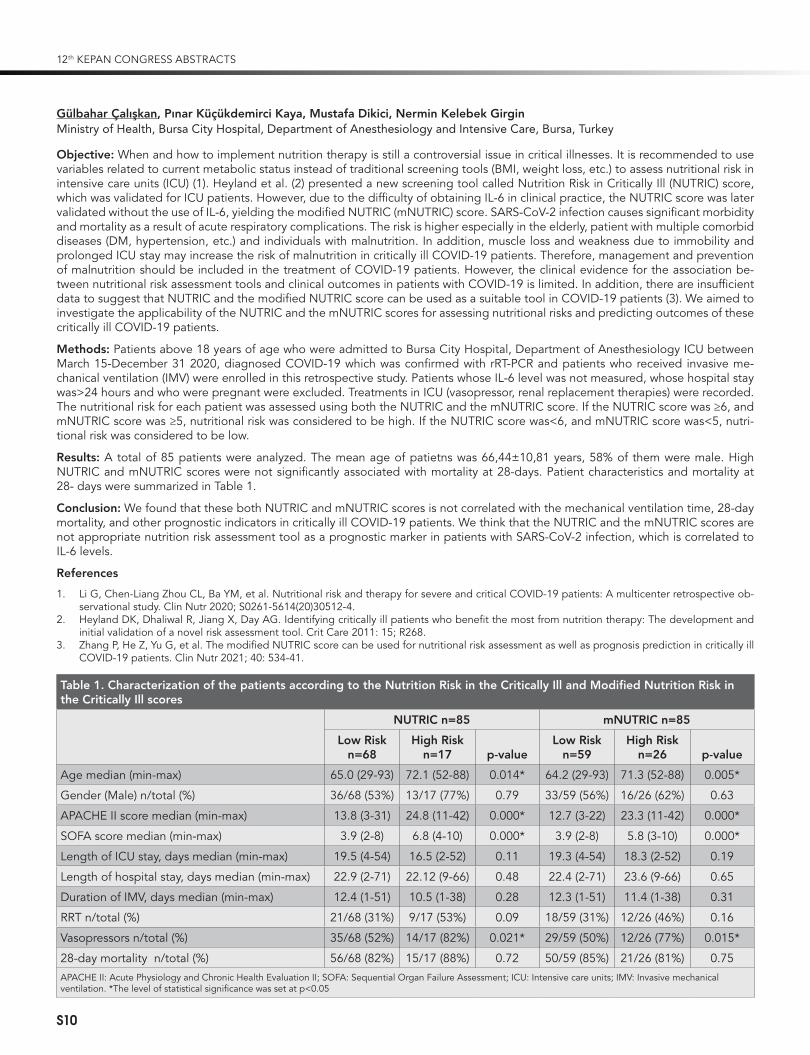
Methods: Patients above 18 years of age who were admitted to Bursa City Hospital, Department of Anesthesiology ICU between March 15-December 31 2020, diagnosed COVID-19 which was confirmed with rRT-PCR and patients who received invasive me-chanical ventilation (IMV) were enrolled in this retrospective study. Patients whose IL-6 level was not measured, whose hospital stay was>24 hours and who were pregnant were excluded. Treatments in ICU (vasopressor, renal replacement therapies) were recorded. The nutritional risk for each patient was assessed using both the NUTRIC and the mNUTRIC score. If the NUTRIC score was ≥6, and mNUTRIC score was ≥5, nutritional risk was considered to be high. If the NUTRIC score was<6, and mNUTRIC score was<5, nutri-tional risk was considered to be low.
Results: A total of 85 patients were analyzed. The mean age of patietns was 66,44±10,81 years, 58% of them were male. High NUTRIC and mNUTRIC scores were not significantly associated with mortality at 28-days. Patient characteristics and mortality at 28- days were summarized in Table 1.
Conclusion: We found that these both NUTRIC and mNUTRIC scores is not correlated with the mechanical ventilation time, 28-day mortality, and other prognostic indicators in critically ill COVID-19 patients. We think that the NUTRIC and the mNUTRIC scores are not appropriate nutrition risk assessment tool as a prognostic marker in patients with SARS-CoV-2 infection, which is correlated to IL-6 levels.
References
1. Li G, Chen-Liang Zhou CL, Ba YM, et al. Nutritional risk and therapy for severe and critical COVID-19 patients: A multicenter retrospective ob-servational study. Clin Nutr 2020; S0261-5614(20)30512-4.
2. Heyland DK, Dhaliwal R, Jiang X, Day AG. Identifying critically ill patients who benefit the most from nutrition therapy: The development and initial validation of a novel risk assessment tool. Crit Care 2011: 15; R268.
3. Zhang P, He Z, Yu G, et al. The modified NUTRIC score can be used for nutritional risk assessment as well as prognosis prediction in critically ill COVID-19 patients. Clin Nutr 2021; 40: 534-41.
Table 1. Characterization of the patients according to the Nutrition Risk in the Critically Ill and Modified Nutrition Risk in the Critically Ill scores
NUTRIC n=85 mNUTRIC n=85
Low Risk n=68
High Risk n=17 p-value
Low Risk n=59
High Risk n=26 p-value
Age median (min-max) 65.0 (29-93) 72.1 (52-88) 0.014* 64.2 (29-93) 71.3 (52-88) 0.005*
Gender (Male) n/total (%) 36/68 (53%) 13/17 (77%) 0.79 33/59 (56%) 16/26 (62%) 0.63
APACHE II score median (min-max) 13.8 (3-31) 24.8 (11-42) 0.000* 12.7 (3-22) 23.3 (11-42) 0.000*
SOFA score median (min-max) 3.9 (2-8) 6.8 (4-10) 0.000* 3.9 (2-8) 5.8 (3-10) 0.000*
Length of ICU stay, days median (min-max) 19.5 (4-54) 16.5 (2-52) 0.11 19.3 (4-54) 18.3 (2-52) 0.19
Length of hospital stay, days median (min-max) 22.9 (2-71) 22.12 (9-66) 0.48 22.4 (2-71) 23.6 (9-66) 0.65
Duration of IMV, days median (min-max) 12.4 (1-51) 10.5 (1-38) 0.28 12.3 (1-51) 11.4 (1-38) 0.31
RRT n/total (%) 21/68 (31%) 9/17 (53%) 0.09 18/59 (31%) 12/26 (46%) 0.16
Vasopressors n/total (%) 35/68 (52%) 14/17 (82%) 0.021* 29/59 (50%) 12/26 (77%) 0.015*
28-day mortality n/total (%) 56/68 (82%) 15/17 (88%) 0.72 50/59 (85%) 21/26 (81%) 0.75 APACHE II: Acute Physiology and Chronic Health Evaluation II; SOFA: Sequential Organ Failure Assessment; ICU: Intensive care units; IMV: Invasive mechanical ventilation. *The level of statistical significance was set at p<0.05
12th KEPAN CONGRESS ABSTRACTS
S10
SS15
Can an Artificial Intelligence Trained with Albumin-Globulin Prevent COVID-19 Severity?Ahmed Cihad GençGeyve Public Hospital, Sakarya, Turkey
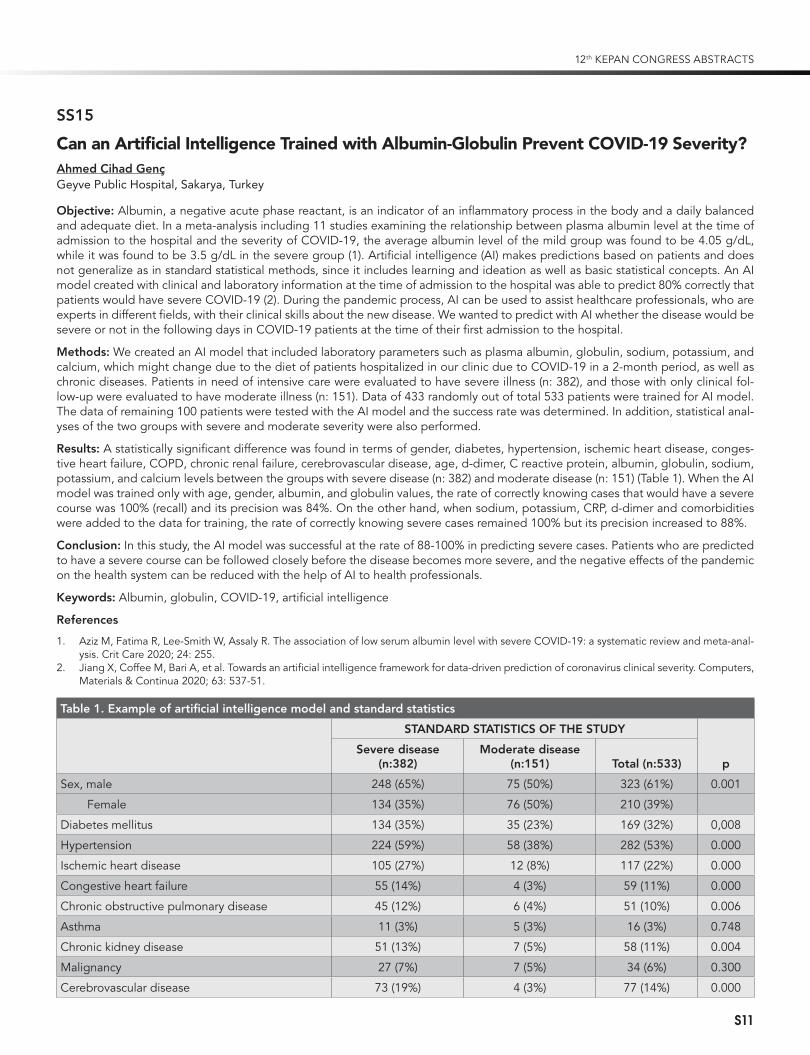
Objective: Albumin, a negative acute phase reactant, is an indicator of an inflammatory process in the body and a daily balanced and adequate diet. In a meta-analysis including 11 studies examining the relationship between plasma albumin level at the time of admission to the hospital and the severity of COVID-19, the average albumin level of the mild group was found to be 4.05 g/dL, while it was found to be 3.5 g/dL in the severe group (1). Artificial intelligence (AI) makes predictions based on patients and does not generalize as in standard statistical methods, since it includes learning and ideation as well as basic statistical concepts. An AI model created with clinical and laboratory information at the time of admission to the hospital was able to predict 80% correctly that patients would have severe COVID-19 (2). During the pandemic process, AI can be used to assist healthcare professionals, who are experts in different fields, with their clinical skills about the new disease. We wanted to predict with AI whether the disease would be severe or not in the following days in COVID-19 patients at the time of their first admission to the hospital.
Methods: We created an AI model that included laboratory parameters such as plasma albumin, globulin, sodium, potassium, and calcium, which might change due to the diet of patients hospitalized in our clinic due to COVID-19 in a 2-month period, as well as chronic diseases. Patients in need of intensive care were evaluated to have severe illness (n: 382), and those with only clinical fol-low-up were evaluated to have moderate illness (n: 151). Data of 433 randomly out of total 533 patients were trained for AI model. The data of remaining 100 patients were tested with the AI model and the success rate was determined. In addition, statistical anal-yses of the two groups with severe and moderate severity were also performed.
Results: A statistically significant difference was found in terms of gender, diabetes, hypertension, ischemic heart disease, conges-tive heart failure, COPD, chronic renal failure, cerebrovascular disease, age, d-dimer, C reactive protein, albumin, globulin, sodium, potassium, and calcium levels between the groups with severe disease (n: 382) and moderate disease (n: 151) (Table 1). When the AI model was trained only with age, gender, albumin, and globulin values, the rate of correctly knowing cases that would have a severe course was 100% (recall) and its precision was 84%. On the other hand, when sodium, potassium, CRP, d-dimer and comorbidities were added to the data for training, the rate of correctly knowing severe cases remained 100% but its precision increased to 88%.
Conclusion: In this study, the AI model was successful at the rate of 88-100% in predicting severe cases. Patients who are predicted to have a severe course can be followed closely before the disease becomes more severe, and the negative effects of the pandemic on the health system can be reduced with the help of AI to health professionals.
Keywords: Albumin, globulin, COVID-19, artificial intelligence
References
1. Aziz M, Fatima R, Lee-Smith W, Assaly R. The association of low serum albumin level with severe COVID-19: a systematic review and meta-anal-ysis. Crit Care 2020; 24: 255.
2. Jiang X, Coffee M, Bari A, et al. Towards an artificial intelligence framework for data-driven prediction of coronavirus clinical severity. Computers, Materials & Continua 2020; 63: 537-51.
Table 1. Example of artificial intelligence model and standard statistics
STANDARD STATISTICS OF THE STUDY
pSevere disease
(n:382)Moderate disease
(n:151) Total (n:533)
Sex, male 248 (65%) 75 (50%) 323 (61%) 0.001
Female 134 (35%) 76 (50%) 210 (39%)
Diabetes mellitus 134 (35%) 35 (23%) 169 (32%) 0,008
Hypertension 224 (59%) 58 (38%) 282 (53%) 0.000
Ischemic heart disease 105 (27%) 12 (8%) 117 (22%) 0.000
Congestive heart failure 55 (14%) 4 (3%) 59 (11%) 0.000
Chronic obstructive pulmonary disease 45 (12%) 6 (4%) 51 (10%) 0.006
Asthma 11 (3%) 5 (3%) 16 (3%) 0.748
Chronic kidney disease 51 (13%) 7 (5%) 58 (11%) 0.004
Malignancy 27 (7%) 7 (5%) 34 (6%) 0.300
Cerebrovascular disease 73 (19%) 4 (3%) 77 (14%) 0.000
12th KEPAN CONGRESS ABSTRACTS
S11

Table 1. Example of artificial intelligence model and standard statistics (Continued)
STANDARD STATISTICS OF THE STUDY
pSevere disease
(n:382)Moderate disease
(n:151) Total (n:533)
Atrial fibrillation 15 (4%) 2 (1%) 17 (3%) 0.172
Age, year 69 (±11.9) 56.6 (±17.4) 65.5 (±14.8) 0.000
Albumin 2.9 (±0.5) 3.6 (±0.5) 3.1 (±0.6) 0.000
Globulin 3.2 (±0.6) 2.9 (±0.5) 3.1 (±0.6) 0.000
Sodium 137.9 (±7.5) 136.9 (±3.3) 137.6 (±6.6) 0.037
Potassium 4.4 (±0.9) 4.2 (±0.5) 4.3 (±0.8) 0.014
Calcium 8 (±0.9) 8.9 (±0.6) 8.3 (±0.9) 0.000
C reactive protein 127.7 (±91.1) 43.1 (±58.9) 103.7 (±91.5) 0.000
d-dimer 4537.7 (±12107) 965.1 (±2920) 3525.6 (±10487) 0.000
An Example of Patient-Specific Response of Artificial Intelligence Model (Correct Prediction at the Rate of 88-100%)
AG
E
SEX
GLO
BU
LIN
ALB
UM
IN
NA
K CA
D-D
imer
CR
P
DM
HT
IHD
CH
F
CO
PD
AST
HM
A
CK
D
MA
LIG
NA
NC
Y
CV
D
AF
MODERATE 65 MALE 3 4 138 5 9 1220 55 - - - - - - - - - -
SEVERE 64 MALE 3 3 133 5 7 402 90 + + - - - - - - - -
SS16
Effect of Vitamin D Level on Mortality and Inflammatory Markers in COVID-19 Patients Over 65 YearsŞerife Gökbulut Bektaş1, Seval İzdeş2
1Department of Intensive Care Unit, Ankara State Hospital, Ankara, Turkey 2Yıldırım Beyazıt University, Department of Intensive Care Unit, Ankara State Hospital, Ankara, Turkey
Objective: We aimed to investigate the relationship between Vitamin D Level and mortality and inflammatory markers in COVID-19 patients over 65 years
Methods: The patients over 65 years old who were followed up in tertiary intensive care due to COVID-19 between April 2020 and September 2020 were retrospectively examined results of laboratory and clinical.
Results: A total of 148 patients, 89 (55.6%) male and 59 (34.4%) female, were included in the study. The levels of D vitamin were 19.1±13.3 (min:4;max:116) ng/ml in the patients. Vitamin D levels of the patients were found to be vitamin D deficient in 94 (63.5%), insufficient in 37 (25%), and normal in 17 (11.5%). APACHE II scores mean were16.5±8. CRP levels were 112.5 (min: 9; max: 314) mg/l in vitamin D deficient, 104 (min: 8; max: 402) mg/l in vitamin D insufficient, and 32 (min: 6; max: 146) mg/l in vitamin D normal. It was significantly higher in group deficient (p=0.001). Compared with IL-6 levels and vitamin D levels, 51 (min: 4.8; max: 2909) pg/mL in deficient group, 38.6 (min:4.1; max:1050) pg/mL in insufficient group, and 33 (min: 6.7; max: 158) pg/mL in normal group (p=0.04). In the relationship of vitamin D ferritin level, deficient group was determined 574 (min: 33; max: 10092) µg/l, 423 (min: 59; max: 1886) µg/l in the insuffucient group and 418 (min: 23; max: 1378) µg/l in the normal group (p=0.02). Vitamin D levels of discharged patients were 16.4 (min: 8; max; 116) ng/ml, while it was found to be 15 (min: 4; max: 40) ng/ml in those who died (p=0.012). According to vitamin D groups, mortality was 59.6% (59/94) in patients with deficient, 48.6% (19/37) in patients with insufficient, and 29.4% (5/17) in patients with normal (p=0.01). It was found that vitamin D deficiency increased the mortality risk (odds ratio) 1.59 times (CI: 1.04-2.44). The average length of stay in the intensive care unit of patients with no mortality was 15.6±9.9 days in patients with vitamin D levels<30 ng/ml, while it was 10.7±5.7 days in patients with a vitamin D level of ≥30 ng/ml (p=0.059).
12th KEPAN CONGRESS ABSTRACTS
S12

Conclusion: We observed a high rate of patients with low vitamin D levels in patients over 65 years of age hospitalized in the in-tensive care unit due to SARS Cov2 infection. Inflammatory response and mortality rates in patients with vitamin D deficiency were found riser than the others. We believe that this population should be given vitamin D supplements and curfew hours may be ar-ranged in consideration of these findings.
SS17
Effects of Nutrition Strategy on Lymphocytes, and Cytokines Levels in Cachectic Infants Who Undergoing Cardiac SurgeryDilek Doğan1, Ömer Faruk Doğan2
1Adana City Hospital, Nutrition and Dietetic, Adana, Turkey 2Adıyaman University Faculty of Medicine Department of Cardiovascular Surgery, Adıyaman, Turkey
Objective: The defect of cellular immune system and release of inflammatory mediators may lead to infection after use of extracor-poreal circulation (ECC) which has been discussed in a limited number of studies. Our aim of this study was to investigate the effect of earlier nutrition strategy on cellular immune system and cytokine levels in cachectic infants who underwent open cardiac surgery.
Methods: To investigate the effects of nutrition strategies on circulating T-cell lymphocytes, their subsets, and cytokines, we includ-ed 28 consecutive infants with cachexia.We devided the patients into 2 groups. Group 1 received enteral or parenteral nutrition after surgery (n=14). Preoperative patients’ characteristics were comparable. We measured T-lymphocytes, their subsets (OKT4+, and OKT8+ cells) preoperatively and after surgery. We investigated tumor necrosis factor alpha (TNF-alpha), interleukin-6, IL-8, and Natural Killer Cells (Leu 7+ Leu ll+). Blood samples were obtained at postoperative day 1 (POD1) (T1),2st(T2),7th day (T3), 1st month (T4), and 3rd (T5) month after surgery (T4).
Results: Preoperative absolute total lymphocytes were 3200 cells/µl and 3350 cells/µl in group 1 and grup2, respectively (p=0.86). Blood levels of preoperative T-helper and T-suppressor were comparable in both groups (1780 cells/µl vs 1850 cells/µl; and 712 cells/µl vs 696 cells/µl) (p=0.66; p=0.70). We did detect a significant decrease OKT3+ and OKT11+, and OKT4+ cells in both groups in the early after surgery (T1) (p1=0.022; p2=0.01). In contrast, OKT8+ cells and NKCs levels increased significantly in both groups in POD1. OKT3+ cells, and OKT4+ cells reached to normal levels while T-suppressors decreased in group 1 in postoperative 7th day. But, levels of suppressor T-cells, NKCs and interleukins were significantly high in group 2 (T1 (p=0.0001), T2 (p=0.034)), and continued untill discharged (p=0.044). The ratio of T-helper/T-suppressor decreased from 2.01 to 1.02 and 2.2 to 1.3 in group 1, in group 2, respectively (p=0.56) in POD1. TNF-alpha and NKCs (Leu7+-LeuII) levels increased significantly in group 1 (51 vs 88pg/mL) (p=0.002), and (48 vs 162 pg/mL) (p=0.001) in group 2, in POD1. In infants received nutrition both cytokine and T-lymphocyte counts including OKT4/OKT8 ratio reached preoperative values 1 week after surgery. Intragroup analyses showed that absolute lympho-cytes including T-helpers reached to normal values in the 7th day in patients received enteral or parenteral nutrition. IL-6 and IL-8 levels as pro- and inflammatory cytokines reached preoperative levels in the first week in group1, but absolute T-lymphocytes, and their subsets were significantly low at the and of first week. All parameters reached normal limits in the first month and continued during follow-up in group 2.
Conclusion: To prevent mortality and morbidity, immune systems and cytıokines are important in Covid-19 pandemic. Enteral or parenteral nutrition seems to be effective strategy if we start earlier in cachectic infants who underwent ECC. We hypothesize that appropriate enteral or parenteral nutrition including amino acids and vitamin-C may provoke activation of lymphocytes and prevent cytokin storm after ECC.
Keywords: Open cardiac surgery, cellular immunity, cytokines, extracorporeal circulation, nutrition, amino acids
References
1. Saucillo DC, Gerriets VA, Sheng J, Rathmell JC, Maciver NJ. Leptin metabolically licenses T cells for activation to link nutrition and immunity. J Immunol 2014; 192: 136-44.
2. Taylor AK, Cao W, Vora KP, et al. Protein energy malnutrition decreases immunity and increases susceptibility to influenza infection in mice. J Infect Dis 2013; 207: 501-10.
3. Ide H, Kakiuchi T, Furuta N, et al. The effect of cardiopulmonary bypass on T cells and their subpopulations. Ann Thorac Surg 1987; 44: 277-82.4. Bayer A, Dogan OF, Ersoy U, Ersoy F. The effect of open heart surgery on circulating lymphocytes and lymphocyte subsets in pediatric patients.
Turk J Thorac Cardiovasc Surg 2009; 17: 13-7.5. Nguyen DM, Mulder DS, Shennib H. Effect of cardiopulmonary bypass on circulating lymphocyte function. Ann Thorac Surg 1992; 53: 611-6.6. Yamaguchi T, Murakami A, Fukahara K, et al. Changes in T-cell receptor subsets after cardiac surgery in children. Surg Today 2000; 30: 875-8.
SS18
Malnutrition via Sarcopenia, May Cause Orthostatic Intolerance Symptoms in Geriatric Patients
12th KEPAN CONGRESS ABSTRACTS
S13

Arzu Okyar Baş, Süheyla Çöteli, Burcu Balam Doğu, Mustafa Cankurtaran, Meltem Gülhan HalilHacettepe University, Faculty of Medicine, Department of Internal Medicine, Division of Geriatrics, Ankara, Turkey
Objective: Malnutrition is a geriatric syndrome commonly seen in the older population and associated with various adverse out-comes (1). Orthostatic Intolerance Syndrome (OIS) is also an important entity in older adults, as it may be associated with negative consequences, especially falls (2, 3). This study aims to evaluate the relationship between nutritional status and OIS in geriatric out-patients by performing malnutrition screening with MNA-SF.
Methods: Comprehensive geriatric assessments, nutritional status screening with MNA-SF and orthostatic blood pressure evaluation of 102 patients admitted to our Geriatrics outpatient clinic were performed.
Results: One-hundred and two participants enrolled in the study, 35 (34.3%) were men, and 67 (65.7%) were women. The median age of the participants was 74 (IQR=9). There was no statistically significant difference between nutritional status groups in terms of comorbidities. In malnutrition and malnutrition risk groups, no differences were observed in orthostatic hypotension (OH) or ortho-static hypertension (OHT) compared to the normal nutritional status group. Orthostatic tachycardia syndrome (POTS), self-reported OIS before the test and OIS occurred during the test (TOIS) were found more frequent in malnutrition and malnutrition risk groups than in the normal group (p values for POTS, OIS, and TOIS were p=<0,0001, p=0,005, p=<0,021, respectively). The frequencies of probable sarcopenia, sarcopenia, and severe sarcopenia defined by the threshold values of BIA and handgrip4 strength, were found to be more common in the malnutrition and malnutrition risk groups compared to the normal group (Table 1).
Results: Malnutrition in older adults is a substantial problem associated with adverse outcomes. Mini Nutritional Assessment- short-form (MNA-SF) is one of the most widely used malnutrition screening tools in the older population (1). Orthostatic intolerance syndrome; is a cluster of frequent, recurrent or persistent symptoms that occur with transition to standing posture (3). Although the prevalence of ortho-static intolerance in the general population has been reported as 3-4% (2), there is not efficient data on its frequency in older adults. In solely one study, the frequency of systolic OH in patients with malnutrition and malnutrition risk found higher than the normal nutritional group, but no symptom questioning was performed in that study (5). Our study is the first to evaluate both the self-reported OIS and OIS that occurred with provocation during the test, and it was observed that OIS detected in both ways has a strong relationship with the mal-nutrition and malnutrition risk. The relationship between malnutrition and sarcopenia in the geriatric population is a well-known condition. In our study, probable sarcopenia, sarcopenia, and severe sarcopenia were significantly higher in malnutrition and malnutrition risk groups than the normal group, consistent with the literature (6). Loss of lower extremity muscle strength and mass caused by malnutrition, namely sarcopenia, may cause the emergence of OIS by causing unable to provide the venous return needed in the standing position.
Conclusion: Malnutrition and malnutrition risk are associated with orthostatic intolerance symptoms in geriatric patients. This rela-tionship may be explained via sarcopenia caused by malnutrition and consequently inadequate venous return. Randomized con-trolled studies with larger samples are needed to support this hypothesis.
References
1. Volkert D, Beck AM, Cederholm T, et al. ESPEN guideline on clinical nutrition and hydration in geriatrics. Clin Nutr 2019; 38: 10-47. 2. Goswami N, Blaber AP, Hinghofer-Szalkay H, Montani JP. Orthostatic Intolerance in Older Persons: Etiology and Countermeasures. Front Physiol
2017; 8: 803. 3. 2017 ACC/AHA/HRS Guideline for the Evaluation and Management of Patients With Syncope: Executive Summary: A Report of the American
College of Cardiology/American Heart Association Task Force on Clinical Practice Guidelines and the Heart Rhythm Society. Circulation 2017; 136: e25-e59.
4. Cruz-Jentoft AJ, Bahat G, Bauer J, et al. Sarcopenia: revised European consensus on definition and diagnosis. Age Ageing 2019; 48: 16-31.5. Kocyigit SE, Soysal P, Ates Bulut E, Isik AT. Malnutrition and Malnutrition Risk Can Be Associated with Systolic Orthostatic Hypotension in Older
Adults. J Nutr Health Aging 2018; 22: 928-33. 6. Reijnierse EM, Trappenburg MC, Leter MJ, et al. The Association between Parameters of Malnutrition and Diagnostic Measures of Sarcopenia
in Geriatric Outpatients. PLoS One 2015; 10: e0135933.
Table 1. Demographic characteristics, comprehensive geriatric evaluation findings, sarcopenia evaluation, and orthostatic blood pressure changes according to the nutritional status groups
Malnutrition (MNA-SF<7) n=16 (16%)
Malnutrition Risk (MNA-SF=8-11) n=38 (37.2%)
Normal nutritional status (MNA>12)
n=48 (46.8%) P value
Sex n (%) Female 9 (57.1%) 26 (69.0%) 29 (61.0%) 0.697
Male 7 (42.9%) 12 (31.0%) 19 (39.0%)
Age, median (IQR) 73.5 (8.5) 73.5 (10.5) 72.5 (11) 0.371
ADL, median (IQR) 5 (2) 5 (1) 6 (1) 0.010
IADL, median (IQR) 8 (4.5) 7 (3) 8 (1) 0.003
MMSE, median (IQR) 24.5 (6) 24.5 (6) 28.0 (6) 0.003
Yesavage Score median (IQR) 5.0 (7.5) 3.5 (7) 2.0 (3) 0.002
12th KEPAN CONGRESS ABSTRACTS
S14

Table 1. Demographic characteristics, comprehensive geriatric evaluation findings, sarcopenia evaluation, and orthostatic blood pressure changes according to the nutritional status groups (Continued)
Malnutrition (MNA-SF<7) n=16 (16%)
Malnutrition Risk (MNA-SF=8-11) n=38 (37.2%)
Normal nutritional status (MNA>12)
n=48 (46.8%) P value
Self-Reported OIS n, (%) 12 (75.0%) 23 (60.5%) 15 (33.3%) 0.005
OIS occured during the test n, % 2 (12.5%) 12 (31.6%) 4 (8.7%) 0.021
Orthostatic hypotension, n (%) 5 (31.3%) 8 (21.1%) 11 (23.9%) 0.725
Orthostatic hypertension, n (%) 1 (6.3%) 8 (21.1%) 9 (20.0%) 0.389
Postural tachycardia syndrome, n (%) 8 (50.0%) 8 (21.0%) 2 (4.3%) <0.0001
Polypharmacy, n (%) 8 (57.1%) 18 (62.1%) 30 (73.2%) 0.443
Falls, n (%) 7 (50.0%) 8 (27.6%) 10 (24.4%) 0.185
Incontinance, n (%) 6 (42.9%) 14 (48.3%) 9 (22.0%) 0.057
Probable sarcopenia, n (%) 10 (71.4%) 9 (31.0%) 11 (26.8%) 0.009
Sarcopenia, n (%) 5 (35.7%) 4 (13.8%) 1 (2.4%) 0.004
Severe sarcopenia, n (%) 4 (28.6%) 3 (10.3%) 1 (2.4%) 0.016
SS19
Determination of the Malnutrition Risk in Overweight and Obese Patients with Cardiovascular DiseaseSema Çalapkorur, Buse BakırErciyes University, Faculty of Health Sciences, Kayseri, Turkey
Objective: Overnutrition may be accompanied by malnutrition in overweight and obese patients. However, the risk of malnutrition is not estimated in these individuals, therefore, routine nutrition screening is not performed in the clinics. This study was carried out to determine the risk of malnutrition in overweight and obese individuals with cardiovascular disease.
Methods: The study was carried out with 238 patients receiving treatment in Erciyes University Hospitals between October 2018 and March 2019. The data on patients’ demographic characteristics and health status were recorded, and their anthropometric measurements were performed in accordance with the method. NRS-2002 and MNA-SF forms were used in determining the risk of malnutrition of patients. The data obtained were analyzed using SPSS 22.0, and p<0.05 was considered statistically significant.
Results: According to NRS-2002, the risk of malnutrition in patients was found to be 39.9%. According to MNA-SF evaluation, it was determined that 42.4% of the patients were at risk of malnutrition and 7.1% of them had malnutrition. According to NRS-2002, it was determined that the risk of malnutrition was 18.8% in overweight patients and 21.1% in obese patients; and according to MNA-SF, the risk of malnutrition was 20.6% in overweight patients and 21.8% in obese patients (p>0.05). According to MNA-SF form, it was determined that 2.5% of overweight patients and 4.6% of obese patients had malnutrition (p>0.05). It was determined that there was a statistically significant and poor consistence between the two screening tools (kappa=0.308).
Conclusion: At the end of our study, the determination of the risk of malnutrition in approximately 40% of overweight and obese patients indicated the importance of nutrition screening in this patient group. In accordance with these results, it was emphasized that the nutrition screening of all patients receiving treatment in the clinics should be performed by dieticians using appropriate screening tools.
Keywords: Nutrition, screening, malnutrition, obese
SS20
Comparison of Malnutrition Assessment Tools in Terms of Revealing the Relationship Between Polypharmacy and MalnutritionGüzin ÇakmakGaziantep University, Faculty of Medicine, Department of Internal Medicine, Division of Geriatric Medicine, Gaziantep, Turkey
12th KEPAN CONGRESS ABSTRACTS
S15

Objective: Malnutrition is prevalent among older adults and is associated with morbidity and mortality. Polypharmacy and poten-tially inappropriate medication use are also common in people. This study aims to investigate the relationship between malnutrition and polypharmacy in older adults. We also tested which malnutrition test had a stronger relationship with polypharmacy.
Study setting and design: We conducted a cross-sectional study for four months.
Methods: We assessed malnutrition by mini nutritional assessment short-form (MNA-SF), long-form (MNA-LF), and Global Leader-ship Initiative on Malnutrition criteria (GLIM) (1). We evaluated potentially inappropriate medication (PIM) use was by TIME (Turkish Inappropriate Medication Use in the Elderly) criteria (2). Data analysis was done by SPSS version 22.
Results: The study population was composed of 93 women and 57 men, of mean age 73 +/- 9 years. Polypharmacy was present in 73% (n=110) of them. MNA-SF, MNA-LF and GLIM scores were correlated with presence of polypharmacy (p=0.036, p=0.002, p=0.045). The relationship was summarized in table 1. MNA-LF was associated with polypharmacy in linear regression analysis (r²=0.06, p=0.046). PIM use was found to be negatively related to MNA-LF scores (p=0.049, r=-0.166). We demonstrated a cut-off value of 6.5 of drug numbers for being malnourished (sensitivity 80%; specificity 88%; p<0.01).
Conclusion: In this study, we concluded that malnutrition and polypharmacy, two common geriatric syndromes, are associated with each other. According to the results of our study, we can say that MNA-LF is a powerful malnutrition assessment tool to demonstrate the malnutrition polypharmacy relationship. Prospective studies to evaluate effect of correction of malnutrition on polypharmacy could be useful.
Keywords: Malnutrition, polypharmacy, potentially inappropriate medication, TIME
References
1. Cederholm T, Barazzoni R, Austin P, et al. ESPEN Guideline ESPEN guidelines on de finitions and terminology of clinical nutrition. 2017; 36: 49-64.
2. Bahat G, Ilhan B, Erdogan T, et al. Turkish inappropriate medication use in the elderly (TIME) criteria to improve prescribing in older adults: TIME to STOP/TIME to START. Eur Geriatr Med 2020; 0123456789.
Table 1. Relationship between malnutrition and polypharmacy
Malnutrition assessment tool Presence of polypharmacy Number of drugs used
MNA-SF* p=0.018, r=-0.195* p<0.001, r=-0.475**
MNA-LF* p=0.002, r=-0.264** p<0.001, r=-0.628**
GLIM* p=0.024, r=0.176* p<0.001, r=0.462*
SS21
Assessment of Relationship Between Sarcopenia, Frailty, and Malnutrition by Exploiting New CriteriaErcüment Öztürk, Güzin ÇakmakGaziantep University, Faculty of Medicine, Department of Internal Medicine, Division of Geriatric Medicine, Gaziantep, Turkey
Ojective: Frailty, sarcopenia, and malnutrition are common geriatric syndromes that thought to be associated with disability and reduced life expectancy. In this study, we aimed to define the relationship between frailty, sarcopenia, and malnutrition. We also evaluated, which diagnosing method for malnutrition or frailty showed the relationship more accurately.
Methods: This cross-sectional study was conducted for a period of 4 months from September 2019 to January 2020. Patients ap-plied to the outpatient clinic of geriatrics were taken in the study. Malnutrition was assessed by Mini Nutritional Assessment–Short Form (MNA–SF), Mini Nutritional Assessment–Long Form (MNA-LF), and Global Leadership Initiative on Malnutrition (GLIM) criteria. Katz Index of Independence in Activities of Daily Living (ADL) and Lawton –Brody Instrumental Activities of Daily Living Scale (IADL) were done for disability. Frailty was evaluated by Fried’s criteria and Study of Osteoporotic Fractures (SOF) criteria. EWGSOP 2 (European Working Group on Sarcopenia in Older People) criteria were used to diagnose sarcopenia (1). Data analysis was done by using SPSS (Statistical Package for the Social Sciences) version 22. Chi-square test, correlation analysis, and linear regression model were used to evaluate the relationship between parameters.
Results: The study population was composed of 57 women and 43 men, of mean age 72.8 +/– 7.4 years. According to SOF criteria 20 patients were robust, 35 patients were pre-frail, and 45 patients were frail. According to Fried criteria 5 patients were robust, 49 patients were pre-frail, and 46 were frail. Handgrip strength, skeletal muscle mass index (SMMI), gait speed, and timed up and go test (TUG) score were better in males. Other parameters were not related with gender (Table 1). Frailty was found to be related with malnutrition and sarcopenia. Malnutrition was associated with sarcopenia. Both gait speed and TUG score were shown to be related with frailty. Also, ADL and IADL were related with frailty. Handgrip strength was found to be independently related with SOF and Fried criteria in linear regression analysis (r²=0.222, p=0.003; r²=0.200, p<0.001). GLIM criteria were shown to be the only malnutrition measure that
12th KEPAN CONGRESS ABSTRACTS
S16

independently related with SOF criteria (r²=0.414, p=0.01). Fried criteria were independently related with MNA-SF, MNA-LF and GLIM criteria (r²=0.474; p=0.007, p=0.017, p=0.01). SOF criteria were independently related with IADL (r²=0.117, p=0.011). Conclusion: Frailty and sarcopenia are important geriatric syndromes. Definitions of frailty and sarcopenia are still developing. New screening and diagnosing methods for malnutrition are under development. Malnutrition plays a key role in the pathogenesis of frailty and sarcopenia (2). In this study, SOF criteria and GLIM criteria were shown to be better when the relationship with other syndromes considered.
Keywords: Sarcopenia, frailty, malnutrition
References
1. CruzJentoft AJ, Bahat G, Bauer J. Sarcopenia: revised European consensus on definition and diagnosis. Age Ageing 2019; 48: 16-31.2. Cruz-Jentoft AJ, Kiesswetter E, Drey M, Sieber CC. Nutrition frailty and sarcopenia. Aging Clin Exp Res 2017; 29: 43-48.
Table 1. Relationship of parameters with gender
ParametersMean (Male)
Standard Deviation (Male)
Mean (Female)
Standard Deviation (Female) p
Handgrip 30.13 12.46 19.01 9.6 0.012*
SMMI 11.37 1.57 10.52 1.47 0.01*
Gait Speed 0.51 0.15 0.44 0.14 0.05*
MNA-SF 9.91 2.54 11.02 3.95 0.296
MNA-LF 21.96 3.94 22.65 5.06 0.103
GLIM 0.78 0.74 0.88 0.81 0.592
SOF 1.34 0.97 1.47 1 0.985
Fried 2.6 1.5 2.66 1.43 0.954
Katz 5.37 1.03 5.30 0.91 0.569
Lawton-Brody 4.74 2.8 5.7 2.47 0.089
TUG 15.48 5.27 17.28 5.68 0.039*
SARC-F 3.65 3.56 3.91 3.20 0.04*
SS22
Can Ultrasonography be Used to Predict Sarcopenia in Sarcoidosis Patients?Mert Eşme1, Oğuz Karcıoğlu2, Aslı Öncel2, Gözde Şengül Ayçiçek3, Sevinç Sarınç Ulaşlı2, Deniz Köksal2, Burcu Balam Doğu1, Mustafa Cankurtaran1, Meltem Halil11Hacettepe University, Faculty of Medicine, Department of Internal Diseases, Division of Geriatric, Ankara, Turkey 2Hacettepe University, Faculty of Medicine, Department of Chests Diseases, Ankara, Turkey 3Kırıkkale University, Faculty of Medicine, Division of Geriatric, Kırıkkale, Turkey
Objective: Sarcoidosis can cause sarcopenia like other chronic diseases. Ultrasonography is a simple method which has been used frequently in recent years. We aimed to evaluate the sarcoidosis patients with ultrasonography for sarcopenia and to compare the results of ultrasonography with the accepted standard method bioelectrical impedance analysis (BIA).
Methods: BIA and handgrip test was applied to all patients diagnosed with sarcoidosis. The patients were classified according to the presence of probable sarcopenia according to their handgrip results, and the presence of sarcopenia with the appendicular skeletal muscle mass index (ASMI) calculated with using BIA. Ultrasonography was applied to each patient and the thickness of 7 different muscle groups of the patients were evaluated. The ability of muscle thickness values measured by ultrasonography to predict sarco-penia was compared with the gold standard test BIA.
Results: 40 patients (F/M=31/9) were included in our study. The mean age was 53.2±12.5. A statistically significant positive correla-tion was observed between handgrip strength and gastrocnemius (GM), rectus femoris (RF) cross-sectional area, rectus abdominis (RA), external oblique (EO), transvers abdominus (TA) and diaphragm thicknesses. Therefore, there was a significant correlation be-tween FFMI with RA, EO and TA muscles. According to the ROC analysis, statistically significant muscle groups predicting sarcopenia were found as GM, RF crosssectional area, EO and IO. Again, according to the ROC analysis, it was seen that the thicknesses of GM, RA, EO, IO and TA muscles corrected for BMI predicted probable sarcopenia with quite high sensitivity and specificity.
Conclusion: Muscle thicknesses measured by ultrasonography give an idea for the diagnosis of sarcopenia that may develop in chronic diseases such as sarcoidosis. Further studies with higher number of patients are needed to validate the results of the present pilot study.
Keywords: Ultrasound, sarcopenia, sarcoidosis
12th KEPAN CONGRESS ABSTRACTS
S17

References
1. Nessrine A, Zahra AF, Taoufik H. Musculoskeletal involvement in sarcoidosis. Jornal Brasileiro de Pneumologia 2014; 40: 175-82.2. Baydur A, Pandya K, Sharma OP, Kanel GC, Carlson M. Control of ventilation, respiratory muscle strength, and granulomatous involvement of
skeletal muscle in patients with sarcoidosis. Chest 1993; 103: 396-402.3. Fayad F, Lioté F, Berenbaum F, Orcel P, Bardin T. Muscle involvement in sarcoidosis: a retrospective and followup studies. J Rheumatol 2006; 33:
98-103.4. Zisman DA, Biermann JS, Martinez FJ, Devaney KO. Sarcoidosis presenting as a tumorlike muscular lesion. Case report and review of the liter-
ature. Medicine 1999; 78: 112-22.5. Maeshima S, Koike H, Noda S, et al. Clinicopathological features of sarcoidosis manifesting as generalized chronic myopathy. J Neurol 2015;
262: 1035-45.6. Cruz-Jentoft AJ, Bahat G, Bauer J, et al. Sarcopenia: revised European consensus on definition and diagnosis. Age Ageing 2018; 48: 16-31.7. Kyle UG, Bosaeus I, De Lorenzo AD, et al. Bioelectrical impedance analysis—part II: utilization in clinical practice. Clin Nutr 2004; 23: 1430-53.8. Kyle U, Genton L, Hans D, Pichard C. Validation of a bioelectrical impedance analysis equation to predict appendicular skeletal muscle mass
(ASMM). Clin Nutr 2003; 22: 537-43.
Table 1. Comparison of general characteristics and ultrasonographic muscle thicknessess (millimeter) between male and female patients
Male Female P value
Age 44.44±13.23 55.74±11.29 0.015
BMI (kg/m2) 27.5±4.31 30.1±5.85 0.216
Upper Arm (cm) 27.3±2.73 29.5±3.95 0.16
Calf (cm) 35.6±4.95 36.2±3.75 0.62
Handgrip strength, kg 35.7±8.4 22.5±6.02 0.001
6 meter m/s 1.53±0.27 1.24±0.33 0.017
FFMI (kg/m2) 20.76±2.53 17.33±2.40 0.001
ASMI 8.19±1.31 6.48±3.38 0.15
MNA-SF 14 (10-14) 14 (11-14) 0.43
CFS 1 (1-4) 2 (1-4) 0.61
FRIED 0 (0-3) 1 (0-3) 0.79
Gastrocnemius medialis (GM) (mm) 16.06±3.47 18.31±3.80 0.30
Gastrocnemius fibrile lenght (GM) (mm) 33.89±7.54 35.18±7.80 0.70
Rectus femoris (RF) (mm) 15.95±5.49 17.50±4.85 0.67
Rectus femoris cross sectional area 6.54±2.63 8.69±3.22 0.13
Rectus abdominis (RA) (mm) 7.74±1.88 9.32±2.24 0.042
External oblique (EO) (mm) 4.83±1.39 5.08±0.98 0.47
Internal oblique (IO) (mm) 6.15±1.99 7.27±2.55 0.18
Transversus abdominis (TA) (mm) 3.56±1 4.47±1.14 0.027
SS23
Which Department and When Have we Reached the Target in Nutrition Treatment?Pelin Unsal1, Göksel Güven2, Ayşe Dikmeer1, Yelda Uçar1, Suna Bürkük1, Kezban Akçay3, Nilgün Ölmez3, Fatma Tamer3, Şermin Ataç3, Burçin Halaçlı2, Arzu Topeli İskit2, Meltem Halil11Hacettepe University, Faculty of Medicine, Department of Internal Medicine, Division of Geriatric Medicine, Ankara, Turkey2Hacettepe University Faculty of Medicine, Department of Internal Medicine, Division of Intensive Care Unit, Ankara, Turkey3Hacettepe University Faculty of Medicine, Clinical Nutrition Unit, Ankara, Turkey
Objective: Nutritional screening should be performed in all hospitalized patients and nutritional therapy should be initiated in risky patient groups. Calorie and protein needs of patients who are followed up in internal medicine, surgical departments and intensive care units are different. Nutrition therapy should be individualized for each patient.
Methods: The clinical and demographic characteristics of the patients who were followed up by the Hacettepe University Clinical Nutrition Unit between January 2017 and December 2019 retrospectively evaluated according to the departments.
12th KEPAN CONGRESS ABSTRACTS
S18

Results: A total of 1817 patients, including 760 from internal medicine department, 606 from surgical departments, and 451 from intensive care units (ICU), were included in the study. The median age of the patients was 61.8±18.6 in internal medicine, 59.5±14.9 in surgical department and 62.6±16.7 in ICU (p=0.006). While 324 (42.6%), 66 (10.9%) and 140 (31%) patients were receiving enteral nutrition in internal medicine, surgical department and ICU, respectively; 397 (52.2%), 517 (85.5%) and 282 (62.5%) patients were receiving parenteral nutrition support, respectively. Patients who received both enteral and parenteral treatment were 39 (5.1%) in internal medicine, 23 (3.8%) in surgical department, and 29 (6.4%) in ICU (p<0.001). The demographic and clinical characteristics of the patients are given in Table-1. In 2017, 144 (65.8%) patients in internal medicine, 115 (56.4%) patients in surgical department, 98 (59.8%) patients in ICU reached the target calorie (p=0.135). In 2018, 165 (65.5%) patients in internal medicine, 84 (42.9%) patients in surgical department, and 52 (43%) patients in ICU reached the target calorie (p<0.001). In 2019, 123 (51.8%) patients in internal medicine, 91 (55.2%) patients in surgical department, 90 (43.8%) patients in ICU reached the target calorie (p=0.089). When we evaluate at the situtations of reaching the target protein by years and departments, in 2017 124 (56.6%) patients in internal medicine, 78 (38.4%) patients in surgical department, 81 (49.7%) patients in ICU reached the target protein (p=0.001). In 2018, 144 patients in internal medicine (57.4%), 72 (36.9%) patients in surgical department, and 42 (35%) patients in ICU (p<0.001) and in 2019, 118 (46.3%) patients in internal medicine, 89 (43.8%) patients in surgical department, and 54 (33.8%) patients in ICU reached the target protein (p=0.036).
Conclusion: Even if the rate of reaching calorie and protein targets in internal medicine department is higher than surgical depart-ment and ICU, our rate of reaching the calorie target has remained at 50% over the years. While protein targets are achieved in more than half of the patients hospitalized in internal medicine, this rate is much lower in patients hospitalized in surgical department and ICU. Multidisciplinary nutrition teams should also follow the rates of reaching the target in patients who are initiated nutritional therapy.
Table 1. Demographic and clinical characteristics
Internal Medicine Departments (n=760)
Surgical Departments (n=606)
Intensive Care Units (n=451) P
Age 61.8±18.6 59.5±14.9 62.6±16.7 0.006
Gender (female) 423 (55.7%) 354 (58.4%) 252 (55.9%) 0.553
Height 165.2±9.4 166.3±8.75 165.4±9.7 0.063
Weight 56 (50-70) 66 (56-75) 70 (60-80) <0.001
BMI 21.47 (18-24.49) 23.14 (20.6-26.6) 24.9 (22.48-29.9) <0.001
NRS 2002 4.43±0.8 4.54±0.88 5.12±1 <0.001
Follow-up duration (days) 23 (11-39.5) 15 (9-25) 15 (8.25-29) 0.523
Prealbumin 10.2 (6.6-13.6) 10.15 (7.7-14) 10.8 (7.5-14.55) 0.039
CRP 8.04 (3.7-11.6) 11.75 (5-21.6) 12.5 (7.8-21.4) <0.001
Prealbumin (Discharge) 13 (8.9-18.4) 13.5 (9.7-18.8) 12.5 (8.2-18.2) 0.046
CRP (Discharge) 7.8 (2.2-12.4) 6.88 (2.4-12.7) 10.3 (4.5- 15.4) 0.001
Enteral nutrition 324 (42.6%) 66 (10.9%) 140 (31%)
<0.001Parenteral nutrition 397 (52.2%) 517 (85.3%) 282 (62.5%)
Enteral + Parenteral nutrition 39 (5.1%) 23 (3.8%) 29 (6.4%)
DM 174 (22.9%) 105 (17.3%) 103 (22.8%) 0.024
COPD 47 (6.2%) 28 (4.6%) 49 (10.9%) <0.001
CKD 54 (7.1%) 14 (2.3%) 31 (6.9%) <0.001
CAD 91 (12%) 67 (11.1%) 75 (16.6%) 0.018
CHD 42 (5.5%) 13 (2.1%) 34 (7.5%) <0.001
HT 65 (25.5%) 49 (24.1%) 67 (41.6%) <0.001
Malignancy 350 (46.1%) 338 (55.8%) 182 (40.4%) <0.001
Target calories per kg 26 (22.4-29.8) 27.6 (20.9-30) 25 (22.6-28.5) 0.018
Target protein per kg 1.34 (1.13-1.5) 1.39 (1.09-1.5) 1.40 (1.18-1.5) 0.010
Reached calories per kg 21.8 (15.7-26.3) 19.3 (14.8- 23.9) 18 (13- 23.9) 0.223
Reached protein per kg 1.11 (0.8-1.3) 0.97 (0.7-1.2) 0.93 (0.6- 1.2) 0.189
12th KEPAN CONGRESS ABSTRACTS
S19

Table 1. Demographic and clinical characteristics (Continued)
Internal Medicine Departments (n=760)
Surgical Departments (n=606)
Intensive Care Units (n=451) P
The rate of reaching the target calories
2017 144 (65.8%) 115 (56.4%) 98 (59.8%) 0.135
2018 165 (65.5%) 84 (42.9%) 52 (43%) <0.001
2019 123 (51.8%) 91 (55.2%) 90 (43.8%) 0.089
The rate of reaching the target protein
2017 124 (56.6%) 78 (38.4%) 98 (59.8%) 0.001
2018 144 (57.4%) 72 (36.9%) 52 (43%) <0.001
2019 118 (46.3%) 89 (43.8%) 90 (43.8%) 0.036
SS24
Serum Trace Elements in Critically Ill Patients on Continous Renal Replacement Therapy Kürşat Gündoğan1, Faruk Seçkin Yücesoy2, Nurhayat Tuğra Özer3, Şahin Temel1, Serap Şahin3, Gülşah Güneş Şahin3, Aliye Esmaoğlu2, Tutkun Talih4, Cevat Yazıcı5, Murat Sungur1
1Department of Internal Medicine, Division of Intensive Care, Erciyes University, School of Medicine, Kayseri, Turkey2Department of Anesthesiology and Reanimation, Erciyes University, School of Medicine, Kayseri, Turkey3Division of Clinical Nutrition, Erciyes University Health Sciences Institute, Kayseri, Turkey4Department of General Surgery, Erciyes University, School of Medicine, Kayseri, Turkey5Department of Clinical Biochemistry, Erciyes University, School of Medicine, Kayseri, Turkey
Objective: Acute kidney injury (AKI) is common and serious complication in critically ill patients. AKI treated with continuous renal replacement therapy (CRRT) may alter trace element levels in critically ill patients and at risk for disturbances in plasma levels of trace elements due to the underlying illness, AKI, and dialysis1. We aimed to determine trace element balances during CRRT in critically ill patients.
Methods: The study was conducted prospectively in intensive care unit (ICU). The study included patients aged ≥18 years who were admitted in ICU with AKI and required CRRT support (continuous venovenous hemodiafiltration, CVVHDF). Serum trace elements copper, zinc, selenium, chromium and cobalt) measured were measured using the Inductively Coupled Plasma Mass Spectrometer (ICP - MS) on the first three days of CVVHDF and first two days after CVVHDF.
Results: We enrolled 50 patients. The median (min - max) age was 64 (18 88) years. The most common reasons for ICU admission were respiratory failure (34%) and metabolic disorders (20%). The mean baseline SOFA score and NUTRIC score of the patients was 8.1 2.7 and 5 (0.8), respectively. The mean days on CRRT was 2.4 0.5 days. Serum copper, zinc, selenium, chromium and cobalt lev-els at all times and reference range showed Table 1. Serum trace elements was not significantly different from baseline at all times p>0.05). Mortality rate in patients was 86%.
Conclusion: End of the study, all patients had at least one micronutrient abnormalities during follow up. Serum chromium and se-lenium was tended to increase on follow up while cobalt, copper and zinc was tended to decrease on follow up. Zinc and selenium deficiency were the most common in the patients
Table 1. Serum copper, zinc, selenium, chromium and cobalt levels of patients
Copper, µg/dl Zinc, µg/dl Selenium, µg/dl Chromium, µg/dl Cobalt, µg/dl
In CRRT,±SD
Baseline 79.5±32.56 51.71±22.60 2.09±1.36 11.20±3.40 1.03±0.76
Day 1 80.27±32.50 53.00±25.50 1.92±1.15 11.19±3.25 1.06±0.72
Day 3 86.04±27.82 47.13±25.92 2.30±0.90 10.93±2.48 0.67±0.47
After CRRT, range
Day 1 66.63±28.34 51.19±30.72 2.70 (0.30-98.80) 11.07±5.01 0.7 (0.3-13.0)
Day 2 69.43±29.86 48.07±30.01 2.60 (1.30-41.50) 12.65±4.04 0.6 (0.3-4.7)
Reference range 75-145 μg/dL 2 66-110 µg/dL2 5.8–23.4 μg/dL2 0-5 μg/dL3 0-12 μg/dL3
12th KEPAN CONGRESS ABSTRACTS
S20

References
1. DOI: 10.1186/cc127802. DOI:10.1038/s41598-020-58115-23. Editor: Kyle C. A Handbook for the interpretation of laboratory tests. 4th ed. Diagnostic Medlab; 2008.
SS25
Physicians’ Approach to Enteral Nutrition in Patients Receiving Vasoactive Drug TherapyNursel Sürmelioğlu1, Özlem Özkan-Kuşcu2, Kutay Demirkan3, Murat Gündüz4
1Department of Clinical Pharmacy, Faculty of Pharmacy, Çukurova University, Adana, Turkey2Department of Intensive Care Unit, Seyhan State Hospital, Adana, Turkey3Department of Clinical Pharmacy, Faculty of Pharmacy, Hacettepe University, Ankara, Turkey4Department of Anesthesiology and Reanimation, Faculty of Medicine, Çukurova University, Adana, Turkey
Objective: In critical diseases, mucosal integrity is impaired and excessive permeability occurs in enterocytes (1). Considering the ben-efits of enteral nutrition (EN), it was suggested in the guidelines of the European Intensive Care Association that low-dose EN can be initiated if the unstable patient does not start EN, if there is a fluid response, and if stability is achieved with a fixed or decreasing dose of vasopressor support (2). On the other hand, The American Parenteral and Enteral Nutrition Association recommends the initiation/continuation of EN in patients with a mean arterial pressure greater than 60 mmHg, a stable dose of vasoactive drugs, and a decrease in lactate level with sufficient perfusion pressure. However, there are still debates about the best time and differences in clinical practice (3). In this study, it is aimed to determine the physicians’ approaches to EN treatment in patients who require vasopressor support.
Methods: In the study, a 15-question electronic questionnaire prepared for the management of the nutrition of patients receiving vasoactive drug therapy was applied to physicians who had experience in following patients in the intensive care unit. SPSS V20.0 was applied for data analysis. Ethics committee approval was obtained for the study.
Results: In the study, the average age of the 244 physicians participating is 39.76±8.45 years and 134 (54.92%) of them are women. Physicians from the branches of intensive care (35.24%), anesthesiology and reanimation (30.74%) and general surgery (16.39%) mostly participated in the study. It was determined that 96 (39.3%) of the physicians did not use a screening test in evaluating the nutritional status of intensive care patients. While 136 of the physicians (55.7%) stated that they immediately started EN in patients with stable hemodynamics, statistically significant differences were found in the answers according to the branches (p<0.05). When planning nutri-tion in shock patients; It was determined that 24 of the physicians (9.8%) did not take into account the presence of organ failure and 77 (31.5%) of them took the SOFA score into account. 109 of the physicians (44.7%) stated that they interrupted/stopped EN in the use of vasoactive drugs. 86 of the physicians (35.2%) reported that they did not take the lactate level into account in the planning of EN, and 134 of them (54.9%) stopped feeding when it exceeds>4mmol. For hemodynamic unstability patients, 90 physicians (36.9%) reported that they continued with trophic nutrition and 75 physicians (30.7%) reported that they continued with intravenous dextrose solution. (p<0.05). It was determined that 101 of the physicians (41.4%) did not use threshold dose value for norepinephrine and 109 (44.7%) of them for dopamine in the management of nutrition. 181 of the physicians (74.2%) stated that they had encountered EN intolerance in their patients who used vasoactive drugs before and they noticed this situation frequently with abdominal distension, excess gastric residual volume and vomiting. In addition, 30 (12.31%) of the physicians reported that they did not control the residue.
Conclusion: Although most of the physicians had previously encountered EN intolerance when using vasoactive drugs, it was found that they did not tend to use threshold dose values for these drugs. Physicians have different approaches in nutritional management in patients who receive vasoactive medication, and it has been determined that these approaches are influenced by the branch, title and professional experience of the physicians.
References
1. Patel JJ, Rice T, Heyland DK. Safety and outcomes of early enteral nutrition in circulatory shock. JPEN J Parenter Enteral Nutr 2020; 44: 779-84.2. Blaser AR, Starkopf J, Alhazzani W, et al. Early Enteral Nutrition in Critically Ill Patients: ESICM Clinical Pratice Guidelines. Intensive Care Med
2017; 43: 380-98.3. McClave SA, Martindale RG, Vanek VW, et al. Guidelines for the Provision and Assessment of Nutrition Support Therapy in the Adult Critically Ill
Patient: Society of Critical Care Medicine (SCCM) and American Society for Parenteral and Enteral Nutrition (A.S.P.E.N.). JPEN J Parenter Enteral Nutr 2016, 40: 159-211.
SS26
Determination of Appetite and Nutrition Status Before and After Transplantation in Stem Cell Transplanted Children
12th KEPAN CONGRESS ABSTRACTS
S21

Derya Suluhan1, Hilal Kocaerkek2, Dilek Yıldız1, Nevra Koç3, Namık Yaşar Özbek4, Orhan Gürsel51Department of Child Health and Diseases Nursing University of Health Sciences Turkey, Gülhane Faculty of Nursing, Ankara, Turkey2Pediatric Hematology Clinic, Ankara State Hospital, Ankara, Turkey3Ankara State Hospital, Children’s Hospital, Ankara, Turkey4Ankara State Hospital, Pediatric Bone Marrow Transplantation Unit, Ankara, Turkey5Gülhane Education and Research Hospital, Pediatric Bone Marrow/Stem Cell Transplantation Unit, Ankara, Turkey
Objective: In this study, it was aimed to determine the appetite and nutritional status before and after transplantation in children who were scheduled for stem cell transplantation.
Methods: This descriptive study was carried out between November 2018 and November 2020 in the Bone Marrow Transplan-tation Unit of Gulhane Education and Research Hospital and Ankara Child Health and Diseases Hematology Oncology Education and Research Hospital. The study included 25 children between the ages of 7-18 years, who were diagnosed with cancer without a secondary disease and scheduled for stem cell transplantation. For totally five times, including seven days before stem cell trans-plant (Z1), transplant day (Z2), post-transplant first day (Z3), post-transplant 14th day (Z4) and 30th day (Z5), the measurements of weight (kilogram, kg), height (centimeter, cm), upper middle arm circumference (centimeter, cm), and Body Mass Index (BMI) were performed and the Pediatric Functional Assessment of Anorexia/Cachexia Treatment (FAACT) scale was used.
Results: Of the patients, 52% were female, the mean age was 13.2 (years)±3.5 (months). The diagnosis of 32% of children was Acute Lymphoblastic Leukemia. The mean body weight was obtained as 47.80 kg in Z1, 46.46 kg in Z2, 46.21 kg in Z3, 44.92 kg in Z4 and 45.79 kg in Z5. There was a statistically significant difference between the means of body weight values over time (p<0.001). The mean BMI was 19.69 in Z1, 19.20 in Z2, 19.01 in Z3, 18.47 in Z4 and 18.82 in Z5. There was a statistically significant difference among the means of BMI values according to time (p<0.001). The mean upper arm circumference was obtained as 25.31 cm in Z1, 24.14 cm in Z2, 24.12 cm in Z3, 22.92 cm in Z4 and 22.94 cm in Z5. There was a statistically significant difference among the means of upper arm circumference values according to time (p<0.001). The mean FAACT value was 16.60±5.12 in Z1, 17.44±4.23 in Z2, 17.24±4.51 in Z3, 19.24±5.31 in Z4 and 18.04±3.23 in Z5. There was no statistically significant difference among the means of upper arm circumference values according to time (p=0.235). There was a statistically significant negative correlation between the upper arm circumference and the FAACT scale at the time of first hospitalization (r=-0.511, p=0.009). The increase in upper arm circum-ference provided a moderate decrease in FAACT score. There was a statistically significant difference between the distributions of change in food taste according to time (p<0.001). There was a statistically significant difference between the distributions of change in food odor according to time (p<0.001).
Conclusion: In our study, it was determined that the decrease in the mean body weight and upper arm circumference of children on the 14th day after stem cell transplantation was found to be statistically significant. Considering that the increased change in food taste and smell is also expressed by children at the end of the second week after transplantation, it is recommended that the nutrition team members closely follow the changes in the nutritional status of the child, especially on the 14th day after the transplantation, plan the appropriate nutritional treatment, perform nutritional care and evaluate anthropometric measurements.
Keywords: Child, stem cell transplantation, antropometric measurement, appetite, malnutrition
References
1. Mehta NM, Corkins MR, Lyman B, et al. Defining pediatric malnutrition: a paradigm shift toward etiology-related definitions. JPEN J Parenter Enteral Nutr 2013; 37: 460-81.
2. Ladas EJ, Sacks N, Meacham L, et al. A multidisciplinary review of nutrition considerations in the pediatric oncology population: a perspective from children’s oncology group. Nutrition in Clinical Prac. https://doi.org/10.1177/0115426505020004377
3. White M, Davies P, Murphy A. Validation of percent body fat indicators in pediatric oncology nutrition assessment. J Pediatr Hematol Oncol 2008; 30: 124-9.
4. Bauer J, Jurgens H, Fruhwald MC. Important Aspects of Nutrition in Children with Cancer American Society for Nutrition. Adv Nutr 2011; 2: 67-77.
5. Jeejeebhoy KN. Nutritional assessment. Nutrition 200; 16: 585-90.6. Mosby TT, Barr RD, Pencharz PB. Nutritional Assessment of Children with Cancer. J Pediatr Oncol Nurs 2009; 26: 186-97.7. Koç N, Gunduz M, Tavil B, et al. Beneficial Effect of the Nutritional Support in Children Who Underwent Hematopoietic Stem Cell Transplant.
Exp Clin Transplant 2017; 15: 4.
SS27
Evaluation of the Effect of Malnutrition on Chemotherapy Effectiveness and Safety and Survival in Metastatic Pancreas Cancer PatientsNail Paksoy1, Betül Keskin2, Ebru Meriç2, Sezai Vatansever1
1İstanbul University Oncology Institute, Medical Oncology, İstanbul, Turkey2İstanbul University Oncology Institute, Nutrition Unit, İstanbul, Turkey
12th KEPAN CONGRESS ABSTRACTS
S22

Objective: Pancreatic cancer is the fourth most common cause of cancer-related deaths in both sexes. Majority of patients experi-ence severe weight loss before diagnosis, and cachexia may develop over time. Therefore, early nutritional support is very important. The efficacy and tolerability of cytotoxic chemotherapy regimens in malnourished patients with metastatic pancreatic cancer (mPC) is unclear. The aim of this study is to investigate the effect of malnutrition on the efficacy, tolerability and overall survival of cytotoxic chemotherapy in newly diagnosed mPC patients.
Methods: In this study, 20 patients who were started chemotherapy due to mPK newly diagnosed between 05.01.2020 and 31.01.2021 in Istanbul University Oncology Institute were examined. The demographic, nutritional and oncological status of the patients were recorded. Patients were evaluated by the nutritional team before each chemotherapy visit (every 2 or 3 weeks). Body mass index (BMI): [Weight (kg)/body surface (m2)]: According to BMI measurement, those with 21 and above were considered to be without risk for malnutrition, those with 18-20 as mild malnutrition, and those below 17 as severe malnutrition. Weight Loss Rate: By questioning the amount of weight loss of the patients in the last 1, 3 and 6 months, their ratio to their usual weight was calculated. Those without a history of weight loss were evaluated as no malnutrition; those with weight loss of 5% in the last 1 month, 7.5% in 3 months, and 10% in 6 months were evaluated as mild malnutrition; those with weight loss of more than 5% in the last 1 month, more than 7.5% in 3 months, and more than 10% in 6 months were considered as severe malnutrition. Serum Albumin value: Those with an albumin level of 3.5g/dl were regarded as risk-free in terms of malnutrition, those with 2.6-3.4 g/dl as mild, and those with 2.5 g/dl as severe malnutrition. 4-Nutritional Risk Index (NRI): it was calculated by the formula of 1.519 x Albumin g/dl + 0.417 x (Measured weight/usual weight (kg) x 100 and those with NRI above 97.5 were evaluated as risk-free in terms of malnutrition, those between 83.5-97.5 as mild, those below 83.5 as severe malnutrition. Drug-related toxicities and treatment responses were evaluated with the National Cancer Institute CTCAE version 4.0 and RECIST 1.1 Criteria, respectively. SPSS version 21, Pearson chi-square, Fisher-exact and Kaplan-meier methods were used for statistical analysis.
Results: The study included 20 patients and 60% were male. The mean age was 62.8 (36-72) years. According to the NRI status at the time of diagnosis, 60% of the patients had malnutrition and 16% of them were severe. The mean serum albumin value was 37.2 g/dl (23-45). All patients received chemotherapy treatment with a diagnosis of mPC. The most commonly used CT regimen was FOL-FIRINOX (5-FU, irinotecan, oxaliplatin) (70%). The median follow-up period was 142 days (29-231). The most common side effects were fatigue 90%, loss of appetite 80% and nausea 60%. 18 patients received regular enteral nutritional support. Three patients developed severe malnutrition during follow-up. Moderate/severe malnutrition was not found to be associated with chemotherapy response (p: 0.65). Moderate/severe malnutrition was found to be associated with cytopenia due to chemotherapy and more severe side effects of nausea-vomiting (p: 0.03). When the groups with and without heavy malnutrition were compared, severe malnutrition was found to be associated with lower overall survival (5.3 months (95% CI, 3.4-7.4) vs 6.1 (95% CI 4.8-8.9)) (p: 0.008).
Conclusion: Moderate/severe malnutrition was not found to be associated with chemotherapy response in mPC patients, but treat-ment-related cytopenia was found to be associated with more severe nausea-vomiting side effects. Severe malnutrition was found to be associated with lower overall survival.
Keywords: Pancreas cancer, chemotherapy, malnutrition
References
1. Bauer J, Capra S, Battistutta D, et al. Compliance with nutrition prescription improves outcomes in patients with unresectable pancreatic cancer. Clin Nutr 2005; 24: 998-1004.
2. Bachmann J, Heiligensetzer M, Krakowski-Roosen H, et al. Cachexia worsens prognosis in patients with resectable pancreatic cancer. J Gastro-intest Surg 2008; 12: 1193.
3. Bye A, Jordhøy MS, Skjegstad G, et al. Symptoms in advanced pancreatic cancer are of importance for energy intake. Support Care Cancer 2013; 21: 219-27.
SS28
Evaluation of Nutrition Status of Patients Hospitalized in the Oncology Service by Two Different Malnutrition Screening MethodsDidem Güneş Kaya1, Özlem Yersal2, Fatma Kozak3
1İstanbul University-Cerrahpaşa, Cerrahpaşa Faculty of Medicine, Child Health and Diseases, İstanbul, Turkey2Aydın Adnan Menderes University, Faculty of Medicine, Internal Medicine Sciences, Department of Internal Diseases, Aydın, Turkey 3Aydın Adnan Menderes University, Faculty of Medicine, Nutrition and Diet Unit, Aydın, Turkey
Objective: Cancer patients are particularly at risk of malnutrition, as both the disease and its treatments threaten their nutritional status. Despite this, it is often ignored or treated inadequately by clinicians (1). Nutritional problems, malnutrition and cachexia are important problems that negatively affect cancer patients during the course of the disease, cause disruptions in treatment and wors-en the prognosis (2). Malnutrition or cachexia can be seen at the time of diagnosis or during the treatment, so the treatment should be monitored throughout the process (3). According to the results of many studies showing the negative effects of malnutrition on oncology patients, malnutrition reduces the effectiveness and tolerance of treatment, increases clinical and surgical complications,
12th KEPAN CONGRESS ABSTRACTS
S23

and increases hospital stay and health expenses (4, 5). Therefore, screening and evaluating the nutritional status of cancer patients is one of the most important tools in treatment and fight against cancer (6). This study was conducted with the aim of screening and evaluating the nutritional status of hospitalized cancer patients with different screening methods.
Methods: This cross-sectional, descriptive study was carried out to screen and evaluate the nutritional status of cancer patients hos-pitalized in Aydın Adnan Menderes University Faculty of Medicine Hospital Oncology Service between September 2020 and Decem-ber 2020. The data were collected by face to face interview technique using a questionnaire form and Patient Focused Subjective Global Assessment Scale (PGSGA) and Nutritional Risk Score (NRS2002). Biochemical parameters of the patients were recorded from the patient files. The anthropometric measurements of the patients were measured twice by the same person, and if the difference was greater, the third measurement was made and the average of the two closest measurements was taken. The data were analyzed in SPSS 21.0 statistical package program.
Results: Of the total 240 oncology patients, 69.2% (n: 166) were male, 30.81% (n: 74) were female and the mean age was 61.6±12.3 years. The most common cancers were lung (28.9%), colon (13.8%) and stomach (10.8%) cancers in men and ovarian (16.2%), breast (16.2%) and colon (14.8%) in women. Gastrointestinal system cancers were seen in 44.6% of the patients. Additional diseases other than cancer were mostly hypertension (18.8%) and diabetes (17.1%). In 12.8% of the patients, diabetes and hypertension are seen together. The patients receive chemotherapy (46.2%), chemo + surgical treatment (30%), chemo + radiotherapy (11.7%). The total PGSGA score and NRS2002 score of the patients were found to be 6.7±4.2 and 2.5±1.1, respectively. It has been determined that PGSGA mean scores and NRS2002 mean scores were different according to age groups (For individuals under 65 years of age: PGS-GA 6.52±4.1 and 7.5±4.4, p=0.049 NRS2002 2.2±1.0 and 2.9±1.0 p=0.039). According to the general PGSGA evaluation, 42.5% of the patients were well nourished, 32.1% had moderate or suspicious malnutrition and 25.4% had severe malnutrition. According to the general NRS2002 evaluation, 49.2% of the patients were under the nutritional risk and 50% should be screened weekly.
Conclusion: Malnutrition is one of the important problems in cancer treatment, it must be detected and treated as soon as possi-ble. For this purpose, patients should be screened at regular intervals with appropriate screening tests and nutritional interventions should be performed.
Keywords: PGSGA, malnutrition, cancer
References
1. Arends J, Baracos V, Bertz H, et al. ESPEN expert group recommendations for action against cancer-related malnutrition. Clin Nutr 2017; 36: 1187-96.
2. Arends J, Bachmann P, Baracos V, et al. ESPEN guidelines on nutrition in cancer patients. Clin Nutr 2017; 36: 11-48. 3. Mantzorou M, Koutelidakis A, Theocharis S, Giaginis C. Clinical Value of Nutritional Status in Cancer: What is its Impact and how it Affects Dis-
ease Progression and Prognosis? Nutr Cancer 2017; 69: 1151-76. 4. Barajas Galindo DE, Vidal-Casariego A, Calleja-Fernández A, et al. Appetite disorders in cancer patients: Impact on nutritional status and quality
of life. Appetite 2017; 114: 23-7.5. Jager-Wittenaar H, Ottery FD. Assessing nutritional status in cancer: Role of the Patient-Generated Subjective Global Assessment. Curr Opin
Clin Nutr Metab Care 2017; 20: 322-9.6. Karpuzoğlu D, Batar N. Onkolojide tercih edilen beslenme durumu tarama ve değerlendirme yöntemleri. Sağlık ve Yaşam Bilim Derg 2019; 1:
37-46.
SS29
Evaluation of Nutrition Therapy Complications in Adults According to Age GroupsSuna Bürkük1, Pelin Ünsal1, Yelda Uçar1, Ayşe Dikmeer1, Meltem Koca1, Kezban Akçay3, Nilgün Ölmez3, Fatma Tamer3, Şermin Ataç3, Arzu Topeli İskit2, Meltem Halil11Hacettepe University Faculty of Medicine, Department of Internal Medicine, Division of Geriatric, Ankara, Turkey2Hacettepe University Faculty of Medicine, Department of Internal Medicine, Division of Intensive Care, Ankara, Turkey3Hacettepe University Faculty of Medicine Adult Hospital, Clinical Nutrition Unit, Ankara, Turkey
Objective: Recognizing the complications of nutritional therapy in hospitalized patients, taking the required precautions to avoid these complications, and treating them appropriately are as critical as the timely initiation of nutritional therapy. Complications of nutritional therapy could be defined as four main groups as gastrointestinal complications, mechanical complications, metabolic complications, and infectious complications. Refeeding syndrome is a serious metabolic complication of nutritional therapy with high mortality.
Methods: The demographic and clinical characteristics and complications related to nutritional therapy of adult patients who were followed up by the Clinical Nutrition Unit of our hospital between January 2020 and December 2020 were retrospectively evaluated for three age groups: under 65, 65-79 years, and 80 years and over.
Results: A total of 437 patients of whom 256 were under 65 years, 119 were aged 65-79 years and 62 were 80 years and over were included in the study. The mean body mass index (BMI) of the patients was 24.5±4.7 in the group under 65 years of age, 24.6±4.4 in the group aged 65-79, and 24.5±4.7 in the group aged 80 years and over (p=0.002). Other demographic and clinical charac-
12th KEPAN CONGRESS ABSTRACTS
S24

teristics of the patients are given in Table 1. Gastrointestinal complications (nausea, vomiting, diarrhea, and distension) were seen in 6 patients (11.3%) in<65 age group, 2 patients (6.1%) in the 65-79 age group, and 9 patients (24.3%) in the group ≥80 years (p=0.095). Mechanical complications were seen in 9 patients (3.5%) in the<65 age group, 3 patients (2.5%) in the 65-79 age group, and 1 patient (1.6%) in the 80 years and older group (p=0.785). Infectious complications were seen in 14 (5.5%), 1 (0.8%), and 7 (11.3%) patients in the groups under 65 years of age, 65-79 years and over 80 years of age, respectively (p=0.007). In logistic re-gression analysis, age (OR=4 95% CI=1.24-12.9 p=0.02), follow-up time (OR=1.017 95% CI=1.005-1.029 p=0.005), calories per kg (OR=1.127 95% CI=1.061-1.197 p<0.001) and hypertension (OR=0.147 95% CI=0.024-0.005 p=0.039) were found to be associated with infectious complications independent from all other parameters. For the patients who had received parenteral nutrition ther-apy, there was no difference between the groups in terms of hypophosphatemia, which is an indicator of refeeding syndrome. In patients who received enteral nutrition therapy, hypophosphatemia was observed in 3 patients (5.7%) in the group under 65 years of age, in 2 patients (6.1%) in the 65-79 age group, and in 9 patients (24.3%) in the group 80 years and over for which its frequency was the highest (p=0.022). According to the logistic regression analysis, for the patient group who received enteral nutrition therapy hypophosphatemia was found to be independently associated with age (OR=7.44 95% CI=1.68- 32.9 p=0.008) and calories per kg (OR=1.079, 95% CI=1.001-1163 p=0.046).
Conclusion: In our study, we found that among the patients who received nutritional therapy infectious complications were more frequent in patients aged 80 years and over. Hypophosphatemia was observed to be more common in patients over 80 years of age who received enteral nutrition therapy. Frequencies of gastrointestinal and mechanical complications did not differ between age groups. Patients who aged 80 years and above should be monitored more carefully and closely for infectious complications and refeeding syndrome when nutritional therapy is initiated.
≥80 years (n=62) 65-79 years (n=119) <65 years (n=256) p
Sex (female) 37 (59.7%) 45 (37.8%) 122 (47.7%) 0.018
Height 1.61±0.09 1.65±0,08 1.66±0.09 <0.001
Weight 64±13.9 67.2±12.5 63.7±15 0.075
BMI 24.5±4.7 24.6±4.4 22.9±5.2 0.002
NRS 2002 5.2±1 4.7±0.97 4.3±0.7 <0.001
Follow-up duration (days) 10.5 (7-28.7) 12 (7-19) 11 (6-18) 0.863
Calories per kg 15.7 (11.9-21.4) 15 (12.5-19.1) 16.1 (13-20.3) 0.239
Protein per kg 0.76 (0.25-1.05) 0.66 (0.50-0.94) 0.73 (0.53-1) 0.314
DM 13 (21%) 29 (24.4%) 32 (12.5%) 0.011
COPD 9 (14.5%) 6 (5%) 3 (1.2%) <0.001
CKD 5 (8.1%) 4 (3.4%) 9 (3.5%) 0.277
CAD 17 (27.4%) 20 (16.8%) 12 (4.7%) <0.001
CHF 10 (16.1%) 5 (4.2%) 5 (2%) <0.001
HT 35 (56.5%) 44 (37%) 27 (10.5%) <0.001
Cancer 5 (8.1%) 14 (11.8%) 32 (12.5%) 0.820
GI complications 9 (24.3%) 2 (6.1%) 6 (11.3%) 0.095
Mechanical complications 1 (1.6%) 3 (2.5%) 9 (3.5%) 0.785
Infectious complications 7 (11.3%) 1 (0.8%) 14 (5.5%) 0.007
Hypophosphatemia (enteral) 9 (24.3%) 2 (6.1%) 3 (5.7%) 0.022
Hypophosphatemia (parenteral) 2 (6.1%) 7 (7.4%) 22 (10.4%) 0.679
SS30
The Relationship of Anti-Cholinergic Burden with Nutritional StateNeziha Erken1, Besra Hazal Yeşil2, Kübra Seydi Altunkalem1, Fatma Sena Dost1, Ahmet Turan Işık1
1Department of Geriatric Medicine, Faculty of Medicine, Dokuz Eylül University, İzmir, Turkey2Deparment of Internal Medicine, Faculty of Medicine, Dokuz Eylül University, İzmir, Turkey
Objective: The use of drugs may be an important etiology for malnutrition which is a geriatric syndrome. The number of drugs used (polypharmacy) and the interaction of drugs may negatively affect the nutritional status of geriatric patients. Another important issue
12th KEPAN CONGRESS ABSTRACTS
S25

about drugs is their anticholinergic effects. Drugs may lead to anticholinergic effects like decrease in gastrointestinal secretion and motility, visual disturbances tachycardia, heat intolerance, sedation and mental alteration. Dry mouth, which is a common anticho-linergic effect, causes difficulties in speaking and eating, mucosal injury, dental prothesis discomfort and tooth decays. As for that in this study, we aimed to investigate the relation between nutritional status and anticholinergic drug burden in older people.
Methods: Patients over 65 years of age who were followed up between January 2020 and January 2021 in Dokuz Eylul University Geriatric Department were included in the study, which was designed as a prospective - cross-sectional study. Neuromuscular and skeletal system diseases that may affect activities of daily living; acute cerebrovascular disorders, gastrointestinal bleeding, sepsis, acute coronary syndrome, acute respiratory diseases that may affect general health; also patients with alcohol and drug abuse were ex-cluded. After the exclusion criteria, a total of 250 patients were included in the study. Demographic characteristics of the patients were recorded. Comorbid diseases were detected by the International Statistical Classification of Diseases (ICD) and scored by Charlson Comorbidity Index (CCI). Nutritional status was evaluated using the Mini Nutrition Assessment Test - Short Form (MNA - SF). As a result of the evaluation of the test, which was evaluated over a total of 14 points, the patients were diagnosed as malnutrition (0 - 7 points), malnutrition risk (8 - 11 points) and normal (12 - 14 points). The groups were examined in two groups as normal nutrition and insufficient nutrition (malnutrition and malnutrition risk). The clinical characteristics and laboratory data of the patients were obtained from their files and recorded. The diagnosis of polypharmacy was accepted as using five or more drugs. Drug Burden Index (DBI) was used for anticholinergic load calculation. The patients were classified according to the DBI scoring as risk (risk 0.5 points) and no risk (0 points).
Results: A total of 250 cases were included in the study. 63.6% of the patients were women. The mean age of the sample was 82.37±7.26 year; the number of drugs were 7.82±2.79; The DBI score was 0.49±0.49. In addition, 41.6% of the patients were eval-uated as robust. Robust and group of malnutrition risk and malnutrition were compared. Demographic data and laboratory results are shown in Table 1. In cases with malnutrition risk and malnutrition, DBI score and risk were higher and hemoglobin, albumin and vitamin D levels were lower (p<0.01). When the confounding effects of age, body mass index, education year, CCI, vitamin D, hemo-globin and albumin levels were eliminated, it was determined that the negative effect of DBI on nutrition increased up to three-fold (%95 CI; 3.03 (1.060 – 8.678) p<0,03).
Conclusion: In this cross-sectional study we showed that anticholinergic drug burden is associated with malnutrition and malnutrition risk. Therefore, it is important to evaluate the anticholinergic drug burden along with polypharmacy while assessing the nutritional status.
Table 1. Demographic data of all patients
Malnutrition and Risk of Malnutrition n=146 Robust n=104 p
Demographics
Age (years) 84.27±7.19 79.71±6.51 <0.01
Sex (Female; %) 67.8 57.7 0.10
Education Time (years) 5.49±4.44 8.35±4.17 <0.01
BMI 27.87±6.35 30.11±4.43 <0.01
CCI (median) 3 (2 – 6) 4 (2 – 6) <0.01
Number of Drugs 8.02±3 7.55±2.44 0.17
DBI risk (%) 65.1 47.1 <0.01
DBI score 0.59±0.52 0.36±0.42 <0.01
Laboratory Data
Hemoglobin (g/dL) 12.23±1.48 12.88±1.62 <0.01
Glucose (mg/dL) 113.17±38.76 114.40±43.73 0.82
LDL (mg/dL) 116.90±39.55 125.41±39.21 0.12
Albumin (g/dL) 3.93±0.39 4.11±0.36 <0.01
D Vitamin (ng/mL) 17.24±12.02 22.92±17.44 <0.01
TSH (mIU/L) 1.58±1.27 1.78±2.30 0.45
Vitamin B12 (pg/mL) 557.64±415.51 486.09±351.98 0.16
Folic asit (ng/mL) 8.28±5.37 9.29±5.42 0.16
e-GFH (ml/dk) 77.47±16.53 74.48±17.01 0.18CKI: Charlson Comorbidities Index; eGFR: estimated Glomerular Filtration Rate; DBI: Drug Burden Index; BMI: Body Mass Index. Minimum and maximum values are shown in brackets.
12th KEPAN CONGRESS ABSTRACTS
S26

SS31
The Relationship Between Sarcopenic Obesity Determined by Different Methods and Nutritional StatusZeynep Kahyaoğlu, Burcu Balam Doğu, Mustafa Cankurtaran, Meltem Gülhan HalilHacettepe University, Faculty of Medicine, Department of Internal Medicine, Division of Geriatrics, Ankara, Turkey
Objective: Mini nutritional assessment short-form (MNA-SF) is a commonly used tool to assess older patients’ nutritional status. Sar-copenia and obesity are directly related to the nutritional status of the patients. In this study, we aimed to evaluate the relationship between the nutritional status of obese patients those sarcopenia status was evaluated via bioelectrical impedance analysis (BIA), handgrip strength, and ultrasonography (USG).
Methods: One-hundred and thirty-five geriatric patients were enrolled (25 males and 110 females) in the study. The median age was 72 (IQR: 9). The sarcopenia status of patients with a body mass index (BMI) ≥30 was evaluated via BIA, USG, and handgrip strength. Patients divided into 3 nutritional status groups via MNA-SF and compared in terms of sarcopenic obesity and non-sarcopenic obesity.
Results: No significant difference was observed between probable sarcopenic obese patients and obese patients with normal muscle strength in terms of the risk of malnutrition or malnutrition defined by MNA-SF. Similarly, there was no significant difference between sarcopenic obese patients identified via BIA and non-sarcopenic obese patients regarding malnutrition or malnutrition risk. In patients defined as sarcopenic obese and severe sarcopenic obese according to the Rectus Femoris muscle cross-sectional area measured by USG, the risk of malnutrition and malnutrition was significantly higher than the non-sarcopenic obese patients.
Discussion: Malnutrition is an important factor in the development of sarcopenia. In previous studies in which sarcopenia was deter-mined by BIA and handgrip strength, it was observed that sarcopenia decreased as the MNA-SF score increased. The MNA-SF score was found to be linearly related to both muscle mass and muscle strength (1). In another study, handgrip strength, walking speed, and calf circumference were measured, but no significant relationship was found between sarcopenia and MNA-SF, and the use of MNA-SF for the evaluation of sarcopenia was not recommended (2). The gold standard method in the evaluation of sarcopenia is computed tomography (CT) (3). Sarcopenia is also an important clinical problem for cancer patients (4). Gastrektomi uygulanan non-metastatik mide kanserli hastalarda yapılan bir çalışmada sarkopeni değerlendirilmesi bilgisayarlı tomografi (BT) ile yapılmış. In this group of patients, CT was performed for staging and sarcopenia was also examined in the same session without additional dose of radiation. Post-operative complications, hospital stay and mortality were higher in patients with preoperative sarcopenia and sarcopenic obesity. The importance of sarcopenia and sarcopenic obesity in preoperative modifiable risk assessment is emphasized. (5) In our study, a significant relationship was observed in patients diagnosed as sarcopenic obesity via USG,in terms of malnutrition and malnutrition risk detected by MNA-SF. Based on this, studies can be conducted on the evaluation of sarcopenia and therefore, the preoperative risk with the MNA-SF test in preoperative geriatric patients. Studies on the relationship between sarcopenic obesity and MNA-SF are insufficient in the literature, and more studies are needed in this area.
Conclusion: In determining sarcopenic obesity, compared to BIA, USG is more consistent with the risk of malnutrition and malnutri-tion determined by MNA-SF. Performing USG instead of BIA to evaluate sarcopenia may be more useful in predicting the malnutri-tion and malnutrition risk in geriatric patients.
References
1. Liguori I, Curcio F, Russo G, et al. Risk of Malnutrition Evaluated by Mini Nutritional Assessment and Sarcopenia in Noninstitutionalized Elderly People. Nutr Clin Pract 2018; 33: 879-86.
2. Díaz Muñoz GA, Cárdenas Zuluaga DM, Mesa Jimenez A. Consistency of Mini Nutritional Assessment to Identify Sarcopenia in Older Adults in Nursing Homes in Bogota, Colombia. Nutr Hosp 2015; 32: 270-4.
3. Cruz-Jentoft AJ, Bahat G, Bauer J, et al. Sarcopenia: revised European consensus on definition and diagnosis. Age Ageing 2019; 48: 16-31.4. Martin L, Birdsell L, Macdonald N, et al. Cancer cachexia in the age of obesity: skeletal muscle depletion is a powerful prognostic factor, inde-
pendent of body mass index. J Clin Oncol 2013; 31: 1539-47.5. Nishigori T, Obama K, Sakai Y. Assessment of body composition and impact of sarcopenia and sarcopenic obesity in patients with gastric cancer.
Transl Gastroenterol Hepatol 2020; 5: 22.
Malnutrition+malnutrition risk group (n=32) (23.7%)
Normal nutritional group (n=103) (76.3%) P value
Age, median (IQR) 76 (9.5) 72 (8) 0.159
Sex Female n (%) 26 (23.6%) 84 (76.4%) 0.969
Male n (%) 6 (24%) 19 (76%)
ADL, median (IQR) 5 (1) 6 (1) <0.0001
IADL, median (IQR) 7 (5) 8 (1) <0.0001
MMSE, median (IQR) 24 (7) 28 (4.5) <0.0001
Yesavage Depression scale score, median (IQR) 6 (10) 2 (4) <0.0001
12th KEPAN CONGRESS ABSTRACTS
S27

Malnutrition+malnutrition risk group (n=32) (23.7%)
Normal nutritional group (n=103) (76.3%) P value
Age, median (IQR) 76 (9.5) 72 (8) 0.159
Probable sarcopenia n (%) 14 (43.8%) 32 (31.3%) 0.186
Sarcopenia via BIA, n (%) 1 (3.4%) 3 (3.1%) 0.931
Severe Sarcopenia via BIA, n (%) 0 (0.0%) 3 (3.1%) 0.335
Sarcopenia via USG measurement of RFCSA, n (%) 8 (29.6%) 9 (10.3%) 0.026
Severe Sarcopenia via USG measurement of RFCSA, n (%) 12 (41.4%) 19 (21.6%) 0.036
Dementia, n (%) 11 (34.4%) 11 (10.7%) 0.002
Depression, n (%) 3 (13%) 12 (15%) 0.005 ADL: Activities of daily living, IADL: Instrumental activities of daily living, MMSE: Mini-mental state examination, BIA: bioelectrical impedance analysis RFCSA: rectus femoris cross-sectional area
SS32
Analysis of the Orthorectic Behavior of Students in the Faculty of Health SciencesEdanur Balalan1, Edibe Pirinçci21Elazığ Fethi Sekin State Hospital, Elazığ, Turkey2Fırat University Faculty of Medicine, Department of Public Health, Elazığ, Turkey
Objective: This research was carried out to determine the frequency of healthy eating obsessions of students studying in health-re-lated departments and the factors affecting them.
Methods: The universe of this cross-sectional study consists of all (n=640) first and third year students of Fırat University Faculty of Health Sciences (response rate 86.8%). SPSS 23 was used to analyze the data. The data were obtained by survey method. Personal information form and ORTO-15 scale were used as data collection tools. In statistical evaluations, whether the normality of the dis-tribution of variables provided the assumption of homogeneity of variances with the Kolmogorov-Smirnov test was examined by the Levene test. As a result of the tests, parametric test statistics did not provide assumptions, so nonparametric test statistics were used. Data were evaluated by median, 25 percent and 75 percent quartiles, Mann-Whitney U and Kruskal-Wallis tests.
Results: The average age of the students included in the study was 20.73±2.14 years (min: 17 max: 41) and it was determined that 15.8% of them were male. While 49.8% of the students evaluated in the research group are first year students, 50.2% are third year students. The average height of those included in the study was 165.85±0.07 (min: 148, max: 192) cm, and their body weight averag-es 60.08±10.88 (min: 37.0, max: 150.0) kg. The average BMI of female students was 21.70±3.29 kg/m², and the average BMI of male students was 22.24±2.78 kg/m². Orthorexia tendency was detected in 11.3% of the students. The ORTO-15 scale scores are lower and show more orthorectic tendency in men, who stated that there were obese individuals in their close vicinity, those who attempt-ed to lose weight in the last year, who stated that they had a chronic disease, and those who stated that they used regular medication (p<0.05). ORTO-15 scores; It does not change according to class level, age group and being an obese person in the family (p>0.05).
Conclusion: Orthorexia tendency was found to be high. Men show more orthorexic tendency than women. Multidisciplinary studies should be carried out to increase the level of awareness and consciousness towards reducing orthorexic attitudes in students who are future healthcare professionals.
Keywords: Orthorectic Behaviors, university students, eating disorder
SS33
Analysis of the Prejudices of Students at the Faculty of Health Sciences Against Obese IndividualsEdanur Balalan1, Edibe Pirinçci21Elazığ Fethi Sekin State Hospital, Elazığ, Turkey2Fırat University Faculty of Medicine, Department of Public Health, Elazığ, Turkey
Objective: This study was conducted to determine the frequency of prejudices of students studying in health-related departments against obese individuals and the factors affecting them.
12th KEPAN CONGRESS ABSTRACTS
S28

Methods: The universe of this cross-sectional study consists of all first and third year students (n=640) studying at Fırat University Faculty of Health Sciences (availability rate 86.8%). SPSS 23 package program was used in the analysis of the data. Personal infor-mation form and GAMS-27 obesity bias scale were used as data collection tools. The normality of the distribution of variables in statistical evaluations was evaluated by the Levene test whether it provided the assumption of homogeneity of variances with the Kolmogorov-Smirnov test. As a result of the tests, parametric test statistics did not provide assumptions, so nonparametric test sta-tistics were used. Data were evaluated by median, 25 percent and 75 percent quartiles, Mann-Whitney U and Kruskal-Wallis tests.
Results: It is seen that 84.2% of the students included in the study are women. 52.3% of the students are enrolled in the nursing program, 24.6% in nutrition and dietetics, and 23.1% in the midwifery program. The average BMI of the students was determined as 21.78±3.23 kg/m². 16.7% of the students in the study group were found to be unbiased, 61.0% prone to prejudice and 22.3% prejudiced against obese individuals. Total scores of GAMS-27 obesity bias scale; It was determined that the students of the nursing department, those who do not have an overweight person in their immediate vicinity, those who regularly exercise, and the groups who stated that they were not prejudiced had higher scores than the other groups and their prejudices increased (p<0.05). The total scores of the GAMS-27 obesity bias scale of the students evaluated in the study group do not change according to gender, age group, grade level (p>0.05).
Conclusion: There is a high rate of prejudice and prejudice against obesity among students. Multidisciplinary studies should be carried out to increase the awareness and consciousness of students, who are future healthcare professionals, to reduce obesity bias.
Keywords: Obesity, prejudice, university students
SS34
Awareness Levels of Employees Constantly Working in Intensive Care Units about Clinical Nutrition and Nutrition GuidelinesGülsüm Meryem Güngör1, Fatma Çelik2, Meltem Soylu2
1Biruni University, Graduate Education Institute, İstanbul, Turkey2Biruni University, Faculty of Health Sciences, Department of Nutrition and Dietetics, İstanbul, Turkey
Objective: This study was planned to reveal the awareness of healthcare professionals working in intensive care units about product selection and clinical nutrition, with national and international nutritional guidelines containing standard protocols for enteral-par-enteral nutrition practices.
Methods: This descriptive, cross-sectional study was conducted on 100 healthcare professionals consisting of physicians, dieticians and nurses working in internal, surgical and coronary intensive care units of three different university hospitals. The data were ob-tained by applying the questionnaire form prepared with the support of the literature to the participants with one-to-one interview method.
Results: Only 67% of the healthcare personnel participating in this study had education at the undergraduate level (female 47%, male 20%) (p<0.05). The participants had low levels of hearing and knowing about the national and international guidelines on clinical nutrition (ESPEN 6%, KEPAN 7%, ASPEN 7%). 52% of the participants stated that they did not take any courses on clinical nutrition during their undergraduate education. The participation rate of the intensive care unit personnel to the trainings related to clinical nutrition in the institution was only 53%, and the participation rate to scientific congresses was 25%. 70% of the selection of enteral products was done by physician, 19% by nutritional team; and 90% of parenteral products were selected by physicians and 6% by the nutrition team. It was determined that 81% of the selection of these nutritional products was done with the help of national and international guidelines, and 18% depended on individual choices.
Conclusion: The awareness of health professionals working in intensive care units about clinical nutrition guidelines and their appli-cation levels are low, and it is recommended to include these issues more in undergraduate and in-service trainings. The choice of nutritional products should be evaluated together with the nutrition team, with current guidelines, regardless of individual decisions.
Keywords: Enteral nutrition, clinical nutrition guidelines, nutrition team, parenteral nutrition
References
1. Akıncı SB. Enteral Nutrisyon Uygulama Yöntemleri. Klinik Gelişim 2011; 20-24.2. Anne-Françoise Rousseau MRL. ESPEN endorsed recommendations: Nutritional therapy in major. Clin Nutr 2013; 497-503.3. Awad S, Herrod PJJ, Forbes E, Lobo DN. Knowledge and attitudes of surgical trainees towards nutritional support: food for thought. Clin Nutr
2010; 29: 243-8.4. Enteral Beslenme: Bakımda Guncel Yaklaşımlar. (2013). Anadolu Hemşirelik ve Sağlık Bilimleri Dergisi, 116.5. Kondrup J, Johansen N, Plum LM, et al. Incidence of nutritional risk and causes of inadequate nutritional care in hospitals. Clin Nutr 2002; 21:
461-8.6. Mowe M, Bosaeus I, Rasmussen HH, Kondrup J, Unosson M, Irtun Ø. Nutritional routines and attitudes among doctors and nurses in Scandina-
via: a questionnaire based survey. Clin Nutr 2006; 25: 524-32.
12th KEPAN CONGRESS ABSTRACTS
S29
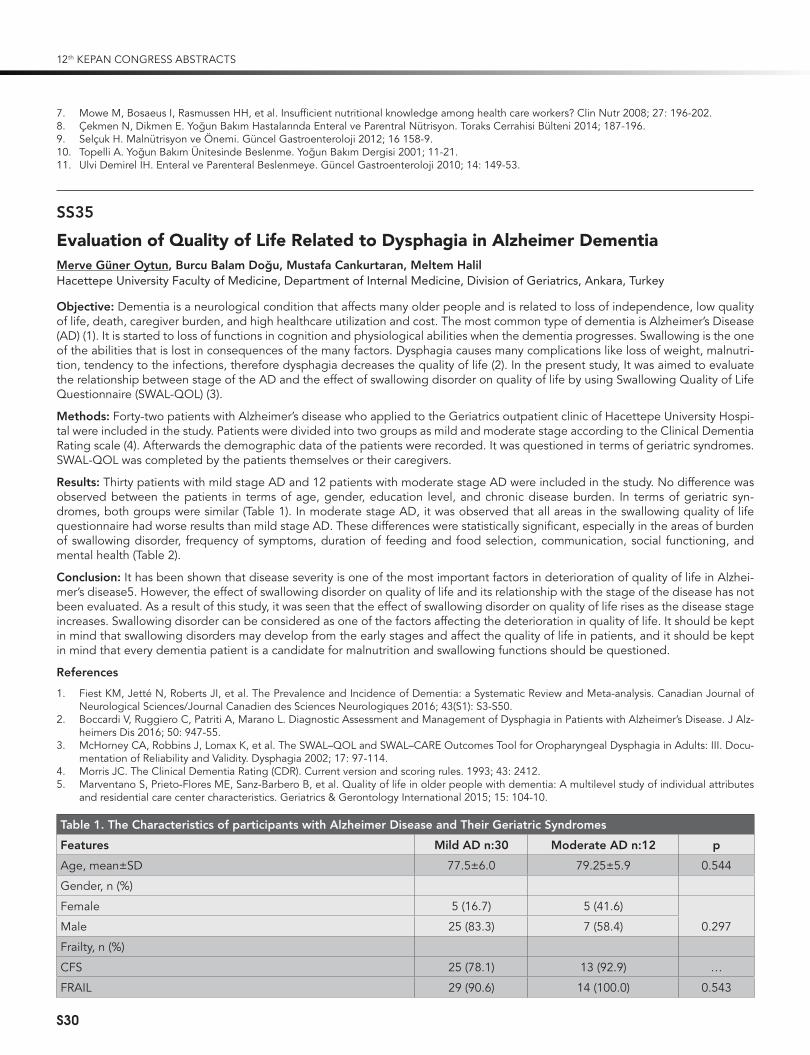
7. Mowe M, Bosaeus I, Rasmussen HH, et al. Insufficient nutritional knowledge among health care workers? Clin Nutr 2008; 27: 196-202.8. Çekmen N, Dikmen E. Yoğun Bakım Hastalarında Enteral ve Parentral Nutrisyon. Toraks Cerrahisi Bulteni 2014; 187-196.9. Selçuk H. Malnutrisyon ve Önemi. Guncel Gastroenteroloji 2012; 16 158-9.10. Topelli A. Yoğun Bakım Ünitesinde Beslenme. Yoğun Bakım Dergisi 2001; 11-21.11. Ulvi Demirel İH. Enteral ve Parenteral Beslenmeye. Guncel Gastroenteroloji 2010; 14: 149-53.
SS35
Evaluation of Quality of Life Related to Dysphagia in Alzheimer DementiaMerve Güner Oytun, Burcu Balam Doğu, Mustafa Cankurtaran, Meltem HalilHacettepe University Faculty of Medicine, Department of Internal Medicine, Division of Geriatrics, Ankara, Turkey
Objective: Dementia is a neurological condition that affects many older people and is related to loss of independence, low quality of life, death, caregiver burden, and high healthcare utilization and cost. The most common type of dementia is Alzheimer’s Disease (AD) (1). It is started to loss of functions in cognition and physiological abilities when the dementia progresses. Swallowing is the one of the abilities that is lost in consequences of the many factors. Dysphagia causes many complications like loss of weight, malnutri-tion, tendency to the infections, therefore dysphagia decreases the quality of life (2). In the present study, It was aimed to evaluate the relationship between stage of the AD and the effect of swallowing disorder on quality of life by using Swallowing Quality of Life Questionnaire (SWAL-QOL) (3).
Methods: Forty-two patients with Alzheimer’s disease who applied to the Geriatrics outpatient clinic of Hacettepe University Hospi-tal were included in the study. Patients were divided into two groups as mild and moderate stage according to the Clinical Dementia Rating scale (4). Afterwards the demographic data of the patients were recorded. It was questioned in terms of geriatric syndromes. SWAL-QOL was completed by the patients themselves or their caregivers.
Results: Thirty patients with mild stage AD and 12 patients with moderate stage AD were included in the study. No difference was observed between the patients in terms of age, gender, education level, and chronic disease burden. In terms of geriatric syn-dromes, both groups were similar (Table 1). In moderate stage AD, it was observed that all areas in the swallowing quality of life questionnaire had worse results than mild stage AD. These differences were statistically significant, especially in the areas of burden of swallowing disorder, frequency of symptoms, duration of feeding and food selection, communication, social functioning, and mental health (Table 2).
Conclusion: It has been shown that disease severity is one of the most important factors in deterioration of quality of life in Alzhei-mer’s disease5. However, the effect of swallowing disorder on quality of life and its relationship with the stage of the disease has not been evaluated. As a result of this study, it was seen that the effect of swallowing disorder on quality of life rises as the disease stage increases. Swallowing disorder can be considered as one of the factors affecting the deterioration in quality of life. It should be kept in mind that swallowing disorders may develop from the early stages and affect the quality of life in patients, and it should be kept in mind that every dementia patient is a candidate for malnutrition and swallowing functions should be questioned.
References
1. Fiest KM, Jetté N, Roberts JI, et al. The Prevalence and Incidence of Dementia: a Systematic Review and Meta-analysis. Canadian Journal of Neurological Sciences/Journal Canadien des Sciences Neurologiques 2016; 43(S1): S3-S50.
2. Boccardi V, Ruggiero C, Patriti A, Marano L. Diagnostic Assessment and Management of Dysphagia in Patients with Alzheimer’s Disease. J Alz-heimers Dis 2016; 50: 947-55.
3. McHorney CA, Robbins J, Lomax K, et al. The SWAL–QOL and SWAL–CARE Outcomes Tool for Oropharyngeal Dysphagia in Adults: III. Docu-mentation of Reliability and Validity. Dysphagia 2002; 17: 97-114.
4. Morris JC. The Clinical Dementia Rating (CDR). Current version and scoring rules. 1993; 43: 2412.5. Marventano S, Prieto-Flores ME, Sanz-Barbero B, et al. Quality of life in older people with dementia: A multilevel study of individual attributes
and residential care center characteristics. Geriatrics & Gerontology International 2015; 15: 104-10.
Table 1. The Characteristics of participants with Alzheimer Disease and Their Geriatric Syndromes
Features Mild AD n:30 Moderate AD n:12 p
Age, mean±SD 77.5±6.0 79.25±5.9 0.544
Gender, n (%)
Female 5 (16.7) 5 (41.6)
0.297Male 25 (83.3) 7 (58.4)
Frailty, n (%)
CFS 25 (78.1) 13 (92.9) …
FRAIL 29 (90.6) 14 (100.0) 0.543
12th KEPAN CONGRESS ABSTRACTS
S30

Table 1. The Characteristics of participants with Alzheimer Disease and Their Geriatric Syndromes (Continued)
Features Mild AD n:30 Moderate AD n:12 p
Fried 23 (71.9) 13 (92.9) 0.143
Malnutrition, n (%) 24 (72.7) 10 (71.4) 0.928
Weight loss, n (%) 15 (45.5) 6 (42.9) 0.870
Probable Sarcopenia, n (%) 24 (75.0) 9 (69.2) 0.721
Falls, n (%) 17 (53.1) 5 (38.5) 0.372
Incontinence, n (%) 19 (57.6) 8 (61.5) 0.806
Polypharmacy, n (%) 25 (75.8) 11 (78.6) 0.845
Charlson Comorbidity Index, median (IQR) 2.0 (1.5) 2.0 (1.0) 0.506
Table 2. Quality of Life Changes According to Stages of Alzheimer Disease
SWAL-QOL Mild AD N:30 Moderate AD N:12 p
Burden, mean±SD 94.58±10.72 76.04±18.81 0.001
Eating Duration, mean±SD 77.72±24.03 58.33±32.12 0.047
Eating Desire, mean±SD 86.11±16.85 68.04±34.59 0.110
Symptom Frequency, mean±SD 90.36±10.06 80.17±17.58 0.044
Food Selection, mean±SD 80.83±26.00 53.12±31.58 0.009
Communication, mean±SD 91.25±15.09 72.91±24.32 0.007
Fear, mean±SD 93.12±18.00 78.64±31.24 0.122
Mental Health, mean±SD 91.33±19.78 77.08±211.73 0.041
Social Funcitoning, mean±SD 89.66±18.00 72.08±27.00 0.023
Fatigue, mean±SD 54.02±29.85 43.73±18.15 0.419
Sleep, mean±SD 61.25±27.72 48.95±33.90 0.197
SS36
Evaluation of the Attitudes and Knowledge of Nurses Working in Education and Research Hospital About Nutritional CareKamil Gönderen, Elif Öztoprak Kol, Hilal Er DöngelKütahya University of Health Sciences, Evliya Çelebi Training and Research Hospital, Kütahya, Turkey
Objective: Nurses take an active role in determining the nutritional status of the patient, detecting dietary changes and informing the nutrition support team. This research was conducted to evaluate nurses attitudes towards nutritional care, to measure their level of knowledge and to determine their views.
Method: 118 nurses working at Kutahya Health Sciences University (KSBU) Evliya Celebi Training and Research Hospital agreed to participate in the study. Nurses working in units other than nurses who treat patients in the service and intensive care units were not included in the study. The participant information form, the importance of nutritional assessment in nurses, the level of knowledge about nutritional care and the perceived quality of nutritional care assessment scale were completed and the data were analyzed using the SPSS(Statistical Program for Social Sciences) package program. Descriptive statistics are given as number, percentage and average. In addition, t test and one-way ANOVA test were used to evaluate the independent sample. If the “p” value is<0.05, it was considered statistically significant.
Results: Of the nurses participating in the study, 60.2% (n=71) were female, 45.8% (n=54) had 6-10 years of professional experience and 85.6% (n=101) had received nutrition support training reported. The nurses received 21.36±4.09 points from the “importance of nutritional assessment” section, 25.33±4.46 from the “level of knowledge about nutritional care” and 33.25±6.33 from the “perceived quality of care regarding nutritional care” section. It has been found that there is a significant relationship between the
12th KEPAN CONGRESS ABSTRACTS
S31

importance of nutritional assessment and gender, getting training about nutritional support, and effectively filling the Nutritional Risk Scoring Form-2002 (NRS-2002). It was found that there was a significant correlation between the score of the level of knowledge about nutritional care and satisfaction with the unit he/she worked in, and filling the NRS-2002 form effectively (p<0.05). It was found that there was a significant relationship between perceived quality of care score regarding nutritional care and gender, effectively completing the NRS-2002 form (p<0.05).
Conclusion: Evaluation and monitoring of the patient’s nutritional status is part of nursing care. Although most of the nurses are aware of the importance of nutritional assessment, their knowledge of nutritional care and perceived quality of care has been found to be low.
Keywords: Nutrition, nursing care, NRS-2002
SS37
The Prevalence of Refeeding Hypophoshatemia in Patients with Liver CirrhosisGülten Can Sezgin1, Nurhayat Tuğra Özer2, Gülşah Güneş Şahin2, Serap Şahin2, Mustafa Alper Yurci1, Kadri Güven1, Kürşat Gündoğan2,3
1Department of Gastroenterology, Erciyes University, Faculty of Medicine, Kayseri, Turkey 2Department of Clinical Nutrition, Erciyes University, Health Sciences Institute, Kayseri, Turkey 3Department of Medical Intensive Care Unit, Erciyes University, Faculty of Medicine, Kayseri, Turkey
Objective: Refeeding hypophosphatemia (RH) is a clinical condition that occurs when patients with malnutrition or long-term starva-tion begin to re-feed. And, it is related to poor clinical outcomes. Patients with liver cirrhosis who has high risk malnutrition may be at risk of RH. We aimed to determine of prevalence of RH and relationship between clinical characteristics and RH in liver cirrhosis.
Methods: This study prospectively conducted in gastroenterology clinics and included patients who aged ≥ 18 aged, with liver cirrhosis and expected to hospital stay>48 hours. Severity of disease was defined by Child-Pugh and Model for End-Stage Liver Disease (MELD) score. Malnutrition described by Subjective Global Assessment (SGA). Serum phosphate levels was followed-up for 14 days. Serum phosphate levels <2.0 mg/dl (0.65 mmol/L) defined as hypophosphatemia.
Results: Our study included 50 patients. The mean age was 62.6±11.2 years. Of patients, the mean Child-Pugh score was 6.2±2.31 and the median MELD score was 10.5 (7.0-18.0). The most common RH was determined in 4 patients (8%) in Day 4. In RH group, the sharpest decline of serum phosphate levels in Day 4 (2.3±0.59 mg/dL). The CHILD and MELD score was no different in RH group compared to No RH group (p>0.05). Forty - two percentage of patients in RH group received PN. And these patients had higher RH risk than other groups (p<0.001).
Conclusion: It was found that the risk of RH is not very high in patients with liver cirrhosis. We think that studies with larger sample are need for trustable and exact recommendations. In this period, each patient with liver cirrhosis, regardless of the severity of the disease, was assessed and monitored in term of RH risk.
SS38
The Incidence of Refeeding Hypophosphatemia during Stem Cell TransplantationSerap Şahin1, Gülşah Güneş Şahin1, Nurhayat Tuğra Özer1, Leyla Gül Kaynar2, Serhat Çelik2, Kürşat Gündoğan3
1Department of Clinical Nutrition, Institute of Health Sciences, Erciyes University, Kayseri, Turkey2Department of Hematology, Erciyes University School of Medicine, Kayseri, Turkey3Division of Medical Intensive Care, Department of Medicine, Erciyes University School of Medicine, Kayseri, Turkey
Objective: As a treatment for hematological malignancy, it is performed as Autologous Stem Cell Transplantation (SCT) from the person himself and Allogeneic SCT from another. The dose and intensity of chemotherapy and/or radiotherapy combinations are adjusted by applying immunosuppressive conditioning regimens in the treatment (1, 2). Various metabolic disorders occur during the SCT treatment process (3). Refeeding Syndrome (RS) occurs with the start of feeding after a long period of inability to feed. Refeeding hypophosphatemia (RH) poses a risk for RS. The aim of this study is to determine the frequency of RH in patients under-going SCT. To determine the most risky times for RH according to the treatment applied during the treatment, and to ensure that the clinician, nurse and dietitian are cautious for RH and RS at these times.
Methods: This prospective study was conducted with patients aged 18 years and over who were admitted to the Stem Cell Transplan-tation service of Erciyes University Medical Faculty Hospital between March and December 2019 and who underwent Allogeneic and Autologous SCT for the first time. Ethics Committee approval dated 06.02.2019 and numbered 2019/80 was obtained for the study. The patients were informed and their consents were obtained. Phosphorus was considered<2.5 mg/dL for RH and<1.00 mg/dL for se-vere RH (3-8). Patients with thyroid disease, chronic renal failure, gastrointestinal disorders and patients with hypophosphatemia during
12th KEPAN CONGRESS ABSTRACTS
S32

hospitalization were excluded. Each patient was followed up for one week before transplantation and for 22 days for two weeks after transplantation. Age, gender, Body Mass Index (BMI), disease diagnosis, intensive care unit (ICU) needs, lenghts of hospital stay (LOS), comorbidity and chemotherapy protocol of the patients were recorded. To assess nutritional status, Scored Patient-Generated Subjec-tive Global Assessment (PGSGA) scores were evaluated to cover one week before (PG-SGA1) and one week post-transplant (PG-SGA2) (9). Serum phosphorus of the patients was recorded daily. Phosphorus replacement was done when necessary.
Results: There are 50 patients in the study. Detailed information of the patients is shown in Table 1. The incidence of RH on any day was 78% and severe RH was 16% in all patients. The incidence of RH and severe RH in patients who underwent allogeneic SCT was found to be 79% and 11%, respectively. The incidence of RH and severe RH in patients who underwent autologous SCT was found to be 77% and 19%, respectively. The mean serum phosphorus of the patients at admission (day -7) was 3.93±0.64 mg/dL, the trans-plant day (Day 0) 3.45±0.94 mg/dL, the lowest + 2.78±1,07 mg/dL on the 10th day.
Conclusion: Despite the use of phosphorus replacement therapy, the incidence of hypophosphatemia was found to be high. The reason for its high result may be the increase in PGSGA2 score after transplantation compared to PGSGA1 score before transplanta-tion (p<0.001). In order to prevent this, it is of great importance that the clinician, nurse and dietician should be more careful about this issue, daily monitoring of electrolyte levels (more frequently if necessary) and replacement, elimination of obstacles to the imple-mentation of nutrition (nausea, vomiting, diarrhea, mucositis, etc.) and follow-up of nutrition are of great importance.
Keywords: Stem cell transplantation, refeeding syndrome, nutritional status
References
1. Yesilipek M, Karasu G. Hematopoetic stem cell transplantation in children. Journal of Pediatric Sciences 2010; 2: e30.2. Tanyeli A, Aykut G, Demirel AO, Akçaoğlu T. Hematopoetik Kök Hucre Nakli ve Tarihçesi. Arşiv Kaynak Tarama Dergisi. 2014; 23: 1-7.3. Lee J, Choi S, Kim S, et al. Severe metabolic abnormalities after allogeneic hematopoietic cell transplantation. Bone Marrow Transplant 2005;
35: 63-9.4. López MTF, Amarelle CG, Mato JAM. Hypophosphatemia in Adults with Nutritional Support, a Literature Review. Medical Research Archives
2019; 7(2).5. Szeja N, Grosicki S. Refeeding syndrome in hematological cancer patients–current approach. Expert Rev Hematol 2020; 13: 201-12.6. Kraaijenbrink B, Lambers W, Mathus-Vliegen E, Siegert C. Incidence of refeeding syndrome in internal medicine patients. Neth J Med 2016; 74:
116-21.7. Olthof LE, Koekkoek WK, van Setten C, Kars JC, van Blokland D, van Zanten AR. Impact of caloric intake in critically ill patients with, and without,
refeeding syndrome: a retrospective study. Clin Nutr 2018; 37: 1609-17.8. Marinella MA. Refeeding syndrome and hypophosphatemia. J Intensive Care Med 2005; 20: 155-9.9. Bauer J, Capra S, Ferguson M. Use of the scored Patient-Generated Subjective Global Assessment (PG-SGA) as a nutrition assessment tool in
patients with cancer. Eur J Clin Nutr 2002; 56: 779-85.
Table 1. Clinical and demographic data of the patients
All patients(n=50)
RH Developed (n=39)
RH not developed (n=11)
Age (year) mean±SD 47±9 48±14 45±17
Gender, n (%) F 17 (34%), M 33 (66%) F 14, M 25 F 3, M 8
BMI, (kg/cm2) mean±SD 27.3±4.8 27.1±4.8 25.5±4.8
PG-SGA1, median (min-max) 2 (1-6) 2 (1-6) 1 (1-2)
PG-SGA2, median (min-max) 7 (4-12) 7 (4-12) 5 (4-11)
Lenghts of hospital stay, median (min-max), gun 21 (14-81) 21 (14-81) 20 (15-33)
Need of ICU, n (%) 14 (28) 12 2
Comorbidity, n (%) 14 (28) 12 2 RH: Refeeding Hypophosphatemia; n:number, std: standart deviation; F: Female; M: Male; BMI: Body Mass Index, PG-SGA1: one week before transplant Scored Patient-Generated Subjective Global Assessment, PG-SGA2: one week after transplant Scored Patient-Generated Subjective Global Assessment, ICU: Intensive Care Unit, min: minimum, max: maxsimum
SS39
Assessment of the Incidence of Gastrointestinal Problems and PG-SGA in Patients Who Develop Hypophosphatemia in The Process of Stem Cell TransplantationSerap Şahin1, Nurhayat Tuğra Özer1, Gülşah Güneş Şahin1, Leyla Gül Kaynar2, Serhat Çelik2, Kürşat Gündoğan3
1Department of Clinical Nutrition, Institute of Health Sciences, Erciyes University, Kayseri, Turkey2Department of Hematology, Erciyes University School of Medicine, Kayseri, Turkey3Division of Medical Intensive Care, Department of Medicine, Erciyes University School of Medicine, Kayseri, Turkey
12th KEPAN CONGRESS ABSTRACTS
S33

Objective: Refeeding syndrome (RS) is the metabolic and biochemical changes that occur with feeding after a long period of inactiv-ity (1). Malignancy and gastrointestinal (GIS) diseases pose a risk for RS (2). Stem Cell Transplantation (SCT) is frequently performed in malignancy(3, 4). GIS symptoms such as nausea, vomiting and diarrhea develop during treatment(5). These problems can prevent the patient from feeding. Malignancy causes unwanted weight loss, causing both malnutrition and cancer cachexia. Hypophospha-temia is often used as a marker of RS (6). The aim of this study is to evaluate the frequency of GIS symptoms, daily weight changes and nutritional status of patients with SCT who developed Refeeding Hypophosphatemia (RH).
Methods: The study was carried out prospectively in March-December 2019 in Erciyes University Medical Faculty Hospital SCT service. Patients 18 years and over who were applied Allogeneic and Autologous BMT for the first time were included. Patients with thyroid disease, chronic renal failure, gastrointestinal disorders and patients with hypophosphatemia during hospitalization were ex-cluded. Ethics Committee approval was obtained prior to the study. The patients were informed and their consents were obtained. The patients were followed up for 22 days, one week before and two weeks after the transplant day. Transplant day was accepted as day 0. Patients’ gender, age, body mass index (BMI), diagnosis, protocol types, and the number of days of hospitalization were obtained. Nutritional status Scored Patient-Generated Subjective Global Assessment (PGSGA) scores were evaluated as 7th day be-fore transplantation (PG-SGA1) and 7th day after transplantation (PG-SGA2) (7). Daily serum phosphorus values of the patients were recorded. Phosphorus replacement was done when necessary. Daily weight changes and GIS symptoms were recorded. Grade 2 and over accepted according to Common Terminology Criteria for Adverse Events for nausea, vomiting, diarrhea (8).
Results: There are 39 patients with RH in the study. The mean age of the patients was 48±14, and the mean BMI score was 28±5 kg/cm2. The median PG-SGA1 score was 2 (1-6) and the median PG-SGA2 score was 7 (4-12). Median day of stay in hospital was 21 (10-81) days. The highest incidence of nausea in patients was 51%, vomiting 36% and diarrhea 69%. When the weight changes of the patients on the -7th and + 7th days were compared, an average of 4% weight loss was observed (p<0.001). When PG-SGA1 and PG-SGA2 test is compared, it increases significantly (p<0.001) (Table 1).
Conclusion: Nausea, vomiting and diarrhea were found to be high in patients with RH developed SCT. Considering the nutritional status of the patients, PG-SGA 2 score increases significantly compared to PG-SGA1 after transplantation. However, weight loss develops. It was determined that patients with GIS symptoms should be followed more closely in terms of nutrition.
Keywords: Stem cell transplantation, refeeding syndrome, nutritional status, vomiting, nausea, diarrhea
References
1. Preiser JC, van Zanten AR, Berger MM, et al. Metabolic and nutritional support of critically ill patients: consensus and controversies. Critical Care 2015; 19: 35.
2. Kocer E, Gormez A. Refeeding Syndrome. Bezmialem Science 2017; 5: 121-5.3. Yesilipek M, Karasu G. Hematopoetic stem cell transplantation in children. Journal of Pediatric Sciences 2010; 2: e30.4. Tanyeli A, Aykut G, Demirel AO, Akçaoğlu T. Hematopoetik Kök Hucre Nakli ve Tarihçesi. Arşiv Kaynak Tarama Dergisi 2014; 23: 1-7.5. Arnaout K, Patel N, Jain M, El-Amm J, Amro F, Tabbara IA. Complications of allogeneic hematopoietic stem cell transplantation. Cancer Inves-
tigation 2014; 32: 349-62.6. Windpessl M, Mayrbaeurl B, Baldinger C, et al. Refeeding syndrome in oncology: report of four cases. World J Oncol 2017; 8: 25.7. Bauer J, Capra S, Ferguson M. Use of the scored Patient-Generated Subjective Global Assessment (PG-SGA) as a nutrition assessment tool in
patients with cancer. Eur J Clin Nutr 2002; 56: 779-85.8. Savarese D. Common terminology criteria for adverse events. UpToDate Waltham, MA: UpToDate. 2013.
Table 1. Assessment of weight changes and PG-SGA test in patients with Refeeding Hypophosphatemia during Stem Cell Transplantation
Median (min-max) df p Cohen’s d
Weight changes of patients (-7 day & +7 day) -7 day: 75 (54-116) +7 day: 72 (50-114)
39 <0.001 0.85
PG-SGA1 & PG-SGA2 values of patients PG-SGA1: 2 (1-6)PG-SGA2: 7 (4-12)
39 <0.001 0.86
SS40
Comparison of Label Infirmation and Analysis Content of Macro Nutrients in Some Parenteral Nutrition SolutionsElif Öztürk1,2, Aslı Akyol11Hacettepe University, Faculty of Health Sciences, Department of Nutrition and Dietetics, Ankara, Turkey2Karadeniz Technical University, Faculty of Health Sciences, Department of Nutrition and Dietetics, Trabzon, Turkey
Objective: Parenteral nutrition (PN) is a nutritional treatment method that was practiced firstly in 1960s. PN provides energy, macro and micro nutrients needed by the patient. This study aimed to analyse the macro nutrient content of eight different all in one par-enteral nutrition solutions used in Turkey.
12th KEPAN CONGRESS ABSTRACTS
S34

Methods: Eight different all in one parenteral nutrition solutions (PN1-PN8) were examined in this study. The solutions in each com-partment of the products were sampled in same proportions and mixed homogeneously. Protein content was analysed by Kjeldahl method and lipid content was analysed by Soxhelet and aqueous extraction methods. The energy content of the samples was calculated by the bomb calorimeter.
Results: In the examinations performed by Soxhelet method, it was determined that the amount of lipids in PN1-8 solutions was sta-tistically different in comparison to their label contents (p<0.05) (Table 1). In the examinations performed by the aqueous extraction method, the lipid content of PN1, PN3 and PN4 solutions and their label information were similar (p>0.05) (Table 1). When the pro-tein contents of PN solutions were compared, the protein contents of PN1, PN2, PN4, PN5, PN6 and PN7 solutions were similar to the values in their label information (p>0.05) (Table 1). When the energy values and label information values were compared for all solutions, the difference between the two values was found to be statistically different (p<0.05) (Table 1).
Conclusion: The nutritional value written on the label information of the PN solution determines the suitability of the product. It is crucially important to meet the nutritional requirement of critically ill patients. For this reason, it is essential to analyse the nutritional content of PN products at regular intervals, make necessary updates and follow them in order to increase the effectiveness of the PN treatment.
Keywords: Parenteral nutrition, macronutrient, label information
Table 1. Lipid determinations by soxhelet method and aqueous hexane extraction method, protein determination by kjehldahl method and energy measurement results with calorie meter bomb and label information of the solutions of PN1-8 solutions
PN
Lip
id (g
/100
ml)
(So
xhel
et)
Lip
id (g
/100
ml)
(Ext
ract
ion
)
Lip
id (g
/100
ml)
(Lab
el)
p1
p2
Pro
tein
(g
/100
ml)
(Kje
hld
ahl)
Pro
tein
(g
/100
ml)
(Lab
el)
p3
Ene
rgy
(kca
l/g
) (C
alo
riem
eter
)
Ene
rgy
(kca
l/g
) (L
abel
)
p4
PN1 0.87±0.02 1.87±0.09 2.00 0.001* 0.125 2.32±0.10 2.2 0.163 4.98±0.12 6.46 0.001*
PN2 1.20±0.08 0.96±0.05 4.00 0.001* 0.001* 3.72±0.29 4 0.227 4.43±0.04 6.81 0.001*
PN3 0.75±0.10 2.82±0.21 3.10 0.001* 0.147 2.45±0.06 2.6 0.045* 4.23±0.13 6.19 0.001*
PN4 2.65±0.30 3.36±0.34 3.54 0.035* 0.447 2.35±0.04 2.36 0.845 4.71±0.01 7.40 0.001*
PN5 2.20±0.32 1.34±0.33 3.90 0.019* 0.006* 3.37±0.21 3.31 0.682 4.31±0.09 6.38 0.001*
PN6 1.53±0.23 0.57±0.07 3.85 0.003* 0.001* 5.02±0.17 5.07 0.680 4.45±0.05 6.46 0.001*
PN7 1.78±0.05 0.89±0.03 3.85 0.001* 0.001* 4.98±0.49 5.07 0.768 4.37±0.01 6.97 0.001*
PN8 1.05±0.12 1.47±0.06 2.85 0.001* 0.001* 2.28±0.13 3.40 0.004* 4.39±0.26 7.03 0.003*Single Sample T Test, p<0.05 *. Data are given as mean±standard deviation.P1: Label information difference with the amount determined using the Soxhelet method p2: Label information difference with the amount determined using the aqueous extraction methodp3: Difference between the amount of protein determined and label informationp4: Difference between assigned energy and label information
SS41
Evaluation of the Effect of Lipoic Acid on Heart Function in Aged Mammals by Examining Mitochondrial Function in the Aging Model Improved Ventricular H9c2 Cell LineGülay SencarAnkara University The Department of Food, Metabolism and Clinical Nutrition, Ankara, Turkey
According to the definition of the World Health Organization, aging is the gradual decrease in adaption ability to environmental factors over time. Decrease in the number of cardiomyocytes and enlargement of cardiomyocytes are observed due to aging, which are risk factors for cardiovascular diseases. The heart, which is an organ that requires high energy, is very rich in mitochondria and 35% of the tissue is made up of mitochondria. With increasing oxidative stress due to mitochondrial damage, molecules that induce cell necrosis and apoptosis such as reactive oxygen species (ROS) and cytochrome C are released in the cell. According to the free radical aging theory, with aging in mitochondria it is possible to increase ROS and it can trigger aging even more. In addition to the decrease in the number and density of mitochondria in aging tissue, a decrease in mitogenesis and a decrease in ATP synthesis have
12th KEPAN CONGRESS ABSTRACTS
S35

been reported. The structures that form the body’s defense mechanism by binding with free radicals, preventing these compounds from damaging cell structures, are called antioxidants. These can be bioactive nutritional components as well as vitamins and miner-als. Alpha lipoic acid is an antioxidant that is involved in mitochondrial dehydrogenesis enzymes and can be synthesized naturally in the body. Animal tissues rich in mitochondria and green leafy vegetables are their dietary sources. It is a coenzyme of the pyruvate dehydrogenase enzyme in energy metabolism.
In this study, it was aimed to investigate the role of lipoic acid in cardiac dysfunction due to aging through mitochondria.
The H9c2 cell line derived from ventricular rat heart tissue was enzymatically aged with 50 mg / ml D-galactose for 48 hours. To ob-serve the effect of lipoic acid, control and D-galactose groups were incubated with lipoic acid at 30, 100 and 300 µM concentrations for 6, 24, 48 hours. Control, old, 30 µM LA, 100 µM LA, 300 µM LA, aged+ 30 µM LA, aged+100 µM LA, aged+300 µM LA were determined as experimental groups. Mitochondrial membrane potential and ROS measurement, which are mitochondrial function evaluation methods, were evaluated. Cell viability was measured from biochemical measurements. Mitochondrial proteins MFN1, MFN2 and FIS1, which are mitochondrial fusion and fission proteins, were analyzed in order to evaluate the mitochondrial functions of lipoic acid involved in energy metabolism with western blot, a technique that enables us to visualize a specific protein.
In the aging cell, cell viability decreased, LA administration increased cell viability and was realized at 100 µM at most. Expression of MFN1, MFN2 and FIS1 decreased with aging, while MFN2 and FIS1 expression increased in LA groups. While MMP increased at 30 µM for 24 hours according to aging, it also increased in other periods and amounts in non-aging lipoic acid groups. 30 and 300 µM LA in 24 hours and DGAL+300 µM LA in 48 hours were sufficient to decrease ROS increasing with aging. As a result, it has been ob-served that the protection of lipoic acid application against oxidative stress occurring in the aging process is weak at the cellular level but strongly at the mitochondrial level. With this study, the possible positive effects of lipoic acid on the damage caused by aging on cardiomyocytes have been clarified and a reference has been made for product development studies related to its use in this field.
12th KEPAN CONGRESS ABSTRACTS
S36

Selected Abstracts for Poster Presentation
DOI: 10.5152/ClinSciNutr.2021.080321
12th KEPAN CONGRESS ABSTRACTS

PS01
Re-Determining the Cut-Off Point of Peristomal Infection Scoring by the Roc Curve Method in the Patients with Feeding Stoma: Methodological ResearchHatice Ayhan1, Kezban Akçay2, Yeter Nilgün Ölmez2, Cem Şimşek3, Osman Abbasoğlu4
1University of Health Sciences, Gülhane Faculty of Nursing, Department of Surgery, Ankara, Turkey2Hacettepe University Adult Hospital, Clinical Nutrition Unit, Ankara, Turkey3Hacettepe University Adult Hospital, Department of Internal Medicine, Division of Gastroenterology, Ankara, Turkey 4Hacettepe University Adult Hospital, Department of General Surgery, Ankara, Turkey
Objective: Peristomal infection is a frequently encountered problem in enteral nutrition that warrants prompt diagnosis and early an-timicrobial treatment. Current practice lacks a consensus on an accepted measurement tool with acknowledged validity and reliabili-ty. Peristomal Infection Scoring System is one such tool that shows promise, yet the optimal cut-off value remains to be determined.
Methods: This methodological research was conducted with 54 adult participants to evaluate their peristomal areas in terms of infec-tion by two nurse nutritionists and an expert physician in a simultaneous and independent manner, using Peristomal Infection Scores or the local signs and symptoms of infection. Performance was assessed by Receiver Operating Characteristic curve, Inter-observer Consistency and validity metrics.
Results: According to the expert opinion, the peristomal infection rate was 9.2%. The agreement between the observers using the Peristomal Infection Scoring was kappa [k]=1,000, p<0.001. Peristomal Infection Score’s area under the Receiver Operating Characteristic curve was 0.98 (p<0.001), the best cut-off value is found to be 6 points that correlated positively with 0.88 coefficient (p<0.001) and the accuracy of 98.1% (CI: 90.11% - 99.95%).
Conclusion: Peristomal Infection Score with a cut-off value of 6 is a valid and reliable instrument to diagnose peristomal infections. It can be easily used by healthcare professionals in all settings as needed.
Keywords: Peristomal infection, peristomal infection scoring
Reference
1. Mundi MS, Seegmiller S, Davidson J, Schneckloth J, Saied J, Hurt RT. Prospective Assessment of Peristomal Infections Using Objective Criteria. Journal of Parenteral and Enteral Nutrition 2018; https://doi.org/10.1002/jpen.1020
PS02
Is Prognostic Nutritional Index Useful for Evaluation of the Nutritional Status in Elderly Patients? Sencer Ganidağlı, Güzin ÇakmakGaziantep University Faculty of Medicine, Gaziantep, Turkey
Objective: Risk of malnutrition is known to be increasing with age. Early diagnosis of malnutrition may help to reverse or prevent the negative outcomes associated with poor nutritional status. Many screening methods are being used for screening and diagnosing malnutrition (1). In this study we aimed to evaluate efficacy of prognostic nutritional index (PNI) in elderly patients. While evaluating effectiveness on PNI, we compared it with geriatric nutritional risk index (GNRI) according to their relationship with other nutritional tests and frailty indices.
Methods: This cross-sectional study was conducted for a period of 3 months from September 2019 to December 2019. The study was based on the data from patients who admitted to outpatient polyclinic of geriatrics. Malnutrition was assessed by using mini nutritional assessment short form (MNA-SF), long form (MNA-LF), Global Leadership Initiative on Malnutrition criteria (GLIM), PNI and GNRI. PNI was calculated with the formula, “10xalbumin (g/dL) +0.005xlymphocyte count/µL” (2). GNRI was calculated with the formula, “ (1.489 × serum albumin (g/L)) + (41.7 × (current body weight/ideal weight)” (3). Frailty was assessed by using Fried and SOF (Study of Osteo-porotic Fractures) criteria. Data analysis was done by using SPSS (Statistical Package for the Social Sciences) version 22. Chi square test, correlation analysis and linear regression model were used to evaluate relationship between parameters.
Results: The study population was composed of 43 women and 35 men, of mean age 72.6±7.4 years. According to PNI 8 of them were severely malnourished, 11 of them mildly malnourished and 59 were normal. According to GNRI 6 of them had high risk, 6 of them had moderate risk, 5 of them had low risk and 61 of them had no risk for malnutrition. Both PNI and GNRI were positively related with MNA-SF, MNA-LF and negatively related with GLIM. Also, SOF scores were revealed to be negatively related with PNI
NUTRITION 12th KEPAN CONGRESS ABSTRACTS
S37

and GNRI. Fried scores were only related with GNRI. Results were depicted in table-1. The numbers of patients diagnosed with malnutrition were 18, 10, 18 respectively by MNA-SF, MNA-LF, GLIM. Malnutrition risk was detected in 33 patients by MNA-SF, 36 patients by MNA-LF and 23 patients by GLIM. In linear regression analysis, only GNRI were found to be independently related with MNA-SF and MNA-LF (r²=0.214, p=0.007; r²=0.121, p=0.018).
Conclusion: PNI, calculated based on serum albumin and lymphocyte counts, is commonly used for predicting prognosis of cancers (2). The geriatric nutritional risk index (GNRI) is a widely used, simple, and well-established tool to assess nutritional risk in elderly (3). Results of this study made us thought that PNI was not as useful as GNRI in geriatric population. Also, MNA-SF, MNA-LF and GLIM were shown to be more sensitive when number of patients diagnosed were compared. More studies in larger populations may be better for evaluation of effectiveness of this test in geriatric population.
Keywords: Malnutrition, geriatric nutritional risk index, prognostic nutritional index, SOF, Fried
References
1. Screening for Malnutrition in Older People. Guyonnet S, Rolland Y. Clin Geriatr Med 2015; 31: 429-37. 2. Matsumoto Y, Zhou Q, Kamimura K, Moriyama M, Saijo Y. The Prognostic Nutrition Index Predicts the Development of Hematological Toxicities
in and the Prognosis of Esophageal Cancer Patients Treated with Cisplatin Plus 5-Fluorouracil Chemotherapy. Nutr Cancer 2018; 70: 447-52. 3. Xie Y, Zhang H, Ye T, Ge S, Zhuo R, Zhu H. The Geriatric Nutritional Risk Index Independently Predicts Mortality in Diabetic Foot Ulcers Patients
Undergoing Amputations. J Diabetes Res 2017; 1-9.
Table 1. Relationship between parameters
MNA-SF MNA-LF GLIM SOF Fried
PNI p=0.003 p=0.03 p=0.001 p=0.018p=0.071
r=0.338 r=0.261 r=-0.381 r=-0,264
GNRI p<0.001 p=0.005 p=0.002 p=0.015 p=0.005
r=0.463 r=0.341 r=-0.342 r=-0.294 r=-0.337
PS03
Evaluation of Nutritional Deficiency Levels of Outpatients with Cancer Who are Treated with Different Screening ToolsGüldan Kahveci, Serhat Mert Tiril, Sema BasatUniversity of Health Sciences, Ümraniye Education and Research Hospital, İstanbul, Turkey
Objective: Malnutrition is common in oncology patients. The prevalence of malnutrition varies between 44.1% in oncological inpatients and 27.7% in outpatients. The first step in detecting malnutrition early is the application of a screening tool to identify patients at risk for nutrition. Scanning tools should be accurate, fast and simple without increasing the workload. The aim of nutritional screening is to identify patients at high nutritional risk and minimize the complications of malnutrition. This study was conducted to compare the results of Nutri-tional Risk Screening-2002 (NRS 2002), Patient-Generated Subjective Global Assessment (PG-SGA) and NUTRISCORE, which are nutrition-al screening tools used for detecting nutritional deficiency in outpatients receiving cancer treatment in a education and research hospital.
Methods: The study was conducted with 69 outpatients who received cancer treatment at Ümraniye Education and Research Hospital between 6 and10 February, 2020. Sociodemographic characteristics of the patients were evaluated within the scope of the study. Body mass index (BMI), upper arm circumference and calf circumference of the patients were measured. The data were collected by face to face interview method. NRS-2002, PG-SGA and NUTRISCORE scores were calculated in terms of nutritional status. SPSS 23 software was used for statistical analysis. In the statistical analysis, the value of p <0.05 was accepted as significant. It was reported that participation in the study was on a volunteer basis and permission was obtained from the relevant institution and the patients participating in the study.
Results: The mean age of the cases was 56.91±13.40 (26-84) years, 59.4% of them were women. The mean arm circumference of women was 29.68±0.6 cm, and the mean arm circumference of men was 26.82±0.63 cm. The mean calf circumference of women was 36.97±0.71 cm, and the mean calf circumference of men was 35.07±0.82 cm. The mean BMI was 28.55±0.87 kg/m2 in women and 25.43±0.78 kg / m2 in men. It was found that 37.7% of the patients were malnourished according to NRS-2002, 40.6% according to NUTRISCORE and 40.6% according to PG-SGA. The correlation analysis performed among NRS-2002, NUTRISCORE and PG-SGA score was found to be significant (r: 0.506). There was no significant difference in statistical analysis in terms of age, BMI, arm and calf circumferences and scores (p>0.05).
Conclusion: Cancer patients lose weight due to mucositis, nausea, vomiting, xerostomia, dysgeusia and diarrhea as a direct result of their treatment, and all of them contribute to the deterioration of the patients’ nutritional status. Cancer cachexia is characterized by reduced calorie intake and weight loss associated with metabolic changes. Early detection of malnutrition in the pre-cachectic stage with the appropriate screening tool can prevent this syndrome from progressing to further stages. From this point of view, NUTRI-
12th KEPAN CONGRESS ABSTRACTS
S38
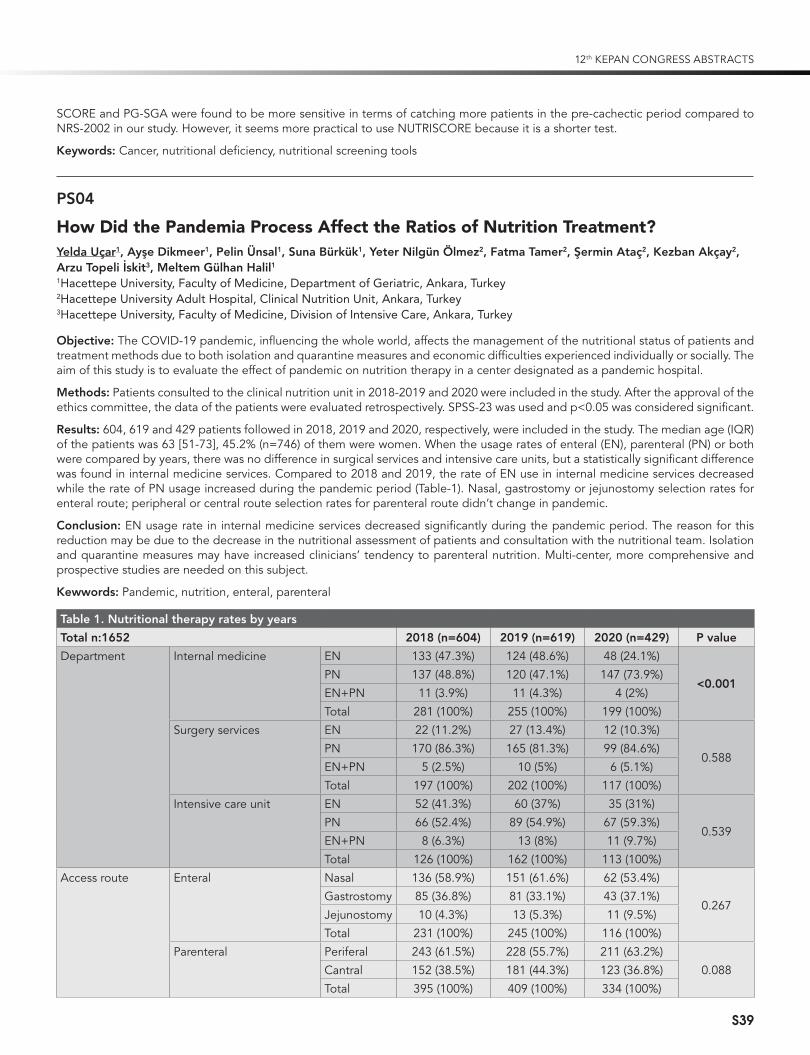
SCORE and PG-SGA were found to be more sensitive in terms of catching more patients in the pre-cachectic period compared to NRS-2002 in our study. However, it seems more practical to use NUTRISCORE because it is a shorter test.
Keywords: Cancer, nutritional deficiency, nutritional screening tools
PS04
How Did the Pandemia Process Affect the Ratios of Nutrition Treatment?Yelda Uçar1, Ayşe Dikmeer1, Pelin Ünsal1, Suna Bürkük1, Yeter Nilgün Ölmez2, Fatma Tamer2, Şermin Ataç2, Kezban Akçay2, Arzu Topeli İskit3, Meltem Gülhan Halil11Hacettepe University, Faculty of Medicine, Department of Geriatric, Ankara, Turkey2Hacettepe University Adult Hospital, Clinical Nutrition Unit, Ankara, Turkey3Hacettepe University, Faculty of Medicine, Division of Intensive Care, Ankara, Turkey
Objective: The COVID-19 pandemic, influencing the whole world, affects the management of the nutritional status of patients and treatment methods due to both isolation and quarantine measures and economic difficulties experienced individually or socially. The aim of this study is to evaluate the effect of pandemic on nutrition therapy in a center designated as a pandemic hospital.
Methods: Patients consulted to the clinical nutrition unit in 2018-2019 and 2020 were included in the study. After the approval of the ethics committee, the data of the patients were evaluated retrospectively. SPSS-23 was used and p<0.05 was considered significant.
Results: 604, 619 and 429 patients followed in 2018, 2019 and 2020, respectively, were included in the study. The median age (IQR) of the patients was 63 [51-73], 45.2% (n=746) of them were women. When the usage rates of enteral (EN), parenteral (PN) or both were compared by years, there was no difference in surgical services and intensive care units, but a statistically significant difference was found in internal medicine services. Compared to 2018 and 2019, the rate of EN use in internal medicine services decreased while the rate of PN usage increased during the pandemic period (Table-1). Nasal, gastrostomy or jejunostomy selection rates for enteral route; peripheral or central route selection rates for parenteral route didn’t change in pandemic.
Conclusion: EN usage rate in internal medicine services decreased significantly during the pandemic period. The reason for this reduction may be due to the decrease in the nutritional assessment of patients and consultation with the nutritional team. Isolation and quarantine measures may have increased clinicians’ tendency to parenteral nutrition. Multi-center, more comprehensive and prospective studies are needed on this subject.
Kewwords: Pandemic, nutrition, enteral, parenteral
Table 1. Nutritional therapy rates by years
Total n:1652 2018 (n=604) 2019 (n=619) 2020 (n=429) P value
Department Internal medicine EN 133 (47.3%) 124 (48.6%) 48 (24.1%)
<0.001PN 137 (48.8%) 120 (47.1%) 147 (73.9%)EN+PN 11 (3.9%) 11 (4.3%) 4 (2%)Total 281 (100%) 255 (100%) 199 (100%)
Surgery services EN 22 (11.2%) 27 (13.4%) 12 (10.3%)
0.588PN 170 (86.3%) 165 (81.3%) 99 (84.6%)EN+PN 5 (2.5%) 10 (5%) 6 (5.1%)Total 197 (100%) 202 (100%) 117 (100%)
Intensive care unit EN 52 (41.3%) 60 (37%) 35 (31%)
0.539PN 66 (52.4%) 89 (54.9%) 67 (59.3%)EN+PN 8 (6.3%) 13 (8%) 11 (9.7%)Total 126 (100%) 162 (100%) 113 (100%)
Access route Enteral Nasal 136 (58.9%) 151 (61.6%) 62 (53.4%)
0.267Gastrostomy 85 (36.8%) 81 (33.1%) 43 (37.1%)Jejunostomy 10 (4.3%) 13 (5.3%) 11 (9.5%)Total 231 (100%) 245 (100%) 116 (100%)
Parenteral Periferal 243 (61.5%) 228 (55.7%) 211 (63.2%)0.088Cantral 152 (38.5%) 181 (44.3%) 123 (36.8%)
Total 395 (100%) 409 (100%) 334 (100%)
12th KEPAN CONGRESS ABSTRACTS
S39

PS05
The Determination of the Relationship Between Adherence with the Mediterranean Diet and the Risk of CancerGül Kızıltan, Selin UçakBaşkent University, Faculty of Medicine, Ankara, Turkey
Objective: It is known that diet plays a role in the regulation of inflammation and has an effect on concentrations of many markers, including cytokines, chemokines, acute phase proteins, and cytokine receptors. When considered from this point of view, the Medi-terranean Diet is considered one of the healthiest eating habits. The study was conducted with the aim of determining the relation-ship between the compliance with the Mediterranean diet and cancer risk of newly diagnosed cancer patients and participants who have not been diagnosed with cancer.
Methods: The study was conducted with 265 individuals, including 128 cancer patients (case group) in suitable criteria, who ap-plied to Private Antalya Medical Park Hospital Medical Oncology Outpatient Clinic and 128 in control group between December 2019-March 2020.Personal characteristics, nutritional habits, situations of physical activity, information about acquired diseases and anthropometric measurements of individuals were recorded in the questionnaire. Food Frequency Questionnaire was used to determine the nutritional status of individuals.Mediterranean Diet Adherence Scale was used to determine the adherence to the Mediterranean diet.
Result: The mean age of individuals were 54.1±8.56 years and 49.9±10.24 years for case group and control group, respectively. It was determined that 59.4% of the case group and 33.6% of the control group had a family history of cancer. The most common types of cancer in the case group were determined as breast, lung, colon and rectal cancers (44.5%, 14.8%, 14.8%, respectively). Comorbid diseases were observed in 64.1% of the case group and 44.5% of the control group. Body Mass Index (BMI) was used to evaluate the anthropometric measurements of individuals. The mean BMI was determined as 27.1±4.80 kg/m² and 27.9±5.19 kg/m² for men and women in the case group, respectively. The mean BMI was determined as 27±2.99 kg/m² and 26.6±3.83 kg/m² for men and women in the control group, respectively. It was observed that the frequency of fruit consumption in the case group was higher than the control group, while the frequency of vegetable consumption was lower. It was determined that the frequency of sugary food consumption of the case group was higher than the control group. Adherence of individuals with the Mediterranean diet, for the case group and control groups, 61.2% are incompatible, 28.9% are acceptable, 3.9% are strictly compatible and 68% are incom-patible, 27.3% are acceptable, 4.7% for case group and control group, respectively. It was determined that there was no significant difference between the average compliance of men and women to Mediterranean diet in the case and control groups (p>0.05). It was determined that there was no statistically significant difference between the anthropometric measurements of individuals ac-cording to their adaptation to the Mediterranean diet (p>0.05). The daily intake of sucrose, fructose, total fat, monounsaturated fatty acid, saturated fatty acid and zincwere observed lower in case group, who incompatible with the Mediterranean compared control group (p<0.05). The daily intake of total fiber, soluble fiber and vitamin B6 were observed higher in case group, who incompatible with the Mediterranean compared control group (p<0.05). The daily intake of total energy and fructose were observed higher in case group, who strictly complied with the Mediterranean diet comparedcontrol group (p<0.05). The daily intake of total fiber, soluble fiber, insoluble fiber, vitamin B1, potassium and magnesium were lower incase group, who strictly complied with the Mediterranean diet comparedcontrol group (p<0.05).
Conclusion: As a result, this study revealed the difference in the nutritional habits of cancer patients and rest of the society. Also provided information on the relationship between cancer and the Mediterranean diet.
Keywords: Mediterranean, diet, cancer, nutrition
PS06
Detection of the Point Prevalance of Symptoms for Infection in Nutritional Ostomies and Investigation of Its Relationship with the Level of Dependence in Patient’s Daily Life ActivitiesGülşah Kesik1, Kezban Akçay2, Hacer Nil Demir3, Hayat Yalın4, Meltem Halil 5
1Hacettepe University, Faculty of Nursing, Ankara, Turkey2Hacettepe University Hospital, Ankara, Turkey3Gazi University Hospital, Ankara, Turkey4Bahçeşehir University Faculty of Health Sciences, İstanbul, Turkey5Hacettepe University Hospital, Ankara, Turkey
Objective: Enteral nutrition is the preferred route for nutritional support in patients with a functional gastrointestinal system. Osto-mies are widely used in providing enteral nutrition, especially in recent years. Local infection is one of the most common complica-
12th KEPAN CONGRESS ABSTRACTS
S40

tions related to ostomies. Infection development in the ostomy site reduces the effectiveness of the treatment, has a negative effect on the general health status of the patient, and increases the cost of health care. Infection development in the ostomy site is often due to negative hygienic conditions and ineffective care. It is known that ostomy care is less in patients with low self-care skills. In the literature review, no study investigating the frequency of infection in the ostomy site and its relationship with the level of dependence in the daily living activities of the patients was found.
Methods: In this cross-sectional analytical type observational study, 21 patients over the age of 18 years and with nutritional ostomy, who were treated in Hacettepe University Adult Hospital and Gazi University Hospital clinics, had no diagnosis of a systemic infec-tion and had no systemic infection treatment, were included. Since the research was a point prevalence study, all of the data were collected on the same day, on July 08, 2020. Demographic Data Table, Symptoms Chart for Infection in Ostomy Site, and Katz Daily Living Activities Scale were used for data collection.
Results: The mean age of 21 patients included in the study was 66.6 years. More than half of the patients were male (62%) and all had at least one chronic disease. The most common symptoms for infection were local rash (38.5%) and discharge (24%), followed by local pain (14.2%) and local temperature increase (9.5%), respectively. There was a statistically significant relationship between the patients’ dependence levels and symptoms of infection (p<0.05).
Conclusion: Although local rash is often in the background during patient follow-up, it is one of the common early signs of infec-tion. In addition, as the dependence level of the patients increases, the rate of infection in ostomies increases significantly. In line with these results, frequent and careful nursing monitoring is recommended for patients with nutritional ostomy, especially for those with a high level of dependence, in terms of symptoms of infection including rash. For this purpose, developing standard follow-up forms and protocols will ensure that patients receive quality care. Moreover, it may be recommended to plan randomized controlled studies with high level of evidence in order to prevent ostomy-related infections.
Keywords: Enteral Nutrition, ostomy, infection, daily living activities, self-care, nursing
References
1. Karadağ A, Menteş B, Üner A. Impact of stomatherapy on quality of life in patients with permanent colostomies or ileostomies. Journal of Col-orectal Dis 2003; 18: 234-8.
2. Volkert D, Berner YN, Berry E, et al. ESPEN (European Society for Parenteral and Enteral Nutrition). ESPEN Guidelines on Enteral Nutrition: Geriatrics. Clin Nutr 2006; 25: 330-60.
3. Bankhead R, Boullata J, Brantley S, et al. Enteral Nutrition Practice Recommendations. Journal of Parenteral and Enteral Nutrition 2009; 33: 122-67.
4. Fraser RJL, Bryant L. Current and future therapeutic prokinetic therapy to improve enteral feed intolerance in the ICU patient. Nutr Clin Pract 2010; 25: 26-31.
5. Poulard F, Dimet J, Martin-Lefevre L, et al. Impact of Not Measuring Residual Gastric Volume in Mechanically Ventilated Patients Receiving Early Enteral Feeding: A Prospective Before–After Study. JPEN J Parenter Enteral Nutr 2010; 34: 125-30.
6. Lewis VP. Basics of ostomy care. Medsurg Nursing 2006; 15: 199-202.7. Butler DL. Early postoperative complications following ostomy surgery. J Wound Ostomy Continence Nurs 2009; 36: 513-9.8. Katz S, Down TD, Cash HR, Grotz RC. Progress In The Development of The Index of ADL. The Gerontologist 1970; 10: 20-30.9. Akçay K, Suluhan D, Kesik G, Uzunoğlu K, Kartal E, Şahna A. Nursing Practices in Enteral Nutrition. Clin Sci Nutr 2020; 2: 1-14.
PS07
The Relationship of Nutritional Status with Geriatric Syndromes and Detailed Geriatric Assessment Parameters in Elderly IndividualsSüleyman Emre Koçyiğit1, Ali Ekrem Aydin2, Ahmet Turan Işik3
1University of Health Sciences, Tepecik Education and Research Hospital, Unit of Geriatrics, İzmir, Turkey2Sivas Numune Hospital, Unit of Geriatrics, Sivas, Turkey3Dokuz Eylül University, Faculty of Medicine, Department of Geriatrics, İzmir, Turkey
Objective: Malnutrition is a geriatric syndrome that causes significant morbidity and mortality in elderly individuals. In this study, it was aimed to investigate the effect of the prevalence of other geriatric syndrome and detailed geriatric assessment (DGA) parame-ters in elderly individuals with malnutrition and under the risk of malnutrition.
Methods: Patients who applied to the geriatric outpatient clinic between January 2019 and June 2020 were included in the study. 460 outpatients who applied to the geriatric outpatient clinic and met the criteria were examined. The patients were divided into three groups according to malnutrition, malnutrition risk and normal nutritional status by applying the short form of the Mini Nu-tritional Assessment (MNA) test. In addition, demographic characteristics, comorbidities and laboratory parameters of the patients were recorded. These three groups were compared in terms of urinary incontinence, falls, dementia, orthostatic hypotension, sleep disturbance, pain, geriatric depression, polypharmacy, sarcopenia and fragility and DGA parameters. In addition, the normal nutri-tional group and the groups with malnutrition and at risk of malnutrition were compared in terms of geriatric syndrome and DGA parameters by applying regression analysis considering age, gender and education year.
12th KEPAN CONGRESS ABSTRACTS
S41

Results: When 460 patients were examined, it was found that 64.5% of these patients were female and the mean age was 77.75±8.12 years. While 65 of the total patients had malnutrition and 141 had malnutrition risk, the remaining 55.2% were included in the normal nutritional group. When the nutritionally normal group was compared with the groups with malnutrition and risk of malnutrition, age, education year, frequency of cerebrovascular disease, hemoglobin, albumin, low-density lipoprotein, vitamin D and folate levels were observed to be statistically different. From geriatric syndroms, the frequencies of falling, dementia, sleep disturbance, urinary incontinence, orthostatic hypotension, polypharmacy, sarcopenia and fragility were found to be higher in the groups with malnutri-tion and risk of malnutrition compared to the normal group (p<0.05). Depression was observed at a higher rate in the malnutrition group compared to the normal group (p<0.05). In addition, daily living activity scores and balance walking test scores were found to be lower in the group with malnutrition and risk of malnutrition (p<0.05). In the regression analysis applied according to demograph-ic characteristics, while the risk of falling, sleep disturbance, urinary incontinence, dementia, orthostatic hypotension, sarcopenia and fragility was increased in the group with malnutrition and risk of malnutrition compared to the normal group, the risk of geriatric depression was higher in the group with malnutrition compared to the normal nutrition group (p<0.05).
Conclusion: It has been shown that the risk of malnutrition, like malnutrition, may increase the risk of other geriatric syndromes and cause deterioration in daily living activity scores in elderly individuals. In this respect, in geriatric practice, patients should be closely monitored nutritionally at each visit and it should be underlined that nutritional interventions should be performed in the early period when necessary in addition to other treatments.
Keywords: Malnutrition, detailed geriatric assessment, geriatric syndrome, elderliness
PS08
Evaluation of Patients Who Have Evaluated by Swallowing Test due to Swallowing Dysfunction at Hacettepe University Anesthesia Intensive Care Unit Between 2015-2019Nihal Deniz Bulut Yüksel1, Adnan Menderes Vural1, Mehmet Yasir Pektezel2, Numan Demir3, Seda Banu Akıncı11Hacettepe University Faculty of Medicine, Department of Anesthesiology and Reanimation, Division of Intensive Care, Ankara, Turkey2Hacettepe University Faculty of Medicine, Department of Neurology, Division of Intensive Care, Ankara, Turkey3Hacettepe University Faculty of Health Sciences, Department of Physiotherapy and Rehabilitation, Ankara, Turkey
Objective: Swallowing dysfunction is frequently encountered in intensive care units. Swallowing dysfunction may present as a clinical picture causing difficulties in patient management. Incidence rates vary between 3-62%. Swallowing dysfunction is associated with morbidity and mortality such as aspiration, airway obstruction, aspiration-related pneumonia, malnutrition, dehydration, malnutri-tion, enteral feeding tube requirement, and prolonged hospital stay. The aim of this study is to evaluate the results of patients who were hospitalized in Hacettepe University Anesthesia Intensive Care Units between 2015 and 2019 evaluated by advanced diagnos-tic methods for swallowing dysfunction.
Methods: After the approval of the ethics committee, patients hospitalized at Hacettepe University Anesthesia ICU between 2015-2019 and who had a diagnostic swallowing test were included in the study. Patients under 18 years of age were excluded from the study.
Results: It was determined that there were 73 patients who were hospitalized in the intensive care unit between 2015-2019 and had a diagnostic swallowing test. 5 patients were excluded from the study because they were younger than 18 years old, and 15 patients were excluded from the study because swallowing evaluation or data could not be reached. 31 (58.5%) patients respiratory failure, 11 (20.8%) patients postoperatively, 3 (5.7%) patients after suicid, 2 (3.8%) patients after fall/multitrauma, 2 (3.8%) patients after cardiac arrest, 2 (3.8%) patients for aspiration pneumonia, 1 (1.9%) patient for COPD exacerbation, 1 (1.9%) patient for neurological event were admitted. 50 (94.3%) patients had comorbidities. 40 (75.5%) patients required a invasive mechanical ventilation in the intensive care follow-up. 20 (37.7%) patients were reintubated during the intensive care follow-up, 11 (20.8%) patients were readmit-ted to the intensive care unit during the same hospitalization period. 16 (30.2%) patients had tracheostomy. 19 (35.8%) patients had a history of aspiration pneumonia. Mechanical ventilation had a significant effect on swallowing dysfunction, such that oral intake was blocked (p<0.05). The effect of mechanical ventilation duration on swallowing dysfunction has not been demonstrated (p>0.05). Demographic and clinical data are given in Table 1.
Conclusion: Patients who are mechanically ventilated have an increased risk for developing swallowing dysfunction after extubation, such that oral intake is closed. Therefore, swallowing functions should be carefully evaluated after extubation.
Keywords: Swallowing dysfunction, postexubation dysphagia, swallowing evaluation in intensive care unit
12th KEPAN CONGRESS ABSTRACTS
S42

Table 1. Demographic and clinical data of patients, n (%), median (min-max), mean (±std)GenderWoman 16 (30.2%)Male 37 (69.8%)BMIWoman 24.9 (±4.97)Man 23.7 (±5.03)Age 65 (19-96)LOS in the hospital 43 (6-199)LOS in the ICU 20 (1-129)LOS before ICU 1 (0-114)ComorbidityHT 22 (41.5%)DM 8 (15.1%)Heart diseases/arrythmia 20 (37.7%)COPD/respiratory diseases 15 (28.3%)Renal diseases 5 (9.4%)Neurological diseases 20 (37.7%)Malignancy 12 (22.6%)Hepatic diseases 1 (1.9%)Other 15 (28.3%)APACHE II 17.43 (±7.66)MortalityIn-hospital 12 (22.6%)1 year after discharge 16 (30.2%)Mechanical ventilator (days) 13.5 (1-108)Diagnostic swallowing assessmentOtorhinolaryngology 8 (15.1%)Department of Neurology 2 (3.8%)Swallowing Disorders Center 43 (81.1%)Swallowing AssessmentNon-oral nutrition 28 (52.8%)Nutrition after swallowing exercise 2 (3.8%)Nutrition with thickener 5 (9.4%)Liquid modified oral intake 14 (26.4%)R3 oral nutrition 4 (7.5%)
PS09
The Relation of Nutritional Situation and Polypharmacy of Geriatric Patients in Palliative Care ServiceEyyüp Murat EfendioğluGaziantep University, Faculty of Medicine, Department of Geriatrics, Gaziantep, Turkey
Objecitve: Palliative care is a term used in the sense of resolving or ameliorating symptoms in patients who fail to respond to curative therapies. We aimed to determine the prevalence of polypharmacy and malnutrition in older patients hospitalized in a palliative care center and the relationship between them.
Methods: The subjects of this study were geriatric patients hospitalized in a palliative care unit. The files and hospital electronic record system data of 136 patients hospitalized were examined. The Mini Nutrition Assessment short-form (MNA-SF) was used to determine the malnutrition prevalence of the patients. Accordingly, patients were divided into three groups in terms of nutritional status: malnutrition, risk of malnutrition, and normal. It was stated as polypharmacy that concurrent usage of five or more drugs.
12th KEPAN CONGRESS ABSTRACTS
S43

Results: The mean age of the 136 patients was 74.88±8.82 years. The proportion of female patients was 63.2%. In our study, the frequency of polypharmacy was found to be 73.5%. The proportion of those with malnutrition or malnutrition who presented polypharmacy was 90%. While there was no significant difference between MNA-SF scores according to gender, it was found that malnutrition or malnutrition risk was in all over the age of 85. A statistically significant weakly negative correlation between MNA-SF and the number of medications was observed.
Conclusion: The frequencies of malnutrition, malnutrition risk, and polypharmacy were high in the patients hospitalized in the palli-ative care unit. The nutritional status of patients who use multiple drugs, especially in the palliative care service, closely monitored and necessary arrangements should be made in their treatment.
Keywords: Palliative care, malnutrition, polypharmacy
Table 1. Nutrition assessment results of the participantsMalnutrition Malnutrition risk Normal Nutrition p
GenderFemale 38 (44.2%) 38 (44.2%) 10 (11.6%) 0.359Male 16 (32.0%) 26 (52.0%) 8 (16.0%)Age group65-74 28 (36.8%) 40 (52.6%) 8 (10.5%) 0.005*75-84 12 (30.0%) 18 (45.0%) 10 (25.0%)≥85 14 (70.0%) 6 (30.0%) 0 (0.0%)Number of medications≥5 46 (46.0%) 44 (44.0%) 10 (10.0%) 0.023*<5 8 (22.2%) 20 (55.6%) 8 (22.2%)*p<0.05
Table 2. Correlation analysis results between age, MNA-SF and number of medications
Age Number of medications MNA score
Age r 1.000 0.160 -0.183p 0.063 0.033*
Number of medications r 0.160 1.000 -0.216p 0.063 0.012*
MNA score r -0.183 -0.216 1.000p 0.033* 0.012*
r: Spearman correlation co-efficent, *p<0.05
PS10
Nutritional Assessment in Ambulatory Neurology Outpatients: A Prospective Study*Ezgi Yılmaz1, Ethem Murat Arsava2, Mehmet Akif Topçuoğlu2
1Giresun University Prof. Dr. A. İlhan Özdemir Training and Research Hospital, Clinic of Neurology, Giresun, Turkey2Hacettepe University Faculty of Medicine, Department of Neurology, Ankara, Turkey
Objective: Many neurological diseases affecting the central and peripheral nervous system may lead to nutritional disorders directly and/or through factors such as depression, dysphagia, cognitive impairment, medication side effects, immobilization. On the other hand, nutritional disorders may play a role in the development and exacerbation of common neurological diseases such as dementia and stroke. As they are known to be associated with low quality of life, prolonged hospital stay, increased number of hospital admis-sions, high morbidity, and mortality, it is important to monitor individuals with neurological disorders for nutritional status.
Methods: Of the patients who presented to the outpatient clinic Hacettepe University Neurology between 27/09/2019 and 25/10/2019, those who consented to participate in the study and who were able to maintain the standing position without assistance during the measurement of height and weight were included in the study. The socio-demographic characteristics of the patients were noted; height and weight were mea-sured and Nutritional Risk Score (NRS-2002) was scored. Those with an NRS-2002 score of 3 or more were considered to be at risk for malnutrition.
Results: 569 patients (n=339 women; median age: 53 (min: 18 - max: 94) were included in the study. Of these patients, 32.7% (n=186) had stroke, 16.7% (n=95) had headache, 12.7% (n=72) had epilepsy, 5.4% (n=31)) had neuromuscular diseases, 11.8% (n=67) had neu-roimmunological disorders, 11.1% (n=63) had movement diseases, 3.3% (n=19) had dementia were examined in outpatient clinics. 6.3% (n=36) of them were enrolled for other reasons such as forensic evaluation and tests. The median duration of illness of the participants was
12th KEPAN CONGRESS ABSTRACTS
S44

3 years (min: 0-max: 50), median body mass index (BMI) was 27.2 (min: 13.6 -max: 48.9), median NRS-2002 was 0 (min: 0 -max: 5). While 4.9% (n=28) of participants were at risk of malnutrition according to NRS 2002, 29.9% were obese according to their BMI. The median age of the group at risk for malnutrition (57.1% n=16 women): 45.5 (min: 19 - max: 76), median duration of illness: 5 years (min: 0 - max: 26). There was no significant difference between the group with and without malnutrition in terms of age, sex, and disease duration. The rate of patients at risk for malnutrition was significantly higher in those evaluated in the outpatient clinic for neuromuscular disease than in the other patients (p=0.014). While the rate of obese patients was lower in those evaluated in the outpatient clinic for epilepsy (p=0.017) than in the other patients, it was higher in those evaluated in the outpatient clinic for movement disorders (p=0.02).
Conclusion: In our study, it was found that 5% of mobile, independently walking patients presenting to the neurology outpatient clinic were at risk of malnutrition requiring intervention; when obesity was taken into account, one in three patients was found to have nutritional disorders. It is of great importance to perform basic anthropometric measurements and routine use of nutritional screen-ing tests in patients presenting to the neurology outpatient clinic in order to identify and treat these patients in the early period.
* Unconditionally supported by Abbott Laboratories Import Export and Trade Limited Company.
PS11
Evaluation of Nutrition Status of Hospitalized Patients Due to COVID-19 DiseaseMelda Türkoğlu1,3, Burcu Öztürk Şahin2, Ezime Toruk3, Lale Karabıyık3,4, Pınar Aysert Yıldız5 , Muhittin Yalçın1, Sema Önal3, Hacer Nil Demir3, Hülya Altun3 1Gazi University, Faculty of Medicine, Department of Internal Medicine, Ankara, Turkey2Gazi University, Faculty of Medicine, Department of Chest Disease, Ankara, Turkey 3Gazi University, Faculty of Medicine, Nutrition Support Team, Ankara, Turkey4Gazi University, Faculty of Medicine, Department of Anesthesiology and Reanimation, Ankara, Turkey5Gazi University, Faculty of Medicine, Department of Infectious Disease and Clinical Microbiology, Ankara, Turkey
Objective: The aim of the study is to evaluate the nutritional status of hospitalized patients with COVID-19 disease, to determine the risk of malnutrition and its effects on patients. Besides, it is also aimed to find out the nutrition support given to patients during hospitalization.
Methods: This study was designed as retrospective. The data set was collected from patients who were diagnosed with COVID-19 disease and hospitalized on service between August 15, 2020, to January 15, 2021. It was presented the preliminary results of an ongoing study. The variables which were included are the demographic characteristics, the variables related to hospitalization, the oxygen treatment on hospitalization, and the variables related to discharge from the ward. From the recordings of height and weight on hospitalization, the body mass indexes (BMI) and NRS-2002 scores were calculated. Descriptive statistics were shown as median [interquartile range] for continuous variables while it was presented as frequency and percentage for categorical variables. Patients with at least 3 points of the NRS-2002 score were classified as high-risk of malnutrition group. For comparisons, the chi-square test and Mann-Whitney U test were implemented for categorical and continuous variables, respectively.
Results: The median age of 187 patients included in the study was 65 [53-73]. Besides, 59% of them were male. The distribution of those pa-tients was 39% from COVID-19 outpatient clinics, 36% from the emergency room, 17% of them from the hospital wards, and the rest of them from the intensive care unit. The most common comorbidities and their percentages were observed as 43% of hypertension, 26% of diabetes mellitus, 18% of coronary artery disease, and 17% of malignancy. The median values of CRP, Ferritin, IL-6, and D-Dimer were found as 76 [20-128] mg/L, 251 [90-628] ng/mL, 33.4 [19.5-67.1] pg/mL and 0.97 [0.49-1.90] µg/mL, respectively. The median values of BMI and NRS-2002 were found as 25.95 [24.22-28.84] and 3 [2-4]. 67% of the patients were at high risk for malnutrition (NRS 2002 ≥3) based on the NRS-2002 score. The percentages of enteral, parenteral, and oral enteral supplementation were 12%, 6%, and 1%, respectively. 63% of those were need-ed oxygen therapy on admission. Therefore, 11% of them were transferred to ICU while 3% of them were discharged from the service. 13% of them have died upon discharge from the hospital. The mortality was higher in the high-risk malnutrition group (19%) compared to the lower-risk malnutrition group (0% and p<0.001). The need of ICU admission is higher in the high-risk malnutrition group (16%) compared to the lower-risk malnutrition group (0% and p=0.001). Moreover, the length of hospital stay was longer in the high-risk group (7 [4-11], 6 [3-8], p=0.04)
Conclusion: 67% of the hospitalized patients due to COVID-19 disease were at risk in terms of malnutrition. However, a small part of them received nutritional support therapy. The hospital mortality and the need for ICU admission were higher and the length of stay was longer in the patients with high-risk of malnutrition comparing the patients with lower risk.
PS12
Evaluation of the Relationship Between Enteral/Parental Nutrition Treatment and Body Mass Index in Geriatric PatientsAyşe Dikmeer1, Pelin Ünsal1, Suna Bürkük1, Yelda Uçar1, Yeter Nilgün Ölmez2, Fatma Tamer2, Şermin Ataç2, Kezban Akçay2, Ebru Ortaç Ersoy3, Arzu Topeli İskit3, Meltem Halil11Hacettepe University, Faculty of Medicine, Department of Geriatrics, Ankara, Turkey2Hacettepe University, Hospital, Clinical Nutrition Unit, Ankara, Turkey3Hacettepe University, Faculty of Medicine, Department of Intensive Care Unit, Ankara, Turkey
12th KEPAN CONGRESS ABSTRACTS
S45

Objective: Malnutrition is common in hospitalized elderly patients. The aim of this study is to evaluate the relationship between body mass index (BMI) and the complications of enteral or parenteral nutrition therapy in geriatric patients.
Methods: The patients older than 65 years whom were followed by clinical nutrition unit between January 2019 and December 2019 were enrolled. Clinical and demographic characteristics and complications were analyzed retrospectively in 3 groups according to body mass index (BMI<23 kg/m2, 23-30 kg/m2,>30 kg/m2).
Results: Total 302 patients (92 patients in BMI<23 kg/m2 group, 165 patients in BMI 23-30 kg/m2 group, 45 patients in BMI >30 kg/m2 group) were enrolled in the study. Median ages of patients were 75 (65-94), 71.5 (65-95), 74 (67-89) in BMI<23 kg/m2, 23-30 kg/m2 and BMI >30 kg/m2 groups respectively (p=0.04). In BMI<23 kg/m2, 23-30 kg/m2,> 30 kg/m2 groups, 54 (58.7%), 77 (46.7%), 21 (46.7%) patients, respectively, received enteral nutrition therapy; 33 (35.9%), 81 (49.1%), 22 (48.9%) patients, respectively, received parenteral nutrition therapy; 5 (5.4%), 7 (4.2%), 2 (4.4%) patients, respectively, received both enteral and parenteral nutrition ther-apy (p=0.312). Target median calories per kilogram were 26.5 (16.0-73.3), 25 (9.0-48.4), 18 (10.0-46.2) in the BMI<23 kg/m2, 23-30 kg/m2,> 30 kg/m2 groups, respectively; median calories received per kilogram were 20 (4.9-46.1), 16.6 (4.3- 37.3), 12.9 (2.7- 34.1), respectively (p<0.001). The other clinical and demographic characteristics are given in Table 1. Gastrointestinal complications (Nau-sea, vomiting, diarrhea and distension) were seen in 12 (20.3%) patients in BMI<23 kg/m2 group, 15 (17.9%) patients in 23-30 kg/m2 group, 5 (21.7%) patients in > 30 kg/m2 group, and there was no statistically significant difference between BMI groups (p=0.899). In BMI groups<23 kg/m2, 23-30 kg/m2, > 30 kg/m2, aspiration pneumonia was seen in 6 (10.2%), 3 (3.6%), 3 (13.0%) patients, respec-tively, hypophosphatemia was seen in 14 (15.2%), 31 (18.8%), 5 (11.1%) patients, respectively, catheter-related infection was seen in 1 (2.6%), 3 (3.4%), 1 (4.0%) patients, ostomy infection was seen in 1 (7.1%), 1 (3.4%), 2 (22.2%) patients, respectively and there was no difference between the groups.
Conclusion: As BMI increases in geriatric patients, the amount of calories given per kilogram has decreased significantly, but the complications that develop during enteral and parenteral nutrition therapy do not differ. Due to the low number of patients who developed complications during enteral or parenteral nutrition therapy in our study group, new studies with more patients should be executed in the future.
Table 1. Demographic, clinical and complication data of the patients
BMI <23 kg/m2 n=92 23-30 kg/m2 n=165 >30 kg/m2 n=45 p
Age 75 (65-94) 71.5 (65-95) 74 (67-89) 0.04
Sex (Female) 36 (39.1%) 67 (40.6%) 35 (77.8%) <0.001
NRS 2002 5 (3-7) 6 (4-7) 6 (5-7) 0.06
Follow-up day 14 (5-76) 15 (3-202) 15 (5-433) 0.28
CRP mg/dl (hospitalization) 7.6 (0.9-33.2) 10.8 (0.17-46.7) 13.8 (1.04- 33.1) 0.50
Prealbumin mg/dl (hospitalization ) 9.8 (3.66-17.5) 9.11 (2.5-38.4) 8.6 (3.5- 36.7) 0.54
Target calories per kg 26.5 (16.0-73.3) 25 (9.0-48.4) 18 (10.0-46.2) <0.001
Target protein per kg 1.4 (0.8-3.6) 1.3 (0.4-2.4) 1.16 (0.5-2.8) <0.001
Recieved calories per kg 20 (4.9-46.1) 16.6 (4.3- 37.3) 12.9 (2.7- 34.1) <0.001
Recieved protein per kg 1.0 (0.2-2.4) 0.83 (0.17-2.31) 0.68 (0.09-1.95) <0.001
Enteral nutrition 54 (58.7%) 77 (46.7%) 21 (46.7%)
0.312Parenteral nutrition 33 (35.9%) 81 (49.1%) 22 (48.9%)
Enteral + Parenteral nutrition 5 (5.4%) 7 (4.2%) 2 (4.4%)
Hypertension 34 (37.0%) 83 (50.3%) 26 (57.8%) 0.039
Tip 2 Diabetes Mellitus 17 (18.5%) 58 (35.2%) 15 (33.3%) 0.017
Chronic obstructive lung disease 13 (14.1%) 22 (13.3%) 10 (22.2%) 0.322
Coronary artery disease 15 (16.3%) 57 (34.5%) 12 (26.7%) 0.007
Chronic renal disease 8 (8.7%) 16 (9.7%) 5 (11.1%) 0.892
Demantia 5 (5.4%) 14 (8.5%) 5 (11.1%) 0.439
Gastrointestinal Complications 12 (20.3%) 15 (17.9%) 5 (21.7%) 0.899
Aspiration Pneumonia 6 (10.2%) 3 (3.6%) 3 (13.0%) 0.118
Hypophosphatemia 14 (15.2%) 31 (18.8%) 5 (11.1%) 0.432
Catheter-related infection 1 (2.6%) 3 (3.4%) 1 (4.0%) 0.954
Ostomy infection 1 (7.1%) 1 (3.4%) 2 (22.2%) 0.153* Variables that do not normally distributed are given as median (min-max), categorical variables are given as number (n) and percentage (%).
12th KEPAN CONGRESS ABSTRACTS
S46

PS13
Are Intensive Care Patients Undergoing Enteral Nutrition Therapy Sufficiently Fed?Volkan Özen1, Aylin Aydın Sayılan2, Miray Türkoğlu3, Dilek Mut3, Samet Sayılan4, Clemente Neves Sousa5,6, Nurten Özen7
1Prof. Dr. Cemil Taşçıoğlu State Hospital, Clinic of Anesthesiology and Reanimation, İstanbul, Turkey2Kırklareli University, School of Health, Department of Nursing, Kırklareli, Turkey3Kırklareli Public Hospital, Intensive Care Unit, Kırklareli, Turkey4Kırklareli University, Faculty of Medicine, Department of Internal Diseases, Kırklareli, Turkey 5Nursing School of Porto, Porto, Portugal6Faculty of Medicine, CINTESIS - Center for Health Technology and Services Research, University of Porto, Porto, Portugal7Demiroğlu Bilim University, Florence Nightingale Hospital School of Nursing, Department of English Nursing, İstanbul, Turkey
Objective: An inability to provide the daily required energy levels makes the patient more prone to infection development and delayed wound healing. In addition, a lower nutritional value than targeted can also lead to prolonged mechanical ventilator use and intensive care unit (ICU) stay. It is emphasized that the patient should receive 80-100% of the daily energy requirement on the third and subsequent days and the daily protein amount should not be less than 1.3 g/kg. It is emphasized that the patient should receive 80-100% of the daily energy requirement on the third and subsequent days and the daily protein amount should not be less than 1.3 g/kg.
Methods: This prospective and descriptive study was conducted with patients who received EN treatment for at least three days at the ICUs of a state hospital between October 2019 and March 2020. Local ethics committee approval was obtained in addition to the necessary permissions from the hospital where the study was conducted and the consent of the patients or patient relatives. Patients aged 18 years or over who were inpatients in the ICU, who had been receiving enteral nutrition (EN) treatment for at least three days, who were not pregnant, and who volunteered to participate were included in the study. The data related to the patients, who had been followed up since admission to the ICU and were on the third day, were obtained from the medical charts on the following day and recorded in the data collection form and APACHE II. The amount of daily energy, volume and protein that the patient should receive was calculated by the nutrition team twice a day. If the patient did not receive the prescribed nutritional product, the nurses made sure that the remaining amount was administered before the next day. A protein and energy intake of required amount on the 3rd day based on the current guidelines was considered protein and energy adequacy while 79% or less was protein and energy inadequacy. “Mann-Whitney U Test”, “Chi-square Test” and “Kruskal-Wallis Test” were used.
Results: The study was completed with 110 patients. The administration of calories and protein was found to be adequate in 95.5% (n=105) and inadequate in 4.5% (n=5). The minimum and maximum calorie intake on the 3rd day was 29.77% and 100%, respec-tively, of the required level. The patients with adequate nutrition were found to have been started EN statistically significantly earlier than patients who were underfed (p=.046). The daily amount of protein intake by the patients with adequate feeding was higher than those who were underfed (p=0.025).
Conclusion: The majority of the patients who underwent EN treatment had adequate nutrition on the 3rd ICU day, and the patients were fed at an adequate level with early onset of EN and the attendance of a nutrition team. A multidisciplinary approach should be demonstrated to ensure that patients receive maximum benefit from EN, and nutrition team play a vital role in regulating nutrition in ICU patients.
PS14
Evaluation of Clinical Nutrition Applications in TurkeySema Çalapkorur, Hilal TokluErciyes University Faculty of Health Sciences, Kayseri, Turkey
This study aimed to evaluate the clinical nutrition practices in Turkey. The study was conducted on online platform with 60 dieticians who were in charge in the nutritional support team in different provinces of Turkey.
While 60% of the dieticians stated that the nutrition support team personnel in their institutions had clinical nutrition training, 45% stated that the personnel to be assigned in this team should not have a special training for clinical nutrition. Only 23% of the dieti-cians reported that there was a parenteral nutrition preparation unit in their institutions. All of the participants stated that they used the NRS-2002 form in the assessment of nutritional status. In addition to NRS-2002, the rate of those using MNA was 8.3%, the rate of those using SGA was 6.7%, and the rate of those using MUST was 1.7%. 86.7% stated that these forms were applied by the nurse, 53.3% stated that they were used by the dietician, and 20% stated that they were applied by the physician. It was determined that the anthropometric measurements of the patients were made by nurses at a rate of 76.7% and by dieticians at a rate of 63.3%. 48.3% of the participants stated that the anthropometric measurements of the patients were not made regularly. The methods used to cal-culate the energy need of the patients were found as follows; The energy calculation per kg (70%), Harris-Benedict equation (60%) and Schofield equation (35%). All of the participants stated that the energy requirement was added according to the stress factors of
12th KEPAN CONGRESS ABSTRACTS
S47

the patient. It was reported that the dietician (91.7%), followed by the physician (80%) and the nurse (26.7%), played an active role in the selection of the product to be used in the patient. 18.3% of the participants stated different foods other than enteral products were sent through the feeding tube and these foods were the products such as grainless soups, milk and ayran. 71.7% of dieticians reported that enteral nutrition was given to all intensive care patients who were not expected to start full-dose oral nutrition within 3 days. 68.3% of the participants stated that they used immunomodulating products in intensive care patients and they used these products in patients with burns (43.3%), trauma (36.7%) and elective upper gastrointestinal surgery (18.3%), respectively. In addition, it was reported that glutamine was used at a rate of 53.3% in patients with burns and at a rate of 40.0% in patients with trauma. The rate of use of whole protein formulations in intensive care patients was found to be 58.3%. 86.7% of dieticians stated that all patients who were not expected to switch to normal nutrition within 3 days, who were contraindicated or unable to tolerate enteral nutrition within 24-48 hours were fed with parenteral nutrition and 66.7% of intensive care patients receiving parenteral nutrition were given full formulations meeting all their needs. The rate of dieticians who stated that perioperative fasting was not applied in surgical patients was 2.0%, and the rate of those who stated that nutrition was not stopped in the postoperative period was 6.1%. The rate of those who gave carbohydrates to patients by oral or IV route before surgery was determined to be 17.3%. The rate of those who applied nutritional support 10-14 days before major surgeries in patients with severe nutritional risk was detected as 23.5%. In the light of these results, it was thought that health professionals working in the nutritional support team should focus on clinical nutrition education and increase their awareness of guideline recommendations.
Keywords: Clinical nutrition, dietician, nutritional support team
PS15
Assessment of Nutritional Status in Critically Ill Patients with Hematological DiseasesMelda Türkoğlu1, Tülay Güler1, Seçil Özercan1, Ekin Kızılay1, Eser Boyar1, Ezime Toruk2, Münci Yağcı3, Nazlıhan Boyacı1, Gülbin Aygencel1 1Department of Medical Intensive Care Unit, 2Nutrition Support Team, 3Department of Hematology, Gazi University School of Medicine, Ankara, Turkey
Objective: To evaluate the nutritional status of hematological patients admitted to the Intensive Care Unit (ICU), to determine the risk of malnutrition and to determine the effect of malnutrition risk on morbidity and mortality.
Methods: Prospectively recorded data of patients admitted to the Hematological ICU of Gazi University Hospital between 01.01.18 and 01.01.21 were examined retrospectively. Demographics, admission data including the diagnosises, Acute Physiology and Chronic Health Evaluation (APACHE II) scores, Glasgow coma scales (GCS), the Sequential Organ Failure Assessment (SOFA) scores were noted. The mechanical ventilation support, renal replacement therapy and complications during the ICU stay were also record-ed. NUTRIC scores were calculated retrospectively. The NUTRIC score of ≥5 was considered as risk of malnutrition. Numerical data are indicated in the median [interquartile range], categorical data in percentages. Comparisons were performed by chi-square and Mann-Whithney U tests.
Results: 189 of the 269 ICU patients were enrolled in the study. The median age was 62 [53-69]. Patients were 60% male. The APACHE II, SOFA and GCS scores were 22 [17-27], 8 [5-11] and 14 [8-15], respectively. The most common underlying hematological diseases were leukemia (40%), plasma cell dyscrasias (23%) and lymphoma (20%). The 31% of patients had allogenic and 17% of them had otolog stem cell transplantation. The most common admission diagnosises were pulmonary diseases (%76) and sepsis (%69). The 51% of patients had shock on admission. The 64% of patients received invasive mechanical ventilation, 34% of them were received renal replacament therapy. The median body mass index was 25.67 [23.21-28.96], NUTRIC score was 5 [4-7]. According to the NUTRIC score, 63% of the patients had malnutrition risk. Enteral nutrition was applied to 42% of the patients, and parenteral nutrition to 15%. The ICU mortality was found as 51% in all patients. Mortality in patients with malnutrition risk (66%) was significantly higher than those without (27%) (p> 0.001). In patients with malnutrition risk, invasive mechanical ventilation (79% to 37%), hemo-dialysis (45% to 14%), nosocomial infection (56% to 41%) and shock development were higher than those without (p<0.05 for all).
Conclusion: The risk of malnutrition was determined in 63% of patients in hematological patients admitted to the ICU. Mortality and morbidity are significantly higher in patients at high risk of malnutrition.
PS16
Awareness of Research Assistants Working in COVID-19 Inpatient Services About Nutrition – A Questionnaire StudySerdar Ceylan, Burcu Balam Doğu, Mustafa Cankurtaran, Meltem Gülhan HalilHacettepe University, Faculty of Medicine, Department of Internal Medicine, Division of Geriatrics, Ankara, Turkey
12th KEPAN CONGRESS ABSTRACTS
S48

Objective: COVID-19 increases risk of malnutrition due to inflammatory process, immobility and possible hospitalization. With prop-er nutritional management, complications are reduced and clinical outcomes are more positive. Nutritional management is of great importance in the COVID-19 pandemic, but it is often overlooked. The aim of our study is to determine the awareness of internal medicine research assistants working in COVID-19 inpatient services in terms of nutritional management of patients and the factors that may affect this.
Methods: A 12-question questionnaire was applied to internal medicine research assistants worked/still working in the inpatient service and intensive care units where COVID-19 patients were followed up, and their awareness and attitudes about nutrition were learned.
Results: A hundred research assistants participated in the study. There were 86 (86%) research assistants who previously performed intensive care rotation and 68 (68%) research assistants who performed geriatrics rotation. The rate of those who considered their knowledge sufficient about nutrition management was 48% (n=48), 63% (n=63) of the research assistants evaluate the nutritional status of the patients daily. The rate of those who considered their knowledge sufficient about enteral nutrition 62% (n=62) and about parenteral nutrition 55% (n=55). It was seen that there were 92 (92%) research assistants who thought that nutrition was a problem in COVID-19 patients, 69 (69%) who questioned for symptoms and 97 (97%) who thought that nutritional therapy showed benefit on clinical results. There are 6 (6%) research assistants who have read publications on nutritional management in COVID-19 patients. Research assistants who have performed intensive care or geriatric rotation see themselves more competent in nutrition (p=0.001 & p<0.001, respectively). Research assistants who have performed geriatric rotation think that they have sufficient knowledge about enteral nutrition (p=0.03). As the researching year increases, the knowledge competencies of general nutrition management, enteral and parenteral nutrition increase (p=0.002 & p=0.02, & p=0.04, respectively).
Conclusion: Research assistants who play important roles in the follow-up and treatment of patients, find themselves highly incom-petent in nutritional management, although they know that nutritional management will yield positive results on the patient’s clinical outcomes. The education of research assistants about nutrition should be given importance in order to apply nutritional support better.
PS17
Turkish Ministry of Health Ümraniye Education and Research Hospital Malnutrition Frequency and Awareness: Point Prevalance StudyEkmel Burak Özşenel, Beytullah Güner, Serhat Mert Tiril, Güldan Kahveci, Sema BasatTurkish Ministry of Health Ümraniye Education and Research Hospital, Unit of Internal Medicine, İstanbul, Turkey
Objective: Malnutrition is a more common health problem with the prolongation of life span, increased oncological patients and increased individuals with multiple chronic diseases. Recognition of malnutrition is important for ensuring the full rehabilitation pro-cess for hospitalized patients and for protecting the patient from possible complications. In addition, providing adequate nutrition also reduces hospital costs. Despite all these benefits, we believe that there is not enough awareness of malnutrition among clini-cians. For this reason, we planned this study both to see the malnutrition frequency in our hospital and to evaluate our awareness as clinicians.
Methods: For this study, with a team of 12 physicians, inpatient clinics other than pediatric, infection and intensive care clinics of our hospital were scanned in a single day and the patients’ NRS2002 scores, arm-calf circumference measurements, and body mass index (BMI) were evaluated at the bedside; their demographic data and the values of albumin, leukocyte, lymphocyte, neutrophil, hemoglobin, crp, and creatinine values which were ordered on the first day of hospitalization were recorded from the hospital automation system. In addition, whether the patients received nutritional support or not was learned and recorded. Patients with NRS2002 scores of ≥3 were considered malnourished.
Results: A total of 178 patients (89 male and 89 female) were included in the study, and 26 male and 22 female patients were found to be malnourished. Considering all inpatients, malnutrition was observed in 24.7% of the patients. While this rate was 32.3% in surgical clinics, it was found to be 20.3% in internal clinics. When only the patients with malnutrition were considered, it was seen that only 27.1% of them received nutritional support. When surgical and internal clinics were evaluated separately in terms of nutritional support, it was observed that 19% of malnourished patients in surgical clinics and 44% in internal clinics were given nutritional support. It was observed that the arm and calf circumference measurements, lymphocyte counts and hemoglobin values of malnourished patients were significantly lower than in those without malnutrition (Table 1). In addition, the mean age, number of days of hospitalization and CRP values of the malnourished group were found to be significantly higher than those of the non-malnourished group (Table 1).
Discussion: Although we have been talking about malnutrition a lot more in the last decade, we think that the awareness of physi-cians has not reached the required level yet. In addition to giving the frequency of malnutrition in a education and research hospital, this study also showed how much of the malnourished patients received support. The results clearly show that there are more mal-nourished patients hospitalized in surgical clinics, but surgical clinics fall behind in providing nutritional support compared to internal clinics. In our study, BMI values and anthropometric measurements of malnourished patients were found to be lower, CRP values
12th KEPAN CONGRESS ABSTRACTS
S49
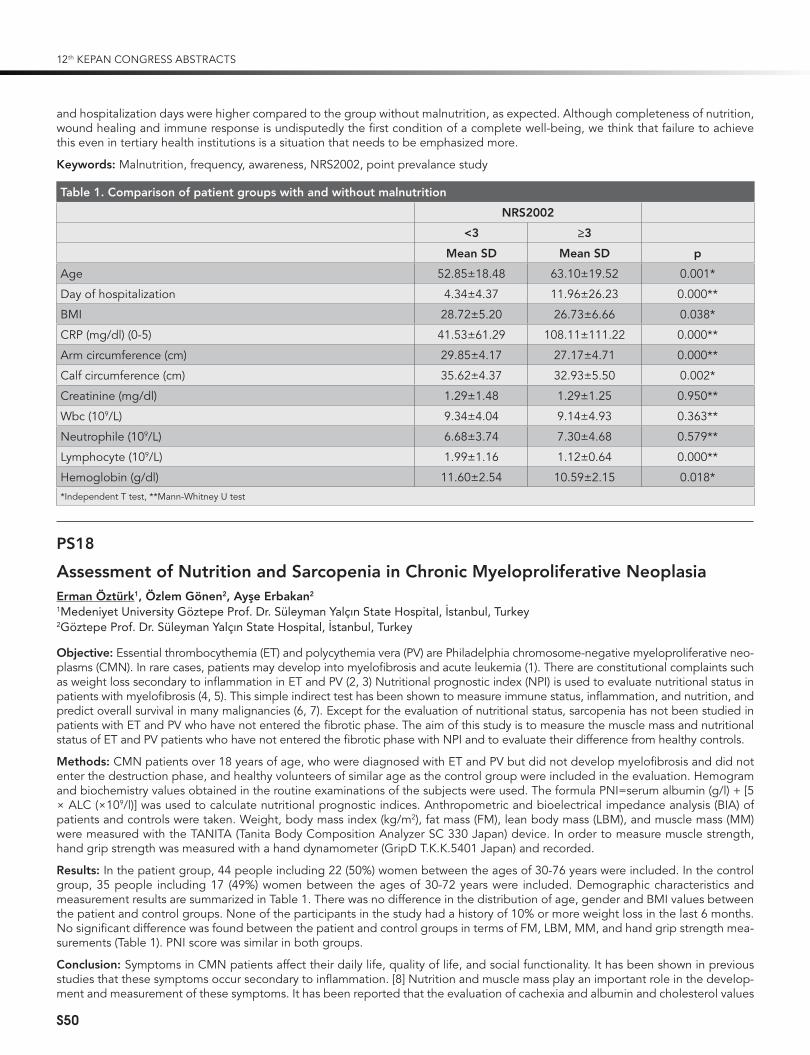
and hospitalization days were higher compared to the group without malnutrition, as expected. Although completeness of nutrition, wound healing and immune response is undisputedly the first condition of a complete well-being, we think that failure to achieve this even in tertiary health institutions is a situation that needs to be emphasized more.
Keywords: Malnutrition, frequency, awareness, NRS2002, point prevalance study
Table 1. Comparison of patient groups with and without malnutrition
NRS2002
<3 ≥3
Mean SD Mean SD p
Age 52.85±18.48 63.10±19.52 0.001*
Day of hospitalization 4.34±4.37 11.96±26.23 0.000**
BMI 28.72±5.20 26.73±6.66 0.038*
CRP (mg/dl) (0-5) 41.53±61.29 108.11±111.22 0.000**
Arm circumference (cm) 29.85±4.17 27.17±4.71 0.000**
Calf circumference (cm) 35.62±4.37 32.93±5.50 0.002*
Creatinine (mg/dl) 1.29±1.48 1.29±1.25 0.950**
Wbc (109/L) 9.34±4.04 9.14±4.93 0.363**
Neutrophile (109/L) 6.68±3.74 7.30±4.68 0.579**
Lymphocyte (109/L) 1.99±1.16 1.12±0.64 0.000**
Hemoglobin (g/dl) 11.60±2.54 10.59±2.15 0.018**Independent T test, **Mann-Whitney U test
PS18
Assessment of Nutrition and Sarcopenia in Chronic Myeloproliferative NeoplasiaErman Öztürk1, Özlem Gönen2, Ayşe Erbakan2
1Medeniyet University Göztepe Prof. Dr. Süleyman Yalçın State Hospital, İstanbul, Turkey2Göztepe Prof. Dr. Süleyman Yalçın State Hospital, İstanbul, Turkey
Objective: Essential thrombocythemia (ET) and polycythemia vera (PV) are Philadelphia chromosome-negative myeloproliferative neo-plasms (CMN). In rare cases, patients may develop into myelofibrosis and acute leukemia (1). There are constitutional complaints such as weight loss secondary to inflammation in ET and PV (2, 3) Nutritional prognostic index (NPI) is used to evaluate nutritional status in patients with myelofibrosis (4, 5). This simple indirect test has been shown to measure immune status, inflammation, and nutrition, and predict overall survival in many malignancies (6, 7). Except for the evaluation of nutritional status, sarcopenia has not been studied in patients with ET and PV who have not entered the fibrotic phase. The aim of this study is to measure the muscle mass and nutritional status of ET and PV patients who have not entered the fibrotic phase with NPI and to evaluate their difference from healthy controls.
Methods: CMN patients over 18 years of age, who were diagnosed with ET and PV but did not develop myelofibrosis and did not enter the destruction phase, and healthy volunteers of similar age as the control group were included in the evaluation. Hemogram and biochemistry values obtained in the routine examinations of the subjects were used. The formula PNI=serum albumin (g/l) + [5 × ALC (×109/l)] was used to calculate nutritional prognostic indices. Anthropometric and bioelectrical impedance analysis (BIA) of patients and controls were taken. Weight, body mass index (kg/m2), fat mass (FM), lean body mass (LBM), and muscle mass (MM) were measured with the TANITA (Tanita Body Composition Analyzer SC 330 Japan) device. In order to measure muscle strength, hand grip strength was measured with a hand dynamometer (GripD T.K.K.5401 Japan) and recorded.
Results: In the patient group, 44 people including 22 (50%) women between the ages of 30-76 years were included. In the control group, 35 people including 17 (49%) women between the ages of 30-72 years were included. Demographic characteristics and measurement results are summarized in Table 1. There was no difference in the distribution of age, gender and BMI values between the patient and control groups. None of the participants in the study had a history of 10% or more weight loss in the last 6 months. No significant difference was found between the patient and control groups in terms of FM, LBM, MM, and hand grip strength mea-surements (Table 1). PNI score was similar in both groups.
Conclusion: Symptoms in CMN patients affect their daily life, quality of life, and social functionality. It has been shown in previous studies that these symptoms occur secondary to inflammation. [8] Nutrition and muscle mass play an important role in the develop-ment and measurement of these symptoms. It has been reported that the evaluation of cachexia and albumin and cholesterol values
12th KEPAN CONGRESS ABSTRACTS
S50

in myelofibrosis patients give significant results. [4] It has also been shown that the PNI score can be an effective tool in determining the poor prognosis in myelofibrosis. [5] The effects of these variables on prognosis in ET and PV are not known since no study has been conducted in this issue before. However, the absence of difference in terms of muscle strength and nutritional index between the patient and the healthy groups may be due to the lack of an effective increase in inflammation in patients with PV and ET who have not entered the destructive phase. With this study, it is seen that patients with PV and ET, who did not enter the destruction phase and did not develop myelofibrosis, were not different from healthy people in terms of sarcopenia and nutrition.
Keywords: Polycythemia vera, essential thrombocythemia, sarcopenia, nutrition
Patient (Mean) Control (Mean)
Age (Year) 55 51 p:0.09
BMI (kg/m2) 28.7 28.4 p:0.8
Fat mass (Kg) 26.5 26.5 p:0.9
Lean body mass (Kg) 55.5 56.3 p:0.7
Muscle mass (Kg) 52.7 53.5 p:0.7
Hand grip (Kg) 23.8 23.7 p:0.9
PNI 55.8 55.7 p:0.9
References
1. Tefferi A, Rumi E, Finazzi G, et al. Survival and prognosis among 1545 patients with contemporary polycythemia vera: an international study. Leukemia 2013; 27: 1874-81.
2. Geyer HL, Dueck AC, Scherber RM, Mesa RA. Impact of Inflammation on Myeloproliferative Neoplasm Symptom Development. Mediators Inflamm 2015; 2015: 284706.
3. Mesa RA, Niblack J, Wadleigh M, et al. The burden of fatigue and quality of life in myeloproliferative disorders (MPDs): an international Inter-net-based survey of 1179 MPD patients. Cancer 2007; 109: 68-76.
4. Tefferi A, Nicolosi M, Penna D, et al. Development of a prognostically relevant cachexia index in primary myelofibrosis using serum albumin and cholesterol levels. Blood Adv 2018; 2: 1980-4.
5. Lucijanic M, Veletic I, Rahelic D, et al. Assessing serum albumin concentration, lymphocyte count and prognostic nutritional index might improve prognostication in patients with myelofibrosis. Wien Klin Wochenschr 2018; 130: 126-33.
6. Periša V, Zibar L, Knezovic A, et al. Prognostic nutritional index as a predictor of prognosis in patients with diffuse large B cell lymphoma. Wien Klin Wochenschr 2017; 129: 411-9.
7. Sun K, Chen S, Xu J, Li G, He Y. The prognostic significance of the prognostic nutritional index in cancer: a systematic review and meta-analysis. J Cancer Res Clin Oncol 2014; 140: 1537-49.
8. Barbui T, Carobbio A, Finazzi G, et al. Inflammation and thrombosis in essential thrombocythemia and polycythemia vera: different role of C-re-active protein and pentraxin 3. Haematologica 2011; 96: 315-8.
PS19
The Incidence of Refeeding Hypophosphatemia Medical Oncology PatientsGülşah Güneş Şahin1, Serap Şahin1, Nurhayat Tuğra Özer1, Mevlüde İnanç2, Sedat Tarık Fırat2, Kürşat Gündoğan3
1Department of Clinical Nutrition, Institute of Health Sciences, Erciyes University, Kayseri, Turkey2Department of Oncology, Erciyes University School of Medicine, Kayseri, Turkey3Division of Medical Intensive Care, Department of Medicine, Erciyes University School of Medicine, Kayseri, Turkey
Objective: Refeeding hypophosphatemia (RH) is a metabolic condition characterized by severe electrolyte and fluid imbalance in response to the transition from catabolic to anabolic state after initiation of nutritional therapy in malnourished patients (1). It is quite common in patients with RH cancer patients. Although several risk factors have been identified for RH, most patients have been reported to have systemic disease such as poor oral intake, recent weight loss, and malignancy (2). Generally, RFS has been reported to occur within the first 3 days after starting nutritional support (3). The primary aim of our study was to determine the daily changes in phosphorus levels of cancer patients hospitalized in the medical oncology service and the frequency of RH seen in patients. Our secondary aim is to determine the frequency of RH according to the nutritional types of patients and cancer types.
Methods: This study was prospectively conducted with patients aged 18 years and over who were admitted to the Medical Oncolo-gy Service. The phosphorus value for RH was<2.5 mg/dL [2,4]. One hundred medical oncology patients aged 18 and over, expected to stay in the service for 48 hours or more, were included in the study. Patients with stage 3 and 4 chronic renal failure were excluded from the study.
Results: The number of patients in the study was 100. Male patients were 59% of the study. The mean age of the patients was 59±9 years. The mean weight of the patients were 69±15 kg and the mean height of the patients were 167±9 cm. The incidence of RH in any day was 87% in patients. The days when RH is seen with the highest rate are determined as the 3rd and 12th days (71% and 33%, respectively).
12th KEPAN CONGRESS ABSTRACTS
S51

Phosphorus values of the patients by days are shown in table 1. When the patients are grouped as GIS (Gastrointestinal system) cancer and non-GIS cancer; the frequency of RH was significantly higher in the GIS cancer group on the 3rd and 11th days than in the non-GIS cancer group. The amount of calories taken by the patients during their follow-up period was significantly higher in the GIS-cancer group com-pared to the non-GIS cancer group. When the patients were grouped according to their diet (enteral nutrition, oral nutrition and parenteral nutrition), the number of patients with RH in the oral group on day 3 was significantly higher than the other groups (p: 0.04).
Conclusion: The incidence of RH is quite high in cancer patients. Among cancer patients, the incidence was higher in patients with GIS cancer patients due to decreased oral intake, decreased absorption and insufficient use.
Keywords: Nutrition, oncology, cancer
References
1. Friedli N, Stanga Z, Culkin A, et al. Management and prevention of refeeding syndrome in medical inpatients: An evidence-based and consen-sus-supported algorithm. Nutrition 2018; 47: 13-20.
2. Marinella MA. Refeeding syndrome and hypophosphatemia. J Intensive Care Med 2005; 20: 155-9.3. González AG, Fajardo RA, González FE. The incidence of the refeeding syndrome in cancer patients who receive artificial nutritional treatment.
Nutricion Hospitalaria 1996; 11: 98.4. Adel N. Overview of chemotherapy-induced nausea and vomiting and evidence-based therapies. Am J Managed Care 2017; 23(14 Suppl): S259.
Table 1. RH frequency of patients with GIS cancer and non-GIS cancer by days
Day 1
Day 2
Day 3
Day 4
Day 5
Day 6
Day 7
Day 8
Day 9
Day 10
Day 11
Day 12
Day 13
Day 14
GIS cancer 3.1 2.9 2.1 3.1 2.9 3 2.9 3 3.1 3.2 3.2 3 3.1 2.9
Non-GIS cancer 3.2 2.7 2.3 3.3 3 3.2 3.1 3.1 3.1 3.4 3.8 3 3.4 3.1
PS20
Working as a Clinical Nutrition Nurse In Turkey: A Qualitative StudyRana Elçin Sezer1, Zeliha Özdemir Köken2, Kezban Akçay3, Mutlu Doğanay4
1Hacettepe University, Faculty of Nursing, Department of Surgical Nursing, Ankara, Turkey2Hacettepe University, Faculty of Nursing, Department of Surgical Nursing, Ankara, Turkey3Hacettepe University Adult Hospital, Unit of Clinical Nutrition, Ankara, Turkey 4University of Health Sciences, Ankara State Hospital, Department of General Surgery, Ankara, Turkey
Objective: In Turkey, the duties and responsibilities of nutritional nurses in the practice areas differ according to the institutions and positions they work in, and the communication and cooperation within the multidisciplinary team. In order to fulfill the responsi-bilities of the multidisciplinary team and to maintain them without interruption, it is necessary to determine the experiences of the nurses working in this field regarding their practice areas, duties and responsibilities. With this study, it was aimed to determine the experiences of nurses in the nutrition team.
Methods: The research was carried out with the phenomenological method, which is one of the qualitative research methods. The study population included nutritional nurses working in clinical nutrition units of hospitals in Turkey for at least 6 months. The sample of the study was determined by purposeful sampling, one of the improbable sampling methods, and data saturation was taken as a basis in determining the sample size. Accordingly, the research was conducted with 10 nutritional nurses. Research data were collect-ed using a semi-structured questionnaire, in-depth, through individual interview method. In-depth individual interviews were carried out with the participants by video calls and audio recordings online. The sound recordings were transcribed by the researchers in computer environment, and the content analysis was made.
Results: As a result of the content analysis of the research data, themes were created by the researchers. According to the results of the analysis, 5 main themes were determined; “Nursing Practices in Nutrition”, “The Importance of the Nutrition Team”, “Prob-lems Regarding Nursing Practices in Nutrition”, “Problems Regarding Laws and Regulations” and “Expectations”. In line with these themes, it has been determined that nurses take part in the nutrition team as the coordinating members of the team and have an important role in the formation of nutrition teams in hospitals. In hospitals with adequate infrastructure and the number of health professionals, the nutrition nurses stated that they were able to fulfill their duties and responsibilities and they were satisfied with the work in the presence of qualified nutrition teams. However, nutritional nurses stated that they faced various difficulties while performing their duties in hospitals that did not have these facilities.
Conclusion: In line with the results of the study, it has emerged that nutritional nursing should be defined as private branch nursing. In this study, duties and responsibilities, needs and experiences of nurses in the nutrition teams in Turkey have been revealed and it is thought that the study results will be guiding in determining the policies related to the issue.
Keywords: Clinical Nutrition, Team, Nurse, Experience, Qualitative study
12th KEPAN CONGRESS ABSTRACTS
S52

PS21
Evaluation of Sarcopenia Diagnosis Paremeters in Patient with Malnutrition According to Glim CriteriaGüzin TümerOndokuz Mayıs University Health Application and Research Center, Samsun, Turkey
Objective: It is very difficult to define sarcopenia after determining malnutrition according to phenotypic and etiological criteria of GLIM after nutritional screening. Although laboratory measurement methods are safe for the diagnosis of sarcopenia, it may not always be practical for every patient and hospital. In this study, it was aimed to determine the diagnosis of sarcopenia by anthropo-metric and muscle strength measurements in patients evaluated with GLIM criteria.
Methods: 80 adult patients hospitalized were evaluated for weight, height, weight loss and % value, Body Mass Index (BMI), NRS and GLIM. Triceps skinfold thickness (TST), upper middle arm circumference (UMAC), calf circumference (CC), and hand grip strength were measured. Anthropometric and muscle strength measurements of patients with malnutrition according to Glim criteria were evaluated in terms of sarcopenia.
Results: The patients’ (n=80) mean age was 59.9±15.6 years, the mean height was 165.2±8.4 cm, the mean weight was 71.3±15.5 kg, the mean weight loss was 5.2±5.6 kg, and the mean weight loss was 6.8±7.3%. 26% (n=21) of the patients were diagnosed with oncological disease, 26% (n=21) with surgical disease, and 48% (n=38) with chronic disease. NRS score was <3 in 34 (42.5%) patients and 3≤ in 46 (57.5%) patients. Sarcopenia diagnosis parameters and statistical evaluations of the patients evaluated according to the Glim criteria are shown in Table 1. Hand grip strength and UMAC were significantly lower in female patients with malnutrition than in those without malnutrition, and hand grip was below the normal value (<16 kg). There was no significant difference in TST, CC and BMI, which could be an indicator of sarcopenic obesity. No difference was found between the malnourished and non-malnourished patients in terms of hand grip and BMI values in males; however, it was lower in malnutrition. UMAC, CC, and TST were significantly lower in malnourished patients compared to those who were not. In addition, hand grip strength for males was below the normal value (<27kg) in the malnourished and non-malnourished groups. In this case, both groups were sarcopenic in males.
Conclusion: Early recognition of malnutrition has always been an important problem. For this reason, different methods are con-stantly being developed. In addition, although it is safe to recognize sarcopenia with laboratory measurements, it may not be prac-tical for most patients and clinics. It is especially difficult in special situations such as the elderly, obese and intensive care patients. Therefore, regular anthropometric, muscle strength and performance measurements can be practical and guiding.
Keywords: Glim criteria, malnutrition, sarcopenia
Table 1. Sarcopenia diagnostic parameters and statistical evaluations of patients evaluated according to Glim criteria
GLIM
Female (n=27) Male (n=53)
Malnourished (n=20)
Non-malnourished (n=7) P
Malnourished (n=37)
Non-malnourished (n=16) P
Hand grip strength (kg) 11.1±7.2 17.6±6.8 <0.05* 23.98±10.4 25.7±1 >0.05
UMAC (cm) 26.7±5.1 32.6±9.1 <0.05* 25.98±3.6 29.1±3.5 <0.05*
TST (mm) 25.1±13.1 35.9±10.7 >0.05 23.59±4 34.8±1 <0.05*
CC (cm) 33.6±6.1 36.5±2.9 >0.05 32.3±4 35.9±3 <0.05*
BMI (kg/height²) 26.5±6.8 25.5±5.9 >0.05 24.5±5 27.3±3 >0.05
PS22
Follow-Up Until Postoperative PeriodGüldan Kahveci1, Selma Dağcı2, Ekmel Burak Özşenel1, Sema Basat1
1University of Health Sciences Ümraniye Education and Research Hospital, İstanbul, Turkey2İstanbul Provincial Directorate of Health, Department of Medical Services, Unit of Specialized Services, İstanbul, Turkey
Objective: Malnutrition is a health problem that affects cancer patients substantially throughout the course of their disease. The pro-portion of patients experiencing weight loss at the time of diagnosis varies between 15% and 40% depending on the type of cancer. As the disease progresses, the incidence of malnutrition increases and eventually affects 80% of patients. Malnutrition prolongs the incidence of infection and hospital stay in cancer patients, adversely affects the course of the disease, and increases the risk of death. This study was carried out to evaluate the results of nutritional deficiency on body mass index in patients who underwent surgery with the diagnosis of gastrointestinal system (GIS) malignancy in the general surgery clinic of an education and research hospital.
12th KEPAN CONGRESS ABSTRACTS
S53
Methods: The study was carried out with 60 patients who underwent surgery for GIS malignancy in Umraniye Education and Re-search Hospital between November and December 2020. Within the scope of the study, the sociodemographic characteristics of the patients were evaluated. Body mass indices (BMIs) of the patients were evaluated in 4 different periods, from the beginning of the complaint to the preoperative period, during the operation, at discharge and 1 month after discharge. The data were collected by face to face interview method.
Results: The mean age of the cases was 50±15 (20-83) years, 68.3% of them were male and the mean height was 168±9 (150-190) cm. The mean body weight of the patients at hospitalization was 70±13 kg (41-108) and the mean BMI was 24.76±3.7 (16.01-33.6). The mean preoperative weight loss of the patients was determined as 8±8 kg (0-30). While the mean BMI of the patients was 27.5±4.1 (18.9-37.3) from the beginning of the complaint to the preoperative period, it was found that they lost an average of 3±3 (0-11 kg) kg during the hospitalization period. The mean BMI of the cases at the time of discharge was determined as 24.17±4.29 (14-34.9). While the patients experienced an average of 2±4 (0-15) weight loss in the period after discharge, the mean BMI one month after discharge was found to be 23.3±4.2 (14-34.9). The decrease in BMI of the patients from the beginning of the complaint to the day of hospital-ization was statistically significant (p: 0.000). Likewise, the decrease in BMI from the day of hospitalization to the day of discharge was found to be statistically significant (p: 0.001). When the BMI at discharge and the BMI values one month later were compared, again a statistically significant decrease was observed (p: 0.000). When an evaluation was made covering all these periods, it was seen that the decrease in BMI values from the beginning of the complaints to the period 1 month after discharge was statistically significant (p: 0.000).
Conclusion: Malnutrition risk of patients diagnosed with GIS malignancy and operated is quite high. It is important for the clinicians who follow these patients to recognize malnutrition both for the full recovery process and for the protection of the patient from possible complications. Evaluation of these patients together with the clinician and the nutritional support team is very important in terms of minimizing weight loss by closely monitoring medical nutrition therapy, reducing hospitalizations and increasing the quality of life. The continuation of pre-diagnosis weight loss of the patients in our study during hospitalization and after discharge indicates that malnutrition awareness is not yet complete in clinical units and training-awareness studies are needed on this issue.
Keywords: Weight loss, GIS malignancy, Malnutrition
PS23
Evaluation of Malnutrition in Alzheimer PatientsNilüfer Erdoğmuş İnce1, 2
1University of Health Sciences İzmir Bozyaka Education and Research Hospital Neurology Clinic, İzmir, Turkey2Dokuz Eylül University Health Sciences Institute, Department of Sleep and States of Consciousness, İzmir, Turkey
Objective: Dementia is one of the most important causes of disability and morbidity in elderly people. Alzheimer›s Disease is the most common cause of dementia. It has been reported in previous studies that various factors such as sociodemographic character-istics, severity of the disease and functional status are associated with deaths from dementia. Unlike unchangeable factors, improving nutritional status is important as a modifiable factor to increase the life expectancy of these patients while maintaining functional capacity. Therefore, new guidelines published by the European Society of Clinical Nutrition and Metabolism (ESPEN) recommend nutritional care and support in dementia as an integral part of dementia management. Unwanted weight loss and malnutrition can be common even in early-stage Alzheimer›s patients. By routinely screening Alzheimer›s patients for the risk of malnutrition and making appropriate interventions in the early period, possible adverse clinical outcomes can be prevented in advance. For the evaluation of malnutrition status in elderly individuals, the European Association of Clinical Nutrition and Metabolism (ESPEN) and the Clinical Enteral Parenteral Nutrition Association (KEPAN) recommend the Mini Nutritional Assessment (MNA) scale as a marker of malnutri-tion in the elderly. MNA is a screening test that has been adapted into Turkish by KEPAN and evaluates malnutrition in the elderly quickly and reliably. In this study, it was aimed to investigate the presence of malnutrition by evaluating the patients diagnosed with Alzheimer’s Disease with the MNA scale and to determine the risk factors that might be associated with malnutrition in these cases.
Methods: Alzheimer’s patients followed in the Neurology Clinic and Home Health Unit of Izmir Bozyaka Education and Research Hospital were included in the study. Patients’ data of age, gender, height, weight, and body mass index (BMI), dementia stage ac-cording to the clinical dementia evaluation scale, the presence of multiple drug use, the presence of pressure sores and the presence of any additional neurological diseases were recorded. Mini Nutritional Assessment scale short form (MNA-SF) and then the whole scale were applied to the patients.
Results: A total of 87 patients participated in the study. The average age of the patients was 80.4±10.1 years, 55 of them (63.2%) were female. While only 5 (5.7%) of the cases were underweight (BMI <19), 62 cases (71.3%) were at normal weight and 20 (23%) were overweight (BMI> 25). While malnutrition was detected in 31 (35.6%) of the patients according to MNA-SF, 45 (51.7%) were under the risk of malnutrition and 11 (12.6%) were normal. According to the MNA scale, 40 patients (46%) were malnourished, 41 patients (47.1%) were at risk of malnutrition and 6 patients (6.9%) were found to be normal. Eleven (12.6%) of the patients had early stage dementia, 37 (42.5%) had middle stage dementia, and 39 (44.8%) had advanced stage dementia according to the Clinical Dementia Assessment Scale (CDAS). While no additional neurological disease was detected in 53 patients (60.9%), additional cere-brovascular disease was detected in 32 patients (36.8%). In addition, 68 patients (78.2) had multiple drug use. When the dementia
12th KEPAN CONGRESS ABSTRACTS
S54

stage determined according to CDAS and the malnutrition status were evaluated, it was found that the frequency of malnutrition increased as the dementia stage progressed. (p <0.001).
Conclusion: The MNA scale is a useful tool in determining the risk of malnutrition in Alzheimer’s patients. Malnutrition risk is associ-ated with clinical dementia stage and disease duration in Alzheimer’s patients. However, studies involving more patients are needed.
Keywords: Alzheimer’s Disease, dementia, malnutrition, MNA
References
1. Landeiro F, Wace H, Ghinai I, et al. Resource utilisation and costs in predementia and dementia: a systematic review protocol. BMJ Open 2018; 8: e019060.
2. Takizawaa C, Thompson P, vanWalsem A, Faured C, Maier W. Epidemiological and economic burden of Alzheimer’s disease: a systematic litera-ture review of data across Europe and the United States of America. JAD 2015; 43: 1271-84.
3. Guigoz Y, Lauque S, Vellas BJ. Identifying the elderly at risk for malnutrition. The Mini Nutritional Assessment. Clin Geriatr Med 2002; 18: 737-57.4. Connors M, Ames D, Boundy K, et al. Predictors of mortality in dementia: the PRIME study. JAD 2016; 52: 967-74.5. Sanders C, Behrens S, Schwartz S, et al. Nutritional status is associated with faster cognitive decline and worse functional impairment in the
progression of dementia: the cache county dementia progression study. JAD 2016; 52: 33-42.6. Volkert D, Chourdakis M, Faxen-Irving G, et al. ESPEN guidelines on nutrition in dementia. Clin Nutr 2015; 34: 1052-73.7. Soini H, Routasalo P, Lagström H. Characteristics of the Mini-Nutritional Assessment in elderly home-care patients. Eur J Clin Nutr 2004; 58: 64-70.
PS24
To Continue or Not to Continue to Follow the Gastric Residual Volume in a Critical Patient?Mustafa KaçmazÖmer Halisdemir University, Faculty of Medicine, Niğde, Turkey
Objective: The aim of our study is to determine whether there is a relationship between the total amount of GRV and two different GRV thresholds and the development of gastrointestinal intolerance in patients whose respiration is provided by mechanical venti-lation in the intensive care unit.
Methods: Eighty adult patients over the age of 18 years who were scheduled to be fed with EN for at least 3 days were included in the study. Ten patients were excluded from the study for various reasons and the study was completed with 70 patients. Group 1 (n=35): In the patient group whose GRV threshold was determined as 250 mL, measurements were performed every 6 hours and the rate of nutritional increase was 10 mL. Those with a total amount of GRV up to 500 ml were also included in this group. Group 2 (n=35): In patients whose GRV threshold was determined to be 500 mL, measurements were performed every 6 hours and the rate of nutritional increase was 10 mL, and those with a total GRV amount above 500 mL were included in this group. Symptoms of gastrointestinal intolerance (vomiting, regurgitation, abdominal distension and diarrhea) were observed in patients. GRV threshold was taken as the measurement of residual volume above 500 ml in one-time measurement.
Results: 10 of the 80 patients included in the study were excluded from the study for the reasons stated above, and the data of 70 patients were evaluated. There was no difference between the groups in terms of age, gender, reasons for hospitalization, need for sedation, use of inotropes, APACHE 2 score and co-morbid disease. (Table 1). In our study, there was a statistically significant difference in terms of the GRV average between both groups (P<0.001). There was no statistically significant difference between the groups in terms of the time to reach the target calorie, target calorie values, and length of stay in the intensive care unit (Table 2). There was no statistically significant difference between Group 1 and Group 2 bwith regard to vomiting, diarrhea, regurgitation, and abdominal distension (Table 3).
Discussion: In our study, no significant difference was found between the two groups in terms of time for reaching the target calorie. These results were similar to those reported by Flesher et al. (1) and Pinilla et al. (2). Montejove et al. demonstrated that increasing the threshold value in GRV was not associated with gastrointestinal complications (3). In our study, the groups with GRV threshold value of 250 mL and 500 mL were compared. We could not find a statistically significant difference in terms of the time to reach the target calorie, regurgitation, aspiration, gastric distension and VID frequency. In 2007, In a study by Desachy et al. (4), in which GRV threshold was determined as 300 ml, they compared the frequency of vomiting in patients with GRV> 300 mL and GRV <300 mL and they reported nu significant difference. In our study, we could not find a significant difference in the vomiting frequency of the patients who were applied 250 ml and 500 ml threshold values. This suggests that the amount of GRV is not important in terms of the frequency of vomiting. It has been reported that sedation may affect gastric drainage and indirectly GRV (5). In our study, we could not find a statistically significant difference between the GRVs of patients who were administered sedative drugs for sedation and those who were not.
Conclusion: According to our results, the use of GRV measurement for evaluating gastrointestinal motility function in patients fed enterally through the nasogastric tube is not significant when evaluated together with the clinical results. We suggest that the use of standardized enteral feeding protocols in intensive care units is important to prevent the development of gastrointestinal intolerance.
12th KEPAN CONGRESS ABSTRACTS
S55

Keywords: Enteral nutrition, Gastrointestinal complication, residuel volume
References
1. Flesher ME, Archer KA, Leslie BD, McCollom RA, Martinka GP. Assessing the metabolic and clinical consequences of early enteral feeding in the malnourished patient. JPEN J Parenter Enteral Nutr 2005; 29: 108-17.
2. Pinilla JC, Samphire J, Arnold C, Liu L, Thiessen B. Comparison of gastrointestinal tolerance to two enteral feeding protocols in critically III pa-tients: a prospective, randomized controlled trial. JPEN J Parenter Enteral Nutr 2001; 25: 81-6.
3. Montejo JC, Minambres E, Bordeje L, et al., Gastric residual volume during enteral nutrition in ICU patients: the REGANE study. Intensive Care Med 2010; 36: 1386-93.
4. Desachy A, Clavel M, Vuagnat A, Normand S, Gissot V, François B. Initial efficacy and tolerability of early enteral nutrition with immediate or gradual introduction in intubated patients. Intensive Care Med 2008; 34: 1054-9.
5. Metheny NA, Schallom ME, Edwards SJ. Effect of gastrointestinal motility and feeding tube site on aspiration risk in critically ill patients: a review. Heart Lung 2004; 33: 131-45.
Mean Values
Group 1 Group 2 p
High GRV 17.1% 0.0% 0.012
Time to reach target calorie 48.40±19.35 53.40±19.35 0.152
Mean GRV 317.14±127.39 598.86±86.09 0.001
Target calorie 1673.14±246.21 1708.29±159.25 0.481
Regurgitation 28.6% 34.3% 0.607
Abdominal Distension 5.7% 7.7% 0.693
Diarrhea 17.1% 17.1% 0.698
Vomiting 8.6% 14.3% 0.710
PS25
Experiences of Nutritional Nurses in Patients Receiving Nutrition Therapy: A Phenomenological Qualitative StudyDerya Suluhan1, Esen Kartal2, Hasibe Kazancı3, Kezban Akçay4
1University of Health Sciences Gülhane Faculty of Nursing, Ankara, Turkey2Ankara City Hospital General Hospital, Ankara, Turkey3Hacettepe University Hospital, Blood Collection Unit, Ankara, Turkey4Hacettepe University, Clinical Nutrition Unit, Ankara, Turkey
Objective: Since qualitative studies reflect the experiences of the participants better and provide an opportunity to identify issues that need improvement, this qualitative study was carried out in order to determine the experiences of nutrition nurses who are members of the KEPAN Association in our country regarding nutritional care during the COVID-19 pandemic process.
Methods: This study, which was planned as a phenomenological qualitative study, was carried out with 21 nutritional nurses who are members of the KEPAN Association. The permission and ethics committee approval of the study was obtained from the KEPAN Association and the Ministry of Health, General Directorate of Health Services. The data were collected with a “Participant Informa-tion Form” containing 10 questions for defining the participants and a “Qualitative Interview Form” consisting of six open-ended questions to determine the experiences of nutrition nurses in the follow-up of patients receiving nutritional therapy in the COVID-19 pandemic. An in-depth individual interview was conducted using the online method in obtaining the data due to the pandemic. The average duration of individual interviews was 35 minutes (minimum=15, maximum 45 minutes). The interviews were digitally record-ed and transcribed verbatim. Digital records that were converted to text were analyzed according to qualitative content analysis.
Results: All of the participants (100%, n=21) were women. According to the content analysis, 4 themes and 21 sub-themes were de-termined for the nutritional nurses’ experiences with patients receiving nutritional therapy. The first theme was ‘chaos and confusion’, the second theme ‘struggle’, the third theme ‘nutritional therapy cannot be ignored’ and the fourth theme was ‘recommendations for optimal nutritional care’.
Conclusion: As a result of in-depth interviews, it was determined that the nutritional treatment of patients was applied during the pandemic process as well as before the pandemic, the need for nutritional support increased, the follow-up of patients receiving en-teral nutrition therapy was more difficult than before the pandemic, and nutritional care applications for patients receiving parenteral nutrition therapy increased during the pandemic process.
Keywords: Nutritional nurse, nutritional care, COVID19, pandemic, experience
12th KEPAN CONGRESS ABSTRACTS
S56

PS26
The Effect of Omega-3 Fat Acid, Trace Element and Vitamin Support, Which are Added to Parenteral Nutrition in Covid-19 Treatment, on Prognostic FactorsGamze Küçükosman, Bengü Gülhan AydınZonguldak Bülent Ecevit University, Zonguldak, Turkey
Objective: Hypercatabolism, which is common in intensive care patients, leads to many complications (1-3). Therefore, nutrition is an integral part of treatment in intensive care units (ICUs). We planned our study in order to raise awareness about nutrition with the questionnaire we prepared in order to evaluate the preferences of clinicians in our hospital’s ICU about the nutritional treatment of these patients.
Methods: The study, for which the approval of the ethics committee was obtained, was completed with 50 experts and assistants working in the ICUs of our hospital. The data were obtained by handing out questionnaires. In the questionnaire consisting of 28 questions, there were questions about the demographic characteristics of the participants and their knowledge and attitudes about nutrition.
Results: The mean age of the participants was 31.92±7.15 years. The demographic data of the participants, the working time, the unit they work in and the working time in the ICU are summarized in Table 1. It was determined that 64% of the participants did not receive training on nutritional support for patients in the ICU, 44% of those who had training, received it in congress / course programs and 87.5% of those who did not receive training stated that they should definitely receive training. It was observed that the nutritional status of the patients was evaluated routinely at a rate of 52%, and the frequency of benefiting from the relevant guidelines when preparing treatment protocols for clinical nutrition was also 44%. It was reported that EN (84%) was initiated in every patient with enteral feeding opportunity, and the preferred route for PN was central venous catheter (52%). It was determined that the most effective factor in the selection of the product in parenteral nutrition was the availability of the product in the hospital and the amount of calories per volume. 32% of the clinicians stated that they expect a decrease in infections, complications, hospitaliza-tion time and acceleration of wound healing with PN application. It was observed that fish oil and glutamine supplements were not provided at a rate of 38% and 36%, respectively, in patients who were given parenteral nutrition support. While clinicians reported that the most common complications in malnourished patients were weight loss, hypoalbuminemia and prolongation in recovery time (40, 39 and 39 individuals, 80-78%, respectively), it was observed that the most frequently used laboratory tests in nutritional monitoring were albumin (n: 49) and urea- creatinine (n: 30). 36% of clinicians stated that if PN is added to enteral nutrition, morbidity will decrease, 48% of them stated that they were undecided and 16% of them stated that it will not decrease mortality. 35 clinicians responded positively to giving PN to a patient who could be fed orally but could not get enough calories. It was found that trace element and vitamin supplements were frequently administered once a week (36%) to a patient who was fed parenterally. It was determined that clinicians started to be fed with 68% EN in patients who were intubated in the ICU due to the COVID-19 pandemic, and these patients often started to take vitamins C (86%) and D (64%). Following the guidelines on nutritional support it was deter-mined that it would reduce the length of stay in ICUs, contribute to the economy, and complications such as infection could be seen less frequently (43, 40 and 40 people, respectively).
Conclusion: We believe that training focused on nutrition in clinics will help clinicians improve their knowledge and use nutritional products more effectively, so that patients can be fed according to their needs.
Keywords: Nutrition in intensive care, follow-up, questionnaire
References
1. Waitzberg DL, Correia MI. Nutritional assessment in the hospitalized patient. Curr Opin Clin Nutr Metab Care 2003; 6: 531-8.2. Martínez Olmos MA, Martínez Vázquez MJ, MartínezPuga López E, del Campo Pérez V; Collaborative Group for the Study of Hospital Malnutri-
tion in Galicia (Spain). Nutritional status study of in patients in hospitals of Galicia. Eur J Clin Nutr 2005; 59: 938-46.3. Btaiche IF, Chan LN, Pleva M, Kraft MD. Critical illness, gastrointestinal complications, and medication therapy during enteral feeding in critically
ill adult patients. Nutr Clin Pract 2010;25:32-49.
Table 1. Demographic data of the participants, duty, working time in the profession, current unit and working time in intensive care (%)
% N(person)
Gender Male / Female 48 / 52 24 / 26
Your Position Assistant Dr / Specialist Dr 80 / 20 40 / 10
Working time in the profession: 0-5 years, 6-10 years, 11-15 years, 16-20 years, 21 years and over 64, 18, 10, 4, 4 32, 9, 5, 2, 2
Currently working in: Anesthesiology and Reanimation ICU, Internal / Neurology ICU, Surgery ICU, Coronary ICU, Respiratory ICU
40, 26, 14, 10, 10 20, 13, 7, 5, 5
ICU working period: 0-5 years, 6-10 years, 11-15 years, 16-20 years 84, 10, 4, 2 42, 5, 2, 1
12th KEPAN CONGRESS ABSTRACTS
S57

PS27
The Effect of Omega-3 Fat Acid, Trace Element and Vitamin Support, Which are Added to Parenteral Nutrition in Covid-19 Treatment, on Prognostic FactorsGüzin TümerOndokuz Mayıs University Health Application and Research Center, Samsun, Turkey
Objective: While complications developing with Covid-19 infection negatively affect nutritional status; the disease itself and malnu-trition cause the impairment of immune functions. Considering that Omega-3 fatty acid, trace elements, magnesium and antioxidant vitamins, which are known to have modulatory effects on the immune system, may play a role in the improvement of treatment re-sponse and prognostic factors in Covid-19 patients; we aimed to see the effect on the results in cases added to parenteral nutrition.
Methods: NRS evaluation, calorie-protein amount, additional omega3 fatty acid, trace elements, vitamin, magnesium, intubation and oxygen support time were recorded in 23 patients with a mean age of 66.5±16.6 years. While those whose clinical status have a mild course lightly consume oral diet and enretal products; nasogastric, parenteral or combined feeding therapy was used in cases where intake was insufficient or not. While 5gr omega-3 fatty acid, fat and water soluble vitamins, trace elements and magnesium were added to the parenteral and combined nutrition group1 (n=11); snack support was provided to group 2 (n=12), who consumed hospital food. D-dimer, ferritin, CRP, prothrombin time and INR blood values of both groups on the 1st and 8th days were compared. Mann-Whitney u and student t test were used.
Results: While Group1’s age was 77.3±7.4 years, NRS 3.9±0.7 points, intubation 4.8±8.9 days, oxygen support 3.2±2.8 days, protein 58.5±15gr and energy was 1377.7±289.4 kcal; these values in group 2 were 56.7±17 years, NRS 2.3±0.7 points, intubation 0.25±0.8 days, oxygen support 2.0±2 days, protein 36.6±6.7gr, 1333,3±138.7 kcal respectively. Group1’s NRS score, age and protein intake were significantly higher. In group1, while the initial prothrombin time1 (p=0.045), CRP1 (p=0.027) and d-dimer1 (p=0.027) were significantly higher; after 8 days, ferritin2 (p=0.049) and d-dimer2 (p=0.016) levels were significantly higher. Although the d-dimer level in Group 1 was not significant, it decreased more than the other group. In the 1st and 2nd measurements of the groups, only ferritin increased significantly; the decrease in d-dimer, increase in prothrombin time and INR were insignificant.
Conclusion: It was expected that d-dimer, ferritin, CRP, Ptz and INR values would change positively with special nutrition and medical treatment. However, the group with a more severe course of Covid-19 was older, nutritional status was impaired and all initial values were higher, although they received special nutritional support. In addition, the different clinical course of Covid-19 infection in dif-ferent people seems to be an important factor. In this study, similar baseline values and clinical course necesitates longer follow-up and more patient numbers.
Keywords: COVID-19, Nutrition, Omega3-Fatty Acid, Vitamin, Trace Element
PS28
Retrospective Analysis and Nutritional Status of the Patients that Stay at a Palliative Care Center Sibel Baktır Altuntaş, Başak Korkmazer, Yağmur Dündar Nacar, Hilal ÖzkayaBasaksehir Cam and Sakura City Hospital Family Practice Clinic, Palliative Care Center, İstanbul, Turkey
Objective: The patients who care in palliative care units are frequently diagnosed by malignancy and chronic neurological disease and the major indication for hospitalization, after pain, for these patients is malnutrition. This work aims to analysis nutritional status and methods of the patients that stay at our hospital’s palliative care center that was put into service on 1st of June 2020.
Methods: The diagnosis, hospitalization indications, other nutritional-related symptoms, laboratory tests and nutrion methods were analyzed retrospectively for the patients that stayed at Basaksehir Cam and Sakura City Hospital Palliative Care Center from 1st of June, 2020 to 30th of October, 2020.
Results: The patients were 44.94% (n: 40) female and 55.05% (n: 49) male, with a mean age of 67.94±13.82. Hospitalization indi-cations of the patients consisted of 53.93% (n: 48) malignancy, 43.82% chronic neurological disease (23.59% CV, 13.48% dementia, 6.74% other neurological disorders) and 2.24% (n: 2) other palliative care indications. The average length of stay of the patients was 11.91 days, which 65.16% (n: 58) were discharged home, 19.11% (n: 17) were transferred to another clinic, and 15.73% (n: 14) were mortality. When the patients were admitted to our service, 59.55% (n: 53) had pressure sores and mean Hb values were 10.71 mg/dl. 39 patients (43.82%) were on oral nutrition, 37 patients (41.57%) were on enteral nutrition, 13 patients (14.60%) were on parenteral nutrition. Minor complications (bleeding and discharge) developed in 2 of our patients with PEG, and in these cases the PEG was not required to be removed, and medical treatment was responded to.
Conclusion: The nutritional complications and mortality rates of the patients who were admitted to our service with many comorbid-ities as a recently opened to service Palliative Care Center have been determined as low.
12th KEPAN CONGRESS ABSTRACTS
S58

Keywords: Palliative Care, malnutrition, pressure ulcer
Reference
1. WHO. Palliative Care. https://www.who.int/news-room/fact-sheets/detail/palliative-care
PS29
The Prevalence of Malnutrition in Diabetic and Non-Diabetic Geriatric PatientsEyyüp Murat Efendioğlu, Ahmet Çiğiloğlu, Zeynel Abidin ÖztürkGaziantep University, Faculty of Medicine, Department of Internal Diseases, Division of Geriatrics, Gaziantep, Turkey
Objective: The elderly population is increasing both worldwide and in Turkey. Malnutrition is an important health problem in our aging world. The purpose of this study was to determine the frequency of malnutrition in diabetic and non-diabetic elderly patients presenting to our clinic.
Methods: Two hundred fifty-three patients presenting to the geriatric clinic, 143 diabetics, and 110 non-diabetic controls, were included in the study. Mini Nutrition Assessment short-form (MNA-SF) was used to determine the malnutrition prevalence of the patients. Accordingly, patients were divided into three groups in terms of nutritional status: malnutrition, risk of malnutrition, and normal. It was stated as polypharmacy that concurrent usage of five or more drugs.
Results: There was no significant difference between the groups in terms of age or sex (p>0.05). The frequency of polypharmacy was statistically significantly higher in the diabetic group (p<0.05). The results of the MNA-SF applied to evaluate the nutritional status of non-diabetic geriatric patients revealed a risk of malnutrition rate of 48.2% and a malnutrition rate of 8.2%. The risk of malnutrition among diabetic geriatric patients was 30.1%. The risk of malnutrition was significantly higher in the non-diabetic group (p=0.004).
Conclusion: The risk of malnutrition was present in close to half of the non-diabetic geriatric patients. Approximately one in three of the geriatric patients diagnosed with diabetes were at malnutrition risk. This result shows that malnutrition is associated with other diseases besides diabetes.
Keywords: Elderly, diabetes, malnutrition
Table 1. Group demographic characteristics and nutritional status of the patients
Diabetic geriatric n=143
Non-diabetic geriatric control n=110 P
Sex (Female/Male) 85/58 (59.4%/40.6%) 66/44 (60%/40%) 0.580
Age (years) 70.3±4.76 71.6±6.52 0.063
Kilo (kg) 80.19±12.14 76.1±15.08 0.042
Malnutrition-Risk of malnutrition (%) 30.1 48.2 0.004
Number of drugs used regularly (0-15) 5.30 + 2.80 3.77 + 2.70 0.000
Smoking(+) (%) 19.6 18.8 0.872
Alcohol(+) (%) 4.2 2.7 0.532
Regular exercise (%) 16.8 19 0.740*Significant at p<0.05
PS30
Effect of Early Nutritional Screening and Treatment on Malnutrition in Patients with Stomach CancerTimuçin Çil, Oğuzhan Kesen, Ahmet Ziya Bayhan, Serdar Ata, Tolga Köşeci, Mert Tohumcuoğlu, Berna BozkurtUniversity of Health Sciences, Adana Medical Faculty Adana City Education and Research Hospital-Medical Oncology Clinic, Adana, Turkey
Objective: Gastric cancer is type of cancer in which malnutrition is seen most frequently. All nutritional guidelines around the world recommend early nutritional screening and treatment for gastric cancer. We evaluated our malnutrition risk scores and malnutrition status in patients with gastric cancer diagnosis who were followed up and treated in our Medical Oncology clinic in 2020 with the malnutrition risk scores in the ONCA project, which our Medical Oncology clinic was included in between 2015-2017.
12th KEPAN CONGRESS ABSTRACTS
S59

Methods: Our gastric cancer patients’ follow-up and treatment were carried out in Adana City Training and Research Hospital-Med-ical Oncology clinic in 2020. The patients’ weight, body weight index, antrapometric measurements; The belly circumference, forearm thickness, etc., NRS 2002 scores used as one of the standard screening methods in malnutrition risk screening, fat mass and paravertebral muscle thickness and density were evaluated with the help of the tanita device. NRS 2002 malnutrition risk score values were compared with the 2015-1017 NRS 2002 risk score data of our Medical Oncology clinic included in the ONCA project. In addition, clinicopathological features and disease stages of gastric cancer were recorded.
Results: It was found that 273 patients were included in the study, and the ratio of Male / Female was 60.8% / 39.2%. It was found that the patients lost an average of 8.7 (0-28) kg weight in the last 3 months. BMI was found to be 24.5 (16.1-38.1). The average amount of fat mass measured with the Tanita device was found to be 14.2 (4.1-41.3). Abdominal circumference was measured as 90.6 (28-132) cm, and Upper Middle Arm circumference was measured as 26.8 (17-53) cm. The mean circumference was evaluated as 42.3 (25-64) cm. In addition, laboratory parameters were evaluated. Among the laboratory parameters, the average albumin value was found to be 3.07 (0.4-4.97) grams. In addition, when the NRS 2002 scores of the patients were evaluated, it was seen that 21% of the patients had 3 or more risk scores.
Conclusion: Gastric cancer is one of the most common type of malnutrition among gastrointestinal cancers. Identifying patients at risk with screening methods, detecting and treating malnutrition in the early period result in a significant prolongation in quality of life indices and survival. By regular malnutrition risk screening, determination of malnutrition status and early nutritional treatment of all patients who applied to our Medical Oncology Clinic of Adana City Training and Research Hospital and followed-up and treated, the decrease of three and above NRS 2002 scores determined as the ONCA project malnutrition risk screening approximately 3 years ago from 33% to 21% reveals the importance of early nutritional screening and treatment.
Keywords: Malnutrition, cancer, gastric cancer
References
1. Cederholm T, Barazzoni R, Austin P, et al. P. ESPEN guidelines on definitionsandterminology of clinicalnutrition. Clin Nutr 2017; 36: 49-64.2. Hebuterne X, Lemarie E, Michallet M, et al. Prevalence of malnutritionandcurrentuse of nutritionsupport in patientswithcancer. JPEN J Parenter
Enteral Nutr 2014; 38: 196-204.
PS31
Evaluation of Patients’ Nutritional Status by Different Screening Tools in Cardiac SurgeryAhmet Aydın1, Burcu Kelleci Çakır2, Aygin Bayraktar-Ekincioğlu2, Mustafa Yılmaz1
1Hacettepe University, Faculty of Medicine, Department of Cardiovascular Surgery, Ankara, Turkey
2Hacettepe University, Faculty of Pharmacy, Department of Clinical Pharmacy, Ankara, Turkey
Objective: The number of patients undergoing complex cardiosurgical procedures is increasing and malnutrition risk rises with co-morbidities. Therefore, determination of nutritional status in preoperative period becomes important in cardiac surgery (CS) due to its effect on postoperative outcomes. No specific screening tool that assessed nutritional status is available to use in patients with cardiac surgery (1). This study was aimed to compare the assessment of nutritional status of patients by the Malnutrition Universal Screening Tool (MUST) and the Nutritional Risk Screening-2002 (NRS-2002) in cardiac surgery.
Methods: This study was prospectively conducted at a university hospital, department of cardiothoracic surgery between November 2019 and March 2020. A total of 100 patients were included. Nutritional status of the patients was evaluated using the MUST (the risk categorized as high-medium and low), and the NRS-2002 (categorized as ‘nutritionally at risk’ or ‘should be monitored weekly) at the hospital admission and patients were followed until the discharge. The ethical approval has been taken from university’s inter-ventional ethical committee.
Results: 100 patients (60 male) were assessed and the median (minimum-maximum) age was 62 (19-86) years. According to the NRS-2002, malnutrition status was categorized as ‘nutritionally at risk’ in 6 (6%) patients and ‘should be monitored weekly’ in 94 patients. Whereas, 6 (6%), 8 (8%) and 86 (86%) patients were identified as in high, medium and low risk of malnutrition, respectively by using the MUST assessment. Among 14 patients who were at high and medium risk categories of the MUST, 5 (35.71%) patients had a prolonged ICU stay and 2 (14.28%) had ICU readmission. The mean (SD) number of medications at admission was 8.83±3.86 at ‘high risk’ and 8.0±3.16 ‘nutritionally at risk’ in patients according to the MUST and the NRS, respectively. It was found that 5 out 8 patients who were identified as ‘medium risk’ by the MUST was categorized as ‘should be monitored weekly’ by the NRS-2002. In addition, 3 out patients were identified as ‘high risk’ by the MUST was categorized as ‘should be monitored weekly’ by the NRS-2002.
Conclusion: Nutritional screening of patients is an essential component of pre-and post-operative periods. Although screening tools are available, such as the MUST and the NRS-2002, variations in assessments can lead misinterpretation of categorization for clini-cians. Therefore, there is a need for a validated nutritional screening tool (including anthropometric measures) for patients in cardiac surgery which enables to assess the risk and associated factors in malnutrition in this patient population.
12th KEPAN CONGRESS ABSTRACTS
S60

Keywords: Cardiac surgery, clinical pharmacy, nutritional screening tool, MUST, NRS-2002
Reference
1. Hill A, Nesterova E, Lomivorotov V, et al. Current evidence about nutrition support in cardiac surgery patients—what do we know? Nutrients 2018; 10: 597.
PS32
The Relationship between Prognosis and Nutritional Risk Score in Hospitalized Pneumonia Patients Over 65 Years OldSerhat Mert Tiril, Sema BasatUniversity of Health Sciences Ümraniye Education and Research Hospital, İstanbul, Turkey
Objective: Community acquired pneumonia (CAP) is defined as an acute infection of the pulmonary parenchyma in a patient infect-ed in the community, unlike hospital-acquired (nosocomial) pneumonia (HAP). In HAP, it is pneumonia that occurs 48 hours or more after hospitalization and is in the incubation period at the time of admission. Aspiration pneumonia is pulmonary infection caused by the ingress of stomach or oropharyngeal fluids or exogenous substances that may contain bacteria and / or have low pH. Its clinical features include cough, fever, pleuritic chest pain, shortness of breath, and sputum production. Mucopurulent sputum production is most commonly found in association with bacterial pneumonia. Nutritional Risk score is the identification score that emphasizes the importance of nutrition in this age group. This scoring has two components: a screening assessment for malnutrition and an estimate for disease severity. Malnutrition is estimated by three variables: BMI, percent final weight loss, and change in food intake. The severity of the disease ranges from zero (for those with chronic illnesses or hip fractures) to three. NRS 2002 is a very important scoring system for hospitalized patients. Our aim in this study is to examine the effects of laboratory values, CURB-65 values, NRS 2002 values on the duration of hospitalization and discharge from the hospital in patients over 65 years of age with pneumonia requiring hospitalization.
Methods: 90 patients hospitalized in Ümraniye Training and Research Hospital Internal Medicine Clinic due to pneumonia were in-cluded in our study by retrospective analysis. Patients under 65 years of age hospitalized for pneumonia were excluded. As a source, laboratory values, hospitalization and discharge periods, NRS 2002 scores were obtained from the patients’ files. In the statistical analysis, p<0.05 value was accepted as significant.
Results: 49 of the patients included in the study were male and 41 were female, and their mean age was found to be 79±7.3. When the duration of hospitalization with NRS-2002 was compared, it was 12.44 days on average in those with NRS 1, 11.25 days in those with 2 points, 13.35 days in those with 3 points, and 11.47 days in those with 4 points, no significant difference was found in this respect (p>0.05). While 60 (66.6%) of the patients were discharged, 15 (16.6%) were referred to intensive care, 15 (16.6%) died. NRS scores of the died patients were higher and a significant correlation was found between NRS 2002 score and the way of discharge from the hospital ((r: 0.512, p<0.05)). There was no significant difference between hospitalization history and duration of hospitalization (p>0.05). There was no significant difference between the acute phase reactants and the length of hospitalization of the patients (p>0.05). How-ever, a relationship was found between the acute phase reactants at admission and their exit patterns. (r: 0.506, p<0.05).
Conclusion: When the NRS-2002 scores of our patients were compared with other parameters, a significant relationship was found between referral to intensive care and death in patients with high NRS-2002 scores. It was observed that the NRS-2002 score had an effect on the duration of hospitalization and discharge, independent of hospitalization and treatment. The importance of risk scoring in terms of prognosis was supported by our study.
Keywords: NRS-2002, Pneumonia, Nutrition
PS33
Nutritional Treatment Goals in Inpatients and Awareness of Its Effect on Nutrition Status Guzin Tumer1, Sertaç Bildircin2, İrem Ülgen3, Merve Akdağ3
1Ondokuz Mayıs University Health Application and Research Center, Samsun, Turkey2Avrasya University Unit of Diet, Trabzon, Turkey3Marmara University Unit of Diet, İstanbul, Turkey
Objective: Procedures, examinations and medications during the treatment process of the inpatient, and sometimes the disease it-self prevents the fulfillment of all nutritional treatment requirements. In the following period, nutritional status worsens and response success to treatment decreases. Even with nutritional therapy, it is often not possible to reach the targets. In this study, it is aimed
12th KEPAN CONGRESS ABSTRACTS
S61

to see how much of the nutritional goals can be achieved in the inpatient, its effect on nutritional status and to raise awareness on this issue.
Methods: Weight, height, weight loss and % value, Body Mass Index (BMI), calories and protein intake of 80 adult patients receiving treatment for oncology surgery and chronic disease were recorded. NRS nutritional status was evaluated. Calories and protein to be taken were calculated, Triceps skin fold thickness (TSFT), Upper middle arm circumference (UPAC) and hand grip strength were measured. The results were evaluated statistically according to those with an NRS score of <3 and 3≤.
Results: The patients (n=80) values were found as such: age 59.9±15.6 years, height 165.2±8.4cm, weight 71.3±15.5kg, weight loss 5.2±5.6kg, weight loss 6.8±7.3%, received energy 1436.4±289kcal, target energy 2006.5±310kcal, protein taken 47.5±16.7gr, target protein 104.5±18.8gr. 26% (n=21) of the patients were diagnosed with oncology, 26% of them had (n=21) surgery, and 48% (n=38) had chronic disease. In Table 1, nutritional intake and anthropometric measurements are evaluated according to NRS <3 and 3≤. There was a significant difference between the energy intake and the targeted energy-protein in both groups and the intake was insufficient. While there was a significant difference in BMI and UPAC between the groups; It was not significant in terms of hand grip strength and TSFT. Besides, BMI and UPAC in the group with malnutrition were significantly lower; Although hand grip strength and TSFT were not significant, they were lower than the group with good nutritional status.
Conclusion: While medical treatment continues in patients hospitalized with different diagnoses, nutritional intake may be far below the targets for those with impaired and good nutritional status. If this situation is not noticed during hospitalization, it should be kept in mind that those with good nutritional status may deteriorate. Conducting anthropometric measurement and other evaluations together is important in evaluating the response to nutritional therapy.
Keywords: Nutrition, Goals, Nutrition Status
Table 1. Evaluation of nutritional intake and anthropometric measurements of the patients according to their NRS scores
NRS SCORE NRS SCORE
< 3 (n=34) P 3 ≤ (n=46) P
Received Energy (kcal) 1516.5±235 <0.001* 1377.2±313 <0.001*
Target energy (kcal) 2129.3±195 1915.9±348
Received protein (gr) 49.1±17 <0.001* 46.2±14 <0.001*
Target protein (gr) 110.8±3.8 99.9±20
BMI (kg/boy²) 27.82±5.6 24.7±5.16 <0.05*
TSFT (mm) 20.9±14.2 16.5±11.4 >0.05
UPAC (cm) 29.5±5.1 25.78±4.3 <0.05*
Hand grip strength (kg) 23.1±11.3 18.65±10.3 >0.05
PS34
Investigation of Gastrointestinal Complications in Patients with Enteral FeedingKamil Gönderen, Hilal Er Döngel, Elif Öztoprak KolKütahya Health Sciences University (KSBU) Evliya Çelebi Training and Research Hospital, Nutrition Support Unit, Kütahya, Turkey
Objective: Enteral nutrition has advantages over parenteral nutrition and is the preferred method of feeding. Because, enteral route is protects the integrity of the gastrointestinal system, supports immune functions, can prevent malnutrition, the cost-effective. In the process of enteral nutrition, some complications may occur, and these complications may often be related to the gastrointesti-nal system. This study was conducted to examine the gastrointestinal complications that develop in patients receiving enteral tube nutrition support in the hospital.
Methods: Patients fed enterally through nasogastric, nasojejunal and gastrostomy were included in the study. Data was collected retrospectively from file records. Age, sex, comorbidity, enteral feeding time, type, amount and energy value of enteral nutrition product, feeding route, infusion type and gastrointestinal complications of the patients were recorded. The data was analyzed using the SPSS. Descriptive statistics are given in number, percentage, median, minimum-maximum. The Chi-Square and Mann-Whitney U test were also used. If the “p” value is<0.05, it was considered statistically significant.
Results: The study included three hundred patients treated in intensive care (internal medicine, general, coronary, cardiovascular surgery intensive care units) and services (palliative care, internal medicine, general surgery, cardiovascular surgery services). One hundred and sixty-one (53.7%) were male, median age 71 years (66-79) one hundred and seven patients (35.7%), and two hundred and seventy six patients (92%) has comorbid disease. The most common concomitant comorbid diseases were hypertension (26.7%) and diabetes mellitus(20.7%). The median duration of total enteral feeding was 9.5 days (min-max 1-130). Two hundred thirty three
12th KEPAN CONGRESS ABSTRACTS
S62

of the patients (77.7%) were fed by nasogastric tube and one hundred fifty two (50.6%) of the patients by continuous infusion. It has been reported that gastrointestinal complications developed in 40.7% (n=122) of the patients during the enteral feeding process and the most common complications developed were diarrhea and high gastric residual volume (46.1%,25.5% respectively). None of the patients developed aspiration and ileus. When the general characteristics of the patients and their enteral nutritional status were evaluated according to the development of gastrointestinal complications, no significant relationship was found between gen-der, age group, disease status, the type of nutritional product according to energy content and complication development status. When the total number of days of feeding, the maximum nutritional product dose given in 24 hours, the route of administration of the nutritional solution, the form of infusion and the state of development of gastrointestinal complications in terms of duration of feeding were examined, it was observed that there was a significant difference between the groups (p<0.05).
Conclusion: Enteral nutrition is the first choice for all hospitalized patients. Complications that may develop should be followed up closely and tried to be prevented, when it develops, treatment should be done at an early stage.
Keywords: Enteral nutrition, gastrointestinal complications, nutritional support unit
PS35 The Effect of Nutrition on Daily Life Activities in the Elderly Ahmet Çiğiloğlu
Gaziantep University, Faculty of Medicine, Department of Geriatrics, Gaziantep, Turkey
Objective: As a result of physiological changes increase in the number of chronic diseases, gastrointestinal system pathologies, socioeconomic and psychological conditions, which develop with aging, food consumption may decrease and this may result in malnutrition. In studies conducted in our country, it is observed that 25-45% of the elderly admitted to hospitals, 20-60% of the elderly hospitalized and 30-70% of the elderly staying in institutions are at risk of malnutrition or have malnutrition (1). Malnutrition causes significant psychological, physiological, social and economic consequences and it is an independent risk factor for mortality. In conditions that increase in frequency with age, such as chronic diseases, sarcopenia, neurodegenerative diseases, increased phys-ical disability, and malnutrition, functional insufficiency may occur in individuals. Cognitive, psychological and physical destruction may also occur in individuals who become more dependent in daily life activities. There is a vicious cycle between malnutrition and functional dependence. As individuals with malnutrition become more and more dependent, increasing dependence in activities of daily living can also have a negative effect on the nutrition of individuals. In this study, it was aimed to evaluate the relationship between nutritional and functional dependencies of elderly people.
Methods: Eighty-four patients aged 65 years and over, who applied to the outpatient clinic, were included in the study. The Katz GYA Scale, Lawton & Brody EGYA, Mini-nutritional test short form (MNA-SF) and Geriatric Depression Scale (GDS-15), Standardized Mini-mental Test, Bioimpedance analysis and anthropometric measurements were performed in the patients. SPSS for Windows 22.0 software was used for the statistical analysis of the study.
Results: The average age of the individuals included in the study was 72.1±5.5 YEARS, and the rate of women was 58.3%. Mal-nutrition in 5 patients, malnutrition risk in 42 patients, and normal nutritional status in 37 patients were detected. Individuals with malnutrition / malnutrition risk were found to be more dependent on GYA and EGYA. In subgroup analyses, a decrease in MNA-SF scores in individuals without dementia was also associated with higher dependence. The mean GDS-15 score was found to be high-er in patients with malnutrition / malnutrition risk (Table 1). In the correlation analysis, a statistically significant positive correlation (p=0.000, r=0.855 and p=0.000, r=0.529) was detected between MNA-SF score and GYA and EGYA, but a statistically significant negative correlation was found between MNA-SF score and GDS-15 score (p=0.00, r=-0.358).
Conclusion: In the study conducted, the rate of patients with malnutrition / malnutrition risk is higher than in the studies in the lit-erature. This may be due to the high mean age of the patients. In the present study, the rate of malnutrition or malnutrition risk was found to be high in individuals without dementia by MNA-SF evaluation. The fact that patients with malnutrition or malnutrition risk are found to be more dependent by GYA and EGYA and the fact that this has also been shown in patients without dementia reveal the importance of nutritional evaluation and support in the elderly. As a result, due to the increase in the elderly population and the number of chronic diseases, individuals with malnutrition will be encountered more frequently in the next period. It is possible to make a comprehensive geriatric evaluation including nutritional status in the elderly, to increase the quality of life of the individuals and to ensure their functional competence with the measures that can be taken for malnutrition.
Keywords: Malnutrition, daily life activities, elderly individuals
References
1. Yuruyen M, Tevetoglu IO, Tekmen Y, Polat O, Arslan I, Okuturlar Y. Prognostic Factors and Clinical Features in Palliative Care Patients. Konuralp Tıp Dergisi 2018; 10: 74-80.
2. Katz S, Ford AB, Moskowitz RW et al. The Index of ADL: a standardized measure of biological and psychosocial function. JAMA 1963; 185: 914-9.3. Lawton MP, Brody EM. Assessment of older people: self maintaining and instrumental activities of daily living. Gerontologist 1969; 9: 179-86.4. Saka B, Özkulluk H. İç hastalıkları polikliniğine başvuran yaşlı hastalarda nutrisyonel durumun değerlendirilmesi ve malnutrisyonun diğer geriatrik
sendromlarla ilişkisi. Gulhane Tıp Dergisi 2008; 50: 151-7.
12th KEPAN CONGRESS ABSTRACTS
S63

Table 1: Distribution analysis of patients according to MNA-SF scores
Malnutrition/ Malnutrition risk Normal Nutrition Total p
Age 71.7±6.2 72.6±4.5 72.1±5.5 0.628
Gender
Female 23 (51.1%) 26 (66.7%) 49 (58.3%) 0.149
Male 22 (48.9%) 13 (33.3%) 35 (41.7%) 0.149
GYA 3.7±0.9 5.3±0.7 4.5±1.2 0.000*
EGYA 4.7±2.5 5.9±2.3 5.2±2.4 0.015*
GDS-15 4.4±4.1 3.4±3.8 3.9±3.9 0.226
Hand grip strength (kg) 27.9±10.8 30.2±13.0 29.1±12.1 0.387
TUG (sec) 12.3±6.3 12.7±7.2 12.5±6.7 0.740
SMMI 11.2±1.4 11.5±1.4 11.4±1.4 0.316
Number of used drugs 4.7±2.5 5.0±2.8 4.9±2.6 0.643
Alzheimer’s disease 12 (40%) 18 (60%) 30 0.063
PS36
Use of Nutritional Supplements in Older Parkinson’s Disease PatientsHafize Özge Görünmezoğlu1, Gizem Alaca1, Dilek Ongan2
1İzmir Katip Çelebi University, Institute of Health Sciences, Department of Geriatric Health, İzmir, Turkey2İzmir Katip Çelebi University, Faculty of Health Sciences, Department of Nutrition and Dietetics, İzmir, Turkey
Objective: Parkinson’s Disease (PD), whose prevalence increases with age, is the second most common neurodegenerative disease affecting older adults. Motor symptoms, neuropsychiatric and sleep disorders, gastrointestinal (GI) dysfunction (gastric emptying delay, constipation, bloating, defecation dysfunction) are observed in patients. GI dysfunction, pharmacological treatment, aging-re-lated physiological changes in the GI system may lead to deficiency in micronutrients in patients, studies on the use of nutritional supplements in patients with PD are still up-to-date and important. The purpose of this review is to review the literature on the use of nutritional supplements in older patients with PD.
Methods: The literature was searched using keywords; “Parkinson’s disease”, “older patients”, “nutritional supplements” in Pubmed, Science Direct, Scopus.
Results: It is seen that studies on nutritional supplements in the literature focus on probiotics, vitamin D, B group vitamins, omega-3 fatty acids, CoQ10. In terms of probiotics, brain-gut-enteric microbiota interaction and intestinal dysbiosis are at the forefront. PD patients have low levels of Prevotella, Lactobacillus, Peptostreptococcus, and Butyricicoccus spp. Increased intestinal permeability in PD is associated with alpha-synuclein accumulation. It has been observed that TLR receptors activated by accumulating alpha-sy-nuclein protein can help reduce inflammation by interacting with Lactobacillus and Bifidobacterium strains. It has been reported that consumption of fermented milk containing probiotic strains and prebiotic fibre is effective in curing constipation. It has been noted that vitamin D supplementation could potentially be therapeutic for non-motor symptoms. It has been stated that short-term, high-dose vitamin D supplementation is safe in PD without causing hypercalcemia. In PD patients diagnosed with depression, 12-week fish oil supplementation resulted in a significant reduction in depression scores in a randomized double-blind study. In another study, improvement in Unified PD Rating Scale, decrease in C-reactive protein level, and increase in total antioxidant capacity were re-ported in patients who took omega-3 fatty acids and vitamin E for 12 weeks. While low-dose niacin supplementation can accelerate anti-inflammatory processes in PD, the effects of niacin supplementation such as changes in α-synuclein levels, mitochondrial dys-function and increased intestinal permeability should be investigated further. It was emphasized that vitamin B6 levels were affected by L-dopa/Carbidopa, and vitamin B6 levels should be monitored in patients receiving high doses of L-dopa/Carbidopa. It has been suggested that vitamin B12 supplementation may be beneficial in patients using L-dopa, and it has been reported that those who use vitamin B12 + multivitamin have a lower risk of sensory symptoms than those who do not take the supplement. According to studies evaluating the effects of CoQ10, it has been concluded that CoQ10 is not superior to placebo in terms of motor symptoms, does not provide clinical benefit in slowing the disease, and does not provide symptomatic benefit in slowing functional decline.
Conclusion: More randomized controlled studies are required to make clinical decisions regarding the use of nutritional supple-ments in patients with Parkinson’s disease.
Keywords: Parkinson’s disease, food supplements, older patients
12th KEPAN CONGRESS ABSTRACTS
S64

PS37
Alzheimer’s Disease: Where is Nutrition in the Disease?Gizem Alaca1, Hafize Özge Görünmezoğlu1, Dilek Ongan2
1İzmir Katip Çelebi University, Institute of Health Sciences, Department of Geriatric Health, İzmir, Turkey2İzmir Katip Çelebi University, Faculty of Health Sciences, Department of Nutrition and Dietetics, İzmir, Turkey
Objective: While aging process plays determinant role in development of Alzheimer›s Disease (AD), genes, chronic inflammation, metabolic dysfunctions, impaired insulin signal, oxidative stress also trigger AD. Studies are being conducted on the potential effects of nutrition on these triggers. The purpose of this review is to examine the relationship between AD and nutrition.
Methods: Literature was searched with the keywords; «Alzheimer›s Disease», «nutrition», «nutrients,» «specific diets in Alzheimer›s disease,» «elderly» in Pubmed, Science Direct, Scopus.
Results: In a review examining cognitive function with DHA, linoleic acid and γ-linolenic acid; significant improvement in cognitive function was achieved in AD patients in 2 of 17 randomized, double-blind, placebo-controlled studies lasting 3 months to 5 years. In a meta-analysis, it has been shown that vitamin-mineral supplements had no effect on cognitive function and AD progression. In a randomized controlled double-blind study investigating the effect of vitamin E and selenium in preventing AD, vitamin E and seleni-um supplements were not found to be beneficial in preventing AD. Folic acid supplementation provided a decrease in inflammatory markers and mild cognitive improvement in AD patients. While supplementation of vitamins B6 and B12 had no effect in slowing cognitive decline in mild to moderate AD patients, vitamins C and E were found to have a positive effect on cognitive function. Al-though low plasma vitamin C levels were observed in AD patients, there are deficiencies in the literature regarding beneficial effect of vitamin C administration in the prevention and treatment of AD. In 119 AD patients given 50-100 mg/day resveratrol, in two sep-arate studies conducted for 52 weeks, patients showed an increase in brain volume, decrease in plasma amyloid beta and cerebro-spinal fluid. Patients who were given 150 mg/day resveratrol for 48 weeks showed improvement in cognitive and immune function. It has been shown that Mediterranean Diet increases brain volume, while poor compliance with Mediterranean Diet is associated with amyloid-and neurodegeneration, and Mediterranean Diet has positive effects on cognitive functions and AD progression. It is thought that Dietary Approaches to Stop Hypertension (DASH) diet may have a protective/slowing effect on AD progression with anti-inflammatory and antioxidant nutrients it contains. It was found that those with high Mediterranean-DASH Intervention for Neu-rodegenerative Delay (MIND) diet scores had slower cognitive function declines. In a study testing the applicability of ketogenic diet in AD patients, significant improvement was reported in Mini-Mental State Examination and Assessment Scale-Cognitive Subscale test results, which measure cognitive functions, compared to baseline. However, there is no randomized controlled study examining the effect of ketogenic diet on AD. More randomized controlled studies are needed to show whether ketogenic diet provides cog-nitive improvement in neurological diseases.
Conclusion: Randomized controlled studies with large patient groups are needed to reach more precise conclusions on the effects of both specific diets and nutrients.
Key words: Alzheimer›s Disease, nutrition, nutrients, specific diets in AD, older adults
PS38
The Relationship of Malnutrition and Anemia in Hospitalized PatientsKevser Yaman, Osman Ekinci, Ayfer DokuyucuUniversity of Health Sciences Haydarpaşa Numune Education and Research Hospital, İstanbul, Turkey
Objective: Anemia is a commonly encountered condition in our society. Anemia often accompanies malnutrition in hospitalized patients and is associated with mortality by causing adverse consequences. Anemia frequently develops in chronic diseases such as nutritional deficiency, chronic renal failure, and connective tissue diseases, which are common causes of malnutrition (1, 2). In our study, we aimed to investigate the relationship between malnutrition and development of related anemia in hospitalized patients.
Methods: 317 malnourished patients who were identified using the NRS 2000 Score for nutritional risk assessment in patients hos-pitalized at the clinics of Haydarpaşa Numune Training and Research Hospital between June and August 2020 were included in the study. By examining the hemoglobin and hematocrit levels of these patients, anemia was detected in 204 patients. Inpatients with malnutrition and associated anemia were compared according to their gender.
Results: 307 malnourished patients were included in the study. Anemia was observed in 204 (64%) patients. While there were 105 people covering 51% of women, 99 people covering 49% of men were identified. (Table 1)
Conclusion: The World Health Organization (WHO) defined anemia as hemoglobin value of <12g / dl in women and <13 dl in men. According to the National Health and Nutrition Research Study (NHANES III), anemia was found in 11% of women and men in the adult group over the age of 65 years, according to WHO criteria. Again, in the same study, when the etiology of anemia was exam-ined, anemia due to iron, vitamin B12 and folate deficiency was found in 1/3 of the cases (1). The rate of anemia in the society in
12th KEPAN CONGRESS ABSTRACTS
S65

developed countries has been found to be around 30% (2). In our study, we found that the rate of anemia in malnutrition patients was 64%, and malnutrition increased the rate of anemia approximately twice. We have concluded that the nutritional support that provides the daily macronutrients and vitamins necessary to prevent anemia should be planned and given by the nutritional support team by recording food consumption for the inpatients.
Keywords: Malnutrition, Anemia, Hemoglobin
References
1. Beghe C, Wilson A, Ershler WB. Prevalence and outcomes of anemia in geriatrics: a systematic review of the literature. Am J Med 2004; 116(Sup-pl 7A): 3-10.
2. Gaskell H, Derry S, Andrew MR, McQuay HJ. Prevalence of anaemia in older persons: systematic review BMC Geriatr 2008; 8: 1.
Table 1. The relationship between malnutrition and anemia according to the gender of hospitalized patients.
Patients with NRS > 3
Number of patients with Hb > 12 mg/dL Number of patients with Hb < 12 mg/dL
Female Male Female Male
Total patients 105 99 60 53
Percentage of patients 51.5% 48.5% 53% 47%
Total 204 113
PS39
Postpyloric Drug Administration in Enteral NutritionBurcu Kelleci Çakır1, Oğuzhan Fırat1, Yelda Uçar2, Yeter Nilgün Ölmez3, Kezban Akçay3, Fatma Tamer3, Şermin Ataç3, Meltem Halil2, Kutay Demirkan1, Osman Abbasoğlu4
1Hacettepe University, Faculty of Pharmacy, Department of Clinical Pharmacy, Ankara, Turkey2Hacettepe University, Faculty of Medicine, Department of Internal Medicine, Division of Geriatric Medicine, Ankara, Turkey3Hacettepe University Hospitals, Clinical Nutrition Unit, Ankara, Turkey4Hacettepe University, Faculty of Medicine, Department of General Surgery, Ankara, Turkey
Objective: Post-pyloric feeding refers administration of nutrients directly to the duodenum or jejunum. Appropriateness of the drugs (such as bioavailability, complications, and interactions) should be evaluated for administration through post-pyloric feeding tube. The location of distal end of the feeding tube has an important role for drug absorption due to differences in pH and osmolarity between stomach and jejunum. While a medication designed for oral use is administered directly to the jejunum; its bioavailability, gastric complaints and malabsorption may alter, therefore the expected process (dissolution in stomach and absorption from small intestine) cannot be pursued (1). This study was aimed to determine the medications that are not appropriate for post-pyloric admin-istration in patients who were followed by nutrition support team.
Methods: This study was retrospectively conducted in clinical nutrition unit of a university hospital. Patients records between January 2017 and December 2020 was evaluated. Adult patients (³18 years) with post-pyloric feeding tube were included. The appropriate-ness of drugs that administered via post-pyloric feeding tube was assessed by using the information provided by the manufacturer, scientific databases and literature. The study protocol was approved by the local Ethics Committee.
Results: Total of 2247 patients were evaluated that followed by nutrition support team during the study period and 65 (2.89%) of those were included; 36 (55.4%) of them were male, median age was 62 (range:22-91) and median follow up period was 15 days (range:7-30 days). Thirty-one patients (47.7%) had at least 1 comorbidity and 10 patients (15.4%) had feeding tube related mechani-cal complications. While patients’ 463 (28.52%) out of 1623 medications administered via feeding tube were evaluated, appropriate administration, administration without specific information and inappropriate administration were detected in 212 (45.78%), 211 (45.57%) and 40 (8.63%) medications, respectively. Most common inappropriate medications were sucralfate (25%), folic acid (7.5%) and mycophenolate mofetil (5%). Medications such as levofloxacin, rifampicin, levothyroxine, ciprofloxacin, warfarin were appropri-ate for administration through post-pyloric feeding, however nutrient-drug interactions were determined with them.
Conclusion: Almost half of the medications were appropriate for post-pyloric administration in this study. Due to retrospective de-sign of the study feeding interruption for interacting medications with nutrients couldn’t be determined. Inappropriate medication administration in patients with post-pyloric feeding tube may lead to ineffectiveness, adverse reactions or toxicity of the medication. Therefore, to provide optimal pharmaceutical and nutritional treatment together, medications should be evaluated for appropriate-ness before administration via post-pyloric feeding tube by the multidisciplinary team, including pharmacists.
Reference
1. McIntyre CM, Monk HM. Medication absorption considerations in patients with postpyloric enteral feeding tubes. Am J Health-System Pharma-cy 2014; 71: 549-56.
12th KEPAN CONGRESS ABSTRACTS
S66
PS40
Folic Acid Elevation Associated with Oral Nutritional Support Therapy in a Geriatric Patient, Case ReportCansu Atbaş, Arzu Okyar Baş, Burcu Balam Doğu, Mustafa Cankurtaran, Meltem Gülhan HalilHacettepe University, Faculty of Medicine, Department of Internal Diseases, Division of Geriatrics, Ankara, Turkey
Introduction: Malnutrition is one of the most common geriatric syndromes in the elderly population. Oral nutritional support therapy is used to prevent malnutrition. Hypernutrition and increased folic acid levels are rare but important complications of this treatment.
Case Report: An 83-year-old male patient who has middle-stage Alzheimer’s Disease, depression, hypertension, benign prostatic hy-pertrophy and urinary incontinence presented to our outpatient clinic for routine control. In his examination, daily life activity was 1/6, and instrumental daily life activity was 0/8. There was no obvious pathology on physical examination. The patient had been using oral nutritional support 4 times a day for approximately 3 years due to malnutrition. Laboratory values were blood urea nitrogen 25.4 mg/dL (8-23), creatine 0.80 mg/dL (0.67-1.17), sodium 140 mEq/L (136-146), potassium 4.41 mEq/L (3.5-5.1), calcium 9.57 mEq/L, phosphorus 2.72 mEq/L (2.5-4.5), fasting glucose 113 mEq/L (870-100), total protein 7, 02 g/dL (6.4-8.3), albumin 3.84 g/dL (3.5-5.2), total bilirubin 1.22 mg/dL (0.3-1.2), direct bilirubin 0.221 mg/dL (0-0.2), AST 17 U/L (<50), ALT 10 U/L (<50), hemoglobin 14 g/dL (13.6-17.2), leukocyte 5x10³/µL (4.3-10.3), MCV 86.8 fL (80.7-95.5), vitamin B12 303 ng (126-590), folic acid> 24.8 µg/L (3 , 1-19.9). It was noteworthy that the folic acid value was above 20 µg/L. At the patient’s examination, there were no signs of myeloproliferative disease and hepatospleno-megaly was not detected. It is understood that the patient did not receive any extra folic acid replacement therapy, but oral nutritional support therapy up to 7 times a day. The reason for excessive use was the thought that, the nutritional content was good and easily accessible. The patient’s nutritional support was recommended 3 times a day as snacks, and he was called for control one month later.
Discussion: Malnutrition is one of the important problems that can negatively affect the quality of life in the elderly population (1) and oral nutritional support therapy has an important place in the treatment armamentarium. Using oral nutritional therapy more than the recommended dose may lead to many negative consequences such as high folic acid levels like our case. One of the major negative consequences of high folic acid level is the increased risk of cancer, due to increased DNA synthesis and replication and also decreased natural killer cells against carcinogenic cells (2, 3). In one study, it was shown that the low vitamin B12 and high serum folate concentrations were associated with the increased risk of cognitive impairment in people aged 60 and over (4). Since oral nutritional supplements contain vitamin B12 along with folic acid, even in increased use, impairment in cognitive functions is not expected. Excess folic acid intake cause disturbed and decreased metabolic effects of drugs such as methotrexate in patients with rheumatological diseases or cancer, because they require higher doses for antimetabolic drugs (5). In addition to all these, there are studies showing that the high folic acid levels are associated with lower seizure threshold and hepatotoxicity (6).
Conclusion: Oral nutritional support is the most important treatment method used in malnutrition therapy. However, since excessive use may cause adverse effects due to its vitamin and electrolyte content, it should be used in appropriate doses, and patients should be called for control at regular intervals.
References
1. Katsas K, Mamalaki E, Kontogianni MD, et al. Malnutrition in older adults: Correlations with social, diet-related, and neuropsychological factors. Nutrition 2020; 71: 110640.
2. Choi SW, Mason JB. Folate status: effects on pathways of colorectal carcinogenesis. J Nutr 2002; 132: 2413S-2418S.3. Troen AM, Mitchell B, Sorensen B, et al. Unmetabolized folic acid in plasma is associated with reduced natural killer cell cytotoxicity among
postmenopausal women. J Nutr 2006; 136: 189-94.4. Selhub J, Rosenberg IH. Excessive folic acid intake and relation to adverse health outcome. Biochimie 2016; 126: 71-8.5. Arabelovic S, Sam G, Dallal GE, et al. Preliminary evidence shows that folic acid fortification of the food supply is associated with higher meth-
otrexate dosing in patients with rheumatoid arthritis. J Am Coll Nutr 2007; 26: 453-5.6. Steinweg DL, Bentley ML. Seizures following reduction in phenytoin level after orally administered folic acid. Neurology 2005; 64: 1982.
PS41
Enteral Nutrition and Persistent HiccupsSevgi KayahanAkdeniz University Hospital, Nutrition Support Unit, Antalya, Turkey
Introduction: Hiccup, known as in Latin “singultus”, is caused by the involuntary rhythmical contraction of the diaphragm. Although it sometimes seen for a short time, those that exceed 48 hours are called “persistent hiccups”. Because this recurrent condition causes reflux due to relaxation of the esophageal sphincter, it can lead to interruptions in the patient’s enteral nutrition. In this case, our aim is to share the path we followed in the hiccup symptom we encountered after gastrostomy revision.
Case: A 41 year old patient who was tetraplegic and connected to a household mechanical ventilator due to Intra-cranial mass (IKK) was admitted to an infectious diseases clinic for growth in the tracheal aspiration culture. Patient was consulted to the Clinical Nutrition Unit.
12th KEPAN CONGRESS ABSTRACTS
S67

Percutaneous Endoscopic Gastrostomy (PEG) replacement was considered due to the shortening of the outer part of the gastrostomy tube and bleeding at the entrance of the tube. As submucosal hematoma was seen at the PEG site during the procedure, it was deter-mined that the tube was in the abdomen, and it was planned to be inserted again by pulling the gastrostomy. The patient remained in the intensive care unit for 1 day after PEG replacement. The patient was transferred to the service and enteral nutrition was resumed by consulting general surgery at the day 11. The patient developed persistent hiccups exceeding 48 hours after nutrition started. The caregiver of the patient did not want to feed the patient because hiccups decreased when the feeding was stopped. According to the decision taken with the clinical physician, the patient’s nutrition was reduced to half dose and completed with peripheral parenteral nutrition. 3x10 mg domperidone was started with the recommendation of general surgery. Hiccup symptom decrased on day 4, contin-ued domperidone at a dose of 3x10 mg for 2 weeks. During this time, the peripheral parenteral nutrition that we started to complete the patient’s nutrition was discontinued. Tube feeding was gradually increased and has been reached the full dose on day 3. Patient’s treatment was completed in the infectious diseases clinic, and discharged by giving bolus nutrition training with an injector.
Conclusion: Chronic hiccups may cause disruption of nutritional support. It is unclear whether the direct effect of surgery or the anesthetic agents is causing the hiccup symptom. There are different protocols for chronic hiccups. Prokinetic agents stimulate the motility of the digestive tract. Prokinetic agents may be useful in the treatment of persistent hiccups that disrupt enteral nutrition.
Key words: Enteral Nutrition, hiccups, domperidone
References
1. Marcus O, Royl G. Singultus - Diagnostic Workup and Therapy. Laryngorhinootologie 2017; 96: 446-55. 2. Uña E, Alonso P. High dose of prokinetics for refractory hiccups after chemotherapy or the return to a simple drug. BMJ Case Rep 2013.3. Greene CL, Oh DS, Worrell SG, Hagen JA. Hiccups and gastroesophageal reflux disease as seen on high resolution esophageal manometry. Dis
Esophagus 2016; 29: 883-4.4. Steger M, Schneemann M, Fox M. Systemic review: the pathogenesis and pharmacological treatment of hiccups. Aliment Pharmacol Ther 2015;
42: 1037-50.
PS42
Patient Diagnosed with Anorexia Nervosa: A Case ReportMerve Köksal, Yasemin Baloğlu Cavbin, Melda DönertaşHealth Sciences University Samsun Education and Research Hospital, Samsun, Turkey
Introduction: Anorexia nervosa (AN) is an eating disorder (ED) characterized by weight loss, fear of gaining weight, and impairment of body perception (1). In the treatment of ED, a multidisciplinary team approach of physicians experienced in ED, psychologists and dieticians is recommended (2). The aim of study, show the effectiveness of medical nutrition therapy, nutrition education and counseling in the management for AN and raise awareness on this issue.
Case: A 14-year-old male patient was consulted to the nutrition clinic from the pediatric clinic with the note “Consulted at the request of the patient.” in 2018. In the nutritional history taken; it was learned that he was sad because he could not qualify the high school he wanted, therefore he had dropped from 68 kilos to 46 kilos in the last 4 months, he was weighed many times every day, he was sad when he gained weight, so he could not eat, felt nausea and regret when he ate. He could not go to school due to health problems. According to the 24 hours dietary recall; energy intake was calculated as 450-500 kcal/day. The patient said that he wanted to consult a dietician to start football and build muscle. When the hospital records were examined, it was learned that he was diagnosed with AN in the psychiatry clinic three months ago, but he did not use the medications prescribed by the doctor. He had 2nd degree malnutrition (weight percentile: 10-25). He had B12 and iron deficiency anemia, hypotension, and constipation. Because of the restrictive type AN, electrolyte imbalance was not detected. In the first appointment, AN disease, its medical treatment and the importance of regular psychiatric follow-up were explained. The patient was following his daily energy intake from the internet. For this reason, detailed nutrition training was given, the energy and nutritions he should take according to his age were explained. A 1200 kcal/day diet was planned considering the possibility of refeeding syndrome and the inability to tolerate a high-energy diet. It was aimed to increase the energy intake gradually. He was invited to weekly nutrition counselling sessions with food records. The desire to start football was used as a source of motivation. The case, who adapted to medication and nutrition therapy, reached the ideal weight for age (56 kg) at the end of the 2nd month and he started playing football. While playing football, he experienced chest pain and bradycardia was found in the cardiology clinic. His nutri-tional status was improving, but after 3 months he stopped taking the medications. Then his disease recurred, and his concerns about nutrition began to increase. The patient, who stopped regular follow-up, applied to our clinic again after a 2-month period. After that he continued his medical nutrition therapy and nutrition training regularly. During this period, he started hypnotherapy in addition to drug therapy. The control periods of the case in good condition were extended once a month, then every 3 months and then every 6 months. When the patient came for the last control session, it was determined that his anxiety decreased and he did not even measure his weight for a long time. It was observed that he had a adequate and balanced diet. He also returned to school.
Conclusion: In order for psychiatric approaches to be effective in AN, medical nutrition therapy should be given as well as medical treatment (3). Dieticians are among the members of the team involved in the management and treatment of ED (4). Coordinated work of the whole team will increase the success of the treatment.
12th KEPAN CONGRESS ABSTRACTS
S68

References
1. Amerikan Psikiyatri Birliği. Ruhsal Bozuklukların Tanısal ve Sayımsal Kitabı, Beşinci Baskı (DSM-5), Tanı Ölçutleri Başvuru Elkitabı. (Ertuğrul Köroğlu Çev. Ed.) Ankara: Hekimler Yayın Birliği. 2014.
2. Agency for Healthcare Research and Quality. Management and Outcomes of Binge-Eating Disorder. Comparative Effectiveness Review 2015;1-33.
3. Herpertz-Dahlmann B. Adolescent eating disorders: update on definitions, symptomatology, epidemiology, and comorbidity. Child Adolesc Psychiatr Clin N Am 2015; 24: 177-96.
4. ADA Reports: Position of the American Dietetic Association: Nutrition Intervention in the Treatment of Eating Disorders. J Am Diet Assoc 2011; 111: 1236-41.
PS43
Mad Honey… Is it Cure or Poison? Murat Ünsel1, Murat Bağcı1, Derya Tatlısuluoğlu1
1Başakşehir Çam and Sakura State Hospital, İstanbul, Turkey2Intensive Care / Anesthesiology and Reanimation Clinic
Introduction: Honey, which is produced by bees feeding with plants from Rhododendron family and which contains grayanotoxin, is known as mad honey or bitter honey in our country. After the ingestion of this honey, many symptoms, from mild digestive system irritation findings to life-threatening bradyarrhythmias, hypotension and central nervous system involvement, can be seen in humans depending on the dose (1).
Case: A 50-year-old female patient who ate 1 spoon of honey every morning was brought to the emergency department of our hos-pital with dizziness, nausea, increased saliva, vomiting and fainting due to eating 2 more spoons of honey. Her general condition was moderate, she was conscious and cooperative. She had a history of hypertension, asthma, and panic attacks. She was using amlodip-ine 5 mg. In the physical examination, the patient had a blood pressure of 78/48 mmHg and a peak heart rate (PHR) of 35 / min. and 1 mg atropine was administered twice. The patient, who had no pathology in routine biochemistry examinations, was hospitalized in our intensive care unit upon the presence of sinus bradycardia on electrocardiography (ECG). The complaints of the patient, who had a normotensive course during follow-up, were reduced. The lowest PHR was found to be 58 / min in the intensive care unit. After being followed up in the intensive care unit for 48 hours, the patient was discharged with normal blood pressure and ECG findings.
Discussion: Honey intoxication is most commonly encountered in the Eastern Black Sea region in our country. Since grayanotox-in, which is taken from Rhododendron type plants by bees, cannot be detoxified in their organisms, it directly mixes with honey and causes poisoning. Symptoms develop within hours after eating honey. Nausea, tinnitus, and hypersalivation at low doses and life-threatening cardiac complications such as atrioventricular blocks, myocardial infarction and cardiac arrest at higher doses are seen. Hypotension and bradycardia (90%) are the most common symptoms, and different degrees of heart blocks and conduction disorders can be observed (2). Atropine is beneficial in reflex hypotension, bradycardia and secretion reduction. In our case, there was a decrease in bradycardia and increased salivary secretion in the following hours with atropine administered twice.
Conclusion: Mad honey poisoning has become possible to be seen everywhere with the spread of tourism in regions where honey consumption is high or natural foods are preferred. When symptomatic bradyarrhythmias or hypotension are detected in patients presenting with dizziness, syncope, symptoms and signs of the gastrointestinal system and having no history of cardiovascular dis-ease, mad honey poisoning should also be considered in the etiology and the history should be deepened accordingly.
Keywords: Mad honey
References
1. Koca I, Koca AF. Poisoning by mad honey: a brief review. Food Chem Toxicol 2007; 45: 1315-8.2. Yilmaz O, Eser M, Sahiner A, Altintop L, Yesildag O. Hypotension, bradycardia and syncope caused by honey poisoning. Resuscitation 2006; 68:
405-8.
PS44
The Factors That Cause Hypophosphatemia in Patients Receiving Clinical Nutrition TreatmentKezban Akçay1, Hatice Ayhan2, Burcu Kelleci Çakır3, Osman Abbasoğlu4
1Hacettepe University Adult Hospital, Clinical Nutrition Unit, Ankara, Turkey2University of Health Sciences, Gülhane Faculty of Nursing, Department of Surgery, Ankara, Turkey3Hacettepe University, Faculty of Pharmacy, Department of Clinical Pharmacy, Ankara, Turkey4Hacettepe University Adult Hospital, Department of General Surgery, Ankara, Turkey
12th KEPAN CONGRESS ABSTRACTS
S69

Objective: One of the most important issues to be considered in patients who recieve nutritional therapy is the refeeding syndrome (RS) that can develop within the first four days. Hypophosphatemia (serum phosphate level<2,5mg/dL) is an early symptoms of RS. In this study, it was aimed to evaluate the rate of hypophosphatemia in different patient groups receiving nutritional therapy, to ex-amine the follow-up results of an experienced Clinical Nutrition Team, the factors that cause hypophosphatemia and to review the effectiveness of the protocols developed for RS.
Methods: In this retrospective study, patients over 18 years of age and who were followed up by the Clinical Nutrition Team between January 2018-January 2019 were included. Included 622 patients characteristics, nutritional characteristics, serum phosphate levels and the relationship between the parameters and hypophosphatemia were evaluated.
Results: Among the included 622 patient’s hypophosphatemia was observed in 11% of them. It was determined that 39(51.3%) of the patients with hypophosphatemia were male, the median age was 66 (21-95). The age (p=0.04), diet (p=0.01), surgery history (p=0.03), the status of reaching the target in parenteral nutrition(p=0.04) and the presence of additional disease (p=0.02) have a significant relationship with the development of hypophosphatemia. In multivariate regression analysis, advanced age (p=0.03 Exβ=1.01) and surgery status (p=0.009 Exβ=2) were found to increase the risk of hypophosphatemia.
Conclusion: It has been determined that there are many factors that can affect hypophosphatemia. However, beside the factors that have been already known, advanced age and surgery seems to increase the risk of hypophosphatemia, and more attention should be paid for the clinical nutrition treatment in these patients.
Keywords: Hypophosphatemia, clinical nutrition team, refeeding syndrome
PS45
A Short Bowel Syndrome Patient with Very High Stoma OutputŞukriye Taşçı Karagöl1, Aykut İçel1, Ali Güner2
1Karadeniz Technical University, Faculty of Medicine, Department of Internal Medicine, Department of General Internal Medicine, Trabzon, Turkey2Karadeniz Technical University, Faculty of Medicine, Department of General Surgery, Trabzon, Turkey
Introduction: Short bowel syndrome (SBS) can be defined as 200 cm below the functional bowel loop. Lack of absorption leads to electrolyte abnormalities, acute renal failure (ARF), and malabsorption. This condition requires special nutritional therapy and a multidisciplinary approach1-3.
Case: A 63-year-old female patient was diagnosed and operated on an ovarian tumor and colon cancer two years ago. A year ago, while undergoing chemotherapy, she was admitted to the emergency room for nausea, vomiting, weight loss, nutritional deficien-cies, and widespread body aches. The patient was followed up by the general Internal Medicine Department with diagnoses of malnutrition, nausea, and vomiting due to chemotherapy. Intestinal obstruction due to peritoneal carcinomatosis was detected in the abdominal CT taken after a complaint of ongoing vomiting. She was transferred to the Department of General Surgery. A Loop jejunostomy operation was performed on the patient whose peritoneal carcinomatosis was considered unresectable. The patient had a small bowel segment of about 50 cm left. Diphenoxylate + atropine treatment was started after the operation and the patient was discharged. The patient was admitted to the emergency department after ten days of operation due to excessive fluid loss from jejunostomy and deterioration in her general condition. It was determined that the patient had about 20-22 Lt/day stomal output. A patient with a creatinine value of 5.57 mg/dl was put on dialysis for three sessions due to metabolic alkalosis and was interned to the Internal Medicine Department with the diagnoses of ARF, metabolic alkalosis, high output stomata (HOS), electrolyte imbalance, and nutritional disorders. In physical examination: Blood pressure: 90/60 mm/Hg, Heart rate: 90 beats/min; she was cachectic and had a decreased skin turgor. Abdominal examination was normal. The patient had ileostomy in the lower right quadrant of the abdomen and jejunostomy in the upper left quadrant. She also had cholecystectomy, inguinal hernia, TAH+BSO operation incision scars. Glucose: 101 mg/dl, creatinin: 5,57 mg/dl, BUN: 55 mg/dl, sodium: 129mEq/L, magnesium: 1.68mg/L, potassium: 3.9 mEq/L, albumin: 28.8 g/L, prealbumin: 0.16 g/L, Ph: 7,602, PCO2: 50,5 mmHg, PO2: 81,2 mmHg, HCO3: 49,1 mmol/L, uric acid: 11,3 mg/dl, ALT: 87 U/L, AST: 67 U/L, ALP: 138 U/L, total bilirubin: 2,64 mg/dl, CRP: 21,4 mg/L, WBC: 9010 µL, hemoglobin: 11,3 g/dl, platelet: 237000 µL was dedected in laboratory tests. The hospitalized patient’s oral intake was stopped. Micro-and macro-nutritional therapy was arranged intravenously. 25-30 kcal/kg energy support, 1,2-1,5 g/kg protein support was provided daily. Loperamide, famotidine, and pantopra-zole treatment were initiated. During follow-up, there was a stomatal output above 20 L/day. The fluid replacement was performed using balanced solutions. It was investigated whether the HOS would be due to a different reason. Carcinoid tumor, gastrinoma, VIPoma, and adrenal insufficiency were examined. The results were within normal limits. In the follow-up, the patient’s stomal output decreased to 4-5 L/day, and creatinine level decreased 0,7 mg/dl. Her metabolic parameters have returned to normal limits. HOS was linked to jejunostomy condition. She was discharged by making arrangements for the treatment of parenteral nutrition.
Conclusion: HOS is not an unexpected situation at SBS. Stomal output volume exceeding 2000 mL/day is a predisposing factor in terms of complications (1, 4). 49% of HOS improves spontaneously in the early period after ileostomy but 51% of HOS patients need treatment that requires close follow-up (1, 2, 5). In a patient with such a short intestine, fluid-electrolyte imbalance and nutritional dis-orders can be expected. But our patient differs in that the stomatal output is much higher than expected ten days after the operation.
12th KEPAN CONGRESS ABSTRACTS
S70

Keywords: Short bowel syndrome, high output stoma, acute renal failure
References
1. Arenas Villafranca JJ, López-Rodríguez C, Abilés J, Rivera R, Adán NG, Navarro PU. Protocol for the detection and nutritional management of high-output stomas. Nutr J 2015; 14: 1-7.
2. Lee YJ, Kweon M, Park M. Nutritional Management of a Patient with a High-Output Stoma after Extensive Small Bowel Resection to Treat Crohn’s Disease. Clin Nutr Res 2019; 8: 247.
3. Matarese LE, Jeppesen PB, O’Keefe SJD. Short bowel syndrome in adults: the need for an interdisciplinary approach and coordinated care. JPEN J Parenter Enteral Nutr 2014; 38: 60S-64S.
4. Nightingale J, Woodward JM. Guidelines for the management of patients with a short bowel. Gut 2006; 55(Suppl 4): 1-12. 5. Baker ML, Williams RN, Nightingale JMD. Causes and management of a high-output stoma. Color Dis 2011; 13: 191-7.
PS46
Clinical Symptoms and Management of Buried Bumper Syndrome in Patients with Percutaneous Endoscopic Gastrostomy Tube: With CasesGüldan Kahveci1, Selma Dağcı21University of Health Sciences Ümraniye Education and Research Hospital, İstanbul, Turkey2İstanbul Provincial Directorate of Health, Department of Medical Services, Unit of Specialized Services, İstanbul, Turkey
Percutaneous endoscopic gastrostomy is the process of placing the tube into the stomach to deliver enteral nutrition directly to the gastrointestinal system in patients who cannot eat orally and whose gastrointestinal system is dysfunctional. Percutaneous endo-scopic gastrostomy tube is usually the preferred route for patients requiring long-term nutritional support. While the rate of major complications due to percutaneous endoscopic gastrostomy tube is 1-4%, the minor complication rate is 8-30%. Minor complications due to percutaneous endoscopic gastrostomy are seen three times more than major complications. One of the major complications of the percutaneous endoscopic gastrostomy tube, buried bumper syndrome, is the condition in which the inner support (bumper, plate) of percutaneous endoscopic gastrostomy tube moves from the gastrostomy canal in the stomach and abdominal wall towards the neighbor and places in any area. Complications such as gastrointestinal bleeding, perforation, peritonitis, intra-abdominal and abdominal wall abscess may occur due to buried bumper syndrome, and these complications can lead to fatal consequences. The incidence of buried bumper syndrome is estimated to be about 1%. The very tight outer and inner plates of the gastrostomy tube are considered to be the main etiological factor leading to buried bumper syndrome. Diagnosis is established by endoscopic or transabdominal ultrasound. The most important preventive measure is the adequate positioning of the plate and the rotation of the plate clockwise for 360 degrees during maintenance. In this article, buried bumper syndrome was discussed with cases, and the unknowns and prevention strategies of buried bumper syndrome were reviewed with the results of the literature.
Keywords: Buried bumper syndrome, percutaneous endoscopic gastrostomy, enteral nutrition, care
12th KEPAN CONGRESS ABSTRACTS
S71