13. agricultural economics, marketing and statistics
TRANSCRIPT
104
13. Agricultural Economics, Marketing and Statistics
Indian agriculture have witnessed many changes since the period of economic reforms. The outcome of changes in policies, world trade environment, transfer of technology and information, rational input use and climate change impacted the agricultural and allied enterprises significantly. Indian Council of Agricultural Research has conducted a number of studies to document the impact of these externalities.
From slowdown to fast track: Indian agriculture since mid 1990's
Indian agriculture faced several challenges for a couple of years after implementation of the WTO agreement on agriculture in year 1995, primarily due to a sharp fall in prices of agricultural commodities. It led to perceptible deceleration in agricultural growth.
Trend growth rate in output of various sub sectors of agriculture (%)
Sub sector 1987-88 to 1995-96 2003-04 1995-96 2003-04 2011-12
Crop sector 2.97 1.87 3.28
Livestock 4.10 3.43 4.84
Fruits and vegetables 4.29 3.79 5.33
Fishery sector 7.22 3.02 4.48
A downward growth trajectory (annual growth rate 1.92%) during 1996-97 to 2003--04 was revived during 2004-05 and 2012-13 (3.75%).
Higher growth rate was recorded in most of the sectors, viz. crop sector (3.3%), fruits and vegetables (5.3%), livestock (4.8%) and fisheries (4.5%). The rate of growth in the recent decade has been historical in most cases.
A number of factors, including higher use of inputs like fertilizer and quality seed, expansion of irrigation and increase in agricultural investments supported by public sector capital formation, substantial increase in the supply of institutional credit to agriculture, and initiatives like National Food Security Mission (NFSM), Rastriya Krishi Vikas Yojna (RKVY) and Bringing Green Revolution in Estern India (BGREI) and other missions and programmes helped improve growth rate. Increase in real prices of agricultural commodities also played role in broad based acceleration of the growth rate.
Fertilizer imbalance in India The actual fertilizer use in various states was
compared with the recommended level of N, P and K, and the imbalance in fertilizer use was estimated. Relevance of prevalent norms of 4 : 2 : 1 for N, P and K was looked into and fresh estimates of optimal mix
Comparison of normative and actual ratio of NPK use in India (2009-2011)
States Actual ratio Normative ratio
N P K N P K
Andhra Pradesh 4.41 2.28 1.00 2.40 1.43 1.00 Asom 1.94 0.73 1.00 1.77 1.28 1.00 Bihar 6.79 1.95 1.00 2.81 1.50 1.00 Chhattisgarh 5.27 2.72 1.00 2.39 1.43 1.00 Gujarat 6.89 2.78 1.00 2.73 0.99 1.00 Haryana 19.55 6.87 1.00 3.99 1.67 1.00 Himachal Pradesh 3.00 1.02 1.00 2.48 1.29 1.00 Jharkhand 7.20 3.31 1.00 1.99 1.20 1.00 Jammu and Kashmir 6.16 2.72 1.00 3.26 1.96 1.00 Karnataka 2.60 1.69 1.00 1.60 1.01 1.00 Kerala 1.28 0.66 1.00 0.65 0.47 1.00 Madhya Pradesh 8.90 6.14 1.00 2.41 2.63 1.00 Maharashtra 2.87 1.91 1.00 2.67 1.80 1.00 Odisha 3.79 1.88 1.00 1.78 1.01 1.00 Punjab 21.20 6.48 1.00 4.05 1.60 1.00 Rajasthan 25.08 11.18 1.00 10.30 5.72 1.00 Tamil Nadu 2.16 0.95 1.00 2.26 0.91 1.00 Uttarakhand 10.24 2.63 1.00 3.18 1.47 1.00 Uttar Pradesh 11.14 3.88 1.00 2.96 1.32 1.00 West Bengal 1.98 1.29 1.00 1.85 1.00 1.00 Others 4.01 1.70 1.00 1.55 1.12 1.00 All India 5.04 2.35 1.00 2.55 1.42 1.00
DARE/leAR ANNUAL REPORT 2014-15

AGRICULTURAL ECONOMICS, MARKETING AND STATISTICS
of various nutrients were prepared. Among the Indian states imbalance needs are to be addressed in Punjab, West Bengal, Haryana, Gujarat, Bihar and Asom. The actual use of NPK nutrients showed wide deviations from the state specific normative quantities. The optimal ratio of NPK use for India was found to be 2.55 : 1.42 : 1. The existing fertilizer use norm of 4 : 2 : 1 cannot be generalized for the country, however, it was closer to the normative ratio for Punjab and Haryana. While in Andhra Pradesh and Tamil N adu all the nutrients are used in excess. The huge deficits in the use of fertilizer nutrients and the imbalance in fertilizer application in terms of relative use of the NPK nutrients need immediate attention of the policy makers.
Trends in total factor productivity (TFP) in Indian agriculture TFP, the measure of an economy's long-term
technological dynamism, is important indicator of sustainability of growth process. TFP growth indicates technical progress, which represents shifts in the production function over time. TFP growth has experienced large variation over time and it was negative
1.5 --------------.~-----lt_-----
0.5 -4-----~----+---------'v_---
·1 ~ __________________________________ ~ I
Average annual TFP using moving base year
for some period after mid-1980s. TFP growth accelerated sharply during the initial period of economic reforms and followed a downward trend after mid-1990s. TFP in Indian agriculture has been rising at a faster rate after the mid-2000s. TFP growth moved in tandem with the growth in agricultural output. The rising trend in TFP growth after 2004--05 suggested that the recent growth in agriculture is accompanied with improved technology and efficiency and is thus sustainable.
Impacts of climate change on Indian agriculture Impacts of climate change on aggregate productivity
of Indian agriculture were estimated using district level
data for the period 1969-2005. A 1°C rise in rabi temperature reduces gross revenue per hectare by 4.0%, and a similar increase in kharif season reduces it by 5.4%. Irrigation reduces harmful effects of warmer climate on the agricultural productivity by 21% in rabi season and 17% in kharif season. The marginal effect of increase in seasonal rainfall (by 1 mm) is positive, but is much smaller than the effect of temperature, implying that climate change in India will influence agriculture largely through changes in temperature. Across agro-climatic regions, marginal effects of weather variables vary in their magnitude as well as direction. Arid-semi-arid tropical region is most vulnerable to climate change. The damages due to rise in temperature are partially offset by irrigation.
Climate impact was simulated using seasonal changes in the surface air temperature and rainfall as predicted by IPCC (2007) for the South Asia and for 2070-99 under two climate change scenarios; one with a high future greenhouse gas emission trajectory (AIF1) and, another with the lowest future emission trajectory (Bl). By 2100 the damages would increase to 25% in A1Fl and 13% in BI. Without adaptation (irrigation) losses would be higher. The impacts are not uniform across regions. By 2100, with significant changes in climate (A1Fl), losses in the gross revenue per hectare in the arid-semi-arid tropics are projected close to one-third of the output. If the changes in climate are slow (B 1), losses will be reduced to about half. The semi-arid temperate and humid regions, in contrast, will be less impacted by the climate change because of better availability of irrigation.
Impact of information on returns from farming Since the period of economic reforms, India's agri
food system has undergone several changes on both supply and demand side, making agriculture knowledgeand information-intensive. Information helped farmers to sustain farm productivity as well as comply with market preferences.
Approximately 28% farm households in India use information on modem crop technologies and practices. The farmers at the bottom of social hierarchy use fewer information sources and depend more on informal social networks and input dealers for their information needs. More number of the upper caste households (35%) use information as compared to the scheduled castes (23%) and scheduled tribes (20%).
Users of information realize 12% higher net returns
Effect of 1°C rise in temperature and 1 mm increase in rainfall on agricultural productivity
All India Humid Semi-arid temperate Arid-Semi-arid tropics
Without With Without With Without With Without With irrigation irrigation irrigation irrigation irrigation irrigation irrigation irrigation
Rabi temperature -3.95 -3.13 -3.7 -3.11 -2.178 -1.94 -3.68 -2.76
Kharif temperature -5.45 -4.52 1.59 1.56 1.38 1.16 -8.83 -7.49
Rabi rainfall 0.019 0.025 -0.003 -0.001 0.015 0.017 0.043 0.048
Kharif rainfall 0.018 0.018 0.009 0.009 0.005 0.006 0.025 0.024
DARE/ICAR ANNUAL REPORT 2014-15 105
106
AGRICULTURAL ECONOMICS, MARKETING AND STATISTICS
~ 1,140lha at 2002-03 prices) over non-users; and the impact is significantly higher (17%) for the farm households growing cash crops along with foodgrains than for those who grow only foodgrains. This is much higher than the expenditure of f 29/ha on public extension services and f 157lha on the research and education. However, the investment in public extension has not kept pace with the rising demand for information in agriculture driven by increasing diversification and expanding market for safe and quality products. Therefore, investment on agricultural research and development has considerable potential for enhancing agricultural productivity and reducing poverty.
Changing paltern of employment in rural India The process of occupational diversification of rural
households was understood by comparing their employment profile in 2011-12 with that in 2004-05. A significant shift was observed in employment from farm to non-farm sectors. The share of crop husbandry in total rural employment declined from 75% in 2004-05 to 56% in 2011-12. The decline was much faster in animal husbandry and other farm activities. On the other hand, the share of rural non-farm sector improved to 57% in 2011-12 from 39% in 2004-05. These findings indicated a transformation of rural economy away from farm to non-farm sectors. To a certain extent, these changes can be attributed to increased employment opportunities generated in the off-farm as well as nonfarm sectors through the employment guarantee scheme MGNREGA that was launched in 2006. This augurs well for agricultural development, especially when employment pressure on agriculture continues to be very high.
Changes in employment (usual status) by sectors in rural India
Sector
Crops Livestock Other farm Non-farm
Employment participation Change % rate (%)
2004-05 2011-12
75.0 8.6 1.9
39.5
56.0 4.0 1.3
57.1
STATISTICS
-25.3 -53.5 -31.6 44.6
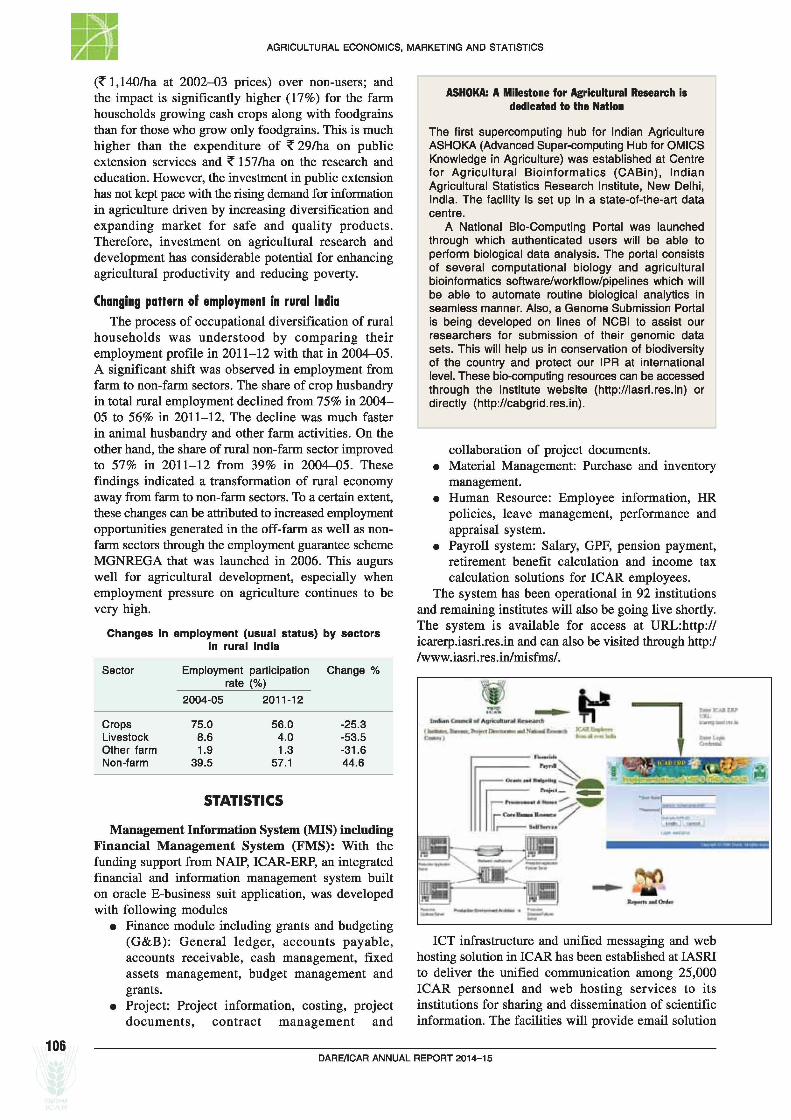
Management Information System (MIS) including Financial Management System (FMS): With the funding support from NAIP, ICAR-ERP, an integrated financial and information management system built on oracle E-business suit application, was developed with following modules
• Finance module including grants and budgeting (G&B): General ledger, accounts payable, accounts receivable, cash management, fixed assets management, budget management and grants.
• Project: Project information, costing, project documents, contract management and
ASHOKA: A Milestone for Agricultural Research is dedicated to the Nation
The first supercomputing hub for Indian Agriculture ASHOKA (Advanced Super-computing Hub for OMICS Knowledge in Agriculture) was established at Centre for Agricultural Bioinformatics (CABin), Indian Agricultural Statistics Research Institute, New Delhi, India. The facility is set up in a state-of-the-art data centre.
A National Bio-Computing Portal was launched through which authenticated users will be able to perform biological data analysis. The portal consists of several computational biology and agricultural bioinformatics software/workflow/pipelines which will be able to automate routine biological analytics in seamless manner. Also, a Genome Submission Portal is being developed on lines of NCBI to assist our researchers for submission of their genomic data sets. This will help us in conservation of biodiversity of the country and protect our IPR at international level. These bio-computing resources can be accessed through the institute website (http://iasri.res.in) or directly (http://cabgrid.res.in).
collaboration of project documents. • Material Management: Purchase and inventory
management. • Human Resource: Employee information, HR
policies, leave management, performance and appraisal system.
• Payroll system: Salary, GPF, pension payment, retirement benefit calculation and income tax calculation solutions for ICAR employees.
The system has been operational in 92 institutions and remaining institutes will also be going live shortly. The system is available for access at URL:http:// icarerp.iasri.res.in and can also be visited through http:/ /www.iasri.res.inimisfms/.
ICT infrastructure and unified messaging and web hosting solution in ICAR has been established at IASRI to deliver the unified communication among 25,000 ICAR personnel and web hosting services to its institutions for sharing and dissemination of scientific information. The facilities will provide email solution
DARE/ICAR ANNUAL REPORT 2014-15

AGRICULTURAL ECONOMICS, MARKETING AND STATISTICS
for all employees of ICAR with features of unified messaging at desktop of users with "icar.gov.in" domain. Data Center meets the specifications of ISO 27001, ITIL and TIA 942 standards.
Indian NARS statistical computing portal: The portal (http://staLiasri.res.in/sscnarsportal) was strengthened for providing service oriented computing to Indian NARS users, by adding the modules of cross over designs and estimation of genetic variancecovariance from block designs. With these 2 new additions, now 24 analysis modules are available on this portal. The total hits to the portal are 197,816 since 1 April 2011, which amounts to more than 100 hits per day. Based on the user logged information, the total number of logged in users from Indian NARS are 24,926 since March 2012. Indian NARS statistical computing portal (both content and software) are copyrighted.
Row-column designs for factorial experiments in two rows: In a row-column design set up, because of practical considerations, it may not be possible to accommodate more than two experimental units in a column. The experimenter may, however, be interested in orthogonal estimation of all the main effects and two factor interactions. To deal with such situations, a general method of construction of row-column designs with two rows for orthogonal estimation of main effects and two factor interactions in factorial experiments in minimum number of runs was provided for orthogonal parameterization. Here in all the designs main effects and two factor interactions are estimated orthogonally.
In case of designs for 2-colour micro-array experiments, where null state or baseline may exist, the experimenter would be interested in baseline parameterization rather than orthogonal parameterization. To deal with such situations, a general procedure of obtaining efficient w-optimal row-column designs in two rows for n-factors mixed level factorial experiments based on baseline parameterization was also developed. An equation was obtained to calculate the number of columns required to make a row column design w-optimal.
FIGARCH model in the presence of long memory in volatility: The Geweke and Porter-Hudak (GPH) test for testing long memory to the raw and squared returns of the spot prices of gram was applied. For the (raw) return series, the test shows no evidence of long memory patterns as the null hypothesis of no persistence is not rejected. The result for squared return is different from that of the returns. Indeed, long memory property is highly significant for the squared returns. Since squared returns are a good proxy for volatility, the findings thus suggested that conditional volatility of return would tend to be range-dependent, persistent and decaying slowly. Intuitively, this volatility persistence can be appropriately modeled by a FIG ARCH (Fractionally integrated generalized autoregressive conditional heteroscedastic) process because it allows for long memory behavior and slow decay of the impact of a volatility shock. This FIGARCH
model, was applied for forecasting the volatility of gram price. The evaluation of forecasting was carried out with mean squares prediction error (MSPE), mean absolute prediction error (MAPE) and relative mean absolute prediction error (RMAPE). The residuals of the fitted models were used for diagnostic checking.
Experimental designs for polycross trials: A practical application of the polycross method is in production of a synthetic variety resulting from crosspollinated plants. Laying out these experiments in appropriate designs, known as polycross designs, would save experimental resources and gather more information from the experiment. Different situations may arise in polycross nurseries where accordingly different polycross designs may be used. For situations in which some genotypes interfere in the growth or production of other genotypes due to different maturity or plant height, but have to be grown together, neighbour restricted design is a better option. Two classes of polycross designs, one for blocked situation and another for row-column situation, are obtained. Two series of polycross designs were constructed ensuring the reduction of self occurrence in the nearest neighbourhood for situations wherein genotypes are planted in a small area without leaving much space between rows.
A catalogue of the algorithms behind the construction methods along with layouts was prepared to enhance the application potential of these designs. Further, SAS macros were developed for generation of polycross designs. The 'webPD' software was developed for online generation and cataloguing of polycross designs, facilitating enhanced utilization of these designs globally.
Locus minimization in breed prediction using Artificial Neural Network approach: Use of Artificial Neural Network (ANN) to decrease the cost of genotyping by locus minimization was applied in the breed identification server for goat (http:// nabg.iasri.res.inlbisgoat). The machine learning (artificial neural networks) approach for breed identification was demonstrated which has multi-fold advantage like locus minimization leading to drastic reduction in cost, web availability of reference breed data obviating the need of repeated genotyping each time while investigation of an unknown breed for its identity. To develop this model web implementation based on ANN, 51,850 allelic data of micro satellite marker based DNA fingerprinting on 25 loci covering 22 registered goat breeds of India were used for training. While minimizing locus up to 9 loci by Multi-Layer Perceptron, 96.63% training accuracy was observed. This server can be an indispensable tool for existing breeds and new synthetic commercial breeds' identification, leading to their intellectual property protection in case of sovereignty and bio-piracy disputes. This server can be widely used as a model for cost reduction by locus minimization of various other flora and fauna for varietylbreedlline identification, especially in conservation and improvement programmes.
o
DARE/ICAR ANNUAL REPORT 2014-15 107