13. supplementary notes 14. abstract number … · program element number 6. author(s) ... 3.7.3...
TRANSCRIPT

REPORT DOCUMENTATION PAGE Form Approved
OMB No. 0704-0188
The public reporting burden for this collection of information is estimated to average 1 hour per response, including the time for reviewing instructions, searching existing data sources, gathering and maintaining the data needed, and completing and reviewing the collection of information. Send comments regarding this burden estimate or any other aspect of this collection of information, including suggestions for reducing the burden, to Department of Defense, Washington Headquarters Services, Directorate for Information Operatiors and Reports (0704-0188), 1215 Jefferson Davis Highway, Suite 1204, Arlington, VA 22202-4302. Respondents should be aware that notwithstanding any othe- provision of law, no person shall be subject to any penalty for failing to comply with a collection of information if it does not display a currently valid OMB control number. PLEASE DO NOT RETURN YOUR FORM TO THE ABOVE ADDRESS.
1. REPORT DATE (DD-MM-YYYY)
03/31/2014
2. REPORT TYPE
Final Technical Report 3. DATES COVERED (From - To)
01/01/2011-12/31/2013 4. TITLE AND SUBTITLE
Mitigation of Corrosion of 5xxx Series Al-Mg Alloys in Marine Environments: Grain Boundary Engineering and Cold Spray Coating Approaches
5a. CONTRACT NUMBER
5b. GRANT NUMBER
N00014-11-1-0326 5c. PROGRAM ELEMENT NUMBER
6. AUTHOR(S)
Sridharan, Kumar (PI), Allen, Todd R. (Former PI), Yang, Young-Ki Benjamin R., Hauch, Benjamin J.
Maier, Sd. PROJECT NUMBER
11PR04641-00 5e. TASK NUMBER
5f. WORK UNIT NUMBER
7. PERFORMING ORGANIZATION NAME(S) AND ADDRESS(ES)
University of Wisconsin, Department of Engineering Physics 1500 Engineering Drive Madison, Wl 53706
8. PERFORMING ORGANIZATION REPORT NUMBER
9. SPONSORING/MONITORING AGENCY NAME{S) AND ADDRESS(ES)
Office of Naval Research 875 North Randolph Street Arlington, VA 22203-1995
10. SPONSOR/MONITOR'S ACRONYM(S)
ONR
11. SPONSOR/MONITOR'S REPORT NUMBER(S)
12. DISTRIBUTION/AVAILABILITY STATEMENT
Approved for Public Release: distribution is Unlimited
13. SUPPLEMENTARY NOTES
14. ABSTRACT
Corrosion mitigation of 5xxx series was investigated using two distinct experimental approaches. The first method was applying thermal and mechanical treatments to aluminum alloy (AA) 5083 resulting in improvements in both the mechanical strength and corrosion resistance as measured with the nitric acid metal loss test (NAMLT). The second approach was the deposition of AA5083 and pure zinc coatings to protect the underlying AA5083 substrate. Coatings were characterized qualitatively with scanning electron microscopy and quantitatively with hardness and adhesion testing. Corrosion behavior of coatings was studied using potentiodynamic scans, NAMLT and exposure in a salt-spray chamber. 15. SUBJECT TERMS
Corrosion, 5xxx Series Aluminum Alloys, Thermo-Mechanical Treatments (TMT), Cold Spray Deposition, Coatings
16. SECURITY CLASSIFICATION OF:
a. REPORT
u
b. ABSTRACT c. THIS PAGE
u u
17. LIMITATION OF ABSTRACT
uu
18. NUMBER OF PAGES
70
19a. NAME OF RESPONSIBLE PERSON
Kumar Sridharan 19b. TELEPHONE NUMBER (Include area code)
608-263-4789
Standard Form 298 (Rev. 8/9S) Prescribed by ANSI Std. 239.18
WISCONSIN UNIVERSITY OF WISCONSIN-MADISON
Mitigation of Corrosion in 5xxx Series Al-Mg Alloys in Marine Environments: Grain Boundary Engineering and
Cold Spray Coating Approaches
Researchers: Dr. Kumar Sridharan, FASM1'2 (Distinguished Research Professor, current PI) Dr. Todd Allen1'2 (Professor, former PI) Dr. Young-Ki Yang1 (Postdoctoral researcher)
Students: Mr. Ben Metier1 (Graduate Research Assistant, M.S. Candidate Engineering Physics) Mr. Ben Hauch' (Research Assistant) Mr. DJ Devan2 (Undergraduate Assistant) Mr. Tom Vanasse2 (Undergraduate Assistant) Mr. Greg Johnson (Undergraduate Assistant) Mr. Elliot Busta2 (Undergraduate Assistant)
University of Wisconsin - Madison, Department of Nuclear Engineering and Engineering Physics (NEEP), 1500 EngineeringDr, Madison, WI53706
2 University of Wisconsin - Madison, Department of Materials Science and Engineering (MSE), 1509 Engineering Dr, Madison, WI 53 706
Date: March 26th, 2014
Approved for Public Release; Distribution is Unlimited
ONRAward#:N00014-ll-l-0326 (01/01/2011-12/31/2013)
^0l5cy\nMA^

Table of Contents
Executive Summary iv
1. Inter-granular corrosion susceptibility and thermo-mechanical treatments 1
2 Experimental — thermo-mechanical treatments 2.1 Research materials for thermo-mechanical treatments (TMT) 2 2.2 Quantification of 1GC susceptibility 3 2.3 Microstructure characterization 4 2.4 Naming convention for samples 5 2.5 Material preparation and method for solvus determination 5
3 Results - thermo-mechanical treatments 3.1 Degree of sensitizationofAA5083-Hl 16 sensitized at 100oC 7 3.2 Mass loss dependence on orientation 7 3.3 Phase identification in AA5083-H131 8
3.3.1 Si-rich phase 8 3.3.2 Mn-rich dispersoid 10 3.3.3 Fe-rich phases 12 3.3.5 P-phase 14
3.4 p -phase Characterization of as-received AA5059 15 3.5 Measurement of solvus of AA5083 16 3.6 Measurement of solvus of AA5059 17 3.7 Improvement in sensitization resistance
3.7.1 Effect of thermal treatment on IG 18 3.7.2 Effect of thermal treatment with ECAP on JGC 19 3.7.3 Effect of thermal treatment with cold rolling on IGC 20
4 Cold spray deposition for corrosion mitigation 22
5 Experimental - cold spray deposition 5.1 Materials for cold spray deposition 23 5.2 Analysis of deposited coatings 25 5.3 Effect of particle size on AA5083 deposition 25 5.4 Adhesion testing of samples 26 5.5 Corrosion testing of AA5083 and zinc coatings 26
6 Implementation of cold spray system at University of Wisconsin-Madison 6.1 Procurement of equipment for cold spray deposition 27 6.2 Safety consultation with Facilities and Planning Management (FPM) 29 6.3 Installation of the equipment and user training 30
7 Cold spray deposition of pure Al and AA5083 7.1 Initial cold spray deposition of Al 31 7.2 Initial investigations on the deposition behavior of AA5083 33 7.3 Development of improved AA5083 coatings 35 7.4 Dimensional restoration with AA5083 coatings 40 7.5 Deposition on previously sensitized AA5083-H116 substrate 42 7.6 Effect of particle size on AA5083 deposition behavior 42 7.7 Adhesion testing of deposited A A5083 coatings 45 7.8 Cold spray deposited zinc coatings 46

8 Corrosion testing of cold spray deposited coatings 8.1 Nitric acid metal loss testing of A A5083 coatings 47 8.2 Potentiodynamic testing of coatings in synthetic sea-water 52 8.3 Metallographic analysis of AA5083 54 8.4 Salt-spray testing of cold spray coatings 59
9. Conclusions 63
9. References 63
in

Executive Summary
5xxx series aluminum alloys (AA) are used widely in the Navy because they possess an excellent balance of required properties such as strength, corrosion resistance, weldability, and formability. However, in these alloys precipitation of Al3Mg2 or the p-phase occurs at the grain boundaries during prolonged exposures. In a sea-water environment the p-phase anodically dissolves due to galvanic coupling between the matrix and P-phase. Generally in Al-Mg alloys, the electrochemical potential of the Al3Mg2 (P) phase is electronegative (-1 ISOITIVSCE) compared with the solid solution (-790mVSCE, for Al- 5wt. %Mg solid solution). There has been general agreement that this electrochemical factor plays a critical role in stress corrosion cracking (SCC) in the presence of tensile stresses, although the exact mechanism is still not fully understood. This research was aimed at achieving two goals. One is to develop a better understanding of corrosion behavior of high Mg-content 5xxx series aluminum alloys for marine applications and eventually arrive at approaches to mitigate p formation along grain boundaries thus improving corrosion properties of the alloy. The second goal was to effectively protect and/or repair the alloy that has already undergone limited SCC by applying cold spray process to deposit coatings of AA5083 or pure zinc - this would be a low-temperature alternative to the currently used welding processes.
The microstructure of as-received 5083-H131 was evaluated in detail. Seven types of secondary phases were identified in a consistent manner using scanning electron microscopy (SEM) and energy dispersive spectroscopy (EDS), to better understand their effects on p-phase formation. Four Fe-rich phases, one Mn-rich, one Si-rich, and p-phase were identified. It was shown that the alloy already contained a noticeable amount of p-phase in the as-processed condition though it has long been believed that commercial 5083 alloy is nearly completely Mg-solutionized. The solvus temperature of 5083, an important starting point for inter-granular corrosion (1GC) research in the given alloy system, was experimentally determined to be 2880C adopting both bottom-up and top-down metallographic examination approaches. These same approaches were applied to AA5059, a newer alloy, and the previously unreported solvus temperature in this alloy was found to be 310oC. A considerable improvement of IGC resistance of AA5083-H131 was achieved based on these results. For example, under the same sensitization conditions, the nitric acid metal loss test (NAMLT) showed a mass loss reduction of over 87% after a simple annealing treatment. Based on these improvements, a high strength marine grade Al-Mg alloy was developed with cold rolling. 5083-H131 samples were annealed at 2310C/6h, quenched, annealed at 180oC/lh, and finally cold rolled to 20% of the original thickness, which resulted in a 19% and 7% increase in yield and ultimate tensile strength, respectively, and 75% increase in elongation before failure.
Cold spray deposition of AA5083 and zinc coatings was investigated with the goal of using this approach to repair 5xxx series AA that have undergone limited IGC and SCC. For AA5083 coatings, two particle size ranges - 5-20|^m and 20-44|im - were investigated to understand the effect of particle size on coating deposition behavior and coating structure. SEM and hardness testing qualitatively showed that the 5-20um particle size powder deposited more effectively. Further characterization revealed that coatings deposited with the 5-20nm powder, using helium pre-heated to 400oC as the propellant gas, had the best densification and adherence to the 5083-H116 substrate than those deposited with nitrogen pre-heated to 400oC or 500oC, as confirmed with ASTM C633 adhesion testing. Corrosion testing of the optimized coatings included a one-sided NAMLT procedure and potentiodynamic corrosion tests in synthetic sea- water to compare the as-deposited and sensitized coating corrosion behavior with as-received and sensitized 5083-H116 substrates. The attack depths for all conditions were quantified by sectional examinations after corrosion tests. Pure zinc coatings were deposited as sacrificial anode coatings to protect the underlying 5083 substrate. Potentiodynamic corrosion tests revealed the zinc coatings to be much more electronegative with respect to any of the 5083 coating or substrate conditions. Salt-spray corrosion tests performed at NSWC-CARDEROCK (West Bethesda, MD) showed that zinc coatings corroded aggressively compared to the 5083 samples (coated and uncoated), and qualitative analysis indicated that corrosion was limited to the surface of the samples and did not propagate along the coating- substrate interface.
iv

Page Intentionally
Left Blank
1. Inter-granular corrosion susceptibility and thermo-mechanical treatments
5xxx series aluminum alloys including aluminum alloy (AA) 5083 are important materials for marine applications. They have excellent corrosion properties in the marine environment but are also susceptible to inter-granular corrosion (1GC) when exposed to elevated temperatures for sufficient periods of time. P-phase formation along grain boundaries, particularly in a rather continuous manner, has been attributed as a primary cause of this IGC in 5xxx series aluminum alloys. Therefore, the crux of the question is how to effectively delay or eliminate such p formation along grain boundaries. There have been two major approaches to answer to this question. One is development of new alloys, which are more resistant to IGC. Although this has been a long-standing topic, the downside of this method usually arises due to difficulty in fulfilling balanced properties. Improving one property often results in degradation of many other properties dramatically and simultaneously. The other method is to alter the production process with a pre-developed alloy to further fine-tune its properties. Process modifications can be controlled more readily to improve only a few target properties of interest while minimizing the undesirable effects on the inherent favorable bulk properties. The latter approach has been adopted in this research to improve IGC resistance utilizing pre-existing materials.
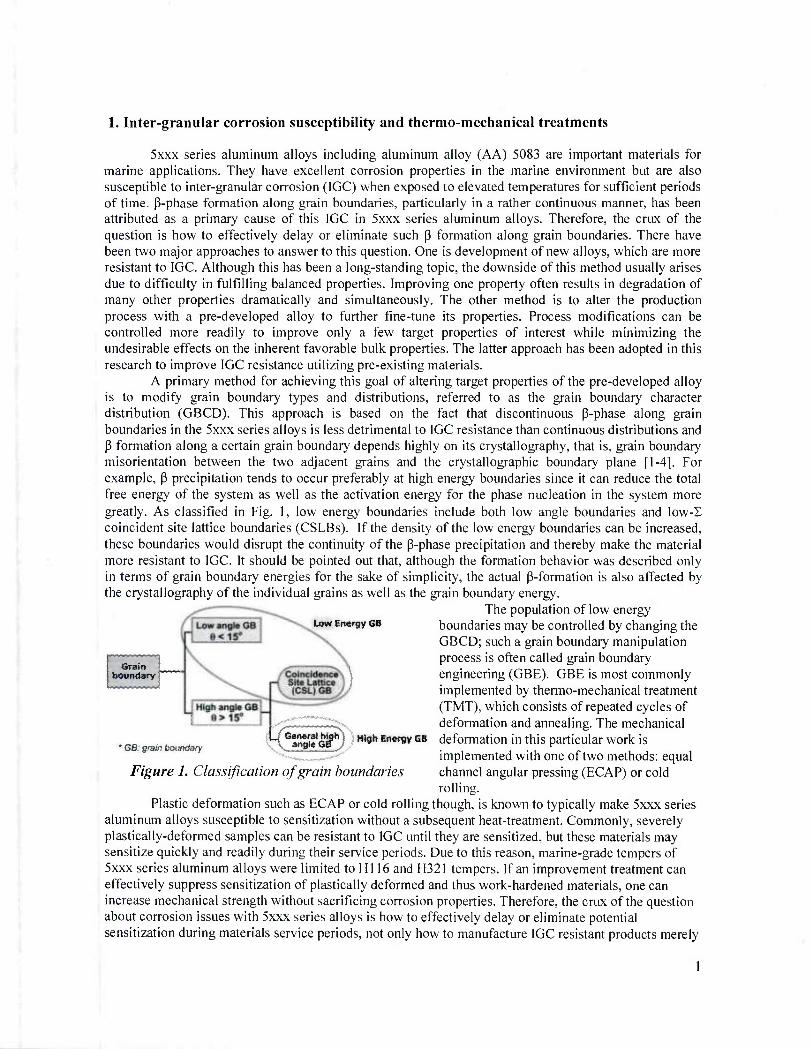
A primary method for achieving this goal of altering target properties of the pre-developed alloy is to modify grain boundary types and distributions, referred to as the grain boundary character distribution (GBCD). This approach is based on the fact that discontinuous (3-phase along grain boundaries in the 5xxx series alloys is less detrimental to IGC resistance than continuous distributions and P formation along a certain grain boundary depends highly on its crystallography, that is, grain boundary misorientation between the two adjacent grains and the crystallographic boundary plane [1-4]. For example, p precipitation tends to occur preferably at high energy boundaries since it can reduce the total free energy of the system as well as the activation energy for the phase nucleation in the system more greatly. As classified in Fig. 1, low energy boundaries include both low angle boundaries and low-E coincident site lattice boundaries (CSLBs). If the density of the low energy boundaries can be increased, these boundaries would disrupt the continuity of the P-phase precipitation and thereby make the material more resistant to IGC. It should be pointed out that, although the formation behavior was described only in terms of grain boundary energies for the sake of simplicity, the actual p-formation is also affected by the crystallography of the individual grains as well as the grain boundary energy.
The population of low energy Low Energy GB boundaries may be controlled by changing the
GBCD; such a grain boundary manipulation process is often called grain boundary engineering (GBE). GBE is most commonly implemented by thermo-mechanical treatment (TMT), which consists of repeated cycles of deformation and annealing. The mechanical
Higit Energy GB deformation in this particular work is implemented with one of two methods: equal channel angular pressing (ECAP) or cold rolling.
Plastic deformation such as ECAP or cold rolling though, is known to typically make 5xxx series aluminum alloys susceptible to sensitization without a subsequent heat-treatment. Commonly, severely plastically-deformed samples can be resistant to IGC until they are sensitized, but these materials may sensitize quickly and readily during their service periods. Due to this reason, marine-grade tempers of 5xxx series aluminum alloys were limited to HI 16 and H321 tempers. If an improvement treatment can effectively suppress sensitization of plastically deformed and thus work-hardened materials, one can increase mechanical strength without sacrificing corrosion properties. Therefore, the crux of the question about corrosion issues with 5xxx series alloys is how to effectively delay or eliminate potential sensitization during materials service periods, not only how to manufacture IGC resistant products merely
Grain boundary f
* G6' grain boundary /General high i
CSarigteGB J
Figure 1. Classification of grain boundaries
1

at the stage of manufacturing. A GBE approach combined with other thermo-mechanica! treatments is the topic of the first approach to mitigate corrosion of 5xxx series aluminum alloys and provide an increase in the mechanical strength.
One of the keys to this first approach is to determine the minimum temperature at which the P-phase will dissolve into the matrix, p-phase is the reason 5xxx series are susceptible to stress corrosion cracking and material designated for marine environments must be P-free upon initial service. The solvus temperature provides a base temperature that TMT samples must be exposed to after mechanical processing to both relieve stress while solutionizing any p-phase. The p solvus temperature in alloy 5083 was first determined experimentally as 289.5 ± 1.50C in this research [5]. This solvus temperature determination is also important in other, newer 5xxx series alloys. Since the unique experimental method developed was applied to AA5083, it can also be utilized to determine a P solvus temperature in a new promising marine aluminum alloy 5059.
It is well known that increasing Mg content is an effective method to increase the strength of Al-Mg alloys due to the solution hardening effect. Such inherent strength, without heat-treatment or cold working, is of special importance for the structures fabricated with welding since most welding processes usually nullify the strength previously gained by such means. Therefore, from the strength viewpoint, high Mg-content (above 4.5%) Al-Mg alloys are an attractive idea in the aluminum alloy industry. Relatively recently, in 1999, the aluminum manufacturer Corns Aluminum (now Aleris International Inc) in Koblenz, Germany, registered the aluminum base Alloy 5059 (brand name Alustar) with the American Aluminum Association. The 5059 alloy contains greater amounts of Mg (nominal concentration of 5.5% Mg) than 5083 as well as some additions of Zn and Zr. This alloy provides significant improvements in strength over the traditional 5083 alloy. It is claimed by Corus that the 5059 alloy provides improvements in minimum mechanical properties over alloy 5083. These improvements are referenced as being a 26% increase in yield strength before welding and a 28% increase in yield strength (with respect to Alloy 5083) after welding of H32I/H116 temper plates of AA5059 (Alustar alloy) [6].
On the other hand, it is also well known that the higher Mg-content alloy is the more susceptible to the inter-granular forms of corrosion. Nonetheless, it is claimed that the IGC susceptibility in the alloy 5059 is mitigated by adding Zn, which creates Mg-Zn-containing components within the grains to balance the differences in chemical potentials along with proper thermo-mechanical treatment [7]. However, recent studies found the AA5059 to be more susceptible to IGC than AA5083 due to easier formation of grain boundary decorating p phase [8, 9].
Since IGC is highly correlated to formation of p phase and its morphology, it is essential to develop a better understanding of p formation behavior in Al-Mg alloys. Such understanding may help discover a solution to mitigate p formation along grain boundaries, and thus improve corrosion properties in high Mg-content 5xxx series aluminum alloys for marine applications. The formation of the p phase is dependent upon the solvus, which is a line in a binary system or surface in a ternary system on a phase diagram that separates a homogeneous solid solution of a aluminum from a field of a and p, or perhaps more phases in a commercial 5059 alloy. Once the composition is fixed, this solvus line or surface frequently becomes a solvus temperature point in the temperature/composition space although it isn't necessarily one single point from a thermodynamics viewpoint. The solvus temperature at a particular composition in an alloy is the critical point where P phase can form or dissolve in thermodynamic equilibrium. It seems quite clear, therefore, that the reliable solvus temperature is an important starting point for IGC research in 5xxx series alloys.
2. Experimental -thermo-mechanical treatments
2. 1 - Research materials for thermo-mechanical treatments (TMT)
AA5083-H13I and AA5083-HI16 were used for this research. All compositions quoted in this report are given in weight percent. These alloys were thermo-mechanically processed, artificially
sensitized, and then NAMLT tested to evaluate improvement in IGC resistance. During this period of research, two different artificial sensitization temperatures have been implemented: 120°C and 100°C.
Commercial AA5083-H131 and AA5083-H116 were used for this research. AA5083-H131 was manufactured in the form of a 58mm (-2.25") thick plate and donated by Alcoa. This material was the sole material used for the ECAP-based studies. Samples for ECAP were cut with electrical discharge machining (EDM). AA5083-Hn6 was a commercial aluminum alloy 5083 plate (6.4 mm or -1/4" thickness) with a HI 16 temper procured from Aluminum Distributing, Inc. Tables 1 and 2 show these two alloys' actual chemical composition, while Table 3 lists the chemical composition limits of AA5083 in accordance with ASTM B928/B928M-09 standard [10].
Table 1. Chemical composition of as-received AA5083-H131 (wt.%). Composition Si Fe Cu Mn Mg Cr Zn Ti Pb V Al
AA5083-H131 .10 .22 .05 .7 4.4 .08 .02 .02 .001 .009 Balance
Table 2. Chemical composition of as-received AA5083-H116 (wt. %). Composition Si Fe Cu Mn Mg Cr Zn Ti Pb Bi Al
AA5083-H116 .080 .160 .031 .500 4.355 .070 .002 .013 .000 .000 Balance
Table 3. Chemical composition limits [ASTM B928/B928M-09].
c- r n *A iv/. n -, -r- Other elements Composition Si Fe Cu Mn Mg Cr Zn Ti ^ , ,. , Each Total
Al
AA5083-H131 .40 .40 .10 .40-1.0 4.0-4.9 .05-.25 .25 .15 .05 .15 Remainder
* Limits are in weight percent maximum unless shown as a range or stated otherwise.
Two different types of mechanical deformation process for thermo-mechanical treatments were employed: ECAP and cold rolling. ECAP is performed using a tensile tester to push an aluminum billet through a right-angled-channel tool steel die. The alternate and more practical method for deformation was cold rolling. Cold rolling was performed with a manual rolling mill with total reduction up to about 40% in the most extreme case.
2.2 - Quantification of IGC susceptibility
The susceptibility to IGC of AA5083-H131 and -HI 16 alloys of various samples was quantitatively evaluated using the nitric acid mass loss test (NAMLT) as described in the ASTM G67-04 standard [11]. The major testing procedure of NAMLT consists of sample immersion in nitric acid for 24 hours and measurement of mass loss of the samples per unit surface area.
It should be emphasized that the ASTM standard screening test, in general, can only ensure that materials at the time of their testing are not sensitized. Therefore, this standard is not intended to predict resistance to sensitization in the future over a long period of service. However, if the test material is a 5xxx series aluminum alloy which is either H116 or H321 tempered, the long-term resistance to sensitization is, in fact, taken into account implicitly, by limiting the degree of work hardening in accordance with the specifications in ASTM B928-B928M-09.
According to ASTM G 67-04 NAMLT and ASTM B928-B928M-09, specimens should be prepared following the geometric requirement: "Prepare specimens with dimensions 50 mm by 6 mm (2 in. by 0.25 in.) by product thickness. The 50-mm dimension shall be parallel to the longitudinal direction (rolling direction) of the product. If the thickness of the product is greater than 25 mm (1 in.), reduce it by one half or to 25 mm, whichever is less, while retaining one original as-fabricated surface."

As-fabricated rotted t TD-RD surface
'm3¥£r^m*' \MtSSSSM '""^te!i™"■,,,
S SQxSxSmm
Cold rolling
Figure 2. Varying sample cutting geometry for NAMLT testing. Note that all tested samples are about 5mm in thickness.
Most samples in this report were prepared in accordance with this rule, while other specimens were cut differently due to the geometric limitation of as-fabricated material. As-received samples with no further thermo-mechanical treatment were reduced to the same thickness as the processed samples while retaining one original as-fabricated surface. Fig. 2 shows the different cutting geometry for NAMLT testing in the case of as-received 5083-H131. The type A is standard cutting (50mm long along the rolling direction, 6mm wide, and 25mm tall) in accordance with the ASTM B928. The type B is named as "ECAP" sample dimensions here-in-after and its dimensions are 6.4mm long along the rolling direction, 6.4mm wide, and 58mm tall. Type C is named as "cold rolled"' sample dimensions for NAMLT testing, of which nominal/target dimensions after cold rolling are 58mm long along the rolling direction, 6mm wide, and 6.4mm tali.
The mass loss of a sample depends highly on its cut geometry with respect to the as-rolled surface. Therefore, samples produced through different processing were prepared with great caution, considering simply changing sample dimensions from identical initial material could lead to profound differences in final mass loss. More heavily rolled materials tend to lose the more mass from the same size of their ND-TD and ND-RD surfaces. Therefore, the as-received sample is expected to lose less mass compared with those cold rolled samples shown in Fig. 2, if everything else is the same. This means that, if cold rolled samples show less mass loss compared with the as-received sample, this improvement in sensitization resistance is a genuine improvement rather than a simple experimental delusion. Therefore, all final samples possess NAMLT dimensions similar to one another as shown in Fig. 2. This sample geometry can minimize sample orientation effect on mass loss.
2.3 - Micro structure characterization
Samples' microstructures were investigated using SEM with the aid of the newly developed etching solution by the University of Wisconsin team. This new etching solution for Al-Mg alloys is ammonium persulfate, (NH4)2S208, dissolved in de-ionized water. The unique feature of this etching solution is the ability to clearly reveal nearly all of the features while preserving their integrity. The exact composition used for metallographic etching in this report was lOg of A.C.S. reagent grade ammonium persulfate (98+%) dissolved in 100ml of de-ionized water at room temperature. All etched samples in this report were prepared for metallographic examination using this ammonium persulfate solution at room temperature. This concentration worked well for the application discussed here, although it can vary. It should be pointed out that a fresh solution is recommended as the aqueous ammonium persulfate solution decomposes as time goes on due to air exposure [12]. The experience during this research suggests, however, that this degradation does not significantly affect the etching quality.
The length of etching time for samples is specified in each image when presented. Most etched samples used in this first approach were etched for less than 30 minutes. About 20ml of the solution was used for each etching, although the etching quality was not affected in a sensitive manner by the amount of etching solution used. The samples were simply submerged in the solution with their polished surface face up. A sample surface can sometimes have air bubbles on it, which are created when the sample is dipped in the solution or the solution is poured on the sample in a beaker. Removing these air pockets is recommended for uniform etching. This can be readily achieved by shaking the solution container and
■

thus the solution, or by degasing using an ultrasonic cleaner for just a few seconds. Once the sample surface becomes completely wet, no additional actions are necessary until the end of the etching process. However, occasional ultrasonic cleanings for a few seconds during etching can greatly help remove inclusions that are commonly introduced during a prior polishing process. Finally the etched samples were rinsed with running tap water for about 30 seconds and then dried using compressed air followed by warm air. This additional warm air drying process is applied to prevent water condensation from ambient air on the sample surface, which results from a cooled sample surface due to prior cold tap water rinsing.
Imaging for the TMT method was conducted utilizing a LEO 1530 field-emission scanning electron microscope (SEM). All SEM images were obtained using an in-lens secondary electron detector, unless otherwise specified. Qualitative chemical analysis was performed using standardless energy- dispersive X-ray spectroscopy (EDS) to identify some of phases metallographically discemable.
2.4 - Naming convention for samples
Since many different types of samples are used in this research, it is necessary to create a system for naming samples and processing conditions to organize and refer to those samples more effectively. A naming convention was established considering all the different parameters involved with different samples, including sensitization and material processing. This convention is summarized in Fig. 3. The naming convention separates samples into two primary groups, "Plain" for samples which do not undergo artificial sensitization and "Sensitized" for those that do. In addition to classifying samples into one of these two groups, any additional treatment a sample undergoes can be identified by its label. For example, a sample that has been annealed and then sensitized would be labeled as a Sensitized-ANN sample, and such a process condition would be referred to as the Sensitized-ANN condition. Note that some of the sample types in this table are not used in the present report.
Sample Description
Plain-AR
Plain-SO
Plain-ECAP/CR
Plain-ANN
Plain-TMT
Plain-TMT-R
Sensitized-AR
Sensitized-SO
Sensitized-ECAP/CR
Sensitized-ANN
Sensitized-TMT
Sensitized-TMT-R
As-received
As-received 4 Soiutionized
As-recefved 4 l™^'
As-received 4 Annealed
As-received 4 1™™J
As-received 4 Annealed
As-received mmmmmmmmmmm
4 Annealed
A ECAPEed or T Cold-rolled
As-received ^ Soiutionized ■
As-received 4 ^,AdP
r|^
As-received 4 Annealed
As-received 4 l^l^J * Ann8a,ed
As-received 4 Annealed ECAPEed or Cold-rolled
Figure 3. Naming convention for samples based on sensitization and processing conditions.
2.5 - Material preparation and method for solvus determination
Metallographic examination was performed to find out the (3 solvus temperature in aluminum alloy 5083 and 5059. The AA5083 from Alcoa described above was used for this work. In addition, a

commercial wrought aluminum alloy 5059 in an HI36 temper was used. This 31mm thick plate was manufactured by Aleris International Inc. and purchased in the marketplace. Table 4 shows the actual chemical composition of the alloy used.
Table 4. Chemical composition of as-received AA5059 (wt.%).
Composition Si Fe Cu Mn Mg Cr Zn Ti Zr Al
AA5059- H136
071 093 .008 ,793 5.264 .006 .505 .023 .122 Balance
Before heat-treating samples at various temperatures and time periods to observe the formation or dissolution of p phase, they were prepared into two different sets of either an as-manufactured or a solution heat-treated condition. This solution heat-treatment was carried out at 320oC for 100 hours with subsequent quench in water. Both sets of samples were then isothermally heat-treated at different temperatures to find out at what temperatures p phase precipitates or dissolves.
All of the samples used for solvus determination were polished down using 0.04|am particle size colloidal silica and subsequently etched before microstructure examination using SEM. All of these samples were etched with a newly developed solution for etching most aluminum alloys by the present authors [13], which is ammonium persulfate (NH^SaOg solution. The specific concentration of the solution used in this work was 10 g of the persulfate in 100 mL of de-ionized water at room temperature. Etching times for all samples was 25 minutes. Metallographic examination to determine the existence of (3 phase was conducted utilizing a LEO 1530 field-emission SEM. All SEM images used for solvus determination were obtained using the in-lens secondary electron detector, p phase was identified based on the observation of Yang et al [13], where P-phase manifests itself as distinctive cratered (or sponge- like three-dimensionally) appearance.
To determine the solvus temperature, a metallographic method was adopted, a common method for phase equilibrium studies. However, the adoption of this method for determining the p solvus temperature in 5xxx series alloys has never been possible. The salient points of the metallographic method used in the current study are a direct visualization of P phase and the use of SEM instead of transmission electron microscopy (TEM), both of which make it possible to perform in-depth microstructure analysis with sufficient statistical accuracy. This accomplishment was achieved with the aid of the aforementioned newly developed etching solution. This etching solution has allowed for the use of SEM to visualize p phase directly down to a minimum scale of about 5 nanometers (normally tens of nanometers). When p phase occurred larger than 50 nm in diameter in particular, it was identified as a distinctive cratered or sponge-like appearance with proper polishing and etching using the new etching solution, more details of which can be found elsewhere [13].
In material systems, true thermodynamic equilibrium conditions are rarely attainable within a reasonable length of time. For more accurate determination of phase boundaries in the phase diagram, experiments need to be conducted from two directions; high-to-low temperature (top-down approach) and low-to-high temperature (bottom-up approach) isothermal heat- treatments at different temperatures. This can confine limits, between which the true equilibrium occurs. To determine the actual solvus temperature of the aluminum alloys, the solutionized or as-received aluminum
bottom-up top-down
Figure 4. Two metallographic experimental approaches to determine ft solvus temperature in a more accurate manner: (left) bottom-up, and (right) top-down heat-treatment approaches.

alloy samples were heat-treated using the two-directional isothermal treatments as schematically illustrated in Fig. 4.
In the bottom-up experimental approach, as-manufactured samples were used for isothermal heat treatment. As discussed in the previous section, it will be shown that the as-received material already contained an easily noticeable amount of p phase. Therefore, if this material is isothermally annealed at higher temperature than the p solvus of 5059 and 5083, this phase is expected to dissolve completely in the thermodynamic equilibrium state.
On the other hand, the top-down experiments used 5059 and 5083 solutionized at 320oC for 100 hours and quenched, where Mg in the material was completely solutionized and supersaturated at room temperature. In this case, if this solution heat-treated, and thus P-free, material is isothermally annealed at lower temperature than the p solvus, p phase emerges again. Therefore the top-down experiments determine the lower limit of the solvus, while the bottom-up experiments determine the upper limit of the solvus. It should be noted that the investigated area for each sample was chosen to be larger than 400.000 |im for better statistics of microstructure analysis when concluding that p phase didn't occur in a given sample.
3. Results - thermo-mechanical treatments
3.1 - Degree of sensitization ofAA5083-H116 sensitized at 100 V
70
60
sampte dimensions: JO x 6.4 (thkknessj * 6mm sensiiized at 100C
30-d
50 - E 9
E 40
I o -J ■ I IS 5
30 -
20 -
Thorough sensitization data over long periods of time with a short time gap between samples has not been available. To investigate the effects of long-term sensitization time on mass loss with the AA5083-H116, therefore, samples were sensitized at 100°C for up to 107 days mostly with a short interval of about 7 days. Samples were machined to ASTM standard specifications for NAMLT testing; about 6mm (width) x 50mm (length in rolling direction) x 6mm (thickness same as as- manufactured sheet thickness).
The test data for samples for samples up to 107 days at 100°C is compiled in Fig. 5. This graph shows the relation between sensitization time and NAMLT results for AA5083-HI16. It shows a monotonous increase in mass loss with increasing sensitization time until about 30 days of sensitization, at which the mass loss plateaus, it should be also noted that the mass loss of AA5083-H131 after sensitization at 120oC showed similar monotonous sensitization behavior.
10 -
7.2-4
li AR 10 20 30 40 50 60 70 80 90 100 110
Sensitization Time [day]
Figure 5. Mass loss in samples after NAMLT ranging from as-received to sensitized for 107 days; sensitization (JOO'CJ.
3.2 - Mass loss dependence on orientation
Previously, the mass loss dependence on orientation was determined using samples of both 5083- H131 and -H116 that had been sensitized at 120°C /300hr and 100°C /30 days respectively. Since the previous investigation, an additional orientation dependence study has been conducted on samples that had been sensitized at 100°C for 7.2 days. The method for determining the mass loss dependence on orientation in samples sensitized at 100°C for 7.2 days was the same as that used for the previous samples sensitized at 100°C for 30 days. This new work was done because after being sensitized at 100°C for 30

days, sample NAMLT mass loss reached a plateau, while 7.2 days of sensitization was within the regime in which mass loss was increasing with respect to increased sensitization duration. Determining the mass loss dependence on orientation in this regime could help elucidate the behavior of the orientation dependence: whether it is consistent across varying degrees of sensitization or if it exhibits a more complicated nature in which the individual planes respond differently depending on duration of sensitization.
The results are summarized in Fig. 6. From these results, it can be inferred that the orientation dependence remains fairly consistent through various degrees of sensitization. The way in which mass loss monotonously increased with respect to increased sensitization time also suggests that no significant change occurred in the mass loss behavior of the samples as a whole, which lends credence to the idea that the mass loss associated with each individual plane did not drastically change over the course of sensitization either.
13.0%
■'TD-RO%
10.6%,/%
50.2%
\
46.4%
ND-TD
Figure 6. Contribution to total mass loss from each plane ofAA5083-H116: (left) new samples sensitized at 100'C/7.2 days, and (right) previous samples sensitized at WO'C/SO days.
3.3 - Phase identification in AA5083-H131
For a more effective examination of microstructure in Al-Mg alloys using SEM instead of TEM, a new etching solution was developed in the previous research period; dissolved ammonium persulfate in water. In the previous report in particular, p-phase was able to be directly visualized. Additional metallographic phase identification results are presented in this report. It has been reported that AA5083 can contain various second phases within it [14]. They may be categorized into five different groups: Si- rich phase, Mn-rich dispersoid, Fe-rich phase, P-phase, and other minor phases. Phase identification for the first four groups is addressed below. Most of these phases are metallographically discernible in a clear and consistent manner with the aid of this etchant. In particular, four Fe-rich phases are metallographically discernable for the first time with SEM.
3.3.1 - Si-rich phase
Commercial 5xxx alloys commonly contain a Si-rich phase, magnesium silicide (Mg2Si). Due to the very low solubility of Mg2Si in aluminum at high Mg contents, it is often present in the microstructure as a major constituent phase in commercial 5xxx alloys [15]. This Si-bearing phase is readily identifiable under SEM and optical microscopy observation of AA5083, because it manifests itself as dark particles with a distinctive appearance, even without etching with ammonium persulfate solution. Revealing this Si-rich phase is usually not a challenge. The usefulness of the new etching solution with regard to microstructural examination of the Si-rich phase does not lie in the mere capability to expose it, but lies in the clear presentation of the phase without interfering with observation of other phases. In this section, the typical appearances of magnesium silicide in AA5083 are demonstrated. In addition, the issue of

occasional misinterpretation on the chemical analysis results with respect to the Si-rich phase in 5xxx alloys is also addressed.
Fig. 7 shows the microstructure of an as-received AA5083-H131 sample. Two images taken from the same area, one in the SE2 mode, Fig. 7(a), and another in the inlens mode. Fig. 7(b), are presented to demonstrate how the material can be imaged differently using different imaging modes. The dark particles in Fig. 7(a) and their counterparts in Fig. 7(b) are rich in Si, as confirmed with EDS analysis in Fig. 8. All white particles in Fig. 7(a) are Fe-rich, which can be readily confirmed by EDS analysis. In Fig. 7(b), however, the same particles appear to be grey since they were imaged in the inlens mode with a short working distance (4.4mm, in this particular case). These Fe-rich particles are also discussed later.
«-matrix * (b)
~
30nm
Figure 7. SEM images SEM images of as-received AA5083-H131: taken in (a) the SE2 mode, (b) the inlens mode; no sensitization; etching time: 2 hours.
It was observed that under low magnification, the Si-rich particles appeared dark regardless of whether using SEM or OM with/without etching. Under higher magnification with SEM, however, a difference among the dark phases shown in Fig. 7(a) becomes apparent; some of the dark phases become more electrically charged than the others giving them a brighter appearance and causing more image deflection. Fig. 8(a) shows such Si-rich particles, where some particles are highly electrically charged
Figure 8. EDS elemental mapping of TMT and subsequently artificially sensitized AA5083: fa) SEM image, and (b) corresponding EDS maps of four elements: Annealing: 265 °C/6hr; sensitization: 120 °C/30hr: etching time: 10 minutes: acceleration voltage for EDS: 7kV. The color black in each elemental map indicates zero concentration.
while others are not. Using EDS, it is confirmed that these two types of phases are in fact of different compositions as shown in Fig. 8(b). Brighter and thus more electrically charged particles clearly contain

much less, if any, Mg. On the other hand. Si is abundant in all of these particles. The big particles in Fig. 8 also contain O. The experience of this research has been that the majority of Si-rich particles can be recognized as Si-0 rather than Si-Mg-0 with EDS measurement. Based on such EDS measurement results, researchers are likely to consider these two seemingly different types of particles as two inherently different phases in the given alloys [16-18].
Nonetheless, it is hard to imagine that this oxygen-rich (as well as enriched in Si or Si/Mg) phase is inherent in AA5083. This is because the solubility of oxygen in molten aluminum is significantly low [14], unless oxygen is introduced as pre-formed oxides during casting. It seems clear, however, that this phase is not a casting inclusion considering its appearance and location in the casting microstructure. It should be noted that this phase is mostly located near the area where the molten alloy solidified at the last stage of the casting, despite the apparent appearance of random distribution at higher magnifications.
The most plausible explanation for the lack of Mg in some of the Si-rich phases and the existence of O, as shown in Fig. 8, would seem to be that the Si-Mg-O and Si-O phase are not the inherent second phases of the alloy, but instead are altered phases resulting from metallographic preparation processes. The veracity of this interpretation seems to be well substantiated by Yasakau et al. [19]. They showed Mg in Mg2Si phase gradually disappeared from a submerged 5083 alloy sample in NaCI solutions as submersion time increased, which is associated with the formation of Si02 and SiCVnFbO (silicon hydroxides). They explained the Mg dissolution in terms of chemical reaction with water and anodic electrochemical dissolution.
Since the ordinary polishing and etching procedure used on the samples in this study entails the use of water and/or water-based solution, it is natural to consider that the surface of MgjSi becomes covered with a Si02 (and/or SiCV^FbO) layer. This reaction proceeds by gradually consuming Mg2Si itself. Once Si02 and/or S^'wFbO is formed and covers the original Mg2Si, the consequent altered phase is expected to become less conductive electrically, which probably led to the charge build-up. It should also be pointed out that there has been no report of oxygen-bearing (along with Si-rich and lack of Mg at the same time) phase found using TEM when samples were ion-milled where water is not introduced. This corroborates our interpretation that Mg2Si is altered due to the use of water during polishing and/or etching with an aqueous solution.
3.3.2 - Mn-rich dispersoid
AA5083 contains 4-4.9 % Mg in solid solution with 0.4-1.0 % Mn added to form precipitates which stabilize the grain size during recrystallization and increase strength [20], although no wrought 5xxx alloys employ precipitation hardening to obtain higher levels of strength. The typical Mn-rich precipitate is known as Al6Mn. Al6Mn can be distinguished from other phases in 5xxx alloys under SEM, where individual particles appear as either equiaxed or elongated. For example, it can be easily discerned from Fe-rich phases in terms of shape, size, and location in the alloy microstructure although both types of phases appear bright under SEM (see also Section 3.3.1). In this section, the etching characteristics of the Mn-rich phase with the new etching solution are investigated.
The archetype of the Mn-rich dispersoid has been considered to be Al6Mn although its exact chemical identity may vary from Al-Mn-Cr to Al-Mn-Cr-Fe [21,22]. Vetrano et al. [20] described it as "plate-like", while Ratchev et al. [23] classified this phase into "rhomboidal" and "plate-like" morphologies. The main difference between the two types of Mn-rich phase(s) under this classification is that the plate-like one bears an orientation relationship and is semi-coherent with the matrix while the rhomboidal phase is incoherent with the matrix [23]. Recently, Goswami et al. [21] characterized this phase as "equiaxed" and "rod-like" in the three-dimensional space, where an equiaxed Mn-rich particle is equivalent to Ratchev's rhomboidal particle. Therefore, there seems to be a disagreement about the true three-dimensional shape of the elongated Mn-rich particle although the results of both Goswami and Ratchev were the product of TEM tilting experiments. As is confirmed later in this section, most of the elongated Mn-rich particles on the two-dimensional observation plane are indeed plate-like in the three-
10
dimensional space. This conclusion is based on the fine-scaled and statistically reliable observation of m.crostructure of AA5083 with the aid of the new etching solution.
■i^ww^--. "m® cold mounting epoxy
\
plate*iike : rttomboittai
fOdnm |
Fe-rich ^
Pei-rlch
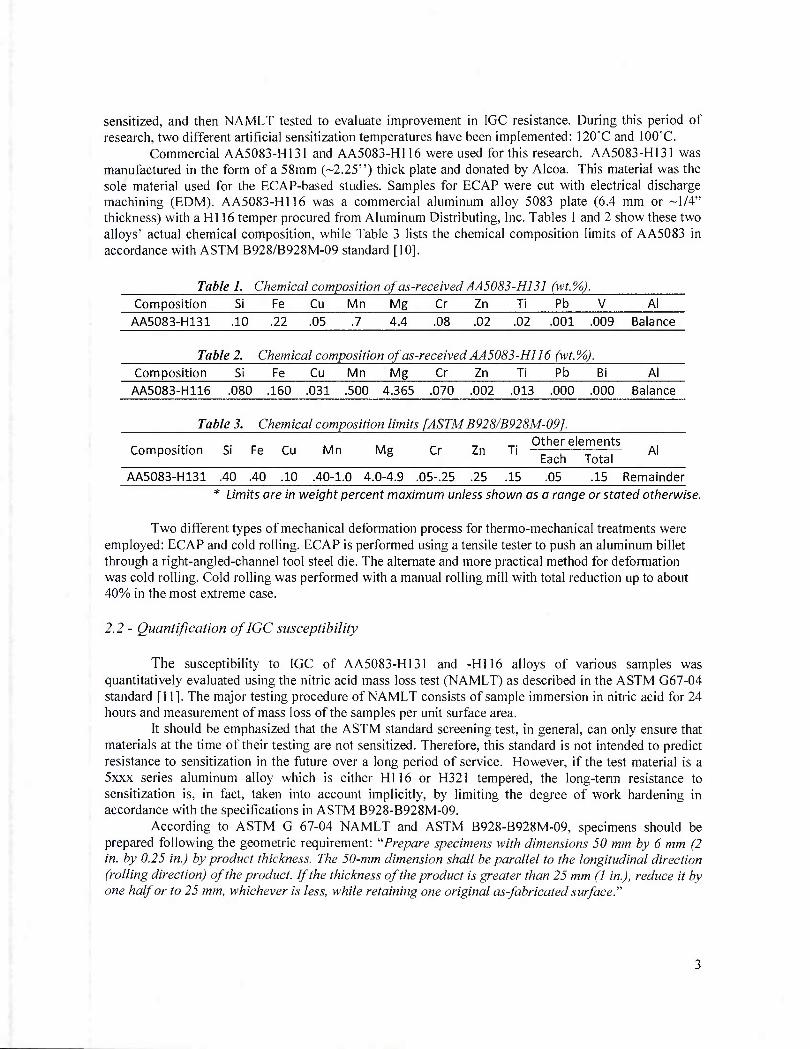
Distinctive characteristics of Mn-rich phase etched with the ammonium persulfate solution are brighter color than the matrix and an etching rate that is almost identical to that of the matrix. Let's first discuss the brightness of Mn-rich phase. Fig. 9 is an SEM image taken from the sample of as- received AA5083 in the SE2 imaging mode with an inset image taken in the inlens imaging mode at higher magnification. Mn-rich phase seen in the inset manifests itself as white phase in contrast with the grey background matrix. The truly unique nature of Mn-rich phase etched with the ammonium persulfate solution is its practically identical etching rate as the matrix. The top sample surface in Fig. 9, which appears as a line between cold mounting epoxy and the sample area, was previously etched with the same ammonium persulfate solution for 15 hours before remounting and cross-sectioning as shown. It is found that the plate-like Mn-rich phase
shown in the inset is etched only as much as the matrix during the 15 hour-etching. This identical etching rate between Mn-rich phase and the matrix is also demonstrated after 15 hour-etching in Fig. 10 below, where the directly etched surface area, rather than a line from the original etching surface on a cross section as in Fig. 8, is viewed. Note that larger white particles in Fig. 10 are Fe-rich phase(s), details of which are discussed in the next section.
-. "—
Figure 10. SEM image of as-received AA5083; no sensitization; etching time: 10 minutes. The parent image is taken in the SE2 imaging mode while the inset is taken in the inlens imaging mode. The inset comes from the demarcated area as the circle.
Mn-rich ^HHK' ilate-like)
m
Mn-rich (plate-like) \
etch pit
500nm i*rn««rtx
■ ■ 300nm
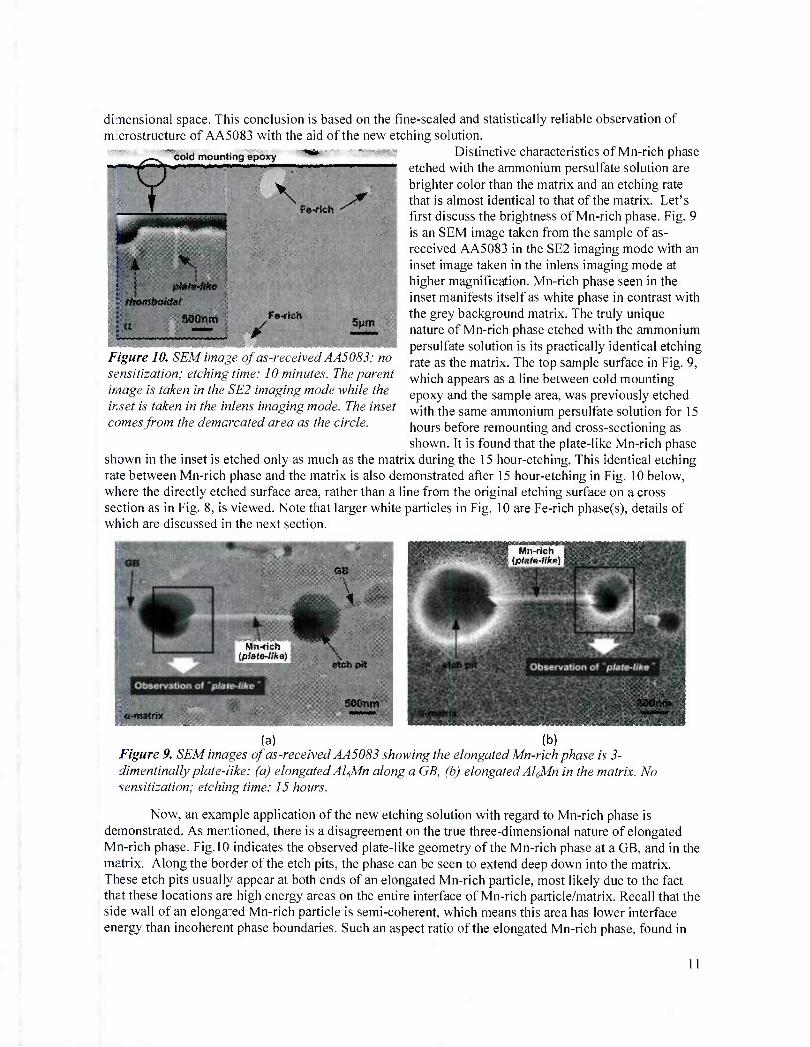
(a) (b) Figure 9. SEM images of as-received AA5083 showing the elongated Mn-rich phase is 3- dimentinally plate-like: (a) elongated Al(Mn along a GB, (b) elongated AlrMn in the matrix. No sensitization: etching time: 15 hours.
Now, an example application of the new etching solution with regard to Mn-rich phase is demonstrated. As mentioned, there is a disagreement on the true three-dimensional nature of elongated Mn-rich phase. Fig. 10 indicates the observed plate-like geometry of the Mn-rich phase at a GB, and in the matrix. Along the border of the etch pits, the phase can be seen to extend deep down into the matrix. These etch pits usually appear at both ends of an elongated Mn-rich particle, most likely due to the fact that these locations are high energy areas on the entire interface of Mn-rich particle/matrix. Recall that the side wall of an elonga:ed Mn-rich particle is semi-coherent, which means this area has lower interface energy than incoherent phase boundaries. Such an aspect ratio of the elongated Mn-rich phase, found in
11
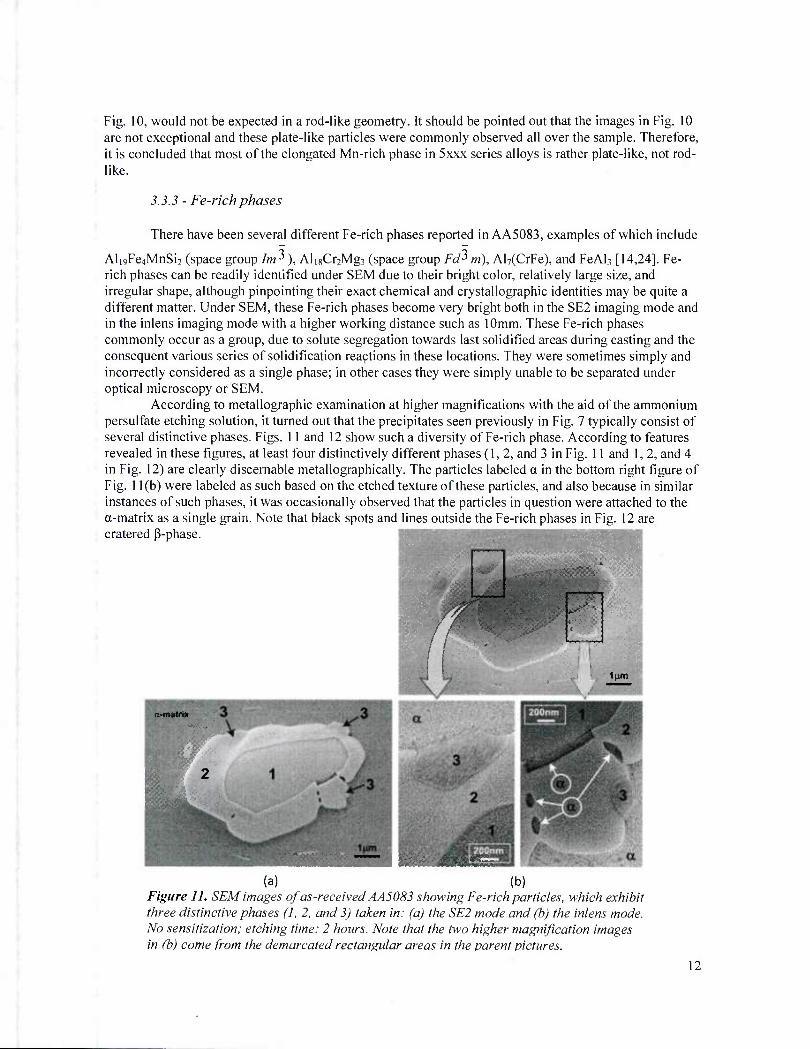
Fig. 10, would not be expected in a rod-like geometry. It should be pointed out that the images in Fig. 10 are not exceptional and these plate-like particles were commonly observed all over the sample. Therefore, it is concluded that most of the elongated Mn-rich phase in 5xxx series alloys is rather plate-like, not rod- like.
3.3.3 - Fe-rich phases
There have been several different Fe-rich phases reported in AA5083, examples of which include
Ali9Fe4MnSi2 (space group Im^1), AligCrjMga (space group FcP m), Al7(CrFe), and FeAU [14,24]. Fe- rich phases can be readily identified under SEM due to their bright color, relatively large size, and irregular shape, although pinpointing their exact chemical and crystallographic identities may be quite a different matter. Under SEM, these Fe-rich phases become very bright both in the SE2 imaging mode and in the inlens imaging mode with a higher working distance such as 10mm. These Fe-rich phases commonly occur as a group, due to solute segregation towards last solidified areas during casting and the consequent various series of solidification reactions in these locations. They were sometimes simply and incorrectly considered as a single phase; in other cases they were simply unable to be separated under optical microscopy or SEM.
According to metallographic examination at higher magnifications with the aid of the ammonium persulfate etching solution, it turned out that the precipitates seen previously in Fig. 7 typically consist of several distinctive phases. Figs. 11 and 12 show such a diversity of Fe-rich phase. According to features revealed in these figures, at least four distinctively different phases (1,2, and 3 in Fig. 11 and 1, 2, and 4 in Fig. 12) are clearly discernable metallographically. The particles labeled a in the bottom right figure of Fig. 11(b) were labeled as such based on the etched texture of these particles, and also because in similar instances of such phases, it was occasionally observed that the particles in question were attached to the a-matrix as a single grain. Note that black spots and lines outside the Fe-rich phases in Fig. 12 are cratered p-phase.
m ■:([■ V
lum
a-matdx
HHHHHwMPWWn
(a) (b) Figure 11. SEM images of as-received AA5083 showing Fe-rich particles, which exhibit three distinctive phases (I, 2, and 3) taken in: (a) the SE2 mode and (b) the inlens mode. No sensitizalion; etching time: 2 hours. Note that the two higher magnification images in (b) come from the demarcated rectangular areas in the parent pictures.
12
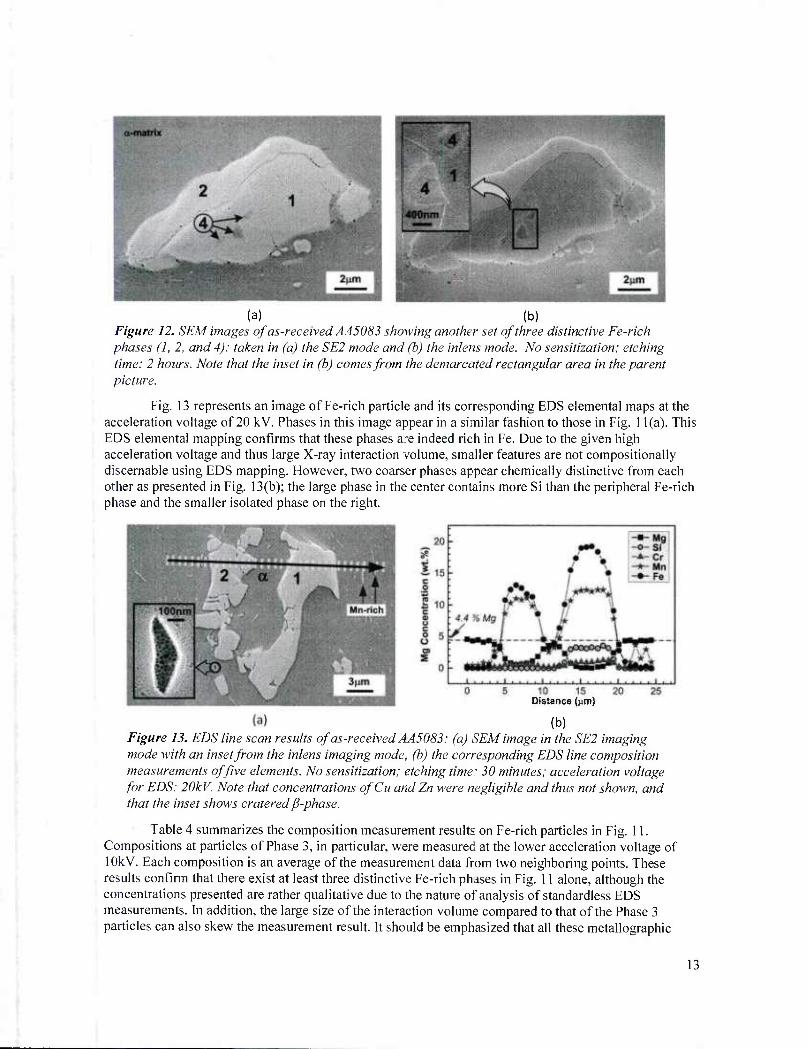
(a) (b) Figure 12. SEM images of as-received AA5083 showing another set of three distinctive Fe-rich phases (1, 2, and 4): taken in (a) the SE2 mode and (b) the inlens mode. No sensitization; etching time: 2 hours. Note that the inset in (b) comes from the demarcated rectangular area in the parent picture.
Fig. 13 represents an image of Fe-rich particle and its corresponding EDS elemental maps at the acceleration voltage of 20 kV. Phases in this image appear in a similar fashion to those in Fig. 11(a). This EDS elemental mapping confirms that these phases are indeed rich in Fe. Due to the given high acceleration voltage and thus large X-ray interaction volume, smaller features are not compositionally discernable using EDS mapping. However, two coarser phases appear chemically distinctive from each other as presented in Fig. 13(b); the large phase in the center contains more Si than the peripheral Fe-rich phase and the smaller isolated phase on the right.
10 15 Distance (nm)
(b) Figure 13. EDS line scan results of as-received AA5083: (a) SEM image in the SE2 imaging mode with an inset from the inlens imaging mode, (b) the corresponding EDS line composition measurements of five elements. No sensitization; etching time: 30 minutes; acceleration voltage for EDS: 20kV. Note that concentrations ofCu and Zn were negligible and thus not shown, and that the inset shows cratered fi-phase.
Table 4 summarizes the composition measurement results on Fe-rich particles in Fig. 11. Compositions at particles of Phase 3, in particular, were measured at the lower acceleration voltage of lOkV. Each composition is an average of the measurement data from two neighboring points. These results confirm that there exist at least three distinctive Fe-rich phases in Fig. 11 alone, although the concentrations presented are rather qualitative due to the nature of analysis of standardless EDS measurements. In addition, the large size of the interaction volume compared to that of the Phase 3 particles can also skew the measurement result. It should be emphasized that all these metallographic
13
demonstrations achieved with the new etching solution are consistent and highly reproducible, although the exact chemical or crystallographic nature of these phases is uncertain thus far.
Table 4. Chemical composition of different Fe-rich phases observed in Fig. 11 (wt.%).
Composition 5/ Fe Cu Mn Mg Cr Zn 77 Al Analysis voltage
Phase 1 3.1 19.1 0.0 12.0 0.1 0.9 0.2 0.0 Remainder 20kV
Phase 2 0.0 13.0 0.0 10.6 0.6 0.5 0.1 0.0 Remainder 20kV
Phases 0.0 8.9 0.0 3.9 5.8 7.4 0.1 0.5 Remainder 10 kV
3.3.4 - fi-phase
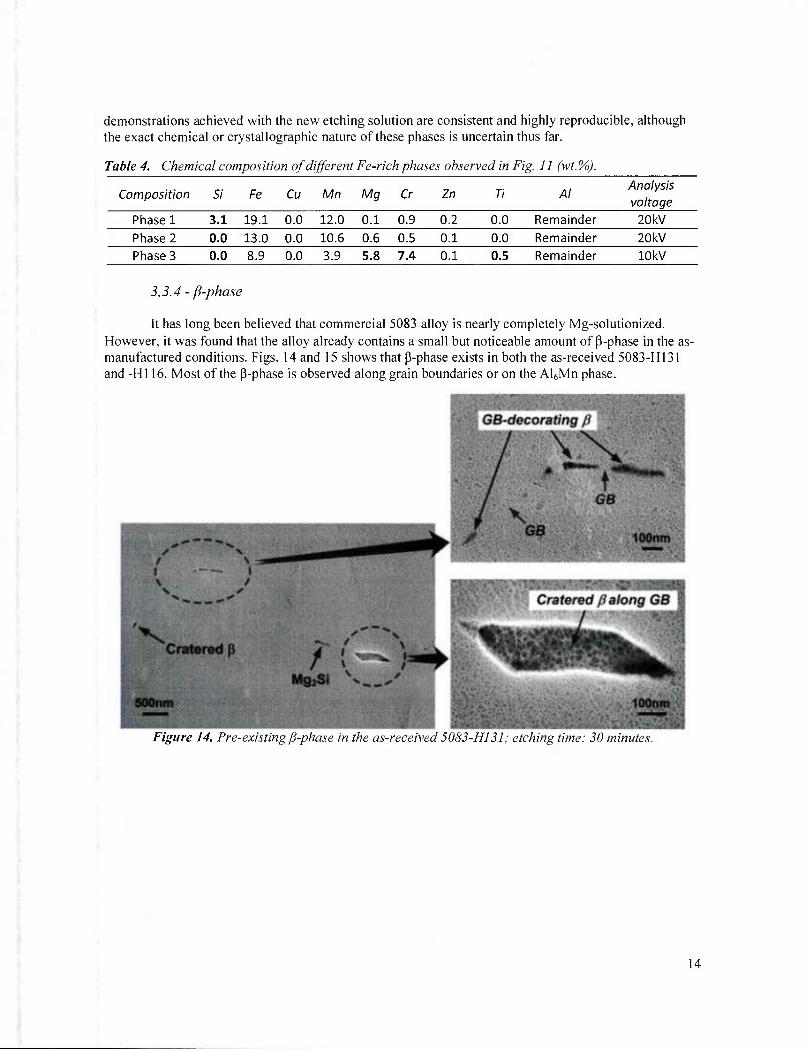
It has long been believed that commercial 5083 alloy is nearly completely Mg-solutionized. However, it was found that the alloy already contains a small but noticeable amount of P-phase in the as- manufactured conditions. Figs. 14 and 15 shows that p-phase exists in both the as-received 5083-H131 and -HI 16. Most of the P-phase is observed along grain boundaries or on the Al6Mn phase.
Figure 14. Pre-existing fi-phase in the as-received 5083-H131; etching time: 30 minutes
14
^'it; cratered p
GB-decorating fi
^W,^ lOpniTi'.
cratered p AI€Mn
MgjS! cratered p on AtsMn 200iim 200nm
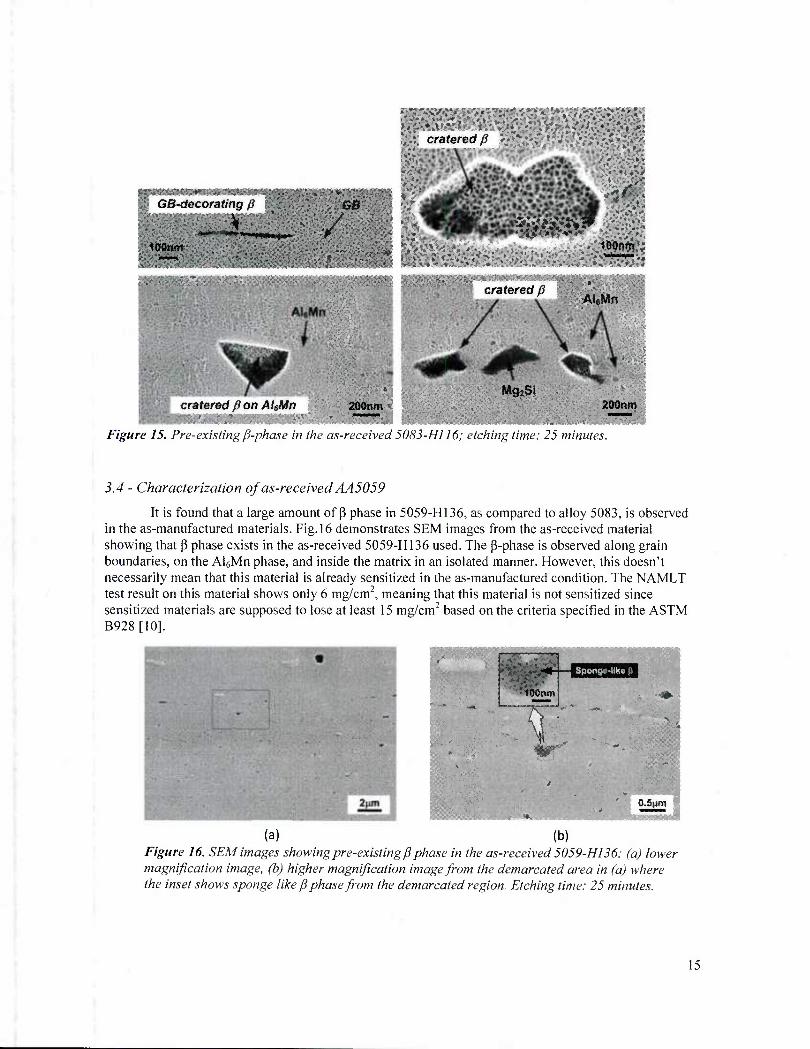
Figure 15. Pre-existing fi-phase in the as-received 5083-H116; etching time: 25 minutes.
3.4 - Characterization of as-received AA5059
It is found that a large amount of P phase in 5059-H136, as compared to alloy 5083, is observed in the as-manufactured materials. Fig. 16 demonstrates SEM images from the as-received material showing that p phase exists in the as-received 5059-H136 used. The (3-phase is observed along grain boundaries, on the AI6Mn phase, and inside the matrix in an isolated manner. However, this doesn't necessarily mean that this material is already sensitized in the as-manufactured condition. The NAMLT test result on this material shows only 6 mg/cm2, meaning that this material is not sensitized since sensitized materials are supposed to lose at least 15 mg/cm2 based on the criteria specified in the ASTM B928[10].
;,t00twn
if \ 1
O.Sunn
(a) (b) Figure 16. SEM images showing pre-existing P phase in the as-received 5059-H136: (a) lower magnification image, (b) higher magnification image from the demarcated area in (a) where the inset shows sponge like p phase from the demarcated region. Etching time: 25 minutes.
15

3.5 - Measurement ofsolvus ofAA5083
P precipitation is dependent upon the solvus temperature, which is the critical point where p - phase can form or dissolve. Therefore, a reliable solvus temperature is an important starting point for IGC research in the given alloy system, but this information for AA5083 has never reported thus far. Almost any of the physical properties that are responsive to phase changes, in principle, may be useful in the determination of phase diagrams. There are many methods available for this purpose, among which include electrical resistivity. X-ray diffraction, microstructural examination, differential scanning calorimetry, magnetic susceptibility, density, and thermal expansion measurements [25]. The most widely used method for investigating phase diagrams is probably thermal analysis due to its experimental simplicity. This method is also useful to locate the liquidus with precision, find invariant equilibria, and preliminarily survey the general tendency of phase transformations in the alloy system. However, it is difficult to employ this thermal analysis method to locate the boundaries between regions involving only solid phases. This is because solid-state phase transformations are often sluggish and the heat change is not significant enough to be readily detected by cooling/heating curves. Since p precipitation is a solid- state transformation from supersaturated a-Al matrix, a metallographic method has been adopted in this research.
In material systems, true thermodynamic equilibrium conditions are rarely attainable within a reasonable length of time. For more accurate determination of phase boundaries in the phase diagram, therefore, experiments are often conducted from two directions regardless of methods employed; high-to- low temperature (top-down approach) and low-to-high temperature (bottom-up approach) experiments. This can confine limits, between which the true equilibrium occurs. In the current research, as-received (bottom-up) and solutionized and quenched (top-down) AA5083-H131 samples at 322°C/100hr were isothermally annealed at different temperatures. Fig. 4 in the experimental section explains how to determine the solvus temperature using these two experimental approaches. As discussed in the previous section, the as-received material already contains a noticeable amount of p-phase. Therefore, if this material is isothermally annealed at higher temperature than the p solvus of 5083, p-phase is expected to dissolve completely in the thermodynamic equilibrium state. This approach was used in the previous report and the solvus was determined to be higher than 2870C. On the other hand, the top-down experiments use 5083 solutionized at 3220C, where Mg in the material is completely solutionized and supersaturated at room temperature. In this case, if this solution heat-treated P-free material is isothermally annealed at lower temperature than the p solvus of 5083, p-phase emerges again. Therefore the top-down experiments determine the lower limit of the solvus, while the bottom-up experiments determine the upper limit of the solvus.
In the top-down approach experiments, p-free solution heat-treated samples were placed in a pre- heated furnace at designated temperatures and subsequently annealed for different periods between 70 and 305 hours, to experimentally determine the lower limit of the actual solvus point of the actual alloy AA5083-H131. Immediately after annealing, the samples were quenched in room temperature water to freeze and thereby preserve the microstructure at the annealing condition. The annealing was conducted at 28rC/70hr, 287oC/305hr, and 290°C/I lOhr. The quenched samples were then mounted and etched for SEM imaging. The investigated area for each sample was chosen to be larger than 40,000|im2 for better statistics of microstructure analysis. It is worth mentioning that such large area investigations were only possible due to the development of the new ammonium persulfate etching solution. According to the experiments, p-phase was observed only in the samples annealed at either 28rC/70hr or 287°C/305hr. As can be expected, the amount of P-phase observed in the 281 °C/70hr sample was higher than that in the 287°C/305hr sample.
Fig. 17 summarizes the experimental results showing that the solvus temperature is located somewhere between 287 and 290°C. Therefore, the actual p solvus temperature of AA5083 was determined to be about 2880C. It should be emphasized that this newly determined solvus temperature is
16
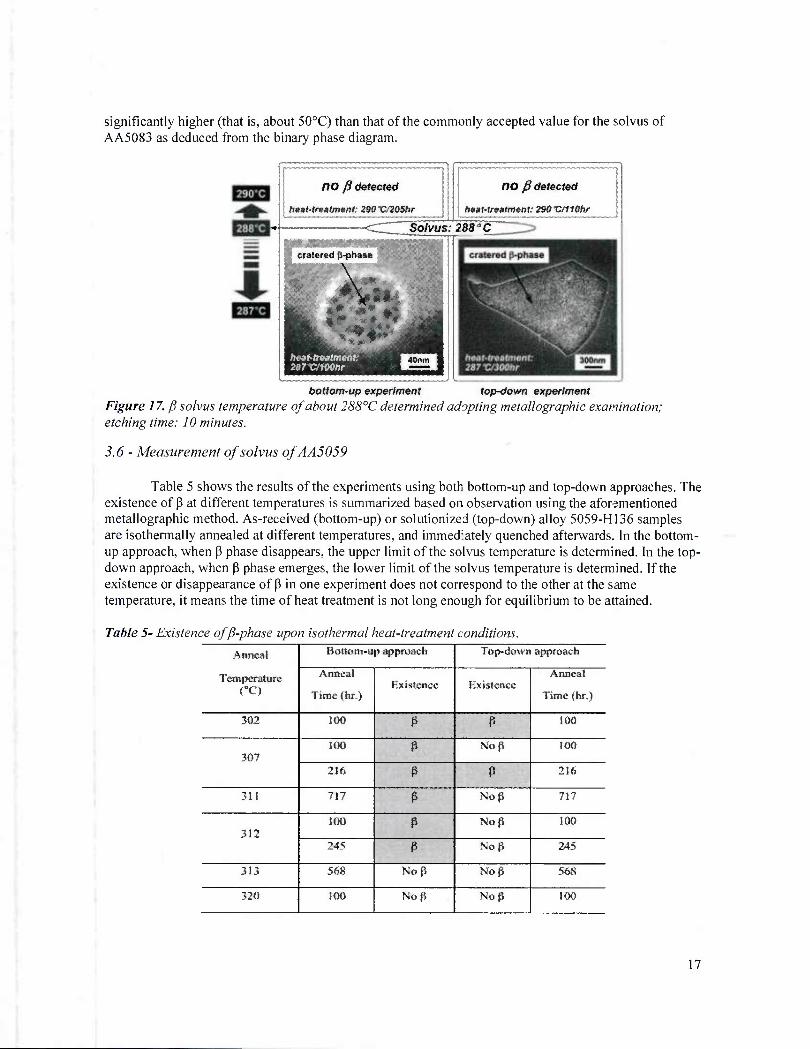
significantly higher (that is, about 50oC) than that of the commonly accepted value for the solvus of AA5083 as deduced from the binary phase diagram.
HO P detected
heat-treatment: 290 "C/ZOShr
no P detected
heat-treatment: 290X/110hr
Solvus: 288° C
cratered ji-phase
. ■
2S7t:/100hr 40nm 1
bottom-up experiment top-down experiment Figure 17. ft solvus temperature of about 288°C determined adopting metallographic examination; etching time: 10 minutes.
3.6 - Measurement of solvus ofAA5059
Table 5 shows the results of the experiments using both bottom-up and top-down approaches. The existence of p at different temperatures is summarized based on observation using the aforementioned metallographic method. As-received (bottom-up) or solutionized (top-down) alloy 5059-H136 samples are isothermally annealed at different temperatures, and immediately quenched afterwards. In the bottom- up approach, when p phase disappears, the upper limit of the solvus temperature is determined. In the top- down approach, when p phase emerges, the lower limit of the solvus temperature is determined. If the existence or disappearance of p in one experiment does not correspond to the other at the same temperature, it means the time of heat treatment is not long enough for equilibrium to be attained.
Table 5- Existence of/3-phase upon isothermal heat-treatment conditions.
Anneal Botiotn-up approach Top-down approach
Temperature Anneal
Tiinc(hr.) Existence Existence
Anneal
Time (hr.)
302 100 P P 100
307 100 P Nop 100
216 $ P 216
311 717 P Nop 717
312 100 P Nop 100
245 P Nop 245
313 568 Nop Nop 568
320 100 Nop Nop 100
17
no fitkitmtmt
aMMillilllMllimMIMIlilliML mrcmm
— HIKSlmitr tti*mrm mpdmcud
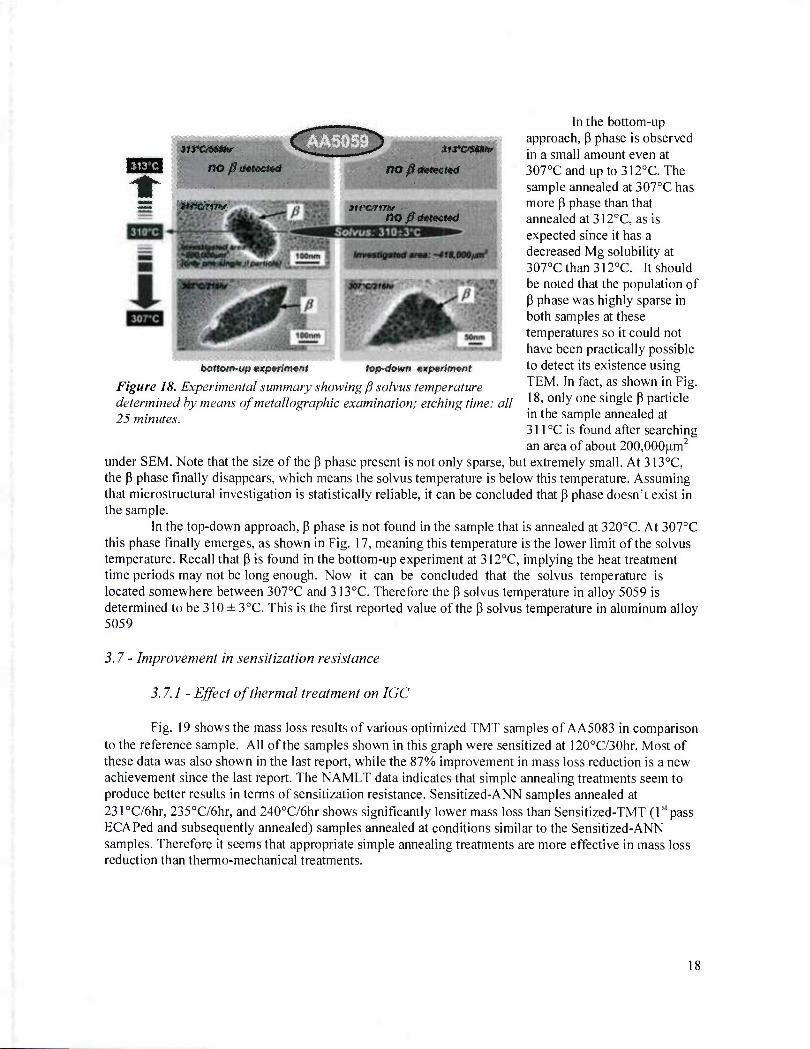
In the bottom-up approach, p phase is observed in a small amount even at 307oCandupto312oC.The sample annealed at 307oC has more p phase than that annealed at 3120C, as is expected since it has a decreased Mg solubility at 307oCthan312oC. It should be noted that the population of P phase was highly sparse in both samples at these temperatures so it could not have been practically possible to detect its existence using TEM. In fact, as shown in Fig. 18, only one single p particle in the sample annealed at 311 °C is found after searching an area of about 200,000|im2
under SEM. Note that the size of the p phase present is not only sparse, but extremely small. At 313°C, the P phase finally disappears, which means the solvus temperature is below this temperature. Assuming that microstructural investigation is statistically reliable, it can be concluded that p phase doesn't exist in the sample.
In the top-down approach, p phase is not found in the sample that is annealed at 320oC. At 307oC this phase finally emerges, as shown in Fig. 17, meaning this temperature is the lower limit of the solvus temperature. Recall that p is found in the bottom-up experiment at 3120C, implying the heat treatment time periods may not be long enough. Now it can be concluded that the solvus temperature is located somewhere between 307oC and 313CC. Therefore the p solvus temperature in alloy 5059 is determined to be 310 ± 30C. This is the first reported value of the p solvus temperature in aluminum alloy 5059
bottom-up experiment top-down experiment
Figure 18. Experimental summary showing /? solvus temperature determined by means of metallographic examination; etching time: all 25 minutes.
3.7 - Improvement in sensitization resistance
3.7.1 - Effect of thermal treatment on IGC
Fig. 19 shows the mass loss results of various optimized TMT samples of AA5083 in comparison to the reference sample. All of the samples shown in this graph were sensitized at 120oC/30hr. Most of these data was also shown in the last report, while the 87% improvement in mass loss reduction is a new achievement since the last report. The NAMLT data indicates that simple annealing treatments seem to produce better results in terms of sensitization resistance. Sensitized-ANN samples annealed at 2310C/6hr, 2350C/6hr, and 240oC/6hr shows significantly lower mass loss than Sensitized-TMT (T'pass ECAPed and subsequently annealed) samples annealed at conditions similar to the Sensitized-ANN samples. Therefore it seems that appropriate simple annealing treatments are more effective in mass loss reduction than thermo-mechanical treatments.

70
60 -
C 50
I- g 40
■ § 30
■ I 20
10
Sensltteation: 120'C, 30 hours Test material; 5083-H131
Ref Reduction of -Tg..-. HWMM loss by
80% ('a0* ^m
iMeai Upper Low«r
2C% 20%
65^
80% 79%
J_LJ
67% I u *J Iff
16
iF % f i
B *f pi
i*^ KF AP £?-C ^-c ^^r ^tS 'vrv ™*> ms jot: SJE* (S«^ ftf? CJ^-
H li JJ1
Figure 19. Highest improvement achieved over course of this research via means of simple anneaiing, which shows 8 f% reduction in mass loss with respect to Sensitized-AR sample.
material from being sensitized.
To pinpoint what caused the improvements shown in the figure, the effect of anneaiing alone was investigated. All of the samples of as-received 5083-H131 were prepared by Type-B ECAP dimension cutting as defined in Fig. 2. These samples were then simply annealed at various temperatures for varying periods prior to sensitization at 120°C/30hr and subsequent NAMLT testing. Fig. 20 shows percent mass loss reduction vs. annealing conditions, where values represent percent mass loss reduction of Sensitized-ANN samples with respect to mass loss of a Sensitized-AR sample. The best optimized sample in terms of sensitization resistance shows about 87% in mass loss reduction. Considering that % mass loss reduction of a Plain-AR sample is about 89%, one can readily imagine the degree of improvement of the 87% reduction in sensitization resistance. In other words, the treatment effectively prohibits the
^^^^^ ̂ ^^^^ ̂ ^^^^ ̂ ^^^^ 100 hr.
50 hr. 20 hr. ^ 64.2% "^N^
10 hr. 6.0% , ■x79.7% SI .8% 82.1% 80.4%v*> , 75.4% 6hr. -3,6%/ 79 4% MMm 80.1% 79.2% \76.3% 3hr. 5.7%\ 77.3% 78.9% 79.2% 79.4% /76.3% 1 hr. 38.5% ' \73.4% 77.3% 75.4% 77.3%/ 77.3%
40Riin. "\^ 20 min.
""^fiSap- IWC ZOO'C IIS'C m*c ■ns°c im'c tm'c 290*C 320'C
fc- ^ h. ■*
■ Sensitization T Best optimized temperature range r Softe w ■^ w
+ incr reased mass loss
Figure 20. Best optimized annealing temperature and time for sensitization resistance.
3.7.2 - Effect of thermal treatment with ECAP on IGC
It is well-known that plastic deformation usually makes 5xxx series aluminum alloys become vulnerable to sensitization. Due to this reason, marine-grade tempers of 5xxx series aluminum alloys were limited to H" 16 and H321. Therefore, if the improvement treatment can still effectively suppress sensitization of plastically deformed and thus work-hardened materials, one can increase mechanical strength without compensating for corrosion pioperies. Since the method to suppress sensitization significantly was found, severe plastic deformation via means of ECAP was applied on the samples either before or after the improvement annealing treatment to evaluate how much the effectiveness of the improvement annealing can be maintained along with plastic deformation.
19
70
60 -
SO
40
30
20
10
Original material: AA50S3-H131 -35.2%
S6.5
87.1% S.4 W M J5
.4^ /^ ACT JW # <^ JOS' J?
#■
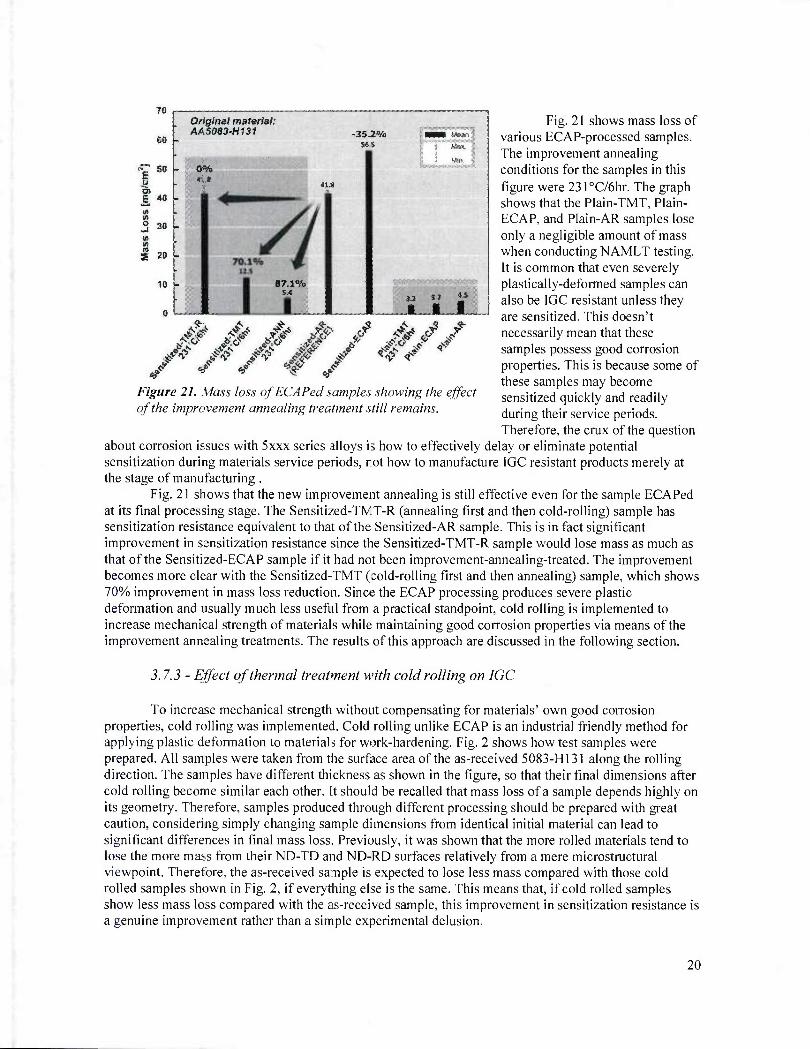
Fig. 21 shows mass loss of various ECAP-processed samples. The improvement annealing conditions for the samples in this figure were 2310C/6hr. The graph shows that the Plain-TMT. Plain- ECAP, and Plain-AR samples lose only a negligible amount of mass when conducting NAMLT testing. It is common that even severely plastically-deformed samples can also be IGC resistant unless they are sensitized. This doesn't necessarily mean that these samples possess good corrosion properties. This is because some of these samples may become sensitized quickly and readily during their service periods. Therefore, the crux of the question
about corrosion issues with 5xxx series alloys is how to effectively delay or eliminate potential sensitization during materials service periods, rot how to manufacture IGC resistant products merely at the stage of manufacturing .
Fig. 21 shows that the new improvement annealing is still effective even for the sample ECAPed at its final processing stage. The Sensitized-TIVT-R (annealing first and then cold-rolling) sample has sensitization resistance equivalent to that of the Sensitized-AR sample. This is in fact significant improvement in sensitization resistance since the Sensitized-TMT-R sample would lose mass as much as that of the Sensitized-ECAP sample if it had not been improvement-annealing-treated. The improvement becomes more clear with the Sensitized-TMT (cold-rolling first and then annealing) sample, which shows 70% improvement in mass loss reduction. Since the ECAP processing produces severe plastic deformation and usually much less useful from a practical standpoint, cold rolling is implemented to increase mechanical strength of materials while maintaining good corrosion properties via means of the improvement annealing treatments. The results of this approach are discussed in the following section.
Figure 21. Mass loss of ECAPed samples showing the effect of the improvement annealing treatment still remains.
.7.3 - Effect of thermal treatment with cold rolling on IGC
To increase mechanical strength without compensating for materials' own good corrosion properties, cold rolling was implemented. Cold rolling unlike ECAP is an industrial friendly method for applying plastic deformation to materials for work-hardening. Fig. 2 shows how test samples were prepared. All samples were taken from the surface area of the as-received 5083-H13I along the rolling direction. The samples have different thickness as shown in the figure, so that their final dimensions after cold rolling become similar each other. It should be recalled that mass loss of a sample depends highly on its geometry. Therefore, samples produced through different processing should be prepared with great caution, considering simply changing sample dimensions from identical initial material can lead to significant differences in final mass loss. Previously, it was shown that the more rolled materials tend to lose the more mass from their ND-TD and ND-RD surfaces relatively from a mere microstructural viewpoint. Therefore, the as-received sample is expected to lose less mass compared with those cold rolled samples shown in Fig. 2, if everything else is the same. This means that, if cold rolled samples show less mass loss compared with the as-received sample, this improvement in sensitization resistance is a genuine improvement rather than a simple experimental delusion.
20

H131«iH116
Figure 22. Newly developed Al-Mg alloys (and/or their tempers) via means of simple annealing and cold rolling, which possess both higher strength and good sensitization and thus IGC resistance.
Fig. 22 shows mass loss test results of the samples cold rolled along with the improvement annealing all at 231 °C/6hr. Two different degrees of cold rolling implemented: about 15 and 30% reduction in thickness. The mass loss test results show sensitization resistance of both Sensitized- TMT-R and Sensitized-TMT-R sample are improved, compared with the Sensitized-AR sample. The Sensitized-TMT samples lose much less mass, so that their mass losses are close or even smaller than that of the Sensitized-AR of 5083-H116. Considering that 5083-H116 is a marine grade alloy, one can readily imagine how much the corresponding Plain-TMT samples (as- manufactured form of the Sensitized-TMT samples) are potentially sensitization resistant. However, there may be a slight decrease in strength of these Sensitized-TMT samples due to the recovery process associated with the annealing. It is usually expected that recovery annealing is accompanied by a slight decrease in mechanical strength of cold worked aluminum. However the strength decrease due to recovery
annealing is not expected to be significant, considering the annealing temperature (between about 210 and 240oC) and time (between about 30 minutes and 6 hours).
Fig. 23 shows intergranular corrosion resistance between the AR sample and the two thermomechanically processed samples. It demonstrates that the new improvement annealing is still effective even for the sample cold rolled at its final processing stage. The Improved-1 samples are annealed at 2310C/6hr., quenched, and then finally 40% cold rolled. The Improved-2 samples are annealed at 23rC/6hr., quenched, annealed at l80oC/Ihr, quenched, and then finally 20% cold rolled. The Improved-1 samples have sensitization resistance similar to that of the AR samples. This is in fact significant improvement in sensitization resistance since the Improved-1 sample now gains mechanical strength significantly. The improvement becomes clearer with the lmproved-2 samples, which shows 30% improvement in mass loss reduction with respect to that of the AR samples.
Figure 24 compares mechanical properties between typical AR samples, minimum requirements
for a HI3I tempered 5083 alloy, and the two thermo-mechanically processed samples. The improved samples show superior mechanical properties except for the fact that the elongation of the Improved-1 sample is lower ihan that of a typical alloy. In particular, the improved samples show much higher yield strength (C.2% offset) than the others. This is of particular importance considering that yield strength is much more impcrtant consideration than ultimate tensile strength in many structural applications. It should be also enphasized that these better mechanical properties of the improved samples are achieved along with good IGC resistance as demonstrated in Fig. 23. The underlying mechanism behind the
E I JE VI m o
More corrosion resistant
Stmsitiiations done ar 100X/fd Figure 23. Comparison of IGC resistance between an as-received sampte and thermo mechanically processed samples.
21

S
c
improvement is still not clear and under investigation. However we now know that the improvement is achieved by something else in addition to mere relaxation of cold working when proper annealing is applied to the materials.
Mmimum Typical Imjji-oved-l Improwed-2
Figure 24. Comparison of mechanical properties between an as-received sample end processed samples.
4. Cold spray deposition for corrosion mitigation
Cold spray deposition, also known as kinetic metallization and cold gas dynamic spraying, is a solid-state deposition process in which iner gas is used to accelerate solid particles toward a substrate which impinge upon the surface; subsequent plastic deformation of these particles adhere them to the surface [26-30]. The plas:ic deformation occurs with adiabatic shear instabilities resulting in particle- particle and particle-substrate bonding causing formation of a dense adherent coating on the substrate [31 ]. Consecutive particle collisions on the surface of the recently deposited coating build up and a thick coating with theoretical bulk properties can be achieved [27]. The cold spray process is dependent on a highly-pressurized, pre-neated inert gas, either nitrogen or helium, forced through a converging-diverging DeLaval nozzle [32]. After this converging portion of the nozzle, the inert gas is allowed to expand freely which accords it a high velocity. The powder particles are injected into the gas stream before the converging section of the nozzle and are accelerated toward the substrate in the expanding gas stream as illustrated in Fig. 25. Depending on the selected equipment parameters and the size of the particles, particle impact velocities can reach from 200 to 1200 m/s [27].
I
I
Gun Offset
i Heating Element f
Powder Injector
Figure 25. A schematic cross-section of the DeLaval nozzle whose expanding gas flow in the diverging section is essential for cold spray deposition.
Unlike thermal spray processes where feedstock particles are melted, in the cold spray process particle deposition occurs in solid state - in fact the particle temperatures are quite low. The main advantage of cold spray is the solid state deposition where possibly detrimental effects due to solidification and oxidation associated with melting the particles are avoided. The relatively low temperature from the very short time scales in which the powder particles interact with the heated inert gas and the use of essentially inert gas to propel the particles leads to relatively low oxidation and porosity in the coatings [33]. The avoidance of oxygen in the coating accords the deposited coating to
22

achieve mechanical and electrical properties near or at those of heavily deformed cold worked bulk material [29]. The best candidate powders for cold spray are nominally ductile materials such as Cu and Al or Al alloys with particles in the 5-45|am size range. It is for these reasons that AA5083 is a candidate material for deposition with this process. The ability to deposit coatings of metallic materials and thermally sensitive materials, such as 5083, are particular advantages of the cold spray process. This particular work investigates the feasibility of using cold spray coating technology to address corrosion- related issues in marine environments of AA5083.
5083 is essentially a binary Al-4.4wt.%Mg alloy known for its excellent corrosion resistance and strength in salt-water environments. However it is subject to inter-granular stress corrosion cracking (IGSCC) due to the sensitization phenomenon at higher temperatures, >50oC, in which Mg-rich AlaMgj, also referred to as the p-phase, precipitates at the grain boundaries of the material [34]. This formation of the p-phase along the grain boundaries has a negative effect on the corrosion resistance of the alloy. The P-phase has a more negative corrosion potential than the bulk alloy, which leads to the dissolution of the p-phase in corrosive environments such as sea-water. The more continuous the precipitation of this p- phase along grain boundaries, the greater the corrosive attack of the material.
Cold spray deposition is being considered as a repair technique for sensitized material due to its relatively low processing temperature and solid state deposition as compared to welding, the traditional repair method. Once the material reaches a critical sensitized condition, welding can no longer be performed as the heat-input of the welding process only contributes to the degradation of the material. Cold spray is also being considered for deposition of sacrificial layers that corrode preferentially, protecting the underlying substrate. The possibility of using cold spray deposition to either repair sensitized 5083 or deposit corrosion resistant or sacrificial coatings is very attractive.
In order to understand the deposition behavior of 5083, extensive coating analysis was performed. This testing began with cross-sectional SEM and EDS to develop some general parameters for deposition. Next, x-ray diffraction (XRD) was performed on the initial samples to show that the deposited coatings had the same phases as the as-received powder. Once a general parameter set was developed, the powder was sieved into two distinct size ranges to determine the effect of particle size on coating quality. These coatings were further tested using microhardness to show coating densification and coating adhesion bond pull testing to quantify the strength of the coating-substrate interface. The best recipes recipes for deposited coatings were then corrosion tested to determine their behavior in electrolytic environments.
In this work, the corrosion properties of the cold sprayed 5083 coatings were investigated using a variety of standard corrosion test methods. The first test method in this analysis and most widely used test for measuring the Degree of Sensitization (DoS) of 5xxx series aluminum alloys is ASTM G61-Standard Test Method for Determining the Susceptibility to Intergranular Corrosion ofSxxx Series Aluminum Alloys by Mass Loss After Exposure to Nitric Acid (NAMLT Test) referred to as NAMLT in this work. Sensitized material which experiences mass losses in the range from 15-25 mg/cm2 are subject to further metallographic analysis and testing while that which experiences mass losses above 25 mg/cm2 are deemed no longer corrosion resistant [II]. If the corrosion resistance of the coating is demonstrated to be equal to or greater than the as-received material, it will provide protection when deposited on AA5083 substrates. The second method was potentiodynamic testing of the coatings in a salt-water medium for comparison of the corrosion potentials for coatings and the bulk material. The third method was exposure in a salt-spray test chamber to visualize the corrosion behavior of the coating-substrate system.
5. Experimental - cold spray deposition
5.1 Materials for cold spray deposition
Pure Al powder was selected as the first material for deposition, it is an ideal candidate for cold spray as it is reactive and has a high ductility. Pure Al powder was purchased from Valimet (Stockton, CA) which specializes in Al and Al-alloy gas atomized powders, the composition is shown below in Table 6. The powder was spherical in nature and had a size range of 5-45nm. For the initial testing, a
23

6061 Al-alloy was selected, purchased from McMaster-Carr. These samples were cross-sectioned for SEM/EDS and analyzed using x-ray diffraction to confirm that the coating was pure aluminum.
Table 6—Pwe Al Powder Composition Received From Valimel Si Fe Cu Mn M< Cr Zn Ti Al 0.0 0.11 0.0 0.0 0.0 0.0 0.0 0.0 Bal.
Figure 26. The as-received 5083AA powder from Valimet is comprised of spherical particles with a large fraction of particles below 10^m.
AA5083 powder was required to produce cold spray coatings for the mitigation of corrosion work. The 5083 powder was also acquired from Valimet and certified to contain particles below 325 mesh (44nm) in size and be spherical in nature. An SEM image of the as-received powder is presented in Fig. 26. The particle shape is confirmed spherical and contains many particles below lO^m with no particles observed to be larger than 44nm.
The substrate material for 5083 deposition was purchased from Sunshine Metals (Harvey, LA) but manufactured by ALCOA. The 1/4" thick 5083 plate was received in 12" x 12" squares which could be cut into different geometries for deposition and subsequent testing. The material adheres to ASTM- B928 with the composition shown below in Table 7 [10]. The alloy is nominally comprised of 4.0- 4.9wt % Mg with balance Al. The alloy plate from Sunshine contains 4.4wt% Mg and has the H-l 16 temper designation. Substrates were cut to various dimensions based on ensuing testing but all were ground with 320-grit SiC paper in alcohol to remove contaminants and roughen the surface before coating.
Table 7 - 5083AA Plate Composition Manufactured by ALCOA
Si Fe Cu Mn Mg Cr Zn Ti Al 0.10 0.26 0.07 0.64 4.4 0.09 0.04 0.02 Bal.
Another possible use for cold spray technology would be to deposit a zinc coating to act as a sacrificial anode that would preferentially corrode away when deposited on AA5083. Zinc powder was procured from Materion (Milwaukee, Wl) with particles less than 44\im (-325 mesh). An SEM image of the zinc powder is shown in Fig. 27, confirming that all particles are below 44|im. The as-received zinc powder also contained some fines, but most particles were in the size range best for cold spray deposition.
Figure 27. The as-received zinc powder is spherical with particles below 44 nm.
24

5.2 - Analysis of deposited coatings
Deposited coatings were cross-sectioned, mounted in phenolic resin and ground with 320-1200 SiC papers, 3 to lum diamond alcohol-based suspensions and finally polished down with 0.02|im particle size colloidal silica. Samples were examined using SEM and the interface adhesion was qualitatively observed using an EDS line scan to confirm a sharp transition from the coating to substrate. Select samples were also analyzed using XRD to confirm that the samples did not undergo phase changes during the deposition. In addition, hardness testing with a Knoop style indenter and a lOOg load was performed on certain samples to show densification of the coating and the work-hardening of the deposited coating.
5.3 - Effect of particle size on AA5083 deposition
The velocity imparted to the powder particles by the inert gas is dependent upon the particle size among other things. Cold spray deposition is most effective when the particles are all a similar size, nominally in the 5-25|im range. Sub-micron particles do not have enough momentum for effective deposition and can cause powder feeding issues [35]. Conversely, particles much larger than the optimum size range may not achieve enough velocity or momentum to undergo sufficient plastic deformation, a requirement to form a dense coating and may in fact rebound off the substrate. It was decided that the as- received powder should be sieved to both remove fines too small for deposition and provide two distinct particle size ranges to investigate the deposition behavior of smaller and larger particles. In addition, a systematic study on the deposition behavior of two well-defined size ranges for the exact same powder composition had not been done and would provide better insight on the best parameters for AA5083 deposition for each size range measured by the resultant coating properties. To elucidate the effect of particle size on cold spray deposition of 5083, the as-received powder was sieved into two distinct particle size ranges, 5-20)j,m and 20-44|jm. The powder was air-jet sieved by Vortec Products (Long Beach, CA) and the particle size ranges of 5-20 and 20-44)am were confirmed using SEM in Fig. 28 (a) and (b) below. The size ranges are well-defined and most sub-micron particles have been removed. The powder was deposited with either of two conditions (500oC, 40bar or 400°C, 40bar) using nitrogen and one condition (400°C, 40bar) with helium. These samples were then examined with cross-sectional SEM, the coating thickness measured and the coatings hardness tested using lOOg load with a Knoop indenter.
Figure 28. The powder was sieved into two distinct size ranges 5-20um (a) and 20-44um (b) as confirmed by SEM images.
25

5.4 - Adhesion testing of samples
The best deposited 5083 samples as determined by the powder size comparison from various analyses were adhesion tested at 1MR Test Labs (Lansing, NY) according to ASTM C633 Standard Test Method for Adhesion or Cohesion Strength of Thermal Spray Coatings [36]. The samples were deposited on 1.25" octagons and machined to 1" diameter circular coupons. The coatings were ground parallel using 400-grit SIC paper before testing. A 1" diameter hardened steel rod was epoxied to the top and bottom of the sample using an 1 Iksi strength epoxy and the two pulled apart to determine the strength of the coating-substrate interface.
5.5 - Corrosion testing of 5083 and zinc coatings
The standard test method for determining the sensitization level or DoS in 5xxx series aluminum alloys is ASTM G67, Standard Test Method for Determining the Susceptibility to Intergranular Corrosion of 5XXXSeries Aluminum Alloys by Mass Loss After Exposure to Nitric Acid (NAMLT). This
test requires full immersion of a sample in 70% Nitric Acid
?__
Sample Teflon 0-
Ring
nitric acid (HNO,), at 30oC for 24hr [11]. Initial testing, explained later in this report, revealed that full coverage deposition and subsequent machining of a fully-coated sample was difficult and impractical. Based on information and guidance received from Ben Bouffard at NSWC-Carderock, a polytetrafluoroethylene (PTFE) test jig was fabricated that would localize the acid attack to a well-defined area allowing the focus to remain on the coating corrosion behavior, not the researchers ability to machine fully coated sample geometries. A schematic of the PTFE jig used for the one- sided nitric acid attack is presented in Fig. 29. The attack depth of the coating was measured
Figure 29. A schematic of the PTFE jig used for the one-sided nitric acid attack shows the acid is localized to the center of the sample.
using a single image stitched from multiple SEM images. Uncoated samples along with samples sensitized at 100°C for 168hr were tested. The sensitization conditions projected a mass loss of 40 mg/cm2 according to the previous work, presented in Fig. 5.
Samples were also corrosion tested using an electrolytic, potentiodynamic corrosion cell filled with synthetic sea-water. The reference electrode for these tests was a saturated KC1 solution also known as the Standard Calomel Electrode (SCE). The testing solution was produced from a dry sea-salt mixture dissolved in deionized water. This mixture was manufactured adherent to ASTM D 1141-98 and was primarily comprised of NaCl, MgCL^F^O, Na2S04, CaCL and KC1 with a final final solution concentration was 3.6% [37]. The samples were polished down to 1200-grit SiC to ensure a smooth surface before testing. Uncoated samples of the as-received substrate, select 5083 coatings and zinc coatings were all tested.
The last corrosion test was exposure in a salt-spray chamber for 500h for zinc deposited and 5083 deposited coatings. Samples 1.5" square were either fully-coated or partially coated to simulate crack repair (partial) or corrosion protection (full) of the samples. The samples were then cross-sectioned and polished for SEM analysis. The edges of the partial coating were examined to look for interfacial attack and possible delamination. The thickness of the coating was measured before and after the exposure using SEM to determine how much coating had been attacked. The coatings were also compared to uncoated coupon in the sensitized (100oC, 168hr) and un-sensitized conditions
26
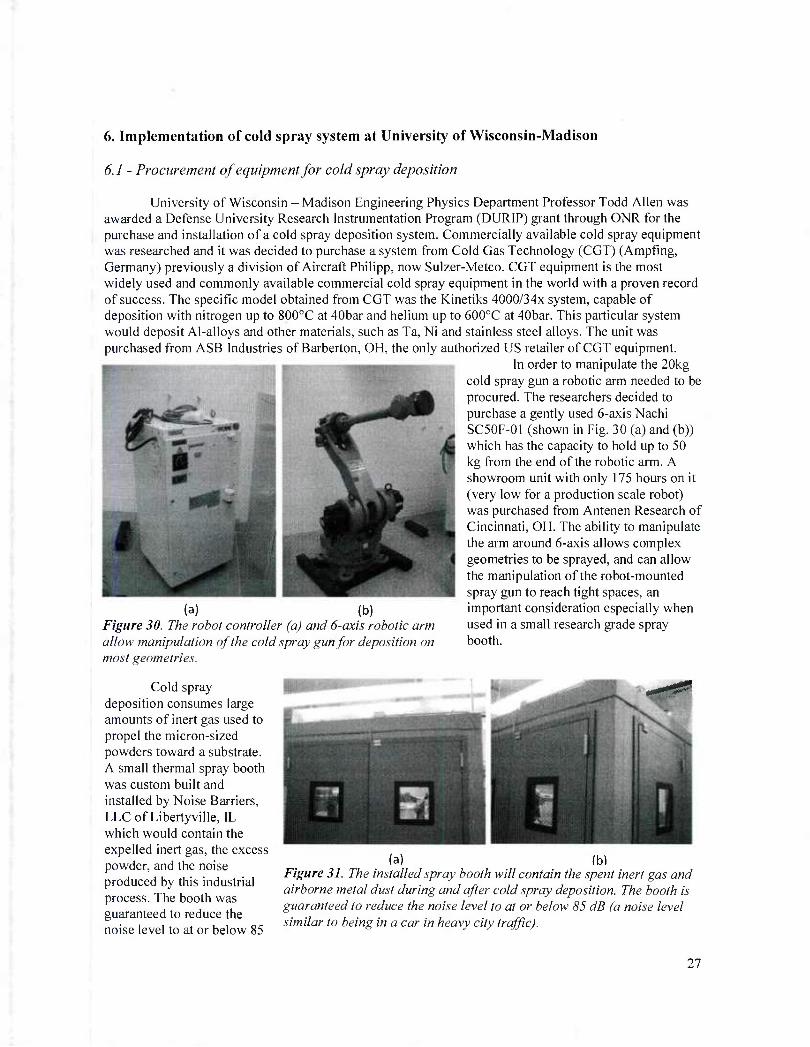
6, Implementation of cold spray system at University of Wisconsin-Madison
6.1 - Procurement of equipment for cold spray deposition
University of Wisconsin - Madison Engineering Physics Department Professor Todd Allen was awarded a Defense University Research Instrumentation Program (DUR1P) grant through ONR for the purchase and installation of a cold spray deposition system. Commercially available cold spray equipment was researched and it was decided to purchase a system from Cold Gas Technology (CGT) (Ampfing, Germany) previously a division of Aircraft Philipp, now Sulzer-Metco. CGT equipment is the most widely used and commonly available commercial cold spray equipment in the world with a proven record of success. The specific model obtained from CGT was the Kinetiks 4000/34x system, capable of deposition with nitrogen up to 800oC at 40bar and helium up to 600oC at 40bar. This particular system would deposit Al-alloys and other materials, such as Ta, Ni and stainless steel alloys. The unit was purchased from ASB Industries of Barberton, OH. the only authorized US retailer of CGT equipment.
In order to manipulate the 20kg cold spray gun a robotic arm needed to be procured. The researchers decided to purchase a gently used 6-axis Nachi SC50F-01 (shown in Fig. 30 (a) and (b)) which has the capacity to hold up to 50 kg from the end of the robotic arm. A showroom unit with only 175 hours on it (very low for a production scale robot) was purchased from Antenen Research of Cincinnati, OH. The ability to manipulate the arm around 6-axis allows complex geometries to be sprayed, and can allow the manipulation of the robot-mounted spray gun to reach tight spaces, an important consideration especially when used in a small research grade spray booth.
(a) (b) Figure 30. The robot controller (a) and 6-axis robotic arm allow manipulation of the cold spray gun for deposition on most geometries.
Cold spray deposition consumes large amounts of inert gas used to propel the micron-sized powders toward a substrate. A small thermal spray booth was custom built and installed by Noise Barriers, LLCofLibertyville, IL which would contain the expelled inert gas, the excess powder, and the noise produced by this industrial process. The booth was guaranteed to reduce the noise level to at or below 85
.*****£*-
(a) (b) Figure 31. The installed spray booth will contain the spent inert gas and airborne metal dust during and after cold spray deposition. The booth is guaranteed to reduce the noise level to at or below 85 dB (a noise level similar to being in a car in heavy city traffic).
21
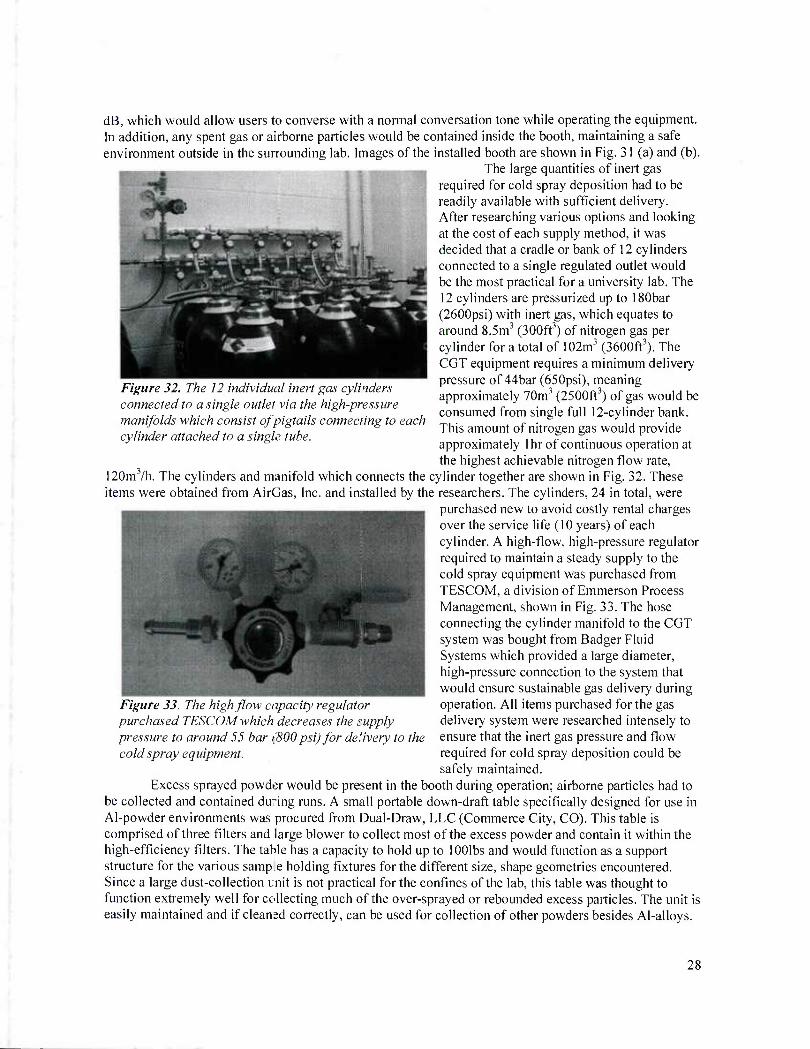
Figure 32. The 12 individual inert gas cylinders connected to a single outlet via the high-pressure manifolds which consist of pigtails connecting to each cylinder attached to a single tube.
dB, which would allow users to converse with a normal conversation tone while operating the equipment. In addition, any spent gas or airborne particles would be contained inside the booth, maintaining a safe environment outside in the surrounding lab. Images of the installed booth are shown in Fig. 31 (a) and (b).
The large quantities of inert gas required for cold spray deposition had to be readily available with sufficient delivery. After researching various options and looking at the cost of each supply method, it was decided that a cradle or bank of 12 cylinders connected to a single regulated outlet would be the most practical for a university lab. The 12 cylinders are pressurized up to !80bar (2600psi) with inert gas, which equates to around 8.5m3 (300ft3) of nitrogen gas per cylinder for a total of 102m3 (3600ft3). The CGT equipment requires a minimum delivery pressure of 44bar (650psi), meaning approximately 70m (2500ft ) of gas would be consumed from single full 12-cylinder bank. This amount of nitrogen gas would provide approximately Ihr of continuous operation at the highest achievable nitrogen flow rate,
120m /h. The cylinders and manifold which connects the cylinder together are shown in Fig. 32. These items were obtained from AirGas, Inc. and installed by the researchers. The cylinders, 24 in total, were
purchased new to avoid costly rental charges over the service life (10 years) of each cylinder. A high-flow, high-pressure regulator required to maintain a steady supply to the cold spray equipment was purchased from TESCOM, a division of Emmerson Process Management, shown in Fig. 33. The hose connecting the cylinder manifold to the CGT system was bought from Badger Fluid Systems which provided a large diameter, high-pressure connection to the system that would ensure sustainable gas delivery during operation. All items purchased for the gas delivery system were researched intensely to ensure that the inert gas pressure and flow required for cold spray deposition could be safely maintained.
Excess sprayed powder would be present in the booth during operation; airborne particles had to be collected and contained during runs. A small portable down-draft table specifically designed for use in Al-powder environments was procured from Dual-Draw, LLC (Commerce City, CO). This table is comprised of three filters and large blower to collect most of the excess powder and contain it within the high-efficiency filters. The table has a capacity to hold up to lOOIbs and would function as a support structure for the various samp.e holding fixtures for the different size, shape geometries encountered. Since a large dust-collection unit is not practical for the confines of the lab, this table was thought to function extremely well for collecting much of the over-sprayed or rebounded excess particles. The unit is easily maintained and if cleaned correctly, can be used for collection of other powders besides Al-alloys.
Figure 33. The high flow capacity regulator purchased TESCOM which decreases the supply pressure to around 55 bar (800 psi) for delivery to the cold spray equipment.
28

6.2 - Safety consultation with Facilities and Planning Management (FPM)
Although cold spray has been used successfully to deposit Al and Al-alloys, depositing such materials requires special consideration. Al-powder is known for its pyrophoritic or explosive nature if present in critical concentrations. Al-alloy dust environments are classified by OSHA's Hazardous Locations as Class II, Group E characterized by the presence of explosive metal dusts, such as Al and Mg dusts [38]. Care must be taken when handling aluminum powder, particularly the un-deposited powder which remains in the environment after spraying. Cold spray is a commercial process with inherent health risks such as loud noise, expulsion of hot inert gas, high-voltage, and excess powder after deposition. These factors along with the combined weights of the necessary support infrastructure made it critical to contact the University of Wisconsin - Madison Facilities and Planning Management (FPM) staff for consultation on how to safely implement this commercial process into the research facilities.
In total, 25 in-person visits were made with FPM to guarantee that the cold spray system could be operated and maintained within the university lab setting. Discussions included safety aspects of the process, the ability to contain the spent inert gas and powder, and the supply of electricity to the equipment occurred before any of the equipment was installed. FPM decided that with proper installation and continued monitoring and maintenance, Al-powder could be deposited safely as long as the concentration of excess powder could be maintained below a critical value. The researchers were required by FPM to maintain a regular cleaning schedule of the booth so that critical concentrations of aluminum powder would not be realized.
Another concern of the FPM staff was that the weight of the combined pieces of equipment (nearly 14,0001bs) would be higher than the design limits of the floor of the lab where the equipment was being installed. The weight limit was of particular concern since the lab was located on the 6th floor of the engineering research building and likely had certain restrictions on how much weight could be distributed throughout the lab space. The FPM staff consulted with an outside structural engineering firm to investigate the limits of the lab floor. With a drawn to scale outline of the lab and intended equipment installation locations it was determined that the installed equipment would be below the designed weight
( limits of the floor. In addition to the weight of all the equipment, large quantities of inert gas would be stored within
the lab in order to operate the cold spray system. Due to restrictions on the quantity of gas which could be stored in a given space, FPM checked the ventilation and air supply capabilities of the lab air handling system to determine if the amount of gas contained within the cylinders could be effectively removed in the improbable event all gas be released simultaneously. It was determined that 24 cylinders of inert gas could be stored concurrently in the lab without violating any regulations.
Since inert gas would be expelled at rates up to 120m /h (70.6 cubic feet per minute (cfm)) for nitrogen and 250m3/h (I47cfm) for helium during the cold spray process, the spent gas and loud noise (inherent to this commercial process) would have to be contained during deposition. A custom built thermal spray booth was designed with the intention of connecting the booth to the building exhaust, extracting the spent inert gas from the booth and releasing it outside of the building. The inter-connect between the building's exhaust duct and the booth would also serve to filter small quantities of airborne particles not collected by the down-draft table while removing the spent gas. Any remaining powder not collected by either the down-draft table or the filtered building exhaust could be cleaned up and disposed of after settling.
The only room available for the installation of this equipment did have the capability to provide high amperage 480V power to both the cold spray system and the robot. However, modifications were made in order make the connections between the 480V supply present in the lab and the equipment. FPM staff brought in certified electricians to provide estimates for the work to supply power to the equipment as well as install emergency door interlocks which would connect to the emergency stops of the equipment. If the door of the booth was opened during operation the interlocks would trip and the equipment would cease immediately. It was also decided that since Al-powder could be combustible in
29
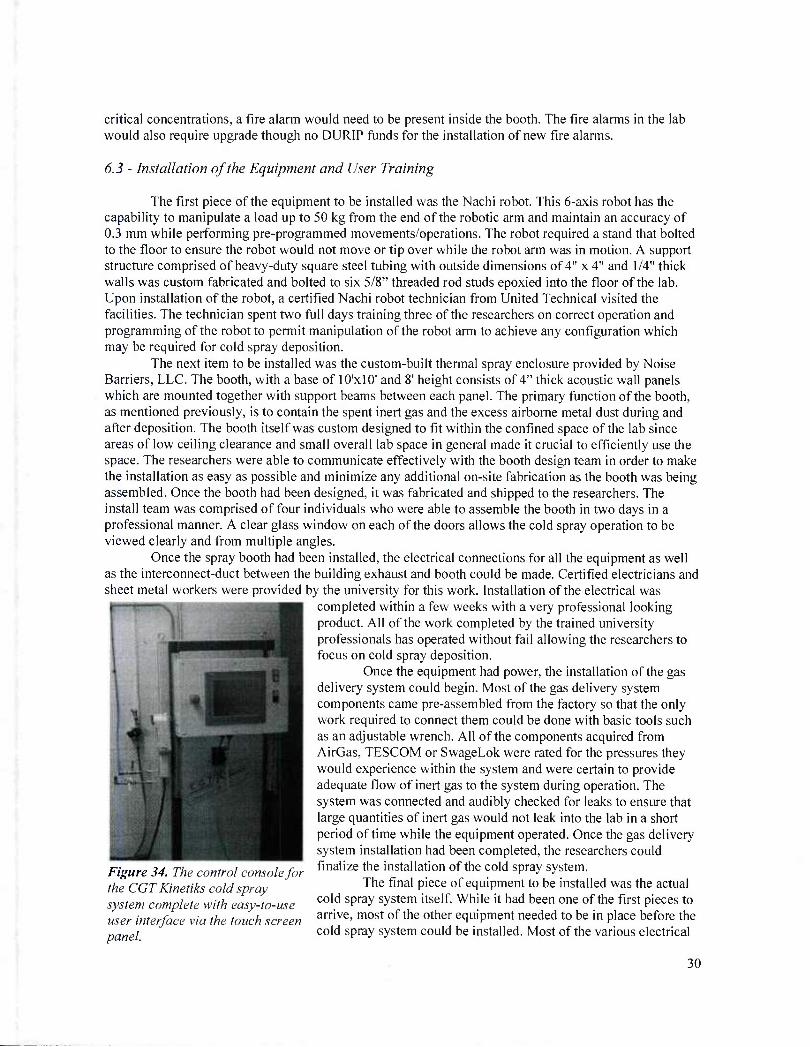
critical concentrations, a fire alarm would need to be present inside the booth. The fire alarms in the lab would also require upgrade though no DURIP funds for the installation of new fire alarms.
6.3 - Installation of the Equipment and User Training
The first piece of the equipment to be installed was the Nachi robot. This 6-axis robot has the capability to manipulate a load up to 50 kg from the end of the robotic arm and maintain an accuracy of 0.3 mm while performing pre-programmed movements/operations. The robot required a stand that bolted to the floor to ensure the robot would not move or tip over while the robot arm was in motion. A support structure comprised of heavy-duty square steel tubing with outside dimensions of 4" x 4" and 1/4" thick walls was custom fabricated and bolted to six 5/8" threaded rod studs epoxied into the floor of the lab. Upon installation of the robot, a certified Nachi robot technician from United Technical visited the facilities. The technician spent two full days training three of the researchers on correct operation and programming of the robot to permit manipulation of the robot arm to achieve any configuration which may be required for cold spray deposition.
The next item to be installed was the custom-built thermal spray enclosure provided by Noise Barriers, LLC. The booth, with a base of 10'xlO' and 8' height consists of 4" thick acoustic wall panels which are mounted together with support beams between each panel. The primary function of the booth, as mentioned previously, is to contain the spent inert gas and the excess airborne metal dust during and after deposition. The booth itself was custom designed to fit within the confined space of the lab since areas of low ceiling clearance and small overall lab space in general made it crucial to efficiently use the space. The researchers were able to communicate effectively with the booth design team in order to make the installation as easy as possible and minimize any additional on-site fabrication as the booth was being assembled. Once the booth had been designed, it was fabricated and shipped to the researchers. The install team was comprised of four individuals who were able to assemble the booth in two days in a professional manner. A clear glass window on each of the doors allows the cold spray operation to be viewed clearly and from multiple angles.
Once the spray booth had been installed, the electrical connections for all the equipment as well as the interconnect-duct between the building exhaust and booth could be made. Certified electricians and sheet metal workers were provided by the university for this work. Installation of the electrical was
completed within a few weeks with a very professional looking product. All of the work completed by the trained university professionals has operated without fail allowing the researchers to focus on cold spray deposition.
Once the equipment had power, the installation of the gas delivery system could begin. Most of the gas delivery system components came pre-assembled from the factory so that the only work required to connect them could be done with basic tools such as an adjustable wrench. All of the components acquired from AirGas, TESCOM or SwageLok were rated for the pressures they would experience within the system and were certain to provide adequate flow of inert gas to the system during operation. The system was connected and audibly checked for leaks to ensure that large quantities of inert gas would not leak into the lab in a short period of time while the equipment operated. Once the gas delivery system installation had been completed, the researchers could
Figure 34. 7 fina1ize the installation of the cold spray system. the CGTKinetiks cold spray The final Piece of equ'Pment to be installed was the actual
system complete with easy-to-use cold SW s^m ltself- While XX had been one of the first Pieces to
user interface via the touch screen arnve' most of the other equiPme"t needed to be in place before the panel cold spray system could be installed. Most of the various electrical
30
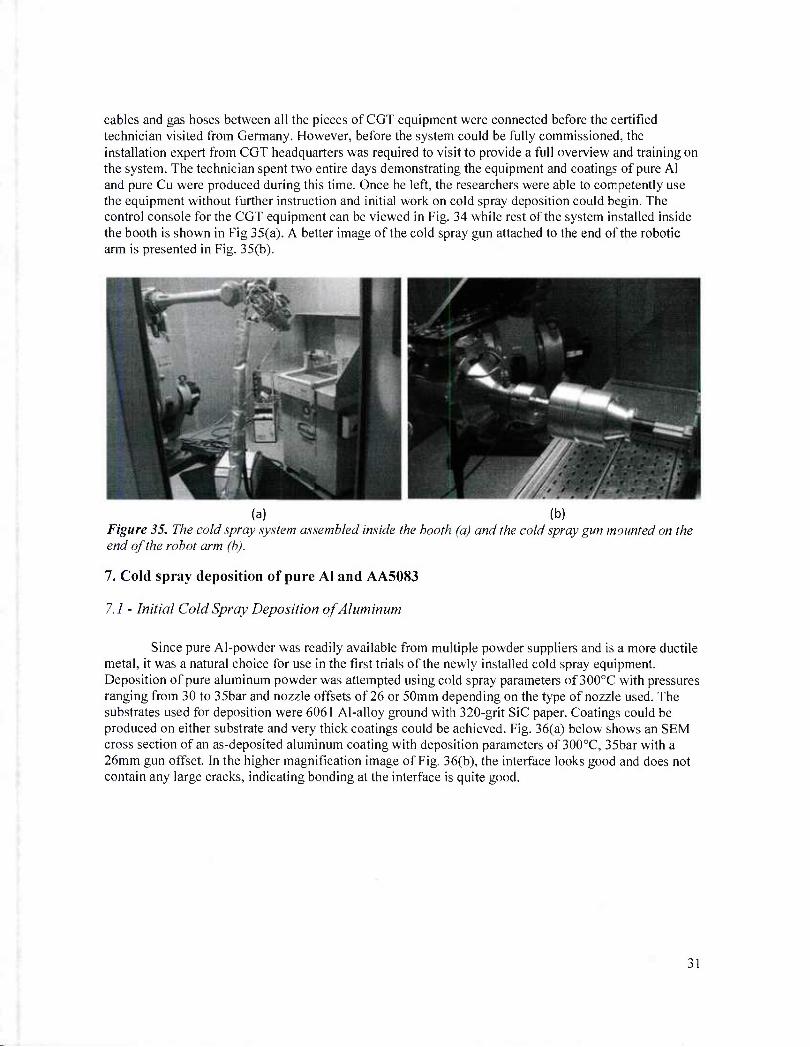
cables and gas hoses between all the pieces of CGT equipment were connected before the certified technician visited from Germany. However, before the system could be fully commissioned, the installation expert from CGT headquarters was required to visit to provide a full overview and training on the system. The technician spent two entire days demonstrating the equipment and coatings of pure Al and pure Cu were produced during this time. Once he left, the researchers were able to competently use the equipment without further instruction and initial work on cold spray deposition could begin. The control console for the CGT equipment can be viewed in Fig. 34 while rest of the system installed inside the booth is shown in Fig 35(a). A better image of the cold spray gun attached to the end of the robotic arm is presented in Fig. 35(b).
(a) (b) Figure 35. The cold spray system assembled inside the booth (a) and the cold spray gun mounted on the end of the robot arm (b).
7. Cold spray deposition of pure AI and AA5083
7.1 - Initial Cold Spray Deposition of Aluminum
Since pure Al-powder was readily available from multiple powder suppliers and is a more ductile metal, it was a natural choice for use in the first trials of the newly installed cold spray equipment. Deposition of pure aluminum powder was attempted using cold spray parameters of 300°C with pressures ranging from 30 to 35bar and nozzle offsets of 26 or 50mm depending on the type of nozzle used. The substrates used for deposition were 6061 Al-alloy ground with 320-grit SiC paper. Coatings could be produced on either substrate and very thick coatings could be achieved. Fig. 36(a) below shows an SEM cross section of an as-deposited aluminum coating with deposition parameters of 300oC. 35bar with a 26mm gun offset. In the higher magnification image of Fig. 36(b), the interface looks good and does not contain any large cracks, indicating bonding at the interface is quite good.

Figure 36. The deposited pure Al coating on the AA6061 substrate SEM cross-section image (a) reveals a nice coating. The higher-magnification image (b) displays a nice coating-substrate interface.
Cold spray deposition is known for producing low-oxygen content coatings and coating-substrate interfaces. It is hypothesized that as the accelerated particles impinge upon the surface of the substrate, ox.des and other surface contaminants are likely broken up and blasted away by the leading edge of the cold spray plume. Due to this phenomenon a qualitative measure of interfacial bonding can be produced by performing an EDS line scan across the interface. If the line scan does not show an increase in oxygen content at the interface, then it is safe to assume the bonding of the coating to the substrate is adequate. An EDS line scan across the coating-substrate interface of the sample shown in Fig. 36 was taken to confirm that no increase in oxygen concentration at this boundary occurred which is indicative of good coating adhesion and is shown below in Fig. 37.
1 •mm ...wttmz.—|»K:- AlQn6061AA
z: ■-■^v. -:-i:'.,v:::.
100
SB
so 70
| so
l« | AD
30
-—"-'. ""*•" ""'V ̂ l
M
- ; < \ :.
1 ) 0 I Q.4 0.6
distance (umj U
(a) (b) Figure 37. An EDS line scan across the interface of the pure Al coating (a) deposited on the 6061 substrate does not show an increase in oxygen at the interface (b) indicating the bonding of coating to substrate is good.
In addition to EDS line scans, XRD was performed on a STOE XRD machine which utilizes Cu K-a (1.54 A wavelength) as the x-ray source. Since cold spray is a solid state deposition process, the composition and microstructure of the feedstock powder should be nearly identical to that of the ceposited coating [30]. XRD spectra of the pure aluminum powder and coating should confirm this fact if
32

the peaks in the as-received powder match the as-deposited coating. Peak broadening of the coating, compared to the powder, may also reveal the inherent high deformation the powder experiences and residua! stress in the coating after deposition. Fig. 39 below contains the resultant spectrums for the as- received AI powder and the deposited coating. The peaks match nicely with one another and no differences are observed. In Fig. 38, the slight peak broadening observed in the coating peak indicates residual compressive stresses within the coating.
1O09S
90* ■
« ■
r ;
—Sprayed Pure A! Csstiftg
fflMMC
Figure 39. The X-Ray Diffraction Spectrum for the as- deposited pure Al coating reveals 4 distinct peaks which after analysis indicated that the powder and coating were indeed pure Al with very little oxygen.
Figure 38. A zoomed image of the peaks at 20 = 65" displays peak broadening indicative of residual stress in the deposited coating.
These initial results with pure Al powder were a promising start before further investigation of 5083 powder deposition. If pure Al could be deposited fairly easily, then any alloy form of Al should deposit nicely as well. It was decided that the next logical step was to begin deposition of AA5083 to determine how the powder would deposit and to decide the best parameter set for quality deposition.
7.2 - Initial investigations on the deposition behavior ofAA5083
The first parameter set used for deposition of AA5083 powder was decided to be 300oC, 35bar with a 26mm offset, the same parameters used for the pure Al deposition. For the additional runs during this first trial, the temperature was increased to 400oC which would increase the velocity of particles. The substrate was ground to remove the as-received surface finish and provide a fresh surface for deposition. It was observed that the deposition of 5083 was not as proficient with similar parameters used for the pure Al powder. The coatings also had some delamination associated with them which would prevent post-deposition processing or metallography required for any further analysis. Based on these initial trials, it was decided that a run should be performed containing a larger and more comprehensive set of parameters.
1
- 1 *f%m ,-***-•'■
»<«- JMx M mimmm
Q7 rvm MM
^^^H ̂ ^^B^^^H
Figure 40. The SEM cross-section of the coating deposited at 300°C, 35har with an offset of 41mm reveals a fairly dense coating with poor adhesion at the coating-substrate interface.
33

This larger parameter set contained 12 individual combinations of temperature (300 or 400oC), pressure (30, 35 or 39bar) and gun offset (26 or 41mm). These runs would provide a quick macroscopic comparison of the relative deposition efficiencies of each combination which could then be further investigated with standard metallographic techniques. The coatings would be deposited using a powder feed rate of approximately 18g/min with the gun traversing the sample at 1 OOOmm/s. The runs were performed in a randomly selected order with four passes of the gun for each parameter set. Upon inspection after deposition, it was noticed that parameters with the higher temperature of 400oC deposited more material than 300oC parameters for all pressures and offsets. An SEM cross-section of a coating deposited at 300oC, 35bar and an offset of 41mm shows a fairly dense coating with severe delamination of the coating at the coating-substrate interface as presented in Fig. 40. Another SEM cross-sectional image of a sample deposited at 300oC, this time with a pressure of 39bar and an offset of 26mm, is displayed in Fig.41 (a). The coating of the higher-pressure sample does still have some large cracks in the coating but the interface is much improved (b).
(a) (b) Figure 41. The coating deposited with parameters of300°C, 39 bar with an offset of 26mm does show improve bonding the coating substrate in (b) but does not have a very thick coating layer (a).
Figure 42. The increase in temperature from 300°C to 400°C did produce a better adhered coating with fewer defects as shown in the SEM image of the cross- sectioned coating.
While the 300oC coatings did deposit a thin layer of coating, a much thicker coating was observed for the coatings deposited with a temperature of 400oC. Metallographic inspection of the cross-section using SEM of the sample deposited at 400oC, 35 bar with an offset of 26mm reveals a well adhered interface with a thicker coating that contained less defects as shown in Fig. 42. This same sample does contain some small cracks at the interface but an EDS line scan over across the interface in a region without a crack does not reveal an increase in oxygen concentration at the coating substrate interface as illustrated in the EDS line scan images of Fig. 43 (a) and (b).
34

m S083 Al Alloy (41X JSbw, ofto: 41nwn)
*l « » : ••• 1 w
- —O-Wts
1 ** ■ ■ ■ ■
1 »
s ! 1 » 4 i «. t DisUotflMmj
(a) (b) Figure 43. The EDS line scan in (h) across the coating-substrate interface in (a) of a coating deposited with parameters of400oC, 35 bar and offset of 26mm does not show an increase in the oxygen content at the interface, characteristic of good cold sprayed coatings.
Since the increase in temperature and pressure resulted in a decrease of defects within the coating combined with an improved interface, SEM analysis of the most aggressive sample set of the 12 runs should reveal a well-adhered, very dense coating. The pressure increase to 39bar and the offset decrease to 26mm at 400CC did in fact yield the best coating of all 12 parameters. The interface, represented by the dashed line in Fig. 44 is barely distinguishable indicating the coating is well bonded. The coating itself still contains some defects but the cracks and voids are smaller overall and less frequent.
Figure 44. The coating cross-section of the 400°C, 39bar, 26mm offset coating highlights that the interface is becoming less distinguishable while the crack and voids present are smaller and less frequent.
7.3 - Development of improved AA5083 coatings
With the knowledge gained from the 12-combination run, the researchers decided that higher temperature was required for good deposition. Since 5083 has a melting point around 590oC, the researchers decided to try 450oC with a pressure of 40 bar and offsets ranging from 18 to 26mm. As presented below in the cross-sectional images of Fig. 45(a) and (b), the coating was further improved with a nearly undetectable interface and minimal crack and holes in the coating by using deposition parameters of 450oC, 40bar and an offset of 18mm.
35

^ **».
""Hfc <>/;<.
*<»% **%»
w -.-;■'
^
*•(*•*»**:* m~. MMMWM (»»»»!>«>» •»•»••«
(a) (b)
Figure 45. The SEM cross sectional image of (a) again reveals that the higher temperature leads to improved interface bonding and even in the higher magnification image of(b) the coating to substrate transition is nearly seamless.
The higher temperature of the gas used for the 450oC depositions would definitely lead to greater heating of the substrate itself. If the sample was heated to a high enough temperature during deposition, p-phase precipitates could form in noticeable quantities. The presence of p-phase might be revealed by using EDS elemental mapping of the region at/near the coating-substrate interface. Elemental maps, presented in Fig. 46, do not reveal any large P-phase precipitates in the substrate or coating material and the interface, represented by the solid line, is nearly indistinguishable. However, most P-phase manifests itself as very small particles, and is really visible only through careful etching.
Investigation of coatings produced with 450oC, 39bar and an offset of 26mm revealed that there was seamless transition from coating to substrate as highlighted in the EDS line scan of Fig. 47. Further SEM analysis of the coating once again shows a nice coating-substrate interface and still some small cracks and voids within the coating as displayed in Fig. 48. However, the coating deposited was much thicker, up to 240|am in this sample. The resultant improvements in the coating due to increased temperature imply that the critical deposition velocity for AA5083 is higher than that of pure Al powder, since the higher gas temperature translates to an increase in gas velocity as it expands and exits the nozzle.
Figure 46. EDS Elemental maps near the coating-substrate, represented by the aqua blue line do not show any large p-phase precipitates in the substrate of the sample shown in fig. 45 above.
36
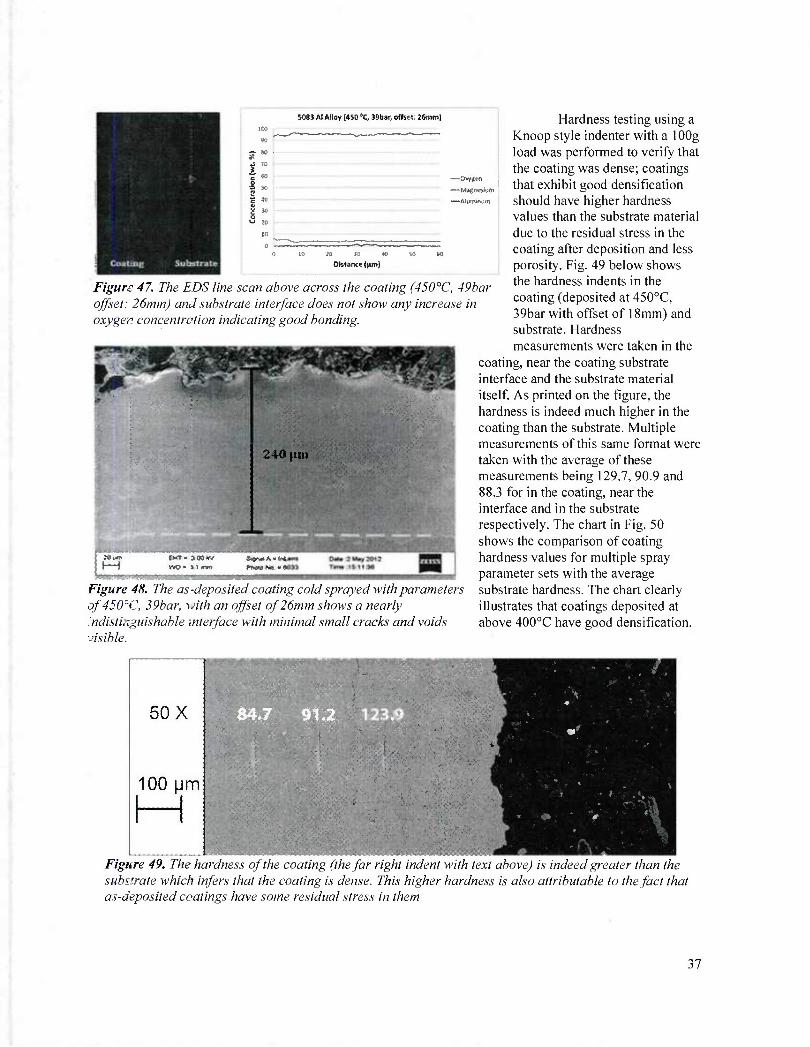
5083 Al Alloy (450 'C, 39bir, offset: 2Smm)
—Oxygen
—Afumioum
Oisunce (|un)
Figure 47. The EDS line scan above across the coating (450°C, 49bar offset: 26mm) and substrate interface does not show any increase in oxygen concentration indicating good bonding.
240 (MM
l—I
Figure 48. The as -deposited coating cold sprayed with parameters of450zC, 39bar, \Jith an offset of 26mm shows a nearly 'ndistinguishable interface with minimal small cracks and voids visible.
Hardness testing using a Knoop style indenter with a lOOg load was performed to verify that the coating was dense; coatings that exhibit good densification should have higher hardness values than the substrate material due to the residual stress in the coating after deposition and less porosity. Fig. 49 below shows the hardness indents in the coating (deposited at 450oC, 39bar with offset of 18mm) and substrate. Hardness measurements were taken in the
coating, near the coating substrate interface and the substrate material itself. As printed on the figure, the hardness is indeed much higher in the coating than the substrate. Multiple measurements of this same format were taken with the average of these measurements being 129.7, 90.9 and 88.3 for in the coating, near the interface and in the substrate respectively. The chart in Fig. 50 shows the comparison of coating hardness values for multiple spray parameter sets with the average substrate hardness. The chart clearly illustrates that coatings deposited at above 400oC have good densification.
SOX 84.7 91.2 12B.9
100 pm
y '■ "
Figure 49. The hardness of the coating (the far right indent with text above) is indeed greater than the substrate which infers that the coating is dense. This higher hardness is also attributable to the fact that as-deposited coatings have some residual stress in them
37

160
~140 ->
i 120 -
r 100 -
■
S 80 - c | 60 -
| 40 ■
■ 20 -
0 -
.
Spray Parameter Set
■ 400 3918 11450 3918 •400 35 26 ■450 3926
■4003041 Si4003541 «4003544 Figure 50. The average hardness values of various deposition parameters are displayed above and reveal that most of the coatings produced at a spray temperature of400°C or above do show increased hardness compared to the underlying substrate.
Further characterization of the deposited coatings was done with XRD to ensure that no significant compositional changes occurred during cold spray. XRD was performed on the as-received 5083 powder, as-received 5083- Hl 16 substrate, and select deposited coatings. Fig. 51 is a graphic of the powder, substrate and coating x-ray spectra which demonstrates that the coating was essentially unchanged from the feedstock powder and was nearly identical to the substrate as well. Fig. 52 is a close-up of the peak at 28 = 44.5° representing the (200) plane in the Al-alloy. The peak for the coating does display
—As-Received S083 Al AHoy Powder
—As-Received 5083 A( Alloy Plate
—Sprayed 5083 Al Alloy Coating
. 1 1
) 1. Ulli
- ■ J
uoo
^ mi! A .A ^ wm
M 60 ItheiaCl
Figure 51. The x-ray spectra of the 5083AA substrate (middle), 5083AA as-received powder (top) and 5083AA deposited coating (bottom) show only pure Al peaks as expected since the Mg should in solid solution with Al. The indexed peaks are those of 5083.
some broadening as expected since the as-deposited coating should have some residual stress associated with the severe deformation.
38

nti
S 30S
As Rpceived 5083 Al Alloy Powder
Spayed 5083 Al Alloy Coating
liur,
■c.
0% ***"
Figure 52. The peak-broadening phenomena associated with residual stress is observed, though only slightly, for the spectrum of the coating compared to the as-received powder.
475 0C 500 0C The present trend in
depositing 5083 indicated that increases in temperature have a positive effect on the density and overall appearance of the coating. For this reason, temperatures of 4750C and 500oC were attempted using a pressure of 40bar and offset of 26mm. These temperature are the highest possible with nitrogen as the propellant since the melting temperature of 5083 is around 590oC. It is known that particles with smaller mass will heat up to a temperature nearer that of the inert gas than large particles. Since the as-received powder contain a large fraction of very fine particles, temperatures above 500oC may cause melting leading to problems with deposition and possibly clogging the equipment.
Coatings deposited with these higher temperatures are shown in Fig. 53(a) through
(d). Fig. 53(a) and (b) are SEM cross-sections of the as-deposited coatings. It can be seen that the coating looks very nice but small cracks and voids are still present. The size of these cracks appears to be decreasing with the higher temperatures, although actual quantification of void size has not been done. In
(d)
Figure 53. The as-deposited coating (a) and (b) have very few voids and cracks with about 0.5mm and 1mm of deposited coating on the 4750C and 500°C samples, respectively. The interface for both sample (c) and (d) also show a seamless transition, a dashed line represents the interface.
39
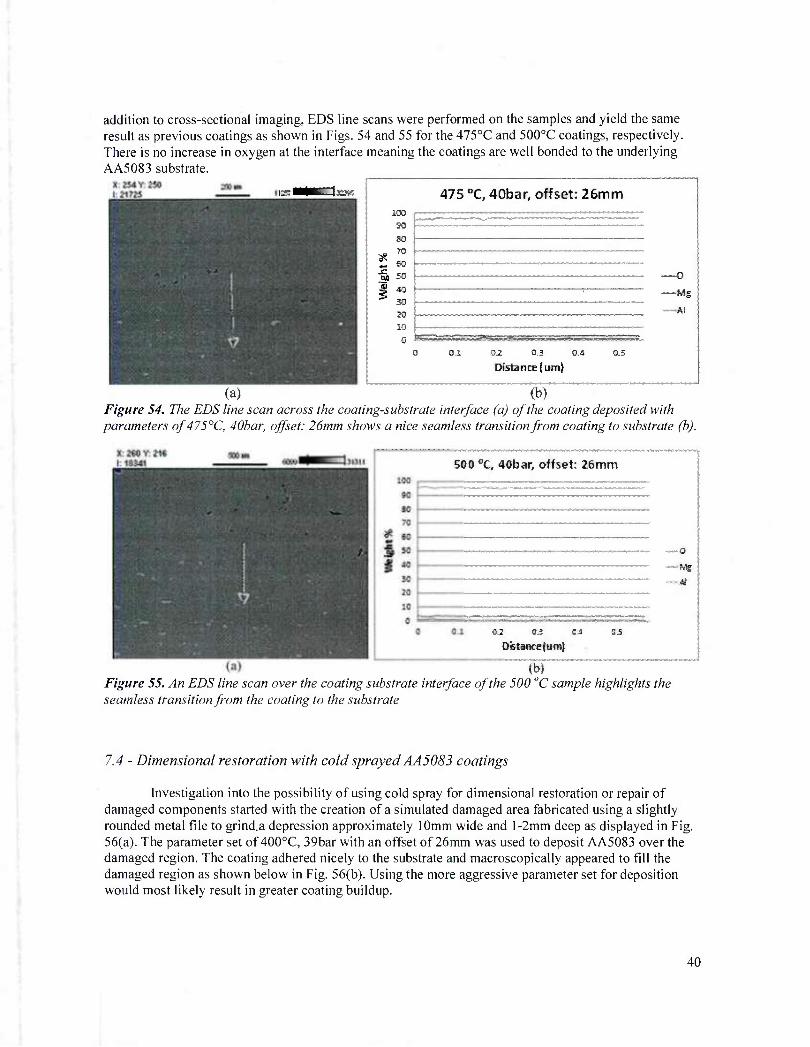
addition to cross-sectional imaging, EDS line scans were performed on the samples and yield the same result as previous coatings as shown in Figs. 54 and 55 for the 4750C and 500°C coatings, respectively. There is no increase in oxygen at the interface meaning the coatings are well bonded to the underlying AA5083 substrate.
^■(■EIJXK* 475 0C, 40bar, offset: 26mm 1OT
50
■§> so 1 40
JO 2B 10
0
-O
-Mg
Al
0.1 0.2 0.3 0.4 0.5
Distancefumj
(a) (b) Figure 54. The EDS line scan across the coating-substrate interface (a) of the coating deposited with parameters of475°C, 40bar, offset: 26mm shows a nice seamless transition from coating to substrate (b).
500 "C, 40bar. offset: 26mm
— Ml
■■■' Ai
az cs s^ DistatKe(uni)
S3
m Figure 55. An EDS line scan over the coating substrate interface of the 500 "C sample highlights the seamless transition from the coating to the substrate
7.4 - Dimensional restoration with cold sprayed AA5083 coatings
Investigation into the possibility of using cold spray for dimensional restoration or repair of damaged components started with the creation of a simulated damaged area fabricated using a slightly rounded metal file to grind a depression approximately I Omm wide and l-2mm deep as displayed in Fig. 56(a). The parameter set of 400oC, 39bar with an offset of 26mm was used to deposit AA5083 over the damaged region. The coating adhered nicely to the substrate and macroscopically appeared to fill the damaged region as shown below in Fig. 56(b). Using the more aggressive parameter set for deposition would most likely result in greater coating buildup.
40

fa) fb) Figure 56. The damaged region in (a) was created using a siightly rounded metal file to create a sloped region which was then filled using cold spray deposition of 5083 powder. The coating did fill the damaged region fb) and post-deposition processing of the coating should be possible.
The initial work to repair this damaged region was deemed a success and plans were made to attempt repair in another geometry where the gouge was narrower and deeper, a more challenging geometry to fill. The more aggressively damaged area was represented with an approximately 3mm wide by 3mm deep gouge created with a round file. An accurate drawing of this geometry is shown below in Fig. 57(a). The robot was programmed to move over this geometry and a repair was attempted. Fig. 57(b) below shows the repaired damage after deposition using the same parameters as the less aggressive simulated damage described above.
(a) (h) Figure 57. Although the 3mm wide gouge illustrated in (a) was deeper and narrower than the previous damage repair attempt, deposition inside the coating was still possible (b).
The researchers thought it would be useful to predict the deposition behavior inside varying crack or crevice geometries to minimize excessive coating build-up abound the area rear damaged regions. Using the relatively accurate assumption that the spray plume would exhibit a Gaussian type distribution, a MatLab computer code was generated which receives input on the path the spray gun takes over the damage and the geometry of the damaged region (round, triangular, etc.) then output the predicted crack filling behavior. The predicted filling behavior for the 3 wide round gouge deposited (as discussed above) did correlate well with the observed deposition behavior and these initial results are promising.
41

7,5 - Deposition on previously sensitized AA5083-H116 substrate
The ability to deposit 5083 coatings with cold spray on already sensitized 5083 substrates is also important to the success of this work. Cold spray is primarily being considered as a repair technique in which sensitized material could be coated to increase the corrosion resistance. Initial trials using deposition parameters of 450oC, 40bar and an offset of 26mm were successful in depositing coating on sensitized material. SEM cross-sections of this sample, in Fig. 58, reveal that the coating- substrate interface looks good with no large cracks or areas of delamination observed. Small cracks and voids are present in the coating, very similar to previous coatings on un-sensitized material with the same deposition parameters. This result is very important since the sensitized material does undergo a microstructural change during the heat-treatment. Elemental EDS maps shown below in Fig. 59, taken
from the area demarcated by the yellow-dashed rectangle in Fig. 58 display a very rich Mg phase near the interface. It should be noted that the Mg concemration in the dark red regions was very high, possibly indicative of p-phase, though a more detailed metallographic analysis would be desirable.
Figure 3S. Deposition on previously heavily- sensitized materials (~40 mg/cm expected) was successfiii with some small cracks and void with a very faint interface, represented by the green line.
Figure 39 The presence of a Mg-rich phase in a heavily-sensitized substrate of a coating deposited with parameters of450oC, 40bar and an offset of 261:1m indicates that the substrate does indeed contain /?- phase. These EDS elemental maps were taken frcm the area demarcated by the dash-rectangle of Fig. 58.
7.6 - Effect of particle size on AA5083 deposition behavior
Once the particles were sieved into the small and large particle size ranges, coatings were deposited with various parameters. The best AA5C83 coatings deposited thus far were achieved with nitrogen process gas at a gas pre-heat temperature of 500oC, 40bar and offset of 26mm. A gas pre-heat tempera: jre of 300oC, 40bar and 26mm offset, had worked for pure Al but not as well for AA5083. It was thought that the wide particle size range of the 5383, coupled with the increased strength of 5083 due to the addiion of Mg (vs. pure Al) required a higher velocity and/or powder particle temperature achieved using the ligher 500oC gas temperature. It was cecided to compare the deposition behavior of two size ranges (5-20|j,m and 20-44^m) by changing the gas pre-heat temperature, either 400oC or 500oC while naintairng constant process gas (nitrogen), pressure (40bar), and offset (26mm). This increase in t^mperaiure would provide both increased particl; velocity and slightly higher particle temperatures. However, an increase in the particle temperatu'e s not always desirable. Substituting helium for nitrogen i? anothe' way to increase particle velocity as the lower molecular weight of helium allows it to travel
42
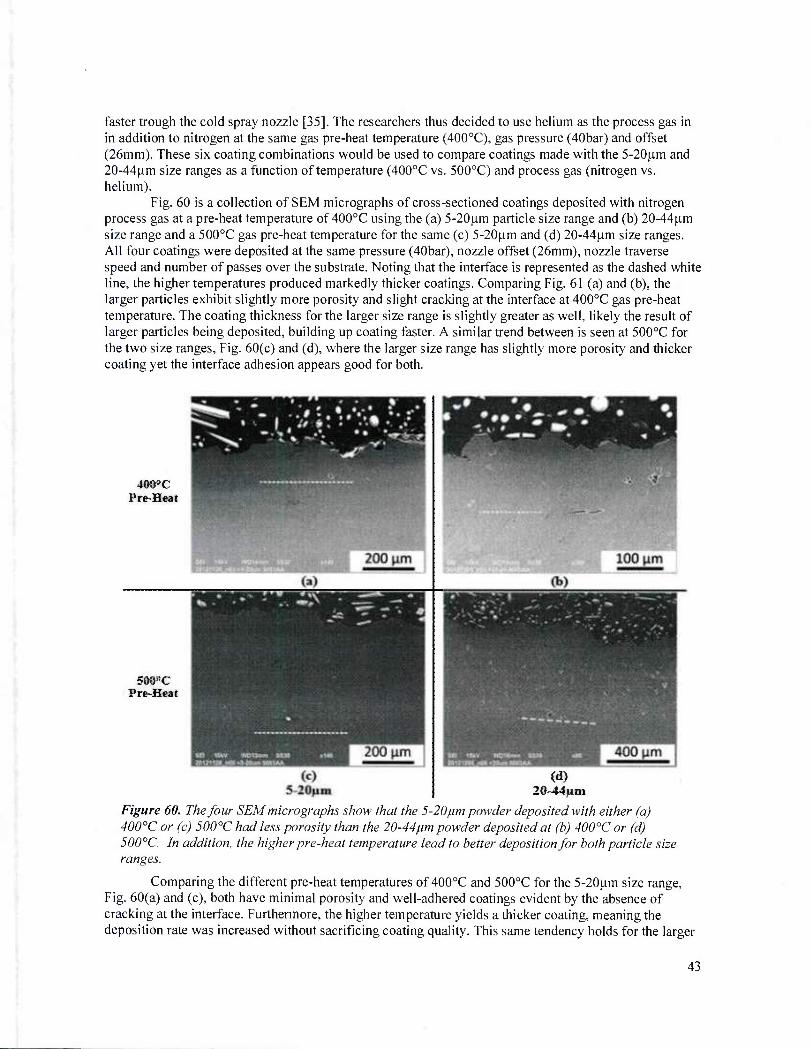
faster trough the cold spray nozzle [35]. The researchers thus decided to use helium as the process gas in in addition to nitrogen at the same gas pre-heat temperature (400oC), gas pressure (40bar) and offset (26mm). These six coating combinations would be used to compare coatings made with the 5-20|im and 20-44|jm size ranges as a function of temperature (400oC vs. 500oC) and process gas (nitrogen vs. helium).
Fig. 60 is a collection of SEM micrographs of cross-sectioned coatings deposited with nitrogen process gas at a pre-heat temperature of 400oC using the (a) 5-20|am particle size range and (b) 20-44nm size range and a 500oC gas pre-heat temperature for the same (c) 5-20|jm and (d) 20-44nm size ranges. All four coatings were deposited at the same pressure (40bar), nozzle offset (26mm), nozzle traverse speed and number of passes over the substrate. Noting that the interface is represented as the dashed white line, the higher temperatures produced markedly thicker coatings. Comparing Fig. 61 (a) and (b), the larger particles exhibit slightly more porosity and slight cracking at the interface at 400°C gas pre-heat temperature. The coating thickness for the larger size range is slightly greater as well, likely the result of larger particles being deposited, building up coating faster. A similar trend between is seen at 500oC for the two size ranges, Fig. 60(c) and (d), where the larger size range has slightly more porosity and thicker coating yet the interface adhesion appears good for both.
4(HPC Pre-Heat
5WC Pre-Heat
(d) 20-44pin
Figure 60. The four SEM micrographs show that the 5-20fjm powder deposited with either (a) 4()0oC or (c) 500oC had less porosity than the 20-44ftm powder deposited at (b) 400°C or (d) 500oC. In addition, the higher pre-heat temperature lead to better deposition for both particle size ranges.
Comparing the different pre-heat temperatures of 400oC and 500oC for the S-lO^m size range, Fig. 60(a) and (c), both have minimal porosity and well-adhered coatings evident by the absence of cracking at the interface. Furthermore, the higher temperature yields a thicker coating, meaning the deposition rate was increased without sacrificing coating quality. This same tendency holds for the larger
43
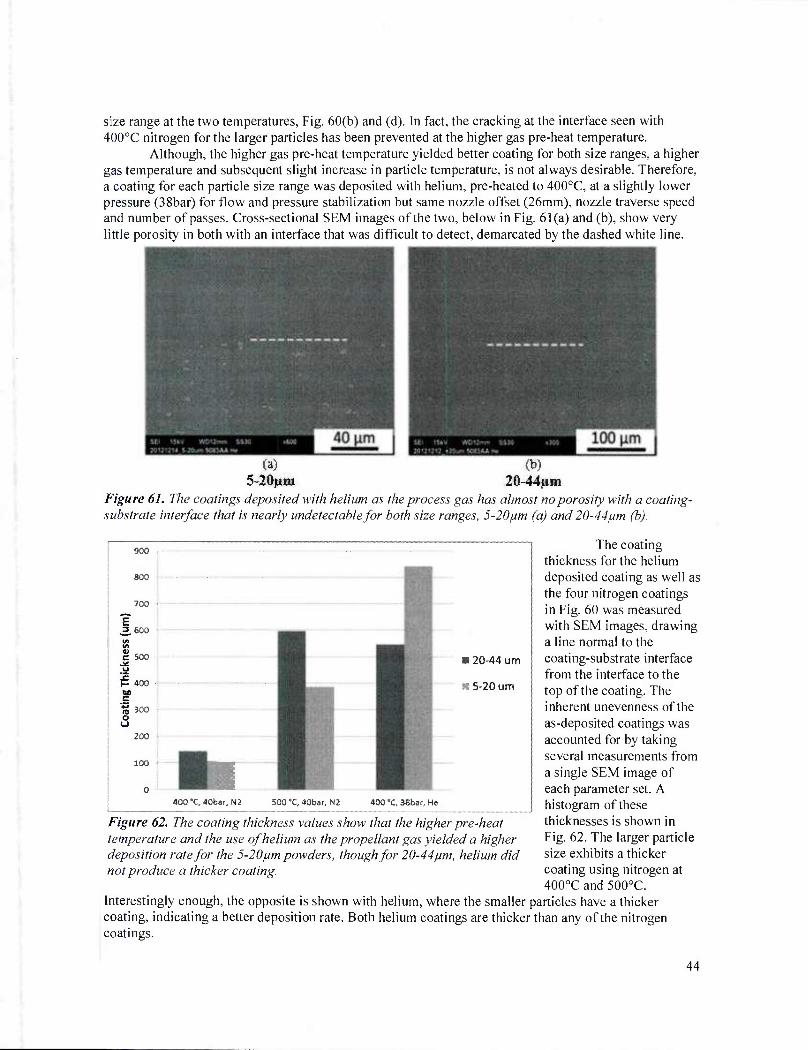
size range at the two temperatures, Fig. 60(b) and (d). In fact, the cracking at the interface seen with 400oC nitrogen for the larger particles has been prevented at the higher gas pre-heat temperature.
Although, the higher gas pre-heat temperature yielded better coating for both size ranges, a higher gas temperature and subsequent slight increase in particle temperature, is not always desirable. Therefore, a coating for each particle size range was deposited with helium, pre-heated to 400oC, at a slightly lower pressure (38bar) for flow and pressure stabilization but same nozzle offset (26mm), nozzle traverse speed and number of passes. Cross-sectional SEM images of the two, below in Fig. 61(a) and (b), show very little porosity in both with an interface that was difficult to detect, demarcated by the dashed white line.
(a) (b) 5-20|im 20-44fiin
Figure 61. The coatings deposited with helium as the process gas has almost no porosity with a coating- substrate interface that is nearly undetectable for both size ranges, 5-20ftm (a) and 20-44ftm (b).
900
800
700
E 3,600
II C 500
P 400 00
% 300 o u
200
100
■ 20-44 urn
m S-20 urn
The coating thickness for the helium deposited coating as well as the four nitrogen coatings in Fig. 60 was measured with SEM images, drawing a line normal to the coating-substrate interface from the interface to the top of the coating. The inherent unevenness of the as-deposited coatings was accounted for by taking several measurements from a single SEM image of each parameter set. A histogram of these thicknesses is shown in Fig. 62. The larger particle size exhibits a thicker coating using nitrogen at 400oC and 500oC.
Interestingly enough, the opposite is shown with helium, where the smaller particles have a thicker coating, indicating a better deposition rate. Both helium coatings are thicker than any of the nitrogen coatings.
44
400*C, 40bar, N2 500 X 40bar, N2 400 "C, 38bar, He
Figure 62. The coating thickness values show that the higher pre-heat temperature and the use of helium as the propellant gas yielded a higher deposition rate for the 5-20fim powders, though for 20-44fim, helium did not produce a thicker coating.

The different particle size coatings thus far had been characterized qualitatively using cross- sectional SEM to observe coating porosity and the coating-substrate interface, and quantitatively using thickness measurements. Hardness testing was selected as another quantitative technique for determining the densification of the coatings or how well the particles deformed upon impact. The presence of porosity or subpar particle-to-particle bonding would be seen if the coating hardness was lower than the underlying substrate or comparable AA5083 coatings. Hardness measurements were performed using a Knoop style indenter and lOOg load. Measurements were taken inside the coating as well as inside the substrate near and far from the interface to observe any substrate deformation after deposition. A histogram of the resultant hardness values for the six parameter sets previously compared by coating thickness is shown below in Fig. 63. The helium deposited coatings exhibit a significantly higher hardness than the nitrogen coatings for both size ranges. The hardness values of the nitrogen coatings are fairly similar yet still noticeably higher than the substrate indicating good densification and work hardening from the deformation. Based on the various analyses, it is clear that the slightly smaller 5- 20um deposits much more effectively and yields superior coatings.
160
§■ 40 +• c e
>C 20
0
■ 400:C. 20-44fim ■400 C. 5-20nm
■ 400oC. 20-44nm ■ 400oC. 5-20fmi
■ 500oC. 20-44nm « 500oC. 5-20}im
Spray Parameter Set
Figure 63. The helium deposited coatings had significantly higher hardness than nitrogen coatings and all cold spray coatings yielded a higher hardness than the underlying substrate.
7.7 - Adhesion testing of deposited AA508S coatings
Although the absence of cracks at the interface typically defines a well-bonded coating, a more quantitative analysis was required. Adhesion testing of the coatings would provide quantitative coating- substrate interface strength, a common metric in the thermal spray industry for coating performance. Adhesion testing of thermal spray coatings is defined by ASTM C633, Standard Test Method for Adhesion or Cohesion Strength of Thermal Spray Coatings.
The test concept is simple, two steel rods are epoxied to the top and bottom of a 1" diameter coated button and pulled apart in a tensile tester. IMR Test Labs (Lansing, NY) was contracted for this work since proper setup and strict alignment of the top and bottom pull rods was required to ensure accurate results. Previous cross-sectional coating analysis indicated that the smaller size formed better coatings. As a result, coatings were deposited using the smaller sized 5-20(im range with the three
45

parameter sets: 400oC/nitrogen, 400°C/helium and 500oC/nitrogen all at the same offset 26mm and nearly the same pressure (40bar for nitrogen, 38bar for helium). The pull-strength of the epoxy was tested before any samples to confirm the epoxy strength. Three coupons of each parameter set were tested with the average of each parameter set, including the tested epoxy strength represented by the horizontal line at 86MPa, shown below in Fig. 64. The helium deposited samples exhibited coating adhesion near that of the epoxy, in fact, two of the three samples had the epoxy fail before the coating. The 400oC nitrogen coating showed the lowest strength, with less than half the strength of even the 500°C nitrogen coating. While helium appears to be the best propellant gas, its use is typically limited due to availability and high cost, making the higher temperature nitrogen deposition more economically attractive.
Figure 64. The 500°C pre-heat temperature coating and the helium deposited coating showed much higher bond strengths. In particular, the helium coatings only had one of the three samples fail before the epoxy strength limit of86MPa.
7.8 - Cold spray deposited zinc coatings
Deposition of sacrificial zinc layers was under consideration for corrosion mitigation. Zinc melts at approximately 419.5°C and is normally coated on materials by electro-plating or dipping in a molten zinc bath. Zinc is an ideal metal for cold spray because of its great ductility at slightly elevated temperatures [39]. Using nitrogen as the process gas, coatings were deposited at 25bar with temperatures of either 200CC or 300oC. A cross-section of the better 300oC coating is shown below in Fig. 65. Though both temperatures resulted in deposition, the higher gas pre-heat temperature deposited visibly more coating. Fig. 65 (a) reveals a thick 500)im layer was easily deposited while (b) highlights the great interface with no visible cracking or peeling at the interface.
46

(a) (b) Figure 65. Deposited since coatings have very littk porosity and a well-adhered interface according to SEM imaging ad evidenced at lower magnification fa) and higher magnification fo;.
The interface integrity was confirr-ed using an EDS line scan, beginning n the zinc coating and ending in the 5083 substrate, per Fig. 66. The coating is well adhered with no oxygen spike at the interface and a sharp transition from the zinc coa;ing to the 5083 substrate. This confirms that zinc is easily deposited with cold spray which makes application of a sacrificial zinc anoce attractive.
15
Distance (um)
Figure 66. An EDS line scan across the coat'ng-substrate interface confirms 2 well-adhered coating demonstrated by a lack of oxygen at the interface and sharp transition from 'ne zinc coating to the AA5083 substrate.
8. Corrosion testing of cold spray deposited con tings
8.1 - Nitric acid metal loss testing ofAA508S coatings
The ultimate goal of this v/ork was 'o deposit well adhered, dense AA508J coatings that exhibited similar if not greater resistance to sensitization a-"d mproved corrosion behavior. Cold spray deposition of 5083 had produced low porosity, well bended coatings. However, the corrosion behavior of ccatings was yet to be determined. Coatings formed during ihe initial investigation of cold spray deaositicn of AA5083 on AA5083 substrates were thoug't to :e dense enough for preliminary investigation into the corrosion behavior of these coatings The fust sample to be tested was a partially ccated l/4"xl/4"x2" sample which had been coated on 2 of the bng 1/4'" x 2" faces and partially submersed in th; nitiic acid at 30oC for 24hr. This first test did not perfcrm well, as the majority of the coating was attacked and
47

removed from the sample as presented in Fig. 67 which shows before and after macroscopic images of the sample. This severe attack is most likely attributed to the fact that the coating-substrate interface was exposed to the acid and the attack propagated quickly along this path. These results led the researchers to attempt full deposition on the same size samples where the coating substrate would not be exposed to the initial acid attack.
After NAMLT
Figure 67. The before image in the top macrophoto shows a nice coating which is almost coating the entire face of the sample. The after macrophoto reveals that the coating did not withstand this initial attack, most likely due to nitric acid preferentially attacking the coating-substrate interface thereby accelerating the mass loss.
Complete coverage of a NAMLT sample would be challenging since cold spray is a line of sight deposition process and sharp corners inherent to the rectangular sample might be problematic to deposit around. The deposition of a full NAMLT sample was attempted using the as-received powder and the parameter set of 400oC, 40bar, and a 26mm offset with 4 passes over the sprayed face traversing across the sample at 400min/s. The rough surface of the as-deposited coating needed to be removed as the top- most layer of particles is loosely impacted into the coating, possibly aiding the attack. These initial fully- coated sample runs did not deposit sufficient material to allow for complete milling of the sample after deposition. The milled coating began to peel from the substrate particularly at the edges of the sample. Trials to remove the coating with 320-grit SiC grinding paper were also not very successful as the coating
still delaminated. The researchers hypothesized that an increase in thickness of the coating would allow for easier milling of the top layer. It was decided that using the more aggressive parameters of 450oC, 40bar with a 26mm offset would provide a sufficient layer which could be milled. The number of passes of the spray gun over the sample was also increased to 8 rather than 4 while the robot speed remained unchanged at 400mm/s. A thick layer of coating could be produced and subsequently milled as shown in Fig. 68, while still maintaining over 200}im of coating after milling. Notice how much smoother the as-milled surface of Fig. 68 is compared to that of as-deposited coatings and the top- most layer of particles has been removed. In addition an EDS line scan analysis across the coating-substrate
Figure 68. The cross-sectional SEM image shown above demonstrates that a thick coating can be deposited and subsequently milled for further experimentation such as NAMLT or potentiodynamic testing. 48

interface, as shown in Fig. 69, reveals no increase in oxygen concentration further indicating the coating was adhered well to the substrate even after milling.
Distance {(im)
Figure 69. An EDS line scan of the coating-substrate interface for the fully coated NAMLT sample described previously reiterates that the bonding between coating and substrate was good with no increase in oxygen concentration at the coating-substrate interface.
Using these milled samples, NAMLT could continue as described in ASTM G67. The samples were again immersed in nitric acid at 30oC for 24hr. Samples manufactured from the as-received substrate with the same as-milled finish wi:hout any coatings were also tested. The as-received condition provided both a comparison to the coated samples and a mass loss baseline for as-received material. The samples were removed from the acid bath after 24hr and only a little bit of the coating on just one of the samples was retained after exposure. Tie mass loss of the three coated and milled sampled were 39.99, 41.09 and 42.87 mg/cm2 respectively while the uncoated samples only had mass losses of 3.59, 3.60 and 3.64 mg/cm , within the range of accept£.bls mass loss.
This high mass loss of the coatings compared to the as-received substrate can likely be attributed to attack at the corners of the sample, where deposition of coating was not as thick. Propagation of this initial attack through the corners and along the coating-substrate interface accelerates the delamination of the coating. Fig. 68 shows a corner of a fully-coated sample, deposited with the parameters mentioned above, and shows the coating does indeed cover the corner. However, the thickness of the coating is less than the faces of the samples which were deposited with the end of the nozzle normal to the surface. The attack would most likely easily reach the interface via this thinner coating and severely delaminate the entire coating. The researchers decided that fully coating a sample was not the avenue to proceed with. Fully-coating a sample was not the most economical means of producing NAMLT samples; each side needed to
Figure 70. One of the corners of'he fully-coated NAMLT substrate demarcated by the dashed yellow lines in the above SEM images proves that the corners wsre fully-coated. Howevc, the coating thickness is less 'har. 100 um in this region; the nitric acid most likely attacks this area quickly and is then allowed to propagate via the interface resulting in high mass losses for these samples.
49
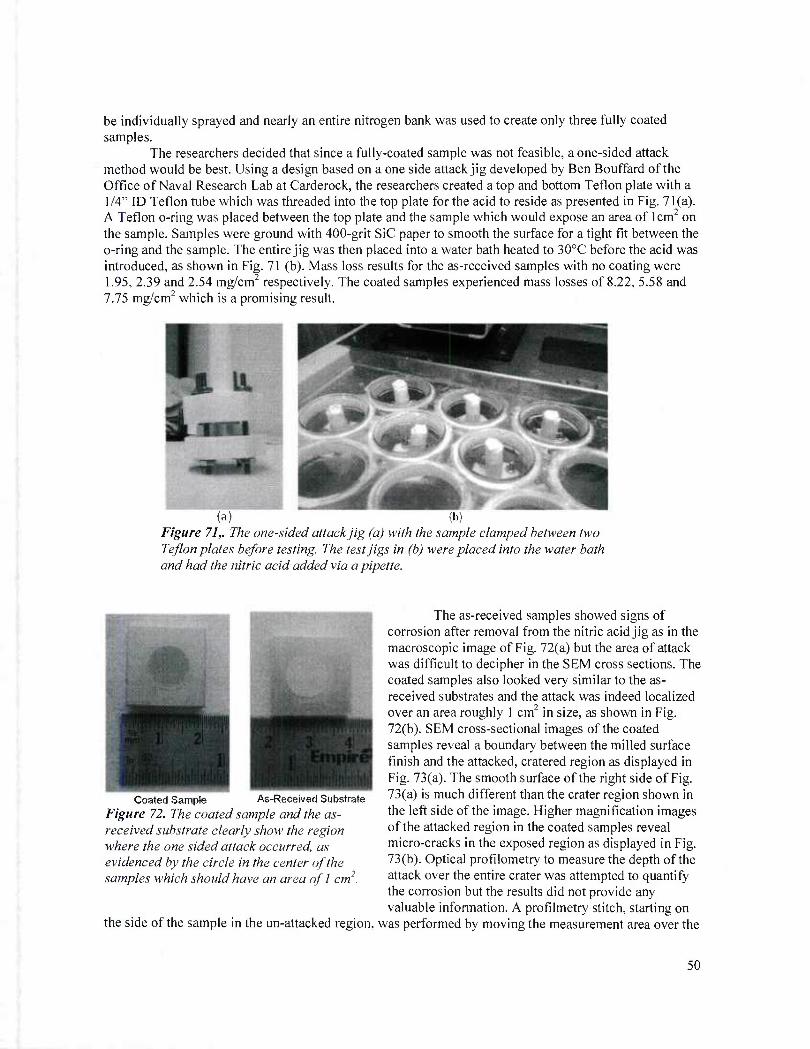
be individually sprayed and nearly an entire nitrogen bank was used to create only three fully coated samples.
The researchers decided that since a fully-coated sample was not feasible, a one-sided attack method would be best. Using a design based on a one side attack jig developed by Ben Bouffard of the Office of Naval Research Lab at Carderock, the researchers created a top and bottom Teflon plate with a 1/4" ID Teflon tube which was threaded into the top plate for the acid to reside as presented in Fig. 71(a). A Teflon o-ring was placed between the top plate and the sample which would expose an area of 1cm2 on the sample. Samples were ground with 400-grit SiC paper to smooth the surface for a tight fit between the o-ring and the sample. The entire jig was then placed into a water bath heated to 30oC before the acid was introduced, as shown in Fig. 71 (b). Mass loss results for the as-received samples with no coating were 1.95, 2.39 and 2.54 mg/cm2 respectively. The coated samples experienced mass losses of 8.22, 5.58 and 7.75 mg/cm2 which is a promising result.
(a) (b) Figure 71,. The one-sided attack jig (a) with the sample clamped between two Teflon plates before testing. The test jigs in (b) were placed into the water bath and had the nitric acid added via a pipette.
Coated Sample As-Received Substrate Figure 72. The coated sample and the as- received substrate clearly show the region where the one sided attack occurred, as evidenced by the circle in the center of the samples which should have an area ofl cm .
the side of the sample in the un-attacked region.
The as-received samples showed signs of corrosion after removal from the nitric acid jig as in the macroscopic image of Fig. 72(a) but the area of attack was difficult to decipher in the SEM cross sections. The coated samples also looked very similar to the as- received substrates and the attack was indeed localized over an area roughly 1 cm2 in size, as shown in Fig. 72(b). SEM cross-sectional images of the coated samples reveal a boundary between the milled surface finish and the attacked, cratered region as displayed in Fig. 73(a). The smooth surface of the right side of Fig. 73(a) is much different than the crater region shown in the left side of the image. Higher magnification images of the attacked region in the coated samples reveal micro-cracks in the exposed region as displayed in Fig. 73(b). Optical profilometry to measure the depth of the attack over the entire crater was attempted to quantify the corrosion but the results did not provide any valuable information. A profilmetry stitch, starting on
was performed by moving the measurement area over the
50

nitric acid formed crater. It was difficu.t to decipher where the crater began in this optical stitch which
*CI 15ISC WOlSmm SSJO
(a) (b) Figure 73. T/ze boundary between the milled surface fright hand side in (a)) and the crater formed during nitric acid exposure (left hand side in (aj) car be revealed with SEM imaging of the cross-section. The residtant micro-cracks on the coating after acid exposure are exhibited in (b).
made q jantifying the depth of attack impossible. It appears that the coating is somewhat resistant to nitric acid a^ack when the attack is ocalized and normal to the coating surface. It was hypothesized that if a fully-dense coating can be deposited, the attack will be less severe since cracks and voids in the coating allow for easier nitric acid attack.
Researchers deposited coatings with the best parameters, 5-20|am AA5083 powder and 500°C, nitrogen and 400oC, helium. These samples were weighed before and after exposure to yield the mass loss, but since the mass loss is dependent on orientation, it was not appropriate to directly compare the single-sided versus full size sample NAMLT results. A better metric for comparison was the depth of the nitric acid attack. Un-coated coupons, both unsensitized and sensitized at 120oC for 168h, were tested with the one-sided attack method and characterized alongside coated and coated then sensitized samples. Samples were cross-sectioned for SEM imaging of the acid attack depth in middle of the exposed area. Multiple images were collected across :he attacked region and stitched together, resulting in a single image for depth measurements. Ten evenly spaced measurements were taken in the crater, along with the observed minimum and maximum attack depth. Ar, example of an image used frr analys s is shown below ii Fig. 74. All parameter sets were measurec using at least one sample for a minimum of 12 measurements, some used two samples yielding 22 total measurements.
Figure 74. The image used for depth of attack was stitched together from SEM images of the attacked region.
A summary of these measurements is below in Table 8. The reported error is the standard error found by dividing the standard deviation by the square root of the number of measurements. The as- received, un-coated sample had the lowest attack depth of only 8.6|am and was difficult to detect with this method. The un-sensitized coatings hac much higher attack depths of 30nm for the 500oC/nitrogen coating and 27|j,m for the 400oC/helium coating. The un-coated sensitized samples had the highest attack depth o: 39|am. The sensitized coatings did not perform significantly worse than the un-sensitized coatings and did not appear to be attacked more than the sensitized, un-coated sample (35|im). The
51
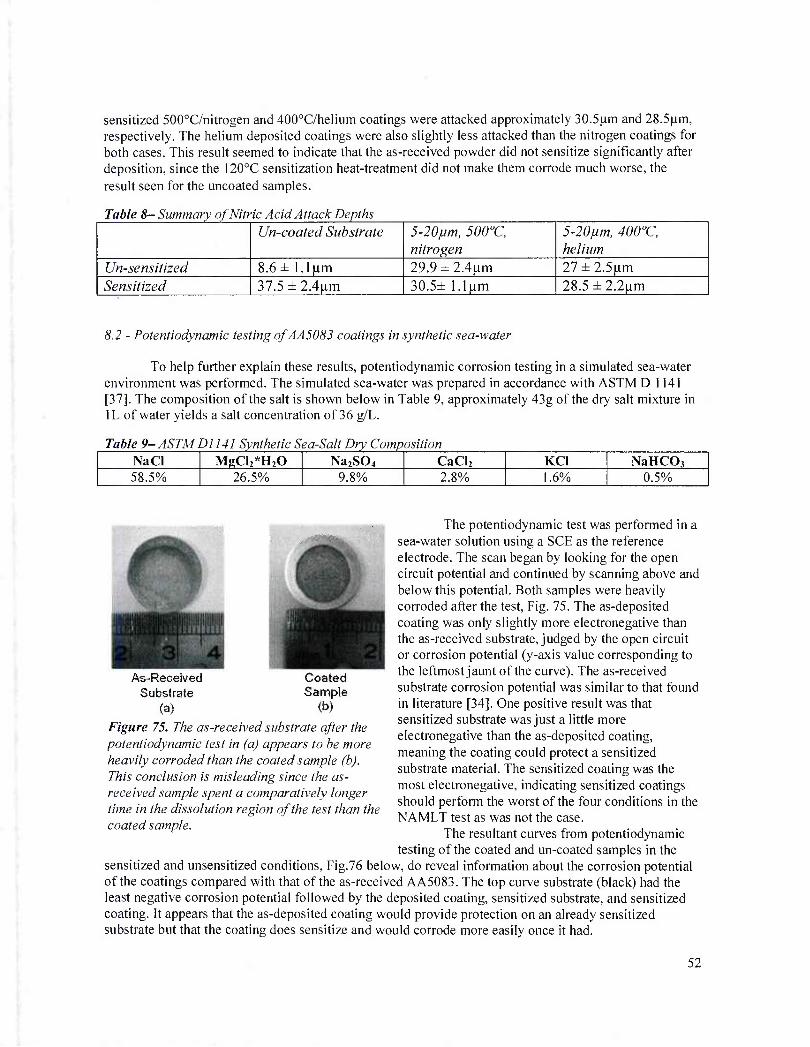
sensitized 500oC/nitrogen and 400oC/helium coatings were attacked approximately 30.5[im and 28.5(im, respectively. The helium deposited coatings were also slightly less attacked than the nitrogen coatings for both cases. This result seemed to indicate that the as-received powder did not sensitize significantly after deposition, since the 120oC sensitization heat-treatment did not make them corrode much worse, the result seen for the uncoated samples.
Table 8- Summary of Nitric Acid Attack Depths Un-coated Substrate 5-20pm, SOOT,
nitrogen 5-20//W, 400oC, helium
Un-sensitized 8.6± \.\\xm 29.9 ± 2.4^m 27±2.5nm Sensitized 37.5 ± 2.4^111 30.5± 1.1 urn 28.5±2.2|am
8.2 - Potentiodynamic testing ofAA5083 coatings in synthetic sea-water
To help further explain these results, potentiodynamic corrosion testing in a simulated sea-water environment was performed. The simulated sea-water was prepared in accordance with ASTM D 1141 [37]. The composition of the salt is shown below in Table 9, approximately 43g of the dry salt mixture in 1L of water yields a salt concentration of 36 g/L.
Table 9-ASTM DJ14] Synthetic Sea-Salt Dry Comp osition NaCl MgCl2*H20 Na2S04 CaCl2 KC1 NaHCOj 58.5% 26.5% 9.8% 2.8% 1.6% 0.5%
As-Received Coated Substrate Sample
(a) (b)
Figure 75. The as-received substrate after the potentiodynamic test in (a) appears to be more heavily corroded than the coated sample (b). This conclusion is misleading since the as- received sample spent a comparatively longer time in the dissolution region of the test than the coated sample.
The potentiodynamic test was performed in a sea-water solution using a SCE as the reference electrode. The scan began by looking for the open circuit potential and continued by scanning above and below this potential. Both samples were heavily corroded after the test. Fig. 75. The as-deposited coating was only slightly more electronegative than the as-received substrate, judged by the open circuit or corrosion potential (y-axis value corresponding to the leftmost jaunt of the curve). The as-received substrate corrosion potential was similar to that found in literature [34]. One positive result was that sensitized substrate was just a little more electronegative than the as-deposited coating, meaning the coating could protect a sensitized substrate material. The sensitized coating was the most electronegative, indicating sensitized coatings should perform the worst of the four conditions in the NAMLT test as was not the case.
The resultant curves from potentiodynamic testing of the coated and un-coated samples in the
sensitized and unsensitized conditions, Fig.76 below, do reveal information about the corrosion potential of the coatings compared with that of the as-received AA5083. The top curve substrate (black) had the least negative corrosion potential followed by the deposited coating, sensitized substrate, and sensitized coating. It appears that the as-deposited coating would provide protection on an already sensitized substrate but that the coating does sensitize and would corrode more easily once it had.
52

-0.50
-0,75
o > LU
-1.00
-1.25
Substrate (As-Received) Substrate (Sensitized) Coating (As-Deposited) Coating (Sensitized)
.j 50 ' ' ■ '■"■! L..L.Limi... i....i.J.iUUl. LJLUllUl l..l..U,Ulit .Li.i.lly.ll Ll.l.Ujilt. L.l.l.Ulld LXJ-U.
Iff* 109 108 10' 10* 10s 104 10'3 10J 10'
I (Amps/cm2)
Figure 76. The potentiodynamic scans of coated and un-coated samples, in either the sensitized or un- sensitized condition show that the sensitized coating had the most electronegative potential while the un- coated, un-sensitized had the least.
The zinc coatings could easily be deposited on the AA5083 substrates as shown above but the zinc coatings corrosion behavior was unknown. It is known that zinc metal is more electronegative than most metals and is commonly used for corrosion protection [40]. A potentiodynamic scan of the 300°C zinc coating, in the same ASTM sea-water as the 5083 material, Fig. 77, plotted against those of the as- received substrate (a) and as-deposited 5083 coating (b) confirmed the zinc coating was significantly more electronegative, meaning it would preferentially corrode if deposited on these materials.
Zinc Cold Spray Coating Potentiodynamic Scan vs.
(a) (b) Figure 77. The zinc deposited coating was much more electronegative than either the as-received substrate (a) or as-deposited 5083 coating (b), indicating it would preferentially corrode , electrolytic medium.
in an
53

8.3 - Metallographic analysis of AA 5083 cold spray deposited coatings
The potentiodynamic results provided some explanation of the NAMLT results however the question still remained if the coating did indeed sensitize. A detailed metallographic study was required in order to determine true sensitization behavior. The first sample used for the etching and imaging of the P- phase was a sensitized, un-coated sample because of its known sensitization behavior. Ammonium persulfate and phosphoric acid etchants were trialed; multiple iterations were done using different concentrations, etching times, and temperatures. The goal of the etching was to observe the Mg-rich P- phase precipitate using SEM for imaging and EDS for measuring relatively higher concentration of Mg at the grain boundaries. If the etching was too aggressive, the p-phase would be completely removed making it impossible to measure a higher Mg concentration. The best recipe was found to be 10% phosphoric acid with an etching time of 30s at room temperature ~22°C. Images of this sample using the 10% phosphoric acid etching are shown below in Fig. 78, an etched sensitized substrate. As can be seen, the grain boundaries have been etched, revealing the rolled microstructure of the alloy.
The exposure of grain boundaries allowed the researchers to search these boundaries for p-phase precipitation. The precipitate should appear spongy if etched lightly enough and EDS can be used to point out an increase in the Mg concentration at these spongy regions, indicating p-phase formation as shown in this work [13]. Performing EDS across one such boundary in an area that appeared spongy revealed a slight increase in the Mg concentration. Fig. 79 shows where the line scan was measured and the slight increase in the Mg concentration. 5083AA nominally contains 4.4wt% Mg, as highlighted on the plot in Fig. 79. The EDS result clearly shows a slight yet significant bump in the Mg concentration moving across the boundary.
Figure 78. The 10% phosphoric acid etchant was able to reveal the grain boundaries in the as-received, sensitized substrate.
mfm
Mg Concentration - Sensitized Uncoated Substrate
/
4.4wt% (Mom.;
1.5
Distance (urn)
Figure 79. The sponge-like region at the grain boundaries could be revealed with light etching. An EDS line scan across such a region revealed a slight bump in Mg concentration, indicating a narrow but detectable region of P-phase.
Once the p-phase was confirmed in an uncoated, sensitized substrate, etching of helium deposited coatings, in both heat-treated (sensitized) and as-deposited conditions, was performed. The sensitization
54
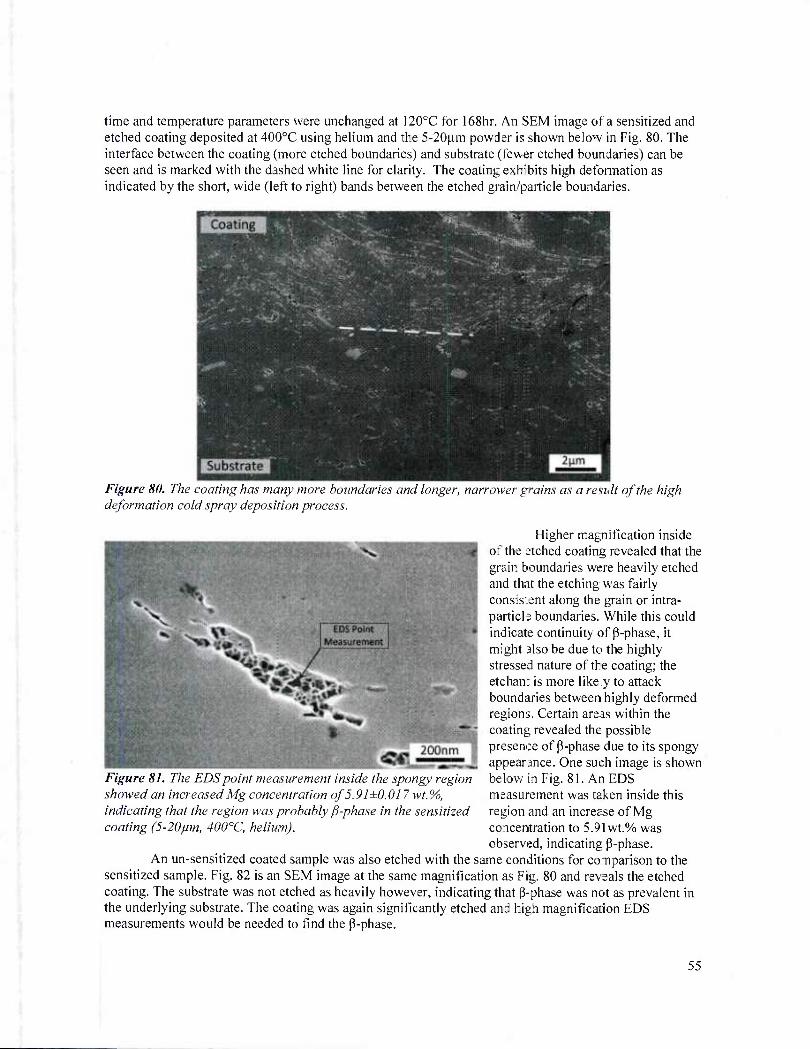
time and temperature parameters were unchanged at I20C,C for 168hr. An SEM image of a sensitized and etched coating deposited at 400oC using helium and the 5-20|im powder is shown below in Fig. 80. The interface between the coating (more etched boundaries) and substrate (fewer etched boundaries) can be seen and is marked with the dashed white line for clarity. The coating exhibits high deformation as indicated by the short, wide (left to right) bands between the etched grain/particle boundaries.
Figure 80. The coating has many more boundaries and longer, narrower grains as a result of the high deformation cold spray deposition process.
Higher magnification inside of the etched coating revealed that the grain boundaries were heavily etched and that the etching was fairly consis:ent along the grain or intra- particb boundaries. While this could indicate continuity of p-phase, it might also be due to the highly stressed nature of the coating; the etchan; is more like y to attack boundaries between highly deformed regions. Certain areas within the coating revealed the possible presence of p-phase due to its spongy appearance. One such image is shown belowinFig. 81. AnEDS measurement was taken inside this region and an increase of Mg concentration to 5.91 wt.% was observed, indicating p-phase.
An un-sensitized coated sample was also etched with the same conditions for conparison to the sensitized sample. Fig. 82 is an SEM image at the same magnification as Fig. 80 and reveals the etched coating. The substrate was not etched as heavily however, indicating that p-phase was not as prevalent in the underlying substrate. The coating was again significanrly etched and high magnification EDS measurements would be needed to find the p-phase.
Figure 81. The EDS point measurement inside the spongy region showed an increased Mg concentration of 5.91±0.017 wt. %, indicating that the region was probably P-phase in the sensitized coating (5-20fim, 400°C, helium).
55

Coating
'■'■■ ■ . ^ ' , '*, * *;.,'»
p
| Substrate ] 2|im
Figure 82, The coating etched more readily than the underlying substrate though both were un- sensitized, emphasizing the highly stressed nature of the as-deposited coating and possibly indicating the presence offi-phase.
Higher magnification SEM images taken in the etched coating revealed the presence of the spongy formations, shown in Fig. 83, that had been identified as the intermetallic AUMg^CP-phase). An EDS point measurement in this region showed an increase in the Mg concentration (5.65wt.%), indicating that p-phase was present in the as-deposited coating. Although this result was unexpected, it can possibly be explained by that fact that particles undergo severe deformation upon impact, precipitating p through this deformation, or could raise the temperature enough to precipitate p-phase. This result could also explain the acid attack depth analysis. If p-phase was present in the un-sensitized coating, it would dissolve in the nitric acid resulting in a higher attack depth than the as-received substrate.
Figure 83. An EDS point and shoot measurement inside one of the spongy regions displayed an increased Mg concentration of 5.65±0.17 (wt. % Mg), confirming the presence of P-phase in the as-deposited (5- 20fim, 400°C, helium) coating.
The coating did not exhibit a greater acid attack depth after the sensitization heat-treatment than before, evidenced by only a slight increase in the measured attack depth, and both were lower than the
56
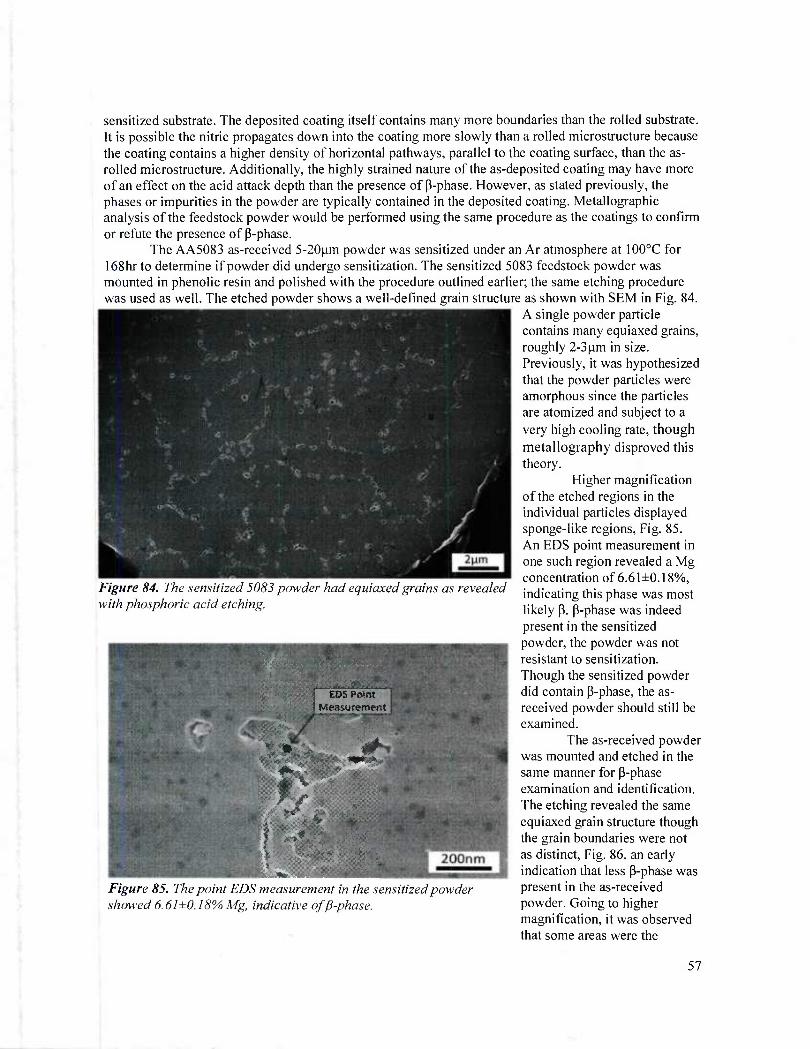
sensitized substrate. The deposited coating itself contains many more boundaries than the rolled substrate. It is possible the nitric propagates down into the coating more slowly than a rolled microstructure because the coating contains a higher density of horizontal pathways, parallel to the coating surface, than the as- rolled microstructure. Additionally, the highly strained nature of the as-deposited coating may have more of an effect on the acid attack depth than the presence of p-phase. However, as stated previously, the phases or impurities in the powder are typically contained in the deposited coating. Metallographic analysis of the feedstock powder would be performed using the same procedure as the coatings to confirm or refute the presence of p-phase.
The AA5083 as-received 5-20|am powder was sensitized under an Ar atmosphere at 100oC for 168hr to determine if powder did undergo sensitization. The sensitized 5083 feedstock powder was mounted in phenolic resin and polished with the procedure outlined earlier; the same etching procedure was used as well. The etched powder shows a well-defined grain structure as shown with SEM in Fig. 84.
A single powder particle contains many equiaxed grains, roughly 2-3 nm in size. Previously, it was hypothesized that the powder particles were amorphous since the particles are atomized and subject to a very high cooling rate, though metallography disproved this theory.
Higher magnification of the etched regions in the individual particles displayed sponge-like regions, Fig. 85. An EDS point measurement in one such region revealed a Mg concentration of 6.61 ±0.18%, indicating this phase was most likely p. P-phase was indeed present in the sensitized powder, the powder was not resistant to sensitization. Though the sensitized powder did contain p-phase, the as- received powder should still be examined.
The as-received powder was mounted and etched in the same manner for P-phase examination and identification. The etching revealed the same equiaxed grain structure though the grain boundaries were not as distinct. Fig. 86, an early indication that less P-phase was present in the as-received powder. Going to higher magnification, it was observed that some areas were the
Figure 84. The sensitized 5083 powder had equiaxed grains as revealed with phosphoric acid etching.
■ EDS Point I Measurement
Figure 85. The point EDS measurement in the sensitized powder showed 6.61 ±0.18% Mg, indicative of P-phase.
57

notorious sponge-like region. An increase of Mg (5.74±0.24%) was seen in one such region. Fig. 87, indicating (3-phase. The detailed metallographic analysis and high magnification SEM proved that P-phase was contained in the powder even before the artificial sensitization. The presence of B-phase in the powder means that it would certainly be in any deposited coatings. The analysis also explained why the nitric acid attack was higher in the as-deposited coatings that the un-sensitized substrate, as any B- formation would certainly increase the acid attack depth. The powder also sensitized similar to that of the deposited coatings as shown.
Figure 86. The as-received unsensitizedpowder also had equiaxed grains though not as distinct compared to the sensitized powder.
Figure 87. The EDS point measurement showed a Mg concentration of 5.74±0.24%, indicating B-phase was present in the as-received powder.
58

8.4 - Salt-spray testing of cold spray coatings
The two zinc coatings deposited at the different temperatures of 200 and 300oC were smoothed with 1200-grit SiC paper and placed into a salt spray chamber, along with an as-received and sensitized AA5083 coupons, both un-coated, prepared in the same manner. This test would allow the researchers to observe the sacrificial nature of the zinc. These samples were exposed to a sea-water spray for one minute per hour for eight hours a day. This spray was repeated for only three days before the samples were removed and photographed. The before and after images are presented below in Fig. 88 and reveal that the zinc coatings exhibit more corrosion than any of the un-coated 5083 samples. This test confirmed that the zinc coatings did corrode more even though the exposure was very short.
No Coating Zinc Coating As-Received 5083AA Sensitized 5083AA SOCTC, 25bar 200oC125b
Before
After
Figure 88. The zinc coatings appeared to he more corroded after the short, three day exposure in the salt spray chamber than the 5083AA coupons.
A much longer, 500h exposure in a salt-spray chamber was performed at NSWC-Carderock with zinc (300oC, nitrogen, 25bar) and AA5083 (500oC, nitrogen, 5-20um. 40bar) cold spray deposited coatings. Substrates were coated either fully-coated on a single face to examine the response of the bulk coatings or partially coated across the center of a face to simulate a crack repair. These samples were ground with 400-grit SiC paper in alcohol to smooth the surface before exposure and to remove the top coating layer, which may not be as compacted as the bottom layers. Uncoated as-received and sensitized 5083 substrates were simultaneously exposed for comparison. Uncoated samples show a light brownish corrosion layer. Fig. 89, had formed on the surface after exposure which was also observed on the 5083 coating, as compared to the silvery surface before exposure. The zinc coating was much more attacked, darker in color, and contained a white corrosion product on the surface. Fig. 89. The samples were washed in water before imaging to remove as much of salt residue as possible. It should be noted that the uncoated substrates had a very faint pattern on them that looked to be from the rolling of the wrought alloy, not surprising since these alloys typically corrode via pitting in salt-water environments [41].
59
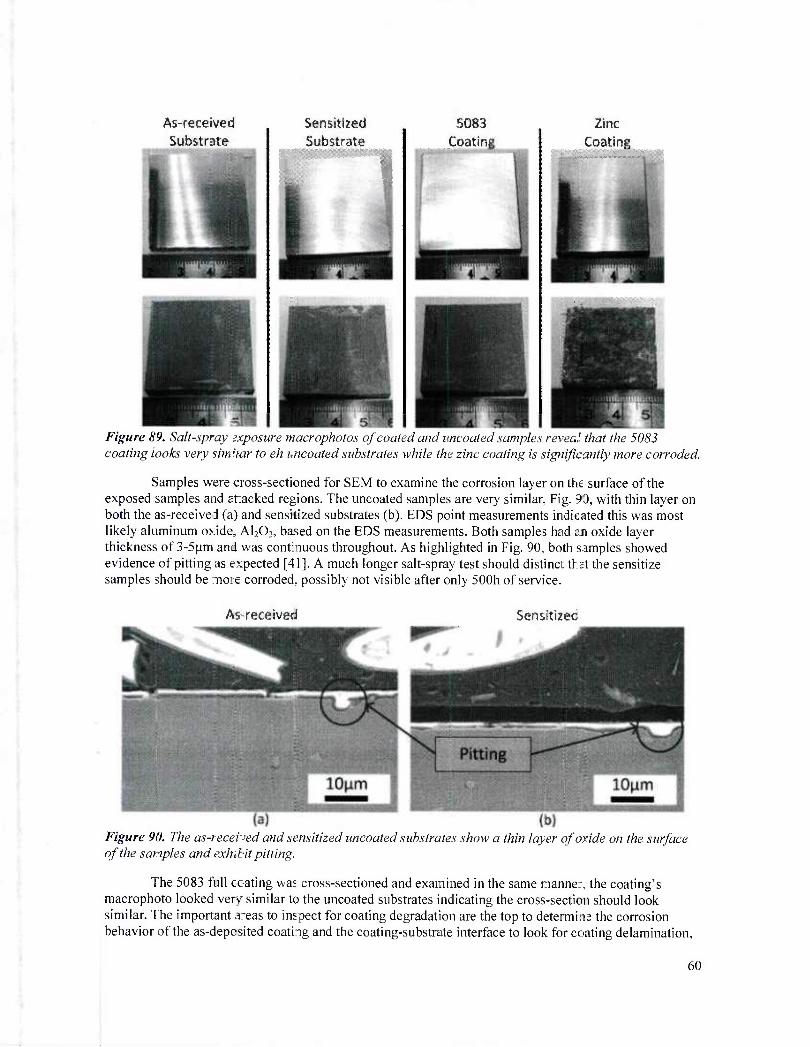
As-received Substrate
Sensitized Substrate
5083 Coatins
Zinc Coatins
Figure 89. Salt-spray exposure macrophotos of coated and uncoated samples reveal that the 5083 coating looks very simitar to eh uncoated substrates while the zinc coating is significantly more corroded.
Samples were cross-sectioned for SEM to examine the corrosion layer on the surface of the exposed samples and attacked regions. The uncoated samples are very similar, Fig. 93, with thin layer on both the as-received (a) and sensitized substrates (b). EDS point measurements indicated this was most likely aluminum oxide, AI2O3, based on the EDS measurements. Both samples had en oxide layer thickness of 3-5(im and was continuous throughout. As highlighted in Fig. 90. both samples showed evidence of pitting as expected [41]. A much longer salt-spray test should distinct thst the sensitize samples should be more corroded, possibly not visible after only 500h of service.
As-received Sensitized
Figure 90. The as-received and sensitized uncoated substrates show a thin layer of oxide on the surface of the samples and exhibit pitting.
The 5083 full ccating was cross-sectioned and examined in the same manner, the coating's macrophoto looked very similar to the uncoated substrates indicating the cross-section should look similar. The important a^eas to inspect for coating degradation are the top to determine the corrosion behavior of the as-depcsited coating and the coating-substrate interface to look for coating delamination.
60

particularly at the coating edges. As Fig. 91(a) shows, the top of the coating had a thin white corrosion layer, roughly S^m thick. This was confirmed to be alumina via an EDS measurement. The thickness of the corrosion products was also comparable to those of the uncoated samples, and some pitting was observed as well, though not as pronounced. Fig. 92(b) shows that the corrosive solution did not attack along the interface (demarcated by the white line) but did corrode on the outside of the sample (white outline in figure), indicating the 5083 coating provided substrate protection.
(a) (b) Figure 91. The 5083 full-coating did have some pitting and a nearly continuous oxide later on the surface hut the coating-substrate interface was hardly attacked.
Samples coated with AA5083 in a stripe on a single face of the substrate were cross-sectioned before and after the coating deposition in order tD observe the attack along the interface on this simulated repair coating. The before image in Fig. 92(a) dees not have any of the white corrosion product at the end of the coating, though the coating does look slightly porous. The exposed sample does have some corrosion product at the far edge of the coating (^hite region) but the corrosion has not compromised he integrity of the interface. Fig. 92(b). The coating in this area is not as compacted since the middle of the spray plume, where the particles are traveling the fastest, does not pass over this area. This edge of the coated area is deposited by the outermost spray plume where the particles have just the minimum velocity required for deposition and particles are loosely adhered.
(a) (b) Figure 92. The partially 5083 coating was slightly attack at the edges though the attack was limited to 'he first 200um as compared before (a) and after (b) the exposure.
The zinc coated samples were visibly more corroded, in particular the fully-coated sample was heavily attacked with much of the original surfac; eaten away. Cross sectional analysis of this coating revealed that most of the original coating thickness was still intact, but that regions of the coating

exhibited severe attack, Fig. 93(a). The depth of this attack was measured across the coating and found to be an average of IVO^m deep. EDS measurements displayed the corrosion product was primarily Zn and O with some Cl. Zn converts to Zn(OH)2 and Zn5(C03)2(OH)6 at the onset of corrosion which progresses to Zns^kOgCk-HbO after a day and NaZn4Cl(OH)6S04-6H20 after several weeks, explaining the presence of Cl in the EDS measurements [42]. Looking at Fig. 92(b) we see that the attack has begun at the interface but the attack was not severe enough to start delaminating the coating. In fact, the attack looks to be confined to the zinc with the underlying substrate unaffected.
W fb) Figure 93. The sample fully-coated with Zn was severely ccrrodid (a), with even some attack at the coating-substrate interface (b).
The zinc coating deposited on the middle of the substrate was also heavily attacked, particularly at the edge, comparing the as-deposited zinc. Fig. 94(a), and the exposed slat-spray tested zinc. Fig. 94(b). However, the coating itself corroded and the attack did no: oropagate much further along the coating- substrate interface than the initial 200)im. The coating above what little propagation occurred was more attacked as the thickness was slightly decreased. This result signals that ths coating, while being severely corroded, should still adhere to the surface until completely gone.
Figure 94. The partial Zn coated samples did have more attack along the interface than the 5083 partial coated sample, with the attack propagating almost I mm abng th3 interface when comparing the before (a) and after exposure (b) samples.
62

9. Conclusion
5xxx series aluminum alloys are very susceptible to inter-granular corrosion (IGC) once p-phase has precipitated along the grain boundaries. Thermo-mechanical treatments are a useful method to both strengthen alloys while simultaneously decreasing the propensity for continuous formation of a p-phase layer, increasing the corrosion resistance. Further work to apply the thermo-mechanical treatments to alloys other than AA5083 and to understand the fundamental mechanisms is worthwhile for full comprehension of the relationship between deformation, thermal processing and sensitization behavior. In addition, cold spray deposition of coatings remains a viable option to repair previously sensitized material or deposit sacrificial layers designed to protect the underlying substrate. Continued work to deposit coatings designed for marine environments, particular alloys that do not sensitize, would be a meaningful endeavor.
10. References
1 ] D. Vaughan, The precipitation of 6' at high-angle boundaries in an Al-Cu alloy, Acta Metall., Vol. 18 (1970) pp. 183-187.
2] E. P. Butler and P. R. Swann, In situ observations of the nucleation and initial growth of grain boundary precipitates in an Al-Zn-Mg alloy, Acta Metall., Vol. 24 (1976) pp. 343-352.
3] J. K. Park and A. J. Ardell, Precipitation at grain boundaries in the commercial alloy Al 7075, Acta Metall., Vol. 34 (1986) pp. 2399-2409.
4] A. Gargand J. M. Howe, Nucleation and growth of Qphase in Al-4.0 Cu-0.5 Mg-0.5 Ag alloy—An in situ hot-stage TEMstudy, Acta Metall. Mater., Vol. 39 (1991) pp. 1925-1937.
5] Y.K. Yang, T. Allen, "'Determination of the P solvus temperature of the aluminum alloy 5083", Materials Science and Engineering: A, Vol. 44, (2013), pp 5226-5233
6] T. Anderson, "New developments within the Aluminium Shipbuilding Industry", Welding Journal. 58 (2003) pp.3-5
7] A. Haszler, "Latest aluminum alloy developments for plate applications in high speed ferry and aircraft structures". Aluminum 97 conference, Essen, Germany (1997) pp. 2/1-2/9
8] B.E. Placzankis, A. L. Hilgeman, "Performance assessment of CARC coated aluminum alloy 5059- HI3I using ASTM B 117 neutral salt fog, GM 9540p, and ASTM D 4541 pull-off adhesion for three different pretreatment methods". Army Research Laboratory (2008), ARL-TR-4547
9] E. Bumiller, R. Ruedisueli, "Correlation of Electrochemical, ASTM Tests and Metallographic Analyses in the Corrosion Behavior of 5XXX Aluminum Alloys", Naval Surface Warfare Center. Source, CORROSION 2008, March 16-20, 2008 , New Orleans LA
10] ASTM B 928/B 928M-07, Standard Specification for High Magnesium Aluminum-Alloy Sheet and Plate for Marine Service and Similar Environments, 2007.
11] ASTM G 67-04, Standard Test Method for Determining Susceptibility to Intergranular Corrosion of 5XXXSeries Aluminum Alloys by Mass Loss after Exposure to Nitric Acid (NAMLT Test), 2004.
12] B. D. Hames, Gel electrophoresis of proteins: a practical approach, Oxford University Press US, 1998, pl4
13] Y.K. Yang, T. Allen, "Direct visualization of p phase causing intergranular forms of corrosion in Al-Mg alloys". Materials Characterization, Vol. 80. (2013), pp/ 76-85
14] L. F. Mondolfo, Aluminium Alloys: Structure and Properties, Butterworth Group, London. (1976), p.806
15] George E. Totten and D. Scott MacKenzie, Handbook of Aluminum: Physical metallurgy and processes, CRC Press, 2003, p. 167
16] Yudie Yuan, "Localized corrosion and stress corrosion cracking of aluminum-magnesium alloys," Ph. D. thesis, 2005. pp.64-65
63

[17
[18
[19
[20
[21
[22
[23
[24
[25 [26
[27
[28
[29
[30
[31
[32 [33
[34
[35
[36
[37
R.M. Cleveland, A.K. Ghosh, J.R. Bradley, "Comparison of superplastic behavior in two 5083 aluminum alloys," Materials Science and Engineering A, 351(2003) pp.228-236
I.N.A. Oguocha, O. J. Adigun, and S. Yannacopoulos, "Effect of Sensitization Heat Treatment on Properties of Al-Mg Alloy AA5083-H116", J. Mater Sci., 43(2008) pp.4208-4214
Kiryl A. Yasakau, Mikhail L. Zheludkevich, Sviatlana V. Lamaka and Mario G.S. Ferreira, "Role of intermetallic phases in localized corrosion of AA5083", Electrochimica Acta, 52(2007) pp.7651- 7659
J.S. Vetrano, S.M. Bruemmer, L.M. Pawlowski, and I.M. Robertson, "Influence of the particle size on recrystallization and grain growth in Al-Mg-X alloys," Mater. Sci. Eng. A, 238(1997) pp. 101- 107
R. Goswami, G. Spanos, P.S. Pao, R.L. Hoitz, "Precipitation behavior of the -phase in Al-5083," Mater. Sci. Eng. A, 527(2010) pp.1089-1095
R. Goswami, G. Spanos, P.S. Pao, and R.L. Holtz, "Microstructural Evolution and Stress Corrosion Cracking Behavior of Al-5083," Metallurgical and Materials Transactions A, 42A(2011) pp.348- 355
P. Ratchev, B. Verlinden and P. Van Houtte, "Effect of preheat temperature on the orientation relationship of (Mn,Fe)Al6 precipitates in an AA5182 aluminum-magnesium alloy," Acta metal. Mater., 43 (1995) pp.621-629
Milan Svoboda, Jozef Janovec, Monika Jenko, Ante Vrankovi, "The characterization of intermetallic-compound particles in an annealed Al-Mg-Cr-Fe alloy," Materiali in Tehnologije, 38 (2004), pp.289-294
F. Rhines, Phase Diagrams in Metallurgy, McGraw- Hill, 1956, pp. 290-311. Papyrin, The Development of the Cold Spray Process, The Cold Spray Materials Deposition
Process: Fundamentals and Applications, 1st ed, V.K. Champagne, Ed., CRC Press, (2007), p 11- 42
T. Schmidt, F. Gartner, H Assadi, H Kreye. Development of a generalized parameter window for cold spray deposition. Acta Materialia, (2007), 54 p 737
T. Schmidt, H. Assadi, F. Gartner, H. Richter, T. Stoltenhoff, H. Kreye, T. Klassen. From Particle Acceleration to Impact and Bonding in Cold Spray. Journal of Thermal Spray Technology. Volume 18, (2009). Pp. 794-808
T. Stoltenhoff, C. Borchers, F. Gaertner, and H. Kreye, Microstructures and Key Properties of Cold Sprayed and Thermally Sprayed Copper Coatings, Surf. Coat. Technol., Vol. 200, (2006), p 4947-4960
F. Gaertner, T. Stoltenhoff, J. Voyer, H. Kreye, S. Riekehr, and M. Kocak, Mechanical Properties of Cold-Sprayed and Thermally Sprayed Copper Coatings, Surf. Coat. Technol., Vol. 20,0 (2006), p 6770-6782
H. Assadi. F. Gartner, T. Stoltenhoff, H. Kreye, Bonding Mechanism in Cold Gas Spraying. Acta Mater. Vol. 51, (2003), p 4379-4394
K. Sakaki, The Influence of Nozzle Design in the Cold Spray Process, op. cit. ref. 2, p 117-126 G. Bae, K. Kang, H. Na, J. Kim, C, Lee. Effect of Particle Size on the Microstructure and Properties
of Kinetic Sprayed Nickel Coatings. Surf. Coat. Technol, Vol. 204 (2010), p 3326-3335 J.L. Searles, P.I Gouma, R.G Bucheit. Stress Corrosion Cracking of Sensitized AA5083 (Al- 4.5Mg-
l.OMn). Materials Science Forums Vols. 396-402 (2002) pp 1437-1442. K. Balani, T. Laha, A. Agarwal, J. Karthikeyan, N. Munroe, Effect of Carrier Gases on
Microstructural and Electrochemical Behavior of Cold-Sprayed 1100 Aluminum Coating, Surf. Coat. Technol, 2005, 195 p 272-279
Standard Test Method for Adhesion of Cohesion Strength of Thermal Spray Coatings, ASTM-C633- 13, ASTM International
Standard Practice for the Preparation of Substitute Ocean Water, ASTM D-l 141-98, ASTM International, p 2
64

[38] Hazardous (Classified) Locations, Occupational Safety and Health Administration. http://www.osha.gov/doc/outreachtraining/htmlfiles/hazloc.html, accessed 8/8/1
[39] R.J. Bamhurst. Zinc and Zinc Alloys, Properties and Selection: Nonferrous Alloys and Special- Purpose Materials, vol2, ASM Handbook, ASM International, 1990, p 527-542.
[40] X.G. Zhang. Corrosion of Zinc and Zinc Alloys, Corrosion: Materials, vol 13B, ASM Handbook, ASM International, (2005), p 402-417.
[41] E. Ghali. Aluminum and Aluminum Alloys, Uhlig's Corrosion Handbook, Part HI: Metals, (2011), pp. 715-745.
[42] X.G. Zhang. Zinc. Uhlig's Corrosion Handbook, Part III: Metals, (2011), (2011), pp879-892.
65