1330 1 simon hunt and chris pacey revd full v3
TRANSCRIPT

Chris and I are jointly presenting this paper today. We have been working together developing this strategy for a while now with Chris focussing primarily on the technical aspects, especially the extraction, sorting and analysis of the road asset data. I have been driving the development of the actual strategy. And that is how we have split the presentation today.
1

Firstly I will run through the process• ONRC – the basis: in the past State Highway have been separate from local authority
roads; now all roads ion NZ with similar functions have the same levels of service and similar performance measures. In this case we are focussing on the safety ones
• Collaborative – working closely with the Client and their strategies and plans• Risk‐based – segmentation is based on skid demand• Safety Assessment – prioritised safety rating method to give risk‐based ranking• Safety Strategies and Solutions – we talk about a suite of individual safety strategies
and related solutions that make up the safety management strategy• Safety Management Strategy – we then explain how we bring all the pieces together
to form the overall safety management strategy• Continuous improvement – ongoing review of the strategies and solutions to
continually inform and improve our safety management strategy
2

Diagram is an extract from the ONRC Guidelines• Strategic – overview of ONRC (the ‘why’)• Tactical level – defines all the performance measures; links them to the aims of the
individual key result areas and the corresponding technical outputs and customer outcomes (the ‘what’)
• Operational level – examples / case studies e.g. the work that we have done for the skid resistance strategy for Matamata‐Piako DC is a case study used by the Road Efficiency Group (REG). The case studies and examples contain specific strategies, and tools and guidelines to assist in achieving the ONRC aims and measuring performance to compare against the performance measures (the ‘how’)
3
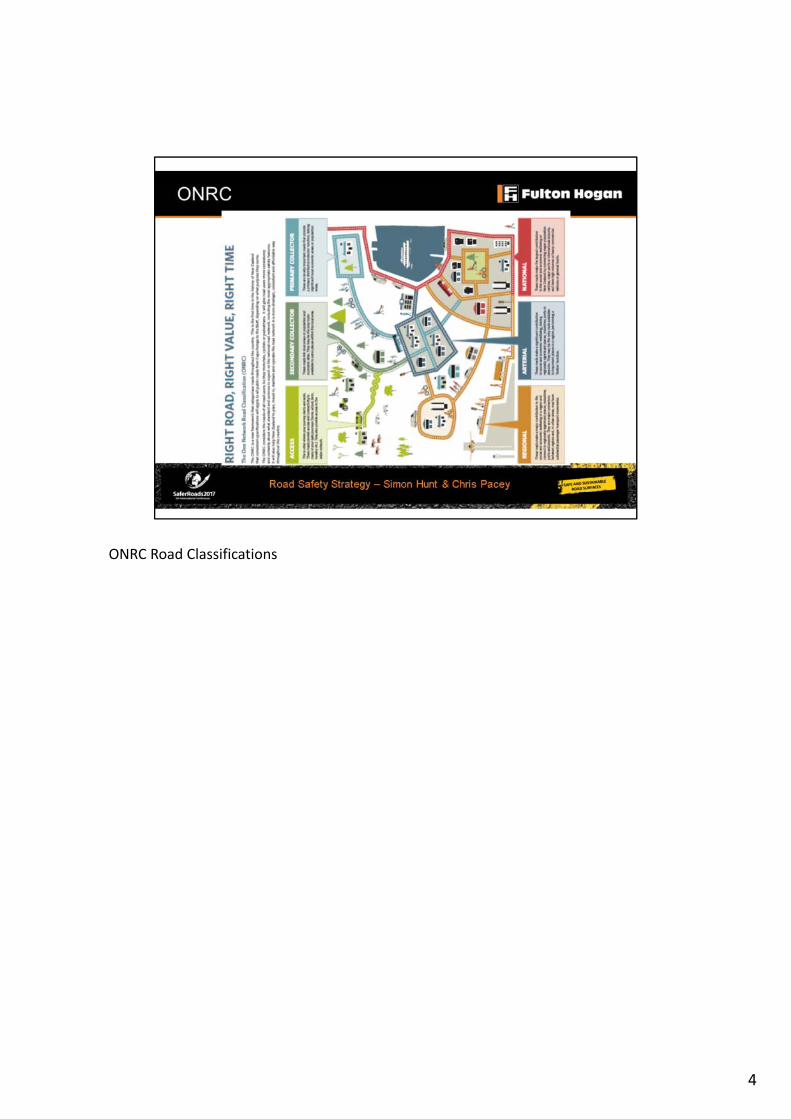
ONRC Road Classifications
4
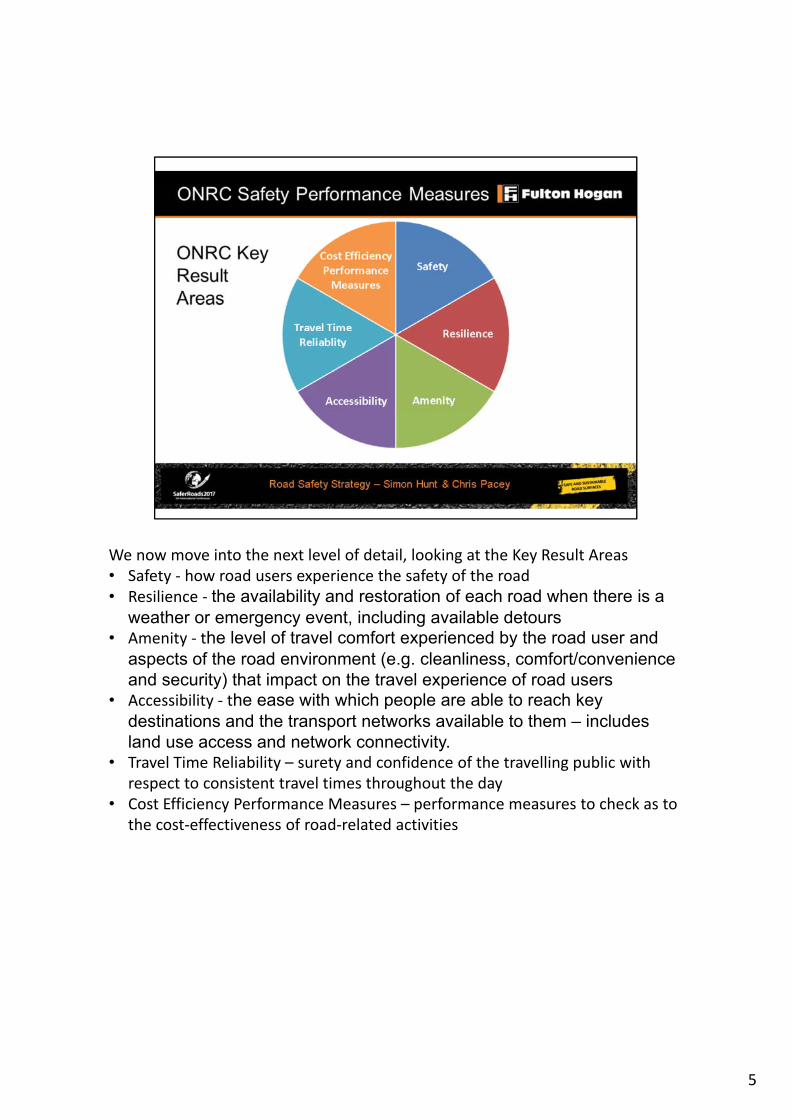
We now move into the next level of detail, looking at the Key Result Areas• Safety ‐ how road users experience the safety of the road• Resilience ‐ the availability and restoration of each road when there is a
weather or emergency event, including available detours• Amenity ‐ the level of travel comfort experienced by the road user and
aspects of the road environment (e.g. cleanliness, comfort/convenience and security) that impact on the travel experience of road users
• Accessibility ‐ the ease with which people are able to reach key destinations and the transport networks available to them – includes land use access and network connectivity.
• Travel Time Reliability – surety and confidence of the travelling public with respect to consistent travel times throughout the day
• Cost Efficiency Performance Measures – performance measures to check as to the cost‐effectiveness of road‐related activities
5

• The pie charts reflect the ratio of customer outcomes and technical outputs which are safety compared to the non‐safety performance measures. As you can see, Safety has a high percentage compared to the other KRAs
• Beneath these are the Customer Outcomes ‐ all of these relate to the number and risk of fatalities and serious injuries
6

• These are the Technical Outputs• All of these are safety issues that Engineers can address or mitigate• Our challenge is ‘How can we do this in the most efficient manner?’
7
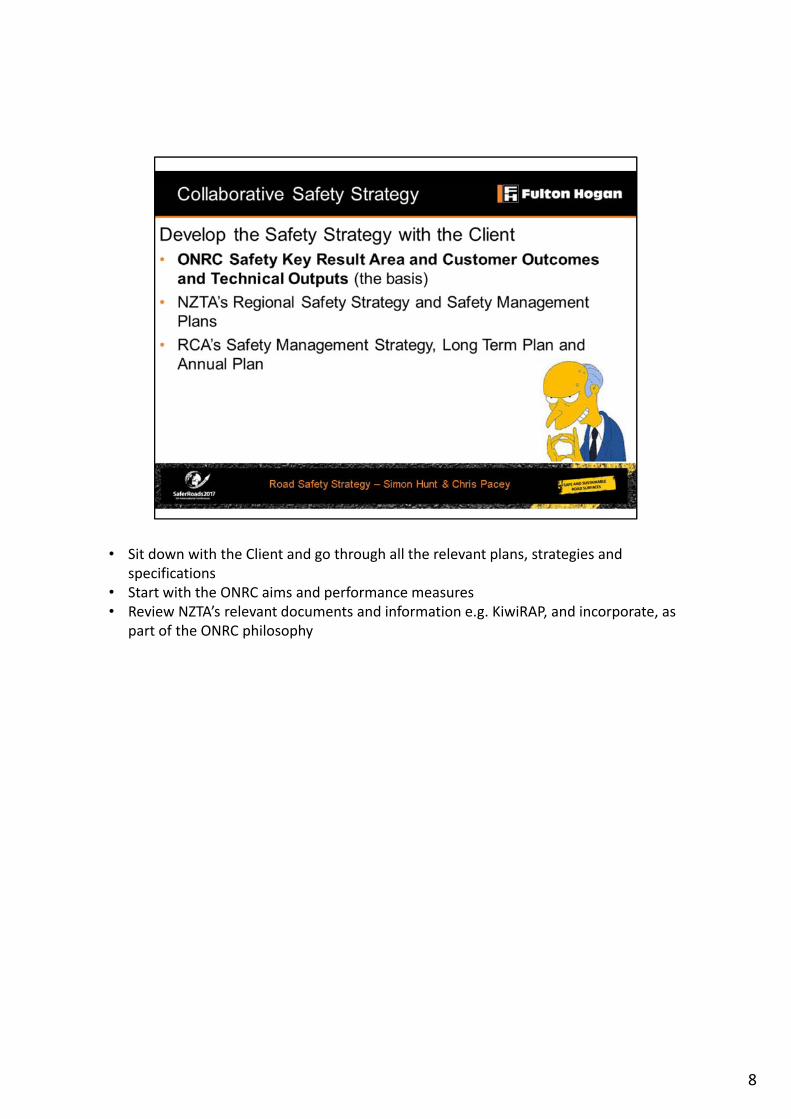
• Sit down with the Client and go through all the relevant plans, strategies and specifications
• Start with the ONRC aims and performance measures• Review NZTA’s relevant documents and information e.g. KiwiRAP, and incorporate, as
part of the ONRC philosophy
8
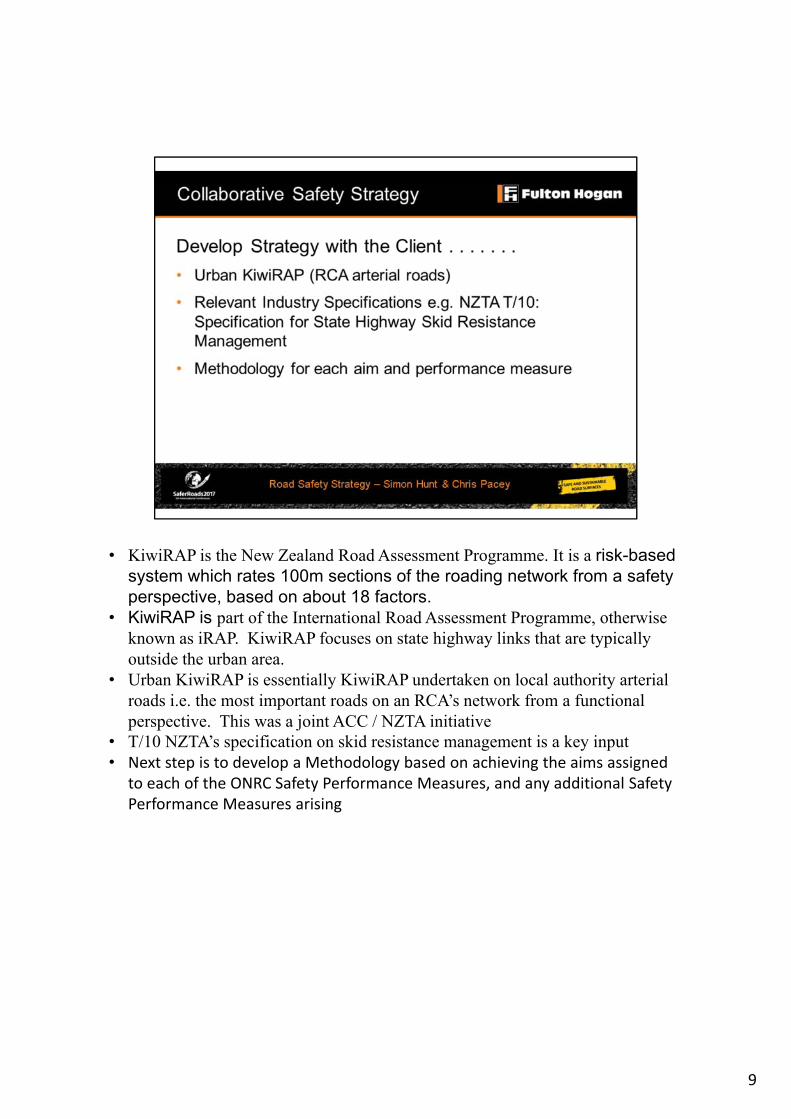
• KiwiRAP is the New Zealand Road Assessment Programme. It is a risk-based system which rates 100m sections of the roading network from a safety perspective, based on about 18 factors.
• KiwiRAP is part of the International Road Assessment Programme, otherwise known as iRAP. KiwiRAP focuses on state highway links that are typically outside the urban area.
• Urban KiwiRAP is essentially KiwiRAP undertaken on local authority arterial roads i.e. the most important roads on an RCA’s network from a functional perspective. This was a joint ACC / NZTA initiative
• T/10 NZTA’s specification on skid resistance management is a key input• Next step is to develop a Methodology based on achieving the aims assigned
to each of the ONRC Safety Performance Measures, and any additional Safety Performance Measures arising
9

CHRIS• As skid management is such a major component of safety management on a roading
network, we decided to use it as our foundation• Developing a robust methodology for something as complex as skid management
takes a lot of time and resources.• However by adapting T/10 we eliminated many of the concept, development, and
proof stages we would otherwise have had to push through.• The core of the T/10 approach is to segment the network based on demand for skid
resistance, which is accomplished by assessing the features along a road corridor. • Each segment is assigned an investigatory level above which a segment must be
further investigated, and also a threshold level above which treatment is required.
10

• Most of the data required to segment a network according to the T/10 methodology can be extracted from the RAMM Database.
• Our approach also requires an assessment of the consequence of leaving the road corridor, which requires a drive over inspection of the whole network.
• We also collect GPS enabled video of the network as we perform this inspection, allowing us to audit the results of that inspection.
11

• This is the first half of our rating matrix, through which we calculate the likelihood of an incident occurring and compare that against the consequence of a vehicle leaving the road.\
• This allows us to quantify the safety risk on all segments along a network.• The weightings for likelihood can be reconfigured to reflect the operating conditions,
or a client’s desired levels of service, on any given network.
• You’ll notice that Geometry is configured to have the highest weighting, which reflects the findings of recent projects which have shown that over 60% of out‐of‐control crashes in New Zealand occur on corners.
• Unfortunately consistent corner information is not readily available in the RAMM database for local roads.
• First we tried to calculate the position and radii of corners through an assessment of the curve advisory signs for that network, but we often found this information incomplete.
• Then we tried to calculate the position and radii of corners on the State Highway using a curvilinear analysis of the RAMM centreline and comparing the results to the information recorded in the State Highway RAMM database, but that failed due to the geometric inaccuracy of the centreline used.
12

• Around this time in our struggle we learned of the Top of The South and Eastern Bay of Plenty safety projects undertaken by ACC, NZTA, and Interpret Geospatial Consultants.
• They used the TomTom Centreline and ArcGIS to calculate the position and radii of corners on the State Highway in these areas to a very high degree of accuracy.
• One restriction of this methodology is that it cannot function on dense urban or unsealed roads for a variety of reasons, but corners are often not the critical feature of those types of segments anyway.
• Therefore we contacted Interpret and worked with them to get a trial of the Matamata‐Piako network prepared in a format we could use.
• We also expanded the project to include an assessment of approach, transition, and departure speeds of vehicles navigating these corners as the source data has traffic information bundled within it.
• So with this information we have everything we need to apply our methodology to our trial network.
13

• So here’s an example of how our approach works. I’ve pictured a corner roughly 6km south of Cape Reinga on State Highway 1.
• It’s an isolated corner when approaching from the north, and chained when approaching from the south; therefore the north is the critical direction.
• You can see from the photo that the road goes through a cutting, with faces less than 5m from the edge of seal.
• While we can see 65km/h advisory signs, we have to consider the approach speed when deceleration begins, which we would expect to be 100km/h.
14

• The RAMM database tells us that the daily traffic count is 300 vehicles per day for this site, and it was last sealed in 2011.
• I said before that it was an isolated corner when approaching from the north, and I also know that its radii slots it into the sharp category.
• Our design traffic speed is 100km/h, and we know there is a cutting face less than 5m from the edge of seal.
• With this information we calculate the likelihood of an incident occurring to be 3, and the consequence of leaving the road to be 5.
15
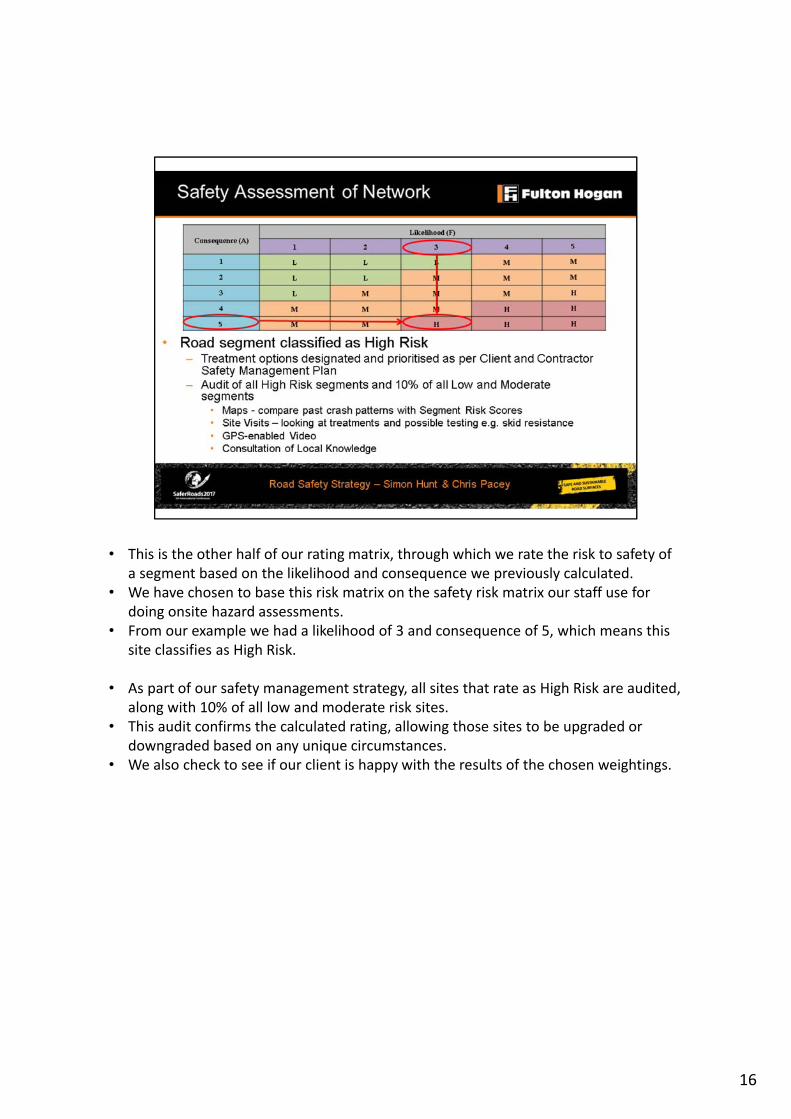
• This is the other half of our rating matrix, through which we rate the risk to safety of a segment based on the likelihood and consequence we previously calculated.
• We have chosen to base this risk matrix on the safety risk matrix our staff use for doing onsite hazard assessments.
• From our example we had a likelihood of 3 and consequence of 5, which means this site classifies as High Risk.
• As part of our safety management strategy, all sites that rate as High Risk are audited, along with 10% of all low and moderate risk sites.
• This audit confirms the calculated rating, allowing those sites to be upgraded or downgraded based on any unique circumstances.
• We also check to see if our client is happy with the results of the chosen weightings.
16

• In New Zealand it is a legal obligation for crashes to be reported to the Police who then investigate the causes of that crash and record it in a central database.
• This means we have a pretty thorough record of crash location, severity, and cause, in New Zealand going back decades.
• We use this database to compare our risk ratings against the past crash history• Should a low or moderate risk segment have a high crash history we would upgrade
that site to a high risk and investigate why more crashes were occurring that we would predict based on data.
17
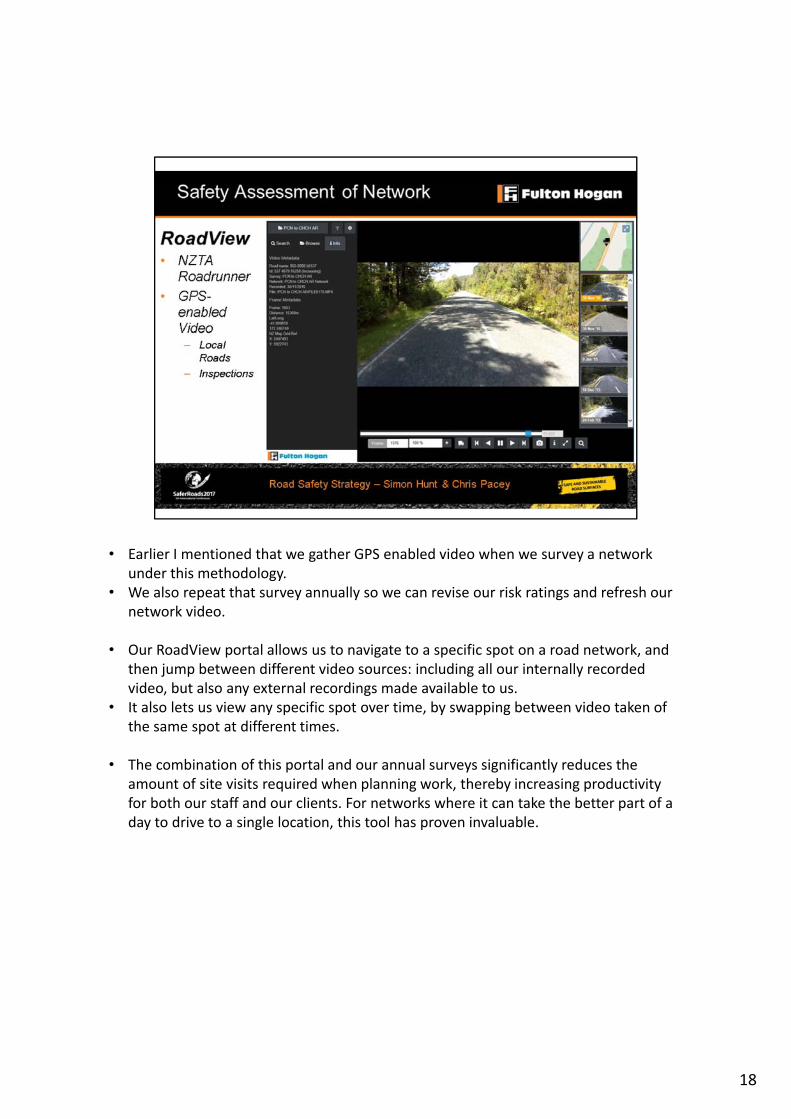
• Earlier I mentioned that we gather GPS enabled video when we survey a network under this methodology.
• We also repeat that survey annually so we can revise our risk ratings and refresh our network video.
• Our RoadView portal allows us to navigate to a specific spot on a road network, and then jump between different video sources: including all our internally recorded video, but also any external recordings made available to us.
• It also lets us view any specific spot over time, by swapping between video taken of the same spot at different times.
• The combination of this portal and our annual surveys significantly reduces the amount of site visits required when planning work, thereby increasing productivity for both our staff and our clients. For networks where it can take the better part of a day to drive to a single location, this tool has proven invaluable.
18
SIMON• We develop specific strategies, such as guardrail, skid resistance and sightline
(vegetation control) strategies, and associated solutions to target the Customer Outcomes and Technical Outputs in the most efficient manner
19

• Another element of the safety management strategy is developing a safe approach in how we undertake the physical work on the network
• Maintenance Intervention Guidelines (MIG) are initially developed based on least whole‐of‐life cost for maintaining the asset but will also have a safety focus with respect to what constitutes a maintenance‐related hazard i.e. take into consideration the safety aspects of executing the repair
• The last step is determining the monitoring, measuring and reporting requirements for our safety strategies and solutions
• We now have sufficient detail to complete the safety management strategy
20
• Strategies and Solutions should be continually reviewed and improved based on actual performance e.g. Aggregate Performance Method when assessing the performance of aggregate and surfacing types for surfacing solutions
• Lessons learnt on one network to be shared with other networks
21

• The ONRC Safety Key Result Area and related aims and performance measures form the basis for the Safety Management Strategy
• In developing the strategy, we have taken a collaborative and risk‐based approach• Curve analysis was technically the most difficult element – required to complete both
the network segmentation and the prioritised safety rating. Thanks to ACC and Interpret
• Prioritised safety rating means that the Client can make funding available down to a certain risk level
• Strategies and solutions have been developed to cost‐effectively address the Customer Outcomes and Technical Outputs
• Safety Management Strategy is a living process which we aim to continually review and improve
22