1337161382 an overview of the pharmaceutical sector in bangladesh (may 2012)
TRANSCRIPT

Introduction
The pharmaceutical market in Bangladesh is pretty small compared to the
population size of the country, mainly because of the lack of spending power
of the population. Pharmaceutical spending is also amongst the lowest in the
world in per capita terms. Healthcare expenditures consist of only 3.35% of
GDP. However, increased awareness of healthcare, increase in per capita
income, emergence of private healthcare services and the government’s
increased expenditure in this sector, together with other factors, have caused
the demand to rise in recent years. The sector is also protected from external
competition as imports are completely restricted for similar drugs that are
manufactured locally. This sector reports provides an overview of the
pharmaceutical sector in Bangladesh and highlights the top performers that
are listed in the Dhaka Stock Exchange (DSE).
Pharmaceutical Sector in Bangladesh
Pharmaceutical sector is technologically the most developed manufacturing
industries in Bangladesh and the third largest industry in terms of contribution
to government’s revenue. The industry contributes about 1% of the total
GDP. There are about 250 licensed pharmaceutical manufacturers in the
country; however, currently a little over 100 companies are in operation. It is
highly concentrated as top 20 companies produce 85% of the revenue.
According to IMS, a US-based market research firm, the retail market size is
estimated to be around BDT 84 billion as on 2011.
Bangladesh pharmaceutical companied focus primarily on branded generic
final formulations, mostly using imported APIs (Active Pharmaceuticals
Ingredient). Branded generics are a category of drugs, including prescription
products, that are either novel dosage forms of off-patent products produced
by a manufacturer that is not the originator of the molecule, or a molecule
copy of an off-patent product with a trade name. About 85% of the drugs sold
in Bangladesh are generics and 15% are patented drugs - the structure
differs significantly from the international market. Branded generic drugs
represent about 25% on average of worldwide pharmaceuticals sales’;
however, given the popularity in emerging markets like China, India and Latin
America, branded generic drugs may well dominate the total sales within a
decade.
Bangladesh manufactures about 450 generic drugs for 5,300 registered
brands which have 8,300 different forms of dosages and strengths. These
include a wide range of products from anti-ulcerants, flouroquinolones, anti-
rheumatic non-steroid drugs, non-narcotic analgesics, antihistamines, and
oral anti-diabetic drugs. Some larger firms have also started producing anti-
cancer and anti-retroviral drugs. Domestic manufacturers account for 97% of
the drug sales in the local market while the remaining 3% are imported. This
is a complete turnaround over from two/three decades back when imports
There are about 250 licensed
pharmaceutical companies in
Bangladesh. The industry contributes
1% to the country's GDP and is the
third largest industry in terms of
contribution to government revenue
Analyst:
Khandakar Safwan Saad [email protected]
(880) 173 035 7779
An Overview of the Pharmaceutical Sector in Bangladesh May 2012
The market is dominated by branded
generics, accounting for 85% of the
total sales in the country
The market is almost self-sufficient in
meeting local demand as 97% of the
drugs are manufactured locally
Pharmaceutical Sector in Bangladesh May 2012
2
used to dominate the market. The imported drugs include essential live
saving drugs and other high quality drugs. The ratio will further increase in
favor of the local production as some of the big players are poised to
manufacture these high quality drugs in-house in the future.
Market Size and Growth
As stated earlier, the size of the retail market reached BDT 84.0 billion as on
2011 based on IMS report. The report further stated that, retail sales in the
domestic market achieved 23.6% growth in 2011 following 23.8% and 16.8%
growth in 2010 and 2009 respectively. High growth in the last three years
(78.8% cumulative and 21.4% CAGR) meant that the Bangladesh
Pharmaceutical market doubled in just over four years. The retail market also
crossed USD 1.0 billion in size in 2011. It is one of the fastest growing
sectors in the country with an annual average growth rate of 17.2% over the
last five years and 13.1% over the last decade.
However, considering that IMS does not include rural market in their survey,
the actual size of the market will vary slightly (5%-10%). It is estimated that
the retail market represent 90% of the total market; in that respect the total
market size (including the rural market) is expected to be over BDT 90.0
billion at present.
Drivers behind Market Growth
The table above shows some selected health indicators for Bangladesh. Most
of the indicators improved over the last decade which are among some of the
factors that contributed to the growth of the sector.
There has been a gradual demographic shift - life expectancy improved
from 64.7 in 2000 to 68.3 in 2009 which highlights the increased health
consciousness among the people. Also the income level of the
population increased over the last decade which allowed them to spend
more for healthcare.
The base was also low as healthcare expenditure was less than 3% of
GDP in 2000 with total pharmaceutical sector size of BDT 24.5 billion
only in that year.
Increased medical coverage of population with new hospitals.
Emergence of private healthcare service - a number of top class
hospitals started operating which includes Apollo Hospitals, Square
Hospitals, United Hospitals and others. These hospitals became very
Increased life expectancy, increased
medical coverage of population,
emergence of private healthcare
services, growing income base of
population and popularization of
wellness drug are some of the
factors contributing to high industry
growth in recent times
Retail market registered 21.4%
CAGR over the last three years,
17.2% over the last five years and
13.1% over the last decade
Health Indicators 2009 2008 2005 2000
Life Expectancy 68.3 68 66.9 64.7
Government % in total health exp. 31.7% 31.4% 34.9% 39.0%
Health exp. as % of GDP 3.35% 3.32% 3.21% 2.82%
GDP per Capita (Current US$) 607.8 546.9 428.8 363.6
Health exp. per capital (Current US$) 18.4 16.5 12.1 9.1
Median Age (2011 estimate) 23.3 - - -
Poverty Level 31.5% NA 40.0% 48.9%
Source: World Bank
Table 2: Selected Health Indicators for Bangladesh
Year Size (BDT b) Growth
2011 84.0 23.6%
2010 68.0 23.8%
2009 54.9 16.8%
2008 47.0 6.9%
2007 44.0 15.8%
2006 38.0 4.1%
2005 36.5 17.5%
2004 31.1 8.6%
2003 28.6 5.9%
2002 27.0 10.2%
2001 24.5
Source: Square Pharmaceuticals Annual Reports & IMS Report
Table 1: Retail Market Size & Growth

Pharmaceutical Sector in Bangladesh May 2012
3
popular with the mass population due to their quality service; they have
been a major factor contributing to increased healthcare expenditure.
Although government expenditure as a % of total healthcare expenditure
did not improve in the last decade, there has been increased expenditure
in in absolute terms. Growth in private expenditure was the primary
reason behind fall in public % of expenditure.
Income base of the population has been growing over the last decade.
Health expenditure per capita doubled in the last decade, indicating
people’s willingness to spend more to remain healthy.
Drivers for Future Growth
Table 4 compares the indicators with other regions of the world and shows
that Bangladesh is way behind other countries. Government spending
proportion is much lower than that in other regions - it is one possible area
where future growth may come from. Moreover, the total health expenditure
to GDP ratio and health expenditure per capita of Bangladesh (both of which
gradually increased from 2000) is very low in comparison to developed and
developing countries. Since the base is still very low, we expect the recent
growth in the local retail market to continue in the current decade. Some
other factors that will also boost the industry growth includes:
Increase in number of modern hospitals
Increase in level of service/treatment provided in the hospitals with
improved/more modern diagnostic equipments
General people are getting more health conscious
Growing income level of the people
Export of pharmaceutical products
Growth Projections
Table 3 shows the healthcare expenditure as % of GDP for neighboring
countries to Bangladesh as well as some other developed countries as well.
Bangladesh is way below in the list of countries with only Pakistan below in
terms of healthcare expenditure percentage. If we assume that Bangladesh is
going to achieve 6.5% real GDP growth rate over the next five years and
healthcare expenditure to reach 5% of GDP by that time, then healthcare
expenditure in nominal value will grow at 15.4% annually over the next five
years.
Health Indicators Bangladesh World
South
Asia EU USA
Life Expectancy 68.3 69.4 65 79.4 78.1
Government % in total health exp. 31.7% 60.8% 32.9% 76.1% 48.6%
Health exp. as % of GDP 3.35% 10.03% 3.99% 10.31% 16.21%
Health exp. per capital (Current US$) 18.4 863.6 40.2 3,370.7 7,410.2
Source: World Bank
Table 4: Comparison of health indicators (2009) with other regions
Region 2009 2005 2000
USA 16.21% 14.72% 13.41%
World 10.03% 9.73% 9.23%
UK 9.34% 8.25% 7.04%
Japan 8.35% 8.16% 7.69%
Afghanistan 7.36% 8.76% 8.29%
Nigeria 5.82% 6.60% 4.56%
Nepal 5.81% 5.91% 5.06%
Thailand 4.31% 3.55% 3.40%
India 4.17% 4.03% 4.61%
Sri Lanka 3.96% 4.04% 3.72%
Bangladesh 3.35% 3.21% 2.82%
Pakistan 2.62% 2.78% 3.02%
Source: World Bank
Table 3: Healthcare exp as % of GDP
Increase in government spending,
increase in number of modern
hospitals and increase in health
consciousness of the people are
some of the drivers for future growth

Pharmaceutical Sector in Bangladesh May 2012
4
Bangladesh has been achieving around 6% GDP growth rate over the last
decade. The current government has set target to achieve even higher
growth rate in this decade, with a vision to achieve double-digit growth within
2018. As such, it is likely that the actual growth in GDP in the next five years
will be greater than the projected 6.5% - in that case the growth in healthcare
expenditure is likely to be more than our simple estimated value of ~15%.
At present, the retail pharmaceutical market size is about 1% of GDP and
health expenditure is about 3.35% of GDP. Therefore, the pharmaceutical
sector revenue accounts for ~30% of the healthcare expenditure. If we
assume that the ratio will remain constant over the years, pharmaceutical
revenue will also grow at par - at 15.4% annually over the next five years.
Major Players
Based on the IMS report for the fourth quarter 2011, Square Pharmaceuticals
(DSE: SQURPHARMA) holds the top market share in the retail market -
18.7%, followed by Incepta Pharmaceuticals (INCEPTA) - 9.3%, Beximco
Pharmaceuticals (DSE: BXPHARMA) - 8.8%, Opsonin Pharma (OPSONIN) -
5.1% and Renata (DSE: RENATA) - 4.9%. The top five companies held
46.8% market share in 2011, slightly more than their 46.2% market holding in
2010 - indicating cumulative revenue growth in excess of the sector growth.
Among the top five, three are listed in DSE – Square, Beximco and Renata.
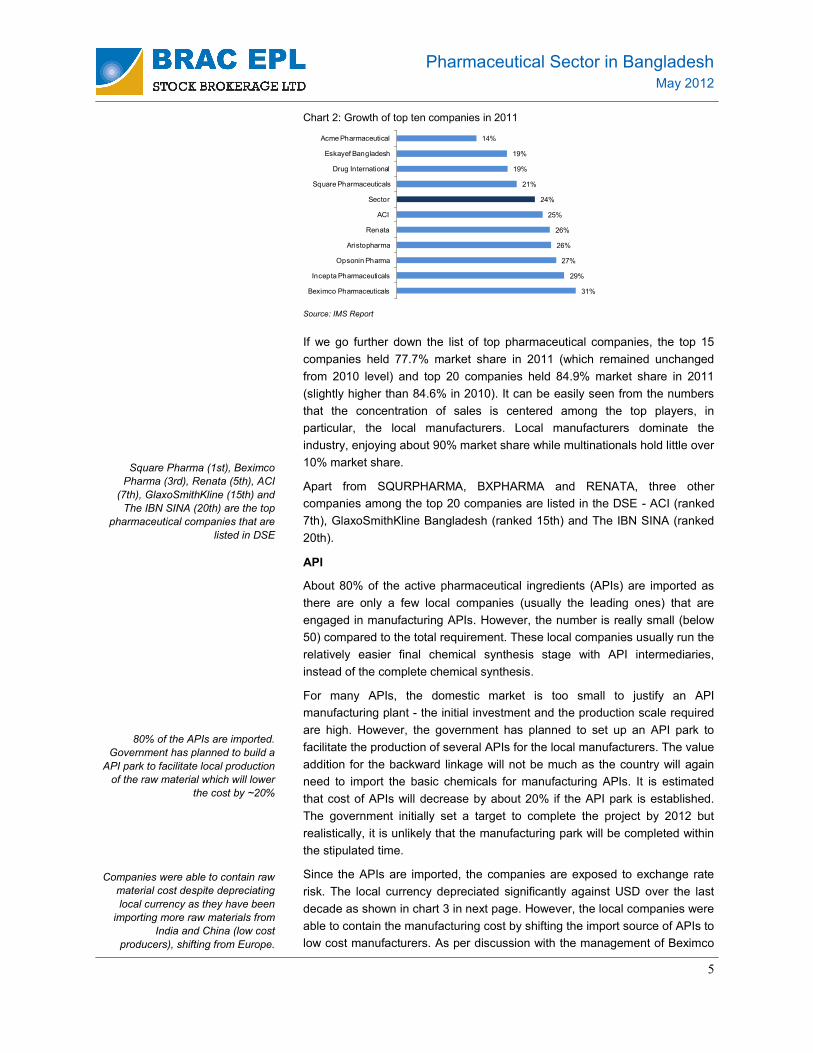
Top 10 companies held 67.7% of the market in 2011 as shown in chart 1.
Growth at par with the entire market meant that there cumulative holding did
not change from 2010 level. However, the market share shifted among the
top players. SQURPHARMA lost 0.5% market share in the last year (from
19.2% in 2010) while the next four companies gained 1.1% market share in
the same period. Growth in local sales of these four companies – INCEPTA,
BXPHARMA, OPSONIN and RENATA – was 28.5% in 2011, increasing their
market share from 27.0% in 2010 to 28.1% in 2011. Chart 2 in the next page
compares the growth rate for the top companies.
Market Size
(BDT m)
Growth in
2011
Market Share Company
2011 2010
Square Pharmaceuticals 15,725.8 20.5% 18.7% 19.2%
Incepta Pharmaceuticals 7,851.5 28.6% 9.3% 9.0%
Beximco Pharmaceuticals 7,415.0 30.5% 8.8% 8.4%
Opsonin Pharma 4,275.4 27.2% 5.1% 4.9%
Renata 4,076.8 26.1% 4.9% 4.8%
Eskayef Bangladesh 3,980.3 18.9% 4.7% 4.9%
ACI 3,578.2 24.9% 4.3% 4.2%
Acme Pharmaceutical 3,500.7 13.7% 4.2% 4.5%
Aristopharma 3,412.8 26.3% 4.1% 4.0%
Drug International 3,070.2 18.9% 3.7% 3.8%
Top 10 Companies 56,886.5 23.6% 67.7% 67.7%
Top 20 Companies 71,382.5 24.1% 84.9% 84.6%
Others Companies 12,661.6 20.7% 15.1% 15.4%
Total Sector 84,044.1 23.6%
Source: World Bank
Table 5: Major players in the retail market
Square Pharmaceuticals holds the
top market share, followed by
Incepta Pharmaceuticals and
Beximco Pharmaceuticals
Top 10 companies hold 67.7%
market share while top 15
companies hold 77.7% market share
With 6.5% forecasted GDP growth in
the next five years and healthcare
expenditure estimated to reach 5%
of GDP in that time, domestic market
is poised to grow over 15% annually
in the next five years
67.7%
32.3%
Top 10 Others
Source: IMS Report
Chart 1: Market Share
Pharmaceutical Sector in Bangladesh May 2012
5
If we go further down the list of top pharmaceutical companies, the top 15
companies held 77.7% market share in 2011 (which remained unchanged
from 2010 level) and top 20 companies held 84.9% market share in 2011
(slightly higher than 84.6% in 2010). It can be easily seen from the numbers
that the concentration of sales is centered among the top players, in
particular, the local manufacturers. Local manufacturers dominate the
industry, enjoying about 90% market share while multinationals hold little over
10% market share.
Apart from SQURPHARMA, BXPHARMA and RENATA, three other
companies among the top 20 companies are listed in the DSE - ACI (ranked
7th), GlaxoSmithKline Bangladesh (ranked 15th) and The IBN SINA (ranked
20th).
API
About 80% of the active pharmaceutical ingredients (APIs) are imported as
there are only a few local companies (usually the leading ones) that are
engaged in manufacturing APIs. However, the number is really small (below
50) compared to the total requirement. These local companies usually run the
relatively easier final chemical synthesis stage with API intermediaries,
instead of the complete chemical synthesis.
For many APIs, the domestic market is too small to justify an API
manufacturing plant - the initial investment and the production scale required
are high. However, the government has planned to set up an API park to
facilitate the production of several APIs for the local manufacturers. The value
addition for the backward linkage will not be much as the country will again
need to import the basic chemicals for manufacturing APIs. It is estimated
that cost of APIs will decrease by about 20% if the API park is established.
The government initially set a target to complete the project by 2012 but
realistically, it is unlikely that the manufacturing park will be completed within
the stipulated time.
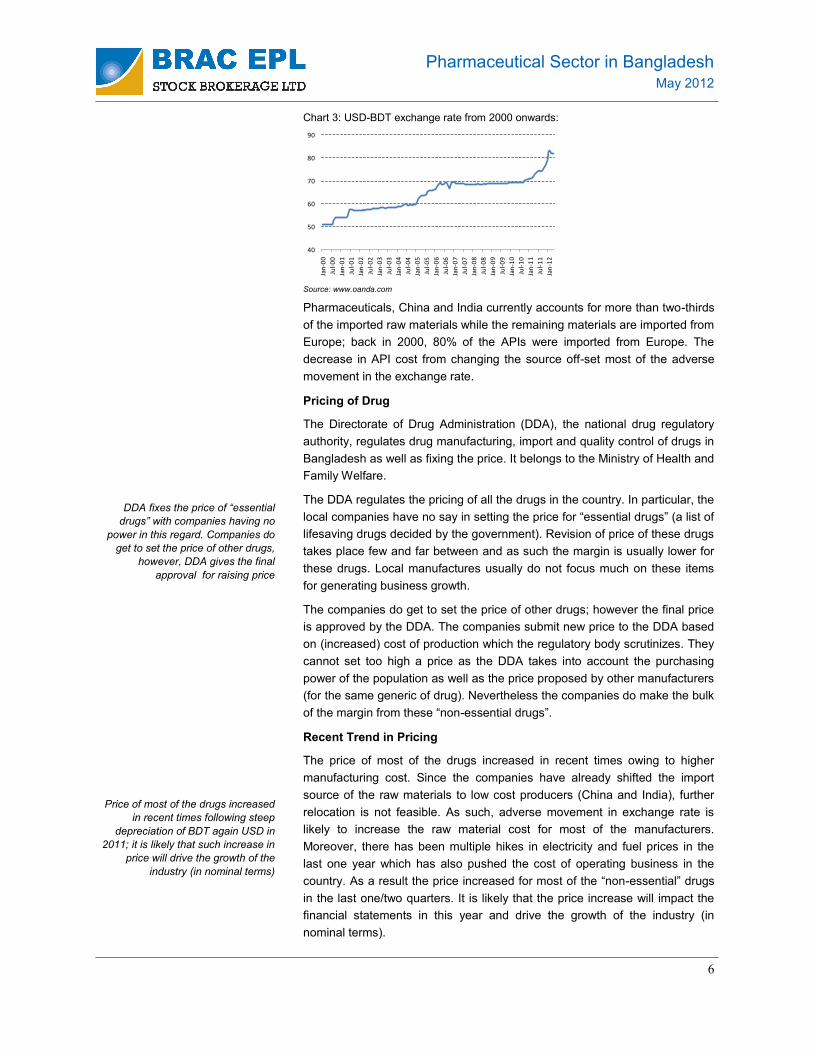
Since the APIs are imported, the companies are exposed to exchange rate
risk. The local currency depreciated significantly against USD over the last
decade as shown in chart 3 in next page. However, the local companies were
able to contain the manufacturing cost by shifting the import source of APIs to
low cost manufacturers. As per discussion with the management of Beximco
Square Pharma (1st), Beximco
Pharma (3rd), Renata (5th), ACI
(7th), GlaxoSmithKline (15th) and
The IBN SINA (20th) are the top
pharmaceutical companies that are
listed in DSE
80% of the APIs are imported.
Government has planned to build a
API park to facilitate local production
of the raw material which will lower
the cost by ~20%
Companies were able to contain raw
material cost despite depreciating
local currency as they have been
importing more raw materials from
India and China (low cost
producers), shifting from Europe.
31%
29%
27%
26%
26%
25%
24%
21%
19%
19%
14%
Beximco Pharmaceuticals
Incepta Pharmaceuticals
Opsonin Pharma
Aristopharma
Renata
ACI
Sector
Square Pharmaceuticals
Drug International
Eskayef Bangladesh
Acme Pharmaceutical
Chart 2: Growth of top ten companies in 2011
Source: IMS Report
Pharmaceutical Sector in Bangladesh May 2012
6
Pharmaceuticals, China and India currently accounts for more than two-thirds
of the imported raw materials while the remaining materials are imported from
Europe; back in 2000, 80% of the APIs were imported from Europe. The
decrease in API cost from changing the source off-set most of the adverse
movement in the exchange rate.
Pricing of Drug
The Directorate of Drug Administration (DDA), the national drug regulatory
authority, regulates drug manufacturing, import and quality control of drugs in
Bangladesh as well as fixing the price. It belongs to the Ministry of Health and
Family Welfare.
The DDA regulates the pricing of all the drugs in the country. In particular, the
local companies have no say in setting the price for “essential drugs” (a list of
lifesaving drugs decided by the government). Revision of price of these drugs
takes place few and far between and as such the margin is usually lower for
these drugs. Local manufactures usually do not focus much on these items
for generating business growth.
The companies do get to set the price of other drugs; however the final price
is approved by the DDA. The companies submit new price to the DDA based
on (increased) cost of production which the regulatory body scrutinizes. They
cannot set too high a price as the DDA takes into account the purchasing
power of the population as well as the price proposed by other manufacturers
(for the same generic of drug). Nevertheless the companies do make the bulk
of the margin from these “non-essential drugs”.
Recent Trend in Pricing
The price of most of the drugs increased in recent times owing to higher
manufacturing cost. Since the companies have already shifted the import
source of the raw materials to low cost producers (China and India), further
relocation is not feasible. As such, adverse movement in exchange rate is
likely to increase the raw material cost for most of the manufacturers.
Moreover, there has been multiple hikes in electricity and fuel prices in the
last one year which has also pushed the cost of operating business in the
country. As a result the price increased for most of the “non-essential” drugs
in the last one/two quarters. It is likely that the price increase will impact the
financial statements in this year and drive the growth of the industry (in
nominal terms).
DDA fixes the price of “essential
drugs” with companies having no
power in this regard. Companies do
get to set the price of other drugs,
however, DDA gives the final
approval for raising price
Price of most of the drugs increased
in recent times following steep
depreciation of BDT again USD in
2011; it is likely that such increase in
price will drive the growth of the
industry (in nominal terms)
Chart 3: USD-BDT exchange rate from 2000 onwards:
Source: www.oanda.com
40
50
60
70
80
90
Jan
-00
Jul-
00
Jan
-01
Jul-
01
Jan
-02
Jul-
02
Jan
-03
Jul-
03
Jan
-04
Jul-
04
Jan
-05
Jul-
05
Jan
-06
Jul-
06
Jan
-07
Jul-
07
Jan
-08
Jul-
08
Jan
-09
Jul-
09
Jan
-10
Jul-
10
Jan
-11
Jul-
11
Jan
-12

Pharmaceutical Sector in Bangladesh May 2012
7
TRIPS
The World Trade Organization's (WTO) Trade-Related Aspects of Intellectual
Property Rights (TRIPs) agreement permits Bangladesh to reverse-engineer
patented generic pharmaceutical products to sell locally and export to
markets around the world. The 1994 WTO agreement TRIPS requires
signatories to implement patent protection for almost all products, including
pharmaceuticals. However, article 66 provides Least Developed Countries
(LDCs) with a breathing space before introducing full product patent
protection. Bangladesh is therefore exempt until 2016 from the requirement to
observe patent protection on reverse-engineered generic products destined
for the local market. Bangladesh imports approximately 80% of its APIs for
domestic production, ~20% of which are patented.
Bangladesh also enjoys some export advantages from TRIPS with regards to
exporting pharmaceutical goods:
Bangladesh can export generic drugs to markets where the patent owner
has not filed for protection. Most drugs on WHO’s Model List of Essential
Drugs are not patented, as affordability is one of the criteria used in
designating medicines as “essential.”
Bangladesh can export to other LDCs or non-WTO members which have
not implemented product patent protection, for example Myanmar.
Bangladesh can also export to a country which has issued a compulsory
drug license and awarded the production contract to Bangladesh. TRIPS
grants governments the right to issue a compulsory license for public
health purposes, which occurs when a government overrides a patent
and grants another entity the right to produce the patented product. It
may do all of this without paying royalties to the patent owner.
The cost of importing APIs will most likely rise as TRIPS phases in. However,
it is likely that WTO would extend the facility for another 10 years on ground
of public health situation and technology transfer issue for producing patent
drugs in the LDCs. WTO will review extension of TRIPS agreement waivers
by the end of 2013. In case the TRIPS agreement is not extended beyond
2015, the local manufacturer will face a number of constraints including:
Import cost of patented APIs are likely to increase.
The cost of manufacturing patented drugs will also increase as the
companies are likely to pay royalty to the original manufacturer.
Export of patented products will become costly.
However, the cost pressure is likely to be associated with a lower proportion
of drugs as less than 20% drugs are patented in the current market.
Moreover, a number of blockbuster drugs have already lost patent or are
about to lose patent in the international market within this year, including
Plavix, Lipitor, Seroquel, Actos, Enbrel, Singulair, Levaquin, Zyprexa and
Concerta. With passage of time, more drugs are set to lose patent rights, as
such the post TRIPS era (if it happens in 2016), is not likely to have a
devastating impact in the pharmaceutical market in Bangladesh.
In case the TRIPS agreement is not
extended beyond 2015, Bangladeshi
companies will face cost pressure in
importing patented APIs and
producing patent drugs. However,
the impact may not be devastating
as proportion of patent drugs is very
small in our market
Bangladesh is exempted till
December 31, 2015 to implement
patent protection for pharmaceuticals
and other products

Pharmaceutical Sector in Bangladesh May 2012
8
Underlying Threat
The advantages that TRIPS provide for Bangladesh are somewhat offset by
the pace and competitiveness of the Indian and Chinese generic markets. In
both the countries, companies can produce drugs at highly competitive
pricing, even with higher costs associated with buying patented APIs or
paying royalties. Bangladesh will have to rely on the standard business
practices of producing the highest quality product at the lowest price to
compete on the international market which may be difficult to achieve in the
near term.
Bangladesh has a competitive disadvantage (when compared to India and
China), since the local pharmaceutical industry is not backward-integrated.
Most of the APIs have to be imported, and even if the APIs are manufactured
in the country, the basic raw materials still have to be imported. As such
construction of API Park is not likely to add too high a value in the
pharmaceutical manufacturing value chain. This results into higher factor
costs, especially in cases where the provider of the API is a competitor in
selling the finished product. Building up backward-integration for all relevant
APIs is also not a realistic option because of scale disadvantages and
infrastructure constraints. The reliance on importing API remains to be the
only significant threat for the pharmaceutical industry in Bangladesh.
Cost structure and Margins for Pharma Industry
Production cost is about 50%-55% for the pharmaceutical companies in
Bangladesh, which results into 45%-50% gross margin for most of the
companies. Raw materials, including API, excipients, packaging materials
and others, account for 75% of the production cost while the remaining 25%
is the conversion cost. Operating cost is about 25% of sales for an average
pharmaceutical company, most of which is dominated by selling and
marketing expenses (more than three-fourth of the operating cost).
Operating margin is about 20%-25% and net profit margin (NPM) varies
around 15% for the industry. The NPM is usually better for the listed
companies as they enjoy significant tax rebate for listing. 37.5% corporate tax
is applicable for non-listed companies in Bangladesh while it goes down to
27.5% for listing in the stock exchange. Listed companies further enjoy 10%
rebate for paying out more than 20% of paid-up capital as cash dividend -
corporate tax rate is only 24.75% for them. Table 6 shows the cost structure
& margin for the top three listed companies (pharmaceutical business only).
The reliance on imported APIs
remain as the major threat to the
industry
37.50%
27.50%24.75%
Non-Listed Listed Listed with 20% cash dividend
Chart 4: Tax Rates for Companies
Source: BRAC EPL Research
Square Beximco Renata
Gross Margin 42.8% 48.9% 52.7%
Operating Exp to sales 20.4% 23.7% 27.1%
Marketing Exp to sales 15.7% 20.1% NA
Operatinf Margin 22.4% 25.2% 25.7%
PBT Margin 25.3% 21.0% 22.2%
Tax expense to sales 6.5% 4.8% 5.5%
Net Margin 18.8% 16.2% 16.7%
Effective tax rate 25.8% 22.8% 24.6%
Table 6: Cost Structure of Top 3 listed companies
Source: BRAC EPL Research

Pharmaceutical Sector in Bangladesh May 2012
9
Export and Import
Bangladesh’s overall export earnings from pharmaceuticals reached USD
46.0 billion for the calendar year 2011, recording a growth of 16.1% over
USD 39.6 billion in calendar year 2010. Exports earnings in Q1’2012 was
USD 10.9 billion, 5.7% up from the same period previous year. Table 6
shows the quarter wise export earnings for the last three years while Chart 5
shows the total export over the last eight fiscal years*.
Pharmaceutical export from Bangladesh recorded 25.5% growth annually
over the last seven years. However, the growth was not steady across all the
years - in fact in FY2009 pharmaceutical export dropped 1.8% following the
global financial crisis. In FY2011 also, the growth was only 1.0% because of
sovereign debt crisis in Europe. Apart from these two years where trade
slowed down significantly worldwide, pharmaceutical export was robust in all
other years.
We expect the export growth to pick up from 2012 onwards given that the
world trade is likely to recover from the sovereign debt crisis. However, the
growth rate is likely to peak four/five years from now. Most of the top
pharmaceutical companies are gearing up for the export market as most of
them have been establishing GMP (Good Manufacturing Practice)
compliance plants. Some of the top companies have already received UK-
MHRA Certificate (Square Pharmaceuticals being the first company to do so
in 2007) while most of them are awaiting for US FDA approval. Apart from
these two major GMP certificate, most of the top companies have already
received GMP clearance from a number of countries, including Turkey,
Yemen, Kenya, Congo, Uganda, Sudan, Ethiopia, etc. Once the growth in the
domestic market becomes steady, companies are likely to focus heavily in
the export market. Earlier, we forecasted domestic market to grow at around
15% annually over the next five years. Top companies can easily achieve
more than 15% growth by attaining higher export sales. Going beyond 2016,
export is likely to be the major driver behind company’s top line growth.
Chart 5: Pharmaceutical Export and Growth (BDT m)
Source: Bangladesh Bank and Export Promotion Bureau
-20%
0%
20%
40%
60%
80%
100%
120%
0.0
400.0
800.0
1,200.0
1,600.0
2,000.0
2,400.0
2,800.0
2004 2005 2006 2007 2008 2009 2010 2011
Pharmaceuticals (LHS) Growth (RHS)
Chart 6: Pharmaceutical and Organic Chemical Import (USD m)
Source: Bangladesh Bank
0.0
100.0
200.0
300.0
400.0
500.0
600.0
2003 2004 2005 2006 2007 2008 2009 2010 2011
Pharmaceuticals Organic Chemical
Export Sales is likely to drive
companies„ revenue once domestic
market reaches steady growth
Some of the top companies already
received the UK-MHRA Certificate
while the US FDA approval is waiting
in the pipeline for many companies
2011 2010 2009
Q1 10.4 9.4 8.8
Q2 12.4 8.7 8.5
Q3 12.3 10.1 10.2
Q4 10.9 11.4 12.7
Total 46.0 39.6 40.1
Table 7: Pharma Export (USD m)
Source: Export Promotion Bureau
* Fiscal Year (FY) is from July to June; FY 2012 means July 2011 to June 2012
Pharmaceutical Sector in Bangladesh May 2012
10
Chart 6 in the previous page shows the import data for pharmaceutical
products and organic chemicals. Over the last eight years, import of
pharmaceutical products grew at 12.9% annually while organic chemical grew
at 15.8%. Unlike export data, pharmaceutical and chemical imports have
been steady over the last four years as the domestic market has been bullish
is the same period.
Budget Directives for FY2012
The government lowered import duties for the FY2012 to provide support to
the pharmaceutical companies. They proposed the following changes to
promote further growth of the sector:
Lower import duty for certain raw materials, from 12% to 5%.
Lower duty for importing certain capital machineries used in the
pharmaceutical industry - for instance a sandwich panel that had a duty
of 12% applied on it would now have a 3% duty.
Withdrawal of existing 5% import duty and 15% VAT on leucocytes filter
used in purification of blood of thalasamia patients
Withdrawal of 20% supplementary duty and reduction of import duty from
25% to 12% on cartridge/membrane filter used for pharmaceuticals
industry.
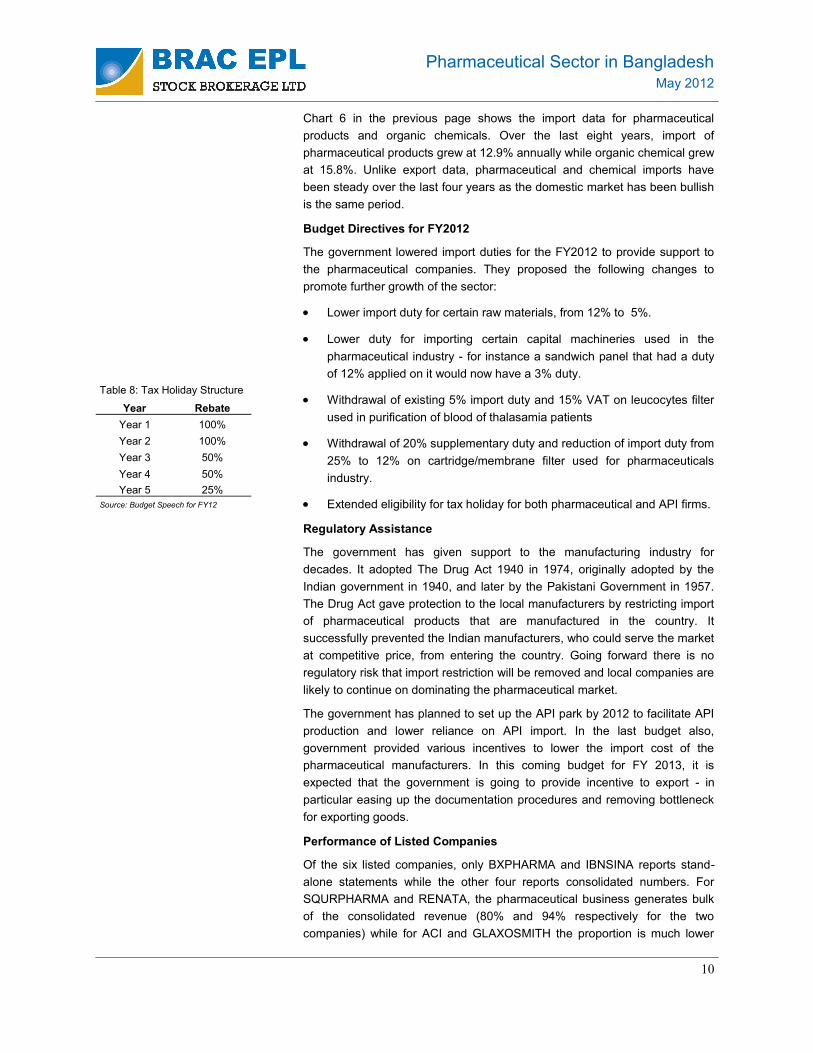
Extended eligibility for tax holiday for both pharmaceutical and API firms.
Regulatory Assistance
The government has given support to the manufacturing industry for
decades. It adopted The Drug Act 1940 in 1974, originally adopted by the
Indian government in 1940, and later by the Pakistani Government in 1957.
The Drug Act gave protection to the local manufacturers by restricting import
of pharmaceutical products that are manufactured in the country. It
successfully prevented the Indian manufacturers, who could serve the market
at competitive price, from entering the country. Going forward there is no
regulatory risk that import restriction will be removed and local companies are
likely to continue on dominating the pharmaceutical market.
The government has planned to set up the API park by 2012 to facilitate API
production and lower reliance on API import. In the last budget also,
government provided various incentives to lower the import cost of the
pharmaceutical manufacturers. In this coming budget for FY 2013, it is
expected that the government is going to provide incentive to export - in
particular easing up the documentation procedures and removing bottleneck
for exporting goods.
Performance of Listed Companies
Of the six listed companies, only BXPHARMA and IBNSINA reports stand-
alone statements while the other four reports consolidated numbers. For
SQURPHARMA and RENATA, the pharmaceutical business generates bulk
of the consolidated revenue (80% and 94% respectively for the two
companies) while for ACI and GLAXOSMITH the proportion is much lower
Year Rebate
Year 1 100%
Year 2 100%
Year 3 50%
Year 4 50%
Year 5 25%
Source: Budget Speech for FY12
Table 8: Tax Holiday Structure

Pharmaceutical Sector in Bangladesh May 2012
11
(about 50%). Among the six companies, SQURPHARMA, BXPHARMA and
RENATA present investors with prospective investment opportunities. For
IBNSINA the market capitalization is very small for investment.
The sector P/E ratio (comprising of these six companies only) stands at
21.2x. Because of the market weight of the top two, the P/E ratio is heavily
tilted towards Square Pharmaceuticals (20.0x) and Beximco Pharmaceuticals
(19.7x). Renata has the highest P/E ratio of 26.0x.
DSE Ticker Market Price
(BDT)
Market Cap
(BDT m)
Profit in 2011
(BDT m) P/E
SQURPHARMA 268.7 71,161.1 3,565.4 20.0x
BXPHARMA 93.9 23,641.0 1,198.4 19.7x RENATA 981.2 27,710.9 1,066.7 26.0x
ACI 247.8 4,885.3 238.1 20.5x
GLAXOSMITH 605.2 7,290.5 282.1 25.8x
IBNSINA 135.5 1,756.1 70.8 24.8x
MCAP Weighted P/E 21.2x
Source: DSE Website and BRAC EPL Research
Table 9: Comparison of listed pharmaceuticals companies
* Market price and market capitalization given as on May 10, 2012
Pharmaceutical Sector in Bangladesh May 2012
12
IMPORTANT DISCLOSURES
Analyst Certification: Each research analyst and research associate who authored this document and whose name appears herein certifies that the recommendations and opinions expressed in the research report accurately reflect their personal views about any and all of the securities or issuers discussed therein that are within the coverage universe. Disclaimer: Estimates and projections herein are our own and are based on assumptions that we believe to be reasonable. Information presented herein, while obtained from sources we believe to be reliable, is not guaranteed either as to accuracy or completeness. Neither the information nor any opinion expressed herein constitutes a solicitation of the purchase or sale of any security. As it acts for public companies from time to time, BRAC-EPL may have a relationship with the above mentioned company(s). This report is intended for distribution in only those jurisdictions in which BRAC-EPL is registered and any distribution outside those jurisdictions is strictly prohibited. Compensation of Analysts: The compensation of research analysts is intended to reflect the value of the services they provide to the clients of BRAC-EPL. As with most other employees, the compensation of research analysts is impacted by the overall profitability of the firm, which may include revenues from corporate finance activities of the firm's Corporate Finance department. However, Research analysts' compensation is not directly related to specific corporate finance transaction. General Risk Factors: BRAC-EPL will conduct a comprehensive risk assessment for each company under coverage at the time of initiating research coverage and also revisit this assessment when subsequent update reports are published or material company events occur. Following are some general risks that can impact future operational and financial performance: (1) Industry fundamentals with respect to customer demand or product / service pricing could change expected revenues and earnings; (2) Issues relating to major competitors or market shares or new product expectations could change investor attitudes; (3) Unforeseen developments with respect to the management, financial condition or accounting policies alter the prospective valuation; or (4) Interest rates, currency or major segments of the economy could alter investor confidence and investment prospects.
BRAC EPL Research www.bracepl.com 121/B Gulshan Avenue Gulshan-2, Dhaka Phone: +880 2 881 9421-5 Fax: +880 2 881 9426 E-Mail: [email protected]
BRAC EPL Stock Brokerage Capital Markets Group
Institutional Sales and Trading
Delwar Hussain (Del) Head of International Trade & Sales
[email protected] 01755 541 252
Ali Imam Head of Research [email protected] 01730 357 153
Khandakar Safwan Saad Research Associate [email protected] 01730 357 779
Farjad Siddiqui Research Associate [email protected] 01730 727 924
Kallol Biswas Research Associate [email protected] 01730 727 930
Nafees Mohammed Badruddin Research Associate [email protected] 01730 727 931
Sajid Huq Amit Head of Strategic Sales [email protected] 01755 541 254
Strategic Sales