139896 inlaga eng arsredo05 - investment ab latour · latour 2005 1 latour at a glance automotive...
TRANSCRIPT

Annual Report
2005
LATOUR

Annual General Meeting
Time and locationThe Annual General Meeting will be held Wednesday 10 May 2006, 17.00 at the Radisson SAS Scandinavia Hotel, Södra Hamngatan 59–65, Gothenburg, Sweden.
ParticipationShareholders who desire to participate in the Annual General Meeting must be recorded in the registered list of shareholders managed by VPC AB by Thursday, 4 May 2006, and submit a notice of intention to participate to Latour at the latest on Thursday, 4 May 2006, by 15.00.
Notice of participation The notice of intention to participate may be submitted to Investment AB Latour, Box 336, SE-401 25 Gothenburg, or Investment AB Latour, Box 7158, SE-103 88 Stockholm, by telephone 46-31-89 17 90 or 46-8-679 56 00, or on Latour’s website www.latour.se.
RegistrationShareholders who have their shares held in the name of a nominee must arrange in sufficient time before 4 May 2006 to have the nominee temporarily register their shares in their own name in order to be able to participate in the proceedings at the Annual General Meeting.
DividendThe Board of Directors recommends that the Annual General Meeting declare a dividend in the amount of SEK 7.00 per share. The dividend record date suggested is 15 May 2006. If the Annual General Meeting decides according to this recommendation, the dividend is expected to be sent from VPC on Thursday, 18 May 2006 to those who are registered in the share register on the record date.
Information dates2006-05-03 Interim report per 2006-03-312006-05-10 Annual General Meeting2006-08-24 Interim report per 2006-06-302006-11-09 Interim report per 2006-09-30
Contents 1 Latour at a glance
2 Comments from the Chief Executive Officer
4 Latour’s market portfolio and ownership
6 Investment portfolio
7 Value development and risk
8 The Latour share
9 Price trends, share turnover
10 The 10 largest owners
11 Five year overview
Business areas
12 Automotive
14 Filters
16 Hand Tools
18 Hydraulics
20 Air Treatment
22 Machinery Trading
24 Textiles
26 Engineering Technology
Portfolio companies
28 Assa Abloy AB
30 AB Fagerhult
32 Securitas AB
34 Munters AB
36 Elanders AB
37 Sweco AB
38 Närkes Elektriska AB
39 The Annual Accounts
40 Board of Directors’ Report
42 Quarterly information
43 Consolidated income statement
44 Consolidated balance sheet
46 Consolidated cash flow statement
47 Change in consolidated equity
47 Change in consolidated interest- bearing net debt
48 Parent company income statement
49 Parent company balance sheet
50 Parent company cash flow statement
50 Change in parent company equity
51 Notes
79 Proposed disposition of profits
80 Audit report
81 Corporate governance
83 Board of directors, Group management, Accountants
84 Addresses

LATOUR 2005 1
Latour at a glance
Automotive Filters Hand Tools Hydraulics Air Treatment Machinery Textiles Engineering Trading Technology
Group profi t after tax totalled SEK 709 m (1,001), which corresponds to SEK 16.20 (22.86) per share.
The Latour share’s net worth amounted to SEK 238 (187) on 31 December 2005.
Sales in industrial and trading companies totalled SEK 4,852 m (4,434) and opera-ting profi t was SEK 342 m (242), an increase in profi ts by 41%.
Acquisitions in Hand Tools and Engineering Technology business areas. Divestitures in the Textiles business area.
Proposed dividends are SEK 7.00 (6.00) per share.
Business areas
Investment portfolio
Assa Abloy Elanders Fagerhult Munters NEA Securitas Sweco

2 LATOUR 2005
Comments by the Chief Executive Officer
Jan Svensson
Avery good industrial cycle throughout 2005 resulted in greater order uptake, invoiced sales and profit in our industrial and trading companies. Moreover,
the stock market developed positively during the year, which resulted in growth in the value of the Group’s invest-ment portfolio by 19% or SEK 1,571 m. Higher dividends from our portfolio companies together with substantially improved results in our industrial and trading companies turned 2005 into a very profitable year, despite few divest-ments from our market portfolio. Profits after net financial items, exclusive capital gains on shares, increased by 174% to SEK 590 m.
Industrial and trading operationsAs a result of the strong demand in almost all our industrial and trading companies we invested intensely in both organic growth and growth through acquisitions. The Group has also focused on working to successfully integrate the companies acquired during 2004.
Order uptake rose by 10% (9% adjusted for acquisitions and divestitures) to SEK 5,010 m.
The overall turnover for our industrial and trading com-panies was SEK 4,852 m, an increase of 9% (9% adjusted for acquisitions and divestitures). Operating profits surged to SEK 342 m (242), an increase of all of 41%.
The various business areas are commented on individu-ally on pages 12–27 but a few events deserve mentioning here.
In the latter part of the year the Automotive business area began delivering components to air conditioning units in cars. Although production start costs were higher than calcu-lated the resulting future opportunities are immense. At the beginning of 2006 Automotive acquired HordaGruppen Vätterleden AB and thereby formed a powerful supplier con-stellation of plastic, rubber and metal pipes to the automo-tive industry in Europe. The acquisition also added a num-ber of new and interesting automotive manufacturers to our list of customers. Turnover for the business area in 2006 is expected to reach close to SEK 600 m.
The Hand Tools Business Area has expertly integrated Wibe Stegar AB into its operations. This, together with the transfer of some of our labour intensive production to our newly built factory in Romania resulted in a rise in turnover and profits by more than 50%.
The Group’s largest business area, the Air Treatment, was very successful in 2005. The merger of PM-Luft and Stifab Farex into one company, Swegon AB, in the beginning of 2005 has given rise to significant synergies and we have cap-tured market shares in Sweden and Europe. Sales outside
the Nordic region grew by all of 30%, particularly in the markets of Poland, Russia and England.
Turnover in the Machinery Trading business area grew despite a shrinking market in 2005, which shows that we won market shares. During the year we have invested sub-stantial amounts in restructuring operations, primarily in the sales of woodworking machinery. Order uptake in the business area rose considerably at the end of 2005 and this has continued in the beginning of 2006.
The Textiles business area has gone through some major changes during the year. Crafts operations in Almedahls AB were divested on 1 April and in the autumn Almedahl-Kinna AB was sold to Domicet Oy. At the end of December Holma-Helsinglands AB was sold to company management and Almedahls AB’s property in Dalsjöfors was sold to a local property manager.
FOV Fabrics, which has had weak profit development the past few years has decided to stop manufacturing air bag fabric. Production of air bag fabric, which makes up approximately half of company operations, will be com-pletely phased-out in 2007.
The Engineering Technology business area acquired AxFlow AB’s gasket and sealing operations. This acquisition

LATOUR 2005 3
makes the business area the leading after sales service sup-plier in gaskets and sealings in Sweden.
Investment portfolioThe total value of the investment portfolio, adjusted for acquisitions and divestitures, grew by 19% to SEK 9,640 m. This represents an increase in value of SEK 1,571 m. The one single share that has contributed most to the increase in value is Sweco, which represents SEK 509 m in value growth.
Profitability, share acquisition and divestment, dividendsThe Group’s total profit after net financial items was SEK 792 m. Only a few changes were made in the investment portfolio in 2005. Holdings in Munters were expanded by 190,250 shares and holdings in Sweco by 5,900 class A shares and 340,000 class B shares. Class B shares of 1,000,000 each have been sold in Assa Abloy and Securitas as well as 225,500 shares in Fagerhult. Profit on these sales amounted to SEK 203 m. Unlisted holdings in Bravida and ProstaLund were written-down by SEK 21 m. A total of SEK 223 m has been received in dividends. Our investment portfolio is now made up solely of holdings where we hold at least 10% of the voting rights.
Total profit after tax equals SEK 16.20 per share. Industrial and trading companies generated SEK 5.74 of this sum.
The board of directors proposes that dividends be raised to SEK 7.00 (6.00) per share, which is a direct return of 3.4% based on the balance sheet date rate.
Latour shareThe Latour share (class B) increased in value by 26% over the year to SEK 204.50. During the same period, the Stockholm Stock Exchange rose 33%. The Group’s net worth at year-end totalled SEK 10,392 m or the equivalent of SEK 238 (187) per share, an increase of 27%. Shares were thus being traded at a discount of 14%. This opens up for reflection on how we value our wholly owned industrial and trading companies compared to the stock exchange’s valua-tion of similar companies. We currently value our industrial and trading companies at 10 times operating profit after standard tax rate, in other words as completely debt free companies. Assuming an equity ratio of 50%, which is a rea-sonable debt/equity ratio, this is the equivalent of P/E 11. It could be argued that based on the stock exchange’s valuation of similar companies this might be a far too conservative valuation and that the P/E 13 is more realistic. In that case
the net worth of the Latour share would increase by more than SEK 10.00 per share.
During the year, a liquidity guarantee for trade with Latour shares was initiated. A program for commission free trade has been implemented so that shareholders can cost free make supplemental purchases or sales of blocks of shares. After the decision of the Annual General Meeting to allow share conversion, 6,084,283 class A shares were converted to class B shares. These measures have prompted more trading in the share during year. This was particularly noticeable after the conversion of class A to class B shares occurred in the autumn.
Prospects for 2006The economy is expected to remain strong throughout 2006. We are convinced that we can continue to perform well in components, machinery and input goods for the engineering industry as well as in air treatment products and hand tools. Restructuring the industrial and trading companies must progress. We will not be able to expand and develop all our business areas. In the future we will have to concentrate on fewer business areas and this will require acquiring as well as divesting operations. Our long-term goal is for fewer business areas to generate considerably higher turnover with a greater content of internationalisa-tion than is currently the case.
As far as the Group’s investment portfolio is concerned we are convinced that our work as active owners will benefit the development of these companies and thereby Latour’s shareholders as well.
Jan SvenssonChief Executive Officer
C o m m e n t s b y t h e C h i e f E x e c u t i v e O f f i c e r

4 LATOUR 2005
Through the years I have commented on develop-ments during the financial year and the market portfolio. These remarks have also included
personal observations concerning the world Latour operates in and underlined the values we represent. As a result of the current division of work Latour’s Chief Executive Officer Jan Svensson will take over this role in the future. This is a natural transfer since Jan is CEO and in addition formed by a tradition of family-owned business which is comparable to my family’s perspective. This will be the last time my observations are presented in Latour’s Annual Report.
Latour has a deep respect for the proficiency in good companies. It takes a long time to form a certain culture in a company but unfortunately a very little to tear it down. An owner cannot therefore achieve anything without becoming an integral part of a company and its values. This makes it difficult to hop onto something new or sell off a holding and as a result we miss some business oppor-tunities. However, because we know our companies well we can play an active role as owners. Our familiarity with them permits us to see both the opportunities and threats looming ahead. We play our role on the board with respect for the division of responsibility between board work and daily management. We want company management to be strong and have integrity. There have been instances where we have not been allowed into a company and in these cases we can choose to fight or retreat. This situation is perhaps due to an error in judgement concerning our own competence, the company, its leadership, circumstances or the agenda of other owners. We seldom insist since the world is full of opportunities.
Latour has played a part in internationalising a number of companies through the years. This participation has always been in teamwork with the individual companies where we have had the advantage of learning quite a bit through time. However, it’s amazing how often the same patterns are repeated and how similar some critical courses of events are to each other. Almost all of these internationalisations have included making acquisitions. This is a mine-filled area in which eagerness to step out into the world must be coupled to the need to concentrate on the company’s focus and the ability to assert one’s own culture while learning from the companies acquired. It’s no coincidence that most company acquisitions are not particularly successful. After having participated in quite a number of acquisitions first hand I have come to see the required costing resulting from the IFRS impairment tests as something positive. Time and time again I have observed
Latour’s market portfolio and ownership
the same pattern. Since proper costings are not performed no one learns from their mistakes. However, pressure to falsify IFRS results will be considerable, particularly in anonymously owned companies with a PR mindset and prestige in management.
Globalisation brings new challenges whether we like it or not. It will condense the time companies have before they must move beyond their local market. Unfortunately it will be necessary to act from a much broader horizon right from the start. Previously we carefully crossed borders through our Nordic neighbours and considered Denmark a hard nut to crack. Nowadays India and China come much earlier into the picture. This puts new demands on us if we want to assert the best in our society. It also makes the deficiencies in our educated society a very serious matter. The thirst for knowledge was previously a strength of the Swedish Welfare State. Now there is an anxiety-ridden resistance to making demands, focusing education and giving grades. That will not, however, prevent the demands from materialising sooner or later and it would have been better if they had been made earlier, in combination with enough support to catch up. It’s easier to learn in school
Gustaf Douglas, Chairman of the Board

LATOUR 2005 5
than go through years of unemployment only to realise at a late date what one should have dealt with long before.
It has become increasingly necessary to tell exciting stories about how people took their fate in their own hands and managed to develop companies that not only manufacture various machines but also create services that enrich the lives of those in need of care and education. We need examples we can relate to and that fill our fantasies with hope. In India I discovered a fantastic combination of strong belief in the future in young people who are building a knowledge-based society and where education is the way to get ahead while they share a clear vision that their main mission is to help poverty stricken people to a better life. It’s vital that we who can, work hard for the good society. An essential part of this is making sure one acquires a solid knowledge base before telling everyone else what to do. We need completely new types of education in professionalism as well as comportment and leadership in countries other than our own. This kind of education might very well suit those who are not at home in academic schooling but prefer practical training in doing business.
Through its interests in global companies Latour can contribute to the development of several of our wholly owned companies abroad. Whether or not they will eventually be listed depends on, among other things, if this would make a merger that is industrially motivated possible. This must be weighed against the fact that stock exchange listing is not particularly attractive now that the public world is not what it once was. There are good reasons for letting company management work in peace for a few years and build up the company without risking be called “loser of the day” or being chased by some unsatis-fied but energetic speculator or analyst. Most probably some combinations require listing – but there is a time for everything. In Securitas and Assa’s case it took around five years and turned out well in the end. One argument against listing is when Latour has control of the cash flow in a wholly owned subsidiary. Under such circumstances Latour can arrange cheaper and better financing than they can on their own.
Securitas announced in 2005 that the company would be divided into four self-sufficient listed entities. This is consequent with the belief that focusing on core operations requires specialisation. In addition, it opens up for new combinations. ASSA ABLOY is good example of this. That merger would never have been possible if Securitas had not hived off ASSA. In a few years several deals will probably occur due to the creation of these four individual com-
panies – business made possible because they are all spe-cialised in different areas but which very easily could have been impossible in the current structure. Concerning the ownership of these companies it is important to remember that majority ownership is a joint affair with SäkI and a collaboration with Melker Schörling. This might seem like taking the long way around but it guarantees a certain amount of reflection.
During 2005 ASSA ABLOY changed CEOs. The important thing to keep in mind here is that issues concerning management and chief executive officers are always on the agenda and are great challenges. In this particular case I would like to express my deep respect for the manner in which Bo Dankis handled this, by him, undesired situation. At the same time I am very happy to see how Johan Molin has dealt with the work in front of him. Transforming ASSA ABLOY from a company that has developed through large acquisitions to a business characterised by internationalisation and technological development is a sizeable and exciting task.
I have rarely felt such confidence about the future of Latour – even though there still are a number of matters that are not entirely easy to deal with. I have great faith in those accompanying me on the journey.
Gustaf DouglasChairman of the Board
L a t o u r ’s m a r k e t p o r t f o l i o a n d o w n e r s h i p

6 LATOUR 2005
Market value Listed price1) Acquisition Share of Equity Share Number SEK m SEK value SEK m votes % interest %
Assa Abloy A2) 6,746,425 843 125 786 Assa Abloy B 19,000,000 2,375 125 414 16 7 Elanders 1,300,000 153 118 267 10 16 Fagerhult3) 4,104,500 616 150 293 32 32 Munters 3,400,000 741 218 610 14 14 NEA 2,215,000 286 129 156 14 24 Securitas A2) 4,000,000 526 132 484 Securitas B 21,500,000 2,827 132 234 12 7 Sweco A 3) 237,568 45 190 7 Sweco B 3) 5,905,000 1,228 208 170 25 36
Total 9,640 3,4211) Latest market price paid.2) Class A shares in Assa Abloy and Securitas are unlisted. The shares listed in this table have been given the same listing price as corresponding class B shares.3) Shown as associated companies in the balance sheet.
Investment portfolio 2005-12-31
Increase Total shares Decrease Total shares
Munters 190,250 Assa Abloy B 1,000,000 Sweco A 5,900 Fagerhult 225,500 Sweco B 340,000 Securitas B 1,000,000
Net change in Latour’s investment portfolio 2005
6,000
6,500
7,000
7,500
8,000
8,500
9,000
SEKm
8,069
9,64010,000
9,500
05-01
-01Sw
eco
Secu
ritas
Assa
Abloy
Fage
rhult
Munter
sNEA
Eland
ers
05-12
-31
277
509
460
194 65 52 14
Change in value of the investment portfolio 2005 adjusted for acquisitions and divestitures
I n v e s t m e n t p o r t f o l i o

LATOUR 2005 7
Value development and risk
2005 2004 Return %1) Volatility % Return %1) Volatility %
Latour B 26 16 28 31Market portfolio2) 19 14 20 19 Securitas B 16 22 18 31 Assa Abloy B 10 21 33 25 OMXSPI 33 11 18 14
Source: The Stockholm Stock Exchange and Latour
1) Exclusive dividends.2) Volatility for the market portfolio is based on holdings per 31 December.
In order to assess the risk that a given investment has involved, the volatility of different classes of assets can be compared. High volatility indicates a greater variation in the underlying asset and thus greater risk. The stock exchange has on the whole a lower volatility than individual shares since it reflects a large number of shares.
Investment portfolio’s acquisition and market value (SEK m)
0%
5%
10%
15%
20%
25%
30%
35%
2001 2002 2003 2004 2005
Net worth discount
I n v e s t m e n t p o r t f o l i o
0
2,000
4,000
6,000
8,000
10,000
97 98 99 00 01 02 03
Acquisition valueMarket value
04 05
12,000

8 LATOUR 2005
Data per share (SEK) 2005 2004 2003 6) 2002 6) 2001 6)
Profit after tax 2) 16.20 22.86 7.65 8.54 19.49 Net worth 1) 3) 238 187 154 156 249 Listed price 31 December 204 162 127 141 185 Listed price as % of net worth 86% 87% 82% 90% 74% Equity 3) 199 171 7) 60 61 65 Dividends paid 7.00 4) 6.00 6.00 7.10 8.50 Direct yield 3.4% 3.7% 4.7% 5.0% 4.6% Investment portfolio direct yield 2.7% 5) 2.1% 2.8% 2.8% 2.0% P/E ratio 13 7 17 17 9 Total shares outstanding 43,700,000 43,700,000 43,820,000 44,570,000 46,045,000 Average number of shares outstanding 43,700,000 43,745,738 44,179,178 45,088,108 47,520,587 Repurchased shares 120,000 120,000 4,203,800 3,453,800 1,978,800 Average number of repurchased shares 120,000 4,278,062 3,844,622 2,716,300 3,003,750 1) The investment portfolio is recorded at market value and operating subsidiaries at a yield equivalent to P/E 10. 2) Calculated as an average number of shares outstanding. 3) Calculated on the number of shares outstanding on the balance date. 4) Proposed dividends.5) Calculated on proposed dividends6) Not recalculated according to IFRSs.7) Calculated according to IFRSs per 2005-01-01.
Definitions: See note 48.
Latour share
2005-12-31 2004-12-31 SEK m SEK/share1) SEK m SEK/share1)
Operating subsidiaries 2) 2,463 56 1,742 40 Assa Abloy 3,218 74 3,022 69 Elanders 153 3 135 3 Fagerhult 616 14 430 10 Munters 741 17 641 15 NEA 286 7 233 5 Securitas 3,353 77 3,008 69 Sweco 1,273 29 739 17 Other assets 3) 120 3 141 3 Liabilities –1,831 –42 –1,923 –44
Net worth 10,392 238 8,168 187
As a result of the adoption of IFRSs the net worth has increased by SEK 2/share on 2005-12-31 and 2004-12-31. 1) Calculated on the number of shares outstanding. 2) Operating subsidiaries are valued at a return equivalent to P/E 10 calculated on the operating profit of each year charged with standard tax
of 28%. The total equity in subsidiary groups amounted to SEK 1,844 m (1,688). 3) Excluding receivables from group companies.
Net worth of the Latour share
L a t o u r s h a re

LATOUR 2005 9
2005 was characterised by a good stock exchange climate with climbing share prices. The Latour class B share increased in value by 26% excluding dividends, which was slightly lower than the Stockholm Stock Exchange’s broad index, OMXSPI, which increased by 33%. The highest price of a Latour class B share was SEK 210 and the lowest was SEK 158.
Price trends in the Latour share
Trading in Latour B 2005 2004
Average number of traded shares/business day 8,499 6,163Average trading per business day, SEK ‘000 1,498 898Average value per closing, SEK ‘000 87 69Number of shares per closing 500 474Number of closings per business day 17 13
Source: Stockholm Stock Exchange
Share turnover
Trading in Latour shares increased in 2005 compared with the previous year. One explanation can be the liquidity promoting measure taken in the beginning of 2005 when an agreement was reached with Hagströmer & Qviberg for a liquidity guarantee.
100
150
200
250
01 02 03 04 05 06
Latour
Class B shareOMX Stockholm Exchange
70 (c) S
IX
0
50,000
100,000
150,000
200,000
250,000
300,000
350,000
Feb-0
4
Mar-04Apr-04
May-04
June-04
July-0
4
Aug-0
4
Sept-04
Oct-04
Nov-04
Dec-0
4
Jan-0
5
Feb-0
5
Mar-05Apr-05
May-05
June-05
July-0
5
Aug-0
5
Sept-05
Oct-05
Nov-05
Dec-0
5
Jan-0
6
SharesNumber of traded shares per month (Latour B)
L a t o u r s h a re

10 LATOUR 2005
Shareholder Number Number % share Number of % Class A shares Class B shares capital votes of votes
Gustaf Douglas, family and company 8,181,000 24,716,500 75.1 106,526,500 79.3 Bertil Svensson, family and company 450,000 601,070 2.4 5,101,070 3.8 Fredrik Palmstierna, family and company 600,720 219,730 1.9 6,226,930 4.6 Roburs Funds 571,650 1.3 571,650 0.4 Göran Sundblad, family and foundation 135,355 409,340 1.2 1 762,890 1.3 Riddarhusets Funds 460,500 1.1 460,500 0.3 Bank of New York 245,600 0.6 245,600 0.2 Länsförsäkringar Småbolagsfond 199,000 0.4 199,000 0.2 Didner & Gerge Aktiefond 190,000 0.4 190,000 0.1 Birger Wågberg with family 69,800 100,900 0.4 798,900 0.6 Other shareholders (6,536) 627,967 5,920,868 14.9 12,200,538 9.1 (of 6,569 shareholders in total) Investment AB Latour, share buyback 120,000 0.3 120,000 0.1
10,064,842 33,755,158 100.0 134,403,578 100.0
The company’s share capital is owned 75.1% by the principal shareholder with family and company. Other board members own 1.9%. Swedish institutional investors own 7.6% of share capital. Foreign ownership accounts for 2.0%.
Type of share Total shares % Number of votes %
Class A (10 votes) 10,064,842 23.0 100,648,420 74.9 Class B (1 vote) 33,755,158 77.0 33,755,158 25.1
Total number of shares (nominal SEK 2.50) 43,820,000 100.0 134,403,578 100.0
The ten largest owners 2005-12-31
Ownership structure 2005-12-31
Size of holding Number of shareholders Number of A shares Number of B shares % of capital % of votes
1 – 500 4,474 51,506 889,027 2.1 1.0 501 – 1,000 1,001 38,609 758,432 1.8 0.9 1,001 – 5,000 878 170,416 1,708,644 4.3 2.5 5,001 – 10,000 98 105,746 598,154 1.6 1.210,001 – 15,000 35 66,215 363,745 1.0 0.815,001 – 20,000 17 48,535 258,712 0.7 0.620,001 – 66 9,583,815 29,178,444 88.5 93.0
Total 6,569 10,064,842 33,755,158 100.0 100.0
O w n e r s h i p s t r u c t u re

LATOUR 2005 11
2005 2004 2003 4) 2002 4) 2001 4)
Parent company Dividends received 223 167 182 191 210 Dividends paid 306 1) 262 263 315 383 Equity/debt ratio 63% 61% 62% 53% 61% Adjusted equity/debt ratio 2) 84% 80% 82% 79% 89%
Investment portfolio Change in investment portfolio value 19% 20% 3% –34% 3% OMX Stockholm 33% 18% 30% –37% –17% Investment portfolio’s market value 9,640 8,261 6,645 6,913 10,709 Surplus value 6,219 4,852 4,337 4,302 8,145 Sales of listed shares 252 1,428 778 491 1,014 Capital gains 203 863 116 235 591 Purchase and subscription of listed shares 60 1,666 348 303 229
Industrial and trading operations Invoiced sales 4,852 4,434 4,169 4,287 4,250 (of which foreign) 2,271 2,115 1,964 2,035 1,996 Operating profit 342 242 173 186 233 Capital employed 1,458 1,405 1,730 1,794 1,812 Balance sheet total 2,505 2,351 2,583 2,676 2,726 Number of employees 2,973 3,117 2,971 3,001 3,052 Return on capital employed, % 24.2 15.8 10.1 10.6 18.5 Operating margins, % 7.0 5.5 4.1 4.3 5.5 Group Return on equity 9% 14% 5) 13% 14% 32% Return on total capital 10% 11% 5) 8% 9% 19% Equity/debt ratio 76% 52% 49% 46% 49% Adjusted equity/debt ratio 3) 78% 73% 72% 69% 78% Adjusted equity 3) 9,862 8,208 6,976 7,022 11,117 Net debt/equity ratio 3) 16% 23% 25% 30% 18%
1) Proposed dividend based on the number of shares outstanding as of 2006-03-13. 2) Including surplus value in investment portfolio.3) Including surplus value in associated companies.4) Not recalculated according to IFRSs.5) Recalculated according to IFRSs 2005-01-01.
Definitions: See note 48.
Five year overview (SEK m)
F i v e y e a r o v e r v i e w

Automotive Business Area
(SEK m) 2005 2004 2003 2002
Turnover 363 312 290 257(of which export) 86 61 59 55Operating profi t 18 18 10 2Capital employed 143 128 129 134
Investments 26 12 9 6Operating margins, % 4.8 5.8 3.4 0.8Return on capital employed, % 12.3 14.2 7.8 1.5Number of employees 284 278 258 254
COMPANY
Autotube AB
Proportion of the Group investments
Proportion of the Group operating profi ts
Proportion of the Group turnover
21%5%7%
2002 2003 2004 2005
- 400
- 300
- 200
- 100
0
20 -
15 -
10 -
5 -
0
SEK m SEK m
Operating profi tTurnover
12 LATOUR 2005
“An enormous expertise in systems and processes”Autotube’s business concept is to meet the needs of the automotive industry for moulded conduits and pipes with high technological competence in air and fl uid distribution.
We produce distribution systems of fl uids, gas and air in vehicles. These are mainly based on combinations of pipes and hoses. Examples of such applications include cooling systems, oil systems, pneumatic systems, fuel systems, steering servo systems, air conditioning systems and brake sys-tems. We have built up an enormous expertise in systems and processes in all of these areas.
Zero defect philosophy and state-of-the-art technologyAutotube has manufacturing plants in Varberg and Ulricehamn. The plant in Varberg works primarily with large production series for cars while Ulricehamn works with truck and bus manufacturers.
Our production is fl ow-oriented with strongly decentralised responsi-bility. We put great stock in our zero defect philosophy, continual improve-
ments and a resource effi cient, highly automated production.
The products and processes are naturally our core business but we can also be intensively involved in the design, development, verifi cation and testing of complete system solutions. We can furnish the latest in technology and systems, process technology and know-how.
New production area, development and rationalisationOur customers are manufacturers of cars, trucks and buses. We have gone from focusing solely on the Scandinavian market to successfully expanding our customer base to include the European market.
During 2005 we have been able to enter a completely new production area: AC pipes in cars. It has required considerable investments in new machines, automation and advanced test equipment that makes it possible for us to further develop our products. This is a major step towards produc-tion with a higher added value, i.e. increasingly complicated, compound products.
The production set up and organi-
Sven-Olov Libäck, Business Area Manager and MD of Autotube AB in front of a robot-ised production cell.

LATOUR 2005 13
sation in the factory in Ulricehamn has gone through major changes aimed at clarifying production and creating long-term efficiency.
Winning over very tough competi-tion the factory in Ulricehamn has been chosen as preferred supplier in a number of production areas.
We anticipate that the market for our products will continue to grow since legislators continue to heighten emission standards. More stringent requirements generally mean accessory equipment for vehicles, which means additional products from us.
Competition poses threats and opportunitiesThe competitive landscape has changed over the years. Previously almost all competitors were local but now we face global players as well. Low cost countries primarily in Eastern Europe are both a threat and an opportunity. While they threaten to exert downward pressure on our price structures they are also an opportunity in that we can outsource suitable production to them.
Proximity to customers is a recipe for successOur success is based on proximity to the customer. In Europe of today Lyon or Coventry are almost as close as Skövde or Trollhättan. We offer close collaboration in development work. We also offer short lead times, cost-effective design solutions and highly efficient, highly automated manufacturing.
Active efforts to reduce absence due to illnessAbsence due to illness is well within the bounds of the parameters we have established and the trend is positive. We work actively to further improve
the situation by stimulating physical activity for better health.
We are strong competitorsOur results continued to be good in 2005 with a drop in volumes at the end of the year. We could not completely compensate for rising raw material prices during the year. The start up of the AC project and restruc-turing in Ulricehamn led to temporary problems which effected profits.
In 2006 we believe we can maintain current volumes in heavy vehicles and perhaps see them grow slightly while car volumes can remain the same or decline somewhat. We have a good platform for continued development and winning new market shares despite the threat of growing competi-
tion. We will continue to broaden our product range and introduce new products and material during the year.
We will continue to refine our processes and develop products with cutting-edge technology aimed at developing and verifying our own design details. Thanks to our unique expertise and extensive rationalisa-tions we are well-prepared to compete against international competition.
In order to further broaden our knowledge, product range and mar-keting opportunities in the area of polymer materials we have reached an agreement to acquire HordaGruppen Vätterleden AB. Turnover for Autotube and HordaGruppen together in 2006 is estimated at SEK 600 m.
Flexible robotic piercing cell pipes.
Robotic bending of fuel lines as well as leak testing.
A u t o m o t i v e B u s i n e s s A re a

COMPANIES
IF Luftfi lter ABIF Luftfi lter AS, NorwayLuftfi lter AS, DenmarkIF Luftfi lter Oy AB, Finland
Proportion of the Group investments
Proportion of the Group operating profi ts
Proportion of the Group turnover
1%5%4%
20 -
15 -
10 -
5 -
0
SEK m SEK m
Operating profi tTurnover
200
150
100
50
0
-
-
-
-
Filters Business Area
14 LATOUR 2005
“For all the air in the world”IF Luftfi lter AB, the parent com-pany in the business area, develops, produces and markets air fi lters for all types of ventilation systems. The Nordic countries are our home market and we operate in Europe. Over the next few years we will intensify our activities on markets outside the Nordic countries.
A complete program of products and servicesWe know that our products function when no one notices them. Our products have individually regis-tered trademarks all with the prefi x “Air”; for example AirBag, AirPleat and AirComp. We also operate Filterskolan (“the Filter School”) and Filterbutiken (“the Filter Shop”).
E-commerce has been a major factor in the company’s advantageous market position.
Developments are positive in our already established distributors in Holland and Germany. Portugal and France are the two countries outside of the Nordic region where we have been most successful in establishing the company and fi nding distributors in 2005.
During 2005 we manufactured 10% more fi lters than in 2004.
In order to retain our market position and competitive edge, we continually work with product development and smart production solutions. Our expertise in metal fi lters opened up a whole new market segment in our fat fi lters manufactur-ing plant in Österbymo. We are cur-rently delivering our knitted metal net as OEM products to many different industries operating in, among others, automotives.
The major increase in volume in 2006 will be in tunnel ventilation where, after investing a couple of
years of work, we expect a high order intake.
A new divisional manager took over at the Österbymo unit in January 2006.
More and more products are P-markedIF Luftfi lter is certifi ed in accordance with ISO 9001 and 14001 and more and more of our products are “P-marked”. P-marking is a quality assur-ance system for products that are inspected and licensed by the Swedish National Testing and Research Institute. Our license was renewed after audits during the year. After 1 January 2006 we can offer P-marked bag fi lters in synthetic media in fi lter classes F6 and F7.
Pleat fi lters for a growing marketThere are three dominant, equally large companies on the Nordic market; IF Luftfi lter, Camfi l and Scandfi lter. Luftfi lter is largest in Sweden, second largest in Denmark and third in Finland and Norway, measured in fi lter volumes in each country.
(SEK m) 2005 2004 2003 2002
Turnover 201 192 145 135(of which export) 92 85 35 33Operating profi t 17 17 19 17Capital employed 52 50 23 33
Investments 1 6 3 2Operating margins, % 8.5 9.2 13.1 12.6Return on capital employed, % 32.9 34.8 82.6 51.5Number of employees 147 154 123 123
2002 2003 2004 2005
Jan Lund, Business Area Manager and MD in IF Luftfi lter AB.

LATOUR 2005 15
The Norwegian Laerdals Tunnel is the first in the world to clean the air leaving the tunnel from 85 percent of dust and nitrous gases. Ventilation is placed in parallel service tunnels where the entire section surface is covered by filters. Automatic flushing keeps the filters clean and effective.
Air treatment is a growing market and we are currently focusing on pleat filters in order to achieve the same market share level as the one we have in bag filters. Our sub-contracting of HEPA filter in Chicago should have furnished us with stock back in August 2005 but didn’t start up until late autumn, which is why we did not have the products in stock until January 2006. Supplies of the filters we manufacture ourselves for the Swedish market grew in 2005 thanks to a well-oiled organisation.
Employees are our greatest resourceWe market IF Luftfilter as a knowl-edge company in air treatment. Our closest competitor is Camfil followed by Scandfilter. Our products and our employees are our greatest resources.
Luftfilter has a flat organisational structure and decisions are made where they belong. Our marketing organisation is by far the strongest in the industry.
Healthy company with a low personnel turnoverAbsence due to illness is well within the bounds of our targets and person-nel turnover is very low.
Profitability according to plan in 2005Profitability in 2005 was according to budget, despite the fact that the expected increase in volume was not as large as anticipated.
As planned, Finland had good
results in 2005 and will most likely be even more profitable in 2006 when we should see the effects of our market-ing drive on industrials and major customers.
Norway has continued to surpass budget.
Denmark made the decision in 2005 to open a warehouse and office in Jutland in February 2006 and bolster the area with another sales-man. During the year a new MD was appointed in Denmark. His back-ground is in the trade and his special area of expertise is sterile filtering. This is the area in Denmark where we plan to grow in 2006.
F i l t e r s B u s i n e s s A re a
COMPANIES
Hultafors ABWIBE Stegar ABTA Ljungberg Patent ABHultafors Norway ASHultafors Denmark ASHultafors Oy, FinlandHultafors Präsident GmbH, GermanyHultafors UMI Srl, Romania
Proportion of the Group investments
Proportion of the Group operating profi ts
Proportion of the Group turnover
14%14%9%
50 -
40 -
30 -
20 -
10 -
0
SEK m SEK m
Operating profi tTurnover
- 500
400
300
200
100
0
Hand Tools Business Area
16 LATOUR 2005
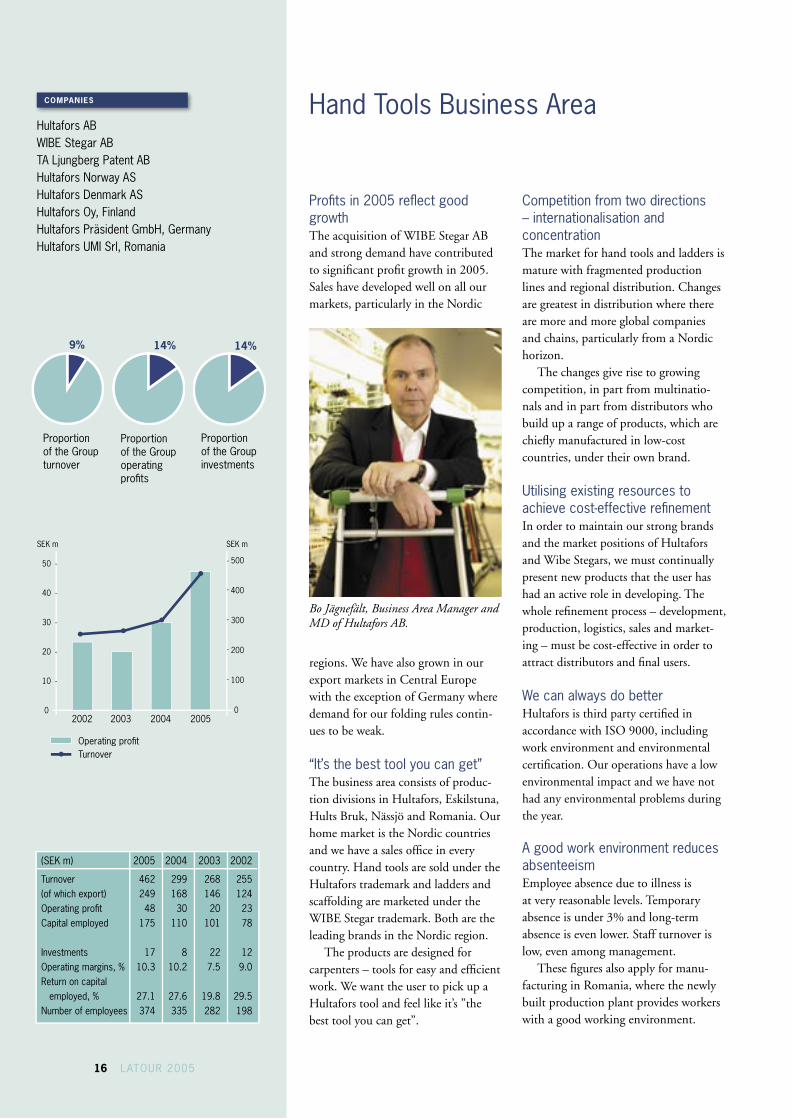
Profi ts in 2005 refl ect good growth The acquisition of WIBE Stegar AB and strong demand have contributed to signifi cant profi t growth in 2005. Sales have developed well on all our markets, particularly in the Nordic
Competition from two directions – internationalisation and concentrationThe market for hand tools and ladders is mature with fragmented production lines and regional distribution. Changes are greatest in distribution where there are more and more global companies and chains, particularly from a Nordic horizon.
The changes give rise to growing competition, in part from multinatio -nals and in part from distributors who build up a range of products, which are chiefl y manufactured in low-cost countries, under their own brand.
Utilising existing resources to achieve cost-effective refi nementIn order to maintain our strong brands and the market positions of Hultafors and Wibe Stegars, we must continually present new products that the user has had an active role in developing. The whole refi nement process – development, production, logistics, sales and market-ing – must be cost-effective in order to attract distributors and fi nal users.
We can always do better Hultafors is third party certifi ed in accordance with ISO 9000, including work environment and environmental certifi cation. Our operations have a low environmental impact and we have not had any environmental problems during the year.
A good work environment reduces absenteeismEmployee absence due to illness is at very reasonable levels. Temporary absence is under 3% and long-term absence is even lower. Staff turnover is low, even among management.
These fi gures also apply for manu-facturing in Romania, where the newly built production plant provides workers with a good working environment.
Bo Jägnefält, Business Area Manager and MD of Hultafors AB.
regions. We have also grown in our export markets in Central Europe with the exception of Germany where demand for our folding rules contin-ues to be weak.
“It’s the best tool you can get”The business area consists of produc-tion divisions in Hultafors, Eskilstuna, Hults Bruk, Nässjö and Romania. Our home market is the Nordic countries and we have a sales offi ce in every country. Hand tools are sold under the Hultafors trademark and ladders and scaffolding are marketed under the WIBE Stegar trademark. Both are the leading brands in the Nordic region.
The products are designed for carpenters – tools for easy and effi cient work. We want the user to pick up a Hultafors tool and feel like it’s ”the best tool you can get”.
(SEK m) 2005 2004 2003 2002
Turnover 462 299 268 255(of which export) 249 168 146 124Operating profi t 48 30 20 23Capital employed 175 110 101 78
Investments 17 8 22 12Operating margins, % 10.3 10.2 7.5 9.0Return on capital employed, % 27.1 27.6 19.8 29.5Number of employees 374 335 282 198
2002 2003 2004 2005
-
-
-
-

LATOUR 2005 17
Strategic investments and new productsWIBE Stegar – rapid and successful integrationThe integration of WIBE Stegar dur-ing the year has surpassed expectations thanks to employees’ enthusiasm and positive attitude towards change. WIBE Stegar and Hultafors’ hand tools share distribution and target groups and anticipated synergies were realised quickly.
TA Ljungberg Patent AB – TalmeternThe company, which was acquired in June, is well-known for its unique product Talmetern. The product has a solid customer base in Sweden because of its excellent function. We expect sales to grow with help from Hultafors’ sales organisation and further develop-ments in the product.
Tikaskolmio Oy – starting point for expansion eastwardIn September we acquired WIBE Stegar’s importer Tikaskolmio Oy in Finland. We secured ladder sales through the acquisition and provided Hultafors with a sales organisation throughout the Nordic region. It also furnished us with a warehouse in Finland, which is important for our continued expansion into the Baltic countries and western Russia. The name of the company was changed to Hultafors Oy as of 1 January 2006.
Germany – our largest market volume-wise for folding rulesOur German sales company has been
struggling with the sluggish German economy and aggressive price competi-tion but the market brightened during the final quarter of 2005. Our produc-tion resources in Sweden and Romania are an excellent platform for 2006.
Romania takes over highly refined productsThe expansion of our plant in Romania was finished in the autumn of 2005 and the previously announced production move ought to be com-pleted by the first quarter 2006.
Forging production moves to China – better international competitive capacityIn November 2005 we signed a joint venture agreement with a world leader in hammer production, Lucky Industrial Brand Co. Ltd, Taiwan. The agreement entails moving the operations in Eskilstuna to Kunshan in China during the latter half of 2006. The newly created company, Hultafors Lucky Kunshan Industrial Co. Ltd, is owned to 49% by Hultafors.
Our know-how in product develop-ment, quality management and mar-keting together with Lucky’s expertise in engineering and forging production will enhance our competitive capacity on our home market and generate international growth.
New craftsmen’s knives – seven new modelsWe launched a new series of crafts-men’s knives in December. Together with professional craftsmen Hultafors has developed the classical craftsman knife into seven customised models for different kinds of jobs.
Continued expansion in 2006Hultafors plans for continued expan-sion through a broader product range in the Nordic market, focusing on craftsmen in construction. New prod-ucts and the anticipated growth in the construction sector will contribute to increased sales and, despite structural costs for moving production, contin-ued good operating profit.Chisel knife. Hand tools you can rely on.
H a n d To o l s B u s i n e s s A re a

Hydraulics Business AreaCOMPANIES
Specma Hydraulic ABSpecma Hydraulic Nord ABEurobend ABSpecma Component ABWiroArgonic ABHymat Oy, Finland
14%9%16%
40 -
30 -
20 -
10 -
0
SEK m SEK m
Operating profi tTurnover
- 800
- 600
- 400
- 200
0
Proportion of the Group investments
Proportion of the Group operating profi ts
Proportion of the Group turnover
18 LATOUR 2005
We consider the Nordic and Baltic countries our home market, but today we are primarily active in Sweden and Finland.
Four specialised business unitsWe develop, manufacture and market specialised conduction systems for hydraulics to Nordic industry. We also offer a broad range of hydraulic, pneu-matic and conduction components for industrial applications and the after sales service market.
Our vision is to become the leading company in our industry in the Nordic and Baltic countries.
In order to realise this vision, we focus on four separate business units: Component, OEM, Commercial Vehicle and Industry & Marine.
Successful promotion of a dynamic retail chainIn 2005 we transferred Specma Hydraulics after sales service organisa-tion to Näsström System and changed its name to Specma Component AB. This has created a dynamic joint business unit for the after sales service market.
Our retail chain “SlangSnabben®” with its new profi le concept has devel-oped well during the year. Our own SlangSnabben® has moved into new, fresh premises in Upplands Väsby and our operations in Örnsköldsvik have moved into together. Ljungby opera-tions will become SlangSnabben® in 2006 when we will also launch the con-cept in Finland. Our goal is to create at least 10 SlangSnabben® stores in Finland in 2006.
Ten new SlangSnabben® stores have been opened and sales through
the chain increased by 33%. There are now a total of 67 SlangSnabben® stores. Our largest competitor is Hydroscand with approximately 20% of the after sales service market.
Besides responsibility for sales on the Finnish market, Hymat Oy handles sales to Russia and the Baltic countries.
Closer cooperation for highly advanced productsOEM works with customised system solutions for conduction components. A large part of operations are carried out onsite at customers’ premises in the form of training, application reviews and fi eld testing. Specma Hydraulic AB and Eurobend AB, which constitute the core of the business unit, collabo-rate closely to fi nd optimal solutions in the choice of hose/pipe components. Specma Hydraulic has intensifi ed cooperation with Gates Hydraulics in the technological development of
(SEK m) 2005 2004 2003 2002
Turnover 798 645 500 467(of which export) 253 247 204 186Operating profi t 32 31 28 22Capital employed 278 273 191 205
Investments 18 15 8 7Operating margins, % 4.1 4.8 5.6 4.7Return on capital employed, % 11.6 11.2 14.7 10.7Number of employees 529 509 375 349
2002 2003 2004 2005
Mats Lundgren, Business Area Manager and MD at Specma Hydraulic AB.
The new SlangSnabben® logotype.

LATOUR 2005 19
highly advanced products. Eurobend has gone through a restructuring and is now a lean-production unit. New orbital welding equipment has been installed and the production area has been extended to accommodate production of new orders to be delivered in 2006.
Customers such as VCE and Komatsu have chosen our products for some of their most technically advanced applications.
New products for heavy vehiclesCommercial Vehicles sells a broad assort-ment of pipes, hoses and conduction components to companies that include Volvo Truck, Renault Truck and Scania. WiroArgonic has contributed to the range with their special and high tem-perature hoses.
During the year Specma Hydraulics developed a new steering servo concept with pipes manufactured at Eurobend. The steering servo concept that was introduced on Volvo’s new heavy trucks in the fourth quarter is now being mounted on Volvo Brasil’s medium-heavy trucks since the beginning of 2006.
The main competitors are interna-tional groups such as Contitech, Eaton and Parker.
Hydraulic assembly for container cranesIndustry & Marine is concentrated to Specma Hydraulic Nord and WiroArgonic which share company management. The companies in this business unit solve the problems of transporting fluids and gases that have strict demands on durability, safety and hygiene. WiroArgonic is the market leader in Sweden and operates in the Nordic and Baltic countries as well. Growth has been good in the company in 2005. Specma Hydraulic Nord has taken over responsibility for manu-facturing the hydraulic aggregates on
McGregor’s hydraulic aggregate is now manufactured by Specma Hydraulics in Örnsköldsvik.
McGregors cranes, which has generated a substantial increase in turnover. Pipes and hoses for combat vehicles will contribute to continued good develop-ments in the foreseeable future.
Products in this business unit con-sist of metal hoses, PTFE hoses, high pressure hoses and expansion joints.
The companies provide licensed stainless steel welding to EN standards. Our main competitor is Witzenmann.
Absence due to illness continues to declineBecause our companies depend on expe-rienced and able staff, health and per-sonal development are highly prioritised. Total absence due to illness has dropped to less than 2%. We work actively with preventative measures such as keep-fit activities and ergonomic studies.
Employee turnover is low and it is easy to recruit new personnel.
Good profitability and bright forecastProfitability was comparable with that of previous year. Specma Component was very profitable due to synergies and successful promotions. Profitability in Eurobend was weak due to heavy restructuring costs that are expected to generate positive results during the first half of 2006.
Operating profits were pressed by further rises in raw materials prices and a strong Euro. Although we have raised our sales prices we have not been able to completely compensate for higher costs. A number of new large scale projects will be implemented in the beginning of 2006 (previously planned for 2005) to increase turnover and improve margins.
Volvo’s new Brazilian VM model contains Specma Hydraulic components in the steering servo and cab tip systems.
H y d r a u l i c s B u s i n e s s A re a

Air Treatment Business Area
Proportion of the Group investments
Proportion of the Group operating profi ts
Proportion of the Group turnover
COMPANIES
Swegon ABSwegon AS, NorwaySwegon AS, DenmarkSwegon Oy, FinlandSwegon GmbH, GermanySwegon GmbH, AustriaSwegon SA, SwitzerlandSwegon Sarl, FranceSwegon Ltd, EnglandSwegon SP Zo.o, Poland
26%33%25%
1,200
1,000
800
600
400
200
0
120 -
100 -
80 -
60 -
40 -
20 -
0
SEK m SEK m
Operating profi tTurnover
-
-
-
-
-
-
20 LATOUR 2005
During 2005 the business area com-prised the manufacturing company Swegon AB which was created on 1 January 2005 through a merger of PM-Luft AB and Stifab Farex AB and their sales companies. Swegon supplies air treatment aggregates and compo-nents that in combination create good indoor climates in residential and busi-ness properties.
Products on the cutting edge of developmentSwegon works with products on the cutting edge of development. The Nordic countries have the highest user specifi cations (silent, draught-free ventilation), which gives us the edge on competitors from the Continent. Regulations, particularly when it comes to energy consumption, are also stricter in the Nordic countries and will gradu-ally increase throughout Europe, which will stimulate growth on the market.
As time passes, the market will grow as the need for renovation escalates. Increasingly demanding user requirements and a focus on energy consumption in Europe will also lead to replacement of existing systems.
Our products are installed in most buildings, such as offi ces, schools, healthcare facilities, shops and industrial buildings. Our marketing promotions are aimed at users, property owners, construction companies, consultants and ventilation installation fi rms.
Improved cost effectiveness with industrial focusMany say the industry is mature. We believe there is still a great deal that can be done to gain market shares and we are going to be in the vanguard. As much as possible will be prefabricated and standardised to simplify our customers’ work. An example of this is our complete system solutions, Swegon Solutions. These are well thought-out system solutions that contain compo-nents that function optimally with each other to create a good indoor climate. Being in the forefront of developments means stepping off the beaten path and trying something new.
Product development close to productionOur production plants are located in
(SEK m) 2005 2004 2003 2002
Turnover 1,244 1,068 1,078 1,116(of which export) 740 619 618 648Operating profi t 114 74 75 83Capital employed 289 275 250 292
Investments 33 29 17 16Operating margins, % 9.1 7.0 7.0 7.4Return on capital employed, % 39.3 27.1 30.0 28.4Number of employees 786 747 788 820
2002 2003 2004 2005

LATOUR 2005 21
Kvänum, Tomelilla and Arvika. All three units include product develop-ment and laboratories. It is important for us to keep product development close to production.
We are one of the dominant players in the industry. The major competitors in Sweden include Fläkt Woods and Systemair. In Europe GEA and Trox are among the most influential.
Good first year for SwegonSwegon’s first year profit was very good. One of the most positive deve-lopments of the year was our growth in Europe where turnover increased by 30% even though the acquisition of Koolair did not go through.
Promoting Swegon in EuropeWe plan to make Swegon well known in many markets which is why we have initiated a plan to more uniformly pro-mote the brand throughout Europe.
2006 looks like a good yearThe prospects for 2006 are good. We expect demand to continue to be strong in both the Nordic region and the rest of Europe. We count on capturing further market shares on all of these markets, particularly those outside of the Nordic region.
Changes in construction processesIt is vital that we are prepared for the changes in the construction process we have begun to note. The major construction companies are testing new ways to procure components and systems in order to lower costs and guarantee quality. Swegon Solutions fit in perfectly with this development.
Another challenge on the horizon is competition from producers in low cost countries. We are well-prepared to face the competition, today as well as tomorrow.
Mats Holmqvist, Business Area Manager and MD in Swegon AB.
Swegon offers complete solution systems that consist of air treatment aggregates with built in control software as well as room solutions that help create the best indoor climate.
A i r Tre a t m e n t B u s i n e s s A re a
Machinery Trading Business AreaCOMPANIES
AB Sigfrid StenbergCarstens ABMekana ABWoodtechnique Verktygssystem ABMaskinCentrum i Örnsköldsvik ABFlextek AS, DenmarkGranaths Hårdmetal AS, DenmarkMTT Machine Trading Team Oy Ltd, Finland
9%6%15%
1,000
800
600
400
200
0
20 -
15 -
10 -
5 -
0
SEK m SEK m
Operating profi tTurnover
-
-
-
-
-
Proportion of the Group investments
Proportion of the Group operating profi ts
Proportion of the Group turnover
22 LATOUR 2005
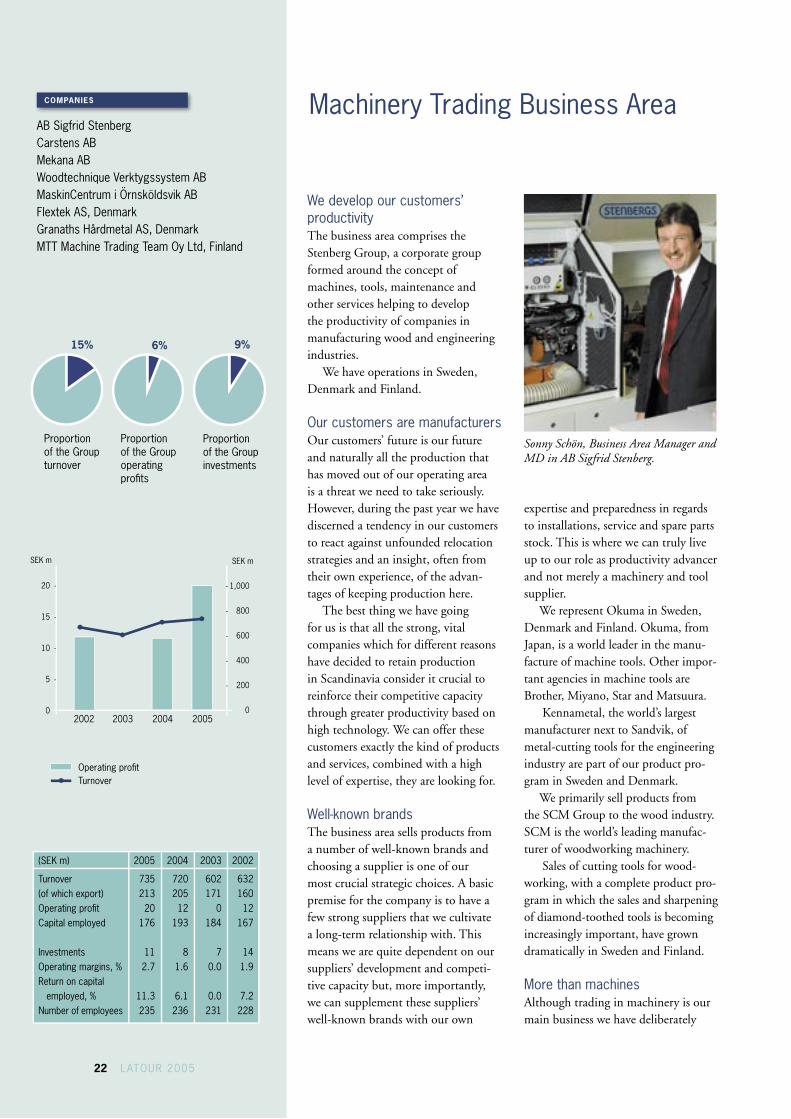
We develop our customers’ productivityThe business area comprises the Stenberg Group, a corporate group formed around the concept of machines, tools, maintenance and other services helping to develop the productivity of companies in manufacturing wood and engineering industries.
We have operations in Sweden, Denmark and Finland.
Our customers are manufacturersOur customers’ future is our future and naturally all the production that has moved out of our operating area is a threat we need to take seriously. However, during the past year we have discerned a tendency in our customers to react against unfounded relocation strategies and an insight, often from their own experience, of the advan-tages of keeping production here.
The best thing we have going for us is that all the strong, vital companies which for different reasons have decided to retain production in Scandinavia consider it crucial to reinforce their competitive capacity through greater productivity based on high technology. We can offer these customers exactly the kind of products and services, combined with a high level of expertise, they are looking for.
Well-known brands The business area sells products from a number of well-known brands and choosing a supplier is one of our most crucial strategic choices. A basic premise for the company is to have a few strong suppliers that we cultivate a long-term relationship with. This means we are quite dependent on our suppliers’ development and competi-tive capacity but, more importantly, we can supplement these suppliers’ well-known brands with our own
expertise and preparedness in regards to installations, service and spare parts stock. This is where we can truly live up to our role as productivity advancer and not merely a machinery and tool supplier.
We represent Okuma in Sweden, Denmark and Finland. Okuma, from Japan, is a world leader in the manu-facture of machine tools. Other impor-tant agencies in machine tools are Brother, Miyano, Star and Matsuura.
Kennametal, the world’s largest manufacturer next to Sandvik, of metal-cutting tools for the engineering industry are part of our product pro-gram in Sweden and Denmark.
We primarily sell products from the SCM Group to the wood industry. SCM is the world’s leading manufac-turer of woodworking machinery.
Sales of cutting tools for wood-working, with a complete product pro-gram in which the sales and sharpening of diamond-toothed tools is becoming increasingly important, have grown dramatically in Sweden and Finland.
More than machinesAlthough trading in machinery is our main business we have deliberately
(SEK m) 2005 2004 2003 2002
Turnover 735 720 602 632(of which export) 213 205 171 160Operating profi t 20 12 0 12Capital employed 176 193 184 167
Investments 11 8 7 14Operating margins, % 2.7 1.6 0.0 1.9Return on capital employed, % 11.3 6.1 0.0 7.2Number of employees 235 236 231 228
2002 2003 2004 2005
Sonny Schön, Business Area Manager and MD in AB Sigfrid Stenberg.

LATOUR 2005 23
worked on increasing products and ser-vices affiliated with the actual machine.
Tool sales have grown in both wood and metal sectors, a development we will further promote through organisa-tional reinforcements and more invest-ments in diamond tool sharpening in Woodtechnique Verktygssystem AB.
We continually develop our service and maintenance sector. Mekana AB has substantially increased its service organisation in 2005 and we will continue the expansion of MaskinCentrum in Örnsköldsvik AB, which offers the market a range of services and maintenance. The Swedish financial daily, Dagens Industri, named MaskinCentrum as one of the fastest growing companies in 2005.
ISO-certification a result of process review In order to achieve our goal of continual improvement we need to blend solid know-how and continuity with new impulses. We have a knowledgeable and engaged personnel and employee turnover and absence due to illness is low. At the same time we constantly develop our organisations in order to more efficiently meet our customers’
expectations. For more reliable and efficient processes that make us more reliable suppliers, AB Sigfrid Stenberg carried out an extensive process review and was ISO certified last autumn.
Advanced positions 2005 was another step in the right direction concerning profits. Certain expenses for restructuring have charged profits for the year and the structural changes we have made have been successful but the effects on costs will fully materialise in 2006.
We have not yet reached the point where we are completely satisfied with our results. We have implemented a number of cost-saving and efficiency measures that will not have full effect until after 2006.
Order uptake was higher than sales and the order stock at the beginning of 2006 was 20% higher than at the same time the previous year.
This means we can expect even higher turnover and better profits for the business area in 2006 than in 2005.
This is a typical interior in a modern Swedish engineering company – clean, efficient and unmanned. Hellmer Industrier in Norrköping has 16 machines from Japanese Brother delivered by Mekana for the manufacture of details to the telecom industry.
M a c h i n e r y Tr a d i n g B u s i n e s s A re a
Volvo Aero is a major maker of components for airplane motors in, among others, Airbus. Stenbergs/Kennametal has developed complete tool solutions for Volvo Aero’s production.

Textiles Business AreaCOMPANIES
Almedahls AB Almedahls Alingsås ABFOV Fabrics ABOy Almedahl AB, Finland
2%9%13%
1,000
800
600
400
200
0
40 -
30 -
20 -
10 -
0
SEK m SEK m
Operating profi tTurnover
-
-
-
-
-
Proportion of the Group investments
Proportion of the Group operating profi ts
Proportion of the Group turnover
24 LATOUR 2005
Business area During 2005 the business area has gone through structural changes and as a result divested certain operations.
After these structural changes the business area comprises Almedahls AB, Almedahls Alingsås AB and FOV Fabrics AB. Operations are highly uniform and can be divided into the following groups:• Textiles for government contracts
and home design (Almedahls)• Hotel and restaurant textiles
(Almedahls Alingsås)• Work clothes (Almedahls Alingsås)• High-tech textiles for use in indus-
try and ready-made clothing (FOV Fabrics)
High-tech products, advanced design and distribution make for signifi cant market sharesWith solid know-how in textiles technology (production and product development), design and logistics, we supply our customers with a good range of products.
Our strategy entails infusion in our product range of maximum added
value – very competitive properties and designs – and effective marketing and distribution which together gener-ates signifi cant market shares in each product area.
Improved profi ts in 2005Profi t in 2005 improved dramatically in comparison with 2004.
Almedahls – Public Spaces and Home DécorDesign is the focal point and essence of this area. Products for Public Spaces are marketed via architects and interior designers. We are the market leader in curtains. During 2005, we launched a collection of rugs that match our other collections which include a range of upholsteries and curtains. The market has turned around and we have had a successful 2005.
Design is also crucial to our com-petitive capacity in Home Décor. The government and parliament of Sweden designated 2005 as the Year of Design. Goal-oriented work with design has won broad media attention and given us a competitive edge. 2005 has been a good year with satisfactory profi tability.
We also market products under
(SEK m) 2005 2004 2003 2002
Turnover 642 854 919 1,039(of which export) 483 618 656 747Operating profi t 32 23 14 39Capital employed 403 459 476 514
Investments 2 8 25 77Operating margins, % 5.0 2.6 1.5 3.8Return on capital employed, % 8.0 4.9 2.9 7.6Number of employees 332 595 650 724
2002 2003 2004 2005
Göran Holm, Business Area Manager and MD in Almedahls AB.
Clothes for runners designed by Newline with functional material from FOV Fabrics.
LATOUR 2005 25
licence, where we are licensed to use, for instance, famous animated figures in our designs. Thus far, we have sold bedclothes and towels with Disney figures, Snoopy and Bolibompa.
Craft range in AlmedahlsThis business unit that consists of sew-ing accessories, embroidery, yarns for hand knitting and staple fabrics and quilting fabrics was sold to Coats Ltd in England on 1 April 2005. Operations in Holma-Helsinglands AB, manu-facturing of weaving yarn, was sold in December to the MD and was taken into possession on 1 January 2006.
Industrial property in DalsjöforsOur property in Dalsjöfors where Almedahls AB is one of several tenants was sold per 31 December to a local property manager.
Almedahls AlingsåsAlmedahls Alingsås has also had a suc-cessful year. A minor business acquisi-tion has further boosted profits.
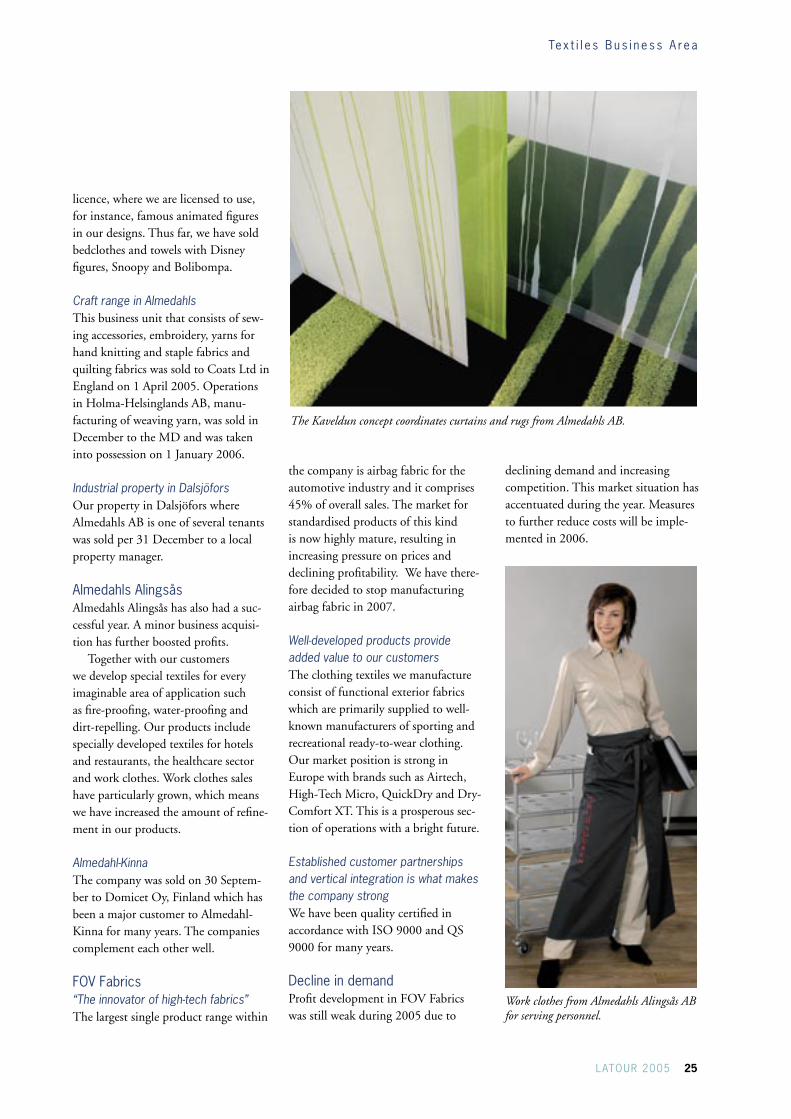
Together with our customers we develop special textiles for every imaginable area of application such as fire-proofing, water-proofing and dirt-repelling. Our products include specially developed textiles for hotels and restaurants, the healthcare sector and work clothes. Work clothes sales have particularly grown, which means we have increased the amount of refine-ment in our products.
Almedahl-Kinna The company was sold on 30 Septem-ber to Domicet Oy, Finland which has been a major customer to Almedahl-Kinna for many years. The companies complement each other well.
FOV Fabrics “The innovator of high-tech fabrics”The largest single product range within
the company is airbag fabric for the automotive industry and it comprises 45% of overall sales. The market for standardised products of this kind is now highly mature, resulting in increasing pressure on prices and declining profitability. We have there-fore decided to stop manufacturing airbag fabric in 2007.
Well-developed products provide added value to our customersThe clothing textiles we manufacture consist of functional exterior fabrics which are primarily supplied to well-known manufacturers of sporting and recreational ready-to-wear clothing. Our market position is strong in Europe with brands such as Airtech, High-Tech Micro, QuickDry and Dry-Comfort XT. This is a prosperous sec-tion of operations with a bright future.
Established customer partnerships and vertical integration is what makes the company strong We have been quality certified in accordance with ISO 9000 and QS 9000 for many years.
Decline in demandProfit development in FOV Fabrics was still weak during 2005 due to
declining demand and increasing competition. This market situation has accentuated during the year. Measures to further reduce costs will be imple-mented in 2006.
The Kaveldun concept coordinates curtains and rugs from Almedahls AB.
Work clothes from Almedahls Alingsås AB for serving personnel.
Te x t i l e s B u s i n e s s A re a

Engineering Technology Business Area
COMPANIES
Specma ABElkapsling ABNord-Lock ABNord-Lock Finland Oy, FinlandNord-Lock Inc., USANord-Lock (UK) Ltd, EnglandNord-Lock France, FranceSpecma AS, Norway
14%18%9%
500
400
300
200
100
0
60 -
50 -
40 -
30 -
20 -
10 -
0
SEK m SEK m
Operating profi tTurnover
-
-
-
-
-
Proportion of the Group investments
Proportion of the Group operating profi ts
Proportion of the Group turnover
26 LATOUR 2005
Renewal and developmentThe business area consists of Nord-Lock AB, Elkapsling AB and six busi-ness units within Specma AB. Through an ongoing dialogue with our custom-ers, we continually renew and develop our products and services in order to continue to grow profi tably.
Speed and fl exibility, structure and strengthOur customers operate in the manu-facturing industry and all our products contain advanced technology and substantial added value. Each of our business units has its own unique busi-ness model, skills and know-how and competitive advantages.
We can combine the speed, fl exibil-ity and rapid action of small companies with the structure and strength of a larger one by sharing operations sup-port resources such as fi nance, IT and personnel administration.
Commitment and personal involvement make for healthy employeesThe fact that our employees are com-mitted and personally involved in operations together with the support we have from our owners is not just a good platform for successful business. It also helps keep our absence due to illness fi gures well below the national average. We work actively with physi-cal fi tness among our employees and to improve both the physical and social work environment.
Good profi tability in 2005All our business units have improved their volumes and profi ts in 2005. Invoicing increased by 17%, three-fourths of which was organic growth.
Operating profi t increased by 65% and the operating margin was 14%.
During the year we made two acquisitions:
In May we acquired the Finnish distributor of Nord-Lock. The Nord-Lock washer, which we manufacture ourselves, is sold in 28 countries. Our own sales companies account for half of sales volumes. We plan to successively increase that proportion where possible and at the proper time, normally when companies pass from one generation to the next, acquire more independent distributors.
Bergman-AXAB was acquired in October from the Axel Johnsson Group. This is a company that like our own Specma Seals, is focused on the process industry’s after sales service need of gasket materials, sealings and service. The operations were incorpo-rated into Specma Seals which thereby cemented its leading position on the Swedish market. Measures taken to cre-ate a new business structure have gener-ated large one-off costs for investments, primarily in IT, which charged profi ts for the year. In 2006 the acquisition will contribute substantially to profi ts.
In summary, all our businesses are
(SEK m) 2005 2004 2003 2002
Turnover 436 372 434 454(of which export) 157 116 94 108Operating profi t 61 37 25 7Capital employed 132 109 117 148
Investments 17 6 8 6Operating margins, % 14.0 10.0 5.8 1.5Return on capital employed, % 46.2 34.3 21.4 4.7Number of employees 280 256 257 299
2002 2003 2004 2005
Per Englund, Business Area Manager and MD at Specma AB.

LATOUR 2005 27
in a good position and this makes us confident that we will do well in 2006.
Independent companiesNord-Lock offers a unique screw lock system which provides secure locking for screw joint reinforcements exposed to vibrations and dynamic loads.
Volume growth is good and exports are over 80% of sales. To meet the increasing demand we have invested in the production unit in Mattmar. Production, which is for the most part based on technology we have devel-oped, has received a sizable capacity extension.
Elkapsling manufactures cabinets and enclosure systems for electrical equipment and data and telecommuni-cations. Good demand and the ongoing restructuring contributed to a substan-tial improvement in profits. However, profitability is still not satisfactory in the long-term and so restructuring will continue.
Specma ABSpecma Drives designs and assembles electromechanical drive systems with a focus on medical-technical applica-tions. Exports are more than 80% of sales. Specma Drives often works as an
integral part of its customers’ produc-tion processes.
Specma Seals supplies the Swedish processing industry with gaskets and seals. We share our considerable exper-tise with customers through preventive consultancy and can deliver quality products twenty-four hours a day from our own production plants, thus mini-mising disruptions in our customers’ production units.
Specma Flowtech provides the world’s most complete program of mechanical seals and bearing covers. This is a new area with dynamic growth.
Specma Automation offers robot-based production solutions to customers in the manufacturing industry – every-thing from small robot installations to complete production systems. Thus
far, we have completed more than 500 robot-based installations in Scandinavia and Germany.
Specma Machines is the Swedish rep-resentative for several of Europe’s leading manufacturers of advanced production equipment in processing, handling and measurement. Our customers are indus-tries with high volume series production.
Demand for products in Automation and Machines has been very good in 2005. Volumes increased and we start 2006 with large order stocks.
Specma Tools offers a broad range of highly advanced electrical and pneu-matic professional tools for industrials and construction companies. Strong demand for tools from the construction sector in particular has lead to a high rise in sales during 2005.
John Deere is a world leading manufacturer of forestry machines. The machines must be extremely durable. Critical nut joints are secured by Nord-Lock’s wedge locks.
Robotised machine service as a part of a joint project in which Specma Automation, Specma Machines and Stenbergs have delivered a production line for the manufacture of automotive details.
Specma Seals are market leaders in different kinds of gaskets, seals and bellows delivered here to Stora Enso’s plant in Skutskär.
E n g i n e e r i n g Te c h n o l o g y B u s i n e s s A re a

28 LATOUR 2005
ASSA ABLOY AB
Good potential through continuous improvementASSA ABLOY is a world leader in the production and sup-ply of locks and accessory products designed for safety, secu-rity and user friendliness. With over 150 companies in more than 40 countries and a global market share of about 10%, the Group is the strongest global player in the lock industry.
ASSA ABLOY is represented all over the world, in mature and developing markets, with a leading position in most of Europe, North America and Australia. The Group is one of the leaders in the rapidly growing field of electromechanical locks in areas such as identification, automatic doors and hotel security.
Since its formation in 1994, the ASSA ABLOY Group has grown from a regional company with 4,700 employees to an international Group with 29,000 employees and a turnover of SEK 27.8 bn.
As the world’s leading lock Group, ASSA ABLOY offers a broader range of products than any other company on the market.
Development during 20052005 was another successful year for ASSA ABLOY. Sales were relatively slow in the beginning of the year but acceler-
ated as the year progressed to end in a strong fourth quarter. Turnover amounted to SEK 27,802 m, EBIT increased by 10.7% to SEK 4,078 m and organic growth was 5%. Developments are based on the good demand in the impor-tant USA market, which affects both Americas and Global Technologies. ASSA ABLOY has generally strengthened its position by focusing on customer usefulness in traditional operations and in segments with a somewhat higher market growth such as electromechanical locks, automatic doors, access control systems and identification.
New President and CEOJohan Molin became the new President and CEO on 1 December 2005 after MD Bo Dankis left his position in the company following a board initiative.
StrategyASSA ABLOY has over a long period of time followed a strategy model built on three phases:1. Global platform. Create a global presence and progres-
sively add new specialised fields.2. Take advantages of synergies and develop the strengths of
the Group.3. Customer value. Increase organic growth by creating
value for customers.
Well-developed business strategyASSA ABLOY has developed a strategy to achieve the Group’s vision, business concept and financial goals. The business strategy is based on three general themes that are divided into seven main activities. The Group has worked continuously with this strategy since it was introduced in 2004.
The first theme is to increase growth within our core operations by strengthening our collaboration with archi-tects, door manufacturers, suppliers of security systems and distributors around the world.
The second theme concerns expanding into markets and segments with higher growth. This primarily involves three markets – the consumer market where customers actively choose their security solutions, the market for electronic access control and the rapidly growing Chinese market where ASSA ABLOY is taking steps to become more established.
The third theme takes aim at better utilising the Group’s size and framework to reduce costs. This entails more specialisation in our factories, better use of production capacity in developing countries and increasing procurement efficiency.
P o r t f o l i o c o m p a n i e s

LATOUR 2005 29
(SEK m) 2005 2004
Sales 27,802 25,526
Profit after tax 2,613 2,356
Proposed dividend per share, SEK 3.25 2.60
Share price 31 December, SEK 125 113
Latour’s share of equity, % 7 7
Latour’s voting share, % 16 16
Leverage & Growth action programThe two-year action program that was launched in November 2003 was completed during the fourth quarter of 2005. Annual savings are expected to reach SEK 450 m starting in 2006. Around SEK 350 m was saved in 2005. During 2005 payments related to the action program amounted to SEK 298 m and a total of 1,300 employees have left the Group. The 100 remaining affected employees will leave the Group during the first quarter of 2006.
Future developmentThere is a great deal that must be accomplished over the next few years in order to improve efficiency and better utilise syn-ergies in the Group. One vital measure is to gather ASSA ABLOY’s sales corps under the brand ASSA ABLOY. Customers will meet one salesman that offers a product port-folio with several brands. The Group will continue to consol-idate, relocate and outsource manufacturing, coordinate R & D and implement shared services in administration.
Product development will to a greater degree focus on creating innovative products for market segments with high growth – electromechanical locks, automatic doors and security doors – as well as developing technology for electronic access authorisation and identification.
Customers are increasingly requesting total solutions for locks that are easy to use and install. ASSA ABLOY is therefore developing open standards that make it possible to integrate all our locks into customers’ systems.
ASSA ABLOY strives to create added value in close coop-eration with customers. One example of this is our endeav-our to participate at an early stage in our customers’ choice of security solutions, the so-called specification market. Another example is Entrance Systems, the Group’s division for automated doors and the rapidly growing service sector.
Forecast for the futureOrganic sales growth is expected to continue to be good. Operating margins (EBIT) and operating cash flow are expected to develop well, excluding the effects of future restructuring measures. ASSA ABLOY anticipates that demand in the long term for security products will grow.
ELVA is an electromechanical entrance lock which is basically constructed like a traditional lock but has many new and con-venient functions. The lock can be opened with both a key and remote control at the same time quick evacuation is assured since the door is always open from the inside.
60
80
100
120
140
160
180
200
220
01 02 03 04 05 06
Assa Abloy
Class B shareOMX Stockholm PI
(c) S
IX
Work on focusing on customer usefulness, innovation and taking full advantage of ASSA ABLOY’s strong position will hasten growth and improve profitability.
SharesThe ASSA ABLOY share is listed on the Stockholm Stock Exchange A-list. During 2005 the share price rose from SEK 113 to SEK 125 per share. Latour’s holding at the end of the year was valued at SEK 3,218 m.
P o r t f o l i o c o m p a n i e s
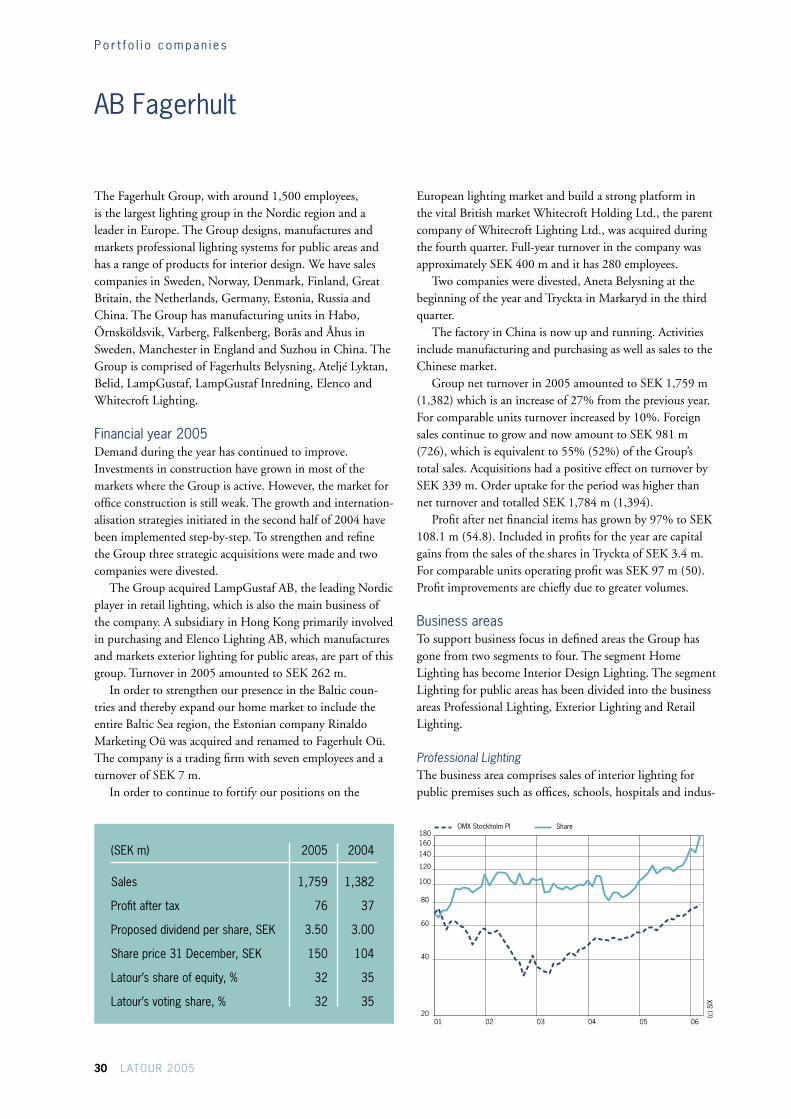
30 LATOUR 2005
AB Fagerhult
(SEK m) 2005 2004
Sales 1,759 1,382
Profit after tax 76 37
Proposed dividend per share, SEK 3.50 3.00
Share price 31 December, SEK 150 104
Latour’s share of equity, % 32 35
Latour’s voting share, % 32 35
The Fagerhult Group, with around 1,500 employees, is the largest lighting group in the Nordic region and a leader in Europe. The Group designs, manufactures and markets professional lighting systems for public areas and has a range of products for interior design. We have sales companies in Sweden, Norway, Denmark, Finland, Great Britain, the Netherlands, Germany, Estonia, Russia and China. The Group has manufacturing units in Habo, Örnsköldsvik, Varberg, Falkenberg, Borås and Åhus in Sweden, Manchester in England and Suzhou in China. The Group is comprised of Fagerhults Belysning, Ateljé Lyktan, Belid, LampGustaf, LampGustaf Inredning, Elenco and Whitecroft Lighting.
Financial year 2005Demand during the year has continued to improve. Investments in construction have grown in most of the markets where the Group is active. However, the market for office construction is still weak. The growth and internation-alisation strategies initiated in the second half of 2004 have been implemented step-by-step. To strengthen and refine the Group three strategic acquisitions were made and two companies were divested.
The Group acquired LampGustaf AB, the leading Nordic player in retail lighting, which is also the main business of the company. A subsidiary in Hong Kong primarily involved in purchasing and Elenco Lighting AB, which manufactures and markets exterior lighting for public areas, are part of this group. Turnover in 2005 amounted to SEK 262 m.
In order to strengthen our presence in the Baltic coun-tries and thereby expand our home market to include the entire Baltic Sea region, the Estonian company Rinaldo Marketing Oü was acquired and renamed to Fagerhult Oü. The company is a trading firm with seven employees and a turnover of SEK 7 m.
In order to continue to fortify our positions on the
European lighting market and build a strong platform in the vital British market Whitecroft Holding Ltd., the parent company of Whitecroft Lighting Ltd., was acquired during the fourth quarter. Full-year turnover in the company was approximately SEK 400 m and it has 280 employees.
Two companies were divested, Aneta Belysning at the beginning of the year and Tryckta in Markaryd in the third quarter.
The factory in China is now up and running. Activities include manufacturing and purchasing as well as sales to the Chinese market.
Group net turnover in 2005 amounted to SEK 1,759 m (1,382) which is an increase of 27% from the previous year. For comparable units turnover increased by 10%. Foreign sales continue to grow and now amount to SEK 981 m (726), which is equivalent to 55% (52%) of the Group’s total sales. Acquisitions had a positive effect on turnover by SEK 339 m. Order uptake for the period was higher than net turnover and totalled SEK 1,784 m (1,394).
Profit after net financial items has grown by 97% to SEK 108.1 m (54.8). Included in profits for the year are capital gains from the sales of the shares in Tryckta of SEK 3.4 m. For comparable units operating profit was SEK 97 m (50). Profit improvements are chiefly due to greater volumes.
Business areasTo support business focus in defined areas the Group has gone from two segments to four. The segment Home Lighting has become Interior Design Lighting. The segment Lighting for public areas has been divided into the business areas Professional Lighting, Exterior Lighting and Retail Lighting.
Professional LightingThe business area comprises sales of interior lighting for public premises such as offices, schools, hospitals and indus-
20
40
60
80
100
120
140
160 180
01 02 03 04 05 06
Fagerhult
ShareOMX Stockholm PI
(c) S
IX
P o r t f o l i o c o m p a n i e s

LATOUR 2005 31
tries. Net turnover amounted to SEK 1,118 m (988) and operating profit was SEK 92.9 m (46.0).
Retail LightingThe business area comprises sales of lighting systems, light sources and service to retail outlets. Net turnover amounted to SEK 306 m (133) and operating profit was SEK 10.9 m (5.7).
Exterior LightingThe business area comprises sales of outdoor products used to light buildings, parks, recreational areas, paths and more. Net turnover amounted to SEK 107 m (78) and operating profit was SEK 3.3 m (0.5).
Interior Design LightingThe business area comprises lighting for hotels, confer-ence facilities, public premises and homes. Net turnover amounted to SEK 229 m (183) and operating profit was SEK 7.6 m (2.5).
Prospects for 2006 The acquisition of Whitecroft Lighting in England supports continued internationalisation and substantially boosted Group turnover. Whitecroft will also contribute positively to profits in 2006. Manufacturing some products in China will further strengthen the Group’s competitive capacity. We will work to become established on other new markets and a sales company will be opened in Russia. The business cycle in construction is relatively favourable in most markets.
All told, both turnover and profit will continue to increase in comparison with the previous year.
SharesThe Fagerhult share is listed on the Stockholm Stock Exchange O-list. The share price in 2005 rose from SEK 104 to SEK 150. Latour’s holding at the end of the year was valued at SEK 616 m.
Professional lighting. Photo: Örjan Henriksson
Exterior lighting produced by Ateljé Lyktan. Interior design lighting at the Nordic Light Hotel. Photo: Örjan Henriksson
Retail lighting. Photo: Örjan Henriksson
P o r t f o l i o c o m p a n i e s

32 LATOUR 2005
Securitas AB
(SEK m) 2005 2004
Sales 66,014 59,687
Profit after tax 2,713 2,529
Proposed dividend per share, SEK 3.50 3.00
Share price 31 December, SEK 132 114
Latour’s share of equity, % 7 7
Latour’s voting share, % 12 12
Securitas is a world leader in security with over 200,000 employees and operations in more than 20 countries in Europe and North America. The Group is organised into five specialised divisions for guarding solutions, integrated and high end security systems, professional and consumer alarm concepts and cash processing, transport and ATM services.
Group developmentSecuritas cemented its position as a world leader in security in 2005 through stable development in all the divisions in the Group. Security Services USA has once again positive organic sales growth and strong margins. Security Services Europe has implemented a new customer adapted organisa-tion and stabilised the temporary downturn in the segment Transportation and Harbour Security.
Securitas Systems and Securitas Direct show steady organic growth and margin development.
Organic growth in Cash Handling Services has been somewhat slower than in 2004 but operating profits have improved by 16% after the divestiture of the German opera-tions. All told these developments lead us to have confidence in 2006.
DivisionsSecuritas has been organised into five specialised divisions since 2001 which creates total focus on each individual busi-ness unit. Security guard service is organised into two divi-sions, Security Services USA and Security Services Europe. Securitas Systems has operations in both Europe and the US but predominantly in Europe. Direct operates in ten coun-tries in Europe, while Cash Handling Services is organised regionally in both Europe and the US.
Security Services USAThe positive developments in organic sales growth and
operating margins in the second and third quarter of 2005 continue. The division has increased sales and operating profit for the fourth quarter in a row. Improvement over the previous year in such key factors as new sales and more con-tracts is an indication that the positive trend in the division will continue in line with the overall development in 2005. The positive effects from the hurricanes will not last through the first quarter of 2006.
Local managers are receiving education as planned. All local managers and other key personnel have successfully completed the first part of the program and it will continue in 2006. Implementation of the new IT platform was con-cluded in October 2005. This provides stability in the future.
In December Security Services USA received the highest protection afforded by the American SAFETY Act. This is expected to further bolster Security Services USA’s range of services during the year.
60
80
100
120
140
160
180
200
220
01 02 03 04 05 06
Securitas
Class B shareOMX Stockholm PI
(c) S
IX
P o r t f o l i o c o m p a n i e s

LATOUR 2005 33
Security Services EuropeThe new organisation in Security Services Europe was implemented in 2005 and is gaining strength. Separate units with mobile services for small customers have been established in every country. Specialised stationary guarding services for large customers have been organised as a separate entity and airport and harbour security form another unit. Alarm surveillance has also been gathered into one unit. The division into independent customer segments will continue to increase focus and enhancement in the future. A strong platform has been created and the division is expected to increase sales and improve profit margins during 2006.
Securitas SystemsThe focus in Securitas Systems lies on promoting organic
growth and establishing new platforms as well as expanding the existing ones. The first step in organic development is to separate the product organisation into installation and service. The second step will be to divide the organisation into various customer segments, where banks and chains will be major segments. Parallel with this we have worked on efficient purchasing of components.
The acquisitions of Bell and Eurotelis have made Securitas Systems a market leader in England and France. With the acquisition of Wornall Electronics and Hamilton in the US Securitas Systems became a leading player in the American bank security segment as well. Integration of the acquisitions is progressing according to plan. In Germany Securitas con-tinues to build a platform with a special focus on banks.
Direct This division is focused entirely on organic expansion of operations. In the last three years investments have been made to increase the rate of development in the countries where Direct is already operating and to expand into new markets through organic establishments. The new con-sumer concepts are being developed in all the countries we operate in with current focus on France, Belgium and the Netherlands.
Cash Handling ServicesCash Handling Services provide services for transport-ing cash, maintenance of ATMs and cash management. Our goal is to increase our share of maintenance and cash management services, which currently amounts to 34% of the division’s total sales. In December 2005 Securitas Cash Handling sold its German valuables transport operations. The transaction resulted in a capital loss of SEK –151 m.
1) Adjusted for the exclusion of third party alarm surveillance that has been transferred to Security Services Europe and Direct Switzerland that is included in the segment Other.
Direct1) October–December January–December Number of alarms 2005 2004 Change in percent 2005 2004 Change in percent
New installations 42,168 39,440 7 168,935 148,672 14Monitored alarms 689,245 548,184 26 689,245 548,184 26
This does not include the operating loss in Cash Handling Services’ operations in Germany, which amounted to SEK –60 m (EUR –6 m).
Acquisitions 2005The most crucial acquisitions in 2005 were made in Securitas Systems which established a vital presence in the bank segment in the US. In addition, Security Services Europe acquired Blackstar in Spain, which substantially strengthens our presence in several regions in Spain.
SharesThe Securitas share is listed on the Stockholm Stock Exchange A-list. During 2005 the share price rose from SEK 114 to SEK 132 per share. Latour’s holding at the end of the year was valued at SEK 3,353 million.
P o r t f o l i o c o m p a n i e s

34 LATOUR 2005
Munters AB
(SEK m) 2005 2004
Sales 5,130 4,543
Profit after tax 252 200
Proposed dividend per share, SEK 5.50 4.00
Share price 31 December, SEK 218 200
Latour’s share of equity, % 14 13
Latour’s voting share, % 14 13
Controlling and adjusting air humidity – the foundation of Munters’ operationsMunters’ operations are divided into three product areas – Dehumidification, MCS and HumiCool. The largest area is MCS, which in 2005 accounted for 45% of the Group’s turnover. Munters has operations in all product areas in our three regional divisions – Europe, the Americas and Asia.
Growth in each area is dependent on our capacity to broaden our range of products and services. Another success factor is moving up in the value chain, which means increas-ing the number of products and services that are distributed closer to the final customer.
Dehumidification – effective climate controlDehumidification offers products and complete solutions for controlling air humidity and indoor climates. Keeping air humidity low prevents rust, mould, frost and bacterial growth. This increases the efficiency of our customers’ production processes and stock management while improv-ing product quality, sustainability and hygiene. Our largest product is dehumidifiers for industrial processes. Sales in 2005 in Dehumidification totalled SEK 1,514 m. Our major geographic markets are Europe and the US.
Market and competitors – few major playersThe most important market segments in Dehumidification are food and pharmaceutical industries. Other major customer areas for dehumidifiers are electronics and semi-conductor industries. Customers include global leaders such as Wal-Mart, Pfizer, Nestlé and Fujifilm, Intel and Texas Instruments.
Product range development – increasing adaptabilityMunters’ goal in Dehumidification is to increase the adapt-ability of our technology to select applications. This improves our ability to meet customers’ changing needs. In addition
the company is constantly working to improve performance and product quality. At the same time products are becoming increasingly modular. This means Munters can shorten the time it takes to design and produce customised systems.
The company also offers products with a combined dehu-midification and cooling function. The technology is called DesiCool and produces comfortable indoor climate in places like warehouses, schools and restaurants. DesiCool consumes less power and has a lower environmental impact which means it should have great future potential.
MCS – focus on cleaning-up and drying-outMCS (Moisture Control Services) works with services for restoration of damage from flooding and fires as well as temporary climate control. The product area offers a broad range of services in investigations, inspections and restoration – for example, limiting water damage in residential proper-ties, odour control and rental of dehumidifiers to industrial customers. Quick on-call services from MCS help limit the damage caused by fire and flooding. MCS has more than 300 service depots in 20 countries. The depots offer high technical expertise and accessibility. Turnover in 2005 in MCS totalled SEK 2,335 m. Our most important geographic markets are the Nordic countries, Germany and the US.
Somewhat simplified the service concept in MCS is based on dehumidification and restoration after fire and flooding
80
100
120
140
160
180
200
220
240
01 02 03 04 05 06
Munters
ShareOMX Stockholm PI
70 (c) S
IX
P o r t f o l i o c o m p a n i e s

LATOUR 2005 35
damage instead of rebuilding. Dehumidification has increas-ingly become a prevalent industrial standard. Local presence is an essential part of operations in MCS. Our many depots offer around-the-clock accessibility. Proximity to customers means rapid response times, which is decisive in limiting damage. More and more of MCS operations are built on national agreements where insurance companies receive fixed prices.
Market and competitors – a leader in quality Fire and flooding restoration is a prioritised market segment but MCS also offers methods for cutting down and improv-ing rebuilding processes. An important goal of our operations is to gain “Preferred Service Provider” status with our key cus-tomers, principally insurance companies. Some of our major customers are Norwich Union, If, Zurich and FM Global.
Developing products and services and increasing flexibilityMCS is making rapid progress in developing our operations. We intend to standardise our methodology throughout our global organisation and increase flexibility in the products and services we offer in order to respond to differing cus-tomer needs.
The current trend in MCS is to offer more standardised service products at fixed prices. Operations are based largely on Munters’ dehumidification products.
HumiCool – controlling indoor climateHumiCool creates the right indoor climate for people, animals and industrial processes. Technical solutions are primarily based on evaporative cooling and dewing, in which air is cooled through evaporation. The major business areas are AgHort (Agriculture & Horticulture), HVAC, Mist Elimination (ME) and PreCooler. AgHort offer systems for cooling, dewing and ventilation in buildings for animal rearing and greenhouses. HVAC manufactures products for climate control of indoor environments based on evaporative cooling technology. ME produces components, so-called droplet separation for flue-gas cleaning systems in coal-fired power stations. PreCooler manufactures products for cooling air in generators and turbines.
Munters has a strong position through its role as a pioneer in evaporative cooling technology. A broad product range, extensive know-how and skills and a global presence are some of the competitive edges in HumiCool. Sales are spread over a large number of geographic markets.
Turnover in 2005 in Humicool totalled SEK 1,343 m. Our most important geographic markets are Southern Europe and the Middle East.
Munters’ technology in the business areas AgHort, HVAC and PreCooler is based on evaporative cooling. Somewhat simplified it means that air is cooled through evaporation. Hot, dry air passes through Munters’ special cooling pads, CELdek or GLASdek, which are covered in water. When the
air passes through the pads it evaporates, which turns the air cool and humid. This cooling technique – based on Munters’ own innovations – provides low running costs and is envi-ronmentally friendly. R & D in HumiCool is focused on optimising the system’s integral components, particularly fans and CELdek, in terms of longevity, cooling effect and energy consumption for the largest application areas. A primary objective is to a greater extent offer complete system solutions for customers’ needs.
The technology in ME is based on spraying flue-gases with water that contains chemicals which absorb the pollut-ants in the gas. After that Munters’ droplet separation isolates the water droplets containing pollutants. This is another field where Munters is working to broaden system expertise and produce more complex customer solutions. A vital technical capacity is to be able to maximise the level of cleansing at the highest flue-gas speeds possible.
Market and competitors – broad application knowledgeThe major market segments in HumiCool are the AgHort industry (Agriculture & Horticulture), the air treatment industry and power stations.
SharesThe Munters share is listed on the Stockholm Stock Exchange O-list. During 2005 the share price rose from SEK 200 to SEK 218. Latour’s holding at the end of the year was valued at SEK 741 m.
P o r t f o l i o c o m p a n i e s

36 LATOUR 2005
Elanders AB
(SEK m) 2005 2004
Sales 1,953 1,780
Profit after tax 78 96
Proposed dividend per share, SEK 2.50 2.00
Share price 31 December, SEK 118 107
Latour’s share of equity, % 16 16
Latour’s voting share, % 10 10
Elanders is the leading infomedia group in the Nordic region. Based on graphic production, we supply publication solutions for all kinds of information to industrials, trading and service companies, publishers and the public sector. The Group has 1,500 employees and operates 15 companies in six countries. Turnover in 2005 was SEK 2 bn, of which some 37% was generated outside of Sweden. Elanders has three business areas: Infologistics which focuses on comprehensive solutions for customer needs throughout the publication chain (Master Vendor® Concept), User Manuals which specialises in delivering user information to mobile telephones and other consumer electronics and Infoprint which is focused on the production of bulky printed matter in large editions.
The Financial Year 2005Elanders continued to refine operations in six select customer segments: Automotive, Directories, Publishing, Industry & Trade, the Public Sector and the Service Sector.
During the year the Group established a new production unit for user information in Beijing. Operations in directo-ries production in Kungsbacka were characterised by exten-sive problems during the year and a sweeping restructuring plan was implemented entailing a reduction of 90 employ-ees, phasing out equipment and a competence exchange program for a new market orientated organisation.
The decline in profits stems from the problems in Kungsbacka and the cost of establishing the factory in China.
Full-service solutions and expansion abroad The market for printing as a sole product is subject to intense competition in Sweden. Elanders is countering this by increasing the proportion of full-service solutions within the framework of Master Vendor® and continued expansion with existing customers abroad, for instance in
Central Europe and Asia. The Group has a leading position in our selected segments in Sweden and continued expan-sion will therefore likely take place through greater Master Vendor® business with an international thrust. Expansion will be first and foremost organic, through start-ups close to our customers’ facilities. Refinement in the segments and adaptation of Master Vendor® to the differing needs of the segments will continue.
Prospects for 2006The forecast for 2006 is a continued increase in turnover and profit improvement.
SharesThe Elanders share is listed on the Stockholm Stock Exchange O-list. During 2005 the share price for Elanders’ class B share rose from SEK 107 to SEK 118. Latour’s hold-ing at the end of the year was valued at SEK 153 m.
30
60
90
120
150
180
210
01 02 03 04 05 06
Elanders
ShareOMX Stockholm PI
(c) S
IX
P o r t f o l i o c o m p a n i e s

LATOUR 2005 37
Sweco AB
(SEK m) 2005 2004
Sales 3,372 3,141
Profit after tax 274 164
Proposed dividend per share, SEK 5.50 4.00
Share price 31 December, SEK 208 127
Latour’s share of equity, % 36 34
Latour’s voting share, % 25 23
SWECO is the leading consultancy firm in the Nordic region and offers comprehensive expertise in technology, the environment and architecture. Engineers, architects and environmental experts collaborate in SWECO to contribute to a safer, more environmentally friendly growth society. Our home market is the Nordic region. We also have extensive international operations with a focus on Eastern and Central Europe, Asia, Africa, the Middle East and Latin America.
Our best result so far2005 was SWECO’s best year so far. Operating margin increased to 8% and operating profit amounted to SEK 272 m, a 30% increase.
We further strengthened our position on our home mar-ket in the Nordic region. At the same time SWECO contin-ued to be successful in the growth markets in Eastern Europe with several major assignments relating to water and the environment, infrastructure and architecture. The company also built up vital local presence in different places, among them Russia and Bulgaria.
At the close of the year SWECO had about 3,700 employees and a turnover of approximately SEK 3.4 bn. SWECO has subsidiaries operating in eight countries and projects in 45 countries. About 40% of our turnover comes from assignments outside of Sweden.
OperationsSWECO’s customers are active in a great number of market segments including manufacturing, processing, environ-ment, energy, construction, property and transportation. Around 59% of customers come from the private sector and 41% from the public sector. International customers outside of the Nordic region include industrials, contractors, power companies, governments or government agencies.
Prospects for 2006SWECO will follow through on measures taken to fortify market positions in our home market in the Nordic region. At the same time we will continue our establishment in the expansive markets in Eastern Europe. This, combined with good demand for SWECO’s services, is the basis of forecasted bright prospects for 2006.
SharesThe SWECO share is listed on the Stockholm Stock Exchange O-list. During 2005 the share price of class B shares rose from SEK 127 to SEK 208. Latour’s holding at the end of the year was valued at SEK 1,273 m.
40
80
120
160
200
240
01 02 03 04 05 06
Sweco
Class B shareOMX Stockholm PI
25 (c) S
IX
SWECO continues to invest in growth markets eastward. During the year SWECO architects received an assignment to produce a proposal for a completely new city district, Baltic Pearl, for 35,000 inhabitants outside of St. Petersburg.
P o r t f o l i o c o m p a n i e s

38 LATOUR 2005
Närkes Elektriska AB
(SEK m) 2005 2004
Sales 1,948 1,924
Profit after tax 67 68
Proposed dividend per share, SEK 6.00 10.00
Share price 31 December, SEK 129 105
Latour’s share of equity, % 24 23
Latour’s voting share, % 14 13
The NEA Group is an electrical installation business, electrical product wholesaler and has service shops for electrical equipment in over 50 sites throughout Sweden. As an electrical fitter, NEA is second largest in Sweden. NEA has 1,900 employees. Customers are found mainly in industry and public administration. The business concept is characterised by a unique combination of installation and wholesale businesses.
The Financial Year 2005The year was characterised by gradual improvement in the market. Increased demand came primarily from industry while the public sector and construction market are still slow. Housing construction has little significance for NEA.
Turnover rose by 1.3% to SEK 1,948 m while the number of employees dropped by 3.2%, which means better capacity utilisation. Operating profit grew by 29% to SEK 99 m (77). This was primarily due to reduced costs for overcapacity in installation operations. Price levels have been more or less constant through the years. Material sales grew considerably during the year. Shop operations had more customers and profits rose. Net financial items fell as a result of the divestiture of the investment portfolio in 2004 and distribution of an extraordinary dividend in the spring of 2005.
Between 2000 and 2003 NEA made three relatively large acquisitions in southern Sweden. In 2004 and 2005 the acquired units have been consolidated and integrated into the NEA Group. However, the acquired operations in Blekinge have had lasting profitability problems and were therefore wound up in 2005.
NEA has developed into Sweden’s second largest electri-cal fitter through a great number of acquisitions and start-ups. This development has followed a very clear strategy
based on the key concepts of decentralisation, local manage-ment and simplicity.
Operations have been subject to strict financial control and NEA has never suffered a loss since 1931. The com-pany has a strong financial position with liquid assets of SEK 149 m and an equity ratio of 47.3 %.
The board of directors proposes an ordinary dividend of SEK 6.00 (5.00) per share.
Prospects for 2006The favourable market is expected to last through 2006 and continued profit improvement is anticipated.
SharesThe NEA share is listed on the Stockholm Stock Exchange O-list. The share price rose from SEK 105 to SEK 129. The value of Latour’s holding was valued at SEK 286 m.
40
50
60
70
80
90
100
110
120
130 140
01 02 03 04 05 06
NEA
ShareOMX Stockholm PI
(c) S
IX
P o r t f o l i o c o m p a n i e s

LATOUR 2005 39
The Annual Accounts 2005CONTENTS:
Board of Directors’ Report 40
Consolidated income statement 43
Consolidated balance sheet 44
Consolidated cash flow statement 46
Change in consolidated equity 47
Change in interest-bearing net debt 47
Parent company income statement 48
Parent company balance sheet 49
Parent company cash flow statement 50
Notes to the financial reportsNote 1 General information 51Note 2 Accounting principles 51Note 3 Segment reporting 55Note 4 Geographic markets 55Note 5 Transactions with related parties 55Note 6 Expenses allocated per type of cost 56Note 7 Exchange rate differences 56Note 8 Remuneration to accountants 56Note 9 Personnel 56Note 10 Depreciation 58Note 11 Leasing 58Note 12 Operating income and expenses 58Note 13 Profit/loss from participation in associated companies 58Note 14 Profit/loss from portfolio management 59Note 15 Financial income 59Note 16 Financial costs 59Note 17 Tax on the profit for the year 59Note 18 Intangible assets 60Note 19 Buildings 61Note 20 Land and land improvements 61Note 21 Machinery 61Note 22 Equipment 61Note 23 Construction in progress and advance payments for material assets 61Note 24 Participation in subsidiaries 62Note 25 Participation in associated companies 63Note 26 Listed shares 64Note 27 Other securities held as fixed assets 65Note 28 Long-term receivables 65Note 29 Inventory 65Note 30 Listed shares, trade 65Note 31 Cash and bank balances 65Note 32 Financial instruments and financial risk management 66Note 33 Equity 68Note 34 Pension obligations 69Note 35 Taxes 69Note 36 Other provisions 70Note 37 Long-term liabilities 70Note 38 Bank overdraft facility 70Note 39 Accrued expenses and deferred income 70Note 40 Pledged assets 70Note 41 Contingent liabilities 70Note 42 Acquisitions 71Note 43 Subsidiary divestitures 73Note 44 Government grants 73Note 45 Events after the balance sheet date 73Note 46 Important estimations and assessments 74Note 47 Transition to IFRS 75Note 48 Definitions 78 Proposed disposition of profits 79
Audit report 80
The Board of Directors and Chief Executive Officer of Investment AB Latour (publ) herewith present the Annual Report and the consolidated annual accounts for 2005.

40 LATOUR 2005
Board of Directors’ Report 2005
GROUPInvestment AB Latour’s investment portfolio was valued at SEK 9,640 m at the end of the year. The portfolio holding accounts are reported on page 6. The largest holdings in terms of value are ASSA ABLOY AB and Securitas AB. In addition, Latour has shares in about 50 wholly-owned oper-ating companies that are organised into eight business areas. Group operations are run by Latour’s subsidiary Nordiska Industri AB and trading with shares and securities is handled by another subsidiary, Karpalunds Ångbryggeri AB.
Companies in which Latour’s voting share is equal to or exceeds 20 percent are reported as associated companies according to the equity method. This category includes AB Fagerhult and SWECO AB, which are part of the investment portfolio, and ProstaLund AB which is unlisted.
Changes in the GroupIn the Hand Tools business area TA Ljungberg AB, maker of the talmetern, and Tikaskolmio Oy, Wibe Stegar’s Finnish sales company was acquired by Hultafors. The acquired companies have a combined turnover of SEK 30 m. An agreement was reached in 2004 for the acquisition of Wibe Stegar and it has been part of the business area since 2005.
In the Engineering Technology business area Specma AB acquired AxFlow AB’s gasket and sealing operations. Annual sales amount to some SEK 40 m. In addition, Nord-Lock’s Finnish distributor, with a turnover of about SEK 20 m, has been acquired.
In the Textiles business area shares in AS Knappehuset and the Craft operations in Almedahls AB were sold. Turnover of the units sold totalled close to SEK 200 m. In addition, Almedahl-Kinna AB that has annual sales of SEK 185 m was sold as well as operations in Holma-Helsinglands AB with annual sales of SEK 30 m. The take over date was 1 January 2006. The divestitures had a positive effect on Latour’s profits by SEK 10 m.
Further information regarding acquisitions and divesti-tures is found in note 42–43.
Events after the balance sheet dateThe Automotive business area acquired HordaGruppen Vätterleden AB in 2006. HordaGruppen has a turnover of some SEK 160 m. The business area’s annual sales will amount to around SEK 600 m after this acquisition.
Brickpack AB, with a turnover of SEK 60 m, was acquired in the Engineering Technology business area.
Invoiced sales and profitsNet sales for the Group totalled SEK 4,852 m (4,434), of
which foreign sales was 47 percent (48).The Group’s overall profit after financial items and tax
was SEK 709 m (1,001). The operating subsidiaries reported an operating profit of SEK 342 m (242). Profits from port-folio management totalled SEK 367 m (893) before financial items. Profit from participation in associated companies totalled SEK 133 m (–14). Write-downs in unlisted holdings amounted to SEK 21 m (76).
Net financial items totalled SEK –50 m (–56). Profit after financial items totalled SEK 792 m (1,065).
Tax on profits for the year was SEK –83 m (–64) of which SEK –105 m was actual tax and SEK 22 m was deferred tax.
Liquidity and financial positionThe Group’s liquid assets totalled SEK 138 m (162). Interest-bearing liabilities, excluding pension liabilities, totalled SEK 1,565 m (1,957), of which SEK 1,557 m (1,945) matures in less than one year. The Group’s pension liabilities totalled SEK 129 m (135). Cash flow from current operations in the operating subsidiaries was SEK 327 m (331) and after investments SEK 196 m (225).
The reported equity ratio was 76 percent (52) while the adjusted equity ratio, after consideration of surplus value in associated companies, amounted to 78 percent (73). The net debt/equity ratio, adjusted for surplus value in associated companies, totalled 16 percent (23).
PersonnelThe average number of employees in the Group was 2,975 (3,119), of which 493 (506) were employed abroad. Information concerning wages and remuneration as well as the allocation of the number of employees is given in note 9.
InvestmentsThe operating subsidiaries’ investments in fixed assets totalled SEK 171 m (107) of which SEK 149 m (99) was machinery and SEK 22 m (8) was buildings.
Currency exposureThe subsidiaries’ sales and purchases in foreign currencies are balanced through the Group’s joint financial function. On the balance sheet date there were forward covered sales totalling SEK 345 m. Currency hedging amounted to SEK 23 m not including currency hedging through currency clauses in major import deals. With the exception of net sales in Norwegian crowns, which totalled about NOK 200 m, there is a relatively good balance between pur-chases and sales in foreign currency. Information concerning Group financial risk exposure is given in note 32.
B o a rd o f D i re c t o r s ’ R e p o r t 2 0 0 5

LATOUR 2005 41
Board work during 2005The board consisted of eight, by the Annual General Meeting elected, members in 2005. A presentation of the board of directors appears on page 83. The Group’s chief financial officer was the secretary of the board. During 2005 the board held four regular meetings, one per capsulam meeting and one telephone meeting.
At two of these meetings the board discussed the Group’s budget and subsequent forecasts. The board also discussed issues concerning portfolio investments, acquisitions and divestitures of subsidiaries and adopted the investment framework applicable to the wholly owned subsidiaries. The company’s auditors attended and expressed their views at two board meetings, one concerning the annual accounts and one in connection with a report from an audit of cur-rent accounting and internal control.
The board is responsible for the company’s organisation and management and makes regular assessments of the par-ent company’s and the Group’s financial position. The board has adopted written rules of procedure, which regulate, among other things, the number of board meetings, matters to be put before the board, financial reporting and instruc-tions for the CEO.
It was deemed important that all board members be informed directly of the outcome of the auditors’ work and any comments and conclusions they arrive at. For this reason, it was resolved that the board as a whole should act as the auditing committee.
The Annual General Meeting of 2005 decided to appoint a nominating committee consisting of the principal share-holder and representatives for two other major owners.
Pursuant to an agreement with the affected labour unions, starting 2005, the Group’s employee representation will participate in Latour Industrier AB, which is the parent company to the wholly-owned trading and industrial sub-sidiaries. For this reason there are no employee representa-tives on the board of Investment AB Latour
Environmental impact The Latour Group runs operations required to have permits according to the Environmental Act in four of the Group’s subsidiaries. The companies obliged to seek permits and submit reports are active in textile manufacturing and pro-duction in the engineering industry. Environmental impact is through emissions into the atmosphere and discharge into municipal purification plants. All affected companies have the permits necessary for their operations.
Changes resulting from the transition to IFRSs From 1 January 2005 Latour has begun reporting under the International Financial Reporting Standards (IFRSs).
The most significant difference for Latour’s part between previous accounting principles and the IFRSs principles is that the investment portfolio will be taken up at market value rather than previously at acquisition value. This will elevate shareholders’ equity. Moreover, there is no deprecia-
tion of goodwill assets; instead the companies’ book value will undergo annual impairment tests to determine whether any write-downs are necessary.
Share buyback and share conversionThe total number of registered shares in circulation at the end of 2005 were 43,820,000. Of these 120,000 class A shares have been previously repurchased at an average price of SEK 141.As these shares bear no entitlement to dividends, they are not included in the total number for the proposed profit distribution.
A conversion clause has been introduced to the articles of association giving owners of class A shares the right to convert them to class B shares. After this became possible 6,084,283 class A shares were converted, among them the above mentioned bought back shares.
PARENT COMPANYThe parent company, Investment AB Latour, administers the Group’s investment portfolio and is the parent company of the Group.
Profit for the year after tax totalled SEK 378 m (775). Shares were purchased for SEK 67 m and sold for
SEK 252 m.During the year 1,000,000 class B shares in ASSA
ABLOY, 1,000,000 class B shares in Securitas and 225,500 shares in Fagerhult were sold. In addition, 190,250 class A shares in Munters and 5,900 class A shares and 340,000 class B shares in SWECO were purchased.
Capital gains on the sale of shares totalled SEK 203 m (850) and received dividends from listed companies amounted to SEK 223 m (167). Write-downs in unlisted holdings amounted to SEK 21 m.
Administration costs have been kept low this year as well. They were in total SEK 11 m, which corresponds to around 0.1 percent of the value of the investment portfolio.
The reported equity ratio was 63 percent (61) while the adjusted equity ratio, taking into account surplus value in the investment portfolio, was 84 percent (80).
Proposed dividends and profit distribution The board of directors proposes that the Annual General Meeting resolves to pay a dividend of SEK 7.00 per share. The total proposed dividends amount to SEK 306 m.
The board’s proposal for the appropriation of profits is set out in full on page 79.
PROSPECTS FOR 2006 The integration of the newly acquired companies will be completed in 2006. A continued strong economy will make it possible for companies in most of the Group’s business areas to achieve solid profits. Holdings in the investment portfolio inspire confidence and reflect well run and consoli-dated companies. All in all, this makes continued positive development for the Latour share possible.
B o a rd o f D i re c t o r s ’ R e p o r t 2 0 0 5

42 LATOUR 2005
Quarterly information 2005 2004 SEK m Q 1 Q 2 Q 3 Q 4 Full-year Q 1 Q 2 Q 3 Q 4 Full-year
INCOME STATEMENT Net turnover 1,192 1,274 1,079 1,307 4,852 1,038 1,096 1,056 1,244 4,434Cost of goods sold –920 –962 –795 –973 –3,650 –805 –835 –796 –927 –3,363Gross profit 272 312 284 334 1,202 233 261 260 317 1,071 Sales costs –156 –157 –140 –171 –624 –142 –147 –126 –203 –618Administration costs –68 –66 –56 –66 –256 –60 –55 –57 –63 –235Other operating income 15 22 13 25 75 14 19 18 16 67Other operating costs –13 –11 –13 –17 –55 –10 –12 –14 –7 –43Operating profit 50 100 88 105 342 35 66 81 60 242 Profit/loss from participation in associated companies 18 32 33 50 133 18 14 –62 16 –14Profit/loss from portfolio management 5 376 10 –25 367 762 115 –13 29 893Profit before financial items 73 508 131 130 842 815 195 6 105 1,121 Financial income 2 2 2 0 6 1 2 2 5 10Financial costs –17 –16 –14 –9 –56 –19 –15 –17 –15 –66Profit after financial items 58 494 119 121 792 797 182 -9 95 1,065 Taxes –12 –24 –21 –26 –83 –6 –17 –17 –24 –64
Profit for the year 46 470 98 95 709 791 165 –26 71 1,001
KEY RATIOS Earnings per share (SEK) 1.05 10.73 2.24 2.17 16.20 18.05 3.75 –0.59 1.62 22.86 Adjusted equity ratio 72% 74% 75% 78% 78% 70% 69% 68% 73% 73%Adjusted equity 7,998 8,371 8,669 9,862 9,862 7,137 6,792 6,704 8,208 8,208Substance value 8,132 8,673 8,978 10,392 10,392 7,022 6,745 6,663 8,168 8,168Substance value per share (SEK) 186 198 205 238 238 160 154 152 187 187
TURNOVER Automotive 90 97 73 103 363 77 83 64 88 312Filters 43 61 45 52 201 44 58 43 47 192Hand Tools 106 116 119 121 462 71 76 78 74 299Hydraulics 202 218 170 208 798 141 143 164 197 645Air Treatment 273 317 310 344 1,244 236 272 259 301 1,068Machinery Trading 173 175 154 233 735 151 176 170 223 720Textiles 220 181 108 133 642 238 205 193 218 854Engineering Technology 93 114 107 122 436 88 91 89 104 372Eliminations –8 –5 –7 –9 –29 –8 –8 –4 –8 –28 1,192 1,274 1,079 1,307 4,852 1,038 1,096 1,056 1,244 4,434
OPERATING PROFIT Automotive 4 8 1 5 18 3 6 3 6 18Filters 0 8 4 5 17 1 7 5 4 17Hand Tools 7 14 17 10 48 2 11 13 4 30Hydraulics 8 10 4 10 32 13 7 7 4 31Air Treatment 13 27 38 36 114 1 19 27 27 74Machinery Trading 3 –1 7 11 20 –1 2 6 5 12Textiles 7 11 3 11 32 10 1 9 3 23Engineering Technology 14 17 17 13 61 7 11 11 8 37Other Group-wide –6 6 –3 3 0 –1 2 0 –1 0 50 100 88 104 342 35 66 81 60 242
OPERATING MARGINS (%) Automotive 4.8 8.2 1.4 4.9 4.8 4.4 7.2 4.7 6.8 5.8Filters 0.0 13.1 8.9 9.6 8.5 1.4 12.1 11.6 8.5 9.2Hand Tools 6.3 12.1 14.3 8.3 10.3 3.2 14.5 16.7 5.4 10.2Hydraulics 3.8 4.6 2.4 4.8 4.1 9.1 4.9 4.3 2.0 4.8Air Treatment 4.6 8.5 12.3 10.5 9.1 0.5 7.0 10.4 9.0 7.0Machinery Trading 1.7 –0.6 4.5 4.7 2.7 –0.7 1.1 3.5 2.2 1.6Textiles 3.0 6.1 2.8 8.3 5.0 4.1 0.5 4.7 1.4 2.6Engineering Technology 14.8 14.9 15.9 10.7 14.0 8.4 12.1 12.4 7.7 10.0 4.2 7.8 8.2 8.0 7.0 3.4 6.0 7.7 4.8 5.5
B o a rd o f D i re c t o r s ’ R e p o r t 2 0 0 5

LATOUR 2005 43
Consolidated income statement
SEK m Note 2005 2004
Net turnover 3,4 4,852 4,434 Cost of goods sold –3,650 –3,363
Gross profit 1,202 1,071 Sales costs –624 –618 Administrative costs –256 –235 Other operating income 12 75 67
Other operating costs 12 –55 –43
Operating profit 5–11 342 242 Profit/loss from participation in associated companies 13 133 –14 Profit/loss from portfolio management 14 367 893
Profit before financial items 842 1,121 Financial income 15 6 10 Financial costs 16 –56 –66
Profit after financial items 792 1,065 Taxes 17 –83 –64
Profit for the year 709 1,001
Attributable to: Parent company shareholders 708 1,000 Minority interests 1 1
Earnings per share regarding profit attributable to parent company shareholders (SEK) 33 16.20 22.86
C o n s o l i d a t e d i n c o m e s t a t e m e n t 2 0 0 5

44 LATOUR 2005
SEK m Note 2005 2004
ASSETS Fixed assets Intangible assets 18 161 127 Tangible assets Buildings 19 297 309 Land and land improvements 20 33 40 Machinery 21 243 222 Equipment 22 127 172 Construction in progress and advance payments 23 7 11 Financial assets Participation in associated companies 25 703 560 Listed shares 26 7,751 2,948 Other securities held as fixed assets 27 155 129 Deferred tax 35 11 11 Other long-term receivables 28 21 32
9,509 4,561 Current assets Inventories etc. 29 Raw materials and consumables 177 238 Work in progress 99 103 Finished products and goods for resale 516 478 Work on contract 4 1 Advance payments to suppliers 17 6 Listed shares 30 35 33 Current receivables Accounts receivable 776 699 Prepaid tax 19 35 Other current receivables 64 37 Prepaid expenses and accrued income 60 48 Cash and bank balances 31 138 162
1,905 1,840
Total assets 11,414 6,401
Consolidated balance sheet
C o n s o l i d a t e d b a l a n c e s h e e t 2 0 0 5

LATOUR 2005 45
SEK m Note 2005 2004
EQUITY Capital and reserves attributable to parent company shareholders 33 Share capital 110 110 Share buyback –17 –17 Other reserves 4,847 –2 Profit brought forward 3,733 3,263 8,673 3,354 Minority interest 3 2
Total equity 8,676 3,356 Liabilities
Long-term liabilities Pension obligations 34 129 135 Deferred tax liability 35 120 149 Other provisions 36 6 4 Interest-bearing liabilities 37 8 12 Non-interest-bearing liabilities 37 0 0
263 300 Current liabilities Bank overdraft facilities 38 12 16 Liabilities to credit institutions 32 1,544 1,917 Advance payments from customers 31 15 Accounts payable 442 338 Tax liabilities 48 17 Other provisions 36 7 11 Derivative instruments 32 1 – Other liabilities 87 104 Accrued expenses and deferred income 39 303 327
2,475 2,745
Total liabilities 2,738 3,045
Total equity and liabilities 11,414 6,401 Pledged assets 40 110 138 Contingent liabilities 41 12 46
Consolidated balance sheet
C o n s o l i d a t e d b a l a n c e s h e e t 2 0 0 5

46 LATOUR 2005
SEK m Note 2005 2004
Operating profit 342 242 Depreciation 139 132 Adjustments for items not included in cash flow –12 –7 Paid tax –59 –43
Cash flow from current operations before changes in working capital 410 324 Change in working capital Inventories –41 –42 Accounts receivable –114 –10 Current receivables –49 3 Current liabilities 121 56
–83 7 Cash flow from current operations 327 331 Investments Acquisition of subsidiaries 42 –81 –78 Sales of subsidiaries 43 110 3 Acquisition of fixed assets –147 –115 Sale of fixed assets 16 9
Cash flow from investments –102 –181 Portfolio management Dividends received 224 175 Administration costs etc. –28 –23 Change in working capital –6 9 Acquisition of listed shares etc. –72 –1,771 Sale of listed shares 267 1,673
Cash flow from portfolio management 385 63 Cash flow after investments and portfolio management 610 213 Financial payments Interest received 8 10 Interest paid –69 –65 Net change in borrowings –318 141 Dividends paid –262 –263 Share buyback – –17
Cash flow from financial payments –641 –194 Change in liquid assets –31 19 Liquid funds at the beginning of the year 162 143 Translation difference in liquid assets 7 0 Liquid assets at the end of the year 31 138 162
Consolidated cash flow statement
C o n s o l i d a t e d c a s h f l o w s t a t e m e n t 2 0 0 5

LATOUR 2005 47
Change in consolidated equity
Change in consolidated interest-bearing net debt Change in Change in Other SEK m 2005-01-01 liquid assets borrowing changes 2005-12-31
Interest-bearing receivables 32 –12 20 Liquid assets 162 –31 7 138 Interest-bearing pensions –127 8 –119 Interest-bearing long-term liabilities –12 4 –8 Bank overdraft facility utilised –16 4 –12 Interest-bearing current liabilities –1,934 389 –1,545
Interest-bearing net debt –1,895 –31 393 7 –1,526
Of the profit brought forward at the end of the year SEK 2,966 m (2,851) was available for dividends to parent company shareholders.At the Annual General Meeting on10 May 2006 a dividend for 2005 of SEK 7.00 (6.00) per share, totalling SEK 305.9 m (262.2), will be proposed. This amount has been reported as a profit appropriation for the financial year 2005 and not as a debt.
Attributable to parent company shareholders
Share Shares Other Profit brought Minority TotalSEK m Note capital bought back reserves forward interests
Opening balance 2004-01-01 33 120 –684 0 3,201 2,637Adjustment for change in accounting principles 2 2Adjusted equity 2004-01-01 120 –684 0 3,201 2 2,639Translation differences for the year -2 –2Acquisition of minority shares –1 –1Other –1 –1Profit for the year 1,000 1 1,001
Total changes in wealth recognised directly in equity, excl. transactions with company owners 120 –684 -2 4,200 2 3,636Dividends –263 –263Share buyback –17 –17Share redemption –10 684 –674 0
Closing equity 2004-12-31 33 110 –17 –2 3,263 2 3,356
Adjustment for change in accounting principles 4,127 4,127Opening balance 2005-01-01 33 110 –17 4,125 3,263 2 7,483Translation differences for the year 14 14Available-for-sale financial assets: Revaluations recognised directly in equity 924 924 Reported as profit or loss when divested –213 19 –194Cash flow hedges Recognised directly in equity –1 –1Net investment hedges –2 –2Changes in associated companies’ equity 7 7Other –2 –2Profit for the year 708 1 709
Total changes in wealth recognised directly in equity, excl. transactions with company owners 110 –17 4,847 3,995 3 8,938Dividends –262 –262
Closing equity 2005-12-31 33 110 –17 4,847 3,733 3 8,676
Change i n conso l i da ted equ i t y / Change i n conso l i da ted i n te res t - bea r i ng ne t deb t 2005

48 LATOUR 2005
SEK m Note 2005 2004
Other operating income 12 – 1 Profit from portfolio management 14 385 783
Profit after financial items 385 784
Interest income and similar profit items 15 36 42 Interest costs and similar loss items 16 –43 –49
Profit after financial items 378 777
Taxes 17 – –2
Profit for the year 378 775
Parent company income statement
P a re n t c o m p a n y i n c o m e s t a t e m e n t 2 0 0 5

LATOUR 2005 49
Parent company balance sheet
SEK m Note 2005 2004
ASSETS Fixed assets Financial assets Participation in subsidiaries 24 241 241 Participation in associated companies 25 470 461 Listed shares 26 2,951 2,948 Other investments held as fixed assets 27 114 127 Receivables from Group companies 1,221 1,188
4,997 4,965 Current assets Current receivables Other current receivables 6 5 Prepaid expenses and accrued income – 2 Cash and bank balances 31 – 7
6 14
Total assets 5,003 4,979
EQUITY AND LIABILITIES Equity 33 Restricted equity Share capital 110 110 Reserve fund 96 96 Non-restricted equity Profit brought forward 2,588 2,076 Profit for the year 378 775
3,172 3,057 Provisions Pension obligations 1 1
1 1 Long-term liabilities Debts to Group companies 1,830 1,915
1,830 1,915 Current liabilities Other liabilities – 6
0 6
Total equity and liabilities 5,003 4,979
Pledged assets – – Contingent liabilities 41 2,399 2,449
P a re n t c o m p a n y b a l a n c e s h e e t 2 0 0 5

50 LATOUR 2005
SEK m Note 2005 2004
Paid tax – – Current receivables 1 –6 Current liabilities –7 5
Cash flow from current operations –6 –1 Portfolio management Dividends received 223 167 Administration costs etc. –21 –16 Acquisition of listed shares etc. –68 –1,676 Sale of listed shares 252 1,428
Cash flow from portfolio management 386 –97 Cash flow after investments and portfolio management 380 –98
Financial payments Interest received 36 42 Interest paid –43 –49 Net change in borrowings –118 339 Dividends paid –262 –263 Share buyback 33 – –17
Cash flow from financial payments –387 52 Change in liquid assets –7 –46 Liquid funds at the beginning of the year 7 53 Liquid assets at year-end 31 0 7
Parent company cash flow statement
Change in parent company equity
Profit brought SEK m Note Share capital Reserve fund forward Total
Opening balance 2004-01-01 120 96 2,345 2,561 Share redemption –10 11 1 Share buyback 33 –17 –17 Dividends –263 –263 Profit for the year 775 775
Closing balance 2004-12-31 110 96 2,851 3,057 Dividends –262 –262 Other –1 –1 Profit for the year 378 378
Closing balance 2005-12-31 110 96 2,966 3,172
P a re n t c o m p a n y c a s h f l o w s t a t e m e n t / C h a n g e i n p a re n t c o m p a n y e q u i t y 2 0 0 5

LATOUR 2005 51
Notes to the financial statements (All amounts are in SEK m unless stated otherwise)
Note 1. General informationInvestment AB Latour (publ), corporate registration number 556026-3237, is a mixed investment company with a wholly-owned industrial and trading business and an investment portfolio, which is concentrated to major holdings in ASSA ABLOY, Elanders, Fagerhult, Munters, Närkes Elektriska, Securitas and SWECO.
The parent company is a limited company registered in Gothenburg. The headquarters address is JA Wettergrens gata 7, Box 336, 401 25 Gothenburg, Sweden. The mother company is listed on the Stockholm Stock Exchange O list.
The board of directors and the chief executive officer have approved these consolidated accounts for publication on 13 March 2006. The Annual Report and annual accounts will be presented to the Annual General Meeting on 10 May 2006 for adoption.
Note 2. Accounting principlesBasis of preparation of the consolidated financial statementsThe consolidated accounts for Investment AB Latour have been prepared in accordance with the International Financial Reporting Standards (IFRSs) published by the International Accounting Standard Board (ISAB) as well as the interpretations of the International Financial Reporting Interpretations Committee (IFRIC) which have been approved by the EC Commission for use in the EU. This is the first complete financial report prepared according to IFRSs. In connection with the transition from previous accounting principles to accounting according to IFRSs the Group has followed IFRS 1, which is the standard that describes how the transition to IFRS should be reported. In addition, the Group has followed the Swedish Financial Accounting Standards Council Recommendation RR 30 Supplemental Accounting Regulations for Groups.
The consolidated accounts have been prepared according to the acquisi-tion method except for revaluations of buildings and land, financial assets that can be sold as well as financial assets and liabilities (including derivative instruments) valued at fair value through profit or loss.
Preparing reports according to IFRSs requires using a number of estima-tions important from an accounting perspective. In addition, management must make some assumptions when using company accounting principles. Areas that require a high level of assumption, those that are complex or areas in which assumptions and estimations are essential to the consoli-dated accounts are presented in note 46.
The parent company uses the same accounting principles as the Group except in cases described below in the section “Parent company accounting principles”. The deviations between the parent company’s and the Group’s principles are due to limitations in the ability to use IFRSs in the parent company because of the Accounting Act and the Security Law as well as in certain cases for tax purposes.
Explanations concerning the affects of the transition to IFRSs on the Group’s financial result and position as well as reported cash flow are given in note 47.
New IFRSs and interpretations that will be used in future periodsStarting in 2006 the new rules in IAS 39 that concern “Fair value option” will be used. This is not expected to have any effect on reporting financial instruments in the Latour Group.
A revised version of IAS 19 concerning reporting actuarial gains and losses as well as certain information will be used starting in 2006. At pres-ent Latour believes this change will not affect how any actuarial gains and losses are reported.
During 2005 IASB published IFRS 7 which deals with information concerning financial instruments. A large part of its contents are now found in IAS 32.
The standard is required from 2007 but beginning earlier is encouraged. Latour has chosen not to use IFRS 7 the financial year of 2005.
Consolidated accountsSubsidiariesThe consolidated financial statements comprise the companies over which Investment AB Latour has a direct or indirect controlling influence.
Acquisition of companies is shown using the acquisition method. This entails that equity in the subsidiary at the time of acquisition, including capital in untaxed reserves, is eliminated in its entirety. Consequently, only profits arising after the point of acquisition will be included in the equity for the Group. If the group-wise acquisition value of the shares exceeds the book value of the company’s net assets in the acquisition analysis, the differ-ence is shown as goodwill of the Group. If the acquisition cost is lower than the fair value of acquired subsidiary’s net assets the difference is recognised directly in the income statement.
Companies acquired during the year are included in the consolidated accounts with sums relating to the period after the acquisition. Profits from companies sold during the year have been included in the consolidated income statement for the period up to the point of divestiture.
Latour’s foreign group companies are defined as independent companies and converted using the daily exchange rate method. The daily exchange rate method entails that assets and liabilities are converted at the exchange rate on the balance sheet date. All items in the income statement are converted at the average annual rate of exchange. Translation differences are recognised in Group equity.
Internal profits on sales between Group companies are eliminated in the annual accounts.
Associated companiesShareholdings in associated companies, in which the Group holds at least 20 percent but less than 50 percent of voting rights or otherwise has significant influence over operational and financial management, are reported according to the equity method.
The equity method entails that the book value of shares in associated companies in the Group’s accounts corresponds to the Group’s participation in associated companies’ equity and any residual value in group-wide surplus and under values. The Group’s “Profit/loss from participation in associated companies” is recorded in the Group’s income statement as the Group’s share of associated companies’ profits after tax, adjusted for any deprecia-tion on or liquidation of acquired surplus or under values respectively.
In the parent company associated companies are recorded using the acquisition value method.
Net salesNet sales are made up of invoiced sales, excluding value-added taxes, and after deduction of discounts on goods and similar income reductions but before deductions for delivery expenses. Sales are reported after the Group has transferred to the buyer the relevant risks and benefits associated with title to the goods sold and once no right of disposal or possibility of actual control over the goods remains. Income from sales of services is reported when the service has been performed.
Ongoing assignmentsIncome and costs attributable to completed services rendered or subcontracted assignments are reported as income respectively costs in relation to the stage of completion of the assignment on the balance sheet date (continuing profit/loss recognition). The stage of completion of an assignment is determined through expenditures made at balance sheet date relative to estimated overall expenditures. If a service rendered or subcontracted assignment cannot be calculated reliably, income is only reported to the extent it corresponds to expenditures that the customer will most likely pay for. An assignment likely to make a loss is immediately reported as an expense.
Other operating incomeOther operating income includes income from activities outside standard operations.
InventoryInventory is reported at the lower of acquisition cost and net sales value, where acquisition value is calculated using the FIFO method or, alternatively,
N o t e s t o t h e f i n a n c i a l s t a t e m e n t s 2 0 0 5

52 LATOUR 2005
the weighted average cost if this is a good estimate of FIFO. The value of finished goods and work-in-progress includes raw materials, direct work, other direct costs and production related expenditures. Obsolescence is separately depreciated. When assessing obsolescence, consideration is given to the age and turnover rate for the article in question. The change between the opening and closing provision for obsolescence for the year affects operating profits as a whole.
Translation of foreign currencyFunctional currency and report currency Items in the financial statements for the various units in the Group are valued in the currency used in the economy that each company primarily operates in (functional currency). Swedish crowns are used in the consolidated accounts, which is the parent company’s functional and report value.
Transactions and balance sheet items Transactions in foreign currency are translated to the functional currency using the exchange rate on the balance sheet date. Exchange gains and losses that are generated through payment of such transactions and from translation of monetary assets and liabilities in foreign currency at balance date rates are reported in the income statement. The exception is when the transactions are hedges that qualify for hedging accounting of cash flows or net investments where profit/loss is booked as equity.
Translation differences for non-monetary items, such as shares that are valued at fair value via profit or loss are reported as part of the fair value profit/loss. Translation differences for non-monetary items such as shares that are classified as available-for-sale financial assets are recognised as reserves for fair value in equity.
Group companies The result and financial position for all Group companies (none of which have a high inflation value) that have a different functional currency than report currency are translated to the Group’s report currency according to the following:• assets and liabilities for each balance sheet is recalculated to the bal-
ance date rate,• income and expenses for each income statement is recalculated to the
average exchange rate (as long as the average rate is a reasonable approximation of the accumulated effect of the rates on the transaction date, if not income and expenses are recalculated to the rate on the transaction date), and
• all exchange differences are recorded as a separate portion of equity.
At consolidation, exchange differences arising from the translation of net investments in foreign operations, loans and other currency instruments that are identified as hedges of such investments are recognised as equity. When a foreign operation is sold such exchange differences are reported in the income statement as a part of capital gains/losses.
Goodwill and adjustments in fair value that arise when acquiring a foreign company are treated as assets and liabilities in that operation and are translated to the balance date rate.
Tangible assetsBuildings and land largely comprise factories, warehouses and offices. Tangible assets are booked as acquisition value less depreciation. Acquisition value includes costs directly related to the acquisition of the asset.
Costs after acquisition are added to the asset’s book value or are reported as a separate asset, depending on what is most appropriate, only when it is probable that the future financial benefits that are connected to the asset will be available to the Group and the asset’s acquisition value can cal-culated in a reliable manner. All other forms of reparation and maintenance are reported as costs in the income statement during the period they occur.
Depreciation of assets is done on a straight-line basis according to plan down to the estimated residual value of the asset over its estimated useful life according to the following:
Buildings 25–30 yearsLand improvements 10–20 yearsMachinery 5–10 yearsVehicles and computers 3–5 yearsOther inventory 5–10 years
Assets’ residual values and useful lives are tested every balance date and adjusted as needed. An asset’s book value is immediately written down to its recovered value if the book value exceeds its calculated recovered value.
Profits and losses in divestitures are determined through a comparison between sales income and book value and are reported in the income statement. When reclassified assets are sold the sums in other reserves are transferred to profit brought forward.
Intangible assetsGoodwillGoodwill is the difference between the acquisition value and the Group’s share of the fair value of the acquired subsidiary’s or associated company’s identifiable net assets on the date of acquisition. Goodwill on the acquisition of subsidiaries is reported as intangible assets. Goodwill on the acquisition of associated companies is included in the value of the Group’s share of the associated company.
Goodwill is tested annually to identify any write-down needs and is booked as acquisition value less accumulated write-downs. Profit or loss when a unit is sold includes the remaining value of the goodwill related to the divested unit.
Goodwill is allocated to cash generating units when an impairment test is carried out.
Trademarks and licenses Trademarks and licenses are reported at acquisition value. Trademarks and licenses have a limited useful life and are reported at acquisition value less accumulated depreciation. Trademarks and licenses are amortised on a straight-line basis in order to spread the cost of over their estimated useful life (5–10 years).
Software Acquired software licenses are capitalised on the basis of the costs gener-ated by the purchase and start-up of the program. These costs are written off during the estimated useful life period (3–5 years).
Costs for development or maintenance of software are recognised as they occur. Costs that are closely related to production of identifiable and unique software products that are controlled by the Group and which will most likely lead to financial gains for more than a year that exceed costs, are booked as intangible assets. Included in costs that are closely related to the production of software are personnel expenses for program develop-ment and a reasonable part of related indirect costs.
Development costs for software reported as an asset is amortised over its useful life period (of not more than three years).
Write-downsAssets that have an undefined useful life period are not written-down but tested annually for impairment. The value of depreciated assets is tested for impairment whenever there are indications that the carrying amount is pos-sibly not recoverable. The asset is written-down by the amount that the book value exceeds its recoverable value. The recovery value is the higher of an asset’s fair value reduced by sales costs and value in use. When testing for impairment the assets are grouped in the smallest cash-generating units.
Research and developmentExpenses for research are recorded on an ongoing basis. Expenses for development are capitalised to the extent they are expected to yield eco-nomic benefits in the future. The booked value includes expenses for materi-als, direct costs for wages and indirect expenses referable to the asset in a reasonable and consistent manner. Other expenses for development are recorded in the income statement as costs as they occur. Any development costs in the balance sheet are booked as acquisition value less accumulated depreciation and write-downs.
Financial instrumentsFinancial instruments recorded in the balance sheet include accounts receivable, securities, loan receivables and derivatives. Accounts payable, any issued debt or equity instruments, loan liabilities and derivatives are recorded as liabilities and equity.
Financial instruments are initially booked at acquisition value equal to the instrument’s fair value including transaction costs for all financial instruments except those categorised as Financial assets recognised at fair value via the income statement. Recognition then takes place on the basis of classifica-tion specified below.
A financial asset or liability is recorded in the balance sheet when the company becomes a party in the instrument’s contractual conditions. Accounts receivable are recorded in the balance sheet when an invoice has been sent. Liabilities are recorded when an item has been delivered and a contractual obligation to pay exists, even if an invoice has not yet been received. Accounts payable are recorded when an invoice has been received.
A financial asset or a part thereof is derecognised from the balance sheet when the rights in the contract are realised, have matured or the company looses control over them. A financial liability or a part thereof is derecognised from the balance sheet when the commitment has been met or otherwise extinguished.
Acquisitions and divestitures of financial assets are booked on the date
N o t e s t o t h e f i n a n c i a l s t a t e m e n t s 2 0 0 5

LATOUR 2005 53
of business, which is the date the company pledges to acquire or sell the asset.
Fair value of listed financial assets is the equivalent of the asset’s listed purchase price on the balance sheet date. Fair value of unlisted financial assets is determined by using valuation techniques such as recent transac-tions, the price of similar instruments or discounted cash flows. For further information see note 32.
Financial assets are controlled at every external reporting instance to determine whether or not there are objective indications that one or a group of financial assets should be written-down. For any equity instruments classified as Available-for-sales financial assets, there must be a significant and long decline in the fair value to under the instrument’s acquisition value before it can be written-down. If the need arises to write-down an asset in the category Available-for-sales financial assets, any previously accumulated value loss recognised directly in equity is rebooked to the income statement. Write-downs of equity instruments reported in the income statement may not later be reversed via the income statement.
Financial instruments are classified in categories based on the purpose of the acquisition of the financial instrument. Company management deter-mines classification at the time of acquisition. The categories are as follows:
Financial assets valued at fair value through profit or lossThis category has two subgroups; financial assets held for trading and those that the company chose to initially designate to this category. A financial asset is classified in this category if the intention is to sell in the short term. Derivatives are classified as financial assets held for trading if they are not used for hedge accounting. Assets in this category are recognised continu-ously at fair value and changes in value are recognised as profit or loss.
Loans and receivables “Loans and receivables” are financial assets with fixed or determinable pay-ments that are not derivatives nor listed on an active market. Receivables arise when the company provides money, goods and services directly to a customer without any intention to conduct trading in the receivables. This category also includes acquired receivables. Assets in this category are valued at amortised cost. Amortised cost is determined based on the compound interest calculated at the time of acquisition.
Held-to-maturity investmentsThese are financial assets with fixed or determinable payments with a fixed maturity date that the company intends and is able to hold to maturity. Assets in this category are valued at amortised cost. Amortised cost is determined based on the compound interest calculated at the time of acqui-sition. This means that surplus or under values as well as direct transaction costs are distributed over the lifespan of the instrument.
Available-for-sale financial assets This category includes financial assets that have not been classified in any other category or financial assets that were designated to this category at initial recognition. Assets in this category are valued continuously at fair value and changes in value are recognised in equity. When the placement is taken from the balance sheet the cumulative gain or loss that was recognised in equity is recognised in profit or loss.
Financial liabilities held for tradingThis category consists of financial liabilities held for trading as well as derivatives not used for hedging purposes. Liabilities in this category are recognised continuously at fair value and changes in value are recognised as profit or loss.
Other financial liabilitiesThese are financial liabilities not held for trading valued at amortised cost. Amortised cost is determined based on the compound interest calculated at the time the liability was recognised. This means that surplus or under values as well as direct issue costs are distributed over the lifespan of the liability.
Derivative instruments used for hedging purposesDerivative instruments are recognised in the balance sheet on the contract date and are valued at fair value, both initially and in following revaluations. The method of recognising the profit or loss generated from revaluation is determined depending on if the derivative is identified as a hedging instru-ment and, if such is the case, the properties of the item hedged. The Group identifies certain derivatives as either: a hedge of a very probable forecasted transaction (cash flow hedge); or a hedge of a net investment in a foreign operation.
When a transaction is entered in to the Group documents the relationship between the hedge instrument and the hedged item as well as the purpose of risk management and strategy for taking different hedging measures.
The Group also documents its assessment when initiating the hedge and continuously thereafter to see if the derivative instruments used in hedging transactions are effective in terms of evening out changes in fair value or cash flows in hedged items.
Cash flow hedgesThe effective portion of changes in fair value of derivative instruments identified as cash flow hedges, and which qualify for hedge accounting, are recognised in equity.
Any ineffective portion of the changes in value is recognised directly in profit or loss.
The cumulative profit or loss in equity is recycled to the income statement in the period the hedged item affects profit/loss (e.g. when a forecasted hedged sale takes place).
When a hedging instrument matures or is sold or when the hedge no longer qualifies for hedge accounting and cumulative profits or losses relating to the hedge are recognised in equity, these profits/losses remain in equity and are recorded as income/costs at the same time the forecasted transaction is finally recorded in the income statement. When the forecasted transaction is no longer assessed as probable, the cumulative profit or loss recognised in equity is transferred directly to the income statement.
Hedges of net investments Hedges of net investments in foreign operations are reported in a similar manner to cash flow hedges. Profit or loss attributable to the hedging instrument that relate to the effective portion of the hedge are recognised in equity, profit or loss that relates to the ineffective portion is transferred directly to the income statement.
Cumulative profit or loss in equity is recognised in the income statement when foreign operations are sold.
Derivatives that do not qualify for hedge accounting Certain derivative instruments do not qualify for hedge accounting. Changes in the value of these derivative instruments are recognised directly in profit or loss.
Cash and bank balanceCash and bank balance consist of cash and immediately available balances in banks and similar institutions as well as short-term liquid investments with a term of less than three months that run no real risk of fluctuations in value.
Financial investmentsFinancial investments are either financial assets or short-term investments depending on the intention of the investment. If the maturity time or the expected holding time of the investment is longer than one year it is a financial asset, under a year it is a short-term investment.
Financial assets are either shares that belong to the category Financial assets at fair value through profit loss or Available-for-sale financial assets.
Interest-bearing securities acquired with the intention of holding them to maturity belong to the category Held-to-maturity financial assets and are valued to amortised cost.
Interest-bearing securities acquired without the intention of holding them to maturity are classified as Financial assets at fair value through profit loss or Available-for-sale financial assets.
The change in value when valuing to fair value is reported in net financial items.
Long-term and other current receivablesLong-term and other current receivables are receivables that arise when the company supplies money without intending to trade on the receivable rights. If the expected holding time of the receivable is longer than one year it is a long-term receivable and if it is shorter it is an other receivable. These receivables belong to the category Loans and receivables.
Accounts receivable Accounts receivable belong to the category Loans and receivables. Accounts receivable are shown in the amount expected to be received after deductions for bad debts, which are judged individually. Accounts receivable expected maturity time is short which is why the value is recorded as a nominal sum without a discount. Write-downs of accounts receivable are booked as operating costs.
Interest-bearing liabilitiesInterest-bearing liabilities are reported at initiation at fair value after deduc-tions for transaction costs, after which liabilities are reported as amortised cost calculated through the compound interest method. Any difference between the received sum and the amount to be repaid is recognized in profit and loss over the period of the loan.
N o t e s t o t h e f i n a n c i a l s t a t e m e n t s 2 0 0 5

54 LATOUR 2005
Taxes on income Recorded taxes on income include taxes to be paid or recovered for the current year, adjustments for previous years’ taxes and changes in deferred taxes.
Evaluation of all tax liabilities/prepayment is made on the basis of nominal sums and in accordance with taxation rules and fixed or announced, and likely to be stipulated, tax rates.
Tax is reported in the income statement except when the underlying transaction is recognised directly against equity, in which case the tax impact is also recognised against equity.
Deferred tax is calculated using the balance sheet method on all temporary differences arising between book and taxable values for assets and liabilities.
Deferred tax credits pertaining to future tax deductions are recorded to the extent it is likely that the deduction can be set off against a surplus on future taxation.
Untaxed reserves including deferred tax liabilities are reported in legal entities.
Deferred tax is not calculated on temporary differences in participation in subsidiaries and associated companies where the date for the reversal of the temporary difference can be controlled by the Group and it is probable that the difference will not be recycled in the foreseeable future.
From a fiscal perspective, Investment AB Latour is an investment company. Profits on sales of shares are not liable to tax and losses are not deductible. The company must however declare 1.5% of the market value of all shareholdings at the beginning of the year as standard taxable income. However this is only valid for listed shares where the share of votes is under 10 percent. Dividends received are taxable and dividends paid are deductible. Interest income is taxable while administration costs and interest expenses are deductible.
Cash flow analysisThe cash flow analysis is drafted according to the indirect method. The cash flow recorded only includes transactions that involve payments and expenditures. Liquid assets include, besides cash and bank account balances, current financial investments with a maturity period of less than three months.
LeasingLeasing is classified within the Group as either financial or operational. Leasing of fixed assets where the Group essentially faces the same risks and enjoys the same benefits as direct ownership is classified as financial leasing. The leased asset is then reported as a fixed asset and future leasing fees as interest-bearing debts. Leasing of assets where the lessor essentially retains ownership of the asset is classified as operational leasing, and the leasing fee is expensed in a straight line over the leasing period. In the parent company all leasing contracts are reported as operational.
Government grantsGovernment grants are reported in the income statement and balance sheet when it is reasonably certain that the conditions associated with the grant will be satisfied and the grant will likely be obtained. Grants are systemati-cally distributed in the same manner and over the same periods as the costs such grants are intended to compensate. Grants pertaining to investments in material assets have reduced the book value of the assets in question.
ProvisionsProvisions are recorded when the Group/company has a formal or informal obligation as a consequence of an event and it is likely that resources must be expended to regulate the obligation and a reliable estimation of the amount can be made.
Provisions for warrantees are based on the previous year’s actual costs.
PensionsThe Group has several defined contribution and defined benefit pension plans. In Sweden and Norway employees are covered by defined benefit, alternatively defined contribution, pension plans. In other countries they are covered by defined contribution plans.
In defined contribution plans, the company pays fixed fees to a separate legal entity and has no obligation to pay any additional fees. Group profit is charged with costs as the benefits are earned.
In defined benefit plans, remuneration to employees and ex-employees is paid on the basis of salary at the point of retirement and the number of years of service. The Group bears the risk that the pledged remunerations will be paid.
The pension cost and the pension obligation of defined benefit plans are calculated using the Projected Unit Credit Method. The method allocates the cost for pensions at the same rate as employees carry out services for the company which increase their right to future remuneration. The calculation
is made annually by independent actuaries. The company’s obligations are valued at the current value of anticipated future payments by using a discounted interest rate equal to the rate on first class corporate bonds or government bonds with the same maturity period as the obligations in ques-tion. The most important actuarial assumptions are set out in note 34.
The interest cost, setting off anticipated returns against any administra-tive assets, is classified as a financial cost. Other expense items in the overall pension cost burden operating profit or loss.
Contingent liabilitiesA contingent liability is reported when an obligation may result from events that have occurred and its existence is only confirmed by one or several uncertain future events or when an obligation is not recorded as a liability or provision because it is improbable that an expenditure of resources will be required to regulate it.
Segment reportingThe Group’s operations are controlled by and organised into two principal lines of businesses, Industrial and trade businesses and Portfolio manage-ment. These lines of business constitute the Group’s primary segments. The secondary segments comprise geographic areas. Income, operating profits, assets and liabilities pertaining to the segments include directly attributable items together with items that can reliably be allocated to the segment in question. Non-allocated items generally comprise interest-bearing assets and liabilities, interest income and expenses, costs common to the Group and taxes.
Parent company accounting principlesThe parent company follows the Annual Accounts Act and the Swedish Financial Accounting Standards Council’s recommendation RR 32 Accounting for legal entities. RR 32 requires the parent company to follow IFRS/IAS as far as possible. Differences between Group and parent company accounting principles are primarily due to the Annual Accounts Act and the Security Law and in certain cases special tax laws. In the following cases the parent company’s accounting principles do not coincide with IFRSs.
Payments to employees/Defined benefit pensionsThe parent company’s defined benefit pension plans have been calculated according to the Security Law and the Swedish Financial Supervisory Authority’s regulations since this is a prerequisite for fiscal deductions.
Financial instruments The parent company does not follow the valuing regulations in IAS 39. Financial assets in the parent company are valued at acquisition price with deductions for write-downs and financial current assets are valued according to the lowest value principle.
N o t e s t o t h e f i n a n c i a l s t a t e m e n t s 2 0 0 5

LATOUR 2005 55
Industrial and trading Portfolio management Total 2005 2004 2005 2004 2005 2004
INCOME External sales 4,852 4,434 4,852 4,434 PROFIT/LOSS Operating profit 342 242 0 0 342 242
Profit/loss from participation in associated companies 133 –14 133 –14Profit/loss from portfolio management 367 893 367 893Interest income 6 10Interest costs –56 –66Taxes –83 –64Profit for the year 709 1,001
OTHER INFORMATION Assets 2,626 2,565 8,647 3,684 11,273 6,249Unallocated assets 141 152Total assets 11,414 6,401
Liabilities 1,014 944 2 9 1,016 953Unallocated liabilities 1,722 2,092Total liabilities 2,738 3,045 Investments in: tangible assets 170 107 – – 170 107 intangible assets 41 38 – – 41 38
Depreciation 139 132 – – 139 132Costs, in addition to depreciation, not matched by payments 12 23 – – 12 23
Note 3. Segment reporting
The Group’s operations can be divided into two principal segments, wholly-owned industrial and trading businesses and portfolio management. The industrial and trading companies are organised into eight business areas; Automotive, Filters, Hand Tools, Hydraulics, Air Treatment, Machinery Trading, Textiles and Engineering Technology. Portfolio management consists primarily of portfolio management of long-term holdings where the Group has at least 10% of voting rights.
Internal prices are set at cost price plus margins. In the profit or loss of the segments assets and liabilities have been included directly related items as well as items that can be reasonably and reliably allocated to a segment. Tax credits and liabilities (deferred and current) are not recognised in the assets and liabilities of a segment nor are interest-bearing assets and liabili-ties. All investments except short-term inventory and inventory of little value are included in the segments’ investments in tangible and intangible assets.
Note 4. Geographic markets
Sales are divided into geographic markets as follows:
2005 2004
Sweden 2,581 2,319Nordic countries excluding Sweden 1,222 1,171Europe excluding Nordic countries 950 865Other markets 99 79
Total 4,852 4,434
Assets are divided into geographic markets as follows:
2005 2004
Sweden 10,798 5,870Nordic countries excluding Sweden 483 430Europe excluding Nordic countries 124 96Other markets 9 5
Total 11,414 6,401
Investments are divided into geographic market as follows:
2005 2004
Sweden 181 135Nordic countries excluding Sweden 13 8Europe excluding Nordic countries 16 2Other markets 1 0
Total 211 145
The Group’s home market is the Nordic countries, with most of production in Sweden.
Note 5. Transactions with related parties
The Douglas family has considerable influence over Investment AB Latour. Privately and through companies, the Douglas family controls 79% of voting rights in Latour. The family has received board representation fees of SEK 600 th. Purchasing and sales for the year between Latour Group companies was SEK 648 m (576) . There were no purchases or sales with the parent company. All transactions with associated companies were based on market terms. Latour has granted a loan of SEK 6 m to associated company ProstaLund, which was reported in the balance sheet among other current receivables. There were no transactions with other closely related persons or companies during the year.
N o t e s t o t h e f i n a n c i a l s t a t e m e n t s 2 0 0 5
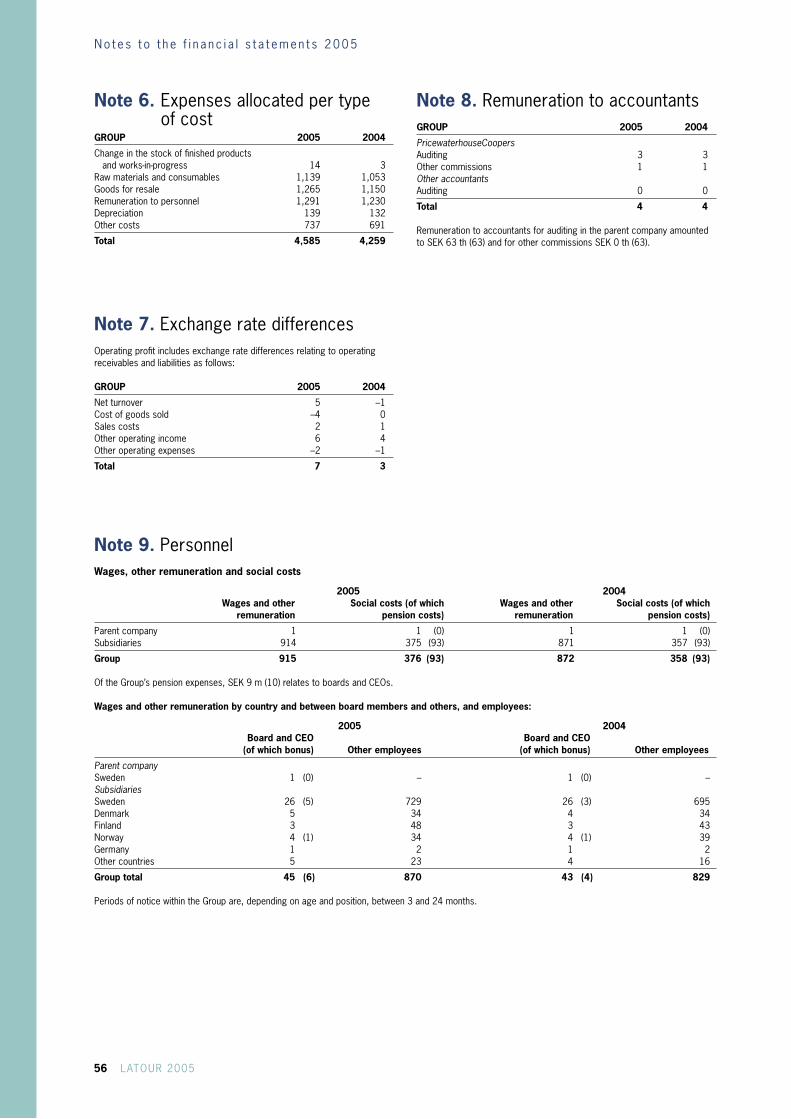
56 LATOUR 2005
Note 6. Expenses allocated per type of costGROUP 2005 2004
Change in the stock of finished products and works-in-progress 14 3Raw materials and consumables 1,139 1,053Goods for resale 1,265 1,150Remuneration to personnel 1,291 1,230Depreciation 139 132Other costs 737 691
Total 4,585 4,259
Note 7. Exchange rate differences Operating profit includes exchange rate differences relating to operating receivables and liabilities as follows: GROUP 2005 2004
Net turnover 5 –1Cost of goods sold –4 0Sales costs 2 1Other operating income 6 4Other operating expenses –2 –1
Total 7 3
Note 8. Remuneration to accountantsGROUP 2005 2004
PricewaterhouseCoopers Auditing 3 3Other commissions 1 1Other accountants Auditing 0 0
Total 4 4
Remuneration to accountants for auditing in the parent company amounted to SEK 63 th (63) and for other commissions SEK 0 th (63).
Note 9. Personnel Wages, other remuneration and social costs
2005 2004 Wages and other Social costs (of which Wages and other Social costs (of which remuneration pension costs) remuneration pension costs)
Parent company 1 1 (0) 1 1 (0)Subsidiaries 914 375 (93) 871 357 (93)
Group 915 376 (93) 872 358 (93) Of the Group’s pension expenses, SEK 9 m (10) relates to boards and CEOs. Wages and other remuneration by country and between board members and others, and employees:
2005 2004 Board and CEO Board and CEO (of which bonus) Other employees (of which bonus) Other employees
Parent company Sweden 1 (0) – 1 (0) –Subsidiaries Sweden 26 (5) 729 26 (3) 695Denmark 5 34 4 34Finland 3 48 3 43Norway 4 (1) 34 4 (1) 39Germany 1 2 1 2Other countries 5 23 4 16
Group total 45 (6) 870 43 (4) 829 Periods of notice within the Group are, depending on age and position, between 3 and 24 months.
N o t e s t o t h e f i n a n c i a l s t a t e m e n t s 2 0 0 5
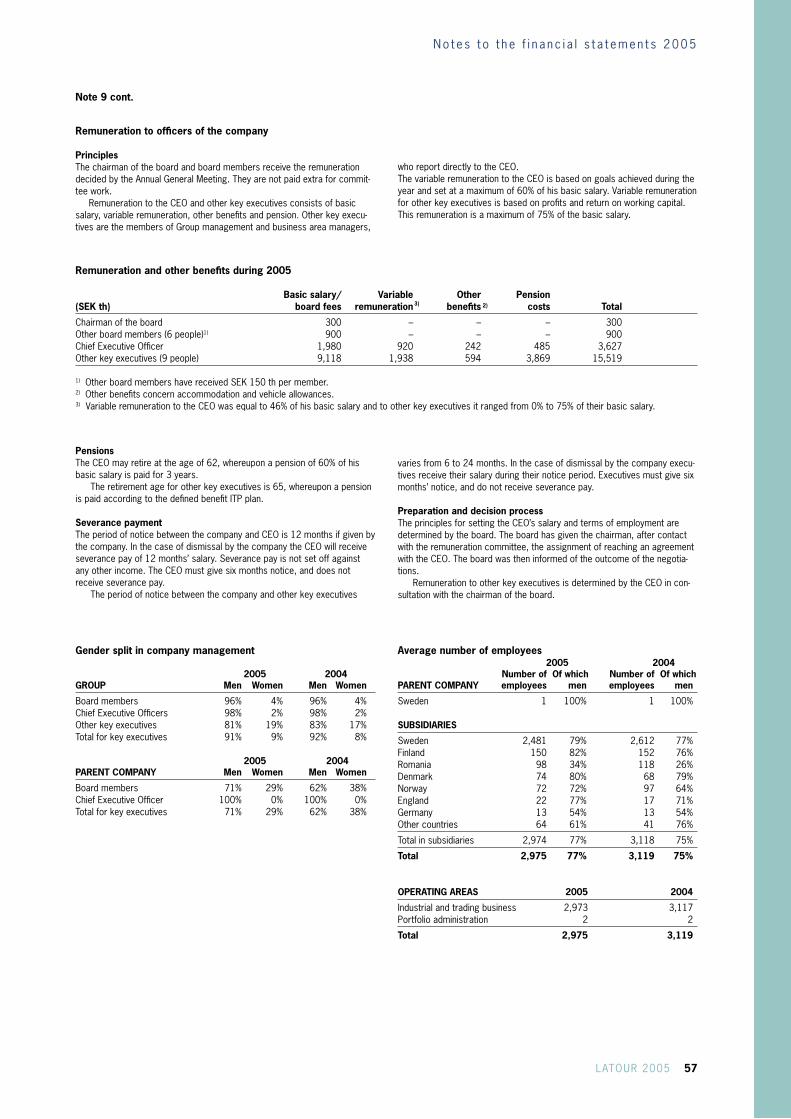
LATOUR 2005 57
Remuneration to officers of the company
PrinciplesThe chairman of the board and board members receive the remuneration decided by the Annual General Meeting. They are not paid extra for commit-tee work. Remuneration to the CEO and other key executives consists of basic salary, variable remuneration, other benefits and pension. Other key execu-tives are the members of Group management and business area managers,
Remuneration and other benefits during 2005
Basic salary/ Variable Other Pension(SEK th) board fees remuneration benefits costs Total
Chairman of the board 300 – – – 300Other board members (6 people)1) 900 – – – 900Chief Executive Officer 1,980 920 242 485 3,627Other key executives (9 people) 9,118 1,938 594 3,869 15,519
1) Other board members have received SEK 150 th per member. 2) Other benefits concern accommodation and vehicle allowances.3) Variable remuneration to the CEO was equal to 46% of his basic salary and to other key executives it ranged from 0% to 75% of their basic salary.
PensionsThe CEO may retire at the age of 62, whereupon a pension of 60% of his basic salary is paid for 3 years.
The retirement age for other key executives is 65, whereupon a pension is paid according to the defined benefit ITP plan. Severance paymentThe period of notice between the company and CEO is 12 months if given by the company. In the case of dismissal by the company the CEO will receive severance pay of 12 months’ salary. Severance pay is not set off against any other income. The CEO must give six months notice, and does not receive severance pay.
The period of notice between the company and other key executives
varies from 6 to 24 months. In the case of dismissal by the company execu-tives receive their salary during their notice period. Executives must give six months’ notice, and do not receive severance pay.
Preparation and decision processThe principles for setting the CEO’s salary and terms of employment are determined by the board. The board has given the chairman, after contact with the remuneration committee, the assignment of reaching an agreement with the CEO. The board was then informed of the outcome of the negotia-tions.
Remuneration to other key executives is determined by the CEO in con-sultation with the chairman of the board.
who report directly to the CEO.The variable remuneration to the CEO is based on goals achieved during the year and set at a maximum of 60% of his basic salary. Variable remuneration for other key executives is based on profits and return on working capital. This remuneration is a maximum of 75% of the basic salary.
Gender split in company management
2005 2004 GROUP Men Women Men Women
Board members 96% 4% 96% 4%Chief Executive Officers 98% 2% 98% 2%Other key executives 81% 19% 83% 17%Total for key executives 91% 9% 92% 8%
2005 2004 PARENT COMPANY Men Women Men Women
Board members 71% 29% 62% 38%Chief Executive Officer 100% 0% 100% 0%Total for key executives 71% 29% 62% 38%
Average number of employees 2005 2004 Number of Of which Number of Of which PARENT COMPANY employees men employees men
Sweden 1 100% 1 100% SUBSIDIARIES
Sweden 2,481 79% 2,612 77%Finland 150 82% 152 76%Romania 98 34% 118 26%Denmark 74 80% 68 79%Norway 72 72% 97 64%England 22 77% 17 71%Germany 13 54% 13 54%Other countries 64 61% 41 76%
Total in subsidiaries 2,974 77% 3,118 75%
Total 2,975 77% 3,119 75%
OPERATING AREAS 2005 2004
Industrial and trading business 2,973 3,117 Portfolio administration 2 2
Total 2,975 3,119
N o t e s t o t h e f i n a n c i a l s t a t e m e n t s 2 0 0 5
Note 9 cont.
3) 2)

58 LATOUR 2005
Note 10. DepreciationGROUP Depreciation of intangible assets in the Group amounted to SEK 6 m (4) and of tangible assets to SEK 133 m (128). Depreciation is distributed per function in the income statement as follows: 2005 2004
Trademarks, licences Cost of goods sold 3 2Sales costs 1 –Administration costs 2 2
Total 6 4 Buildings Cost of goods sold 14 14Sales costs 2 2Administration costs 1 1Other operating expenses 3 3
Total 20 20 Land and land improvements Cost of goods sold 1 1
Total 1 1 Machinery Cost of goods sold 56 50Sales costs 1 1
Total 57 51
Equipment Cost of goods sold 27 29Sales costs 10 8Administration costs 5 6Other 13 13
Total 55 56
Total depreciation 139 132
Note 11. LeasingLeasing costs for premises, machinery, computers and office equipment for the Group were SEK 26 (20) m.
Future minimum leasing fees in the Group for non-cancellable operating leases fall due as follows: Year Future minimum leasing fees
2006 192007–2010 35
Total 54
Operating leases for rented machinery are included in the Group’s fixed assets and are as follows:
Leased fixed assets Machinery
Accumulated acquisition value 13Accumulated depreciation –7
Residual value according to plan 6 Depreciation for the year –3
Note 12. Operating income and expenses
Other operating income GROUP 2005 2004Capital gains on sales 10 3Income from rent 22 20Exchange rate differences 6 4Other income 37 40
Total 75 67
PARENT COMPANY 2005 2004Capital gains on sales – 1
Total 0 1 Other operating expenses GROUP 2005 2004Depreciation –16 –16Property management costs –22 –16Other expenses –17 –11
Total –55 –43
Note 13. Profit/loss from participation in associated companies
2005 2004
Share of profit for the year after tax 122 64Depreciation of surpluses –3 –3Write-downs –5 –76Net change in capital 7 1Profit/loss from sales of participation 12 –
Total 133 –14
Individual holdings have affected profit/loss as follows:
2005 2004
AB Fagerhult 42 10Sweco AB 96 56ProstaLund AB –5 –80
Total 133 –14
N o t e s t o t h e f i n a n c i a l s t a t e m e n t s 2 0 0 5

LATOUR 2005 59
Note 14. Profit/loss from portfolio management GROUP 2005 2004
Profit/loss from fixed assets Dividends 187 111Capital gains on sales 191 850Value change in call option SWECO B 18 –Write-downs –17 –110Other income – 6Loss from guarantee commitments –17 –
362 857
Profit from current assets Dividends 1 8Capital gains 15 38
16 46
Administration costs –11 –10
Total portfolio management 367 893
PARENT COMPANY 2005 2004
Profit from fixed assets Dividends 223 167Capital gains on sales 203 850Write-downs –21 –236Other income – 5Loss from guarantee commitments –17 –
388 786
Administration costs –3 –3
Total portfolio management 385 783
Note 15. Financial income
GROUP 2005 2004
Interest income 5 8Exchange gains 0 1Other financial income 1 1
Total 6 10
PARENT COMPANY 2005 2004
Interest income from Group companies 35 40Interest income 0 2Other financial income 1 –
Total 36 42
Note 16. Financial costs
GROUP 2005 2004
PRI interest –7 –7Other interest expenses –46 –58Exchange losses –3 –1
Total –56 –66
PARENT COMPANY 2005 2004
Interest expenses to Group companies –43 –48Exchange losses – –1
Total –43 –49
Note 17. Tax on profit for the year GROUP 2005 2004
Current tax costs for the period –105 –62Deferred tax attributable to changes in temporary differences Deferred tax income 23 2Deferred tax expenses –1 –4
Total –83 –64
Difference between actual tax costs and tax cost based on applicable tax rates
GROUP 2005 2004
Profit before tax 792 1,065Tax according to applicable tax rate –222 –298Tax effect of special taxation rules for investment companies 106 233Effect of associated company accounts 37 –4Tax effect of adjustment of tax costs from previous year 0 –4Tax effect of non-deductible costs –4 –5Tax effect of non-taxable income 3 10Other tax effects –3 4
Tax on profit for the year according to the income statement –83 –64
PARENT COMPANY 2005 2004
Profit before tax 378 777Tax according to applicable tax rate –106 –218Tax effect of special taxation rules for investment companies 106 218Tax effect of adjustment of tax costs from previous year – –2
Tax on profit for the year according to the income statement 0 –2
The applicable tax rate for the Group, as for the parent company, is 28%. The tax rate is the same rate as in the previous year.
Investment companies are allowed a tax deduction for the dividend approved at the subsequent Annual General Meeting. Capital gains are not taxable while capital losses are not deductible. Investment companies are taxed on a standardised basis.
N o t e s t o t h e f i n a n c i a l s t a t e m e n t s 2 0 0 5

60 LATOUR 2005
Patents, GROUP Goodwill licenses Total
Accumulated acquisition values Opening balance 2004-01-01 81 15 96Opening acquisition value from acquired companies – 4 4Acquisitions for the year 31 8 39Reclassifications – –1 –1
Closing balance 2004-12-31 112 26 138
Opening balance 2005-01-01 112 26 138Opening acquisition value from acquired companies – 3 3Acquisitions for the year 32 9 41Sales for the year –1 0 –1Translation difference 1 0 1
Closing balance 2005-12-31 144 38 182
Accumulated depreciation Opening balance 2004-01-01 0 –4 –4Opening depreciation from acquired companies – –3 –3Depreciation for the year – –4 –4
Closing balance 2004-12-31 0 –11 –11
Opening balance 2005-01-01 0 –11 –11Opening depreciation from acquired companies – –3 –3Depreciation for the year – –6 –6
Closing balance 2005-12-31 0 –20 –20
Accumulated write-down Opening balance 2004-01-01 0 0 0Write-down for the year – – 0
Closing balance 2004-12-31 0 0 0
Opening balance 2005-01-01 0 0 0Write-down for the year –1 – –1
Closing balance 2005-12-31 –1 0 –1
Book value 143 18 161
Recorded values Per 2004-01-01 81 11 92Per 2004-12-31 112 15 127
Per 2005-01-01 112 15 127Per 2005-12-31 143 18 161
Note 18. Intangible assetsThe effect of depreciation on profit or loss is detailed in note 10. All goodwill is related to the industrial and trading business.
Impairment tests of goodwillDuring the year goodwill has been written-down in the subsidiary Mobergs Maskin AB due to the restructuring in the Machinery Trading business area. The write-down of SEK 1 m is reported in Other operating expenses in the consolidated income statement.
Goodwill is allocated to the Latour Group’s cash generating units identified per geographic area and business line.
The recoverable amount for a cash generating unit is determined based on a calculation of value in use. These calculations are based on estimated future cash flows for the next 20 years, based on financial budgets approved of by management. The total length of the forecast period (20 years) corresponds to the average useful life of the Group’s key assets. The forecasted cash flows have been present value calculated with a discount of 8% before taxes.
Key assumptionsMarket shares and growth Current market shares have been assumed valid for future periods based on previous experience and external information sources.
Personnel expensesForecasted personnel expenses are based on anticipated inflation, a certain real wage increase (historical average) and planned rationalisations in production. The forecast concurs with previous experience and external information sources.
Exchange rates Exchange rates forecasts are based on current listed exchange and forward rates. The forecast concurs with external information sources
Assumed variablesDiscount rate of 8% before taxExchange rate EUR 9.25Exchange rate DKK 1.24Exchange rate NOK 1.17Exchange rate USD 7.50
For most of the Group’s units the recoverable value surpasses book value with a good margin. Group management believes that a change in one key assumption would not, on its own, have such a significant effect that it would reduce the recoverable value to a value lower than the book value.
N o t e s t o t h e f i n a n c i a l s t a t e m e n t s 2 0 0 5

LATOUR 2005 61
Note 19. Buildings GROUP 2005 2004
Opening acquisition value 595 593Opening acquisition value from acquired companies 2 9Purchase 21 1Sales and disposals –41 –3Reclassification 0 –4Translation differences 4 –1
Closing acquisition values 581 595 Opening depreciation –203 –188Opening acquisition value from acquired companies –1 –1Sales and disposals 10 1Depreciation for the year –20 –20Reclassification 0 4Translation differences –1 1
Closing depreciation –215 –203 Opening write-downs –83 –83Write-downs for the year – –Sales and reversals 14 –
Closing write-downs –69 –83
Book value 297 309
Book value of property in Sweden 229 257Taxable value of property in Sweden 192 231
Depreciation for the year is found in note 10.
Note 20. Land and land improvements GROUP 2005 2004
Opening acquisition value 46 45Purchases 0 1Sales and disposals –7 –Translation differences 0 0
Closing acquisition values 39 46 Opening depreciation –6 –5Sales and disposals 1 –Depreciation for the year –1 –1Translation differences 0 0
Closing depreciation –6 –6
Book value 33 40
Book value of property in Sweden 26 33Taxable value of property in Sweden 30 37
Depreciation for the year is found in note 10.
Note 21. Machinery GROUP 2005 2004
Opening acquisition value 790 743Opening acquisition value from acquired companies 49 7Purchases 65 46Sales and disposals –26 –8Reclassification 4 2Translation differences 1 0
Closing acquisition values 883 790 Opening depreciation –568 –518Opening depreciation from acquired companies –32 –6Sales and disposals 23 7Depreciation for the year –57 –51Reclassification –5 0Translation differences –1 0
Closing depreciation –640 –568
Book value 243 222
Depreciation for the year is found in note 10.
Note 22. Equipment GROUP 2005 2004
Opening acquisition value 572 534Opening acquisition value from acquired companies 3 20Purchases 64 59Sales and disposals –229 –40Reclassification 3 –1Translation differences 4 0
Closing acquisition values 417 572 Opening depreciation –400 –361Opening depreciation from acquired companies –1 –16Sales and disposals 172 32Depreciation for the year –55 –56Reclassification –3 1Translation differences –3 0
Closing depreciation –290 –400
Book value 127 172
Depreciation for the year is found in note 10.
Note 23. Construction in progress and advance payments for material assets GROUP 2005 2004
Opening acquisition value 11 6Costs expended during the year 50 16Reclassification –54 –11
Book value 7 11
No loan costs have been capitalised in material assets.
N o t e s t o t h e f i n a n c i a l s t a t e m e n t s 2 0 0 5

62 LATOUR 2005
Not 24. Participations in subsidiaries 2005 2004
Opening acquisition value 241 241Change for the year – –
Closing acquisition value 241 241
Corporate Number of Share of equity Book value Company name registration number Domicile shares in % (SEK m)Karpalunds Ångbryggeri AB 556000-1439 Stockholm 3,600 97 1Latour Industrier AB 556649-8647 Gothenburg 400,000 100 49
Autotube AB 556099-2041 Gothenburg 500,000 100IF Luftfilter AB 556133-4466 Alingsås 4,500 100Luftfilter AS 21197807 Denmark 10,000 100IF Luftfilter AS 985-882-479 Norway 100 100IF Luftfilter OY AB 211.107 Finland 1,000 100Hultafors AB 556023-7793 Gothenburg 30,000 100Hultafors OY 1704545-9 Finland 80 100Tikaskolmio Oy 0664406-9 Finland 100 100 Hultafors Norge AS 983513328 Norway 1,000 100Hultafors Danmark AS 225241 Denmark 1,320 100Hultafors Präsident GmbH HRB 3586 Germany – 100Hultafors UMI Srl. J32/572/22.11.1996 Romania 78,661 100TA Ljungberg Patent AB 556113-7760 Huddinge 1,000 100 Wibe Stegar AB 556092-0489 Nässjö 5,000 100 Specma Hydraulic AB 556089-9550 Gothenburg 10,000 100Specma Hydraulic Nord AB 556278-7183 Örnsköldsvik 1,000 100Eurobend AB 556137-4041 Tranemo 1,000 100Hymat OY 0292607-7 Finland 400 100Specma Component AB 556219-2202 Skellefteå 7,500 100WiroArgonic AB 556362-4641 Malmö 5,000 100Swegon AB 556077-8465 Vara 400,000 100PM-Luft Norge AS 958-719-523 Norway 500 100Swegon GmbH HRB 55388 Germany 1 100Swegon AS 247231 Denmark 5 100PM-Luft Finland OY 415-626 Finland 4,010 100Swegon GmbH FN 229472 i Austria – 100KB Söderby 1:752 916634-4441 Vara 100KB Kardanen 7 916634-4516 Vara 100Swegon Ltd 1529960 England 50,000 100Swegon S.á.r.l. 409-770-195 France 1,990 100Swegon SA 48-205-4517 Switzerland 100 100Swegon AS 933-765-806 Norway 1,500 100Oy Swegon AB 240.505 Finland 20,000 100Lewaco Trading AB 556343-3423 Vara 910 91Swegon Sp.z o.o 632031333 Poznan 1,454 100AB Sigfrid Stenberg 556017-2099 Nässjö 800,000 100Carstens AB 556059-6776 Jönköping 18,500 100Flextek AS 17951831 Denmark 20,000 100Granaths Hårdmetal AS 182650 Denmark 2,550 100Machine Trading Team OY 1032222-2 Finland 100 100Mekana AB 556103-6251 Burlöv 40,000 100Mobergs Maskin AB 556053-5642 Borlänge 1,200 100MaskinCentrum i Örnsköldsvik AB 556578-8303 Örnsköldsvik 4,200 51Woodtechnique Finland OY 745.813 Finland 510 100Woodtechnique Verktygssystem AB 556463-2833 Växjö 2,500 100Almedahls AB 556001-2600 Gothenburg 180,000 100Almedahls Alingsås AB 556051-2245 Alingsås 50,000 100Holma-Helsinglands AB 556002-6105 Hudiksvall 27,400 100Almedahl GmbH HRB 1179 Germany 500 100OY Almedahl AB 599.732 Finland 43 100Marifa Polska Sp.z o.o. RHB 2994 Poland 1,000 100KB Ankarvimpeln 916634-4466 Alingsås 100FOV Fabrics AB 556057-3460 Gothenburg 60,000 100Specma AB 556018-9754 Gothenburg 100,000 100Specma AS 988605042 Norway 100 100Nord-Lock AB 556137-1054 Åre 8,000 100Nord-Lock Ltd 4117670 England 100 100Nord-Lock France 439-251-901 France 1,000 100Nordlock Inc. 38-3418590 USA 1,000 100Nord-Lock Oy 0893691-1 Finland 100 100Elkapsling AB 556198-5077 Ånge 10,000 100KB Backen Västergård 1:141 916634-4490 Gothenburg 100
Nordiska Industri AB 556002-7335 Gothenburg 840,000 100 191Marieholms Yllefabriks AB 556018-3914 Eslöv 8,000 100PM-LUFT AB 556048-2118 Tomelilla 1,000 100Farex AB 556196-7802 Borlänge 1,000 100Stifab AB 556099-8832 Stockholm 1,800 100
Total book value 241
N o t e s t o t h e f i n a n c i a l s t a t e m e n t s 2 0 0 5

LATOUR 2005 63
Note 25. Participation in associated companies
Number of Adjusted Share of Market Acquisition Acquisition shares equity1) capital value value goodwill
AB Fagerhult 4,104,500 177 291 616 293 65(Corporate Reg.no. 556110-6203, Domicile: Habo Sweco AB 6,142,568 321 412 1,273 214 113(Corporate Reg.no. 556542-9841, Domicile: Stockholm) ProstaLund AB 2,263,990 5 0 – 131 0(Corporate Reg.no. 556470-0184, Domicile: Lund)
Total 503 703 1,889 638 178
1) Adjusted equity refers to Latour’s share of the company’s equity. Group participation in associated companies: Share of Share of 2004 Assets Liabilities Income Profit/loss capital % votes %
AB Fagerhult 276 114 473 13 35 35Sweco AB 600 377 1,078 55 34 23ProstaLund AB 17 9 11 –4 27 27 2005
AB Fagerhult 475 298 571 25 32 32Sweco AB 742 427 1,226 96 36 25ProstaLund AB 10 6 6 0 23 23
GROUP 2005 2004
Opening book value 560 615Acquisitions during the year 66 26Sold during the year –16 –Profit share for the year after tax 122 64Dilution effect 8 1Dividends received –36 –56Depreciation of surpluses –3 –3Write-downs –5 –76Net change in capital 7 –11
Closing value 703 560
PARENT COMPANY 2005 2004
Opening book value 461 561Acquisitions during the year 30 26Sold during the year –16 –Write-downs –5 –126
Closing value 470 461
N o t e s t o t h e f i n a n c i a l s t a t e m e n t s 2 0 0 5
The Group has not taken up recorded losses attributable to ProstaLund AB amounting to SEK 9 m (5). Unrecorded cumulative losses are SEK 13 m (4).
Shares in ProstaLund AB have been written-down since the long-term value is deemed uncertain. The write-down has charged Group profit with SEK –5 m (–76) and parent company profit with SEK –5 m (–126).

64 LATOUR 2005
INVESTMENT PORTFOLIO Market value Listed price1) Acquisition Share of Share of Share Number SEK m SEK value, SEK m votes, % equity, %
Assa Abloy A2) 6,746,425 843 125 786 Assa Abloy B 19,000,000 2,375 125 414 16 7Elanders 1,300,000 153 118 267 10 16Munters 3,400,000 741 218 610 14 14NEA 2,215,000 286 129 156 14 24Securitas A2) 4,000,000 526 132 484 Securitas B 21,500,000 2,827 132 234 12 7
Total 7,751 2,951
Associated companies in the investment portfolio (see note 25)
Fagerhult 4,104,500 616 150 293 32 32 Sweco A 237,568 45 190 7 Sweco B 5,905,000 1,228 208 170 3) 25 36
Total incl. associated companies in the parent company 9,640 3,421
1) Buying-rate. 2) Class A shares in ASSA ABLOY and Securitas are unlisted. The shares listed in this table have been given the same listing price as corresponding class B shares.3) The acquisition value of SWECO B is SEK 36 m higher in the Group due to the utilisation of a call option.
Note 26. Listed shares
GROUP 2005 2004
Opening acquisition value 2,948 1,873Purchases 35 1,640Sales –32 –565
Closing acquisition value 2,951 2,948
Opening fair value reserve 0 0Effect of change in accounting principle 4,090 –Divestitures, booked in the income statement –194 –Revaluation recognised in equity 904 –
Closing fair value reserve 4,800 0
Book value 7,751 2,948
PARENT COMPANY 2005 2004
Opening acquisition value 2,948 1,873Purchases 35 1,640Sales –32 –565
Book value 2,951 2,948
N o t e s t o t h e f i n a n c i a l s t a t e m e n t s 2 0 0 5

LATOUR 2005 65
Note 27. Other securities held as fixed assets
GROUP 2005 2004
Opening acquisition value 208 212Purchases 3 9Reclassification 2 –Sales – –13
Closing acquisition value 213 208 Opening fair value reserve 0 0Effect of change in accounting principle 17 –Change for the year 20 –
Closing fair value reserve 37 0 Opening write-downs –79 –Write-downs for the year –16 –79
Closing write-downs –95 –79
Book value 155 129 Bravida ASA 91 63Convertible debenture, Bravida ASA1) – 38Arisaig Asian Fund 56 22Linktech 4 4Other holdings 4 2
Book value 155 129
PARENT COMPANY 2005 2004
Opening acquisition value 206 209Purchases 2 9Reclassification 1 –Sales – –12
Closing acquisition value 209 206 Opening write-downs –79 –Write-downs for the year –16 –79
Closing write-downs –95 –79
Book value 114 127
Bravida ASA 88 63Convertible debenture, Bravida ASA1) – 38Arisaig Asian Fund 22 22Linktech 4 4
Book value 114 127
1) The convertible debenture has been converted to class D shares in Bravida ASA during 2005.
Holdings in Bravida ASA have been written-down since the long-term value is not considered solid.
Note 28. Long-term receivables
GROUP 2005 2004
Opening acquisition value 32 17Increase for the year – 28Write-downs – –12Decrease for the year –8 –1Reclassification –3 –
Book value 21 32 The Group’s interest-bearing receivables have an average interest rate of 6% and run for an average period of two years.
Note 29. Inventory Inventory is valued at the lower of acquisition value and net sales value. Raw materials, consumables and work-in-progress are usually calculated accord-ing to the FIFO method. Finished goods and goods for resale are calculated using both the FIFO and the average methods. The value of goods pledged as security for loans or other obligations is SEK 0 m (0) Inventory valued at net sales value 2005 2004
Raw materials and consumables – –Work-in-progress – –Finished products and goods for resale 44 23
Remaining inventory is valued at acquisition value.
Note 30. Listed shares – trading GROUP 2005 2004
Opening acquisition value 53 164Acquisitions for the year 2 95Sales –7 –199Reclassification 1 –7
Closing acquisition values 49 53 Opening depreciation –20 –17Write-downs for the year – –5Reversed write-downs 6 2
Closing write-downs –14 –20
Book value 35 33
Acqu.- Book MarketGROUP Number value value value
Sweco B1) 133,350 11 13 28Other shares and participation 38 22 22
49 35 50
1) Call options have been issued for 133,350 shares in SWECO at a redemp-tion price of SEK 90 per share. The shares are valued at redemption price plus the premium entered as a liability.
The premium for call options issued was determined using the Black & Scholes valuation method. Premiums received are entered as liabilities until the option is definitely closed through set-off, redemption or expiration. Premiums entered as liabilities total SEK 1 m (1).
Note 31. Cash and bank balancesCash and bank balances consist of SEK 135 m in bank balances and SEK 3 m in short-term investments. The Group receives interest on bank balances according to a floating interest rate based on the daily rate.
Of the Group’s and the parent company’s liquid assets, SEK 0 million (0) comprise frozen funds.
N o t e s t o t h e f i n a n c i a l s t a t e m e n t s 2 0 0 5

66 LATOUR 2005
Note 32. Financial instruments and financial risk management
Book value and fair value of financial assets and liabilitiesThe table below shows book and fair value per type of financial instrument. Financial instruments include securities, derivative instruments, receivables, operating liabilities, leasing obligations and borrowing. For Latour’s part financial instruments are largely market related investments. Listed securities are valued at the latest buying-rate as of the balance sheet date.
Currency swaps and hedging contracts are valued at the forward rate. Translation to SEK is according to listed rates on the balance sheet date. The main difference between book value and fair value arises in the Group’s holdings of participation in associated companies. For other items, the book value largely reflects fair value.
2005 2004 Book Fair Book FairSEK m value value value value
Participation in associated companies 703 1,889 560 1,170Listed shares, administration 7,751 7,751 2,948 7,038Other securities held as fixed assets 155 155 129 146Other long-term receivables 21 21 32 32Listed shares – trading 35 50 33 38Accounts receivable 776 776 699 699Other current receivables 64 64 37 37Unrealised gains, currency derivatives – – – 1Options – – – 19Assets 9,505 10,706 4,438 9,180
Pension provisions 129 129 135 135Long-term loans 8 8 12 12Bank overdraft facilities 12 12 16 16Short-term loans 1,544 1,544 1,917 1,917Advance payments from customers 31 31 15 15Accounts payable 442 442 338 338Other liabilities 87 87 104 104Unrealised gains, currency derivatives 1 1 – –
Liabilities 2,254 2,254 2,537 2,537
Financial risk managementThe Group’s financing operations and management of financial risks is primarily centralised to Group staff. Operations are run in accordance with a finance policy adopted by the board which is characterised by low risk levels. The purpose is to minimise the Group’s capital expense through appropriate financing and effective management and control over the Group’s financial risks.
Hedge accountingLatour uses hedge accounting on forward exchange contracts that hedge cash flows and loans in foreign currency which safeguards net investments abroad. Changes in market values of cash flow hedges are recognised in equity. Accumulated sums in equity are reversed to the income statement in the periods the hedged item affects profits. Profits or losses that stem from a market valuation of derivative instruments attributable to hedges of net investments and which stem from currency differences are recognised in equity.
Currency exposureThe Group’s operations face currency exposure in the form of exchange rate fluctuations. The Group’s currency exposure consists partly of transaction exposure relating to purchases and sales in foreign currency, and partly to translation exposure relating to net investments in foreign subsidiaries and currency rate fluctuations when the profits or losses of foreign subsidiaries are converted to Swedish currency (SEK).
Transaction exposureThe Group’s policy concerning transaction exposure is to hedge 50% of the coming 12 months’ budgeted cash flows. The net effect of currency hedging was SEK –5 m (3), and booked in operating profit/loss.
The net currency flows for the year for Swedish units were distributed as follows:
Currencies (Amounts in SEK m)
NOK 200DKK 66GBP –50USD –21EUR –80Total 115
Given a net transaction exposure that was valid for 2005, and without hedging measures, profits would be affected negatively by SEK 1 m if the Swedish crown had been strengthened by one percentage point towards all transaction currencies.
On 31 December 2005 the Group had outstanding hedging contracts distributed in the following currencies and on these maturity dates.
(Amounts in SEK m) 2006 2007 Total
Sell EUR 99 3 102Sell NOK 94 37 131Sell DKK 42 30 72Sell GBP 18 3 21Sell USD 7 – 7Sell CHF 7 – 7Sell PLN 5 – 5
Sell total 272 73 345 Buy JPY –10 – –10Buy USD –7 – –7Buy EUR –5 – –5Buy DKK –1 – –1
Buy total –23 0 –23
Net 249 73 322
The above forward exchange contracts are not included in the balance sheet.The value of hedges not yet taken up as income totalled SEK –1 million (1).
Translation exposureThe need to hedge net assets in foreign subsidiaries is decided on a case-to-case basis and hedges are based on the group-wise value of the net assets. Hedging is done through loans in foreign currency. The loss from hedges in foreign operations amount to SEK –2 m. The amount is reported in the balance item Other reserves in equity.
N o t e s t o t h e f i n a n c i a l s t a t e m e n t s 2 0 0 5

LATOUR 2005 67
Net assets of the foreign subsidiaries’ are allocated as follows:
2005 2004 Amount AmountCurrencies SEK m % SEK m %
EUR 124 49 101 46DKK 64 26 62 28NOK 51 20 56 25GBP 7 3 6 3USD 7 3 3 1CHF 5 2 4 2RON 3 1 3 1PLN –11 –4 –14 –6
Total 250 100 221 100
Exchange rate difference from translation of foreign net assets amounted to SEK 14 m (–2) and is reported in the balance item Other reserves in equity.
Financing risksIn order to reduce the risk of difficulties in procuring capital in the future and refinancing of loans fallen due, the Group has a contracted credit com-mitment of SEK 3,200 m.
The Group’s net financial liabilities, excluding shareholdings and other securities, amounted on 31 December to SEK 1,526 m. Most of the Group’s loans are in SEK with a maturity period of less than one year.
Debt liabilities The Group’s interest-bearing loans had the following maturity schedule on 31 December 2005: 1–5 years >5 years Total
Loans due after more than one year 1 7 8 < 1 month 1–3 months 4–12 months Total
Loans due within one year 505 398 642 1,545
Interest exposureThe Latour Group’s major source of financing is the cash flow from current operations and portfolio management as well as from loans. The loans, which are interest-bearing, expose the Group to interest rate risks.
Interest rate exposure is the risk that interest rate fluctuations will affect the Group’s net interest and/or cash flow negatively. The Group’s financing policy establishes guidelines for setting fixed rates and average loan periods for borrowings. The Group strives to achieve a balance between the estima-ted cost of servicing loans and the risk that major interest rate fluctuations might affect profits negatively. At the end of 2005, the average fixed loan period was about seven months.
The Group does not presently use any form of interest rate derivative. If the interest rate level of Latour’s loan portfolio had been one percen-
tage point higher, profit for the year would have been charged with SEK –17 million.
The average cost for outstanding long and short term borrowing on the balance sheet date: 2005 2004 % Debt % Debt (SEK m) (SEK m)
Long-term borrowing (SEK) 4.9 2 4.7 2Long-term borrowing (DKK) 4.0 6 4.7 10
4.2 8 4.7 12 Short-term borrowing (SEK) 1.9 1,485 2.7 1,860Short-term borrowing (DKK) 2.5 37 2.4 35Short-term borrowing (EUR) 2.4 22 2.5 22
1.9 1,544 2.7 1,917
Credit riskThe Group has limited exposure to credit risks. These risks are primarily related to outstanding accounts receivable. Losses on accounts receivable arise when customers become insolvent or for other reasons fail to meet their payment obligations. The risks are limited through credit insurance policies. Certain businesses even require prepayments. Group management takes the view that there is no significant credit risk concentration in relation to any specific customer or counterparty or in relation to any specific geographic region.
Price riskThe Group is exposed to a price risk concerning shares due to investments held by the Group and which, in the Group’s balance sheet are classified either as available-for-sale financial instruments or assets valued at fair value through profit or loss. The Group is not exposed to any price risk relating to raw and staple materials.
Note 32 cont.
N o t e s t o t h e f i n a n c i a l s t a t e m e n t s 2 0 0 5

68 LATOUR 2005
According to the articles of association for Investment AB Latour, share capital shall be at least SEK 100 m and no more than SEK 400 m. All shares have been fully paid up.
The number of class A shares shall not exceed 155,971,300, the number of class B shares shall not exceed 155,971,300 and the number of class C shares shall not exceed 4,028,700. Class A shares carry ten votes and class B and C shares carry one vote. Class A and class B shares confer upon the holder the same rights to a proportion of company’s assets and profits. The nominal value of each share is SEK 2.50.
Class C shares do not entitle the holder to dividends. If the company decides to make a cash issue and release new class A and B shares, owners of class A and B shares have preferential right to subscribe for new shares of the same type proportionate to the number of shares the shareholder held (primary preferential right).
If the company decides to make a cash issue and issue only shares of class A or class B, all shareholders, regardless whether they hold class A, B or C shares, shall have preferential right to subscribe for new shares proportionate to the number of shares they hold.
In case of an increase in share capital through a bonus issue, new class A and B shares of each class shall be issued in proportion to the number of shares of each type already in existence. Old shares of a given class shall thereby entail a right to new shares of the same type. Class C shares do not entitle the holder to participate in the bonus issue.
Dividends are proposed by the board in accordance with the Companies Act and approved by the Annual General Meeting. The proposed but as yet not approved dividends for 2006 amount to SEK 306 m (SEK 7.00 per share). The sum has not been taken up as a liability.
Note 33. Equity
Shares outstanding Class A Class B Total
Number of shares on 1 January 2005 16,029,125 27,670,875 43,700,000Conversion –6,084,283 6,084,283 0
Total shares outstanding per 31 December 2005 9,944,842 33,755,158 43,700,000 Own shareholdings Class A Class B Total
Share holdings on 1 January 2005 120,000 0 120,000Buyback during the year 0 0 0Conversion –120,000 120,000 0
Total own shareholdings per 31 December 2005 0 120,000 120,000
2005 2004 Own shareholdings Number Cost Number Cost
Accumulated at the beginning of the year 120,000 17 4,203,800 684Buyback during the year 0 0 120,000 17Redemption 0 0 –4,203,800 –684
Accumulated at the end of the year 120,000 17 120,000 17 The nominal value of own shareholdings bought-back during the year amounted on 31 December 2005 to SEK 0.3 million and corresponds to 0.3% of share capital. The transaction costs in connection with the buyback are reported as a deduction from equity. These costs have not affected booked tax costs. Share buybacks were carried out to create additional value for remaining Latour shareholders.
Earnings per share GROUP 2005 2004
Net profit 708 1,000 Average number of outstanding shares 43,700,000 43,745,738 Earnings per share related to profit attributable to parent company shareholders SEK 16.20 SEK 22.86 Latour has no programs that can produce any dilution effect on the share.
Other reserves Translation Fair value GROUP Hedging reserve reserve reserve Total
Opening balance 2004-01-01 0Translation differences for the year –2 –2
Closing other reserves 2004-12-31 0 –2 0 –2
Adjustments for changes in accounting principles 1 4,126 4,127Opening balance 2005-01-01 1 –2 4,126 4,125Translation differences for the year 14 14Available-for-sales financial assets: Revaluation recognised directly in equity 924 924 Recognised in the income statement when divested –213 –213Cash flow hedges Recognised directly in equity –1 –1Net asset hedge –2 –2
Closing other reserves 2005-12-31 –2 12 4,837 4,847
N o t e s t o t h e f i n a n c i a l s t a t e m e n t s 2 0 0 5
1)
1) Tax on amounts recognised directly in equity is SEK 0 m.

LATOUR 2005 69
Note 34. Pension obligations
Nearly all employees in the Latour Group are covered either by defined benefit or defined contribution pension plans. Defined benefit pension plans mean that the employee is guaranteed a pension corresponding to a certain percentage of his or her salary. The pension plans comprise retirement pension, sickness pension and family pension. The pension obligations are secured through provisions in the balance sheet and through premiums to insurance companies which thereby assume the obligations towards the employees. Group employees outside Sweden and Norway are covered by defined contribution pension plans. Fees for these plans normally constitute a percentage of the employee’s salary.
Obligations for retirement and family pensions for white-collar workers in Sweden are largely secured through insurance with Alecta. Since Alecta cannot provide enough information to report the ITP plan as a defined benefit plan it is reported as a defined contribution plan. Fees for the year for pen-sion insurance policies with Alecta amounted to SEK 26 m. Alecta’s surplus can be divided amongst the insurance policy holder and/or the insured. At the end of 2005, Alecta’s surplus in the form of the collective consolidation level was 128.5 %. Pension plans for blue-collar workers in Sweden are defined contribution plans.
For defined benefit plans, the company’s costs and the value of outstand-ing obligations are calculated using actuarial calculations which aim to establish the current value of the obligations undertaken.
If the accumulated actuarial profit or loss on a pension obligation and administration assets exceeds a corridor corresponding to 10% of the high-est either of pension obligations or the market value of the administration assets, the surplus is recorded as profit during the period remaining of employment.
GROUP Provisions for pension obligations 2005 2004
Amount at the close of the previous year 135 142Change of accounting principle – –10Amount at the beginning of the year 135 132Pension costs 8 6Pension payments –4 –3Divestitures (companies) –11 –Redemption 0 0Translation differences 1 –
Closing value 129 135
Defined benefit obligations 2005 2004
Current value at the beginning of the period 135 132Benefits earned during the period 1 0Interest 7 6Pension payments –4 –3Divestitures (companies) –11 –Actuarial profit/loss 0 0Translation differences 1 0
Closing balance 129 135
Administration assets Opening balance 0 0
Closing balance 0 0
Amount reported in the income statement 2005 2004
Benefits earned during the period 1 0Interest on pension provisions 7 6
Cost of defined benefit plans 8 6Costs of defined contribution plans 71 74Special employer’s tax and taxes on yield 14 13
Total pension costs 93 93
Note 35. Taxes Deferred tax in the balance sheet Temporary differences exist where the book value and taxation value differ for a given asset or liability. Temporary differences have resulted in the Group’s overall deferred tax credits and deferred tax liabilities as set out below. GROUP 2005 2004
Deferred tax credits Buildings and land – 1Machinery and equipment – 1Inventories 3 2Receivables 2 2Provisions 2 1Current liabilities 3 2Other items 1 2
11 11Deferred tax liabilities Intangible assets –5 –3Buildings and land –1 –Untaxed reserves –113 –143Provisions – –3Other items –1 –
–120 –149 Deferred tax liabilities, net –109 –138
Deferred tax credits and liabilities are set-off when there is a legal right to set off current tax credits and tax liabilities and when deferred taxes refer to the same tax system.
Temporary differences related to investments in subsidiaries for which deferred tax credits are not recorded: 2005 2004
Temporary differences concerning write-down of participation 65 77
Deferred taxes recognised in equityDeferred tax recognised directly in equity refers to tax on cash flow hedges and amounts to SEK 0 m.
The actuarial calculation of pension obligations and pension costs is based on the following important assumptions:
% 2005 2004
Discount rate 5.0 5.0Anticipated wage increases 3.0 3.0Income base amount 3.0 3.0Pension indexation 2.0 2.0Annual increase of paid-up policy 2.0 2.0Personnel turnover 3.0 3.0Remaining years of service, years 15.6 16.3
N o t e s t o t h e f i n a n c i a l s t a t e m e n t s 2 0 0 5

70 LATOUR 2005
Not 36. Other provisions Guarantee Other GROUP provisions provisions Total
Opening value 2004-01-01 11 4 15Opening value from acquired companies 0 – 0Amounts claimed during the year –5 –1 –6Provisions for the year 5 1 6
Closing value 2004-12-31 11 4 15Amounts claimed during the year –3 –3 –6Provisions for the year 4 – 4
Closing value 2005-12-31 12 1 13 The provisions consist of: 2005 2004
Long-term part 6 4Short-term part 7 11
13 15 Other provisions primarily consist of provisions for restructuring costs.
Note 37. Long-term liabilities GROUP 2005 2004
Liabilities to credit institutions falling due in 1-5 years 1 3Liabilities to credit institutions falling due in >5 years 7 9Long-term non-interest-bearing liabilities 0 0
Total 8 12 For other details concerning long-term liabilities see note 32, Financial instruments.
Note 38. Bank overdraft facilityThe bank overdraft facility available to the Group is SEK 323 m (258) of which SEK 12 m (16) has been used.
Note 39. Accrued expenses and deferred income GROUP 2005 2004
Accrued interest expenses 9 23Accrued social fees 73 76Accrued other wage-related costs 138 148Other items 83 80
Total 303 327
Note 40. Pledged assets GROUP 2005 2004
For own debts Concerning pension provisions – Floating charges 4 4 Concerning long-term liabilities to credit institutions – Floating charges 42 70– Property mortgages 26 31 Other – Floating charges 5 –– Property mortgages 6 2– Other securities 27 31
Total pledged assets 110 138
Note 41. Contingent obligations GROUP 2005 2004
Pension guarantees 1 1Other obligations 11 45
Total 12 46
PARENT COMPANY 2005 2004
Surety given for the benefit of subsidiaries 2,399 2,407Other obligations – 42
Total 2,399 2,449
The parent company has pledged to assume certain obligations that may befall Group companies.
N o t e s t o t h e f i n a n c i a l s t a t e m e n t s 2 0 0 5

LATOUR 2005 71
Note 42. Acquisitions
The acquired companies’ net assets at the time of acquisition
2005 2004
Intangible assets 40 35Tangible assets 21 11Financial assets 1 3Inventories 36 57Accounts receivable 21 39Receivables 2 9Cash 20 1Deferred tax liability –5 0Long-term net borrowing –13 –31Current liabilities –27 –45
Paid purchase price 96 79Acquisition of items not included in cash flow 5 0Liquid funds in acquired companies –20 –1
Total 81 78
Wibe Stegar GroupOn 1 January 2005 the Group acquired 100% of the shares in Wibe Stegar Holding AB. In addition to the parent company the Wibe Stegar Group is comprised of the subsidiaries Wibe Stegar AB and Wibe Stiger AS (Norway). The acquired operations contributed income of SEK 117 m and a net profit of SEK 11 m for the period of 1 January 2005 to 31 December 2005. Book value Fair value Fair value in the company adjustment recorded in the Group
Tangible assets 18 18Intangible assets 3 3Inventories 21 21Accounts receivable 14 14Other receivables 2 2Long-term liabilities –13 –13Deferred tax liability –4 –4Current liabilities –18 –18
Net identifiable assets and liabilities 20 3 23Group goodwill 16Cash regulated purchase price 39Acquisition of provisions not included in cash flow 4Change in Group liquid funds at acquisition 43
Goodwill is attributable to the synergies arising from coordinating the Wibe Group’s sales organisation with the Hand Tools business area’s existing organisation.
TA Ljungberg Patent ABOn 1 July 2005 the Group acquired 100 % of the shares in TA Ljungberg Patent AB. The acquired operations contributed income of SEK 7 m and a net profit of SEK 2 m for the period of 1 July 2005 to 31 December 2005. If the acquisition had taken place on 1 January 2005 the income from the company would have been SEK 11 m and profits for the year SEK 3 m. Book value Fair value Fair value in the company adjustment recorded in the Group
Tangible assets 1 1Intangible assets 1 1Financial assets 1 1Inventories 3 3Accounts receivable 1 1Cash 11 11Deferred tax liability –1 –1Current liabilities –1 –1Net identifiable assets and liabilities 15 1 16Group goodwill 6Cash regulated purchase price 22Acquisition of provisions not included in cash flow 1Acquired cash –11Change in Group liquid funds at acquisition 12
Goodwill is attributable to the synergies arising from coordinating the production and sales organisations with the Hand Tools business area’s existing organisation.
N o t e s t o t h e f i n a n c i a l s t a t e m e n t s 2 0 0 5

72 LATOUR 2005
Note 42 cont.
Tikaskolmio Oy (name changed to Hultafors Oy)On 1 September 2005 the Group acquired 100% of the shares in Tikaskolmio Oy. The acquired operations contributed income of SEK 7 m and a net profit of SEK 0 m for the period of 1 September 2005 to 31 December 2005. It is unclear what the income and profits from the company would have been if the acquisition had taken place on 1 January 2005 since the company previous had a split financial year. Book value Fair value Fair value in the company adjustment recorded in the Group
Tangible assets 1 1Inventories 2 2Accounts receivable 4 4Cash 2 2Current liabilities –5 –5Net identifiable assets and liabilities 4 0 4Group goodwill 1Cash regulated purchase price 5Acquired cash –2Change in Group liquid funds at acquisition 3
Goodwill is attributable to securing the Hand Tools business area’s distribution in Finland.
Nord-Lock OyOn 1 May 2005 the Group acquired 100% of the shares in Nord-Lock Oy. The acquired operations contributed income of SEK 13 m and a net profit of SEK 3 m for the period of 1 May 2005 to 31 December 2005. If the acquisition had taken place on 1 January 2005 the income from the company would have been SEK 18 m and profits for the year SEK 4 m. Book value Fair value Fair value in the company adjustment recorded in the Group
Inventories 2 2Accounts receivable 2 2Cash 7 7Current liabilities –3 –3Net identifiable assets and liabilities 8 0 8Group goodwill 3Cash regulated purchase price 11Acquired cash –7Change in Group liquid funds at acquisition 4
Goodwill is attributable to securing the Engineering Technology business area’s distribution in Finland.
Ameps ABOn 1 October 2005 the Group acquired 100% of the shares in Ameps AB. The acquisition concerned AxFlow AB’s gasket and sealing operations. The acquired operations contributed income of SEK 8 m and a net profit of SEK –1 m for the period of 1 October 2005 to 31 December 2005. It is unclear what the income and profits from the company would have been if the acquisition had taken place on 1 January 2005 since the company was previously part of another company structure. Book value Fair value Fair value in the company adjustment recorded in the Group
Tangible assets 1 1Inventories 8 8Net identifiable assets and liabilities 9 0 9Group goodwill 10Cash regulated purchase price 19Acquired cash 0Change in Group liquid funds at acquisition 19
Goodwill is attributable to the synergies arising from coordinating production and sales organisation with the Engineering Technology business area’s existing organisation.
N o t e s t o t h e f i n a n c i a l s t a t e m e n t s 2 0 0 5

LATOUR 2005 73
Note 43. Subsidiary divestitures 2005 2004
Tangible assets 69 –Long-term receivables 4 –Inventories 90 –Accounts receivable 54 –Other receivables 11 –Cash 14 –Provisions –24 –Long-term net borrowing –67 –Current liabilities –52 –Profit/loss on sale of subsidiaries 13 3
Received purchase price 112 3Items not included in cash flow 12 –Liquid funds in divested company –14 –
Total 110 3
The Textiles business area has sold the craft operations in Almedahls AB together with shares in the Norwegian AS Knappehuset. The operations’ combined turnover was SEK 200 m. Almedahl-Kinna AB, with a turnover of SEK 185 m, was sold to the Finnish Domicet Oy. At the end of the year an agreement was signed to sell Holma-Helsingland AB to company manage-ment with the take over date 1 January 2006. Turnover in Holma-Helsingland was SEK 30 m. Almedahls AB’s property in Dalsjöfors was sold in December. The divestitures have had a positive effect of SEK 10 m on Group profit.
Note 44. Government grants
Government grants have affected the Group’s income statement and balance sheet as follows: 2005 2004
Grants that affected profit for the year 3 3Grants that affected assets 8 1Grants that affected liabilities 1 1 Grants are primarily relocation grants and grants for handicapped employees.
Note 45. Events after the balance sheet dateAutotube AB, i.e. the Automotive business area, acquired HordaGruppen Vätterleden AB, take over date 1 April 2006, with a turnover of SEK 160 m. HordaGruppen is a total supplier of polyurethane material and provides com-ponents and systems of injection moulded plastic and rubber, blow-mould plastic, mandrel vulcanised rubber pipes and polyurethane foam products. Considerable investments have been made primarily in 3D blow moulding of heatproof material during the past few years. The new 3D technology has generated significant new order intake from the Swedish and foreign automotive industry. Through the acquisition business area turnover will increase to around SEK 600 m.
On 1 March 2006 an agreement was signed in the Engineering Technology business area to acquire Brickpack AB with the take over date of 1 May 2006. Brickpack develops, manufactures and markets gaskets, sealings and washers to seal, insulate, dampen, absorb and fill the space between two surfaces. Brickpack is located in Laholm and has a turnover of SEK 62 m and 54 employees. The acquisition supplements the Engineering Technology business area’s current gasket and sealing operations, which mainly consists of after sales products, with its own operations for the OEM market. This acquisition, together with the previously acquired AxFlow AB’s gasket and sealing operations (Ameps AB), creates the leading Nordic region supplier of gaskets and sealings with a turnover of around SEK 200 m annually.
N o t e s t o t h e f i n a n c i a l s t a t e m e n t s 2 0 0 5

74 LATOUR 2005
In order to prepare the accounts according to good accounting practice, Group management and the board of directors must make estimations and assessments which affect the asset and liability items, respectively balance and income statement items, reported in the annual accounts, as well as reported information in general, for example contingent liabilities. These assessments are based on historic experience and the various assumptions that Group management and the board of directors consider plausible under existing circumstances. In cases where it is not possible to ascertain the book value of assets and liabilities through information from other sources these estimations and assumptions form the basis of the valuation. If other assumptions are made or other circumstances influence the matter can the actual outcome differ from these assessments.
Particularly in the areas of income accounting and doubtful receivables, valuing intangible and fixed assets, restructuring measures, pension obligations, taxes, disputes and contingent liabilities can assessments have a significant effect on Latours’ profits and financial position (see each note respectively).
Group management has discussed the development and selection of, and information concerning, the Group’s critical accounting principles and estimations, as well as their application and estimations with the auditing committee.
Assessing the need to write-down goodwillGoodwill is subject to annual impairment test according to the accounting principle described in note 2. The recovery value for cash generating units is determined by calculating value of use. To make these calculations certain estimations must be made (note 18).
If the estimated discount interest before tax used as a discounting factor for cash flows had been 1 percentage point higher than management’s assumption the Group would still not have had to write-down the book value of goodwill.
Income taxThe Group is required to pay taxes in several countries. Extensive assess-ments are required in order to determine provisions for income taxes. There are many transactions and calculations in which end tax is uncertain at the moment the transactions and calculations are made.
Foreign currency exposureChanges in exchange rates can have a rather significant effect on the company in general. An analysis of foreign currency exposure as well as risks connected to changes in exchange rates is presented in note 32.
Note 46. Important estimations and assessments
Pension obligations The current value of pension obligations depends on a number of factors that are established on an actuary basis with the help of a number of assumptions. Included in the assumptions used to determine the net cost (income) of pensions are long-term returns on current administration assets and discount interest. Every change in these assumptions will have an affect on the book value of pension obligations.
Assumptions on anticipated returns on administration assets are determined in a uniform manner and take into consideration historical long-term returns, the allocation of assets and assessments of future long-term returns.
The Group establishes appropriate discount interest rates at the end of every year. This is the interest used to determine the current value of estimated future payments that are assumed necessary to pay for pension obligations. The Group bases the discount interest rate on first class corporate bonds expressed in the currency the remuneration will be paid in and with the same maturity period as the obligations in question.
Other important actuarial assumptions concerning pension obligations are based in part on current market conditions. Further details are given in note 34.
WarranteesManagement in each subsidiary estimates necessary reserves to guarantee future warrantee demands based on information concerning historical warrantee demands as well as current trends which can signal that historical information can differ from future demands.
Among the factors that can affect information concerning warrantee demands is the success of the Group’s productivity and quality initiative as well as the cost of labour and parts.
Write-downs of available-for-sale financial assets Extensive assessments by the Group are necessary to determine whether an instrument has decreased in value other than temporarily. To make this assessment the Group analyses, among other factors, how long and to what extent the fair value of an instrument is lower than its acquisition value as well as the financial condition and short-term business outlook of the investment object, including such factors as trade and sector profitability, changes in technology and operating and financial cash flows.
N o t e s t o t h e f i n a n c i a l s t a t e m e n t s 2 0 0 5

LATOUR 2005 75
Note 47. Transition to IFRS
Adjustment of profit/loss for the year 2004 according to IFRSs SEK m Swedish accounting IAS 1 IFRS 3 IAS 28 IFRSs
Net turnover 4,434 4,434Cost of goods sold –3,380 17 –3,363
Gross profit 1,054 0 17 0 1,071
Sales expenses –620 2 –618Administration costs –235 –235Other operating income 67 67Other operating expenses –43 –43
Operating profit 223 0 19 0 242
Result from participation in associated companies –40 20 6 –14Result from portfolio management 893 893
Result before financial items 1,076 0 39 6 1,121
Interest income and similar profit items 10 10Interest expenses and similar loss items –66 –66
Profit after financial items 1,020 0 39 6 1,065
Taxes –62 –2 –64Minority share –1 1 0
Profit for the year 957 1 37 6 1,001
Starting 1 January 2005 Latour follows international accounting standards, International Financial Reporting Standards (IFRSs) in accordance with EU regulations. All financial reports from 1 January 2005 on are therefore pre-pared according to IFRSs. IFRSs is also followed retroactively on comparable data from 2004 with the exception of reports on financial instruments (IAS 32 and 39). The transition to IAS 32 and 39 took place on 1 January 2005 and therefore information from the comparable year concerning financial instruments is presented according to prior accounting principles. Latour uses hedging accounting according to IAS 39.
The financial tables are arranged according to IAS 1 from 1 January 2005. This means, among other things, that profit/loss for the period in the income statement and equity in the balance sheet include minority shares. In addition, the concept Remaining provisions no longer exists. These items are now recorded as part of Long-term or Current liabilities.
The financial reports are prepared according to the IFRS principles app-lied on 31 December 2005. IFRS is subject to ongoing review and approval by the EU, and consequently changes may still arise.
N o t e s t o t h e f i n a n c i a l s t a t e m e n t s 2 0 0 5

76 LATOUR 2005
Adjustments to the balance sheet in accordance with IFRSs Opening balance, Ongoing during 2004 04-12-31 05-01-01SEK m 04-12-31 IAS 1 IFRSs 3 IAS 28 according to IFRSs IAS 39 according to IFRSs
ASSETS Fixed assets Intangible fixed assets Trademarks, licences 10 5 15 15Goodwill 97 15 112 112Tangible assets 754 754 754Financial assets – –Participation in associated companies 534 20 6 560 560Listed shares 2,948 2,948 4,090 7,038Other investments held as fixed assets 129 129 17 146Deferred tax credits 11 11 11Other long-term receivables 32 32 32
4,515 0 40 6 4,561 4,107 8,668Current assets Inventories 826 826 826Listed shares 33 33 33Receivables 819 819 819Derivative instruments – 0 1 1Other financial assets valued at fair value through profit or loss – 0 19 19Cash and bank balances 162 162 162
1,840 0 0 0 1,840 20 1,860
Total assets 6,355 0 40 6 6,401 4,127 10,528 EQUITY AND LIABILITIES
Equity Share capital 110 110 110Share buyback – –17 –17 –17Other reserves 325 –327 –2 4,127 4,125Profit brought forward 1,919 1,301 37 6 3,263 3,263Profit for the year 957 –957 0 0
3,311 0 37 6 3,354 4,127 7,481Minority interests 2 2 2
Total equity 3,311 2 37 6 3,356 4,127 7,483 Minority interests 2 –2 – –Provisions Provisions for pensions 135 –135 – –Provisions for taxes 146 –146 – –Other provisions 15 –15 – –
296 –296 0 0 0 0 0Long-term liabilities Pension obligations – 135 135 135Deferred tax liabilities – 146 3 149 149Other provisions – 4 4 4Interest-bearing liabilities 12 12 12Interest-free liabilities 0 0 0
12 285 3 0 300 0 300Current liabilities Bank overdraft facilities 16 16 16Liabilities to credit institutions 1,917 1,917 1,917Advance payments from customers 15 15 15Accounts payable 338 338 338Tax liabilities 17 17 17Other provisions – 11 11 11Other financial liabilities – – –Other liabilities 104 104 104Accrued expenses and deferred income 327 327 327
2,734 11 0 0 2,745 0 2,745
Total equity and liabilities 6,355 0 40 6 6,401 4,127 10,528
Key ratios:Return on equity 32% 33% 14%Return on total capital 19% 19% 11%Equity ratio 52% 52% 71%Net debt/equity ratio 24% 24% 24%
Note 47 cont.
N o t e s t o t h e f i n a n c i a l s t a t e m e n t s 2 0 0 5

LATOUR 2005 77
IFRSs effect on equity Bought- Restricted/ Unrestricted Share back Other reserves/Profit Minority Group capital shares reserves brought forward interests Total
Equity according to Swedish accounting principles 2004-12-31 110 0 325 2,876 – 3,311Reclassification according to IAS 1 –17 –327 344 0Minority interests in equity according to IAS 1 2 2Goodwill depreciation in subsidiaries according to IFRS 3 17 17Goodwill depreciation in associated companies according to IFRS 3 20 20Shares in profits in associated companies according to IFRS 28 6 6
Equity according to IFRSs 2004-12-31 110 –17 –2 3,263 2 3,356Market valuation of market related investments according to IAS 39 4,107 4,107Market value of exchange forward contracts according to IAS 39 1 1Market value of option contracts according to IAS 39 19 19
Equity according to IFRSs 2005-01-01 110 –17 4,125 3,263 2 7,483
IFRS 1 First time adoption of IFRSs The transition to IFRS is reported according to IFRS 1, “First time adoption of International Financial Reporting Standards”. Generally, a company is required to set its accounting principles and apply the same retroactively in order to determine its opening balance according to IFRSs. Certain excep-tions are, however, allowed and Latour has elected to apply the following:– To use IFRS 3, Business Combinations, from the transition date 1
January 2004 onward.– To zero conversion differences from the transition date onward in
accordance with IAS 21, Effects of Changes in Foreign Exchange Rates.– Not recalculate comparable financial information for 2004 according
to the requirements of IAS 39, Financial Instruments: Recognition and Measurement, assumed by the EU. However, comparable financial information was recalculated as of 1 January 2005.
– To apply IAS 19 from the transition date 1 January 2004, which entails, among other things, that actuarial profits and losses arising before this date are recognised against opening equity.
IFRS 3 Operating acquisitionsAccording to IFRS 3, goodwill shall not be depreciated; instead an impairment test is to be carried out annually. Latour’s share of profits from associated companies is also affected when associated companies no longer depreciate their goodwill.
The accounting rules concerning corporate acquisitions bring about rela-tively large changes in the manner of accounting for corporate acquisitions. A more detailed division of the purchase sum consideration is to be provided where values are assigned to several intangible assets being acquired, such as customer relations, trademarks, patents etc. In addition, the useful life of these assets shall be assessed and depreciated according to plan.
IAS 1 Arrangement of financial reportsAccording to IAS 1, minority interest is a separate component of equity in the balance sheet. In the income statement, it is included as part of net income.
IAS 28 Holdings in associated companiesLatour reports holdings in associated companies according to the share of capital method. When associated companies’ accounts are converted to IFRSs it affects Latour’s recorded participation in these companies.
IAS 39 (IAS 32) Financial instrumentsFinancial instruments include securities, derivative instruments, receivables, operating liabilities, leasing obligations and borrowing. Latour’s financial instruments are largely market related investments. The recommendation specifies that financial instruments are valued to fair value in the annual accounts. Listed securities are valued at the latest buying-rate (previously latest price paid) on the balance sheet date.
Note 47 cont.
N o t e s t o t h e f i n a n c i a l s t a t e m e n t s 2 0 0 5
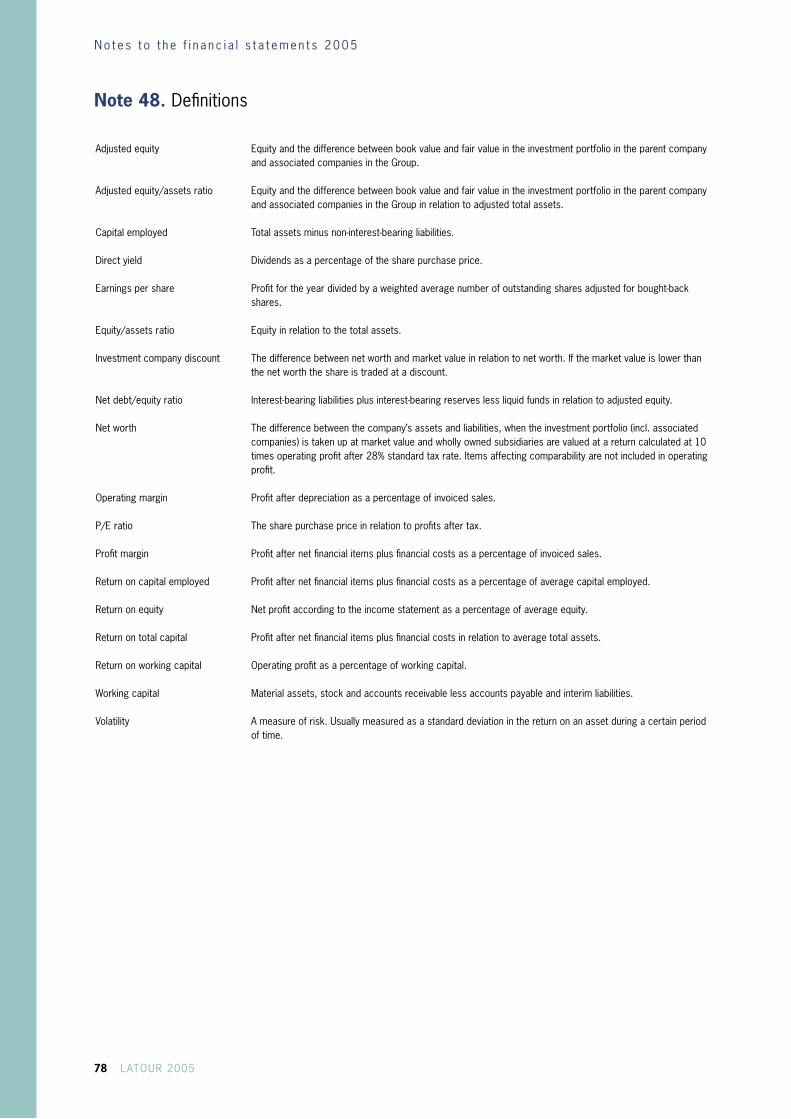
78 LATOUR 2005
Adjusted equity Equity and the difference between book value and fair value in the investment portfolio in the parent company and associated companies in the Group.
Adjusted equity/assets ratio Equity and the difference between book value and fair value in the investment portfolio in the parent company and associated companies in the Group in relation to adjusted total assets.
Capital employed Total assets minus non-interest-bearing liabilities.
Direct yield Dividends as a percentage of the share purchase price.
Earnings per share Profit for the year divided by a weighted average number of outstanding shares adjusted for bought-back shares.
Equity/assets ratio Equity in relation to the total assets.
Investment company discount The difference between net worth and market value in relation to net worth. If the market value is lower than the net worth the share is traded at a discount.
Net debt/equity ratio Interest-bearing liabilities plus interest-bearing reserves less liquid funds in relation to adjusted equity. Net worth The difference between the company’s assets and liabilities, when the investment portfolio (incl. associated
companies) is taken up at market value and wholly owned subsidiaries are valued at a return calculated at 10 times operating profit after 28% standard tax rate. Items affecting comparability are not included in operating profit.
Operating margin Profit after depreciation as a percentage of invoiced sales. P/E ratio The share purchase price in relation to profits after tax. Profit margin Profit after net financial items plus financial costs as a percentage of invoiced sales. Return on capital employed Profit after net financial items plus financial costs as a percentage of average capital employed. Return on equity Net profit according to the income statement as a percentage of average equity. Return on total capital Profit after net financial items plus financial costs in relation to average total assets. Return on working capital Operating profit as a percentage of working capital. Working capital Material assets, stock and accounts receivable less accounts payable and interim liabilities.
Volatility A measure of risk. Usually measured as a standard deviation in the return on an asset during a certain period of time.
Note 48. Definitions
N o t e s t o t h e f i n a n c i a l s t a t e m e n t s 2 0 0 5

LATOUR 2005 79
The board is of the opinion that the proposed dividend is justifiable with regard to the demands that operations impose on the size of equity taking into consideration the scope and risks of the business and with regard to the company’s and Group’s financial strength, liquidity and overall position.
No amount in the parent company’s equity on the balance date stemmed from assets and liabilities valued at fair value according 4 Capital 14 a § of the annual Accounts Act.
Group equity includes changes in value amounting to the net sum of SEK 4,837 m.
The following profits are at the disposal of the shareholders’ meeting:
Retained profits SEK 2,589.0 mProfit for the year SEK 377.7 m SEK 2,966.7 m
The number of shares entitling the holder to receive dividends totalled 43,700,000 on 13 March 2006, which does not include bought-back shares. The board and the chief executive officer pro-pose that the profits be disposed of in the following manner:
To shareholders, a dividend of SEK 7.00 per share which totals SEK 305.9 mTo be carried forward SEK 2,660.8 m SEK 2,966.7 m
The income statement and balance sheet will be presented to the Annual General Meeting on 2006-05-10 for adoption.
Gothenburg, 13 March 2006
Gustaf DouglasChairman
Anders Böös Elisabeth Douglas Eric Douglas
Bo Eveborn Fredrik Palmstierna Jan Svensson
Caroline af Ugglas
Our Independent Accountants’ Report was given 21 March 2006.
Öhrlings PricewaterhouseCoopers AB
Lennart Wiberg Olof Enerbäck
Proposed disposition of profits
P ro p o s e d d i s p o s i t i o n o f p ro f i t s

80 LATOUR 2005
To the annual meeting of the shareholders ofInvestment AB Latour (publ)Corporate identity number 556026-3237
We have audited the annual accounts, the consolidated accounts, the accounting records and the administration of the board of directors and the managing director of Investment AB Latour (publ) for the year 2005. The board of directors and the managing director are responsible for these accounts and the administration of the company as well as for the application of the Annual Accounts Act when preparing the annual accounts and the application of international financial reporting standards IFRSs as adopted by the EU and the Annual Accounts Act when preparing the consolidated accounts. Our responsibility is to express an opinion on the annual accounts, the consolidated accounts and the administration based on our audit.
We conducted our audit in accordance with generally accepted auditing standards in Sweden. Those standards require that we plan and perform the audit to obtain reasonable assurance that the annual accounts and the consolidated accounts are free of material misstatement. An audit includes examining, on a test basis, evidence supporting the amounts and disclosures in the accounts. An audit also includes assessing the accounting principles used and their application by the board of directors and the managing director and significant estimates made by the board of directors and the managing director when preparing the annual accounts and consolidated accounts as well as evaluating the overall presentation of information in the annual accounts and the consolidated accounts. As a basis for our opinion concerning discharge from liability, we examined significant decisions, actions taken and circumstances of the company in order to be able to determine the liability, if any, to the company of any board member or the managing director. We also examined whether any board member or the managing director has, in any other way, acted in contravention of the Companies Act, the Annual Accounts Act or the Articles of Association. We believe that our audit provides a reasonable basis for our opinion set out below.
The annual accounts have been prepared in accordance with the Annual Accounts Act and give a true and fair view of the company’s financial position and results of operations in accordance with generally accepted accounting principles in Sweden. The consolidated accounts have been prepared in accordance with international financial reporting standards IFRSs as adopted by the EU and the Annual Accounts Act and give a true and fair view of the group’s financial position and results of operations. The statutory administration report is consistent with the other parts of the annual accounts and the consolidated accounts.
We recommend to the annual meeting of shareholders that the income statements and balance sheets of the parent company and the group be adopted, that the profit (loss) of the parent company be dealt with in accordance with the proposal in the administration report and that the members of the board of directors and the managing director be discharged from liability for the financial year.
Göteborg 21 March 2006
Öhrlings PricewaterhouseCoopers AB
Lennart Wiberg Olof Enerbäck Authorized Public Accountant Authorized Public Accountant
Audit report
A u d i t re p o r t

LATOUR 2005 81
Annual General MeetingThe Annual General Meeting must be held within six months after the end of the financial year. The Annual General Meeting can be held in Gothenburg or Stockholm. All shareholders recorded in the registered list of sharehold-ers before the Annual General Meeting and who have announced their intention to attend have the right to participate and vote for their entire shareholdings.
Nominating processThe Annual General Meeting selects board members for a one-year term. Starting with the Annual General Meeting of 2006 the nominating committee will provide a proposal concerning the election of the chairman and the other members of the board, remuneration to the board and, if necessary, remuneration for committee work to the Annual General Meeting. The nominating committee, which was appointed by the Annual General Meeting of 2005, consists of Gustaf Douglas (chairman), Henric Ankarcrona and Björn Karlsson. None of them have received any remunera-tion for their participation in the nominating committee.
Board of directorsThe board consists of eight members, including the chief executive officer. There are no deputies. All members are elected for a one-year term. Except for the chief executive officer no members have a position or assignment in the Group. The secretary of the board is the chief financial officer of the Group. Previously the board elected the chair-man but starting with the Annual General Meeting 2006 the chairman will be appointed by the Annual General Meeting. The members of the board represent 84 percent of the voting shares in the company and 77 percent of its share capital. Employees are represented in the subsidiary Latour Industrier AB, which is the parent company of the wholly owned companies in the industrial and trading business seg-ment. They are therefore not represented in the investment company’s board.
A presentation of the board is given on page 83.The board annually adopts a work program that
regulates board meetings, matters that must be put before the board at these meetings, the division of responsibility between the board and the chief executive officer as well as certain other matters. Instructions to the chief executive officer stipulate his duties and reporting responsibilities to the board.
The board has had four ordinary meetings during the year as well as a telephone meeting and a per capsulam meeting. All the members of the board have been present
Corporate Governance
on every occasion. The company’s auditors attended two board meetings and provided reports and observations from the audits performed. The auditors attended one meeting without Group management in attendance. Among the matters dealt with by the board are strategic changes in portfolio investments, acquisitions and divestitures of sub-sidiaries, budgets and forecasts for the subsidiaries as well as financial follow-up of operations.
The chairman of the board has also made sure that dur-ing the year an evaluation of the board’s work was carried out and that all board members have expressed their views.
CommitteesThe board has appointed a remuneration committee, which consists of Gustaf Douglas (chairman) and Caroline af Ugglas, and an auditing committee which consists of the entire board except the chief executive officer.
The auditing committee has met twice and all members as well as the auditors were present. Financial risks and the focus of auditing were discussed, among other things. In addition, there has been a follow-up of the Group’s applica-tion of the new accounting standard regarding IFRSs.
The remuneration committee has held two meetings. The committee presents proposals to the board concerning remuneration to the chief executive officer and supports him in determining remuneration to the other key execu-tives.
Remuneration to the chief executive officer consists of a fixed and a variable portion, of which the variable portion is based on achieved individual goals. Remuneration to other key executives also consists of a basic salary and a fixed key ratio based variable portion. The variable portion is maxim-ised to a certain number of monthly wages.
AuditorsÖhrlings PricewaterhouseCoopers was selected at the Annual General Meeting of 2004 as auditors with Lennart Wiberg as authorised auditor. Lennart Wiberg has led auditing since 2000 and is also auditor for, among others, AB Fagerhult and Rederi AB Transatlantic. He has no other assignments in companies that are closely related to Latour’s largest owner or the chief executive officer.
The auditor has personally reported to the board con-cerning auditing and internal control of the Group at the board meetings in December 2005 and March 2006.
C o r p o r a t e G o v e r n a n c e 2 0 0 5

82 LATOUR 2005
Group managementLatour’s industrial and trading companies are divided into eight business areas, which also comprise legal structures. The investment portfolio is managed by the parent company, Investment AB Latour. The subsidiary Latour Industrier AB is a management company and the parent company of all the business areas mentioned above. Other subsidiaries to Investment AB Latour are Nordiska Industri AB which operates as a management company and the Group’s internal bank as well as Karpalunds Ångbryggeri AB, where share trading takes place.
Group management consists of the chief executive officer and the chief financial officer. The business area managers lead operations in the operating parent companies that own shares in the underlying companies and are responsible for business areas profits and management. The Group’s business organisation is built on decentralisation of respon-sibility and authority. The business areas are responsible for developing their own operations and for meeting financial targets that include the return on capital employed, capital binding and operating margins.
A presentation of the business areas is found on pages 12–27.
Internal control relating to financial reportingInternal control relating to financial reporting is based on a control environment that includes the organisation, the decision-making process, authority and responsibility and which has been documented and communicated in management documents. An example of this is the division of responsibility between the board and the chief executive officer as well as instructions for authorisation rights and accounting and reporting instructions.
The risks identified concerning financial reporting are managed by the Group’s control structure. Latour has implemented a special procedure for control of IFRSs regulations.
Control documents have been produced to promote completeness and correctness in the financial reports and have been communicated to appropriate staff. Follow-up of effectiveness and implementation takes place through programmed controls and procedures for personnel. The Group has a common report system in which all reporting
is done. Group management regularly visits the subsidiar-ies where they go through financial reporting and develop controller operations.
The board receives monthly financial reports and the Group’s financial situation is discussed at every board meet-ing.
During 2006 a new study will be carried out to chart the need for further internal control and to see if there is any-thing lacking in the reporting system. Necessary measures will then be implemented.
Applying the Swedish Code of Corporate GovernanceLatour applies the Swedish Code of Corporate Governance with the following exceptions.
The majority of the nominating committee are members of the company’s board and its chairman is also the chair-man of Latour’s board. This is because it is only natural that the major owner is represented in the nominating commit-tee and at the same time the number of members ought to be limited. It is also natural that the owner with the largest number of votes is the chairman of the nominating com-mittee.
No particular affirmation from the board and the chief executive officer has been included in the Annual Report since matters of responsibility are regulated in detail in the Company Act and an affirmation is therefore considered superfluous.
According to the definition in the Code the majority of Latour’s board members are not independent. However, the board does not believe there is any dependency relationship in cases where a member has had a position for more than twelve years. On the contrary there is a very good argument for the positive effect of long experience of operations and continuity.
The special auditing function in the form of internal auditing does not exist in the Latour Group. Discussions with the company’s external auditors concerning the focus of auditing as well as the auditing firm’s extensive organisa-tion, together with the controls made by Group manage-ment and the existing control functions in the business areas, are considered to be an acceptable level.
C o r p o r a t e g o v e r n a n c e 2 0 0 5

LATOUR 2005 83
Board of Directors
Gustaf Douglas b 1938, M.B.A, Harvard Business School. Entrepreneur since 1980. Chairman of the Board. Owns with family Förvaltnings AB Wasatornet (principal owner of Latour). Chair-man of the Board of Boxholms Skogar AB and SäkI AB. Vice Chairman of Securitas AB. Member of the boards of ASSA ABLOY AB, the Moderate Party of Sweden and Stiftelsen Svenska Dagbladet.Chairman of Latour’s board from 1985-1991 and since 1993.Shares in Latour: 50,000 A and 105,000 B, through various family-owned companies 8,001,000 A, 24,231,500 B
Anders Böös b 1964 Previously MD of Drott AB and Hagströmer & Qviberg AB. Chairman of the Board of IFS AB and member of the boards of Hag-strömer & Qviberg AB and Explorer Property Fund.Member of Latour’s board since 2005.
Elisabeth Douglas b 1941 University studies at Sorbonne, Paris, France, university studies at the University of Stock-holm. Entrepreneur.Member of Latour’s board since 1987, Chairman 1991-1993.Shares in Latour: 30,000 A and 280,000 B
Eric Douglas b 1968 Economic college graduate and 3 years studies at the University of Lund in “Economy for Entrepre-neurs”. Partner in Pod Holding. Member of the boards of AB Fagerhult, LinkTech AB and SWECO AB.Member of Latour’s board since 2002.Shares in Latour: 50,000 A and 60,000 B
Bo Eveborn b 1942 Bachelor of Science (Econ.) Previously MD of AB Fagerhult. Member of the boards of Närkes Elektriska AB, Swegon AB and Jönköpings University School of Health Sciences. Member of Latour’s board since 2002.Shares in Latour: 7,500 B (Bo Eveborn and family)
Fredrik Palmstierna b 1946 Bachelor of Science (Econ.) M.B.A. MD of SäkI AB. Member of the boards of Securitas AB, Bravida, Attendo, AB Fagerhult and Hultafors AB.Member of Latour’s board from 1985-87 and since 1990.Shares in Latour: 600,720 A and 219,730 B (Fredrik Palmstierna with family and company)
Jan Svensson b 1956. Mechanical engineer and Bachelor of Science (Econ.). CEO. Member of the boards of Munters AB and ProstaLund AB. CEO and mem-ber of Latour’s board since 2003.Shares in Latour: 4,000 B (Jan Svensson and family)
Caroline af Ugglas b 1958. Bachelor of Science (Econ.) at the University of StockhomHead of equities and corporate governance at Livförsäkrings AB Skandia. Member of the board of Skandia Media Invest SMI AB.Member of Latour’s board since 2003.Shares in Latour: 300 A and 800 B
AccountantsÖhrlings PricewaterhouseCoopers AB
Lennart Wiberg, Authorised Public AccountantOlof Enerbäck, Authorised Public Accountant
Group management
Jan Svensson b 1956 Mechanical engineer and Bachelor of Science (Econ.) Chief Executive Officer since 2003.Shares in Latour: 4,000 B (with family)
Tore Åberg b 1942. Bachelor of Science (Econ.). Chief Financial Officer since 1987.Shares in Latour: 12,400 B
B o a rd o f D i re c t o r s 2 0 0 5

84 LATOUR 2005
Investment AB LatourHeadquarters:J A Wettergrens gata 7P.O. Box 336SE-401 25 GöteborgTelephone +46 31 89 17 90Telefax +46 31 45 60 [email protected]
Mäster Samuelsgatan 1P.O. Box 7158SE-103 88 StockholmTelephone +46 8 679 56 00Telefax +46 8 611 31 06
Nordiska Industri ABJ A Wettergrens gata 7P.O. Box 336SE-401 25 GöteborgTelephone +46 31 89 17 90Telefax +46 31 45 60 63
AUTOMOTIVE
Autotube ABSusvindsvägen 28P.O. Box 1114SE-432 15 VarbergTelephone +46 340 62 86 00Telefax +46 340-62 86 [email protected]
Hester IndustriområdeSE-523 90 UlricehamnTelephone +46 321 287 00Telefax +46 321 287 [email protected]
FILTERS
IF Luftfi lter ABHemvägen 17P.O. Box 655SE-441 18 AlingsåsTelephone +46 322 780 00Telefax +46 322 780 01info@luftfi lter.comwww.luftfi lter.com
IndustrigatanP.O. Box 44SE-570 60 ÖsterbymoTelephone +46 381 607 00Telefax +46 381 608 62
IF Luftfi lter ASStanseveien 28Postboks 121 KalbakkenNO-0902 OsloNorgeTelephone +47 23 33 82 22Telefax +47 23 33 82 20norge@luftfi lter.comwww.luftfi lter.com
Addresses
Luftfi lter ASEgegårdsvej 32 - 34DK-2610 RødovreDanmarkTelephone +45 36 36 99 88Telefax +45 36 36 99 92salg@luftfi lter.comwww.luftfi lter.com
IF Luftfi lter Oy ABMunkkullavägen 1FI-02400 KyrkslättFinlandTelephone +358 9 22 19 81Telefax +358 9 22 19 82 00 info@luftfi lter.fi www.luftfi lter.fi
HAND TOOLS
Hultafors ABSE-517 96 HultaforsTelephone +46 33 23 74 00Telefax +46 33-23 74 [email protected]
WIBE Stegar ABTelegatan 6P.O. Box 145SE-571 22 NässjöTelephone +46 380 55 68 00Telefax +46 380 141 [email protected]
Hultafors Norge ASStanseveien 28 BNO-0976 OsloNorgeTelephone +47 23 33 82 70Telefax +47 23 33 82 [email protected]
Hultafors Danmark ASVibevej 23DK-2400 Köpenhamn NVDanmarkTelephone +45 38 34 16 00Telefax +45 38 34 16 46
Hultafors OySmåindustrivägen 3PB 222FI-06101 BorgåFinlandTelephone +358 19 54 96 00Telefax +358 19 54 96 [email protected] www.hultafors.fi
Hultafors Präsident GmbHIm Meisenfeld 26DE-32602 Vlotho-ExterTysklandTelephone +49 5228 9571 0Telefax +49 5228 9571 [email protected]
Hultafors UMI SrlP.O. Box 830RO-2400 SibiuRumänienTelephone +40 269 21 37 71Telefax +40 269 21 37 [email protected]
HYDRAULICS
Specma Hydraulic ABJ A Wettergrens gata 7P.O. Box 164SE-401 23 GöteborgTelephone +46 31 89 17 00Telefax +46 31 45 77 [email protected]
Industrigatan 10SE-312 75 VåxtorpTelephone +46 430 302 70Telefax +46 430 308 [email protected]
Specma Hydraulic Nord ABGesällvägen 3P.O. Box 190SE-891 24 ÖrnsköldsvikTelephone +46 660 29 50 30Telefax +46 660 133 [email protected]
Eurobend ABHantverksgatan 3SE-514 32 TranemoTelephone +46 325 188 70Telefax +46 325 771 [email protected]
Specma Component ABSvedjevägen 10SE-931 36 SkellefteåTelephone +46 910 73 32 00Telefax +46 910 73 32 [email protected]
WiroArgonic ABDynamovägen 7P.O. Box 247SE-591 23 MotalaTelephone +46 141 520 20Telefax +46 141 565 [email protected]
Hymat OyVantinmäentie 1FI-02780 EspooFinlandTelephone +358 20 7509 200Telefax +358 20 7509 [email protected] www.hymat.fi
Kaskimäenkatu 3FI-33900 TampereFinlandTelephone +358 20 7509 360Telefax +358 20 7509 361
Ruunikkokatu 13FI-20380 TurkuFinlandTelephone +358 20 7509 340Telefax +358 20 7509 341
AIR TREATMENT
Swegon AB Frejgatan 14P.O. Box 300SE-535 23 KvänumTelephone +46 512 322 00Telefax +46 512 323 [email protected]
Industrigatan 5SE-273 35 TomelillaTelephone +46 417 198 00Telefax +46 417 198 99
P.O. Box 979SE-671 29 ArvikaTelephone +46 570 844 40Telefax +46 570 175 40
Swegon ASStanseveien 28NO-0976 OsloNorgeTelephone +47 23 33 82 00Telefax +47 23 33 82 50fi [email protected]
Swegon ASGjellerupvej 84DK-8230 ÅbyhøjDanmarkTelephone +45 86 17 00 11Telefax +45 86 17 01 [email protected]
Swegon OyMunkkullavägen 1FI-02400 KyrkslättFinlandTelephone +358 9 221 982 10Telefax +358 9 221 982 [email protected] www.swegon.fi
Swegon LtdEssex House, Astra CentreEdinburgh Way HarlowGB - CM20 2BNTStorbritannienTelephone +44 12 79 41 60 87Telefax +44 12 79 41 60 [email protected]
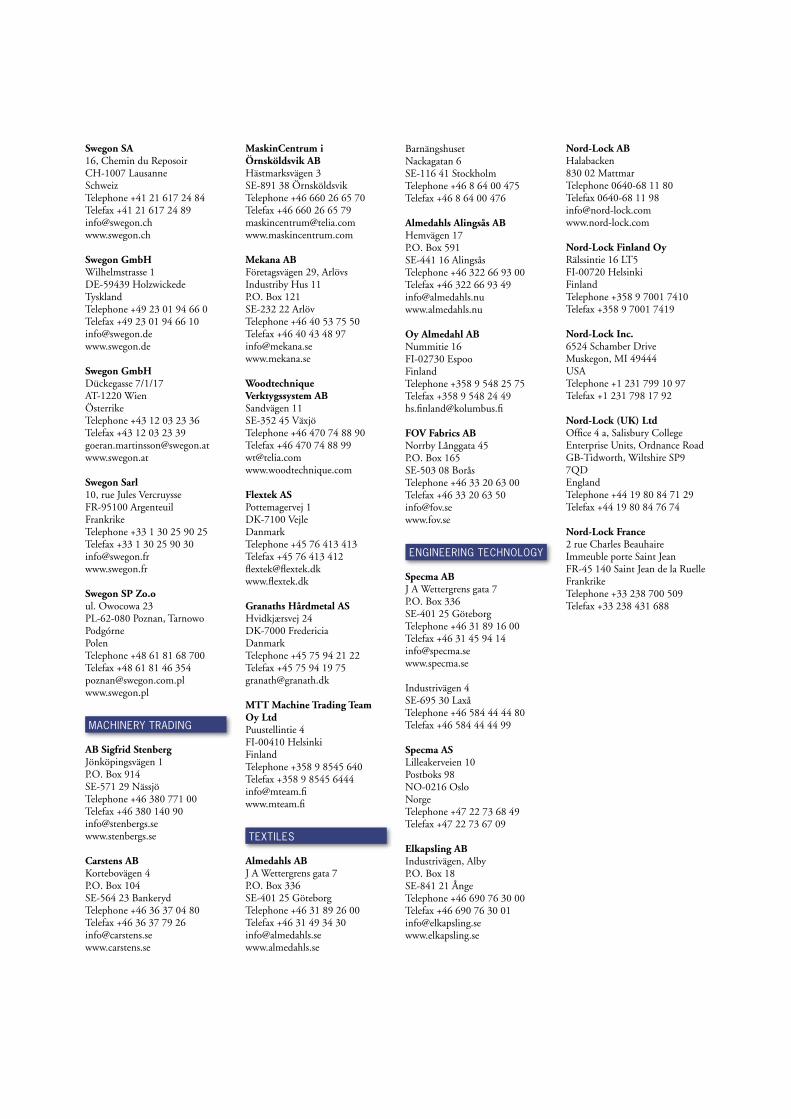
Swegon SA16, Chemin du ReposoirCH-1007 LausanneSchweizTelephone +41 21 617 24 84Telefax +41 21 617 24 [email protected]
Swegon GmbHWilhelmstrasse 1DE-59439 HolzwickedeTysklandTelephone +49 23 01 94 66 0Telefax +49 23 01 94 66 [email protected]
Swegon GmbHDückegasse 7/1/17AT-1220 WienÖsterrikeTelephone +43 12 03 23 36Telefax +43 12 03 23 [email protected] www.swegon.at
Swegon Sarl10, rue Jules VercruysseFR-95100 ArgenteuilFrankrikeTelephone +33 1 30 25 90 25Telefax +33 1 30 25 90 [email protected]
Swegon SP Zo.oul. Owocowa 23PL-62-080 Poznan, Tarnowo PodgórnePolenTelephone +48 61 81 68 700Telefax +48 61 81 46 [email protected] www.swegon.pl
MACHINERY TRADING
AB Sigfrid StenbergJönköpingsvägen 1P.O. Box 914SE-571 29 NässjöTelephone +46 380 771 00Telefax +46 380 140 [email protected]
Carstens ABKortebovägen 4P.O. Box 104SE-564 23 BankerydTelephone +46 36 37 04 80Telefax +46 36 37 79 [email protected]
MaskinCentrum i Örnsköldsvik ABHästmarksvägen 3SE-891 38 ÖrnsköldsvikTelephone +46 660 26 65 70Telefax +46 660 26 65 [email protected]
Mekana ABFöretagsvägen 29, Arlövs Industriby Hus 11P.O. Box 121SE-232 22 ArlövTelephone +46 40 53 75 50Telefax +46 40 43 48 [email protected]
Woodtechnique Verktygssystem ABSandvägen 11SE-352 45 VäxjöTelephone +46 470 74 88 90Telefax +46 470 74 88 [email protected]
Flextek ASPottemagervej 1DK-7100 VejleDanmarkTelephone +45 76 413 413Telefax +45 76 413 412fl extek@fl extek.dkwww.fl extek.dk
Granaths Hårdmetal ASHvidkjærsvej 24DK-7000 FredericiaDanmarkTelephone +45 75 94 21 22Telefax +45 75 94 19 [email protected]
MTT Machine Trading Team Oy LtdPuustellintie 4FI-00410 HelsinkiFinlandTelephone +358 9 8545 640Telefax +358 9 8545 [email protected] www.mteam.fi
TEXTILES
Almedahls ABJ A Wettergrens gata 7P.O. Box 336SE-401 25 GöteborgTelephone +46 31 89 26 00Telefax +46 31 49 34 [email protected]
BarnängshusetNackagatan 6SE-116 41 StockholmTelephone +46 8 64 00 475Telefax +46 8 64 00 476
Almedahls Alingsås ABHemvägen 17P.O. Box 591SE-441 16 AlingsåsTelephone +46 322 66 93 00Telefax +46 322 66 93 [email protected]
Oy Almedahl ABNummitie 16FI-02730 EspooFinlandTelephone +358 9 548 25 75Telefax +358 9 548 24 49hs.fi [email protected]
FOV Fabrics ABNorrby Långgata 45P.O. Box 165SE-503 08 BoråsTelephone +46 33 20 63 00Telefax +46 33 20 63 [email protected]
ENGINEERING TECHNOLOGY
Specma ABJ A Wettergrens gata 7P.O. Box 336SE-401 25 GöteborgTelephone +46 31 89 16 00Telefax +46 31 45 94 [email protected]
Industrivägen 4SE-695 30 LaxåTelephone +46 584 44 44 80Telefax +46 584 44 44 99
Specma ASLilleakerveien 10Postboks 98NO-0216 OsloNorgeTelephone +47 22 73 68 49Telefax +47 22 73 67 09
Elkapsling ABIndustrivägen, AlbyP.O. Box 18SE-841 21 ÅngeTelephone +46 690 76 30 00Telefax +46 690 76 30 [email protected]
Nord-Lock ABHalabacken830 02 MattmarTelephone 0640-68 11 80Telefax 0640-68 11 [email protected]
Nord-Lock Finland OyRälssintie 16 LT5FI-00720 HelsinkiFinlandTelephone +358 9 7001 7410Telefax +358 9 7001 7419
Nord-Lock Inc.6524 Schamber DriveMuskegon, MI 49444USATelephone +1 231 799 10 97Telefax +1 231 798 17 92
Nord-Lock (UK) LtdOffi ce 4 a, Salisbury CollegeEnterprise Units, Ordnance RoadGB-Tidworth, Wiltshire SP9 7QDEnglandTelephone +44 19 80 84 71 29Telefax +44 19 80 84 76 74
Nord-Lock France2 rue Charles BeauhaireImmeuble porte Saint JeanFR-45 140 Saint Jean de la RuelleFrankrikeTelephone +33 238 700 509Telefax +33 238 431 688

Investment AB Latour (publ)Reg.no. 556026–3237
J A Wettergrens gata 7, P.O. Box 336, SE-401 25 Göteborg, Telephone +46 31 89 17 90, Telefax +46 31 45 60 63
[email protected], www.latour.se
INVESTMENT AB
LATOUR