14 simulating current and future water resources
TRANSCRIPT

I
11 th year flo 1H 2) May
i Land lise ill Kenay PhD
EnVlronllltntaJ Qpment md Cooperation
lorthern Ethiopia the role
9) DctcymiWis ofAiptitll
~~lr ()lffsmlil~( i Prtl 11 sit1l
011 Scicllce (ESSS) 25-27
1 water institutions in tIle icy Rc((wri 2H 14)-170
em of soil nlltriCllt cleplcshy1a llsing partial versus liJ
den I) (21l1lJ) Institlilional
lWMI Working
fer mui Lwd loirics (Ild ltcr Management in The
the Blne liJe project
III 011 Water dnd Food
cd j illcrshcd Ahaha Ethiopia
Y Ministry of Water
Efi1fopitl final report V
Cofi(ics of tile iii Belsill
ling Jnd MJnagenlent
Jgelll(nt practices and
rvatioll invtSt111tl1ts 111
erving 111
lin iIs 1H 213-247 ervices in and
IJrtDlent World Balik
I Paper 110 42 Center
14
Simulating current and future water resources development in the
Blue Nile River Basin
Matthew P McCartney Tadesse Alemayehu Zachary M Easton and Seleshi B Awulachew
Key messages
Both Ethiopia and Sudan have plans to unilaterally develop the water resources of the mue
Nile for hydropower and irrigation The extent to which these plam will actually be impleshymented is unclear However if both countries totally fulfil their stated obJectives the following are estimated to occur
the total reservoir storage in Ethiopia will increase from the current 116 to more than 167 billion cubic metres (ie more than 3 times the mean annual flow at the Ethiopiamiddot-Sudan border) large-scale irrigation withdrawals in Sudan will increase irom the current 85 to 138 billion m 1 yr large-scale irrigation withdrawals in Ethiopia will increase from the current 026 to 38 billion m and electricity generation in Ethiopia will increase from the current 1383 to 31297 gigavatt h0urS (GWh) yr
Increased Vater storage in dams and greater withdrawals will inevitably alter the now regime of the river and its main tributaries If full development occurs the total flow at the Ethiopia-Sudan border is predicted to decrease from the current (near natural) 451 to 427 billion m yr and at Khartoum from the current 40A to 318 billion m 1 yr However although there is a significant reduction in wet season flow at both locations dry season flow will actually increase because of the greater upstream How regulation By increasing water availability in the dry season and reducing t100ding in the wet season this increased regulashytion promises significant benefits for Sudan There is great potential for increased water resources development in the Blue Nile However ifEthiopia and Sudan continue to implement development unilaterally the beneshyfits of water resources development are unlikely to be fully realized It is tberefore essential that the countries eooperate closely to (i) identifY priority development options (ii) improve irrigation efficiencies (iii) mitigate any adverse impacts (eg to the environment)
269
The Nile River Basin
and (iv) manage water resources in a vay that brings benetlts to all To take full advantage of the water resources of the basin it is necessary that they are managed as a single system (ie without considering national borders) that in turn requires the establishment of much more effective institutional arrangements than those currently existing
Introduction
The Blue Nile River is an important shared resource of Ethiopia and Sudan and also because it is the major contributor of water to the main Nile River Egypt However tensions over the basins water resources remain unresolved Although the riparian countries have agreed to collaborate in principle formal mechanisms to cooperatively develop the basins water resources are limited Currently a Cooperative Framework Agreement (CFA) is being negotishyated but this process has been under way for more than a decade and no final agreement has yet been achieved (Cascao 2009) Recently t1ve of the riparian countries Ethiopia Kenya Itvanda Tanzania and Uganda signed an agreement but both Egypt and Sudan remain opposed to the current version
Under the auspices of the Nile Basin Initiative (NBI) twO primary programmes have been established (i) the basin-wide Shared Vision Program designed to build confIdence and capacshyity across the basin and (ii) the Subsidiary Action Program which aims to initiate concrete investments and action at sub-basin level (Metawie 2004) However both programmes are developing slowly and there are few tangible activities on the ground As a result all riparian countries continue to pursue unilateral plans for development
The potential benetlts of regional cooperation and integrated joint basin management are signiticant and well documented (Whittington et al 2005Jigerskog et aI 2007 Cascao 20(9) A prerequisite for such cooperation is the development of shared knowledge bases and approshypriate analytical tools to support decision-making processes Currently knowledge of the basin is fragmented and inconsistent and there is limited sharing of data and information There is also a lack of analytical tools to evaluate water resources and analyse the implications of differshyent development options These are l1l~or impediments to building consensus on appropriate development strategies and cooperative investments in the basin
A number of computer models have been developed to assess various aspects of hydropower and irrigation potential within the Blue Nile and the wider Nile basins (Guariso and Whittington 1987 Georgakakos 2003 Block et al 2007E1ala 2(08) However these models have focused primarily on the upper Blue Nile in Ethiopia and the development of hydraulic infrastructure on the main stem of the river Relatively little attention has been paid to water diversions and development on the tributaries or future development in Sudan
In this chapter we report the t1ndings of research conducted to determine the impact of current and possible future water demand throughout the whole of the Blue Nile Basin (BNE) The Water Evaluation And Planning (WEAP) model was used to evaluate the water resource implications of existing and proposed irrigation and hydropower development in both Ethiopia and Sudan The current situation and two future development scenarios were simulated one representing a relatively near future (the medirmHerm scenario) and the other a more distant future (the long-term scenario) Since year-to-year variation is important for water management 33 years of monthly time step flow data wer2 used to simulate the natural hydrological variashytion in all the major tributaries The water demands of the scenarios incorporating all existing and planned development on both the main stem and the tributaries were superimposed on these time series However because the planned large reservoirs require considerable time to fill a 20-year warm-up period was used and comparison between the scenarios was made over
270
all To take full advantage lanaged as a single system he establishment of much
Sudan and also because However tensions over COuntries have agreed to velop the basins water It (CFA) is being negotishyd no final agreement has lntries Ethiopia Kenya
5Ypt and Sudan remain
r programmes have been d confidence and capacshyllIUS to initiate concrete r both programmes are I As a result all riparian
t basin management are al 2007 Casdio 2009) vledge bases and approshy
knowledge of the basin d information There is e implications of differshynsensus on appropriate
aspects ofhydropower ~ basins (Guariso and However these models elopment of hydraulic has been paid to water 1 Sudan
termine the impact of Uue Nile Basin (BNB) ate the water resource
ment in both Ethiopia )s were simulated one other a more distant Dr water management ral hydrological variashyorporating all existing ere superimposed on considerable time to
narios was made over
Simulating current and future water resources development in the Blue Nile River Basil
13 years Although necessarily based on many assumptions the work illustrates how a relatively simple model used in conjunction with data from both countries can provide a credible basis for assessing possible future water resources development throughout the basin
In the following section of this chapter the natural characteristics and the current socioshyeconomic situation in the basin as well as the planned water resources development are described The following section describes the WEAP model and its configuration and applishycation to the Blue Nile River Basin through development scenarios Thereafter the results are presented and discussed and fmally some conclusions are drawn
Water availability in the Blue Nile River Basin
Natural characteristics
The Blue Nile River (known as the Abay River in Ethiopia) rises in the Ethiopian Highlands in the region ofWest Gojam and flows northward into Lake Tana which is located at an elevashytion ofjust under 1800 m (Figure 141) It leaves the southeastern corner of the lake flowing first southeast before looping back on itself flowing west and then turning northwest close to the border with Sudan In the highlands the basin is composed mainly of volcanic and PreshyCambrian basement rocks with sl11all areas of sedimentary rocks The catchment is cut by deep ravines through which the major tributaries flow The valley of the Blue Nile River itself is 1300 m deep in places The primary tributaries in Ethiopia are the Bosheilo Welaka Jemma Muger Guder Finchaa Anger Didessa and Dabus on the lefi bank and the North Gojam South Gojam Vombera and Beles on the right bank
The Blue Nile enters Sudan at an altitude of 490 maslJust before crossing the frontier the river enters a clay plain through which it flows to Khartoum The average slope of the river from the Ethiopian frontier to Khartoum is only 15 em km Within Sudan the Blue Nile receives water from two major tributaries draining from the north the Dinder and the Rahad both of which also originate in Ethiopia At Khartoum the Blue Nile joins the White Nile to form the main stem of the Nile River at an elevation of 400 masl The catchment area of the Blue Nile at Khartoum is approximately 311548 km
Within the basin rainfall varies significantly with altitude and is to a large extent controlled by movement of air masses associated with the Inter-Tropical Convergence Zone There is considerable inter-annual variability but within Sudan the mean annual rainfall over much of the basin is less than 500 111m and it is as low as 140 mm at Khartoum In Ethiopia it increases from about 1000 mm near the Sudan border to between 1400 and 1800 111m over parts of the upper basin and exceeds 2000 111m in some places in the south (Awulachew el al 20(8) The summer months account for a large proportion of mean annual rainfall roughly 70 per cent occurs between June and September This proportion generally increases with latitude rising to 93 per cent at Khartoum
Potential evapotranspiration also varies considerably and like rainfall is highly correlated with altitude Throughout the Sudanese part of the basin values (computed using the Penman-Monteith method Monteith 1981) generally exceed 2200 mm yr and even in the rainy season Ouly-October) rainpound111 rarely exceeds 50 per cent of potential evapotranspiration Consequently irrigation is essential for tlIe growth of crops In the Ethiopian Highlands potenshytial evapotranspiration ranges from approximately 1300 to 1700 111111 yr and in many places is less than rainfall in the rainy season Consequently rain-fed cultivation producing a single crop in the rainy season is possible though risky in low rainfall years
The flow of the Blue Nile is characterized by extreme seasonal and inter-annual variability
271
900
33OOE
Legend
RIvers IIIIIIIiIIlakes cJ Sub Basins
Ethro_Sudan border
The Nile River Basin
3OOE 3rOOE
N
A
FiJirl 141 Map of the Blue Nile Basin showing the major tribntaries and sub-basins
SoU(e Yilma and AWllIJchew 2009
12OON
9OON
1t Khartoum annual tlovv varies from approximately 23 billion to 63 billion 111 (Figure 142) Mean monthly flow also varies considerably at all locations along the river (Table 141 Figure 143) Typically IUore than 80 per cent of the flow occurs during the flood season Ouly-October) while only 4 per cent of the flow occurs during the dry season (February-May) (Awlliachew ct lt11 20(8)
Current water resources development
Currently Ethiopia utilizes very little of the Blue Nile water partly because of its inaccessibilshyity partly because the major centres of population lie Oll tside of the basin and partly because to date there has been only limited development of hydraulic infrastructure on the river To date only two relatively minor hydraulic structures (ie Chara Chara weir and Finchaa dam) have been constructed in the Ethiopian part of the catchment (Table 142) These two dams were built primarily to provide hydropower They regulate tlow from Lake Tam and the Finchaa River respectively The combined capacity of the power stations they serve (218 MW) represented approximately 13 per cent of the total installed generating capacity of the country in 2009 (ie 1618 MW of which 95 was hydropower) In 2010 a new power station on the Ueles River came on line (see below) and the total illStaIled capacity increased to 1994 MW
272
a
b
e
rO H
1)0
I-basins
illion 01 (Figure 142)
vel (Table 141 Figure
ing the flood season eaSon (February--May)
use of its inaccessibilshy
in and partly because
cture on the river To eir and Finchaa dam)
42) These two dams
1 Lake Tana and the they serve (21 R MW)
pacity of the country
pOwer station on the Teased to 1994 MW
Simulating current and future water resources development in the Blue Nile River Basin
a 70000
60000
50000
l 40000 6 ~ 30000
u
20000
10000
a 1960 1963 1966 1969 1972 1975 1978 1981 1984 1987 1990
b 70000
60000
50000
E 40000 6 l 0 30000
u
20000
10000
a 1960 1963 1966 1969 1972 1975 1978 1981 1984 1987 1990
FitIJrC 142 Annual low of the I3lue Nile measured at (a) Khartollm (1960-1 ()R2) and the EthIOpia-Sudan border (1 0-] 9(2)
Source Data obtlined from the C]ob] Data Runoff Cemre and Ethiopian Ministry ofWatltr Reourc
Agriculture which is the main occupation of the inhabitants in the basin is primarily raill-ted
with almost no irrigation Although there is some informal small-scale irrigation currently the
only formal irrigation scheme in the Ethiopian part of the catchment is the Finchaa sugar cane
plantation (8145 hal which utilizes WJer after it has passed through the Finchaa hydropower plant (11ble 142)
In contrast to Ethiopia Sudan utilizes signiticant volumes ofBlue Nile water for both irri shy
gation and hydropower production Tvo dams Roseires and Sennar) constructed 011 the
273
The Nile River Basin
Table 141 Meln monthly flow (milhon m ) and run-off (mm) measured at gauging stations located on the main stem and major tributaries of the I31ue Nile River
Lorarhm Ja Fch A1af Apr May J1II1 July AI~~ Sept ()a Nav Dec Am11lt
vrain stem
Lke Tana Flow 203 127 94 70 49 45 114 434 )06 B61 541 332 377(
rull-otf 13 B ( 5 3 2 28 59 56 35 22 247 Kessie- Flow 331 221 227 211 20) 258 3003 6594 30HO 1456 7B8 51)3 16881
run-otf l 3 4 3 ) 4 46 IOU 47 22 12 8 257 Border Flow 94) S45 437 359 446 1175 6293 1550213U68 7045 3105 1709 50612
run-otT 5 3 2 2 2 6 31 7H 65 35 1( lt) 253 Khartoul11 Flow 724 44B 406 427 503 1084 4989 15237 13625 7130 2451 1257 48281
run-otf 3 2 2 2 2 4 18 55 50 26 lt) 5 17(
gtCajor tributaries
Beshcilo Flow 4 4 4 5 14 494 1303 527 74 19 9 2462 rl1n~middotoff I) 0 1 03 04 04 1 37 li8 40 6 1 06 18(
Welaka Flow gt 2 2 3 3 7 261 689 279 39 HI 5 n02 ntnotf IU 113 04 04 04 41 107 44 ( 2 07 203
Jemma Flow 6 5 6 7 7 18 662 1748 7fl7 lilO 25 11 )301
run~otT 04 () 1 04 114 05 1 42 III 45 6 2 ()7 20t)
Muger Flow 1 2 2 ( 268 753 112 44 10 4 14112 run-off (jl 01 (11 1)2 (12 07 33 92 38 5 171
Glldcr Flow () () () (I ) 43 66 50 15 () 1H2 run-off (j () o () () ( lt) 2 01 ( 26
Finchd Flow 45 29 21 lH 16 2() lOB 347 464 409 220 91 1786 run-off 11 7 5 4 4 26 85 113 10(1 54 22 437
Anger Flow 44 25 21 22 37 114 386 717 716 436 141 75 2733 runmiddot-otr () 3 3 3 14 49 91 91 55 18 10 346
Didessa Flow 10) 62 52 54 93 23 958 17H2 1779 1084 352 186 6791 run-otf 6 3 3 3 14 49 91 91 55 Iii 10 346
WOlllbera Flow 72 41 34 35 61 187 632 1176 1174 715 233 123 44H3
run-off 6 3 3 3 14 49 )1 91 55 18 10 346 Dabu Flow 306 155 114 88 14 ~14 534 917 1336 146() 107U 602 6H88
run-off 15 7 5 4 5 10 25 44 h4 69 51 2) 32H North Gojam Flow 6 5 ( 8 8 20 730 1927 779 110 27 U 3()39
runmiddotoff 04 04 04 05 05 1 51 134 54 8 2 2)3
Sourh GOjUl1 Flow 7 6 7 9 () 24 855 2257 913 128 32 15 4262 run-off 04 04 04 05 (16 14 51 135 54 H 2 1 254
Bele Flow 6 2 2 1 2 36 J93 846 637 218 42 12 2195 run-off OA 01 01 0 02 3 2ii (O 45 15 155
Rdhad Flow () () IJ I () 132 342 354 201 26 1056
run-off 0 IJ 0 () () 01 16 41 43 24 1 () 1 128 Dinder Flow ( () () () () 17 291 968 917 37( 34 4 2609
run-otT ( I) 0 0 (I 20 65 62 25 2 02 176
Source BCEOM (1998) with slight modifications based on more reClnt feasibility stuciies of ENTRO (2007) and Sutcliffe and Parks (19)9)
main river approximately 350 and 620 km southeast of Khartoum (Table 142) provide hydropower (primarily tor Khartoum) as well as water for several large irrigation schemes These include tbe Gezira irrigation scheme (882000 hal which is one of the largest in the world As well as irrigating land immediately adjacent to the l3lue Nile River some water is diverted from the l3lue Nile downstream of the Roseires reservoir to the Rahad River where it is used to supplement the irrigation of the Rahad irrigation scheme (168037 hal The total
274
g stations located on
llov Dec Annual
541 332 3776 35 22 247
6 788 503 16881 12 8 257
f5 3105 1709 50032 16 9 253
10 2451 1257 48281 9 5 176
19 9 2462 00 186
10 5 1302 2 07 203 25 11 3301 2 07 209 10 4 1402 1 05 171
0 182 01 0 26 220 91 1786 54 22 437 141 75 2733 18 10 346 352 IH6 6791 18 10 346 233 123 4483 18 10 346 1070 602 6888 51 29 328 27 13 3639 2 253 32 15 4262 2 254 42 12 2195 3 1 155 26 1056 3 01 128 34 4 2609 2 02 176
ENTRO (2007) and
Ie 142) provide rigation schemes the largest in the er some water is had River where 37 ha) The total
Simulating current and future water resources development in the Blue Nile River Basin
16
14
12
i 10middot
8middot
~ u 6
4
_ bull _i~ bull Outflow from lake Tana Abay at Kessie bull Blue Nile at EI diem b Blue Nile at Khartoum
FiflIrc 143 Mean monthly flow (million tn) at gauging stations located on the main stem o[ the Blue Nile
SOlmy Data provIded by the Ministry ofWarer Remurces Ethiopia and the UNESCO Chair in Warer Resources Sudan
irrigated area in the Sudanese part of the Blue Nile is estimated to be 1305000 ha consisting of a variety of crops including cotton sugar cane and vegetables The installed power capacity at the two dams is 295 MW which represents 25 per cent of the countrys total generating capacity (ie 1200 MW from both thermal and hydropower stations)
71hle 142 Existing dams in the BIne Nile catchment
Dam Country River Storage Year darn Purposf
(miliott In ) was built
Chara Chara Ethiopia Abay 9100 2000 Regulation of Lake Tana outflows [or
hydropower production at Tis Abay I and
Tis Abay II power stations (installed
capacity 84 MW) and since 2010 for
transfer o[ water to the Beles River
hydropower station (installed capacity
460 MW)
Finchaa Ethiopia Finchaa 2395 1971 Regulation for hydropower production
(installed capacity 134 M W) and also [or
irrigating sugar cane plantations (8145 hal
Roseires Sudan nIue Nile 3024 1964 Regulation tor hydropower production
(installed capacity 280 MW) and [or
sl1pply to irrigation schemes (1305000
hal
SennaT Sudan Blue Nile 930 1925 Regulation tor hydropower production
(installed capacity 15 MW) and [or supply
to irrigation schemes (1093502 hal
Notes This is the active storage of Lake TaIlJ that is controlled by the operation otthe weir (ie jake levels between 1784 and 1787 masl) It represents 24 rimes the average annual ourtlow of the lake There is small dam located on the Amerty River (storage 40 million m) which diverts water [rom the A111erty ftiver into the Finehaa reservoir
275
The Nile River Basin
Future water resources development
Both Ethiopia and Sudan contend that utilization of the Nile water resources is essential for socio-economic development and poverty alleviation Consequently both countries are planshyning significant development of the Blue Nile River water resources ill the future
In Ethiopia current planning is focused primarily on the Lake Tana and the BellS River catchments which have been identified by the government as an economic growth corridor (McCartney ct al 2(10) However additional projects are planned in nearly all the subshycatchments as well as along tbe main river Possible irrigation projects have been investigated over a number of years (eg Labmeyer 1962 USBR 1964 JICA 1977 WAPCOS 1990 BCEOM 1(98) and tbe total potential irrigated area is estimated to be 815581 ha comprisshying 45856 ha of small-scale 130395 ha of medium-scale and 639330 ha of large-scale schemes Of this 461 OOU ha are envisaged to be developed in tbe long term (BCEOM 19(8)
In the Ethiopian Blue Nile more than 120 potential hydropower sites have been identified (WAPCOS 1990) Of these 26 were investigated in detail during the preparation of the Abay River Basin Master Plan (BCEOM 1(98) The major hydropower projects currently being contemplated in Ethiopia have a combined installed capacity of between 3634 and 7629 MW (cf the Aswan High Dam which has an installed capacity of 2100 MW) The exact value depends on the fmal design of the dams and the consequent head that is produced at each The four largest schemes being considered are dams on the main stem of the Blue Nile River Of these schemes the furthest advanced is the Karadobi project for which the pre-feasibility study was conducted in 2006 (NorcollSult2006
In addition to the single-purpose hydropower schemes electricity generation is expected to
be added to several of the proposed irrigation projects where dams are being built This is estishymated to provide an ldditional 216 MW of capacity (BCEOM 199R) The total energy produced by all the hydropower schemes being considered is in the range 16000-33000 GWh yr This represents 20 to 40 per cent of the technical potential in the Ethiopian Blue Nile 70000 GWh yr- i
) estimated by the Ministry ofWater Resources (Beyene and Abebe 2(06) Currently it is anticipated that much of the electricity generated by these power stations will be sold to Sudan and possibly to other countries in the Nile Basin
Sudan is also planning to increase the area irrigated in the BNB Additional new projects OJld extension of existing schemes are anticipated to add an additional 889340 ha by 2025 An additional 4()OO million Ill of storage will be created by raising the height of the existing Roseries dam by 10 111 (Omer 2(10) However currently there are no plans for additional darns to be constructed on the Blue Nile
Technically feasible hydropower energy production in the Nile Basin of Sudan is estimated to be 24137 GWb yr-r (Omer 20(9) 1110St of which is on the main Nile downstream of the White and Blue Nile confluence Currently the Merowe dam with an installed capacity of 2500 MW is being commissioned 011 the Nile downstream of Khartonm Several other major hydropower dams are being planned nOlle of which are to be located on the Blue Nile River
Application of the Water Evaluation And Planning model
Model description
Developed by the Stockholm Environment Institute (SEI) the WEAl model is intended to be used to evaluate planning and management issues associated with water resources development The WEAP model essentially calculates a llJass balance of flow sequentially down a river
276
- resources is essential for both countries are planshyin the future_
lana and the Beles River )I1omic growth corridor d in nearly all the subshyts have been investigated 1977 WAPCOS 1990 be 815581 ha comprisshy39330 ha of large-scale g term (BCEOM 1998) sites have been identifIed preparation of the Abay projects currently being een 3634 and 7629 MW I MW) The exact value is produced at each The the Blue Nile River Of I the pre-feasibility study
eneration is expected to being built This is estishy998) The total energy ge 16000-33()()() GWh
thiopian BIlle Nile (ie yene and Abebe 20(6) 1ese power stations will
dditional new projects 389340 ha by 2025 An height of the existing
lans for additional dams
n of Sudan is estimated ~ile downstream of the U1 installed capacity of m Several other major n the Blue Nile River
gmodel
lode is intended to be ~sources development entially down a river
Simulating currellt alld future water resources development in the Blue Nile River Basin
system making allowance for abstractions and inflows The elements that comprise the water demand-supply system and their spatial relationship are characterized within the model The system is represented in terms of its various water sources (eg surface water groundwater and water reuse elements) withdrawal transmission reservoirs wastewater treatment facilities and water demands user-defined sectors but typically comprising industry mines irrigation and domestic supplyYatcs et aI 2005 SEI 20(7)
Typically the model is configured to simulate a baseline year fc)r which the water availshyability and demands can be confidently determined It is then used to simulate alternative scenarios to assess the impact of different development and management options For each scenario the model optimizes water use in the catchment using an iterative linear programshyming algorithm the objective of which is to maximize the water delivered to demand sites according to a set of user-defined priorities All demand sites are assigned a priority between 1 and 99 where I is the highest priority and 99 the lowest When water is limited the algorithm is formulated to progressively restrict water allocation to those demand sites given the lowest priority In this study the model was configured to simulate the 16 major sub-catchments of the basin (Figure 144a) It was assumed that because hydropower generates greater income it would be considered more important than irrigation by both governments Consequently within WEAP it was given a higher priority than irrigation However all schemes in Ethiopia and Sudan were given the same priority (ie no attempt was made to reflect differences between upstream and downstream locations)
Description of the scenarios
Scenarios are comJllonly used to investigate complex systems that are inherently unpredictable or insufficiently understood to enable precise predictions In this instance although there is reasonable (but not total) knowledge of current (ie 2008) water demand there is comiderable uncertainty about how future water resources development will proceed Consequently a scenario approach was adopted
The model was set up to simulate four scenarios each of which provides a coherent intershynally consistent and plausible description of water demand within the catchment (Table 143 Figure 144a-d)
litle 143 Water resources development scenarios simulated using the Water Evaluation And Planning model
Dcsaipthm -_- ----------------------------~---
No human-made storage and no abstractions so that tlows an assuIlled to be natural This scenario provides J baseline against which all the other scenarios can be assessed
Current The current water resources development situation (around 20(8) including all major
irrigation and hydropower schemes
Medium-term Water resources development (irrigation and hydropower) in the medium-term future future (around 2010-2(25) including al schemes for which feasibility studies have been
conducted
Long-term Water resources developmem (irrigation and hydropower) in the long-term futurt future (around 2025-2050) including schemes that are included in basin master plam bL1t have
not yet reached the feasibility study stage of planning
277
The Nile River Basin
~--------- -~-I
bull Jemma
Jemma Il[ bull Lem
Muger
Flow gHugmg stallOflS e(carewen ama gt 1000 j(nf) ~
Reservoir Gude
a Didessa Finchaa
bull Khano SUDAN
Downstream --- Irrigation upstream of__~__Rahxad Rohalt 148293 ha Lake Tana 7200 ha
Senna 167200 na Di~~---~
Gezira and Managii -- - -~~ ~~nnar 882195ha i
Ou(el Lake Tana
Upstream Sennar 71717 na
Suki 29827 ha
FinchaaDabus
V8145ha
InigallOn
V ReserVOIr Guder
Irrigation schemeb Finchaa
278
Welaka
Simulating current and future water resources development in the Blue Nile River Basin
SuIO 32767 ha North GOlam
I
Irfigaijon upstream of Lake Tan 69053ha
r___ Anger t)v--- Finchaa
Irrigahon o Diversions Flow gaugmg staUons bull 2014500Anger
(catchmmt rpa gt 1~OOO Imf) V Reservoir1445000 GuderVReservoir c FlOchaa
bull Khartoum SUDAN Rahad If 210046ha
6)0 Irriga_ ups1ream ofOownstrean f Lake Tana 69053 ha
lnigalion upstream of Sennar 228111 00
lake Tana 7200 ha ~_ Gezlra and Managil lake iTana NW Lake Tana L~ Pumping 6720ha882195 ha
2424 1 ~ ~ Upom Senna 117626 ha Oul18t Lake Trwa ~ t Oultel Lake Tana --_
~----
Kanana I amp II 4200931gt0 ~ _ O-Cjf Beles ~~ Bosheilo 0 d Upper Dioder 10000 ha-f) ~10( at ~ lit)
Suki 36128 ha r1--- Welaka
_bull~-middot--VDngurDm Upper Bele 537ooha J-----Welaka
Jemma
f lower Beles North Gojam Jemma m ETHIOPIA 85000 ha South GOlam bullbullbull
Loor ) WOmber I Mobrr Dab~ t_ ~aya--tgt _tgtdObl _ A _~ ___~~Se(
Upper ifMuger DD~US ~oe~sa rv Nekemte 11220ha NestleOabus 9661ha bull _ ~
bull T r- 7217 ha C r ~ Anger (t
OOi erslonsDabus ~=ahgation -t- Flnchaa ~ ~ha ~ Ange t 20145ha 17 If 14450 ha V (
Dfversions Arjo 13665h I FinchaVReservoir 1 t 1 J inigalion scheme
--cJ- 8 -+1 ct Guderdiversion41ooha Imgallon scheme d Dldessa Guder
F(iliYe 144 Schematic of the model contlguration for different scenarios (a) the natural situation (b) the current (2008) situation (e) the medium-term (2010-2025) future and (d) the long-term (2025-2050) future
279
The Nile River Basin
Time series of monthly naturalized How data for the period 1960-1992 obtained from the Abay Basin Master Plan (BCEOM 1998) and modified slightly based on more recent feasibilshyity studies (ENTRO 20(7) were used as input data In the future scenarios considerable time is needed to fill the planned large reservoirs particularly those located on the main stem of the Blue Nile River Hence a 20-year warm-up period was introduced and all comparisons benveen scenarios were made tor just the 13 years 1980-1992
Estimates of current irrigation and hydropower demand were derived from data provided by governmcnt ministries and agencies or from prcvious studies These included information on water passing through the turbines of the power stations and water diverted fix irrigation It was necessary to make several assumptions particularly about irrigation demands and the return t]ows from irrigation schemes Net evaporation fiom Lake Tana and the reservoirs was estimated from raillfall and potential evaporation data obtained from the meteorological station located closest to each dam These data were obtained from the FAO LocClirn datJb~lse (FAn 20(2)
For the mediul1l-term and long-term scenarios the sizes of planned hydropower and irrishygation development schemes were derived trom the basin master plan tor the Ethiopian Blue Nile and through discussion with academics and water resource planners in Sudan New schemes proposed extension of existing irrigation schemes as well as planned hydropower developments were identified (Tables 144 and 145) The medium-term scenario includes the Tma-Beles transfer scheme in EthiopiaThis project which involves the transfer of water from Lake lana to the Beles River to generate hydropower actually came on line in 2010 but after the modelling had been undertaken (McCartney ct al 2010)
hJIe 144 Proposed irrigation development in the Biue Nile Hiver Basin
Scheme Sub-basllI Dcsrriplitlfl Estimaled
completioll
dale -------------------------------------------shy
Ethiopia Lake Tana LakeTana Dams to be constructed OIl the major inflows to Lake Tana Medium
(ie Megech Ribb Guman and Gilgcl Abay) term
Total storage 102H million 111
Irrigation area 61 H53 ha
Average annml demand 516 million m
Bcles Belcs Upper Beles scheme 53700 ha Medium
Lower Beles scheme H5OOO ha term
Average annual demand 1554 million 111
Anger Anger Maximum irrigated area 14450 ha Mediulll
Average annual demand 202 million m ternl
Arjo Didessa Arjo scheme 13665 ha Medium
Average annual deIlland 921 million 111 j term
Dinder Dinder (but Upper Dinder scheme 10000 ha Medium
water Average annual demand 982 million m term
transferred
from Beles)
Finch a Finchaa Extemion of existing scheme Medium
Additional area 12000 ha term
Average annual demand 4566 million m j
280
192 obtained from the
1 more recent feasibilshy-ios considerable time 1 the main stem of the
and all comparisons
from data provided by luded information on ~d for irrigation It was nands and the return ~servoirs was estimated logical station located atabase (FAO 2002) hydropower and irri shy)r the Ethiopian Blue mers in Sudan New
planned hydropower scenario includes the transfer ofwater from line in 2010 but after
Estimated wmpletioll date
keTana Medium
term
Medium terlll
Medium term
Medmll1 terlll
Medium
term
Medium term
Simulating current and future water resources development in the Blue Nile River Basin
Table 144 Continned
Schaw Stih-basin Dcltcriplioll rislilllated
date
Rahad and Rahad Rahad and Galegu scheme 15029 ha Long term Average annual demand 607 millioll Ill
Dinder Dinder Dilldcc scheme 49555 hJ Long term Average annual demand 556 million ll1
Guder Guder Guder diversion 4100 ha Long term Guder 4R96 ha
Average annual demand 544 million Ill
Nekemte Anger Nekemte scheme 11220 ha Long term Averaglt anllual demand 715 million Ill
Dides-a Didessa Didessa irrigation scheme 5405R ha Long term
Average annual demand 7694 million 1lJ
Sudan
Raising Blue Nile Roseries dam raised by 10 III to provide total (gross) Medium
Roscries main stem storage of 7400 million m term
Dam
Extension Rahad Additional irrigation area 1J740 ha Medium of Rahad Rahad II irrigation scheme 210000 ha terlll
irrigation 1btal average annual demand 2433 million m
scheme
Extemion J)ue Nile Additional irrigation area 2940 h33361 ha Mediulll
ofSuki main stem Total average allnual demand 201 million m221 million 111 tcrm
irngation scheme
Extension Blue Nile Additional irrigation area 39910 ha Medium
of Upstrealll main stem Total average annual demand 745 million m term Sennar
Extcnsion Blue Nik Additional irrigation area 44110 h36R04 ha Mcdunn
of 11lain StClll Total average annual demand 1414 million Ill long term
Downstream 1526 million Ill
Sennar
Kenana II Blue Nile Additional irrigation area 420093 ha Medium
and III l11alll stelll Average allnual demand 2352 million m tenn
Soutb Dinder Additional irrigation area ~-lO 19 ha48318 hah Medium
Dindtr Average annual demand 541 million m ~51 million 111 II lung term
llotcs Schelllts arc extended partially in the mediUlll-tcnn future Jnd partially in the long-term filturc
IThe slash in the third C01Ulll11 demarcates values lwtweell the llledilllll-tcrm future and the ]ong-ttnll future
For many potential schemes there is currently considerable uncertainty about the dates when they will be completed In the current study it was assumed that for Ethiopian schemes if prefeasibility studies have been undertaken then the scheme will be completed in the mediulll term For all other planned schemes it was assumed that they will be completed in the long term For the Sudanese schemes information on likely completion dates was obtained
281
The Nile River Basin
TiJhle 14) Proposed hydropower development in the Blue Nile River Basin
Scheme Suh-basin Descriptioll Estimated
wmpletioN date
Ethiopia Tana-Beles TlIld and Beles Transfer of water from Lake Tana to Beles catchment for
hydropower production and lrrigatioll Hydropower capacity 460 MW
Average anllual transfer 2424 million 111
Medium
term
Anger Anger Linked to the Anger irrigation scheme Hydropower capacity 18-96 MW
Medium
term
Arjo Didessa Linked to the Atjo irrigation scheme
Hydropower capacity 33 MW
Medium
term
Karadobi Blue Nile main stem
Height of dam 250 m
Total storage 40220 million m
Hydropower capacity 1600 MW
Medium term
Mendaya Blue Nile
main stem
Height of dam 164
Total storage 15900 million 111
Hydropower capacity 1620 MW
Medium
term
Border Blue Nile
main stem
Height of dam 90 111
Total storage 11100 million 111
Hydropower capacity 1400 MW
Long term
Mabil Blue Nile
main stem
Height of dam 170 J1l
Total storage 17200 million III 1
Hydropower capacity 1200 MW
Long term
Lower Didessa Didessa Height of dam 110 Il1
final storage 5510 million 111
Hydropower capacity 1)0 MW
Long terlll
Dabus Dabl1s Linked to the Dabus irrigation cheme
Hydropower capacity 152 MW
Long term
Danguar Beles Height of dam 120 m
Total storage 4640 million m
Hydropower capacity 33 MW
Long term
Lower Daills Dabus Height of dam 50 1Il
10tal storage 1290 million m
Hydropower capacity 164 MW
Long term
from discussions with water resources experts within the country However clearly the two scenarios reflect only an approximate timeline tor water resources development in the basin In reality development is dependent on many external factors and so it is impossible to predict exactly when many planned schemes will actually be implemented or indeed the exact sequencing of schemes As they stand the medium-term and long-term future scenarios represhysent a plausible development trajectory but it is unlikely that it will actually come to pass in exactly the way envisaged
282
Estimated
compleril dale
lent for Medium term
Medium term
Medium
term
Medium term
Medium term
Long term
Long term
Long term
Long term
Long term
Long term
rever clearly the two )ment in the basin In impossible to predict or indeed the exact Iture scenarios represhy1ally come to pass in
Simulating current and future water resources development in tile Blue Nile River Basin
The water withdrawals for irrigation schemes were derived from a variety of sources including the Ethiopia Basin master plan and where available feasibility studies For Sudan useful information on irrigation water use was obtained from a study of the Roseries irrigation scheme (Ibrahim ct al 20(9) In schemes for which there were no data it was assumed that withdrawals per hectare would be similar to those at the nearest scheme where data were availshyable with some allowances for differences in rainf111 where this ditTered signifIcantly between locations Irrigation return flows were estimated from existing feasibility studies and averaged approximately 20 per cent of withdrawals in Ethiopia and 15 per cent in Sudan Where it is planned to extend irrigation schemes the future withdrawals and return flows were estimated based on current values but weighted by the new area Thus no allowance was made tor possishyble future improvements in irrigation dhciency Furthermore no allowance was made tor inter-annual variations in rainfall which might affect irrigation demand between years
Results
Model validation
Figure 145 shows the simulated and observed flows at the Ethiopia-Sudan border and at Khartoum for the current situation At Khartoum observed data (obtained from the Global Data Runoff Centre) were only available tor the period 1960--1982 Over this period the error in the simulated mean annual flow was 19 per cent_ As a result of current abstractions primashyrily tor irrigation in Sudan the flow at Khartoum is estimated to be approximately 7J-l billion m yc less than would have occurred naturally over this period (ie 424 billion 111 yr- 1 rather than 502 billion tn yr 1) At the border there are two flow gauging stations One is operated by the Government of Ethiopia and just a few kilometres downstream another is operated by the Government of Sudan Possibly because of differences in periods of missing data observed flows at these two stations differ and there is a 10 per cent difference in mean annual flow over the period 1960-1992 506 billion m measured by Ethiopia and 455 billion m measured by Sudan Without a detailed analysis which was beyond the scope of the present study it is not possible to know which of the two flow series is the more accurate The WEAP model simushylation falls between the two with a mean annual discharge of 462 billion m
Figure 146 compares the simulated and observed water levels of Lake Tana also over the period 1960-1992 Although the average simulated water level (17863 masl) is close to the observed average (17860 masl) it is clear that the variability ill the simulated water levels does not quite match that of the observed levels Nevertheless these results in conjunction with the flow results indicate that the WEAP simulation of the current situation is reasonably accurate and provides credibility for the results of the simulated future scenarios
Comparison ofscenarios
Currently irrigation water withdrawals in Sudan greatly exceed those in Ethiopia because of the differences in irrigated area The total irrigation demand in Sudan is estimated to average 845 billion nr yr-This compares with an average ofjust 026 billion m yr- in EthiopiaWith the planned irrigation development demand is estimated to increase to 1339 billion and 238 billion m yC in the medium-term scenarios and to 1383 billion and 381 billion 111 yr 1 in the long-term scenarios in Sudan and Ethiopia respectively (Table 146) If all planned dams are constructed the total reservoir storage in Ethiopia is estimated to increase to 70 billion Ill (ie 15 times the mean annual flow at the border) in the mid-term and to 167 biJ1ion 11 (ie
283
The Nile River Basin
36 times the mean annual flow at the border) in the long term Hydropower generated in Ethiopia from the Tis Abay and Finchaa power stations is currently estimated to be 1383 GWh yr With the construction of the Tana Ueles transfer the Karadobi dam and other smaller schemes this is estimated to increase to 12908 GWh yr in the medium term With Uorder Mendaya and Mabil hydropower stations as well as with additional smaller schemes electricity production in the long terll1 could increase to 31297 GWh yr
Hydropower generated on the U1ue Nile in Sudan is currently estimated to be just over 1000 GWh ye but there arc no publicly available data to confirm this estimate Because of the additional head and increased storage the raising of the Roseries dam will result in a very small increase to 1134 GWh yr I in the medium term and to 1205 GWh yr I in the long term The increase in the long term is due entirely to greater dry season resulting from increased regulation upstream in Ethiopb
40000a bull bullI35000
bull30000 bull 25000 bullbull
bull l
f bull I I I
~ 20000 ~ o I f u 15000 I~10000
II bull III bull I III III rl ~ 5000 II II I I
bull bull t II Ie IIbull middotI bull o
0 0 0 M VI 0) N VI 00 0 co ltXl q~ i9 C C C C c c C c c C C S C C t S ~ ~ ~ ~ ~ ~ ~ ~ ~ ~ ~
- Observed Flow at Khartoum bullbullbullbullSimUlated Flow at Khartoum
18000
16000
14000 ~E
eshy 12000
g ~ 10000 gtshyc 8000C 0 E 6000 c ltlgt 40002
2000
0
Jan Feb Mar Apr May June July Aug Sep Oct Nov Dec
- Observed flow at Khartoum bullbullbullbull Simulated flow at Khartoum
b
cu cat
ah lIH
tio lIlt
284
ropower generated in ated to be 1383 GWh
am and other smaller m term With Border
b
Simulating current and jutllre water resources development in the Blue Nile River Basin
40000
middot 35000 t I
30000 t I
er schemes electricity
11ated to be just over timate Because of the J result in a very small in the long term The u1ting from increased
- 0
C 9 q 0 i~ ~i Ji
lUm
-
~ -ltshy
~ ~ - _ Nov Dec
n
_ 25000 E 620000 0 u 15000
10000
5000
0
-
18000
16000
~ 14000 ~E
5 12000
g 10000 raquo
J 8000C 0 E 6000 c (J) 4000i
2000
o
bullbull
0 - 0 0 N M 0 0 q~ ~ ~ 9 r-- r-- - r-- P P f ltXl f l i c r C i C i c C C c ~ ~ ~ ~ ~ ~ ~ ~ ~ ~ ~Ji Ji Ji Ji Ji Ji Ji Ji Ji Ji Ji
Observed flow at the border - - - bull Simulated flow at the border
Measured MAF in Ethiopia 5068 m
Measured MAF in Sudan = WEAP Simulated MAF = 462 8m
455Bm
Jan Feb Mar Apr May June July Aug 5ep Oct Nov Dec
- Observed flow in Ethiopia - - - bull Simulated flow at the border
-- Observed flow in Sudan
F(qWf 145 Simulated and observed flow series and mean monthly flows (1960-1992) for the Blue Nile (current situation) at (a) Khartoum and (b) the Ethiopia-Sudan border
Comparison of the mean monthly flows at Khartoum tor the simulated natural condition current situation and the mediulIl- and long-term scenarios tor the 13 years 1980-1 SlSl2 indishy
cates how the mean annual flow is progressively reduced as a consequence of greater upstream abstractions (Table 147) Wet season flmvs are reduced significantly but dry season flows are increased as a consequence offlow regulation (Figure 147Table 147) Under natural condishytions 84 per cent of the river flow occurs in the wet season months (July-October) In the medium-term and long-term scenarios this is reduced to 61 and 37 per cent respectively
285
The Nile River Basin
17875
17870
17865
17860
17855
I
17850 0 M U r- 00 0 N ~ U r- 01 N ~ 0 00 01 0 0 0 r- r- r- I 00 00 00 co cof r- r- ~ C ~ C ~ C C C
u 5 3 u 5 Q u 5 Q u 5 Q uC1l C1l C1l C1l C1l ~ 0 lt( 0 lt( 0 lt( 0 lt( 0
- WEAP simulated water level bullbullbullbullbull Observed water level
Figure 146 Simulated and observed water levels in Lake Tana (1960-1992)
Tablc 146 Comparison of current Jnd future irrigation demand and hydropower production in the Ethiopian and Sudanese parts of the Blue Nile
Curreri Jfedil1n-lerm Ji4t1ire LOl1g-teml future
Eilliopia Slldal1 Ethiopia Sudal1 Ethiopia SlIdml
Total storage (lllillion 111) ] l57H 3370 70244 10770 167079 10770
Formal irrigatiotl Area (ha) lt]0000 ]305000 210000 2]26000 461000 2190000
Water withdrawJls per year 026 845 238 1339 381 n83 (millio1111l yr)
Hydropower Installed capacity (MW) 218 295 2194 295 6426 295 Production (GWh yr ) 1383 1029 12908 1134 31297 1205
10[( Allowance llladc for sedinlentation of both the Roscrlcs and Sennar reservoirs
At the Ethiopia-Sudan border the current situation is almost identical to the natural condishytion so this is not shown (Figure 147) Mean annual flow is reduced from 452 to 432 and 427 billion nr in the medium-term and long-term future scenarios respectively As in Khartoum there is a significant reduction in wet season flows but there are signifICant increases
in dry season flows as a consequence of flow regulation (Figure 147Table 147) Under natushyral conditions 81 per cent of the river flow occurs in the wet season but this decreases to 59 and 43 per cent in the medium-term and long-te-m scenarios respectively The total decrease in border flow in the long-term scenario is less than might be ex-pected given the increased
286
ltt 00 000 00 00 J or CiJ C Q ra u laquo 0
water level
ver production in the
LOlx-term fu lure
Ethiopia
167079
461000 381
6426 31297
Sudan
10770
2190000 1383
295 1205
Simulating current al1d future water resources developmel1t il1 the Blue Nile River Basin
a 18000 Simulated natural MAF 482 Bm 3
Simulated current MAF =40A Bm 316000 Simulated medium -term future MAF =33ABm 3f 14000 Simulated long-term future MAF =319Bm 3
~ 12000
~ 10000 gt -pound 8000 c 0 E 6000 c
~ (1l 4000
2000
0
Jan Feb Mar Apr May June July Aug Sep Oct Nov Dec
-Natural flow -Current flow - - -Medium-term future _ Long-term future
18000 Simulated natural MAF = 452 Bm3
16000
b
Simulated current MAF = 452 Bm)
f 14000 Simulated medium middotterm future MAF = 432 Bm 3
Simulated longmiddotterm future MAF =427 Bm~ 12000 3 g 10000 gt pound 8000 c 0
6000E c
~ (1l 4000
2000
0
Jan Feb Mar Apr May June July Aug Sep Oct Nov Dec
- Natural flow - - bull Medium-term future _ Long-term future
Fixure 147 Comparison of simulated mean monthly flow derived for natural current mecHum-term and long-term future scenarios at (a) Khartoum and (b) the Ethiopiamiddot-Sudan border
irrigation demand in Ethiopia The reason is partly that less water is diverted fi-om the Tana to the Beles catchmem ano more flow is routed down the main stem of Blue Nile
rurrently shortfalls (ie failure in any given month to supply the full amount of water needed for irrigation withdrawals or hydropower needs) in Ethiopia are negligible However in the medium-term scenario shortfalls increase to 08 and 50 billion m l yr for irrigation and hydropower respectively In the long term the increased storage means that shortfalls will avershyage 04 billion m for irrigation and 07 billion m l yr- for hydropower In comparison under current conditions there is an average shortfall of 08 billion m in water for the Sudanese irrigation schemes However because of the improved flow regulation there are no shortfalls in irrigation or hydropower in Sudan in either the medium- or the long-term scenarshyios These results reflect the fact that in each scenario the Sudanese schemes were given the same priority as those in Ethiopia Hence although in the medium term and long term more water is stored in Ethiopia in these scenarios no preference was given to the schemes in Ethiopia
I to the natural condishyrom 452 to 432 and )S respectively As in
re significant increases le 147) Under natushyIt this decreases to 59
dy The total decrease f given the increased
287
The Nile River Basin
lablr 147 Simulated mean monthly flow (million m) at the Ethiopia-Sudan border and Khartoum for natural current medium- and long-term tiJture scenarios (1980-1992)
Atom Naruml Currcrlt Aledium-term filturr Long-term future Border Khartollm Border Khartoum Border Khartoutll Border Khartoum
--~---~-~--------~---------
January 835 835 955 B55 1565 3220 2710 4405 February 470 470 380 740 1180 2220 2110 3175 March 350 350 400 475 845 1615 19BO 2770 April 310 310 520 620 710 1315 1635 2250 May 390 390 645 710 680 1235 14B5 2055
June 980 990 1230 640 1390 2273 2203 3125
July 5930 6235 6105 5365 3870 2560 4820 3420 August 15770 16830 15430 15950 8400 8615 4H20 4245 September 10590 116HO 10130 10165 H020 7490 4665 3760 October 53()O SH25 4970 3865 5315 1740 4105 420 November 2750 2795 2() 15 3JO 8870 2ltgt0 9095 250 December 1510 1510 1575 740 2305 H50 3055 1990 10ta1 45245 48220 45155 40435 43150 33395 426H5 3LB65
Net evaporation (ie the difference between evaporation trom a reservoir and the rainfall directly onto its surface) from the Ethiopian reservoirs currently averages 08 billion m yr- However by f3r the bulk of this is from Lake Tana which is a natural geographic feature and would be evaporating even without regulation By comparison net evaporation from the Sudanese reservoirs is 04 billion 111 yr- In the medium term this increases to 12 billion 111
yr in Ethiopia (03 billion m yr excluding Lake Tam) and to 14 billion m yr in Sudan The increase in Sudan is due to the increased area of the Roseries reservoir arising from raisshying the Roseries Dam and the fact that water levels in both Roseries and Sennar reservoirs are maintained at higher levels because of the higher dry season inflows In the long term total net reservoir evaporation increases to 17 billion m yr in Ethiopia (08 billion 111 yr bull excluding Lake Tam) and remains at 14 billion m l yr- in Sudan However evaporation losses per cubic metre of water stored are considerably lower in Ethiopia than in Sudan in all the scenarios In
fact as a result of the locations of the planned reservoirs as storage increases in Ethiopia losses per cubic metre of water stored decrease significantly over time (Table 14H)
labe 148 Simulated average annual net evaporation trom reservoirs in Ethiopia and Sudan for each of the scenarios
Sccnario Ethiopir SHdml
Tiltal lillal EJaptJratiou Iblal Iotal Elapomrioll storage evaporation from stOlalZe st()ra~e (U(1poration fn)Jn _f)ra~~l
(millioll ml (millivlI II) Imm) (millioll m) (millioll tn) (m i 111-)
Current 1157il H46 007 3370 443 013 Medium term 70244 l1SB (l02 10770 1363 013 Long term 167079 1732 Cl01 10770 13H7 013
N(lres Including from Lake 1ma which is a natural lake though regulated by the Char Chara weir
288
der and Khartoum for )
Long-term future Border Khartoum
2710 4405 2110 3175 1980 2770 1635 2250 1485 2055 2205 3125 4820 3420 4820 4245 4665 3760 4105 420 9095 250 3055 1990 42685 31865
~voir and the rainfall s 08 billion m 1 yc agraphic feature and vaporation from the Ises to 12 billion m on m yr I in Sudan oir arising from raisshySennaI reservoirs are long term total net on 111 yr excluding tion losses per cubic I all the scenarios In es in Ethiopia losses 8)
Ind Sudan fix each of
Euaporati()11 )ratiol1 I1om _forage
Oil m (111 I1l )
013 013 013
nra we-ir
Simulating current and future water resources development in the Blue Nile River Basin
Discussion
The results presented in this chapter are based on many assumptiolls Lack of data on flow and water demand and use particularly in Sudall makes it very difficult to validate the model for the current situation However where it has been possible to verifY them the model results appear to be reasonably accurate For example in the current scenario simulated flows closely match the observed flows at key locations on the main stem of the river and the simulated water levels in Lake Tana were reasonably accurate (Figures 145 and 146) Consequently though the results should be treated with caution they arc believed to be broadly indicative of the likely impacts arising trom the development currently being considered in both Ethiopia and Sudan By illustrating what may occur the scenarios provide information that is useful for resource pbnning and the results provide a basis for discussion
Climate and hence hydrological variability possibly increased by future climate change will remain key tilCtorS in the economic development of both Ethiopia and Sudan in the future As in the past future water resources development in the Blue Nile will be driven predominantly by the need felf water for agriculture and hydropower and hence the need for large volumes of stored water Irrigation will remain by filf the largest user of water and the future scenarios indicate significantly increased water withdrawals as a conseqnence of increasing irrigation predominantly in Sudan and also increasingly in Ethiopia The construction of the dams particularly the very large hydropower dams proposed by Ethiopia though not consuming large amounts of water vill sihrnificantly alter the flow regime of the river resulting in lower wet season flows and much greater dry season flows The results of this are likely to be benetlmiddotshycial for SudanThe frequency of flooding which occurs ewry few years in the flat areas of the country and is particularly devastating in and around Khartoum may be reduced Higher dry season flows mean greater availability of water at a time when it is naturally scarce and hence increased opportunities for withdrawals f()r irrigation and other uses Thus increased water storshyage in Ethiopia has the potential to provide benefits for Sudan too
As a result of higher rainfall and lower evaporative demand net evaporation loss per cubic metre of water stored in the Ethiopian reservoirs (including Lake Tana which is a natural lake) is currently approximately 50 per cent of that in Sudan As more water is stored in Ethiopia this ratio decreases so that in the long term it could be as low as 8 per cent of that in Sudan (Table 148) This confirms that one of the most signifICant benefits of storing water in the Ethiopian Highlands rather than in the lower more arid regions ofSudan (or indeed in Egypt) is significantly reduced evaporation losses
For all scenarios the model was run as a single system making no allowance tor the fact that Ethiopia and Sudan are separate countries Water demands in Sudan were given the same priorshyity as those in Ethiopia and water was released from reservoirs in Ethiopia to meet downstream demands in Sudan This assumes a much higher level of cooperation between the two states in relation to both the planning and managel1lent of water resources than at present
Future research is needed to refme the model Key to improving the simulatiom are
improved estimates of irrigation water demand improved estimates of the dates on which schemes will become operational more realistic dam operating rules detailed economic livelihood and environmental assessments of the cumulative impacts of all the proposed schemes and evaluation of the possible hydrological implications of climate change
289
The Nile River Basin
An important issue not considered in the current model simulations is the transient stages of reservoir tilling Given the large cumulative volume of the planned reservoirs in Ethiopia it is essential that reservoir filling is planned and managed in such a way that adverse downstream impacts including potentially negative environmental and social impacts are minimized The need to give due consideration to dam operation that provides for environmental (lows to avoid degradation of riverine ecosystems has recently been emphasized (Reitburger and McCartney 2(11)
Conclusion
The WEAP model has been configured to simulate the impacts of water resources developshyment in the I3NI3 Currently Ethiopia utilizes very little water for irrigation but does reb1llate some tlow for hydropower production In contrast Sudan uses some water for hydropower production and also abstracts large volumes for irrigation Both countries plan to develop water resources substantially in the near future The extent to which actual water resources developshyment will match the plans of both countries in the long term is unclear and will depend a lot on unpredictable social and economic factors However in both Ethiopia and Sudan hydropower and irrigation are widely perceived as critical to national development and in both countries current investment in water infrastructure is substantial and increasing Consequently pressures on water resources are rising and will increase substantially in the near future
The results of this study have confirmed that if the states cooperate effectively mutually beneficial scenarios are possible upstream regulation in Ethiopia reduces evaporation losses probably reduces the frequency of flooding and provides opportunities for greatly increased water development in Sudan However maximizing benefits and minimizing potential adverse impacts (eg to the environment) especially when the large reservoirs are being filled require much greater cooperation than currently exim between the riparian states The key to success is the establishment of pragmatic institutional arrangements that enable the water resources of the basin to be planned and managed as a single entity (ie without consideration of national borders) in the most effective and equitable manner possible It is to be hoped that such arrangements will be devised through the protracted negotiations currently under way
References
Awulachew S B McCartney M P Steenhuis T SAhmedAA (200H) A Review oHydrology Sedimcnt and vVater Resource Use ill the Blue Nile Basil International Water Management Institute Colombo Sri Lanka
[lCEOM (1998) Abbay RiFcr Basin Jltlc~ralcd Development A1astcr Plan Section II v[lilme v 11latcr Resources De1Jeopcnl Parr 1 1rr(~ion awl Draillfljlc Ministry ofWater Resources Addis Abtba Ethiopia
Beyelle T md Abebe Jv1 (2006) Potential and development plan in Ethiopia Hydropower and Datlls 13 61-64
Block P Strzepek K and Rajagopalan B (2007) blfegrated Jv1anagement of till Blue Nile Basin ill Ethiopia Hydropower and Irr(llaquo(lrion rvtdeli~ IFPRI Discussion Paper 00700 International Food Policy Research Institute Wasbington DC p22
Cascao1 E (2009) Changing power relations in the Nile River Basin Cnilateralism vs cooperation Water Alternalives 2 2 245-268
Ebla G (2008) Study ofMainstem Dams on the Blue Nile MSc thesis Arba Minch University Ethiopia pp94 ENTRO (Eastern Nile Technical Regional Office) (2007) Preeasibility study of Border Hydrnpucr PJfct
Ethiopia ENTROAddis Ababa Ethiopia FAO (Food and Agriculture Organization of the Cnited Nations) (2002) Aruwuncing LJCCim the FAa Local
Climate Estimator CDROll] wwwfaoorgsd2002EN1203a_enhtm accessed June 2009 GeorgakakosA P (200)) Nile Decision Support Tool (Nile DST) Executive Summary Report submitted to
FAO and the Nile riparian states Rome Italy June
290
Ie transient stages of Dirs in Ethiopia it is adverse downstream are minimized The iron mental flows to ed (Reitburger and
r resources developshym but does regulate Iter for hydropower Ian to develop water r resources developshyI1d will depend a lot hiopia and Sudan opment and in both asing Consequently e near future effectively mutually evaporation losses or greatly increased ng potential adverse being filled require The key to success e water resources of deration of national )e hoped that such y under way
Hydrolog Sedimcrll and ~ Colombo Sri Lanka fume ~ Hlaler Resources lba Ethiopia
and Dams 13
Nile Basin ill Ethiopia Food Policy Research
vs cooperation Hlatcr
iversiry Ethiopia pp94 dey Hydropower Project
Simulating current and future water resources development in the Blue Nile River Basin
Guariso C and Whittington n (19H7) Implications of Ethiopian water development for Egypt and Sudan bltcrnaliltllllllJolJrnal Hater Resources Dncpmml 3 2 105-114
IbrahimY A Ahmed A A and Ramdan M S (2009) Improving water management practices in the Rahad Scheme (Sudan) in Improved Hlaler md Lmd lvanuJlClllcnt ill Ihe Ethiopian H(~hlallds lis lmpaa 01
DowlIStrealgtl Stakrlwlders Dependent )11 tile Blllt Nile Intermediate Results Dissemination Vorkshop held at the International Livestock Research Institute (ILRI) 5-6 February S 13 Awulachew T Erkossa V Smakhtin and EAshra (eds)Addis Ababa Ethiopia
Jigerskog A GranitJ Risberg A and Yn V (2007) Tramboundary water management as a regional public good in fillaflcil1g Exampllfrom rhe Nile Basin Report no 20 SIWI Stockholm Sweden
JICA (lapan International Cooperation Agency) (1997) Feasibility Reporr uti Power Declopmellt at Lake lim Rf~IOIIJapan Internatiol Cooperariol1 Agency Tokyo Japan
Lahmeyer Consulting Engineers (1962) GilJlfl Abay Scheme Imperial Ethiopian Government Ministry of Public Works Addis Ahaba Ethiopia
McCartney M I~ Alcmayehu T Shiferaw A and Awulachew S ]3 (2010) Evaluation of current and future water resources development in the Lake Tana Basin Ethiopia IWMI Research Report 134 International Water Management Institute Colombo Sri Lanka
MetawieA E (2()04) History of co-operation in the Nile Basin Hlater Resources Dedopmer 20 147-63 MonteithJ L (1981) Evaporation and surface temperature QII1rIcry Joumal of lile Royal A1etrorologiral SariOy
107 1~~27
Norconsult (2006) Karadobi Hultipurpo5c Projea Preea5ibility Sludy Report to the Ministry of Water ResoUTces The Federal Republic of Ethiopia Addis Ababa Ethiopia
Omer A M (2009) Hydropouer polcurial atld Priority for Dams Developmel1t ill Slitiall wwwscitopicscomHydropower_potentiaLand_priority_for_da1l1s_developmellcill_Suda11html accessed November 2010
Omer A M (2010) S14dmese dec[opmelll 20 September wwwwaterpowermagazinecom storyaspc=2U57614 accessed 29lpril 2012
Reitburger B and McCartney M E (2011) Concepts of environmental flow assessment and challenges in the Blue Iile I3asin Ethiopia i11 Nile Rifler B115it Hydroloxy Clinate alld Water Use A M Melesse (cd) ppJ37-35H Springer Heidelberg Germany
SEI (Stockholm Environlllem Instiwte) (2007) WEAl Hlatcr Evaluarion Alld Planning System U5er Cuide Stockholm Environment Institute I3oston MA
SutcliffeJV and ParksY P (1999) The Hydrology fthe Nilr IAHSWallingford UK USBR (United States Bureau ofReclalllation) (1964) Lard and Water Re50urce f lire Bille iVile B05iH Ethiopia
United States Bureau of Reclamation Main report United States Bureau of Reclal11ation Washington DC
VAlCOS (1990) Preimirwry Water Resources neueiopmen [asleY PlanIor Ethipi( Final Rc-port prepared f)r EVDSA Addis Ababa Ethiopia
Whittington D Wu X and Sadoff C (20()5) Water resources management in the Nile Basin the economic value of cooperation ~HlIcr Poicy 7227-252
Yates lJ Sieber] Purkey nand Huber-LeeA (2005) VEAP 21 a demand priority and preference driven water planning model part 1 model characteristics WlIf1 ililertlatiorral 30 4H7~500
YilJ1la D A and Awulachew S 13 (2009) Characterization and atlas of the I3lne Nile I3asin and its sub basins in IprolJCd ~1rcr drld LlIId lvlaI~rmrl1l ill tile Erhiopian H~hlaruls lIs Inpltlct Oil Downstream Stakeholder5 Dependent 011 rhe Blur Nile Intermediate Results Dissemination Workshop held at the International Livestock Research Institute (ILRI) 5-6 Febrmry S B Awulachew T ErkmsaV Smakhtin and F Ashra (cds) Addis Ababa Ethiopia
UJClim the pound40 Local ne 2009 Report submitted to
291

The Nile River Basin
and (iv) manage water resources in a vay that brings benetlts to all To take full advantage of the water resources of the basin it is necessary that they are managed as a single system (ie without considering national borders) that in turn requires the establishment of much more effective institutional arrangements than those currently existing
Introduction
The Blue Nile River is an important shared resource of Ethiopia and Sudan and also because it is the major contributor of water to the main Nile River Egypt However tensions over the basins water resources remain unresolved Although the riparian countries have agreed to collaborate in principle formal mechanisms to cooperatively develop the basins water resources are limited Currently a Cooperative Framework Agreement (CFA) is being negotishyated but this process has been under way for more than a decade and no final agreement has yet been achieved (Cascao 2009) Recently t1ve of the riparian countries Ethiopia Kenya Itvanda Tanzania and Uganda signed an agreement but both Egypt and Sudan remain opposed to the current version
Under the auspices of the Nile Basin Initiative (NBI) twO primary programmes have been established (i) the basin-wide Shared Vision Program designed to build confIdence and capacshyity across the basin and (ii) the Subsidiary Action Program which aims to initiate concrete investments and action at sub-basin level (Metawie 2004) However both programmes are developing slowly and there are few tangible activities on the ground As a result all riparian countries continue to pursue unilateral plans for development
The potential benetlts of regional cooperation and integrated joint basin management are signiticant and well documented (Whittington et al 2005Jigerskog et aI 2007 Cascao 20(9) A prerequisite for such cooperation is the development of shared knowledge bases and approshypriate analytical tools to support decision-making processes Currently knowledge of the basin is fragmented and inconsistent and there is limited sharing of data and information There is also a lack of analytical tools to evaluate water resources and analyse the implications of differshyent development options These are l1l~or impediments to building consensus on appropriate development strategies and cooperative investments in the basin
A number of computer models have been developed to assess various aspects of hydropower and irrigation potential within the Blue Nile and the wider Nile basins (Guariso and Whittington 1987 Georgakakos 2003 Block et al 2007E1ala 2(08) However these models have focused primarily on the upper Blue Nile in Ethiopia and the development of hydraulic infrastructure on the main stem of the river Relatively little attention has been paid to water diversions and development on the tributaries or future development in Sudan
In this chapter we report the t1ndings of research conducted to determine the impact of current and possible future water demand throughout the whole of the Blue Nile Basin (BNE) The Water Evaluation And Planning (WEAP) model was used to evaluate the water resource implications of existing and proposed irrigation and hydropower development in both Ethiopia and Sudan The current situation and two future development scenarios were simulated one representing a relatively near future (the medirmHerm scenario) and the other a more distant future (the long-term scenario) Since year-to-year variation is important for water management 33 years of monthly time step flow data wer2 used to simulate the natural hydrological variashytion in all the major tributaries The water demands of the scenarios incorporating all existing and planned development on both the main stem and the tributaries were superimposed on these time series However because the planned large reservoirs require considerable time to fill a 20-year warm-up period was used and comparison between the scenarios was made over
270
all To take full advantage lanaged as a single system he establishment of much
Sudan and also because However tensions over COuntries have agreed to velop the basins water It (CFA) is being negotishyd no final agreement has lntries Ethiopia Kenya
5Ypt and Sudan remain
r programmes have been d confidence and capacshyllIUS to initiate concrete r both programmes are I As a result all riparian
t basin management are al 2007 Casdio 2009) vledge bases and approshy
knowledge of the basin d information There is e implications of differshynsensus on appropriate
aspects ofhydropower ~ basins (Guariso and However these models elopment of hydraulic has been paid to water 1 Sudan
termine the impact of Uue Nile Basin (BNB) ate the water resource
ment in both Ethiopia )s were simulated one other a more distant Dr water management ral hydrological variashyorporating all existing ere superimposed on considerable time to
narios was made over
Simulating current and future water resources development in the Blue Nile River Basil
13 years Although necessarily based on many assumptions the work illustrates how a relatively simple model used in conjunction with data from both countries can provide a credible basis for assessing possible future water resources development throughout the basin
In the following section of this chapter the natural characteristics and the current socioshyeconomic situation in the basin as well as the planned water resources development are described The following section describes the WEAP model and its configuration and applishycation to the Blue Nile River Basin through development scenarios Thereafter the results are presented and discussed and fmally some conclusions are drawn
Water availability in the Blue Nile River Basin
Natural characteristics
The Blue Nile River (known as the Abay River in Ethiopia) rises in the Ethiopian Highlands in the region ofWest Gojam and flows northward into Lake Tana which is located at an elevashytion ofjust under 1800 m (Figure 141) It leaves the southeastern corner of the lake flowing first southeast before looping back on itself flowing west and then turning northwest close to the border with Sudan In the highlands the basin is composed mainly of volcanic and PreshyCambrian basement rocks with sl11all areas of sedimentary rocks The catchment is cut by deep ravines through which the major tributaries flow The valley of the Blue Nile River itself is 1300 m deep in places The primary tributaries in Ethiopia are the Bosheilo Welaka Jemma Muger Guder Finchaa Anger Didessa and Dabus on the lefi bank and the North Gojam South Gojam Vombera and Beles on the right bank
The Blue Nile enters Sudan at an altitude of 490 maslJust before crossing the frontier the river enters a clay plain through which it flows to Khartoum The average slope of the river from the Ethiopian frontier to Khartoum is only 15 em km Within Sudan the Blue Nile receives water from two major tributaries draining from the north the Dinder and the Rahad both of which also originate in Ethiopia At Khartoum the Blue Nile joins the White Nile to form the main stem of the Nile River at an elevation of 400 masl The catchment area of the Blue Nile at Khartoum is approximately 311548 km
Within the basin rainfall varies significantly with altitude and is to a large extent controlled by movement of air masses associated with the Inter-Tropical Convergence Zone There is considerable inter-annual variability but within Sudan the mean annual rainfall over much of the basin is less than 500 111m and it is as low as 140 mm at Khartoum In Ethiopia it increases from about 1000 mm near the Sudan border to between 1400 and 1800 111m over parts of the upper basin and exceeds 2000 111m in some places in the south (Awulachew el al 20(8) The summer months account for a large proportion of mean annual rainfall roughly 70 per cent occurs between June and September This proportion generally increases with latitude rising to 93 per cent at Khartoum
Potential evapotranspiration also varies considerably and like rainfall is highly correlated with altitude Throughout the Sudanese part of the basin values (computed using the Penman-Monteith method Monteith 1981) generally exceed 2200 mm yr and even in the rainy season Ouly-October) rainpound111 rarely exceeds 50 per cent of potential evapotranspiration Consequently irrigation is essential for tlIe growth of crops In the Ethiopian Highlands potenshytial evapotranspiration ranges from approximately 1300 to 1700 111111 yr and in many places is less than rainfall in the rainy season Consequently rain-fed cultivation producing a single crop in the rainy season is possible though risky in low rainfall years
The flow of the Blue Nile is characterized by extreme seasonal and inter-annual variability
271
900
33OOE
Legend
RIvers IIIIIIIiIIlakes cJ Sub Basins
Ethro_Sudan border
The Nile River Basin
3OOE 3rOOE
N
A
FiJirl 141 Map of the Blue Nile Basin showing the major tribntaries and sub-basins
SoU(e Yilma and AWllIJchew 2009
12OON
9OON
1t Khartoum annual tlovv varies from approximately 23 billion to 63 billion 111 (Figure 142) Mean monthly flow also varies considerably at all locations along the river (Table 141 Figure 143) Typically IUore than 80 per cent of the flow occurs during the flood season Ouly-October) while only 4 per cent of the flow occurs during the dry season (February-May) (Awlliachew ct lt11 20(8)
Current water resources development
Currently Ethiopia utilizes very little of the Blue Nile water partly because of its inaccessibilshyity partly because the major centres of population lie Oll tside of the basin and partly because to date there has been only limited development of hydraulic infrastructure on the river To date only two relatively minor hydraulic structures (ie Chara Chara weir and Finchaa dam) have been constructed in the Ethiopian part of the catchment (Table 142) These two dams were built primarily to provide hydropower They regulate tlow from Lake Tam and the Finchaa River respectively The combined capacity of the power stations they serve (218 MW) represented approximately 13 per cent of the total installed generating capacity of the country in 2009 (ie 1618 MW of which 95 was hydropower) In 2010 a new power station on the Ueles River came on line (see below) and the total illStaIled capacity increased to 1994 MW
272
a
b
e
rO H
1)0
I-basins
illion 01 (Figure 142)
vel (Table 141 Figure
ing the flood season eaSon (February--May)
use of its inaccessibilshy
in and partly because
cture on the river To eir and Finchaa dam)
42) These two dams
1 Lake Tana and the they serve (21 R MW)
pacity of the country
pOwer station on the Teased to 1994 MW
Simulating current and future water resources development in the Blue Nile River Basin
a 70000
60000
50000
l 40000 6 ~ 30000
u
20000
10000
a 1960 1963 1966 1969 1972 1975 1978 1981 1984 1987 1990
b 70000
60000
50000
E 40000 6 l 0 30000
u
20000
10000
a 1960 1963 1966 1969 1972 1975 1978 1981 1984 1987 1990
FitIJrC 142 Annual low of the I3lue Nile measured at (a) Khartollm (1960-1 ()R2) and the EthIOpia-Sudan border (1 0-] 9(2)
Source Data obtlined from the C]ob] Data Runoff Cemre and Ethiopian Ministry ofWatltr Reourc
Agriculture which is the main occupation of the inhabitants in the basin is primarily raill-ted
with almost no irrigation Although there is some informal small-scale irrigation currently the
only formal irrigation scheme in the Ethiopian part of the catchment is the Finchaa sugar cane
plantation (8145 hal which utilizes WJer after it has passed through the Finchaa hydropower plant (11ble 142)
In contrast to Ethiopia Sudan utilizes signiticant volumes ofBlue Nile water for both irri shy
gation and hydropower production Tvo dams Roseires and Sennar) constructed 011 the
273
The Nile River Basin
Table 141 Meln monthly flow (milhon m ) and run-off (mm) measured at gauging stations located on the main stem and major tributaries of the I31ue Nile River
Lorarhm Ja Fch A1af Apr May J1II1 July AI~~ Sept ()a Nav Dec Am11lt
vrain stem
Lke Tana Flow 203 127 94 70 49 45 114 434 )06 B61 541 332 377(
rull-otf 13 B ( 5 3 2 28 59 56 35 22 247 Kessie- Flow 331 221 227 211 20) 258 3003 6594 30HO 1456 7B8 51)3 16881
run-otf l 3 4 3 ) 4 46 IOU 47 22 12 8 257 Border Flow 94) S45 437 359 446 1175 6293 1550213U68 7045 3105 1709 50612
run-otT 5 3 2 2 2 6 31 7H 65 35 1( lt) 253 Khartoul11 Flow 724 44B 406 427 503 1084 4989 15237 13625 7130 2451 1257 48281
run-otf 3 2 2 2 2 4 18 55 50 26 lt) 5 17(
gtCajor tributaries
Beshcilo Flow 4 4 4 5 14 494 1303 527 74 19 9 2462 rl1n~middotoff I) 0 1 03 04 04 1 37 li8 40 6 1 06 18(
Welaka Flow gt 2 2 3 3 7 261 689 279 39 HI 5 n02 ntnotf IU 113 04 04 04 41 107 44 ( 2 07 203
Jemma Flow 6 5 6 7 7 18 662 1748 7fl7 lilO 25 11 )301
run~otT 04 () 1 04 114 05 1 42 III 45 6 2 ()7 20t)
Muger Flow 1 2 2 ( 268 753 112 44 10 4 14112 run-off (jl 01 (11 1)2 (12 07 33 92 38 5 171
Glldcr Flow () () () (I ) 43 66 50 15 () 1H2 run-off (j () o () () ( lt) 2 01 ( 26
Finchd Flow 45 29 21 lH 16 2() lOB 347 464 409 220 91 1786 run-off 11 7 5 4 4 26 85 113 10(1 54 22 437
Anger Flow 44 25 21 22 37 114 386 717 716 436 141 75 2733 runmiddot-otr () 3 3 3 14 49 91 91 55 18 10 346
Didessa Flow 10) 62 52 54 93 23 958 17H2 1779 1084 352 186 6791 run-otf 6 3 3 3 14 49 91 91 55 Iii 10 346
WOlllbera Flow 72 41 34 35 61 187 632 1176 1174 715 233 123 44H3
run-off 6 3 3 3 14 49 )1 91 55 18 10 346 Dabu Flow 306 155 114 88 14 ~14 534 917 1336 146() 107U 602 6H88
run-off 15 7 5 4 5 10 25 44 h4 69 51 2) 32H North Gojam Flow 6 5 ( 8 8 20 730 1927 779 110 27 U 3()39
runmiddotoff 04 04 04 05 05 1 51 134 54 8 2 2)3
Sourh GOjUl1 Flow 7 6 7 9 () 24 855 2257 913 128 32 15 4262 run-off 04 04 04 05 (16 14 51 135 54 H 2 1 254
Bele Flow 6 2 2 1 2 36 J93 846 637 218 42 12 2195 run-off OA 01 01 0 02 3 2ii (O 45 15 155
Rdhad Flow () () IJ I () 132 342 354 201 26 1056
run-off 0 IJ 0 () () 01 16 41 43 24 1 () 1 128 Dinder Flow ( () () () () 17 291 968 917 37( 34 4 2609
run-otT ( I) 0 0 (I 20 65 62 25 2 02 176
Source BCEOM (1998) with slight modifications based on more reClnt feasibility stuciies of ENTRO (2007) and Sutcliffe and Parks (19)9)
main river approximately 350 and 620 km southeast of Khartoum (Table 142) provide hydropower (primarily tor Khartoum) as well as water for several large irrigation schemes These include tbe Gezira irrigation scheme (882000 hal which is one of the largest in the world As well as irrigating land immediately adjacent to the l3lue Nile River some water is diverted from the l3lue Nile downstream of the Roseires reservoir to the Rahad River where it is used to supplement the irrigation of the Rahad irrigation scheme (168037 hal The total
274
g stations located on
llov Dec Annual
541 332 3776 35 22 247
6 788 503 16881 12 8 257
f5 3105 1709 50032 16 9 253
10 2451 1257 48281 9 5 176
19 9 2462 00 186
10 5 1302 2 07 203 25 11 3301 2 07 209 10 4 1402 1 05 171
0 182 01 0 26 220 91 1786 54 22 437 141 75 2733 18 10 346 352 IH6 6791 18 10 346 233 123 4483 18 10 346 1070 602 6888 51 29 328 27 13 3639 2 253 32 15 4262 2 254 42 12 2195 3 1 155 26 1056 3 01 128 34 4 2609 2 02 176
ENTRO (2007) and
Ie 142) provide rigation schemes the largest in the er some water is had River where 37 ha) The total
Simulating current and future water resources development in the Blue Nile River Basin
16
14
12
i 10middot
8middot
~ u 6
4
_ bull _i~ bull Outflow from lake Tana Abay at Kessie bull Blue Nile at EI diem b Blue Nile at Khartoum
FiflIrc 143 Mean monthly flow (million tn) at gauging stations located on the main stem o[ the Blue Nile
SOlmy Data provIded by the Ministry ofWarer Remurces Ethiopia and the UNESCO Chair in Warer Resources Sudan
irrigated area in the Sudanese part of the Blue Nile is estimated to be 1305000 ha consisting of a variety of crops including cotton sugar cane and vegetables The installed power capacity at the two dams is 295 MW which represents 25 per cent of the countrys total generating capacity (ie 1200 MW from both thermal and hydropower stations)
71hle 142 Existing dams in the BIne Nile catchment
Dam Country River Storage Year darn Purposf
(miliott In ) was built
Chara Chara Ethiopia Abay 9100 2000 Regulation of Lake Tana outflows [or
hydropower production at Tis Abay I and
Tis Abay II power stations (installed
capacity 84 MW) and since 2010 for
transfer o[ water to the Beles River
hydropower station (installed capacity
460 MW)
Finchaa Ethiopia Finchaa 2395 1971 Regulation for hydropower production
(installed capacity 134 M W) and also [or
irrigating sugar cane plantations (8145 hal
Roseires Sudan nIue Nile 3024 1964 Regulation tor hydropower production
(installed capacity 280 MW) and [or
sl1pply to irrigation schemes (1305000
hal
SennaT Sudan Blue Nile 930 1925 Regulation tor hydropower production
(installed capacity 15 MW) and [or supply
to irrigation schemes (1093502 hal
Notes This is the active storage of Lake TaIlJ that is controlled by the operation otthe weir (ie jake levels between 1784 and 1787 masl) It represents 24 rimes the average annual ourtlow of the lake There is small dam located on the Amerty River (storage 40 million m) which diverts water [rom the A111erty ftiver into the Finehaa reservoir
275
The Nile River Basin
Future water resources development
Both Ethiopia and Sudan contend that utilization of the Nile water resources is essential for socio-economic development and poverty alleviation Consequently both countries are planshyning significant development of the Blue Nile River water resources ill the future
In Ethiopia current planning is focused primarily on the Lake Tana and the BellS River catchments which have been identified by the government as an economic growth corridor (McCartney ct al 2(10) However additional projects are planned in nearly all the subshycatchments as well as along tbe main river Possible irrigation projects have been investigated over a number of years (eg Labmeyer 1962 USBR 1964 JICA 1977 WAPCOS 1990 BCEOM 1(98) and tbe total potential irrigated area is estimated to be 815581 ha comprisshying 45856 ha of small-scale 130395 ha of medium-scale and 639330 ha of large-scale schemes Of this 461 OOU ha are envisaged to be developed in tbe long term (BCEOM 19(8)
In the Ethiopian Blue Nile more than 120 potential hydropower sites have been identified (WAPCOS 1990) Of these 26 were investigated in detail during the preparation of the Abay River Basin Master Plan (BCEOM 1(98) The major hydropower projects currently being contemplated in Ethiopia have a combined installed capacity of between 3634 and 7629 MW (cf the Aswan High Dam which has an installed capacity of 2100 MW) The exact value depends on the fmal design of the dams and the consequent head that is produced at each The four largest schemes being considered are dams on the main stem of the Blue Nile River Of these schemes the furthest advanced is the Karadobi project for which the pre-feasibility study was conducted in 2006 (NorcollSult2006
In addition to the single-purpose hydropower schemes electricity generation is expected to
be added to several of the proposed irrigation projects where dams are being built This is estishymated to provide an ldditional 216 MW of capacity (BCEOM 199R) The total energy produced by all the hydropower schemes being considered is in the range 16000-33000 GWh yr This represents 20 to 40 per cent of the technical potential in the Ethiopian Blue Nile 70000 GWh yr- i
) estimated by the Ministry ofWater Resources (Beyene and Abebe 2(06) Currently it is anticipated that much of the electricity generated by these power stations will be sold to Sudan and possibly to other countries in the Nile Basin
Sudan is also planning to increase the area irrigated in the BNB Additional new projects OJld extension of existing schemes are anticipated to add an additional 889340 ha by 2025 An additional 4()OO million Ill of storage will be created by raising the height of the existing Roseries dam by 10 111 (Omer 2(10) However currently there are no plans for additional darns to be constructed on the Blue Nile
Technically feasible hydropower energy production in the Nile Basin of Sudan is estimated to be 24137 GWb yr-r (Omer 20(9) 1110St of which is on the main Nile downstream of the White and Blue Nile confluence Currently the Merowe dam with an installed capacity of 2500 MW is being commissioned 011 the Nile downstream of Khartonm Several other major hydropower dams are being planned nOlle of which are to be located on the Blue Nile River
Application of the Water Evaluation And Planning model
Model description
Developed by the Stockholm Environment Institute (SEI) the WEAl model is intended to be used to evaluate planning and management issues associated with water resources development The WEAP model essentially calculates a llJass balance of flow sequentially down a river
276
- resources is essential for both countries are planshyin the future_
lana and the Beles River )I1omic growth corridor d in nearly all the subshyts have been investigated 1977 WAPCOS 1990 be 815581 ha comprisshy39330 ha of large-scale g term (BCEOM 1998) sites have been identifIed preparation of the Abay projects currently being een 3634 and 7629 MW I MW) The exact value is produced at each The the Blue Nile River Of I the pre-feasibility study
eneration is expected to being built This is estishy998) The total energy ge 16000-33()()() GWh
thiopian BIlle Nile (ie yene and Abebe 20(6) 1ese power stations will
dditional new projects 389340 ha by 2025 An height of the existing
lans for additional dams
n of Sudan is estimated ~ile downstream of the U1 installed capacity of m Several other major n the Blue Nile River
gmodel
lode is intended to be ~sources development entially down a river
Simulating currellt alld future water resources development in the Blue Nile River Basin
system making allowance for abstractions and inflows The elements that comprise the water demand-supply system and their spatial relationship are characterized within the model The system is represented in terms of its various water sources (eg surface water groundwater and water reuse elements) withdrawal transmission reservoirs wastewater treatment facilities and water demands user-defined sectors but typically comprising industry mines irrigation and domestic supplyYatcs et aI 2005 SEI 20(7)
Typically the model is configured to simulate a baseline year fc)r which the water availshyability and demands can be confidently determined It is then used to simulate alternative scenarios to assess the impact of different development and management options For each scenario the model optimizes water use in the catchment using an iterative linear programshyming algorithm the objective of which is to maximize the water delivered to demand sites according to a set of user-defined priorities All demand sites are assigned a priority between 1 and 99 where I is the highest priority and 99 the lowest When water is limited the algorithm is formulated to progressively restrict water allocation to those demand sites given the lowest priority In this study the model was configured to simulate the 16 major sub-catchments of the basin (Figure 144a) It was assumed that because hydropower generates greater income it would be considered more important than irrigation by both governments Consequently within WEAP it was given a higher priority than irrigation However all schemes in Ethiopia and Sudan were given the same priority (ie no attempt was made to reflect differences between upstream and downstream locations)
Description of the scenarios
Scenarios are comJllonly used to investigate complex systems that are inherently unpredictable or insufficiently understood to enable precise predictions In this instance although there is reasonable (but not total) knowledge of current (ie 2008) water demand there is comiderable uncertainty about how future water resources development will proceed Consequently a scenario approach was adopted
The model was set up to simulate four scenarios each of which provides a coherent intershynally consistent and plausible description of water demand within the catchment (Table 143 Figure 144a-d)
litle 143 Water resources development scenarios simulated using the Water Evaluation And Planning model
Dcsaipthm -_- ----------------------------~---
No human-made storage and no abstractions so that tlows an assuIlled to be natural This scenario provides J baseline against which all the other scenarios can be assessed
Current The current water resources development situation (around 20(8) including all major
irrigation and hydropower schemes
Medium-term Water resources development (irrigation and hydropower) in the medium-term future future (around 2010-2(25) including al schemes for which feasibility studies have been
conducted
Long-term Water resources developmem (irrigation and hydropower) in the long-term futurt future (around 2025-2050) including schemes that are included in basin master plam bL1t have
not yet reached the feasibility study stage of planning
277
The Nile River Basin
~--------- -~-I
bull Jemma
Jemma Il[ bull Lem
Muger
Flow gHugmg stallOflS e(carewen ama gt 1000 j(nf) ~
Reservoir Gude
a Didessa Finchaa
bull Khano SUDAN
Downstream --- Irrigation upstream of__~__Rahxad Rohalt 148293 ha Lake Tana 7200 ha
Senna 167200 na Di~~---~
Gezira and Managii -- - -~~ ~~nnar 882195ha i
Ou(el Lake Tana
Upstream Sennar 71717 na
Suki 29827 ha
FinchaaDabus
V8145ha
InigallOn
V ReserVOIr Guder
Irrigation schemeb Finchaa
278
Welaka
Simulating current and future water resources development in the Blue Nile River Basin
SuIO 32767 ha North GOlam
I
Irfigaijon upstream of Lake Tan 69053ha
r___ Anger t)v--- Finchaa
Irrigahon o Diversions Flow gaugmg staUons bull 2014500Anger
(catchmmt rpa gt 1~OOO Imf) V Reservoir1445000 GuderVReservoir c FlOchaa
bull Khartoum SUDAN Rahad If 210046ha
6)0 Irriga_ ups1ream ofOownstrean f Lake Tana 69053 ha
lnigalion upstream of Sennar 228111 00
lake Tana 7200 ha ~_ Gezlra and Managil lake iTana NW Lake Tana L~ Pumping 6720ha882195 ha
2424 1 ~ ~ Upom Senna 117626 ha Oul18t Lake Trwa ~ t Oultel Lake Tana --_
~----
Kanana I amp II 4200931gt0 ~ _ O-Cjf Beles ~~ Bosheilo 0 d Upper Dioder 10000 ha-f) ~10( at ~ lit)
Suki 36128 ha r1--- Welaka
_bull~-middot--VDngurDm Upper Bele 537ooha J-----Welaka
Jemma
f lower Beles North Gojam Jemma m ETHIOPIA 85000 ha South GOlam bullbullbull
Loor ) WOmber I Mobrr Dab~ t_ ~aya--tgt _tgtdObl _ A _~ ___~~Se(
Upper ifMuger DD~US ~oe~sa rv Nekemte 11220ha NestleOabus 9661ha bull _ ~
bull T r- 7217 ha C r ~ Anger (t
OOi erslonsDabus ~=ahgation -t- Flnchaa ~ ~ha ~ Ange t 20145ha 17 If 14450 ha V (
Dfversions Arjo 13665h I FinchaVReservoir 1 t 1 J inigalion scheme
--cJ- 8 -+1 ct Guderdiversion41ooha Imgallon scheme d Dldessa Guder
F(iliYe 144 Schematic of the model contlguration for different scenarios (a) the natural situation (b) the current (2008) situation (e) the medium-term (2010-2025) future and (d) the long-term (2025-2050) future
279
The Nile River Basin
Time series of monthly naturalized How data for the period 1960-1992 obtained from the Abay Basin Master Plan (BCEOM 1998) and modified slightly based on more recent feasibilshyity studies (ENTRO 20(7) were used as input data In the future scenarios considerable time is needed to fill the planned large reservoirs particularly those located on the main stem of the Blue Nile River Hence a 20-year warm-up period was introduced and all comparisons benveen scenarios were made tor just the 13 years 1980-1992
Estimates of current irrigation and hydropower demand were derived from data provided by governmcnt ministries and agencies or from prcvious studies These included information on water passing through the turbines of the power stations and water diverted fix irrigation It was necessary to make several assumptions particularly about irrigation demands and the return t]ows from irrigation schemes Net evaporation fiom Lake Tana and the reservoirs was estimated from raillfall and potential evaporation data obtained from the meteorological station located closest to each dam These data were obtained from the FAO LocClirn datJb~lse (FAn 20(2)
For the mediul1l-term and long-term scenarios the sizes of planned hydropower and irrishygation development schemes were derived trom the basin master plan tor the Ethiopian Blue Nile and through discussion with academics and water resource planners in Sudan New schemes proposed extension of existing irrigation schemes as well as planned hydropower developments were identified (Tables 144 and 145) The medium-term scenario includes the Tma-Beles transfer scheme in EthiopiaThis project which involves the transfer of water from Lake lana to the Beles River to generate hydropower actually came on line in 2010 but after the modelling had been undertaken (McCartney ct al 2010)
hJIe 144 Proposed irrigation development in the Biue Nile Hiver Basin
Scheme Sub-basllI Dcsrriplitlfl Estimaled
completioll
dale -------------------------------------------shy
Ethiopia Lake Tana LakeTana Dams to be constructed OIl the major inflows to Lake Tana Medium
(ie Megech Ribb Guman and Gilgcl Abay) term
Total storage 102H million 111
Irrigation area 61 H53 ha
Average annml demand 516 million m
Bcles Belcs Upper Beles scheme 53700 ha Medium
Lower Beles scheme H5OOO ha term
Average annual demand 1554 million 111
Anger Anger Maximum irrigated area 14450 ha Mediulll
Average annual demand 202 million m ternl
Arjo Didessa Arjo scheme 13665 ha Medium
Average annual deIlland 921 million 111 j term
Dinder Dinder (but Upper Dinder scheme 10000 ha Medium
water Average annual demand 982 million m term
transferred
from Beles)
Finch a Finchaa Extemion of existing scheme Medium
Additional area 12000 ha term
Average annual demand 4566 million m j
280
192 obtained from the
1 more recent feasibilshy-ios considerable time 1 the main stem of the
and all comparisons
from data provided by luded information on ~d for irrigation It was nands and the return ~servoirs was estimated logical station located atabase (FAO 2002) hydropower and irri shy)r the Ethiopian Blue mers in Sudan New
planned hydropower scenario includes the transfer ofwater from line in 2010 but after
Estimated wmpletioll date
keTana Medium
term
Medium terlll
Medium term
Medmll1 terlll
Medium
term
Medium term
Simulating current and future water resources development in the Blue Nile River Basin
Table 144 Continned
Schaw Stih-basin Dcltcriplioll rislilllated
date
Rahad and Rahad Rahad and Galegu scheme 15029 ha Long term Average annual demand 607 millioll Ill
Dinder Dinder Dilldcc scheme 49555 hJ Long term Average annual demand 556 million ll1
Guder Guder Guder diversion 4100 ha Long term Guder 4R96 ha
Average annual demand 544 million Ill
Nekemte Anger Nekemte scheme 11220 ha Long term Averaglt anllual demand 715 million Ill
Dides-a Didessa Didessa irrigation scheme 5405R ha Long term
Average annual demand 7694 million 1lJ
Sudan
Raising Blue Nile Roseries dam raised by 10 III to provide total (gross) Medium
Roscries main stem storage of 7400 million m term
Dam
Extension Rahad Additional irrigation area 1J740 ha Medium of Rahad Rahad II irrigation scheme 210000 ha terlll
irrigation 1btal average annual demand 2433 million m
scheme
Extemion J)ue Nile Additional irrigation area 2940 h33361 ha Mediulll
ofSuki main stem Total average allnual demand 201 million m221 million 111 tcrm
irngation scheme
Extension Blue Nile Additional irrigation area 39910 ha Medium
of Upstrealll main stem Total average annual demand 745 million m term Sennar
Extcnsion Blue Nik Additional irrigation area 44110 h36R04 ha Mcdunn
of 11lain StClll Total average annual demand 1414 million Ill long term
Downstream 1526 million Ill
Sennar
Kenana II Blue Nile Additional irrigation area 420093 ha Medium
and III l11alll stelll Average allnual demand 2352 million m tenn
Soutb Dinder Additional irrigation area ~-lO 19 ha48318 hah Medium
Dindtr Average annual demand 541 million m ~51 million 111 II lung term
llotcs Schelllts arc extended partially in the mediUlll-tcnn future Jnd partially in the long-term filturc
IThe slash in the third C01Ulll11 demarcates values lwtweell the llledilllll-tcrm future and the ]ong-ttnll future
For many potential schemes there is currently considerable uncertainty about the dates when they will be completed In the current study it was assumed that for Ethiopian schemes if prefeasibility studies have been undertaken then the scheme will be completed in the mediulll term For all other planned schemes it was assumed that they will be completed in the long term For the Sudanese schemes information on likely completion dates was obtained
281
The Nile River Basin
TiJhle 14) Proposed hydropower development in the Blue Nile River Basin
Scheme Suh-basin Descriptioll Estimated
wmpletioN date
Ethiopia Tana-Beles TlIld and Beles Transfer of water from Lake Tana to Beles catchment for
hydropower production and lrrigatioll Hydropower capacity 460 MW
Average anllual transfer 2424 million 111
Medium
term
Anger Anger Linked to the Anger irrigation scheme Hydropower capacity 18-96 MW
Medium
term
Arjo Didessa Linked to the Atjo irrigation scheme
Hydropower capacity 33 MW
Medium
term
Karadobi Blue Nile main stem
Height of dam 250 m
Total storage 40220 million m
Hydropower capacity 1600 MW
Medium term
Mendaya Blue Nile
main stem
Height of dam 164
Total storage 15900 million 111
Hydropower capacity 1620 MW
Medium
term
Border Blue Nile
main stem
Height of dam 90 111
Total storage 11100 million 111
Hydropower capacity 1400 MW
Long term
Mabil Blue Nile
main stem
Height of dam 170 J1l
Total storage 17200 million III 1
Hydropower capacity 1200 MW
Long term
Lower Didessa Didessa Height of dam 110 Il1
final storage 5510 million 111
Hydropower capacity 1)0 MW
Long terlll
Dabus Dabl1s Linked to the Dabus irrigation cheme
Hydropower capacity 152 MW
Long term
Danguar Beles Height of dam 120 m
Total storage 4640 million m
Hydropower capacity 33 MW
Long term
Lower Daills Dabus Height of dam 50 1Il
10tal storage 1290 million m
Hydropower capacity 164 MW
Long term
from discussions with water resources experts within the country However clearly the two scenarios reflect only an approximate timeline tor water resources development in the basin In reality development is dependent on many external factors and so it is impossible to predict exactly when many planned schemes will actually be implemented or indeed the exact sequencing of schemes As they stand the medium-term and long-term future scenarios represhysent a plausible development trajectory but it is unlikely that it will actually come to pass in exactly the way envisaged
282
Estimated
compleril dale
lent for Medium term
Medium term
Medium
term
Medium term
Medium term
Long term
Long term
Long term
Long term
Long term
Long term
rever clearly the two )ment in the basin In impossible to predict or indeed the exact Iture scenarios represhy1ally come to pass in
Simulating current and future water resources development in tile Blue Nile River Basin
The water withdrawals for irrigation schemes were derived from a variety of sources including the Ethiopia Basin master plan and where available feasibility studies For Sudan useful information on irrigation water use was obtained from a study of the Roseries irrigation scheme (Ibrahim ct al 20(9) In schemes for which there were no data it was assumed that withdrawals per hectare would be similar to those at the nearest scheme where data were availshyable with some allowances for differences in rainf111 where this ditTered signifIcantly between locations Irrigation return flows were estimated from existing feasibility studies and averaged approximately 20 per cent of withdrawals in Ethiopia and 15 per cent in Sudan Where it is planned to extend irrigation schemes the future withdrawals and return flows were estimated based on current values but weighted by the new area Thus no allowance was made tor possishyble future improvements in irrigation dhciency Furthermore no allowance was made tor inter-annual variations in rainfall which might affect irrigation demand between years
Results
Model validation
Figure 145 shows the simulated and observed flows at the Ethiopia-Sudan border and at Khartoum for the current situation At Khartoum observed data (obtained from the Global Data Runoff Centre) were only available tor the period 1960--1982 Over this period the error in the simulated mean annual flow was 19 per cent_ As a result of current abstractions primashyrily tor irrigation in Sudan the flow at Khartoum is estimated to be approximately 7J-l billion m yc less than would have occurred naturally over this period (ie 424 billion 111 yr- 1 rather than 502 billion tn yr 1) At the border there are two flow gauging stations One is operated by the Government of Ethiopia and just a few kilometres downstream another is operated by the Government of Sudan Possibly because of differences in periods of missing data observed flows at these two stations differ and there is a 10 per cent difference in mean annual flow over the period 1960-1992 506 billion m measured by Ethiopia and 455 billion m measured by Sudan Without a detailed analysis which was beyond the scope of the present study it is not possible to know which of the two flow series is the more accurate The WEAP model simushylation falls between the two with a mean annual discharge of 462 billion m
Figure 146 compares the simulated and observed water levels of Lake Tana also over the period 1960-1992 Although the average simulated water level (17863 masl) is close to the observed average (17860 masl) it is clear that the variability ill the simulated water levels does not quite match that of the observed levels Nevertheless these results in conjunction with the flow results indicate that the WEAP simulation of the current situation is reasonably accurate and provides credibility for the results of the simulated future scenarios
Comparison ofscenarios
Currently irrigation water withdrawals in Sudan greatly exceed those in Ethiopia because of the differences in irrigated area The total irrigation demand in Sudan is estimated to average 845 billion nr yr-This compares with an average ofjust 026 billion m yr- in EthiopiaWith the planned irrigation development demand is estimated to increase to 1339 billion and 238 billion m yC in the medium-term scenarios and to 1383 billion and 381 billion 111 yr 1 in the long-term scenarios in Sudan and Ethiopia respectively (Table 146) If all planned dams are constructed the total reservoir storage in Ethiopia is estimated to increase to 70 billion Ill (ie 15 times the mean annual flow at the border) in the mid-term and to 167 biJ1ion 11 (ie
283
The Nile River Basin
36 times the mean annual flow at the border) in the long term Hydropower generated in Ethiopia from the Tis Abay and Finchaa power stations is currently estimated to be 1383 GWh yr With the construction of the Tana Ueles transfer the Karadobi dam and other smaller schemes this is estimated to increase to 12908 GWh yr in the medium term With Uorder Mendaya and Mabil hydropower stations as well as with additional smaller schemes electricity production in the long terll1 could increase to 31297 GWh yr
Hydropower generated on the U1ue Nile in Sudan is currently estimated to be just over 1000 GWh ye but there arc no publicly available data to confirm this estimate Because of the additional head and increased storage the raising of the Roseries dam will result in a very small increase to 1134 GWh yr I in the medium term and to 1205 GWh yr I in the long term The increase in the long term is due entirely to greater dry season resulting from increased regulation upstream in Ethiopb
40000a bull bullI35000
bull30000 bull 25000 bullbull
bull l
f bull I I I
~ 20000 ~ o I f u 15000 I~10000
II bull III bull I III III rl ~ 5000 II II I I
bull bull t II Ie IIbull middotI bull o
0 0 0 M VI 0) N VI 00 0 co ltXl q~ i9 C C C C c c C c c C C S C C t S ~ ~ ~ ~ ~ ~ ~ ~ ~ ~ ~
- Observed Flow at Khartoum bullbullbullbullSimUlated Flow at Khartoum
18000
16000
14000 ~E
eshy 12000
g ~ 10000 gtshyc 8000C 0 E 6000 c ltlgt 40002
2000
0
Jan Feb Mar Apr May June July Aug Sep Oct Nov Dec
- Observed flow at Khartoum bullbullbullbull Simulated flow at Khartoum
b
cu cat
ah lIH
tio lIlt
284
ropower generated in ated to be 1383 GWh
am and other smaller m term With Border
b
Simulating current and jutllre water resources development in the Blue Nile River Basin
40000
middot 35000 t I
30000 t I
er schemes electricity
11ated to be just over timate Because of the J result in a very small in the long term The u1ting from increased
- 0
C 9 q 0 i~ ~i Ji
lUm
-
~ -ltshy
~ ~ - _ Nov Dec
n
_ 25000 E 620000 0 u 15000
10000
5000
0
-
18000
16000
~ 14000 ~E
5 12000
g 10000 raquo
J 8000C 0 E 6000 c (J) 4000i
2000
o
bullbull
0 - 0 0 N M 0 0 q~ ~ ~ 9 r-- r-- - r-- P P f ltXl f l i c r C i C i c C C c ~ ~ ~ ~ ~ ~ ~ ~ ~ ~ ~Ji Ji Ji Ji Ji Ji Ji Ji Ji Ji Ji
Observed flow at the border - - - bull Simulated flow at the border
Measured MAF in Ethiopia 5068 m
Measured MAF in Sudan = WEAP Simulated MAF = 462 8m
455Bm
Jan Feb Mar Apr May June July Aug 5ep Oct Nov Dec
- Observed flow in Ethiopia - - - bull Simulated flow at the border
-- Observed flow in Sudan
F(qWf 145 Simulated and observed flow series and mean monthly flows (1960-1992) for the Blue Nile (current situation) at (a) Khartoum and (b) the Ethiopia-Sudan border
Comparison of the mean monthly flows at Khartoum tor the simulated natural condition current situation and the mediulIl- and long-term scenarios tor the 13 years 1980-1 SlSl2 indishy
cates how the mean annual flow is progressively reduced as a consequence of greater upstream abstractions (Table 147) Wet season flmvs are reduced significantly but dry season flows are increased as a consequence offlow regulation (Figure 147Table 147) Under natural condishytions 84 per cent of the river flow occurs in the wet season months (July-October) In the medium-term and long-term scenarios this is reduced to 61 and 37 per cent respectively
285
The Nile River Basin
17875
17870
17865
17860
17855
I
17850 0 M U r- 00 0 N ~ U r- 01 N ~ 0 00 01 0 0 0 r- r- r- I 00 00 00 co cof r- r- ~ C ~ C ~ C C C
u 5 3 u 5 Q u 5 Q u 5 Q uC1l C1l C1l C1l C1l ~ 0 lt( 0 lt( 0 lt( 0 lt( 0
- WEAP simulated water level bullbullbullbullbull Observed water level
Figure 146 Simulated and observed water levels in Lake Tana (1960-1992)
Tablc 146 Comparison of current Jnd future irrigation demand and hydropower production in the Ethiopian and Sudanese parts of the Blue Nile
Curreri Jfedil1n-lerm Ji4t1ire LOl1g-teml future
Eilliopia Slldal1 Ethiopia Sudal1 Ethiopia SlIdml
Total storage (lllillion 111) ] l57H 3370 70244 10770 167079 10770
Formal irrigatiotl Area (ha) lt]0000 ]305000 210000 2]26000 461000 2190000
Water withdrawJls per year 026 845 238 1339 381 n83 (millio1111l yr)
Hydropower Installed capacity (MW) 218 295 2194 295 6426 295 Production (GWh yr ) 1383 1029 12908 1134 31297 1205
10[( Allowance llladc for sedinlentation of both the Roscrlcs and Sennar reservoirs
At the Ethiopia-Sudan border the current situation is almost identical to the natural condishytion so this is not shown (Figure 147) Mean annual flow is reduced from 452 to 432 and 427 billion nr in the medium-term and long-term future scenarios respectively As in Khartoum there is a significant reduction in wet season flows but there are signifICant increases
in dry season flows as a consequence of flow regulation (Figure 147Table 147) Under natushyral conditions 81 per cent of the river flow occurs in the wet season but this decreases to 59 and 43 per cent in the medium-term and long-te-m scenarios respectively The total decrease in border flow in the long-term scenario is less than might be ex-pected given the increased
286
ltt 00 000 00 00 J or CiJ C Q ra u laquo 0
water level
ver production in the
LOlx-term fu lure
Ethiopia
167079
461000 381
6426 31297
Sudan
10770
2190000 1383
295 1205
Simulating current al1d future water resources developmel1t il1 the Blue Nile River Basin
a 18000 Simulated natural MAF 482 Bm 3
Simulated current MAF =40A Bm 316000 Simulated medium -term future MAF =33ABm 3f 14000 Simulated long-term future MAF =319Bm 3
~ 12000
~ 10000 gt -pound 8000 c 0 E 6000 c
~ (1l 4000
2000
0
Jan Feb Mar Apr May June July Aug Sep Oct Nov Dec
-Natural flow -Current flow - - -Medium-term future _ Long-term future
18000 Simulated natural MAF = 452 Bm3
16000
b
Simulated current MAF = 452 Bm)
f 14000 Simulated medium middotterm future MAF = 432 Bm 3
Simulated longmiddotterm future MAF =427 Bm~ 12000 3 g 10000 gt pound 8000 c 0
6000E c
~ (1l 4000
2000
0
Jan Feb Mar Apr May June July Aug Sep Oct Nov Dec
- Natural flow - - bull Medium-term future _ Long-term future
Fixure 147 Comparison of simulated mean monthly flow derived for natural current mecHum-term and long-term future scenarios at (a) Khartoum and (b) the Ethiopiamiddot-Sudan border
irrigation demand in Ethiopia The reason is partly that less water is diverted fi-om the Tana to the Beles catchmem ano more flow is routed down the main stem of Blue Nile
rurrently shortfalls (ie failure in any given month to supply the full amount of water needed for irrigation withdrawals or hydropower needs) in Ethiopia are negligible However in the medium-term scenario shortfalls increase to 08 and 50 billion m l yr for irrigation and hydropower respectively In the long term the increased storage means that shortfalls will avershyage 04 billion m for irrigation and 07 billion m l yr- for hydropower In comparison under current conditions there is an average shortfall of 08 billion m in water for the Sudanese irrigation schemes However because of the improved flow regulation there are no shortfalls in irrigation or hydropower in Sudan in either the medium- or the long-term scenarshyios These results reflect the fact that in each scenario the Sudanese schemes were given the same priority as those in Ethiopia Hence although in the medium term and long term more water is stored in Ethiopia in these scenarios no preference was given to the schemes in Ethiopia
I to the natural condishyrom 452 to 432 and )S respectively As in
re significant increases le 147) Under natushyIt this decreases to 59
dy The total decrease f given the increased
287
The Nile River Basin
lablr 147 Simulated mean monthly flow (million m) at the Ethiopia-Sudan border and Khartoum for natural current medium- and long-term tiJture scenarios (1980-1992)
Atom Naruml Currcrlt Aledium-term filturr Long-term future Border Khartollm Border Khartoum Border Khartoutll Border Khartoum
--~---~-~--------~---------
January 835 835 955 B55 1565 3220 2710 4405 February 470 470 380 740 1180 2220 2110 3175 March 350 350 400 475 845 1615 19BO 2770 April 310 310 520 620 710 1315 1635 2250 May 390 390 645 710 680 1235 14B5 2055
June 980 990 1230 640 1390 2273 2203 3125
July 5930 6235 6105 5365 3870 2560 4820 3420 August 15770 16830 15430 15950 8400 8615 4H20 4245 September 10590 116HO 10130 10165 H020 7490 4665 3760 October 53()O SH25 4970 3865 5315 1740 4105 420 November 2750 2795 2() 15 3JO 8870 2ltgt0 9095 250 December 1510 1510 1575 740 2305 H50 3055 1990 10ta1 45245 48220 45155 40435 43150 33395 426H5 3LB65
Net evaporation (ie the difference between evaporation trom a reservoir and the rainfall directly onto its surface) from the Ethiopian reservoirs currently averages 08 billion m yr- However by f3r the bulk of this is from Lake Tana which is a natural geographic feature and would be evaporating even without regulation By comparison net evaporation from the Sudanese reservoirs is 04 billion 111 yr- In the medium term this increases to 12 billion 111
yr in Ethiopia (03 billion m yr excluding Lake Tam) and to 14 billion m yr in Sudan The increase in Sudan is due to the increased area of the Roseries reservoir arising from raisshying the Roseries Dam and the fact that water levels in both Roseries and Sennar reservoirs are maintained at higher levels because of the higher dry season inflows In the long term total net reservoir evaporation increases to 17 billion m yr in Ethiopia (08 billion 111 yr bull excluding Lake Tam) and remains at 14 billion m l yr- in Sudan However evaporation losses per cubic metre of water stored are considerably lower in Ethiopia than in Sudan in all the scenarios In
fact as a result of the locations of the planned reservoirs as storage increases in Ethiopia losses per cubic metre of water stored decrease significantly over time (Table 14H)
labe 148 Simulated average annual net evaporation trom reservoirs in Ethiopia and Sudan for each of the scenarios
Sccnario Ethiopir SHdml
Tiltal lillal EJaptJratiou Iblal Iotal Elapomrioll storage evaporation from stOlalZe st()ra~e (U(1poration fn)Jn _f)ra~~l
(millioll ml (millivlI II) Imm) (millioll m) (millioll tn) (m i 111-)
Current 1157il H46 007 3370 443 013 Medium term 70244 l1SB (l02 10770 1363 013 Long term 167079 1732 Cl01 10770 13H7 013
N(lres Including from Lake 1ma which is a natural lake though regulated by the Char Chara weir
288
der and Khartoum for )
Long-term future Border Khartoum
2710 4405 2110 3175 1980 2770 1635 2250 1485 2055 2205 3125 4820 3420 4820 4245 4665 3760 4105 420 9095 250 3055 1990 42685 31865
~voir and the rainfall s 08 billion m 1 yc agraphic feature and vaporation from the Ises to 12 billion m on m yr I in Sudan oir arising from raisshySennaI reservoirs are long term total net on 111 yr excluding tion losses per cubic I all the scenarios In es in Ethiopia losses 8)
Ind Sudan fix each of
Euaporati()11 )ratiol1 I1om _forage
Oil m (111 I1l )
013 013 013
nra we-ir
Simulating current and future water resources development in the Blue Nile River Basin
Discussion
The results presented in this chapter are based on many assumptiolls Lack of data on flow and water demand and use particularly in Sudall makes it very difficult to validate the model for the current situation However where it has been possible to verifY them the model results appear to be reasonably accurate For example in the current scenario simulated flows closely match the observed flows at key locations on the main stem of the river and the simulated water levels in Lake Tana were reasonably accurate (Figures 145 and 146) Consequently though the results should be treated with caution they arc believed to be broadly indicative of the likely impacts arising trom the development currently being considered in both Ethiopia and Sudan By illustrating what may occur the scenarios provide information that is useful for resource pbnning and the results provide a basis for discussion
Climate and hence hydrological variability possibly increased by future climate change will remain key tilCtorS in the economic development of both Ethiopia and Sudan in the future As in the past future water resources development in the Blue Nile will be driven predominantly by the need felf water for agriculture and hydropower and hence the need for large volumes of stored water Irrigation will remain by filf the largest user of water and the future scenarios indicate significantly increased water withdrawals as a conseqnence of increasing irrigation predominantly in Sudan and also increasingly in Ethiopia The construction of the dams particularly the very large hydropower dams proposed by Ethiopia though not consuming large amounts of water vill sihrnificantly alter the flow regime of the river resulting in lower wet season flows and much greater dry season flows The results of this are likely to be benetlmiddotshycial for SudanThe frequency of flooding which occurs ewry few years in the flat areas of the country and is particularly devastating in and around Khartoum may be reduced Higher dry season flows mean greater availability of water at a time when it is naturally scarce and hence increased opportunities for withdrawals f()r irrigation and other uses Thus increased water storshyage in Ethiopia has the potential to provide benefits for Sudan too
As a result of higher rainfall and lower evaporative demand net evaporation loss per cubic metre of water stored in the Ethiopian reservoirs (including Lake Tana which is a natural lake) is currently approximately 50 per cent of that in Sudan As more water is stored in Ethiopia this ratio decreases so that in the long term it could be as low as 8 per cent of that in Sudan (Table 148) This confirms that one of the most signifICant benefits of storing water in the Ethiopian Highlands rather than in the lower more arid regions ofSudan (or indeed in Egypt) is significantly reduced evaporation losses
For all scenarios the model was run as a single system making no allowance tor the fact that Ethiopia and Sudan are separate countries Water demands in Sudan were given the same priorshyity as those in Ethiopia and water was released from reservoirs in Ethiopia to meet downstream demands in Sudan This assumes a much higher level of cooperation between the two states in relation to both the planning and managel1lent of water resources than at present
Future research is needed to refme the model Key to improving the simulatiom are
improved estimates of irrigation water demand improved estimates of the dates on which schemes will become operational more realistic dam operating rules detailed economic livelihood and environmental assessments of the cumulative impacts of all the proposed schemes and evaluation of the possible hydrological implications of climate change
289
The Nile River Basin
An important issue not considered in the current model simulations is the transient stages of reservoir tilling Given the large cumulative volume of the planned reservoirs in Ethiopia it is essential that reservoir filling is planned and managed in such a way that adverse downstream impacts including potentially negative environmental and social impacts are minimized The need to give due consideration to dam operation that provides for environmental (lows to avoid degradation of riverine ecosystems has recently been emphasized (Reitburger and McCartney 2(11)
Conclusion
The WEAP model has been configured to simulate the impacts of water resources developshyment in the I3NI3 Currently Ethiopia utilizes very little water for irrigation but does reb1llate some tlow for hydropower production In contrast Sudan uses some water for hydropower production and also abstracts large volumes for irrigation Both countries plan to develop water resources substantially in the near future The extent to which actual water resources developshyment will match the plans of both countries in the long term is unclear and will depend a lot on unpredictable social and economic factors However in both Ethiopia and Sudan hydropower and irrigation are widely perceived as critical to national development and in both countries current investment in water infrastructure is substantial and increasing Consequently pressures on water resources are rising and will increase substantially in the near future
The results of this study have confirmed that if the states cooperate effectively mutually beneficial scenarios are possible upstream regulation in Ethiopia reduces evaporation losses probably reduces the frequency of flooding and provides opportunities for greatly increased water development in Sudan However maximizing benefits and minimizing potential adverse impacts (eg to the environment) especially when the large reservoirs are being filled require much greater cooperation than currently exim between the riparian states The key to success is the establishment of pragmatic institutional arrangements that enable the water resources of the basin to be planned and managed as a single entity (ie without consideration of national borders) in the most effective and equitable manner possible It is to be hoped that such arrangements will be devised through the protracted negotiations currently under way
References
Awulachew S B McCartney M P Steenhuis T SAhmedAA (200H) A Review oHydrology Sedimcnt and vVater Resource Use ill the Blue Nile Basil International Water Management Institute Colombo Sri Lanka
[lCEOM (1998) Abbay RiFcr Basin Jltlc~ralcd Development A1astcr Plan Section II v[lilme v 11latcr Resources De1Jeopcnl Parr 1 1rr(~ion awl Draillfljlc Ministry ofWater Resources Addis Abtba Ethiopia
Beyelle T md Abebe Jv1 (2006) Potential and development plan in Ethiopia Hydropower and Datlls 13 61-64
Block P Strzepek K and Rajagopalan B (2007) blfegrated Jv1anagement of till Blue Nile Basin ill Ethiopia Hydropower and Irr(llaquo(lrion rvtdeli~ IFPRI Discussion Paper 00700 International Food Policy Research Institute Wasbington DC p22
Cascao1 E (2009) Changing power relations in the Nile River Basin Cnilateralism vs cooperation Water Alternalives 2 2 245-268
Ebla G (2008) Study ofMainstem Dams on the Blue Nile MSc thesis Arba Minch University Ethiopia pp94 ENTRO (Eastern Nile Technical Regional Office) (2007) Preeasibility study of Border Hydrnpucr PJfct
Ethiopia ENTROAddis Ababa Ethiopia FAO (Food and Agriculture Organization of the Cnited Nations) (2002) Aruwuncing LJCCim the FAa Local
Climate Estimator CDROll] wwwfaoorgsd2002EN1203a_enhtm accessed June 2009 GeorgakakosA P (200)) Nile Decision Support Tool (Nile DST) Executive Summary Report submitted to
FAO and the Nile riparian states Rome Italy June
290
Ie transient stages of Dirs in Ethiopia it is adverse downstream are minimized The iron mental flows to ed (Reitburger and
r resources developshym but does regulate Iter for hydropower Ian to develop water r resources developshyI1d will depend a lot hiopia and Sudan opment and in both asing Consequently e near future effectively mutually evaporation losses or greatly increased ng potential adverse being filled require The key to success e water resources of deration of national )e hoped that such y under way
Hydrolog Sedimcrll and ~ Colombo Sri Lanka fume ~ Hlaler Resources lba Ethiopia
and Dams 13
Nile Basin ill Ethiopia Food Policy Research
vs cooperation Hlatcr
iversiry Ethiopia pp94 dey Hydropower Project
Simulating current and future water resources development in the Blue Nile River Basin
Guariso C and Whittington n (19H7) Implications of Ethiopian water development for Egypt and Sudan bltcrnaliltllllllJolJrnal Hater Resources Dncpmml 3 2 105-114
IbrahimY A Ahmed A A and Ramdan M S (2009) Improving water management practices in the Rahad Scheme (Sudan) in Improved Hlaler md Lmd lvanuJlClllcnt ill Ihe Ethiopian H(~hlallds lis lmpaa 01
DowlIStrealgtl Stakrlwlders Dependent )11 tile Blllt Nile Intermediate Results Dissemination Vorkshop held at the International Livestock Research Institute (ILRI) 5-6 February S 13 Awulachew T Erkossa V Smakhtin and EAshra (eds)Addis Ababa Ethiopia
Jigerskog A GranitJ Risberg A and Yn V (2007) Tramboundary water management as a regional public good in fillaflcil1g Exampllfrom rhe Nile Basin Report no 20 SIWI Stockholm Sweden
JICA (lapan International Cooperation Agency) (1997) Feasibility Reporr uti Power Declopmellt at Lake lim Rf~IOIIJapan Internatiol Cooperariol1 Agency Tokyo Japan
Lahmeyer Consulting Engineers (1962) GilJlfl Abay Scheme Imperial Ethiopian Government Ministry of Public Works Addis Ahaba Ethiopia
McCartney M I~ Alcmayehu T Shiferaw A and Awulachew S ]3 (2010) Evaluation of current and future water resources development in the Lake Tana Basin Ethiopia IWMI Research Report 134 International Water Management Institute Colombo Sri Lanka
MetawieA E (2()04) History of co-operation in the Nile Basin Hlater Resources Dedopmer 20 147-63 MonteithJ L (1981) Evaporation and surface temperature QII1rIcry Joumal of lile Royal A1etrorologiral SariOy
107 1~~27
Norconsult (2006) Karadobi Hultipurpo5c Projea Preea5ibility Sludy Report to the Ministry of Water ResoUTces The Federal Republic of Ethiopia Addis Ababa Ethiopia
Omer A M (2009) Hydropouer polcurial atld Priority for Dams Developmel1t ill Slitiall wwwscitopicscomHydropower_potentiaLand_priority_for_da1l1s_developmellcill_Suda11html accessed November 2010
Omer A M (2010) S14dmese dec[opmelll 20 September wwwwaterpowermagazinecom storyaspc=2U57614 accessed 29lpril 2012
Reitburger B and McCartney M E (2011) Concepts of environmental flow assessment and challenges in the Blue Iile I3asin Ethiopia i11 Nile Rifler B115it Hydroloxy Clinate alld Water Use A M Melesse (cd) ppJ37-35H Springer Heidelberg Germany
SEI (Stockholm Environlllem Instiwte) (2007) WEAl Hlatcr Evaluarion Alld Planning System U5er Cuide Stockholm Environment Institute I3oston MA
SutcliffeJV and ParksY P (1999) The Hydrology fthe Nilr IAHSWallingford UK USBR (United States Bureau ofReclalllation) (1964) Lard and Water Re50urce f lire Bille iVile B05iH Ethiopia
United States Bureau of Reclamation Main report United States Bureau of Reclal11ation Washington DC
VAlCOS (1990) Preimirwry Water Resources neueiopmen [asleY PlanIor Ethipi( Final Rc-port prepared f)r EVDSA Addis Ababa Ethiopia
Whittington D Wu X and Sadoff C (20()5) Water resources management in the Nile Basin the economic value of cooperation ~HlIcr Poicy 7227-252
Yates lJ Sieber] Purkey nand Huber-LeeA (2005) VEAP 21 a demand priority and preference driven water planning model part 1 model characteristics WlIf1 ililertlatiorral 30 4H7~500
YilJ1la D A and Awulachew S 13 (2009) Characterization and atlas of the I3lne Nile I3asin and its sub basins in IprolJCd ~1rcr drld LlIId lvlaI~rmrl1l ill tile Erhiopian H~hlaruls lIs Inpltlct Oil Downstream Stakeholder5 Dependent 011 rhe Blur Nile Intermediate Results Dissemination Workshop held at the International Livestock Research Institute (ILRI) 5-6 Febrmry S B Awulachew T ErkmsaV Smakhtin and F Ashra (cds) Addis Ababa Ethiopia
UJClim the pound40 Local ne 2009 Report submitted to
291

The Nile River Basin
Table 141 Meln monthly flow (milhon m ) and run-off (mm) measured at gauging stations located on the main stem and major tributaries of the I31ue Nile River
Lorarhm Ja Fch A1af Apr May J1II1 July AI~~ Sept ()a Nav Dec Am11lt
vrain stem
Lke Tana Flow 203 127 94 70 49 45 114 434 )06 B61 541 332 377(
rull-otf 13 B ( 5 3 2 28 59 56 35 22 247 Kessie- Flow 331 221 227 211 20) 258 3003 6594 30HO 1456 7B8 51)3 16881
run-otf l 3 4 3 ) 4 46 IOU 47 22 12 8 257 Border Flow 94) S45 437 359 446 1175 6293 1550213U68 7045 3105 1709 50612
run-otT 5 3 2 2 2 6 31 7H 65 35 1( lt) 253 Khartoul11 Flow 724 44B 406 427 503 1084 4989 15237 13625 7130 2451 1257 48281
run-otf 3 2 2 2 2 4 18 55 50 26 lt) 5 17(
gtCajor tributaries
Beshcilo Flow 4 4 4 5 14 494 1303 527 74 19 9 2462 rl1n~middotoff I) 0 1 03 04 04 1 37 li8 40 6 1 06 18(
Welaka Flow gt 2 2 3 3 7 261 689 279 39 HI 5 n02 ntnotf IU 113 04 04 04 41 107 44 ( 2 07 203
Jemma Flow 6 5 6 7 7 18 662 1748 7fl7 lilO 25 11 )301
run~otT 04 () 1 04 114 05 1 42 III 45 6 2 ()7 20t)
Muger Flow 1 2 2 ( 268 753 112 44 10 4 14112 run-off (jl 01 (11 1)2 (12 07 33 92 38 5 171
Glldcr Flow () () () (I ) 43 66 50 15 () 1H2 run-off (j () o () () ( lt) 2 01 ( 26
Finchd Flow 45 29 21 lH 16 2() lOB 347 464 409 220 91 1786 run-off 11 7 5 4 4 26 85 113 10(1 54 22 437
Anger Flow 44 25 21 22 37 114 386 717 716 436 141 75 2733 runmiddot-otr () 3 3 3 14 49 91 91 55 18 10 346
Didessa Flow 10) 62 52 54 93 23 958 17H2 1779 1084 352 186 6791 run-otf 6 3 3 3 14 49 91 91 55 Iii 10 346
WOlllbera Flow 72 41 34 35 61 187 632 1176 1174 715 233 123 44H3
run-off 6 3 3 3 14 49 )1 91 55 18 10 346 Dabu Flow 306 155 114 88 14 ~14 534 917 1336 146() 107U 602 6H88
run-off 15 7 5 4 5 10 25 44 h4 69 51 2) 32H North Gojam Flow 6 5 ( 8 8 20 730 1927 779 110 27 U 3()39
runmiddotoff 04 04 04 05 05 1 51 134 54 8 2 2)3
Sourh GOjUl1 Flow 7 6 7 9 () 24 855 2257 913 128 32 15 4262 run-off 04 04 04 05 (16 14 51 135 54 H 2 1 254
Bele Flow 6 2 2 1 2 36 J93 846 637 218 42 12 2195 run-off OA 01 01 0 02 3 2ii (O 45 15 155
Rdhad Flow () () IJ I () 132 342 354 201 26 1056
run-off 0 IJ 0 () () 01 16 41 43 24 1 () 1 128 Dinder Flow ( () () () () 17 291 968 917 37( 34 4 2609
run-otT ( I) 0 0 (I 20 65 62 25 2 02 176
Source BCEOM (1998) with slight modifications based on more reClnt feasibility stuciies of ENTRO (2007) and Sutcliffe and Parks (19)9)
main river approximately 350 and 620 km southeast of Khartoum (Table 142) provide hydropower (primarily tor Khartoum) as well as water for several large irrigation schemes These include tbe Gezira irrigation scheme (882000 hal which is one of the largest in the world As well as irrigating land immediately adjacent to the l3lue Nile River some water is diverted from the l3lue Nile downstream of the Roseires reservoir to the Rahad River where it is used to supplement the irrigation of the Rahad irrigation scheme (168037 hal The total
274
g stations located on
llov Dec Annual
541 332 3776 35 22 247
6 788 503 16881 12 8 257
f5 3105 1709 50032 16 9 253
10 2451 1257 48281 9 5 176
19 9 2462 00 186
10 5 1302 2 07 203 25 11 3301 2 07 209 10 4 1402 1 05 171
0 182 01 0 26 220 91 1786 54 22 437 141 75 2733 18 10 346 352 IH6 6791 18 10 346 233 123 4483 18 10 346 1070 602 6888 51 29 328 27 13 3639 2 253 32 15 4262 2 254 42 12 2195 3 1 155 26 1056 3 01 128 34 4 2609 2 02 176
ENTRO (2007) and
Ie 142) provide rigation schemes the largest in the er some water is had River where 37 ha) The total
Simulating current and future water resources development in the Blue Nile River Basin
16
14
12
i 10middot
8middot
~ u 6
4
_ bull _i~ bull Outflow from lake Tana Abay at Kessie bull Blue Nile at EI diem b Blue Nile at Khartoum
FiflIrc 143 Mean monthly flow (million tn) at gauging stations located on the main stem o[ the Blue Nile
SOlmy Data provIded by the Ministry ofWarer Remurces Ethiopia and the UNESCO Chair in Warer Resources Sudan
irrigated area in the Sudanese part of the Blue Nile is estimated to be 1305000 ha consisting of a variety of crops including cotton sugar cane and vegetables The installed power capacity at the two dams is 295 MW which represents 25 per cent of the countrys total generating capacity (ie 1200 MW from both thermal and hydropower stations)
71hle 142 Existing dams in the BIne Nile catchment
Dam Country River Storage Year darn Purposf
(miliott In ) was built
Chara Chara Ethiopia Abay 9100 2000 Regulation of Lake Tana outflows [or
hydropower production at Tis Abay I and
Tis Abay II power stations (installed
capacity 84 MW) and since 2010 for
transfer o[ water to the Beles River
hydropower station (installed capacity
460 MW)
Finchaa Ethiopia Finchaa 2395 1971 Regulation for hydropower production
(installed capacity 134 M W) and also [or
irrigating sugar cane plantations (8145 hal
Roseires Sudan nIue Nile 3024 1964 Regulation tor hydropower production
(installed capacity 280 MW) and [or
sl1pply to irrigation schemes (1305000
hal
SennaT Sudan Blue Nile 930 1925 Regulation tor hydropower production
(installed capacity 15 MW) and [or supply
to irrigation schemes (1093502 hal
Notes This is the active storage of Lake TaIlJ that is controlled by the operation otthe weir (ie jake levels between 1784 and 1787 masl) It represents 24 rimes the average annual ourtlow of the lake There is small dam located on the Amerty River (storage 40 million m) which diverts water [rom the A111erty ftiver into the Finehaa reservoir
275
The Nile River Basin
Future water resources development
Both Ethiopia and Sudan contend that utilization of the Nile water resources is essential for socio-economic development and poverty alleviation Consequently both countries are planshyning significant development of the Blue Nile River water resources ill the future
In Ethiopia current planning is focused primarily on the Lake Tana and the BellS River catchments which have been identified by the government as an economic growth corridor (McCartney ct al 2(10) However additional projects are planned in nearly all the subshycatchments as well as along tbe main river Possible irrigation projects have been investigated over a number of years (eg Labmeyer 1962 USBR 1964 JICA 1977 WAPCOS 1990 BCEOM 1(98) and tbe total potential irrigated area is estimated to be 815581 ha comprisshying 45856 ha of small-scale 130395 ha of medium-scale and 639330 ha of large-scale schemes Of this 461 OOU ha are envisaged to be developed in tbe long term (BCEOM 19(8)
In the Ethiopian Blue Nile more than 120 potential hydropower sites have been identified (WAPCOS 1990) Of these 26 were investigated in detail during the preparation of the Abay River Basin Master Plan (BCEOM 1(98) The major hydropower projects currently being contemplated in Ethiopia have a combined installed capacity of between 3634 and 7629 MW (cf the Aswan High Dam which has an installed capacity of 2100 MW) The exact value depends on the fmal design of the dams and the consequent head that is produced at each The four largest schemes being considered are dams on the main stem of the Blue Nile River Of these schemes the furthest advanced is the Karadobi project for which the pre-feasibility study was conducted in 2006 (NorcollSult2006
In addition to the single-purpose hydropower schemes electricity generation is expected to
be added to several of the proposed irrigation projects where dams are being built This is estishymated to provide an ldditional 216 MW of capacity (BCEOM 199R) The total energy produced by all the hydropower schemes being considered is in the range 16000-33000 GWh yr This represents 20 to 40 per cent of the technical potential in the Ethiopian Blue Nile 70000 GWh yr- i
) estimated by the Ministry ofWater Resources (Beyene and Abebe 2(06) Currently it is anticipated that much of the electricity generated by these power stations will be sold to Sudan and possibly to other countries in the Nile Basin
Sudan is also planning to increase the area irrigated in the BNB Additional new projects OJld extension of existing schemes are anticipated to add an additional 889340 ha by 2025 An additional 4()OO million Ill of storage will be created by raising the height of the existing Roseries dam by 10 111 (Omer 2(10) However currently there are no plans for additional darns to be constructed on the Blue Nile
Technically feasible hydropower energy production in the Nile Basin of Sudan is estimated to be 24137 GWb yr-r (Omer 20(9) 1110St of which is on the main Nile downstream of the White and Blue Nile confluence Currently the Merowe dam with an installed capacity of 2500 MW is being commissioned 011 the Nile downstream of Khartonm Several other major hydropower dams are being planned nOlle of which are to be located on the Blue Nile River
Application of the Water Evaluation And Planning model
Model description
Developed by the Stockholm Environment Institute (SEI) the WEAl model is intended to be used to evaluate planning and management issues associated with water resources development The WEAP model essentially calculates a llJass balance of flow sequentially down a river
276
- resources is essential for both countries are planshyin the future_
lana and the Beles River )I1omic growth corridor d in nearly all the subshyts have been investigated 1977 WAPCOS 1990 be 815581 ha comprisshy39330 ha of large-scale g term (BCEOM 1998) sites have been identifIed preparation of the Abay projects currently being een 3634 and 7629 MW I MW) The exact value is produced at each The the Blue Nile River Of I the pre-feasibility study
eneration is expected to being built This is estishy998) The total energy ge 16000-33()()() GWh
thiopian BIlle Nile (ie yene and Abebe 20(6) 1ese power stations will
dditional new projects 389340 ha by 2025 An height of the existing
lans for additional dams
n of Sudan is estimated ~ile downstream of the U1 installed capacity of m Several other major n the Blue Nile River
gmodel
lode is intended to be ~sources development entially down a river
Simulating currellt alld future water resources development in the Blue Nile River Basin
system making allowance for abstractions and inflows The elements that comprise the water demand-supply system and their spatial relationship are characterized within the model The system is represented in terms of its various water sources (eg surface water groundwater and water reuse elements) withdrawal transmission reservoirs wastewater treatment facilities and water demands user-defined sectors but typically comprising industry mines irrigation and domestic supplyYatcs et aI 2005 SEI 20(7)
Typically the model is configured to simulate a baseline year fc)r which the water availshyability and demands can be confidently determined It is then used to simulate alternative scenarios to assess the impact of different development and management options For each scenario the model optimizes water use in the catchment using an iterative linear programshyming algorithm the objective of which is to maximize the water delivered to demand sites according to a set of user-defined priorities All demand sites are assigned a priority between 1 and 99 where I is the highest priority and 99 the lowest When water is limited the algorithm is formulated to progressively restrict water allocation to those demand sites given the lowest priority In this study the model was configured to simulate the 16 major sub-catchments of the basin (Figure 144a) It was assumed that because hydropower generates greater income it would be considered more important than irrigation by both governments Consequently within WEAP it was given a higher priority than irrigation However all schemes in Ethiopia and Sudan were given the same priority (ie no attempt was made to reflect differences between upstream and downstream locations)
Description of the scenarios
Scenarios are comJllonly used to investigate complex systems that are inherently unpredictable or insufficiently understood to enable precise predictions In this instance although there is reasonable (but not total) knowledge of current (ie 2008) water demand there is comiderable uncertainty about how future water resources development will proceed Consequently a scenario approach was adopted
The model was set up to simulate four scenarios each of which provides a coherent intershynally consistent and plausible description of water demand within the catchment (Table 143 Figure 144a-d)
litle 143 Water resources development scenarios simulated using the Water Evaluation And Planning model
Dcsaipthm -_- ----------------------------~---
No human-made storage and no abstractions so that tlows an assuIlled to be natural This scenario provides J baseline against which all the other scenarios can be assessed
Current The current water resources development situation (around 20(8) including all major
irrigation and hydropower schemes
Medium-term Water resources development (irrigation and hydropower) in the medium-term future future (around 2010-2(25) including al schemes for which feasibility studies have been
conducted
Long-term Water resources developmem (irrigation and hydropower) in the long-term futurt future (around 2025-2050) including schemes that are included in basin master plam bL1t have
not yet reached the feasibility study stage of planning
277
The Nile River Basin
~--------- -~-I
bull Jemma
Jemma Il[ bull Lem
Muger
Flow gHugmg stallOflS e(carewen ama gt 1000 j(nf) ~
Reservoir Gude
a Didessa Finchaa
bull Khano SUDAN
Downstream --- Irrigation upstream of__~__Rahxad Rohalt 148293 ha Lake Tana 7200 ha
Senna 167200 na Di~~---~
Gezira and Managii -- - -~~ ~~nnar 882195ha i
Ou(el Lake Tana
Upstream Sennar 71717 na
Suki 29827 ha
FinchaaDabus
V8145ha
InigallOn
V ReserVOIr Guder
Irrigation schemeb Finchaa
278
Welaka
Simulating current and future water resources development in the Blue Nile River Basin
SuIO 32767 ha North GOlam
I
Irfigaijon upstream of Lake Tan 69053ha
r___ Anger t)v--- Finchaa
Irrigahon o Diversions Flow gaugmg staUons bull 2014500Anger
(catchmmt rpa gt 1~OOO Imf) V Reservoir1445000 GuderVReservoir c FlOchaa
bull Khartoum SUDAN Rahad If 210046ha
6)0 Irriga_ ups1ream ofOownstrean f Lake Tana 69053 ha
lnigalion upstream of Sennar 228111 00
lake Tana 7200 ha ~_ Gezlra and Managil lake iTana NW Lake Tana L~ Pumping 6720ha882195 ha
2424 1 ~ ~ Upom Senna 117626 ha Oul18t Lake Trwa ~ t Oultel Lake Tana --_
~----
Kanana I amp II 4200931gt0 ~ _ O-Cjf Beles ~~ Bosheilo 0 d Upper Dioder 10000 ha-f) ~10( at ~ lit)
Suki 36128 ha r1--- Welaka
_bull~-middot--VDngurDm Upper Bele 537ooha J-----Welaka
Jemma
f lower Beles North Gojam Jemma m ETHIOPIA 85000 ha South GOlam bullbullbull
Loor ) WOmber I Mobrr Dab~ t_ ~aya--tgt _tgtdObl _ A _~ ___~~Se(
Upper ifMuger DD~US ~oe~sa rv Nekemte 11220ha NestleOabus 9661ha bull _ ~
bull T r- 7217 ha C r ~ Anger (t
OOi erslonsDabus ~=ahgation -t- Flnchaa ~ ~ha ~ Ange t 20145ha 17 If 14450 ha V (
Dfversions Arjo 13665h I FinchaVReservoir 1 t 1 J inigalion scheme
--cJ- 8 -+1 ct Guderdiversion41ooha Imgallon scheme d Dldessa Guder
F(iliYe 144 Schematic of the model contlguration for different scenarios (a) the natural situation (b) the current (2008) situation (e) the medium-term (2010-2025) future and (d) the long-term (2025-2050) future
279
The Nile River Basin
Time series of monthly naturalized How data for the period 1960-1992 obtained from the Abay Basin Master Plan (BCEOM 1998) and modified slightly based on more recent feasibilshyity studies (ENTRO 20(7) were used as input data In the future scenarios considerable time is needed to fill the planned large reservoirs particularly those located on the main stem of the Blue Nile River Hence a 20-year warm-up period was introduced and all comparisons benveen scenarios were made tor just the 13 years 1980-1992
Estimates of current irrigation and hydropower demand were derived from data provided by governmcnt ministries and agencies or from prcvious studies These included information on water passing through the turbines of the power stations and water diverted fix irrigation It was necessary to make several assumptions particularly about irrigation demands and the return t]ows from irrigation schemes Net evaporation fiom Lake Tana and the reservoirs was estimated from raillfall and potential evaporation data obtained from the meteorological station located closest to each dam These data were obtained from the FAO LocClirn datJb~lse (FAn 20(2)
For the mediul1l-term and long-term scenarios the sizes of planned hydropower and irrishygation development schemes were derived trom the basin master plan tor the Ethiopian Blue Nile and through discussion with academics and water resource planners in Sudan New schemes proposed extension of existing irrigation schemes as well as planned hydropower developments were identified (Tables 144 and 145) The medium-term scenario includes the Tma-Beles transfer scheme in EthiopiaThis project which involves the transfer of water from Lake lana to the Beles River to generate hydropower actually came on line in 2010 but after the modelling had been undertaken (McCartney ct al 2010)
hJIe 144 Proposed irrigation development in the Biue Nile Hiver Basin
Scheme Sub-basllI Dcsrriplitlfl Estimaled
completioll
dale -------------------------------------------shy
Ethiopia Lake Tana LakeTana Dams to be constructed OIl the major inflows to Lake Tana Medium
(ie Megech Ribb Guman and Gilgcl Abay) term
Total storage 102H million 111
Irrigation area 61 H53 ha
Average annml demand 516 million m
Bcles Belcs Upper Beles scheme 53700 ha Medium
Lower Beles scheme H5OOO ha term
Average annual demand 1554 million 111
Anger Anger Maximum irrigated area 14450 ha Mediulll
Average annual demand 202 million m ternl
Arjo Didessa Arjo scheme 13665 ha Medium
Average annual deIlland 921 million 111 j term
Dinder Dinder (but Upper Dinder scheme 10000 ha Medium
water Average annual demand 982 million m term
transferred
from Beles)
Finch a Finchaa Extemion of existing scheme Medium
Additional area 12000 ha term
Average annual demand 4566 million m j
280
192 obtained from the
1 more recent feasibilshy-ios considerable time 1 the main stem of the
and all comparisons
from data provided by luded information on ~d for irrigation It was nands and the return ~servoirs was estimated logical station located atabase (FAO 2002) hydropower and irri shy)r the Ethiopian Blue mers in Sudan New
planned hydropower scenario includes the transfer ofwater from line in 2010 but after
Estimated wmpletioll date
keTana Medium
term
Medium terlll
Medium term
Medmll1 terlll
Medium
term
Medium term
Simulating current and future water resources development in the Blue Nile River Basin
Table 144 Continned
Schaw Stih-basin Dcltcriplioll rislilllated
date
Rahad and Rahad Rahad and Galegu scheme 15029 ha Long term Average annual demand 607 millioll Ill
Dinder Dinder Dilldcc scheme 49555 hJ Long term Average annual demand 556 million ll1
Guder Guder Guder diversion 4100 ha Long term Guder 4R96 ha
Average annual demand 544 million Ill
Nekemte Anger Nekemte scheme 11220 ha Long term Averaglt anllual demand 715 million Ill
Dides-a Didessa Didessa irrigation scheme 5405R ha Long term
Average annual demand 7694 million 1lJ
Sudan
Raising Blue Nile Roseries dam raised by 10 III to provide total (gross) Medium
Roscries main stem storage of 7400 million m term
Dam
Extension Rahad Additional irrigation area 1J740 ha Medium of Rahad Rahad II irrigation scheme 210000 ha terlll
irrigation 1btal average annual demand 2433 million m
scheme
Extemion J)ue Nile Additional irrigation area 2940 h33361 ha Mediulll
ofSuki main stem Total average allnual demand 201 million m221 million 111 tcrm
irngation scheme
Extension Blue Nile Additional irrigation area 39910 ha Medium
of Upstrealll main stem Total average annual demand 745 million m term Sennar
Extcnsion Blue Nik Additional irrigation area 44110 h36R04 ha Mcdunn
of 11lain StClll Total average annual demand 1414 million Ill long term
Downstream 1526 million Ill
Sennar
Kenana II Blue Nile Additional irrigation area 420093 ha Medium
and III l11alll stelll Average allnual demand 2352 million m tenn
Soutb Dinder Additional irrigation area ~-lO 19 ha48318 hah Medium
Dindtr Average annual demand 541 million m ~51 million 111 II lung term
llotcs Schelllts arc extended partially in the mediUlll-tcnn future Jnd partially in the long-term filturc
IThe slash in the third C01Ulll11 demarcates values lwtweell the llledilllll-tcrm future and the ]ong-ttnll future
For many potential schemes there is currently considerable uncertainty about the dates when they will be completed In the current study it was assumed that for Ethiopian schemes if prefeasibility studies have been undertaken then the scheme will be completed in the mediulll term For all other planned schemes it was assumed that they will be completed in the long term For the Sudanese schemes information on likely completion dates was obtained
281
The Nile River Basin
TiJhle 14) Proposed hydropower development in the Blue Nile River Basin
Scheme Suh-basin Descriptioll Estimated
wmpletioN date
Ethiopia Tana-Beles TlIld and Beles Transfer of water from Lake Tana to Beles catchment for
hydropower production and lrrigatioll Hydropower capacity 460 MW
Average anllual transfer 2424 million 111
Medium
term
Anger Anger Linked to the Anger irrigation scheme Hydropower capacity 18-96 MW
Medium
term
Arjo Didessa Linked to the Atjo irrigation scheme
Hydropower capacity 33 MW
Medium
term
Karadobi Blue Nile main stem
Height of dam 250 m
Total storage 40220 million m
Hydropower capacity 1600 MW
Medium term
Mendaya Blue Nile
main stem
Height of dam 164
Total storage 15900 million 111
Hydropower capacity 1620 MW
Medium
term
Border Blue Nile
main stem
Height of dam 90 111
Total storage 11100 million 111
Hydropower capacity 1400 MW
Long term
Mabil Blue Nile
main stem
Height of dam 170 J1l
Total storage 17200 million III 1
Hydropower capacity 1200 MW
Long term
Lower Didessa Didessa Height of dam 110 Il1
final storage 5510 million 111
Hydropower capacity 1)0 MW
Long terlll
Dabus Dabl1s Linked to the Dabus irrigation cheme
Hydropower capacity 152 MW
Long term
Danguar Beles Height of dam 120 m
Total storage 4640 million m
Hydropower capacity 33 MW
Long term
Lower Daills Dabus Height of dam 50 1Il
10tal storage 1290 million m
Hydropower capacity 164 MW
Long term
from discussions with water resources experts within the country However clearly the two scenarios reflect only an approximate timeline tor water resources development in the basin In reality development is dependent on many external factors and so it is impossible to predict exactly when many planned schemes will actually be implemented or indeed the exact sequencing of schemes As they stand the medium-term and long-term future scenarios represhysent a plausible development trajectory but it is unlikely that it will actually come to pass in exactly the way envisaged
282
Estimated
compleril dale
lent for Medium term
Medium term
Medium
term
Medium term
Medium term
Long term
Long term
Long term
Long term
Long term
Long term
rever clearly the two )ment in the basin In impossible to predict or indeed the exact Iture scenarios represhy1ally come to pass in
Simulating current and future water resources development in tile Blue Nile River Basin
The water withdrawals for irrigation schemes were derived from a variety of sources including the Ethiopia Basin master plan and where available feasibility studies For Sudan useful information on irrigation water use was obtained from a study of the Roseries irrigation scheme (Ibrahim ct al 20(9) In schemes for which there were no data it was assumed that withdrawals per hectare would be similar to those at the nearest scheme where data were availshyable with some allowances for differences in rainf111 where this ditTered signifIcantly between locations Irrigation return flows were estimated from existing feasibility studies and averaged approximately 20 per cent of withdrawals in Ethiopia and 15 per cent in Sudan Where it is planned to extend irrigation schemes the future withdrawals and return flows were estimated based on current values but weighted by the new area Thus no allowance was made tor possishyble future improvements in irrigation dhciency Furthermore no allowance was made tor inter-annual variations in rainfall which might affect irrigation demand between years
Results
Model validation
Figure 145 shows the simulated and observed flows at the Ethiopia-Sudan border and at Khartoum for the current situation At Khartoum observed data (obtained from the Global Data Runoff Centre) were only available tor the period 1960--1982 Over this period the error in the simulated mean annual flow was 19 per cent_ As a result of current abstractions primashyrily tor irrigation in Sudan the flow at Khartoum is estimated to be approximately 7J-l billion m yc less than would have occurred naturally over this period (ie 424 billion 111 yr- 1 rather than 502 billion tn yr 1) At the border there are two flow gauging stations One is operated by the Government of Ethiopia and just a few kilometres downstream another is operated by the Government of Sudan Possibly because of differences in periods of missing data observed flows at these two stations differ and there is a 10 per cent difference in mean annual flow over the period 1960-1992 506 billion m measured by Ethiopia and 455 billion m measured by Sudan Without a detailed analysis which was beyond the scope of the present study it is not possible to know which of the two flow series is the more accurate The WEAP model simushylation falls between the two with a mean annual discharge of 462 billion m
Figure 146 compares the simulated and observed water levels of Lake Tana also over the period 1960-1992 Although the average simulated water level (17863 masl) is close to the observed average (17860 masl) it is clear that the variability ill the simulated water levels does not quite match that of the observed levels Nevertheless these results in conjunction with the flow results indicate that the WEAP simulation of the current situation is reasonably accurate and provides credibility for the results of the simulated future scenarios
Comparison ofscenarios
Currently irrigation water withdrawals in Sudan greatly exceed those in Ethiopia because of the differences in irrigated area The total irrigation demand in Sudan is estimated to average 845 billion nr yr-This compares with an average ofjust 026 billion m yr- in EthiopiaWith the planned irrigation development demand is estimated to increase to 1339 billion and 238 billion m yC in the medium-term scenarios and to 1383 billion and 381 billion 111 yr 1 in the long-term scenarios in Sudan and Ethiopia respectively (Table 146) If all planned dams are constructed the total reservoir storage in Ethiopia is estimated to increase to 70 billion Ill (ie 15 times the mean annual flow at the border) in the mid-term and to 167 biJ1ion 11 (ie
283
The Nile River Basin
36 times the mean annual flow at the border) in the long term Hydropower generated in Ethiopia from the Tis Abay and Finchaa power stations is currently estimated to be 1383 GWh yr With the construction of the Tana Ueles transfer the Karadobi dam and other smaller schemes this is estimated to increase to 12908 GWh yr in the medium term With Uorder Mendaya and Mabil hydropower stations as well as with additional smaller schemes electricity production in the long terll1 could increase to 31297 GWh yr
Hydropower generated on the U1ue Nile in Sudan is currently estimated to be just over 1000 GWh ye but there arc no publicly available data to confirm this estimate Because of the additional head and increased storage the raising of the Roseries dam will result in a very small increase to 1134 GWh yr I in the medium term and to 1205 GWh yr I in the long term The increase in the long term is due entirely to greater dry season resulting from increased regulation upstream in Ethiopb
40000a bull bullI35000
bull30000 bull 25000 bullbull
bull l
f bull I I I
~ 20000 ~ o I f u 15000 I~10000
II bull III bull I III III rl ~ 5000 II II I I
bull bull t II Ie IIbull middotI bull o
0 0 0 M VI 0) N VI 00 0 co ltXl q~ i9 C C C C c c C c c C C S C C t S ~ ~ ~ ~ ~ ~ ~ ~ ~ ~ ~
- Observed Flow at Khartoum bullbullbullbullSimUlated Flow at Khartoum
18000
16000
14000 ~E
eshy 12000
g ~ 10000 gtshyc 8000C 0 E 6000 c ltlgt 40002
2000
0
Jan Feb Mar Apr May June July Aug Sep Oct Nov Dec
- Observed flow at Khartoum bullbullbullbull Simulated flow at Khartoum
b
cu cat
ah lIH
tio lIlt
284
ropower generated in ated to be 1383 GWh
am and other smaller m term With Border
b
Simulating current and jutllre water resources development in the Blue Nile River Basin
40000
middot 35000 t I
30000 t I
er schemes electricity
11ated to be just over timate Because of the J result in a very small in the long term The u1ting from increased
- 0
C 9 q 0 i~ ~i Ji
lUm
-
~ -ltshy
~ ~ - _ Nov Dec
n
_ 25000 E 620000 0 u 15000
10000
5000
0
-
18000
16000
~ 14000 ~E
5 12000
g 10000 raquo
J 8000C 0 E 6000 c (J) 4000i
2000
o
bullbull
0 - 0 0 N M 0 0 q~ ~ ~ 9 r-- r-- - r-- P P f ltXl f l i c r C i C i c C C c ~ ~ ~ ~ ~ ~ ~ ~ ~ ~ ~Ji Ji Ji Ji Ji Ji Ji Ji Ji Ji Ji
Observed flow at the border - - - bull Simulated flow at the border
Measured MAF in Ethiopia 5068 m
Measured MAF in Sudan = WEAP Simulated MAF = 462 8m
455Bm
Jan Feb Mar Apr May June July Aug 5ep Oct Nov Dec
- Observed flow in Ethiopia - - - bull Simulated flow at the border
-- Observed flow in Sudan
F(qWf 145 Simulated and observed flow series and mean monthly flows (1960-1992) for the Blue Nile (current situation) at (a) Khartoum and (b) the Ethiopia-Sudan border
Comparison of the mean monthly flows at Khartoum tor the simulated natural condition current situation and the mediulIl- and long-term scenarios tor the 13 years 1980-1 SlSl2 indishy
cates how the mean annual flow is progressively reduced as a consequence of greater upstream abstractions (Table 147) Wet season flmvs are reduced significantly but dry season flows are increased as a consequence offlow regulation (Figure 147Table 147) Under natural condishytions 84 per cent of the river flow occurs in the wet season months (July-October) In the medium-term and long-term scenarios this is reduced to 61 and 37 per cent respectively
285
The Nile River Basin
17875
17870
17865
17860
17855
I
17850 0 M U r- 00 0 N ~ U r- 01 N ~ 0 00 01 0 0 0 r- r- r- I 00 00 00 co cof r- r- ~ C ~ C ~ C C C
u 5 3 u 5 Q u 5 Q u 5 Q uC1l C1l C1l C1l C1l ~ 0 lt( 0 lt( 0 lt( 0 lt( 0
- WEAP simulated water level bullbullbullbullbull Observed water level
Figure 146 Simulated and observed water levels in Lake Tana (1960-1992)
Tablc 146 Comparison of current Jnd future irrigation demand and hydropower production in the Ethiopian and Sudanese parts of the Blue Nile
Curreri Jfedil1n-lerm Ji4t1ire LOl1g-teml future
Eilliopia Slldal1 Ethiopia Sudal1 Ethiopia SlIdml
Total storage (lllillion 111) ] l57H 3370 70244 10770 167079 10770
Formal irrigatiotl Area (ha) lt]0000 ]305000 210000 2]26000 461000 2190000
Water withdrawJls per year 026 845 238 1339 381 n83 (millio1111l yr)
Hydropower Installed capacity (MW) 218 295 2194 295 6426 295 Production (GWh yr ) 1383 1029 12908 1134 31297 1205
10[( Allowance llladc for sedinlentation of both the Roscrlcs and Sennar reservoirs
At the Ethiopia-Sudan border the current situation is almost identical to the natural condishytion so this is not shown (Figure 147) Mean annual flow is reduced from 452 to 432 and 427 billion nr in the medium-term and long-term future scenarios respectively As in Khartoum there is a significant reduction in wet season flows but there are signifICant increases
in dry season flows as a consequence of flow regulation (Figure 147Table 147) Under natushyral conditions 81 per cent of the river flow occurs in the wet season but this decreases to 59 and 43 per cent in the medium-term and long-te-m scenarios respectively The total decrease in border flow in the long-term scenario is less than might be ex-pected given the increased
286
ltt 00 000 00 00 J or CiJ C Q ra u laquo 0
water level
ver production in the
LOlx-term fu lure
Ethiopia
167079
461000 381
6426 31297
Sudan
10770
2190000 1383
295 1205
Simulating current al1d future water resources developmel1t il1 the Blue Nile River Basin
a 18000 Simulated natural MAF 482 Bm 3
Simulated current MAF =40A Bm 316000 Simulated medium -term future MAF =33ABm 3f 14000 Simulated long-term future MAF =319Bm 3
~ 12000
~ 10000 gt -pound 8000 c 0 E 6000 c
~ (1l 4000
2000
0
Jan Feb Mar Apr May June July Aug Sep Oct Nov Dec
-Natural flow -Current flow - - -Medium-term future _ Long-term future
18000 Simulated natural MAF = 452 Bm3
16000
b
Simulated current MAF = 452 Bm)
f 14000 Simulated medium middotterm future MAF = 432 Bm 3
Simulated longmiddotterm future MAF =427 Bm~ 12000 3 g 10000 gt pound 8000 c 0
6000E c
~ (1l 4000
2000
0
Jan Feb Mar Apr May June July Aug Sep Oct Nov Dec
- Natural flow - - bull Medium-term future _ Long-term future
Fixure 147 Comparison of simulated mean monthly flow derived for natural current mecHum-term and long-term future scenarios at (a) Khartoum and (b) the Ethiopiamiddot-Sudan border
irrigation demand in Ethiopia The reason is partly that less water is diverted fi-om the Tana to the Beles catchmem ano more flow is routed down the main stem of Blue Nile
rurrently shortfalls (ie failure in any given month to supply the full amount of water needed for irrigation withdrawals or hydropower needs) in Ethiopia are negligible However in the medium-term scenario shortfalls increase to 08 and 50 billion m l yr for irrigation and hydropower respectively In the long term the increased storage means that shortfalls will avershyage 04 billion m for irrigation and 07 billion m l yr- for hydropower In comparison under current conditions there is an average shortfall of 08 billion m in water for the Sudanese irrigation schemes However because of the improved flow regulation there are no shortfalls in irrigation or hydropower in Sudan in either the medium- or the long-term scenarshyios These results reflect the fact that in each scenario the Sudanese schemes were given the same priority as those in Ethiopia Hence although in the medium term and long term more water is stored in Ethiopia in these scenarios no preference was given to the schemes in Ethiopia
I to the natural condishyrom 452 to 432 and )S respectively As in
re significant increases le 147) Under natushyIt this decreases to 59
dy The total decrease f given the increased
287
The Nile River Basin
lablr 147 Simulated mean monthly flow (million m) at the Ethiopia-Sudan border and Khartoum for natural current medium- and long-term tiJture scenarios (1980-1992)
Atom Naruml Currcrlt Aledium-term filturr Long-term future Border Khartollm Border Khartoum Border Khartoutll Border Khartoum
--~---~-~--------~---------
January 835 835 955 B55 1565 3220 2710 4405 February 470 470 380 740 1180 2220 2110 3175 March 350 350 400 475 845 1615 19BO 2770 April 310 310 520 620 710 1315 1635 2250 May 390 390 645 710 680 1235 14B5 2055
June 980 990 1230 640 1390 2273 2203 3125
July 5930 6235 6105 5365 3870 2560 4820 3420 August 15770 16830 15430 15950 8400 8615 4H20 4245 September 10590 116HO 10130 10165 H020 7490 4665 3760 October 53()O SH25 4970 3865 5315 1740 4105 420 November 2750 2795 2() 15 3JO 8870 2ltgt0 9095 250 December 1510 1510 1575 740 2305 H50 3055 1990 10ta1 45245 48220 45155 40435 43150 33395 426H5 3LB65
Net evaporation (ie the difference between evaporation trom a reservoir and the rainfall directly onto its surface) from the Ethiopian reservoirs currently averages 08 billion m yr- However by f3r the bulk of this is from Lake Tana which is a natural geographic feature and would be evaporating even without regulation By comparison net evaporation from the Sudanese reservoirs is 04 billion 111 yr- In the medium term this increases to 12 billion 111
yr in Ethiopia (03 billion m yr excluding Lake Tam) and to 14 billion m yr in Sudan The increase in Sudan is due to the increased area of the Roseries reservoir arising from raisshying the Roseries Dam and the fact that water levels in both Roseries and Sennar reservoirs are maintained at higher levels because of the higher dry season inflows In the long term total net reservoir evaporation increases to 17 billion m yr in Ethiopia (08 billion 111 yr bull excluding Lake Tam) and remains at 14 billion m l yr- in Sudan However evaporation losses per cubic metre of water stored are considerably lower in Ethiopia than in Sudan in all the scenarios In
fact as a result of the locations of the planned reservoirs as storage increases in Ethiopia losses per cubic metre of water stored decrease significantly over time (Table 14H)
labe 148 Simulated average annual net evaporation trom reservoirs in Ethiopia and Sudan for each of the scenarios
Sccnario Ethiopir SHdml
Tiltal lillal EJaptJratiou Iblal Iotal Elapomrioll storage evaporation from stOlalZe st()ra~e (U(1poration fn)Jn _f)ra~~l
(millioll ml (millivlI II) Imm) (millioll m) (millioll tn) (m i 111-)
Current 1157il H46 007 3370 443 013 Medium term 70244 l1SB (l02 10770 1363 013 Long term 167079 1732 Cl01 10770 13H7 013
N(lres Including from Lake 1ma which is a natural lake though regulated by the Char Chara weir
288
der and Khartoum for )
Long-term future Border Khartoum
2710 4405 2110 3175 1980 2770 1635 2250 1485 2055 2205 3125 4820 3420 4820 4245 4665 3760 4105 420 9095 250 3055 1990 42685 31865
~voir and the rainfall s 08 billion m 1 yc agraphic feature and vaporation from the Ises to 12 billion m on m yr I in Sudan oir arising from raisshySennaI reservoirs are long term total net on 111 yr excluding tion losses per cubic I all the scenarios In es in Ethiopia losses 8)
Ind Sudan fix each of
Euaporati()11 )ratiol1 I1om _forage
Oil m (111 I1l )
013 013 013
nra we-ir
Simulating current and future water resources development in the Blue Nile River Basin
Discussion
The results presented in this chapter are based on many assumptiolls Lack of data on flow and water demand and use particularly in Sudall makes it very difficult to validate the model for the current situation However where it has been possible to verifY them the model results appear to be reasonably accurate For example in the current scenario simulated flows closely match the observed flows at key locations on the main stem of the river and the simulated water levels in Lake Tana were reasonably accurate (Figures 145 and 146) Consequently though the results should be treated with caution they arc believed to be broadly indicative of the likely impacts arising trom the development currently being considered in both Ethiopia and Sudan By illustrating what may occur the scenarios provide information that is useful for resource pbnning and the results provide a basis for discussion
Climate and hence hydrological variability possibly increased by future climate change will remain key tilCtorS in the economic development of both Ethiopia and Sudan in the future As in the past future water resources development in the Blue Nile will be driven predominantly by the need felf water for agriculture and hydropower and hence the need for large volumes of stored water Irrigation will remain by filf the largest user of water and the future scenarios indicate significantly increased water withdrawals as a conseqnence of increasing irrigation predominantly in Sudan and also increasingly in Ethiopia The construction of the dams particularly the very large hydropower dams proposed by Ethiopia though not consuming large amounts of water vill sihrnificantly alter the flow regime of the river resulting in lower wet season flows and much greater dry season flows The results of this are likely to be benetlmiddotshycial for SudanThe frequency of flooding which occurs ewry few years in the flat areas of the country and is particularly devastating in and around Khartoum may be reduced Higher dry season flows mean greater availability of water at a time when it is naturally scarce and hence increased opportunities for withdrawals f()r irrigation and other uses Thus increased water storshyage in Ethiopia has the potential to provide benefits for Sudan too
As a result of higher rainfall and lower evaporative demand net evaporation loss per cubic metre of water stored in the Ethiopian reservoirs (including Lake Tana which is a natural lake) is currently approximately 50 per cent of that in Sudan As more water is stored in Ethiopia this ratio decreases so that in the long term it could be as low as 8 per cent of that in Sudan (Table 148) This confirms that one of the most signifICant benefits of storing water in the Ethiopian Highlands rather than in the lower more arid regions ofSudan (or indeed in Egypt) is significantly reduced evaporation losses
For all scenarios the model was run as a single system making no allowance tor the fact that Ethiopia and Sudan are separate countries Water demands in Sudan were given the same priorshyity as those in Ethiopia and water was released from reservoirs in Ethiopia to meet downstream demands in Sudan This assumes a much higher level of cooperation between the two states in relation to both the planning and managel1lent of water resources than at present
Future research is needed to refme the model Key to improving the simulatiom are
improved estimates of irrigation water demand improved estimates of the dates on which schemes will become operational more realistic dam operating rules detailed economic livelihood and environmental assessments of the cumulative impacts of all the proposed schemes and evaluation of the possible hydrological implications of climate change
289
The Nile River Basin
An important issue not considered in the current model simulations is the transient stages of reservoir tilling Given the large cumulative volume of the planned reservoirs in Ethiopia it is essential that reservoir filling is planned and managed in such a way that adverse downstream impacts including potentially negative environmental and social impacts are minimized The need to give due consideration to dam operation that provides for environmental (lows to avoid degradation of riverine ecosystems has recently been emphasized (Reitburger and McCartney 2(11)
Conclusion
The WEAP model has been configured to simulate the impacts of water resources developshyment in the I3NI3 Currently Ethiopia utilizes very little water for irrigation but does reb1llate some tlow for hydropower production In contrast Sudan uses some water for hydropower production and also abstracts large volumes for irrigation Both countries plan to develop water resources substantially in the near future The extent to which actual water resources developshyment will match the plans of both countries in the long term is unclear and will depend a lot on unpredictable social and economic factors However in both Ethiopia and Sudan hydropower and irrigation are widely perceived as critical to national development and in both countries current investment in water infrastructure is substantial and increasing Consequently pressures on water resources are rising and will increase substantially in the near future
The results of this study have confirmed that if the states cooperate effectively mutually beneficial scenarios are possible upstream regulation in Ethiopia reduces evaporation losses probably reduces the frequency of flooding and provides opportunities for greatly increased water development in Sudan However maximizing benefits and minimizing potential adverse impacts (eg to the environment) especially when the large reservoirs are being filled require much greater cooperation than currently exim between the riparian states The key to success is the establishment of pragmatic institutional arrangements that enable the water resources of the basin to be planned and managed as a single entity (ie without consideration of national borders) in the most effective and equitable manner possible It is to be hoped that such arrangements will be devised through the protracted negotiations currently under way
References
Awulachew S B McCartney M P Steenhuis T SAhmedAA (200H) A Review oHydrology Sedimcnt and vVater Resource Use ill the Blue Nile Basil International Water Management Institute Colombo Sri Lanka
[lCEOM (1998) Abbay RiFcr Basin Jltlc~ralcd Development A1astcr Plan Section II v[lilme v 11latcr Resources De1Jeopcnl Parr 1 1rr(~ion awl Draillfljlc Ministry ofWater Resources Addis Abtba Ethiopia
Beyelle T md Abebe Jv1 (2006) Potential and development plan in Ethiopia Hydropower and Datlls 13 61-64
Block P Strzepek K and Rajagopalan B (2007) blfegrated Jv1anagement of till Blue Nile Basin ill Ethiopia Hydropower and Irr(llaquo(lrion rvtdeli~ IFPRI Discussion Paper 00700 International Food Policy Research Institute Wasbington DC p22
Cascao1 E (2009) Changing power relations in the Nile River Basin Cnilateralism vs cooperation Water Alternalives 2 2 245-268
Ebla G (2008) Study ofMainstem Dams on the Blue Nile MSc thesis Arba Minch University Ethiopia pp94 ENTRO (Eastern Nile Technical Regional Office) (2007) Preeasibility study of Border Hydrnpucr PJfct
Ethiopia ENTROAddis Ababa Ethiopia FAO (Food and Agriculture Organization of the Cnited Nations) (2002) Aruwuncing LJCCim the FAa Local
Climate Estimator CDROll] wwwfaoorgsd2002EN1203a_enhtm accessed June 2009 GeorgakakosA P (200)) Nile Decision Support Tool (Nile DST) Executive Summary Report submitted to
FAO and the Nile riparian states Rome Italy June
290
Ie transient stages of Dirs in Ethiopia it is adverse downstream are minimized The iron mental flows to ed (Reitburger and
r resources developshym but does regulate Iter for hydropower Ian to develop water r resources developshyI1d will depend a lot hiopia and Sudan opment and in both asing Consequently e near future effectively mutually evaporation losses or greatly increased ng potential adverse being filled require The key to success e water resources of deration of national )e hoped that such y under way
Hydrolog Sedimcrll and ~ Colombo Sri Lanka fume ~ Hlaler Resources lba Ethiopia
and Dams 13
Nile Basin ill Ethiopia Food Policy Research
vs cooperation Hlatcr
iversiry Ethiopia pp94 dey Hydropower Project
Simulating current and future water resources development in the Blue Nile River Basin
Guariso C and Whittington n (19H7) Implications of Ethiopian water development for Egypt and Sudan bltcrnaliltllllllJolJrnal Hater Resources Dncpmml 3 2 105-114
IbrahimY A Ahmed A A and Ramdan M S (2009) Improving water management practices in the Rahad Scheme (Sudan) in Improved Hlaler md Lmd lvanuJlClllcnt ill Ihe Ethiopian H(~hlallds lis lmpaa 01
DowlIStrealgtl Stakrlwlders Dependent )11 tile Blllt Nile Intermediate Results Dissemination Vorkshop held at the International Livestock Research Institute (ILRI) 5-6 February S 13 Awulachew T Erkossa V Smakhtin and EAshra (eds)Addis Ababa Ethiopia
Jigerskog A GranitJ Risberg A and Yn V (2007) Tramboundary water management as a regional public good in fillaflcil1g Exampllfrom rhe Nile Basin Report no 20 SIWI Stockholm Sweden
JICA (lapan International Cooperation Agency) (1997) Feasibility Reporr uti Power Declopmellt at Lake lim Rf~IOIIJapan Internatiol Cooperariol1 Agency Tokyo Japan
Lahmeyer Consulting Engineers (1962) GilJlfl Abay Scheme Imperial Ethiopian Government Ministry of Public Works Addis Ahaba Ethiopia
McCartney M I~ Alcmayehu T Shiferaw A and Awulachew S ]3 (2010) Evaluation of current and future water resources development in the Lake Tana Basin Ethiopia IWMI Research Report 134 International Water Management Institute Colombo Sri Lanka
MetawieA E (2()04) History of co-operation in the Nile Basin Hlater Resources Dedopmer 20 147-63 MonteithJ L (1981) Evaporation and surface temperature QII1rIcry Joumal of lile Royal A1etrorologiral SariOy
107 1~~27
Norconsult (2006) Karadobi Hultipurpo5c Projea Preea5ibility Sludy Report to the Ministry of Water ResoUTces The Federal Republic of Ethiopia Addis Ababa Ethiopia
Omer A M (2009) Hydropouer polcurial atld Priority for Dams Developmel1t ill Slitiall wwwscitopicscomHydropower_potentiaLand_priority_for_da1l1s_developmellcill_Suda11html accessed November 2010
Omer A M (2010) S14dmese dec[opmelll 20 September wwwwaterpowermagazinecom storyaspc=2U57614 accessed 29lpril 2012
Reitburger B and McCartney M E (2011) Concepts of environmental flow assessment and challenges in the Blue Iile I3asin Ethiopia i11 Nile Rifler B115it Hydroloxy Clinate alld Water Use A M Melesse (cd) ppJ37-35H Springer Heidelberg Germany
SEI (Stockholm Environlllem Instiwte) (2007) WEAl Hlatcr Evaluarion Alld Planning System U5er Cuide Stockholm Environment Institute I3oston MA
SutcliffeJV and ParksY P (1999) The Hydrology fthe Nilr IAHSWallingford UK USBR (United States Bureau ofReclalllation) (1964) Lard and Water Re50urce f lire Bille iVile B05iH Ethiopia
United States Bureau of Reclamation Main report United States Bureau of Reclal11ation Washington DC
VAlCOS (1990) Preimirwry Water Resources neueiopmen [asleY PlanIor Ethipi( Final Rc-port prepared f)r EVDSA Addis Ababa Ethiopia
Whittington D Wu X and Sadoff C (20()5) Water resources management in the Nile Basin the economic value of cooperation ~HlIcr Poicy 7227-252
Yates lJ Sieber] Purkey nand Huber-LeeA (2005) VEAP 21 a demand priority and preference driven water planning model part 1 model characteristics WlIf1 ililertlatiorral 30 4H7~500
YilJ1la D A and Awulachew S 13 (2009) Characterization and atlas of the I3lne Nile I3asin and its sub basins in IprolJCd ~1rcr drld LlIId lvlaI~rmrl1l ill tile Erhiopian H~hlaruls lIs Inpltlct Oil Downstream Stakeholder5 Dependent 011 rhe Blur Nile Intermediate Results Dissemination Workshop held at the International Livestock Research Institute (ILRI) 5-6 Febrmry S B Awulachew T ErkmsaV Smakhtin and F Ashra (cds) Addis Ababa Ethiopia
UJClim the pound40 Local ne 2009 Report submitted to
291

The Nile River Basin
Future water resources development
Both Ethiopia and Sudan contend that utilization of the Nile water resources is essential for socio-economic development and poverty alleviation Consequently both countries are planshyning significant development of the Blue Nile River water resources ill the future
In Ethiopia current planning is focused primarily on the Lake Tana and the BellS River catchments which have been identified by the government as an economic growth corridor (McCartney ct al 2(10) However additional projects are planned in nearly all the subshycatchments as well as along tbe main river Possible irrigation projects have been investigated over a number of years (eg Labmeyer 1962 USBR 1964 JICA 1977 WAPCOS 1990 BCEOM 1(98) and tbe total potential irrigated area is estimated to be 815581 ha comprisshying 45856 ha of small-scale 130395 ha of medium-scale and 639330 ha of large-scale schemes Of this 461 OOU ha are envisaged to be developed in tbe long term (BCEOM 19(8)
In the Ethiopian Blue Nile more than 120 potential hydropower sites have been identified (WAPCOS 1990) Of these 26 were investigated in detail during the preparation of the Abay River Basin Master Plan (BCEOM 1(98) The major hydropower projects currently being contemplated in Ethiopia have a combined installed capacity of between 3634 and 7629 MW (cf the Aswan High Dam which has an installed capacity of 2100 MW) The exact value depends on the fmal design of the dams and the consequent head that is produced at each The four largest schemes being considered are dams on the main stem of the Blue Nile River Of these schemes the furthest advanced is the Karadobi project for which the pre-feasibility study was conducted in 2006 (NorcollSult2006
In addition to the single-purpose hydropower schemes electricity generation is expected to
be added to several of the proposed irrigation projects where dams are being built This is estishymated to provide an ldditional 216 MW of capacity (BCEOM 199R) The total energy produced by all the hydropower schemes being considered is in the range 16000-33000 GWh yr This represents 20 to 40 per cent of the technical potential in the Ethiopian Blue Nile 70000 GWh yr- i
) estimated by the Ministry ofWater Resources (Beyene and Abebe 2(06) Currently it is anticipated that much of the electricity generated by these power stations will be sold to Sudan and possibly to other countries in the Nile Basin
Sudan is also planning to increase the area irrigated in the BNB Additional new projects OJld extension of existing schemes are anticipated to add an additional 889340 ha by 2025 An additional 4()OO million Ill of storage will be created by raising the height of the existing Roseries dam by 10 111 (Omer 2(10) However currently there are no plans for additional darns to be constructed on the Blue Nile
Technically feasible hydropower energy production in the Nile Basin of Sudan is estimated to be 24137 GWb yr-r (Omer 20(9) 1110St of which is on the main Nile downstream of the White and Blue Nile confluence Currently the Merowe dam with an installed capacity of 2500 MW is being commissioned 011 the Nile downstream of Khartonm Several other major hydropower dams are being planned nOlle of which are to be located on the Blue Nile River
Application of the Water Evaluation And Planning model
Model description
Developed by the Stockholm Environment Institute (SEI) the WEAl model is intended to be used to evaluate planning and management issues associated with water resources development The WEAP model essentially calculates a llJass balance of flow sequentially down a river
276
- resources is essential for both countries are planshyin the future_
lana and the Beles River )I1omic growth corridor d in nearly all the subshyts have been investigated 1977 WAPCOS 1990 be 815581 ha comprisshy39330 ha of large-scale g term (BCEOM 1998) sites have been identifIed preparation of the Abay projects currently being een 3634 and 7629 MW I MW) The exact value is produced at each The the Blue Nile River Of I the pre-feasibility study
eneration is expected to being built This is estishy998) The total energy ge 16000-33()()() GWh
thiopian BIlle Nile (ie yene and Abebe 20(6) 1ese power stations will
dditional new projects 389340 ha by 2025 An height of the existing
lans for additional dams
n of Sudan is estimated ~ile downstream of the U1 installed capacity of m Several other major n the Blue Nile River
gmodel
lode is intended to be ~sources development entially down a river
Simulating currellt alld future water resources development in the Blue Nile River Basin
system making allowance for abstractions and inflows The elements that comprise the water demand-supply system and their spatial relationship are characterized within the model The system is represented in terms of its various water sources (eg surface water groundwater and water reuse elements) withdrawal transmission reservoirs wastewater treatment facilities and water demands user-defined sectors but typically comprising industry mines irrigation and domestic supplyYatcs et aI 2005 SEI 20(7)
Typically the model is configured to simulate a baseline year fc)r which the water availshyability and demands can be confidently determined It is then used to simulate alternative scenarios to assess the impact of different development and management options For each scenario the model optimizes water use in the catchment using an iterative linear programshyming algorithm the objective of which is to maximize the water delivered to demand sites according to a set of user-defined priorities All demand sites are assigned a priority between 1 and 99 where I is the highest priority and 99 the lowest When water is limited the algorithm is formulated to progressively restrict water allocation to those demand sites given the lowest priority In this study the model was configured to simulate the 16 major sub-catchments of the basin (Figure 144a) It was assumed that because hydropower generates greater income it would be considered more important than irrigation by both governments Consequently within WEAP it was given a higher priority than irrigation However all schemes in Ethiopia and Sudan were given the same priority (ie no attempt was made to reflect differences between upstream and downstream locations)
Description of the scenarios
Scenarios are comJllonly used to investigate complex systems that are inherently unpredictable or insufficiently understood to enable precise predictions In this instance although there is reasonable (but not total) knowledge of current (ie 2008) water demand there is comiderable uncertainty about how future water resources development will proceed Consequently a scenario approach was adopted
The model was set up to simulate four scenarios each of which provides a coherent intershynally consistent and plausible description of water demand within the catchment (Table 143 Figure 144a-d)
litle 143 Water resources development scenarios simulated using the Water Evaluation And Planning model
Dcsaipthm -_- ----------------------------~---
No human-made storage and no abstractions so that tlows an assuIlled to be natural This scenario provides J baseline against which all the other scenarios can be assessed
Current The current water resources development situation (around 20(8) including all major
irrigation and hydropower schemes
Medium-term Water resources development (irrigation and hydropower) in the medium-term future future (around 2010-2(25) including al schemes for which feasibility studies have been
conducted
Long-term Water resources developmem (irrigation and hydropower) in the long-term futurt future (around 2025-2050) including schemes that are included in basin master plam bL1t have
not yet reached the feasibility study stage of planning
277
The Nile River Basin
~--------- -~-I
bull Jemma
Jemma Il[ bull Lem
Muger
Flow gHugmg stallOflS e(carewen ama gt 1000 j(nf) ~
Reservoir Gude
a Didessa Finchaa
bull Khano SUDAN
Downstream --- Irrigation upstream of__~__Rahxad Rohalt 148293 ha Lake Tana 7200 ha
Senna 167200 na Di~~---~
Gezira and Managii -- - -~~ ~~nnar 882195ha i
Ou(el Lake Tana
Upstream Sennar 71717 na
Suki 29827 ha
FinchaaDabus
V8145ha
InigallOn
V ReserVOIr Guder
Irrigation schemeb Finchaa
278
Welaka
Simulating current and future water resources development in the Blue Nile River Basin
SuIO 32767 ha North GOlam
I
Irfigaijon upstream of Lake Tan 69053ha
r___ Anger t)v--- Finchaa
Irrigahon o Diversions Flow gaugmg staUons bull 2014500Anger
(catchmmt rpa gt 1~OOO Imf) V Reservoir1445000 GuderVReservoir c FlOchaa
bull Khartoum SUDAN Rahad If 210046ha
6)0 Irriga_ ups1ream ofOownstrean f Lake Tana 69053 ha
lnigalion upstream of Sennar 228111 00
lake Tana 7200 ha ~_ Gezlra and Managil lake iTana NW Lake Tana L~ Pumping 6720ha882195 ha
2424 1 ~ ~ Upom Senna 117626 ha Oul18t Lake Trwa ~ t Oultel Lake Tana --_
~----
Kanana I amp II 4200931gt0 ~ _ O-Cjf Beles ~~ Bosheilo 0 d Upper Dioder 10000 ha-f) ~10( at ~ lit)
Suki 36128 ha r1--- Welaka
_bull~-middot--VDngurDm Upper Bele 537ooha J-----Welaka
Jemma
f lower Beles North Gojam Jemma m ETHIOPIA 85000 ha South GOlam bullbullbull
Loor ) WOmber I Mobrr Dab~ t_ ~aya--tgt _tgtdObl _ A _~ ___~~Se(
Upper ifMuger DD~US ~oe~sa rv Nekemte 11220ha NestleOabus 9661ha bull _ ~
bull T r- 7217 ha C r ~ Anger (t
OOi erslonsDabus ~=ahgation -t- Flnchaa ~ ~ha ~ Ange t 20145ha 17 If 14450 ha V (
Dfversions Arjo 13665h I FinchaVReservoir 1 t 1 J inigalion scheme
--cJ- 8 -+1 ct Guderdiversion41ooha Imgallon scheme d Dldessa Guder
F(iliYe 144 Schematic of the model contlguration for different scenarios (a) the natural situation (b) the current (2008) situation (e) the medium-term (2010-2025) future and (d) the long-term (2025-2050) future
279
The Nile River Basin
Time series of monthly naturalized How data for the period 1960-1992 obtained from the Abay Basin Master Plan (BCEOM 1998) and modified slightly based on more recent feasibilshyity studies (ENTRO 20(7) were used as input data In the future scenarios considerable time is needed to fill the planned large reservoirs particularly those located on the main stem of the Blue Nile River Hence a 20-year warm-up period was introduced and all comparisons benveen scenarios were made tor just the 13 years 1980-1992
Estimates of current irrigation and hydropower demand were derived from data provided by governmcnt ministries and agencies or from prcvious studies These included information on water passing through the turbines of the power stations and water diverted fix irrigation It was necessary to make several assumptions particularly about irrigation demands and the return t]ows from irrigation schemes Net evaporation fiom Lake Tana and the reservoirs was estimated from raillfall and potential evaporation data obtained from the meteorological station located closest to each dam These data were obtained from the FAO LocClirn datJb~lse (FAn 20(2)
For the mediul1l-term and long-term scenarios the sizes of planned hydropower and irrishygation development schemes were derived trom the basin master plan tor the Ethiopian Blue Nile and through discussion with academics and water resource planners in Sudan New schemes proposed extension of existing irrigation schemes as well as planned hydropower developments were identified (Tables 144 and 145) The medium-term scenario includes the Tma-Beles transfer scheme in EthiopiaThis project which involves the transfer of water from Lake lana to the Beles River to generate hydropower actually came on line in 2010 but after the modelling had been undertaken (McCartney ct al 2010)
hJIe 144 Proposed irrigation development in the Biue Nile Hiver Basin
Scheme Sub-basllI Dcsrriplitlfl Estimaled
completioll
dale -------------------------------------------shy
Ethiopia Lake Tana LakeTana Dams to be constructed OIl the major inflows to Lake Tana Medium
(ie Megech Ribb Guman and Gilgcl Abay) term
Total storage 102H million 111
Irrigation area 61 H53 ha
Average annml demand 516 million m
Bcles Belcs Upper Beles scheme 53700 ha Medium
Lower Beles scheme H5OOO ha term
Average annual demand 1554 million 111
Anger Anger Maximum irrigated area 14450 ha Mediulll
Average annual demand 202 million m ternl
Arjo Didessa Arjo scheme 13665 ha Medium
Average annual deIlland 921 million 111 j term
Dinder Dinder (but Upper Dinder scheme 10000 ha Medium
water Average annual demand 982 million m term
transferred
from Beles)
Finch a Finchaa Extemion of existing scheme Medium
Additional area 12000 ha term
Average annual demand 4566 million m j
280
192 obtained from the
1 more recent feasibilshy-ios considerable time 1 the main stem of the
and all comparisons
from data provided by luded information on ~d for irrigation It was nands and the return ~servoirs was estimated logical station located atabase (FAO 2002) hydropower and irri shy)r the Ethiopian Blue mers in Sudan New
planned hydropower scenario includes the transfer ofwater from line in 2010 but after
Estimated wmpletioll date
keTana Medium
term
Medium terlll
Medium term
Medmll1 terlll
Medium
term
Medium term
Simulating current and future water resources development in the Blue Nile River Basin
Table 144 Continned
Schaw Stih-basin Dcltcriplioll rislilllated
date
Rahad and Rahad Rahad and Galegu scheme 15029 ha Long term Average annual demand 607 millioll Ill
Dinder Dinder Dilldcc scheme 49555 hJ Long term Average annual demand 556 million ll1
Guder Guder Guder diversion 4100 ha Long term Guder 4R96 ha
Average annual demand 544 million Ill
Nekemte Anger Nekemte scheme 11220 ha Long term Averaglt anllual demand 715 million Ill
Dides-a Didessa Didessa irrigation scheme 5405R ha Long term
Average annual demand 7694 million 1lJ
Sudan
Raising Blue Nile Roseries dam raised by 10 III to provide total (gross) Medium
Roscries main stem storage of 7400 million m term
Dam
Extension Rahad Additional irrigation area 1J740 ha Medium of Rahad Rahad II irrigation scheme 210000 ha terlll
irrigation 1btal average annual demand 2433 million m
scheme
Extemion J)ue Nile Additional irrigation area 2940 h33361 ha Mediulll
ofSuki main stem Total average allnual demand 201 million m221 million 111 tcrm
irngation scheme
Extension Blue Nile Additional irrigation area 39910 ha Medium
of Upstrealll main stem Total average annual demand 745 million m term Sennar
Extcnsion Blue Nik Additional irrigation area 44110 h36R04 ha Mcdunn
of 11lain StClll Total average annual demand 1414 million Ill long term
Downstream 1526 million Ill
Sennar
Kenana II Blue Nile Additional irrigation area 420093 ha Medium
and III l11alll stelll Average allnual demand 2352 million m tenn
Soutb Dinder Additional irrigation area ~-lO 19 ha48318 hah Medium
Dindtr Average annual demand 541 million m ~51 million 111 II lung term
llotcs Schelllts arc extended partially in the mediUlll-tcnn future Jnd partially in the long-term filturc
IThe slash in the third C01Ulll11 demarcates values lwtweell the llledilllll-tcrm future and the ]ong-ttnll future
For many potential schemes there is currently considerable uncertainty about the dates when they will be completed In the current study it was assumed that for Ethiopian schemes if prefeasibility studies have been undertaken then the scheme will be completed in the mediulll term For all other planned schemes it was assumed that they will be completed in the long term For the Sudanese schemes information on likely completion dates was obtained
281
The Nile River Basin
TiJhle 14) Proposed hydropower development in the Blue Nile River Basin
Scheme Suh-basin Descriptioll Estimated
wmpletioN date
Ethiopia Tana-Beles TlIld and Beles Transfer of water from Lake Tana to Beles catchment for
hydropower production and lrrigatioll Hydropower capacity 460 MW
Average anllual transfer 2424 million 111
Medium
term
Anger Anger Linked to the Anger irrigation scheme Hydropower capacity 18-96 MW
Medium
term
Arjo Didessa Linked to the Atjo irrigation scheme
Hydropower capacity 33 MW
Medium
term
Karadobi Blue Nile main stem
Height of dam 250 m
Total storage 40220 million m
Hydropower capacity 1600 MW
Medium term
Mendaya Blue Nile
main stem
Height of dam 164
Total storage 15900 million 111
Hydropower capacity 1620 MW
Medium
term
Border Blue Nile
main stem
Height of dam 90 111
Total storage 11100 million 111
Hydropower capacity 1400 MW
Long term
Mabil Blue Nile
main stem
Height of dam 170 J1l
Total storage 17200 million III 1
Hydropower capacity 1200 MW
Long term
Lower Didessa Didessa Height of dam 110 Il1
final storage 5510 million 111
Hydropower capacity 1)0 MW
Long terlll
Dabus Dabl1s Linked to the Dabus irrigation cheme
Hydropower capacity 152 MW
Long term
Danguar Beles Height of dam 120 m
Total storage 4640 million m
Hydropower capacity 33 MW
Long term
Lower Daills Dabus Height of dam 50 1Il
10tal storage 1290 million m
Hydropower capacity 164 MW
Long term
from discussions with water resources experts within the country However clearly the two scenarios reflect only an approximate timeline tor water resources development in the basin In reality development is dependent on many external factors and so it is impossible to predict exactly when many planned schemes will actually be implemented or indeed the exact sequencing of schemes As they stand the medium-term and long-term future scenarios represhysent a plausible development trajectory but it is unlikely that it will actually come to pass in exactly the way envisaged
282
Estimated
compleril dale
lent for Medium term
Medium term
Medium
term
Medium term
Medium term
Long term
Long term
Long term
Long term
Long term
Long term
rever clearly the two )ment in the basin In impossible to predict or indeed the exact Iture scenarios represhy1ally come to pass in
Simulating current and future water resources development in tile Blue Nile River Basin
The water withdrawals for irrigation schemes were derived from a variety of sources including the Ethiopia Basin master plan and where available feasibility studies For Sudan useful information on irrigation water use was obtained from a study of the Roseries irrigation scheme (Ibrahim ct al 20(9) In schemes for which there were no data it was assumed that withdrawals per hectare would be similar to those at the nearest scheme where data were availshyable with some allowances for differences in rainf111 where this ditTered signifIcantly between locations Irrigation return flows were estimated from existing feasibility studies and averaged approximately 20 per cent of withdrawals in Ethiopia and 15 per cent in Sudan Where it is planned to extend irrigation schemes the future withdrawals and return flows were estimated based on current values but weighted by the new area Thus no allowance was made tor possishyble future improvements in irrigation dhciency Furthermore no allowance was made tor inter-annual variations in rainfall which might affect irrigation demand between years
Results
Model validation
Figure 145 shows the simulated and observed flows at the Ethiopia-Sudan border and at Khartoum for the current situation At Khartoum observed data (obtained from the Global Data Runoff Centre) were only available tor the period 1960--1982 Over this period the error in the simulated mean annual flow was 19 per cent_ As a result of current abstractions primashyrily tor irrigation in Sudan the flow at Khartoum is estimated to be approximately 7J-l billion m yc less than would have occurred naturally over this period (ie 424 billion 111 yr- 1 rather than 502 billion tn yr 1) At the border there are two flow gauging stations One is operated by the Government of Ethiopia and just a few kilometres downstream another is operated by the Government of Sudan Possibly because of differences in periods of missing data observed flows at these two stations differ and there is a 10 per cent difference in mean annual flow over the period 1960-1992 506 billion m measured by Ethiopia and 455 billion m measured by Sudan Without a detailed analysis which was beyond the scope of the present study it is not possible to know which of the two flow series is the more accurate The WEAP model simushylation falls between the two with a mean annual discharge of 462 billion m
Figure 146 compares the simulated and observed water levels of Lake Tana also over the period 1960-1992 Although the average simulated water level (17863 masl) is close to the observed average (17860 masl) it is clear that the variability ill the simulated water levels does not quite match that of the observed levels Nevertheless these results in conjunction with the flow results indicate that the WEAP simulation of the current situation is reasonably accurate and provides credibility for the results of the simulated future scenarios
Comparison ofscenarios
Currently irrigation water withdrawals in Sudan greatly exceed those in Ethiopia because of the differences in irrigated area The total irrigation demand in Sudan is estimated to average 845 billion nr yr-This compares with an average ofjust 026 billion m yr- in EthiopiaWith the planned irrigation development demand is estimated to increase to 1339 billion and 238 billion m yC in the medium-term scenarios and to 1383 billion and 381 billion 111 yr 1 in the long-term scenarios in Sudan and Ethiopia respectively (Table 146) If all planned dams are constructed the total reservoir storage in Ethiopia is estimated to increase to 70 billion Ill (ie 15 times the mean annual flow at the border) in the mid-term and to 167 biJ1ion 11 (ie
283
The Nile River Basin
36 times the mean annual flow at the border) in the long term Hydropower generated in Ethiopia from the Tis Abay and Finchaa power stations is currently estimated to be 1383 GWh yr With the construction of the Tana Ueles transfer the Karadobi dam and other smaller schemes this is estimated to increase to 12908 GWh yr in the medium term With Uorder Mendaya and Mabil hydropower stations as well as with additional smaller schemes electricity production in the long terll1 could increase to 31297 GWh yr
Hydropower generated on the U1ue Nile in Sudan is currently estimated to be just over 1000 GWh ye but there arc no publicly available data to confirm this estimate Because of the additional head and increased storage the raising of the Roseries dam will result in a very small increase to 1134 GWh yr I in the medium term and to 1205 GWh yr I in the long term The increase in the long term is due entirely to greater dry season resulting from increased regulation upstream in Ethiopb
40000a bull bullI35000
bull30000 bull 25000 bullbull
bull l
f bull I I I
~ 20000 ~ o I f u 15000 I~10000
II bull III bull I III III rl ~ 5000 II II I I
bull bull t II Ie IIbull middotI bull o
0 0 0 M VI 0) N VI 00 0 co ltXl q~ i9 C C C C c c C c c C C S C C t S ~ ~ ~ ~ ~ ~ ~ ~ ~ ~ ~
- Observed Flow at Khartoum bullbullbullbullSimUlated Flow at Khartoum
18000
16000
14000 ~E
eshy 12000
g ~ 10000 gtshyc 8000C 0 E 6000 c ltlgt 40002
2000
0
Jan Feb Mar Apr May June July Aug Sep Oct Nov Dec
- Observed flow at Khartoum bullbullbullbull Simulated flow at Khartoum
b
cu cat
ah lIH
tio lIlt
284
ropower generated in ated to be 1383 GWh
am and other smaller m term With Border
b
Simulating current and jutllre water resources development in the Blue Nile River Basin
40000
middot 35000 t I
30000 t I
er schemes electricity
11ated to be just over timate Because of the J result in a very small in the long term The u1ting from increased
- 0
C 9 q 0 i~ ~i Ji
lUm
-
~ -ltshy
~ ~ - _ Nov Dec
n
_ 25000 E 620000 0 u 15000
10000
5000
0
-
18000
16000
~ 14000 ~E
5 12000
g 10000 raquo
J 8000C 0 E 6000 c (J) 4000i
2000
o
bullbull
0 - 0 0 N M 0 0 q~ ~ ~ 9 r-- r-- - r-- P P f ltXl f l i c r C i C i c C C c ~ ~ ~ ~ ~ ~ ~ ~ ~ ~ ~Ji Ji Ji Ji Ji Ji Ji Ji Ji Ji Ji
Observed flow at the border - - - bull Simulated flow at the border
Measured MAF in Ethiopia 5068 m
Measured MAF in Sudan = WEAP Simulated MAF = 462 8m
455Bm
Jan Feb Mar Apr May June July Aug 5ep Oct Nov Dec
- Observed flow in Ethiopia - - - bull Simulated flow at the border
-- Observed flow in Sudan
F(qWf 145 Simulated and observed flow series and mean monthly flows (1960-1992) for the Blue Nile (current situation) at (a) Khartoum and (b) the Ethiopia-Sudan border
Comparison of the mean monthly flows at Khartoum tor the simulated natural condition current situation and the mediulIl- and long-term scenarios tor the 13 years 1980-1 SlSl2 indishy
cates how the mean annual flow is progressively reduced as a consequence of greater upstream abstractions (Table 147) Wet season flmvs are reduced significantly but dry season flows are increased as a consequence offlow regulation (Figure 147Table 147) Under natural condishytions 84 per cent of the river flow occurs in the wet season months (July-October) In the medium-term and long-term scenarios this is reduced to 61 and 37 per cent respectively
285
The Nile River Basin
17875
17870
17865
17860
17855
I
17850 0 M U r- 00 0 N ~ U r- 01 N ~ 0 00 01 0 0 0 r- r- r- I 00 00 00 co cof r- r- ~ C ~ C ~ C C C
u 5 3 u 5 Q u 5 Q u 5 Q uC1l C1l C1l C1l C1l ~ 0 lt( 0 lt( 0 lt( 0 lt( 0
- WEAP simulated water level bullbullbullbullbull Observed water level
Figure 146 Simulated and observed water levels in Lake Tana (1960-1992)
Tablc 146 Comparison of current Jnd future irrigation demand and hydropower production in the Ethiopian and Sudanese parts of the Blue Nile
Curreri Jfedil1n-lerm Ji4t1ire LOl1g-teml future
Eilliopia Slldal1 Ethiopia Sudal1 Ethiopia SlIdml
Total storage (lllillion 111) ] l57H 3370 70244 10770 167079 10770
Formal irrigatiotl Area (ha) lt]0000 ]305000 210000 2]26000 461000 2190000
Water withdrawJls per year 026 845 238 1339 381 n83 (millio1111l yr)
Hydropower Installed capacity (MW) 218 295 2194 295 6426 295 Production (GWh yr ) 1383 1029 12908 1134 31297 1205
10[( Allowance llladc for sedinlentation of both the Roscrlcs and Sennar reservoirs
At the Ethiopia-Sudan border the current situation is almost identical to the natural condishytion so this is not shown (Figure 147) Mean annual flow is reduced from 452 to 432 and 427 billion nr in the medium-term and long-term future scenarios respectively As in Khartoum there is a significant reduction in wet season flows but there are signifICant increases
in dry season flows as a consequence of flow regulation (Figure 147Table 147) Under natushyral conditions 81 per cent of the river flow occurs in the wet season but this decreases to 59 and 43 per cent in the medium-term and long-te-m scenarios respectively The total decrease in border flow in the long-term scenario is less than might be ex-pected given the increased
286
ltt 00 000 00 00 J or CiJ C Q ra u laquo 0
water level
ver production in the
LOlx-term fu lure
Ethiopia
167079
461000 381
6426 31297
Sudan
10770
2190000 1383
295 1205
Simulating current al1d future water resources developmel1t il1 the Blue Nile River Basin
a 18000 Simulated natural MAF 482 Bm 3
Simulated current MAF =40A Bm 316000 Simulated medium -term future MAF =33ABm 3f 14000 Simulated long-term future MAF =319Bm 3
~ 12000
~ 10000 gt -pound 8000 c 0 E 6000 c
~ (1l 4000
2000
0
Jan Feb Mar Apr May June July Aug Sep Oct Nov Dec
-Natural flow -Current flow - - -Medium-term future _ Long-term future
18000 Simulated natural MAF = 452 Bm3
16000
b
Simulated current MAF = 452 Bm)
f 14000 Simulated medium middotterm future MAF = 432 Bm 3
Simulated longmiddotterm future MAF =427 Bm~ 12000 3 g 10000 gt pound 8000 c 0
6000E c
~ (1l 4000
2000
0
Jan Feb Mar Apr May June July Aug Sep Oct Nov Dec
- Natural flow - - bull Medium-term future _ Long-term future
Fixure 147 Comparison of simulated mean monthly flow derived for natural current mecHum-term and long-term future scenarios at (a) Khartoum and (b) the Ethiopiamiddot-Sudan border
irrigation demand in Ethiopia The reason is partly that less water is diverted fi-om the Tana to the Beles catchmem ano more flow is routed down the main stem of Blue Nile
rurrently shortfalls (ie failure in any given month to supply the full amount of water needed for irrigation withdrawals or hydropower needs) in Ethiopia are negligible However in the medium-term scenario shortfalls increase to 08 and 50 billion m l yr for irrigation and hydropower respectively In the long term the increased storage means that shortfalls will avershyage 04 billion m for irrigation and 07 billion m l yr- for hydropower In comparison under current conditions there is an average shortfall of 08 billion m in water for the Sudanese irrigation schemes However because of the improved flow regulation there are no shortfalls in irrigation or hydropower in Sudan in either the medium- or the long-term scenarshyios These results reflect the fact that in each scenario the Sudanese schemes were given the same priority as those in Ethiopia Hence although in the medium term and long term more water is stored in Ethiopia in these scenarios no preference was given to the schemes in Ethiopia
I to the natural condishyrom 452 to 432 and )S respectively As in
re significant increases le 147) Under natushyIt this decreases to 59
dy The total decrease f given the increased
287
The Nile River Basin
lablr 147 Simulated mean monthly flow (million m) at the Ethiopia-Sudan border and Khartoum for natural current medium- and long-term tiJture scenarios (1980-1992)
Atom Naruml Currcrlt Aledium-term filturr Long-term future Border Khartollm Border Khartoum Border Khartoutll Border Khartoum
--~---~-~--------~---------
January 835 835 955 B55 1565 3220 2710 4405 February 470 470 380 740 1180 2220 2110 3175 March 350 350 400 475 845 1615 19BO 2770 April 310 310 520 620 710 1315 1635 2250 May 390 390 645 710 680 1235 14B5 2055
June 980 990 1230 640 1390 2273 2203 3125
July 5930 6235 6105 5365 3870 2560 4820 3420 August 15770 16830 15430 15950 8400 8615 4H20 4245 September 10590 116HO 10130 10165 H020 7490 4665 3760 October 53()O SH25 4970 3865 5315 1740 4105 420 November 2750 2795 2() 15 3JO 8870 2ltgt0 9095 250 December 1510 1510 1575 740 2305 H50 3055 1990 10ta1 45245 48220 45155 40435 43150 33395 426H5 3LB65
Net evaporation (ie the difference between evaporation trom a reservoir and the rainfall directly onto its surface) from the Ethiopian reservoirs currently averages 08 billion m yr- However by f3r the bulk of this is from Lake Tana which is a natural geographic feature and would be evaporating even without regulation By comparison net evaporation from the Sudanese reservoirs is 04 billion 111 yr- In the medium term this increases to 12 billion 111
yr in Ethiopia (03 billion m yr excluding Lake Tam) and to 14 billion m yr in Sudan The increase in Sudan is due to the increased area of the Roseries reservoir arising from raisshying the Roseries Dam and the fact that water levels in both Roseries and Sennar reservoirs are maintained at higher levels because of the higher dry season inflows In the long term total net reservoir evaporation increases to 17 billion m yr in Ethiopia (08 billion 111 yr bull excluding Lake Tam) and remains at 14 billion m l yr- in Sudan However evaporation losses per cubic metre of water stored are considerably lower in Ethiopia than in Sudan in all the scenarios In
fact as a result of the locations of the planned reservoirs as storage increases in Ethiopia losses per cubic metre of water stored decrease significantly over time (Table 14H)
labe 148 Simulated average annual net evaporation trom reservoirs in Ethiopia and Sudan for each of the scenarios
Sccnario Ethiopir SHdml
Tiltal lillal EJaptJratiou Iblal Iotal Elapomrioll storage evaporation from stOlalZe st()ra~e (U(1poration fn)Jn _f)ra~~l
(millioll ml (millivlI II) Imm) (millioll m) (millioll tn) (m i 111-)
Current 1157il H46 007 3370 443 013 Medium term 70244 l1SB (l02 10770 1363 013 Long term 167079 1732 Cl01 10770 13H7 013
N(lres Including from Lake 1ma which is a natural lake though regulated by the Char Chara weir
288
der and Khartoum for )
Long-term future Border Khartoum
2710 4405 2110 3175 1980 2770 1635 2250 1485 2055 2205 3125 4820 3420 4820 4245 4665 3760 4105 420 9095 250 3055 1990 42685 31865
~voir and the rainfall s 08 billion m 1 yc agraphic feature and vaporation from the Ises to 12 billion m on m yr I in Sudan oir arising from raisshySennaI reservoirs are long term total net on 111 yr excluding tion losses per cubic I all the scenarios In es in Ethiopia losses 8)
Ind Sudan fix each of
Euaporati()11 )ratiol1 I1om _forage
Oil m (111 I1l )
013 013 013
nra we-ir
Simulating current and future water resources development in the Blue Nile River Basin
Discussion
The results presented in this chapter are based on many assumptiolls Lack of data on flow and water demand and use particularly in Sudall makes it very difficult to validate the model for the current situation However where it has been possible to verifY them the model results appear to be reasonably accurate For example in the current scenario simulated flows closely match the observed flows at key locations on the main stem of the river and the simulated water levels in Lake Tana were reasonably accurate (Figures 145 and 146) Consequently though the results should be treated with caution they arc believed to be broadly indicative of the likely impacts arising trom the development currently being considered in both Ethiopia and Sudan By illustrating what may occur the scenarios provide information that is useful for resource pbnning and the results provide a basis for discussion
Climate and hence hydrological variability possibly increased by future climate change will remain key tilCtorS in the economic development of both Ethiopia and Sudan in the future As in the past future water resources development in the Blue Nile will be driven predominantly by the need felf water for agriculture and hydropower and hence the need for large volumes of stored water Irrigation will remain by filf the largest user of water and the future scenarios indicate significantly increased water withdrawals as a conseqnence of increasing irrigation predominantly in Sudan and also increasingly in Ethiopia The construction of the dams particularly the very large hydropower dams proposed by Ethiopia though not consuming large amounts of water vill sihrnificantly alter the flow regime of the river resulting in lower wet season flows and much greater dry season flows The results of this are likely to be benetlmiddotshycial for SudanThe frequency of flooding which occurs ewry few years in the flat areas of the country and is particularly devastating in and around Khartoum may be reduced Higher dry season flows mean greater availability of water at a time when it is naturally scarce and hence increased opportunities for withdrawals f()r irrigation and other uses Thus increased water storshyage in Ethiopia has the potential to provide benefits for Sudan too
As a result of higher rainfall and lower evaporative demand net evaporation loss per cubic metre of water stored in the Ethiopian reservoirs (including Lake Tana which is a natural lake) is currently approximately 50 per cent of that in Sudan As more water is stored in Ethiopia this ratio decreases so that in the long term it could be as low as 8 per cent of that in Sudan (Table 148) This confirms that one of the most signifICant benefits of storing water in the Ethiopian Highlands rather than in the lower more arid regions ofSudan (or indeed in Egypt) is significantly reduced evaporation losses
For all scenarios the model was run as a single system making no allowance tor the fact that Ethiopia and Sudan are separate countries Water demands in Sudan were given the same priorshyity as those in Ethiopia and water was released from reservoirs in Ethiopia to meet downstream demands in Sudan This assumes a much higher level of cooperation between the two states in relation to both the planning and managel1lent of water resources than at present
Future research is needed to refme the model Key to improving the simulatiom are
improved estimates of irrigation water demand improved estimates of the dates on which schemes will become operational more realistic dam operating rules detailed economic livelihood and environmental assessments of the cumulative impacts of all the proposed schemes and evaluation of the possible hydrological implications of climate change
289
The Nile River Basin
An important issue not considered in the current model simulations is the transient stages of reservoir tilling Given the large cumulative volume of the planned reservoirs in Ethiopia it is essential that reservoir filling is planned and managed in such a way that adverse downstream impacts including potentially negative environmental and social impacts are minimized The need to give due consideration to dam operation that provides for environmental (lows to avoid degradation of riverine ecosystems has recently been emphasized (Reitburger and McCartney 2(11)
Conclusion
The WEAP model has been configured to simulate the impacts of water resources developshyment in the I3NI3 Currently Ethiopia utilizes very little water for irrigation but does reb1llate some tlow for hydropower production In contrast Sudan uses some water for hydropower production and also abstracts large volumes for irrigation Both countries plan to develop water resources substantially in the near future The extent to which actual water resources developshyment will match the plans of both countries in the long term is unclear and will depend a lot on unpredictable social and economic factors However in both Ethiopia and Sudan hydropower and irrigation are widely perceived as critical to national development and in both countries current investment in water infrastructure is substantial and increasing Consequently pressures on water resources are rising and will increase substantially in the near future
The results of this study have confirmed that if the states cooperate effectively mutually beneficial scenarios are possible upstream regulation in Ethiopia reduces evaporation losses probably reduces the frequency of flooding and provides opportunities for greatly increased water development in Sudan However maximizing benefits and minimizing potential adverse impacts (eg to the environment) especially when the large reservoirs are being filled require much greater cooperation than currently exim between the riparian states The key to success is the establishment of pragmatic institutional arrangements that enable the water resources of the basin to be planned and managed as a single entity (ie without consideration of national borders) in the most effective and equitable manner possible It is to be hoped that such arrangements will be devised through the protracted negotiations currently under way
References
Awulachew S B McCartney M P Steenhuis T SAhmedAA (200H) A Review oHydrology Sedimcnt and vVater Resource Use ill the Blue Nile Basil International Water Management Institute Colombo Sri Lanka
[lCEOM (1998) Abbay RiFcr Basin Jltlc~ralcd Development A1astcr Plan Section II v[lilme v 11latcr Resources De1Jeopcnl Parr 1 1rr(~ion awl Draillfljlc Ministry ofWater Resources Addis Abtba Ethiopia
Beyelle T md Abebe Jv1 (2006) Potential and development plan in Ethiopia Hydropower and Datlls 13 61-64
Block P Strzepek K and Rajagopalan B (2007) blfegrated Jv1anagement of till Blue Nile Basin ill Ethiopia Hydropower and Irr(llaquo(lrion rvtdeli~ IFPRI Discussion Paper 00700 International Food Policy Research Institute Wasbington DC p22
Cascao1 E (2009) Changing power relations in the Nile River Basin Cnilateralism vs cooperation Water Alternalives 2 2 245-268
Ebla G (2008) Study ofMainstem Dams on the Blue Nile MSc thesis Arba Minch University Ethiopia pp94 ENTRO (Eastern Nile Technical Regional Office) (2007) Preeasibility study of Border Hydrnpucr PJfct
Ethiopia ENTROAddis Ababa Ethiopia FAO (Food and Agriculture Organization of the Cnited Nations) (2002) Aruwuncing LJCCim the FAa Local
Climate Estimator CDROll] wwwfaoorgsd2002EN1203a_enhtm accessed June 2009 GeorgakakosA P (200)) Nile Decision Support Tool (Nile DST) Executive Summary Report submitted to
FAO and the Nile riparian states Rome Italy June
290
Ie transient stages of Dirs in Ethiopia it is adverse downstream are minimized The iron mental flows to ed (Reitburger and
r resources developshym but does regulate Iter for hydropower Ian to develop water r resources developshyI1d will depend a lot hiopia and Sudan opment and in both asing Consequently e near future effectively mutually evaporation losses or greatly increased ng potential adverse being filled require The key to success e water resources of deration of national )e hoped that such y under way
Hydrolog Sedimcrll and ~ Colombo Sri Lanka fume ~ Hlaler Resources lba Ethiopia
and Dams 13
Nile Basin ill Ethiopia Food Policy Research
vs cooperation Hlatcr
iversiry Ethiopia pp94 dey Hydropower Project
Simulating current and future water resources development in the Blue Nile River Basin
Guariso C and Whittington n (19H7) Implications of Ethiopian water development for Egypt and Sudan bltcrnaliltllllllJolJrnal Hater Resources Dncpmml 3 2 105-114
IbrahimY A Ahmed A A and Ramdan M S (2009) Improving water management practices in the Rahad Scheme (Sudan) in Improved Hlaler md Lmd lvanuJlClllcnt ill Ihe Ethiopian H(~hlallds lis lmpaa 01
DowlIStrealgtl Stakrlwlders Dependent )11 tile Blllt Nile Intermediate Results Dissemination Vorkshop held at the International Livestock Research Institute (ILRI) 5-6 February S 13 Awulachew T Erkossa V Smakhtin and EAshra (eds)Addis Ababa Ethiopia
Jigerskog A GranitJ Risberg A and Yn V (2007) Tramboundary water management as a regional public good in fillaflcil1g Exampllfrom rhe Nile Basin Report no 20 SIWI Stockholm Sweden
JICA (lapan International Cooperation Agency) (1997) Feasibility Reporr uti Power Declopmellt at Lake lim Rf~IOIIJapan Internatiol Cooperariol1 Agency Tokyo Japan
Lahmeyer Consulting Engineers (1962) GilJlfl Abay Scheme Imperial Ethiopian Government Ministry of Public Works Addis Ahaba Ethiopia
McCartney M I~ Alcmayehu T Shiferaw A and Awulachew S ]3 (2010) Evaluation of current and future water resources development in the Lake Tana Basin Ethiopia IWMI Research Report 134 International Water Management Institute Colombo Sri Lanka
MetawieA E (2()04) History of co-operation in the Nile Basin Hlater Resources Dedopmer 20 147-63 MonteithJ L (1981) Evaporation and surface temperature QII1rIcry Joumal of lile Royal A1etrorologiral SariOy
107 1~~27
Norconsult (2006) Karadobi Hultipurpo5c Projea Preea5ibility Sludy Report to the Ministry of Water ResoUTces The Federal Republic of Ethiopia Addis Ababa Ethiopia
Omer A M (2009) Hydropouer polcurial atld Priority for Dams Developmel1t ill Slitiall wwwscitopicscomHydropower_potentiaLand_priority_for_da1l1s_developmellcill_Suda11html accessed November 2010
Omer A M (2010) S14dmese dec[opmelll 20 September wwwwaterpowermagazinecom storyaspc=2U57614 accessed 29lpril 2012
Reitburger B and McCartney M E (2011) Concepts of environmental flow assessment and challenges in the Blue Iile I3asin Ethiopia i11 Nile Rifler B115it Hydroloxy Clinate alld Water Use A M Melesse (cd) ppJ37-35H Springer Heidelberg Germany
SEI (Stockholm Environlllem Instiwte) (2007) WEAl Hlatcr Evaluarion Alld Planning System U5er Cuide Stockholm Environment Institute I3oston MA
SutcliffeJV and ParksY P (1999) The Hydrology fthe Nilr IAHSWallingford UK USBR (United States Bureau ofReclalllation) (1964) Lard and Water Re50urce f lire Bille iVile B05iH Ethiopia
United States Bureau of Reclamation Main report United States Bureau of Reclal11ation Washington DC
VAlCOS (1990) Preimirwry Water Resources neueiopmen [asleY PlanIor Ethipi( Final Rc-port prepared f)r EVDSA Addis Ababa Ethiopia
Whittington D Wu X and Sadoff C (20()5) Water resources management in the Nile Basin the economic value of cooperation ~HlIcr Poicy 7227-252
Yates lJ Sieber] Purkey nand Huber-LeeA (2005) VEAP 21 a demand priority and preference driven water planning model part 1 model characteristics WlIf1 ililertlatiorral 30 4H7~500
YilJ1la D A and Awulachew S 13 (2009) Characterization and atlas of the I3lne Nile I3asin and its sub basins in IprolJCd ~1rcr drld LlIId lvlaI~rmrl1l ill tile Erhiopian H~hlaruls lIs Inpltlct Oil Downstream Stakeholder5 Dependent 011 rhe Blur Nile Intermediate Results Dissemination Workshop held at the International Livestock Research Institute (ILRI) 5-6 Febrmry S B Awulachew T ErkmsaV Smakhtin and F Ashra (cds) Addis Ababa Ethiopia
UJClim the pound40 Local ne 2009 Report submitted to
291

The Nile River Basin
~--------- -~-I
bull Jemma
Jemma Il[ bull Lem
Muger
Flow gHugmg stallOflS e(carewen ama gt 1000 j(nf) ~
Reservoir Gude
a Didessa Finchaa
bull Khano SUDAN
Downstream --- Irrigation upstream of__~__Rahxad Rohalt 148293 ha Lake Tana 7200 ha
Senna 167200 na Di~~---~
Gezira and Managii -- - -~~ ~~nnar 882195ha i
Ou(el Lake Tana
Upstream Sennar 71717 na
Suki 29827 ha
FinchaaDabus
V8145ha
InigallOn
V ReserVOIr Guder
Irrigation schemeb Finchaa
278
Welaka
Simulating current and future water resources development in the Blue Nile River Basin
SuIO 32767 ha North GOlam
I
Irfigaijon upstream of Lake Tan 69053ha
r___ Anger t)v--- Finchaa
Irrigahon o Diversions Flow gaugmg staUons bull 2014500Anger
(catchmmt rpa gt 1~OOO Imf) V Reservoir1445000 GuderVReservoir c FlOchaa
bull Khartoum SUDAN Rahad If 210046ha
6)0 Irriga_ ups1ream ofOownstrean f Lake Tana 69053 ha
lnigalion upstream of Sennar 228111 00
lake Tana 7200 ha ~_ Gezlra and Managil lake iTana NW Lake Tana L~ Pumping 6720ha882195 ha
2424 1 ~ ~ Upom Senna 117626 ha Oul18t Lake Trwa ~ t Oultel Lake Tana --_
~----
Kanana I amp II 4200931gt0 ~ _ O-Cjf Beles ~~ Bosheilo 0 d Upper Dioder 10000 ha-f) ~10( at ~ lit)
Suki 36128 ha r1--- Welaka
_bull~-middot--VDngurDm Upper Bele 537ooha J-----Welaka
Jemma
f lower Beles North Gojam Jemma m ETHIOPIA 85000 ha South GOlam bullbullbull
Loor ) WOmber I Mobrr Dab~ t_ ~aya--tgt _tgtdObl _ A _~ ___~~Se(
Upper ifMuger DD~US ~oe~sa rv Nekemte 11220ha NestleOabus 9661ha bull _ ~
bull T r- 7217 ha C r ~ Anger (t
OOi erslonsDabus ~=ahgation -t- Flnchaa ~ ~ha ~ Ange t 20145ha 17 If 14450 ha V (
Dfversions Arjo 13665h I FinchaVReservoir 1 t 1 J inigalion scheme
--cJ- 8 -+1 ct Guderdiversion41ooha Imgallon scheme d Dldessa Guder
F(iliYe 144 Schematic of the model contlguration for different scenarios (a) the natural situation (b) the current (2008) situation (e) the medium-term (2010-2025) future and (d) the long-term (2025-2050) future
279
The Nile River Basin
Time series of monthly naturalized How data for the period 1960-1992 obtained from the Abay Basin Master Plan (BCEOM 1998) and modified slightly based on more recent feasibilshyity studies (ENTRO 20(7) were used as input data In the future scenarios considerable time is needed to fill the planned large reservoirs particularly those located on the main stem of the Blue Nile River Hence a 20-year warm-up period was introduced and all comparisons benveen scenarios were made tor just the 13 years 1980-1992
Estimates of current irrigation and hydropower demand were derived from data provided by governmcnt ministries and agencies or from prcvious studies These included information on water passing through the turbines of the power stations and water diverted fix irrigation It was necessary to make several assumptions particularly about irrigation demands and the return t]ows from irrigation schemes Net evaporation fiom Lake Tana and the reservoirs was estimated from raillfall and potential evaporation data obtained from the meteorological station located closest to each dam These data were obtained from the FAO LocClirn datJb~lse (FAn 20(2)
For the mediul1l-term and long-term scenarios the sizes of planned hydropower and irrishygation development schemes were derived trom the basin master plan tor the Ethiopian Blue Nile and through discussion with academics and water resource planners in Sudan New schemes proposed extension of existing irrigation schemes as well as planned hydropower developments were identified (Tables 144 and 145) The medium-term scenario includes the Tma-Beles transfer scheme in EthiopiaThis project which involves the transfer of water from Lake lana to the Beles River to generate hydropower actually came on line in 2010 but after the modelling had been undertaken (McCartney ct al 2010)
hJIe 144 Proposed irrigation development in the Biue Nile Hiver Basin
Scheme Sub-basllI Dcsrriplitlfl Estimaled
completioll
dale -------------------------------------------shy
Ethiopia Lake Tana LakeTana Dams to be constructed OIl the major inflows to Lake Tana Medium
(ie Megech Ribb Guman and Gilgcl Abay) term
Total storage 102H million 111
Irrigation area 61 H53 ha
Average annml demand 516 million m
Bcles Belcs Upper Beles scheme 53700 ha Medium
Lower Beles scheme H5OOO ha term
Average annual demand 1554 million 111
Anger Anger Maximum irrigated area 14450 ha Mediulll
Average annual demand 202 million m ternl
Arjo Didessa Arjo scheme 13665 ha Medium
Average annual deIlland 921 million 111 j term
Dinder Dinder (but Upper Dinder scheme 10000 ha Medium
water Average annual demand 982 million m term
transferred
from Beles)
Finch a Finchaa Extemion of existing scheme Medium
Additional area 12000 ha term
Average annual demand 4566 million m j
280
192 obtained from the
1 more recent feasibilshy-ios considerable time 1 the main stem of the
and all comparisons
from data provided by luded information on ~d for irrigation It was nands and the return ~servoirs was estimated logical station located atabase (FAO 2002) hydropower and irri shy)r the Ethiopian Blue mers in Sudan New
planned hydropower scenario includes the transfer ofwater from line in 2010 but after
Estimated wmpletioll date
keTana Medium
term
Medium terlll
Medium term
Medmll1 terlll
Medium
term
Medium term
Simulating current and future water resources development in the Blue Nile River Basin
Table 144 Continned
Schaw Stih-basin Dcltcriplioll rislilllated
date
Rahad and Rahad Rahad and Galegu scheme 15029 ha Long term Average annual demand 607 millioll Ill
Dinder Dinder Dilldcc scheme 49555 hJ Long term Average annual demand 556 million ll1
Guder Guder Guder diversion 4100 ha Long term Guder 4R96 ha
Average annual demand 544 million Ill
Nekemte Anger Nekemte scheme 11220 ha Long term Averaglt anllual demand 715 million Ill
Dides-a Didessa Didessa irrigation scheme 5405R ha Long term
Average annual demand 7694 million 1lJ
Sudan
Raising Blue Nile Roseries dam raised by 10 III to provide total (gross) Medium
Roscries main stem storage of 7400 million m term
Dam
Extension Rahad Additional irrigation area 1J740 ha Medium of Rahad Rahad II irrigation scheme 210000 ha terlll
irrigation 1btal average annual demand 2433 million m
scheme
Extemion J)ue Nile Additional irrigation area 2940 h33361 ha Mediulll
ofSuki main stem Total average allnual demand 201 million m221 million 111 tcrm
irngation scheme
Extension Blue Nile Additional irrigation area 39910 ha Medium
of Upstrealll main stem Total average annual demand 745 million m term Sennar
Extcnsion Blue Nik Additional irrigation area 44110 h36R04 ha Mcdunn
of 11lain StClll Total average annual demand 1414 million Ill long term
Downstream 1526 million Ill
Sennar
Kenana II Blue Nile Additional irrigation area 420093 ha Medium
and III l11alll stelll Average allnual demand 2352 million m tenn
Soutb Dinder Additional irrigation area ~-lO 19 ha48318 hah Medium
Dindtr Average annual demand 541 million m ~51 million 111 II lung term
llotcs Schelllts arc extended partially in the mediUlll-tcnn future Jnd partially in the long-term filturc
IThe slash in the third C01Ulll11 demarcates values lwtweell the llledilllll-tcrm future and the ]ong-ttnll future
For many potential schemes there is currently considerable uncertainty about the dates when they will be completed In the current study it was assumed that for Ethiopian schemes if prefeasibility studies have been undertaken then the scheme will be completed in the mediulll term For all other planned schemes it was assumed that they will be completed in the long term For the Sudanese schemes information on likely completion dates was obtained
281
The Nile River Basin
TiJhle 14) Proposed hydropower development in the Blue Nile River Basin
Scheme Suh-basin Descriptioll Estimated
wmpletioN date
Ethiopia Tana-Beles TlIld and Beles Transfer of water from Lake Tana to Beles catchment for
hydropower production and lrrigatioll Hydropower capacity 460 MW
Average anllual transfer 2424 million 111
Medium
term
Anger Anger Linked to the Anger irrigation scheme Hydropower capacity 18-96 MW
Medium
term
Arjo Didessa Linked to the Atjo irrigation scheme
Hydropower capacity 33 MW
Medium
term
Karadobi Blue Nile main stem
Height of dam 250 m
Total storage 40220 million m
Hydropower capacity 1600 MW
Medium term
Mendaya Blue Nile
main stem
Height of dam 164
Total storage 15900 million 111
Hydropower capacity 1620 MW
Medium
term
Border Blue Nile
main stem
Height of dam 90 111
Total storage 11100 million 111
Hydropower capacity 1400 MW
Long term
Mabil Blue Nile
main stem
Height of dam 170 J1l
Total storage 17200 million III 1
Hydropower capacity 1200 MW
Long term
Lower Didessa Didessa Height of dam 110 Il1
final storage 5510 million 111
Hydropower capacity 1)0 MW
Long terlll
Dabus Dabl1s Linked to the Dabus irrigation cheme
Hydropower capacity 152 MW
Long term
Danguar Beles Height of dam 120 m
Total storage 4640 million m
Hydropower capacity 33 MW
Long term
Lower Daills Dabus Height of dam 50 1Il
10tal storage 1290 million m
Hydropower capacity 164 MW
Long term
from discussions with water resources experts within the country However clearly the two scenarios reflect only an approximate timeline tor water resources development in the basin In reality development is dependent on many external factors and so it is impossible to predict exactly when many planned schemes will actually be implemented or indeed the exact sequencing of schemes As they stand the medium-term and long-term future scenarios represhysent a plausible development trajectory but it is unlikely that it will actually come to pass in exactly the way envisaged
282
Estimated
compleril dale
lent for Medium term
Medium term
Medium
term
Medium term
Medium term
Long term
Long term
Long term
Long term
Long term
Long term
rever clearly the two )ment in the basin In impossible to predict or indeed the exact Iture scenarios represhy1ally come to pass in
Simulating current and future water resources development in tile Blue Nile River Basin
The water withdrawals for irrigation schemes were derived from a variety of sources including the Ethiopia Basin master plan and where available feasibility studies For Sudan useful information on irrigation water use was obtained from a study of the Roseries irrigation scheme (Ibrahim ct al 20(9) In schemes for which there were no data it was assumed that withdrawals per hectare would be similar to those at the nearest scheme where data were availshyable with some allowances for differences in rainf111 where this ditTered signifIcantly between locations Irrigation return flows were estimated from existing feasibility studies and averaged approximately 20 per cent of withdrawals in Ethiopia and 15 per cent in Sudan Where it is planned to extend irrigation schemes the future withdrawals and return flows were estimated based on current values but weighted by the new area Thus no allowance was made tor possishyble future improvements in irrigation dhciency Furthermore no allowance was made tor inter-annual variations in rainfall which might affect irrigation demand between years
Results
Model validation
Figure 145 shows the simulated and observed flows at the Ethiopia-Sudan border and at Khartoum for the current situation At Khartoum observed data (obtained from the Global Data Runoff Centre) were only available tor the period 1960--1982 Over this period the error in the simulated mean annual flow was 19 per cent_ As a result of current abstractions primashyrily tor irrigation in Sudan the flow at Khartoum is estimated to be approximately 7J-l billion m yc less than would have occurred naturally over this period (ie 424 billion 111 yr- 1 rather than 502 billion tn yr 1) At the border there are two flow gauging stations One is operated by the Government of Ethiopia and just a few kilometres downstream another is operated by the Government of Sudan Possibly because of differences in periods of missing data observed flows at these two stations differ and there is a 10 per cent difference in mean annual flow over the period 1960-1992 506 billion m measured by Ethiopia and 455 billion m measured by Sudan Without a detailed analysis which was beyond the scope of the present study it is not possible to know which of the two flow series is the more accurate The WEAP model simushylation falls between the two with a mean annual discharge of 462 billion m
Figure 146 compares the simulated and observed water levels of Lake Tana also over the period 1960-1992 Although the average simulated water level (17863 masl) is close to the observed average (17860 masl) it is clear that the variability ill the simulated water levels does not quite match that of the observed levels Nevertheless these results in conjunction with the flow results indicate that the WEAP simulation of the current situation is reasonably accurate and provides credibility for the results of the simulated future scenarios
Comparison ofscenarios
Currently irrigation water withdrawals in Sudan greatly exceed those in Ethiopia because of the differences in irrigated area The total irrigation demand in Sudan is estimated to average 845 billion nr yr-This compares with an average ofjust 026 billion m yr- in EthiopiaWith the planned irrigation development demand is estimated to increase to 1339 billion and 238 billion m yC in the medium-term scenarios and to 1383 billion and 381 billion 111 yr 1 in the long-term scenarios in Sudan and Ethiopia respectively (Table 146) If all planned dams are constructed the total reservoir storage in Ethiopia is estimated to increase to 70 billion Ill (ie 15 times the mean annual flow at the border) in the mid-term and to 167 biJ1ion 11 (ie
283
The Nile River Basin
36 times the mean annual flow at the border) in the long term Hydropower generated in Ethiopia from the Tis Abay and Finchaa power stations is currently estimated to be 1383 GWh yr With the construction of the Tana Ueles transfer the Karadobi dam and other smaller schemes this is estimated to increase to 12908 GWh yr in the medium term With Uorder Mendaya and Mabil hydropower stations as well as with additional smaller schemes electricity production in the long terll1 could increase to 31297 GWh yr
Hydropower generated on the U1ue Nile in Sudan is currently estimated to be just over 1000 GWh ye but there arc no publicly available data to confirm this estimate Because of the additional head and increased storage the raising of the Roseries dam will result in a very small increase to 1134 GWh yr I in the medium term and to 1205 GWh yr I in the long term The increase in the long term is due entirely to greater dry season resulting from increased regulation upstream in Ethiopb
40000a bull bullI35000
bull30000 bull 25000 bullbull
bull l
f bull I I I
~ 20000 ~ o I f u 15000 I~10000
II bull III bull I III III rl ~ 5000 II II I I
bull bull t II Ie IIbull middotI bull o
0 0 0 M VI 0) N VI 00 0 co ltXl q~ i9 C C C C c c C c c C C S C C t S ~ ~ ~ ~ ~ ~ ~ ~ ~ ~ ~
- Observed Flow at Khartoum bullbullbullbullSimUlated Flow at Khartoum
18000
16000
14000 ~E
eshy 12000
g ~ 10000 gtshyc 8000C 0 E 6000 c ltlgt 40002
2000
0
Jan Feb Mar Apr May June July Aug Sep Oct Nov Dec
- Observed flow at Khartoum bullbullbullbull Simulated flow at Khartoum
b
cu cat
ah lIH
tio lIlt
284
ropower generated in ated to be 1383 GWh
am and other smaller m term With Border
b
Simulating current and jutllre water resources development in the Blue Nile River Basin
40000
middot 35000 t I
30000 t I
er schemes electricity
11ated to be just over timate Because of the J result in a very small in the long term The u1ting from increased
- 0
C 9 q 0 i~ ~i Ji
lUm
-
~ -ltshy
~ ~ - _ Nov Dec
n
_ 25000 E 620000 0 u 15000
10000
5000
0
-
18000
16000
~ 14000 ~E
5 12000
g 10000 raquo
J 8000C 0 E 6000 c (J) 4000i
2000
o
bullbull
0 - 0 0 N M 0 0 q~ ~ ~ 9 r-- r-- - r-- P P f ltXl f l i c r C i C i c C C c ~ ~ ~ ~ ~ ~ ~ ~ ~ ~ ~Ji Ji Ji Ji Ji Ji Ji Ji Ji Ji Ji
Observed flow at the border - - - bull Simulated flow at the border
Measured MAF in Ethiopia 5068 m
Measured MAF in Sudan = WEAP Simulated MAF = 462 8m
455Bm
Jan Feb Mar Apr May June July Aug 5ep Oct Nov Dec
- Observed flow in Ethiopia - - - bull Simulated flow at the border
-- Observed flow in Sudan
F(qWf 145 Simulated and observed flow series and mean monthly flows (1960-1992) for the Blue Nile (current situation) at (a) Khartoum and (b) the Ethiopia-Sudan border
Comparison of the mean monthly flows at Khartoum tor the simulated natural condition current situation and the mediulIl- and long-term scenarios tor the 13 years 1980-1 SlSl2 indishy
cates how the mean annual flow is progressively reduced as a consequence of greater upstream abstractions (Table 147) Wet season flmvs are reduced significantly but dry season flows are increased as a consequence offlow regulation (Figure 147Table 147) Under natural condishytions 84 per cent of the river flow occurs in the wet season months (July-October) In the medium-term and long-term scenarios this is reduced to 61 and 37 per cent respectively
285
The Nile River Basin
17875
17870
17865
17860
17855
I
17850 0 M U r- 00 0 N ~ U r- 01 N ~ 0 00 01 0 0 0 r- r- r- I 00 00 00 co cof r- r- ~ C ~ C ~ C C C
u 5 3 u 5 Q u 5 Q u 5 Q uC1l C1l C1l C1l C1l ~ 0 lt( 0 lt( 0 lt( 0 lt( 0
- WEAP simulated water level bullbullbullbullbull Observed water level
Figure 146 Simulated and observed water levels in Lake Tana (1960-1992)
Tablc 146 Comparison of current Jnd future irrigation demand and hydropower production in the Ethiopian and Sudanese parts of the Blue Nile
Curreri Jfedil1n-lerm Ji4t1ire LOl1g-teml future
Eilliopia Slldal1 Ethiopia Sudal1 Ethiopia SlIdml
Total storage (lllillion 111) ] l57H 3370 70244 10770 167079 10770
Formal irrigatiotl Area (ha) lt]0000 ]305000 210000 2]26000 461000 2190000
Water withdrawJls per year 026 845 238 1339 381 n83 (millio1111l yr)
Hydropower Installed capacity (MW) 218 295 2194 295 6426 295 Production (GWh yr ) 1383 1029 12908 1134 31297 1205
10[( Allowance llladc for sedinlentation of both the Roscrlcs and Sennar reservoirs
At the Ethiopia-Sudan border the current situation is almost identical to the natural condishytion so this is not shown (Figure 147) Mean annual flow is reduced from 452 to 432 and 427 billion nr in the medium-term and long-term future scenarios respectively As in Khartoum there is a significant reduction in wet season flows but there are signifICant increases
in dry season flows as a consequence of flow regulation (Figure 147Table 147) Under natushyral conditions 81 per cent of the river flow occurs in the wet season but this decreases to 59 and 43 per cent in the medium-term and long-te-m scenarios respectively The total decrease in border flow in the long-term scenario is less than might be ex-pected given the increased
286
ltt 00 000 00 00 J or CiJ C Q ra u laquo 0
water level
ver production in the
LOlx-term fu lure
Ethiopia
167079
461000 381
6426 31297
Sudan
10770
2190000 1383
295 1205
Simulating current al1d future water resources developmel1t il1 the Blue Nile River Basin
a 18000 Simulated natural MAF 482 Bm 3
Simulated current MAF =40A Bm 316000 Simulated medium -term future MAF =33ABm 3f 14000 Simulated long-term future MAF =319Bm 3
~ 12000
~ 10000 gt -pound 8000 c 0 E 6000 c
~ (1l 4000
2000
0
Jan Feb Mar Apr May June July Aug Sep Oct Nov Dec
-Natural flow -Current flow - - -Medium-term future _ Long-term future
18000 Simulated natural MAF = 452 Bm3
16000
b
Simulated current MAF = 452 Bm)
f 14000 Simulated medium middotterm future MAF = 432 Bm 3
Simulated longmiddotterm future MAF =427 Bm~ 12000 3 g 10000 gt pound 8000 c 0
6000E c
~ (1l 4000
2000
0
Jan Feb Mar Apr May June July Aug Sep Oct Nov Dec
- Natural flow - - bull Medium-term future _ Long-term future
Fixure 147 Comparison of simulated mean monthly flow derived for natural current mecHum-term and long-term future scenarios at (a) Khartoum and (b) the Ethiopiamiddot-Sudan border
irrigation demand in Ethiopia The reason is partly that less water is diverted fi-om the Tana to the Beles catchmem ano more flow is routed down the main stem of Blue Nile
rurrently shortfalls (ie failure in any given month to supply the full amount of water needed for irrigation withdrawals or hydropower needs) in Ethiopia are negligible However in the medium-term scenario shortfalls increase to 08 and 50 billion m l yr for irrigation and hydropower respectively In the long term the increased storage means that shortfalls will avershyage 04 billion m for irrigation and 07 billion m l yr- for hydropower In comparison under current conditions there is an average shortfall of 08 billion m in water for the Sudanese irrigation schemes However because of the improved flow regulation there are no shortfalls in irrigation or hydropower in Sudan in either the medium- or the long-term scenarshyios These results reflect the fact that in each scenario the Sudanese schemes were given the same priority as those in Ethiopia Hence although in the medium term and long term more water is stored in Ethiopia in these scenarios no preference was given to the schemes in Ethiopia
I to the natural condishyrom 452 to 432 and )S respectively As in
re significant increases le 147) Under natushyIt this decreases to 59
dy The total decrease f given the increased
287
The Nile River Basin
lablr 147 Simulated mean monthly flow (million m) at the Ethiopia-Sudan border and Khartoum for natural current medium- and long-term tiJture scenarios (1980-1992)
Atom Naruml Currcrlt Aledium-term filturr Long-term future Border Khartollm Border Khartoum Border Khartoutll Border Khartoum
--~---~-~--------~---------
January 835 835 955 B55 1565 3220 2710 4405 February 470 470 380 740 1180 2220 2110 3175 March 350 350 400 475 845 1615 19BO 2770 April 310 310 520 620 710 1315 1635 2250 May 390 390 645 710 680 1235 14B5 2055
June 980 990 1230 640 1390 2273 2203 3125
July 5930 6235 6105 5365 3870 2560 4820 3420 August 15770 16830 15430 15950 8400 8615 4H20 4245 September 10590 116HO 10130 10165 H020 7490 4665 3760 October 53()O SH25 4970 3865 5315 1740 4105 420 November 2750 2795 2() 15 3JO 8870 2ltgt0 9095 250 December 1510 1510 1575 740 2305 H50 3055 1990 10ta1 45245 48220 45155 40435 43150 33395 426H5 3LB65
Net evaporation (ie the difference between evaporation trom a reservoir and the rainfall directly onto its surface) from the Ethiopian reservoirs currently averages 08 billion m yr- However by f3r the bulk of this is from Lake Tana which is a natural geographic feature and would be evaporating even without regulation By comparison net evaporation from the Sudanese reservoirs is 04 billion 111 yr- In the medium term this increases to 12 billion 111
yr in Ethiopia (03 billion m yr excluding Lake Tam) and to 14 billion m yr in Sudan The increase in Sudan is due to the increased area of the Roseries reservoir arising from raisshying the Roseries Dam and the fact that water levels in both Roseries and Sennar reservoirs are maintained at higher levels because of the higher dry season inflows In the long term total net reservoir evaporation increases to 17 billion m yr in Ethiopia (08 billion 111 yr bull excluding Lake Tam) and remains at 14 billion m l yr- in Sudan However evaporation losses per cubic metre of water stored are considerably lower in Ethiopia than in Sudan in all the scenarios In
fact as a result of the locations of the planned reservoirs as storage increases in Ethiopia losses per cubic metre of water stored decrease significantly over time (Table 14H)
labe 148 Simulated average annual net evaporation trom reservoirs in Ethiopia and Sudan for each of the scenarios
Sccnario Ethiopir SHdml
Tiltal lillal EJaptJratiou Iblal Iotal Elapomrioll storage evaporation from stOlalZe st()ra~e (U(1poration fn)Jn _f)ra~~l
(millioll ml (millivlI II) Imm) (millioll m) (millioll tn) (m i 111-)
Current 1157il H46 007 3370 443 013 Medium term 70244 l1SB (l02 10770 1363 013 Long term 167079 1732 Cl01 10770 13H7 013
N(lres Including from Lake 1ma which is a natural lake though regulated by the Char Chara weir
288
der and Khartoum for )
Long-term future Border Khartoum
2710 4405 2110 3175 1980 2770 1635 2250 1485 2055 2205 3125 4820 3420 4820 4245 4665 3760 4105 420 9095 250 3055 1990 42685 31865
~voir and the rainfall s 08 billion m 1 yc agraphic feature and vaporation from the Ises to 12 billion m on m yr I in Sudan oir arising from raisshySennaI reservoirs are long term total net on 111 yr excluding tion losses per cubic I all the scenarios In es in Ethiopia losses 8)
Ind Sudan fix each of
Euaporati()11 )ratiol1 I1om _forage
Oil m (111 I1l )
013 013 013
nra we-ir
Simulating current and future water resources development in the Blue Nile River Basin
Discussion
The results presented in this chapter are based on many assumptiolls Lack of data on flow and water demand and use particularly in Sudall makes it very difficult to validate the model for the current situation However where it has been possible to verifY them the model results appear to be reasonably accurate For example in the current scenario simulated flows closely match the observed flows at key locations on the main stem of the river and the simulated water levels in Lake Tana were reasonably accurate (Figures 145 and 146) Consequently though the results should be treated with caution they arc believed to be broadly indicative of the likely impacts arising trom the development currently being considered in both Ethiopia and Sudan By illustrating what may occur the scenarios provide information that is useful for resource pbnning and the results provide a basis for discussion
Climate and hence hydrological variability possibly increased by future climate change will remain key tilCtorS in the economic development of both Ethiopia and Sudan in the future As in the past future water resources development in the Blue Nile will be driven predominantly by the need felf water for agriculture and hydropower and hence the need for large volumes of stored water Irrigation will remain by filf the largest user of water and the future scenarios indicate significantly increased water withdrawals as a conseqnence of increasing irrigation predominantly in Sudan and also increasingly in Ethiopia The construction of the dams particularly the very large hydropower dams proposed by Ethiopia though not consuming large amounts of water vill sihrnificantly alter the flow regime of the river resulting in lower wet season flows and much greater dry season flows The results of this are likely to be benetlmiddotshycial for SudanThe frequency of flooding which occurs ewry few years in the flat areas of the country and is particularly devastating in and around Khartoum may be reduced Higher dry season flows mean greater availability of water at a time when it is naturally scarce and hence increased opportunities for withdrawals f()r irrigation and other uses Thus increased water storshyage in Ethiopia has the potential to provide benefits for Sudan too
As a result of higher rainfall and lower evaporative demand net evaporation loss per cubic metre of water stored in the Ethiopian reservoirs (including Lake Tana which is a natural lake) is currently approximately 50 per cent of that in Sudan As more water is stored in Ethiopia this ratio decreases so that in the long term it could be as low as 8 per cent of that in Sudan (Table 148) This confirms that one of the most signifICant benefits of storing water in the Ethiopian Highlands rather than in the lower more arid regions ofSudan (or indeed in Egypt) is significantly reduced evaporation losses
For all scenarios the model was run as a single system making no allowance tor the fact that Ethiopia and Sudan are separate countries Water demands in Sudan were given the same priorshyity as those in Ethiopia and water was released from reservoirs in Ethiopia to meet downstream demands in Sudan This assumes a much higher level of cooperation between the two states in relation to both the planning and managel1lent of water resources than at present
Future research is needed to refme the model Key to improving the simulatiom are
improved estimates of irrigation water demand improved estimates of the dates on which schemes will become operational more realistic dam operating rules detailed economic livelihood and environmental assessments of the cumulative impacts of all the proposed schemes and evaluation of the possible hydrological implications of climate change
289
The Nile River Basin
An important issue not considered in the current model simulations is the transient stages of reservoir tilling Given the large cumulative volume of the planned reservoirs in Ethiopia it is essential that reservoir filling is planned and managed in such a way that adverse downstream impacts including potentially negative environmental and social impacts are minimized The need to give due consideration to dam operation that provides for environmental (lows to avoid degradation of riverine ecosystems has recently been emphasized (Reitburger and McCartney 2(11)
Conclusion
The WEAP model has been configured to simulate the impacts of water resources developshyment in the I3NI3 Currently Ethiopia utilizes very little water for irrigation but does reb1llate some tlow for hydropower production In contrast Sudan uses some water for hydropower production and also abstracts large volumes for irrigation Both countries plan to develop water resources substantially in the near future The extent to which actual water resources developshyment will match the plans of both countries in the long term is unclear and will depend a lot on unpredictable social and economic factors However in both Ethiopia and Sudan hydropower and irrigation are widely perceived as critical to national development and in both countries current investment in water infrastructure is substantial and increasing Consequently pressures on water resources are rising and will increase substantially in the near future
The results of this study have confirmed that if the states cooperate effectively mutually beneficial scenarios are possible upstream regulation in Ethiopia reduces evaporation losses probably reduces the frequency of flooding and provides opportunities for greatly increased water development in Sudan However maximizing benefits and minimizing potential adverse impacts (eg to the environment) especially when the large reservoirs are being filled require much greater cooperation than currently exim between the riparian states The key to success is the establishment of pragmatic institutional arrangements that enable the water resources of the basin to be planned and managed as a single entity (ie without consideration of national borders) in the most effective and equitable manner possible It is to be hoped that such arrangements will be devised through the protracted negotiations currently under way
References
Awulachew S B McCartney M P Steenhuis T SAhmedAA (200H) A Review oHydrology Sedimcnt and vVater Resource Use ill the Blue Nile Basil International Water Management Institute Colombo Sri Lanka
[lCEOM (1998) Abbay RiFcr Basin Jltlc~ralcd Development A1astcr Plan Section II v[lilme v 11latcr Resources De1Jeopcnl Parr 1 1rr(~ion awl Draillfljlc Ministry ofWater Resources Addis Abtba Ethiopia
Beyelle T md Abebe Jv1 (2006) Potential and development plan in Ethiopia Hydropower and Datlls 13 61-64
Block P Strzepek K and Rajagopalan B (2007) blfegrated Jv1anagement of till Blue Nile Basin ill Ethiopia Hydropower and Irr(llaquo(lrion rvtdeli~ IFPRI Discussion Paper 00700 International Food Policy Research Institute Wasbington DC p22
Cascao1 E (2009) Changing power relations in the Nile River Basin Cnilateralism vs cooperation Water Alternalives 2 2 245-268
Ebla G (2008) Study ofMainstem Dams on the Blue Nile MSc thesis Arba Minch University Ethiopia pp94 ENTRO (Eastern Nile Technical Regional Office) (2007) Preeasibility study of Border Hydrnpucr PJfct
Ethiopia ENTROAddis Ababa Ethiopia FAO (Food and Agriculture Organization of the Cnited Nations) (2002) Aruwuncing LJCCim the FAa Local
Climate Estimator CDROll] wwwfaoorgsd2002EN1203a_enhtm accessed June 2009 GeorgakakosA P (200)) Nile Decision Support Tool (Nile DST) Executive Summary Report submitted to
FAO and the Nile riparian states Rome Italy June
290
Ie transient stages of Dirs in Ethiopia it is adverse downstream are minimized The iron mental flows to ed (Reitburger and
r resources developshym but does regulate Iter for hydropower Ian to develop water r resources developshyI1d will depend a lot hiopia and Sudan opment and in both asing Consequently e near future effectively mutually evaporation losses or greatly increased ng potential adverse being filled require The key to success e water resources of deration of national )e hoped that such y under way
Hydrolog Sedimcrll and ~ Colombo Sri Lanka fume ~ Hlaler Resources lba Ethiopia
and Dams 13
Nile Basin ill Ethiopia Food Policy Research
vs cooperation Hlatcr
iversiry Ethiopia pp94 dey Hydropower Project
Simulating current and future water resources development in the Blue Nile River Basin
Guariso C and Whittington n (19H7) Implications of Ethiopian water development for Egypt and Sudan bltcrnaliltllllllJolJrnal Hater Resources Dncpmml 3 2 105-114
IbrahimY A Ahmed A A and Ramdan M S (2009) Improving water management practices in the Rahad Scheme (Sudan) in Improved Hlaler md Lmd lvanuJlClllcnt ill Ihe Ethiopian H(~hlallds lis lmpaa 01
DowlIStrealgtl Stakrlwlders Dependent )11 tile Blllt Nile Intermediate Results Dissemination Vorkshop held at the International Livestock Research Institute (ILRI) 5-6 February S 13 Awulachew T Erkossa V Smakhtin and EAshra (eds)Addis Ababa Ethiopia
Jigerskog A GranitJ Risberg A and Yn V (2007) Tramboundary water management as a regional public good in fillaflcil1g Exampllfrom rhe Nile Basin Report no 20 SIWI Stockholm Sweden
JICA (lapan International Cooperation Agency) (1997) Feasibility Reporr uti Power Declopmellt at Lake lim Rf~IOIIJapan Internatiol Cooperariol1 Agency Tokyo Japan
Lahmeyer Consulting Engineers (1962) GilJlfl Abay Scheme Imperial Ethiopian Government Ministry of Public Works Addis Ahaba Ethiopia
McCartney M I~ Alcmayehu T Shiferaw A and Awulachew S ]3 (2010) Evaluation of current and future water resources development in the Lake Tana Basin Ethiopia IWMI Research Report 134 International Water Management Institute Colombo Sri Lanka
MetawieA E (2()04) History of co-operation in the Nile Basin Hlater Resources Dedopmer 20 147-63 MonteithJ L (1981) Evaporation and surface temperature QII1rIcry Joumal of lile Royal A1etrorologiral SariOy
107 1~~27
Norconsult (2006) Karadobi Hultipurpo5c Projea Preea5ibility Sludy Report to the Ministry of Water ResoUTces The Federal Republic of Ethiopia Addis Ababa Ethiopia
Omer A M (2009) Hydropouer polcurial atld Priority for Dams Developmel1t ill Slitiall wwwscitopicscomHydropower_potentiaLand_priority_for_da1l1s_developmellcill_Suda11html accessed November 2010
Omer A M (2010) S14dmese dec[opmelll 20 September wwwwaterpowermagazinecom storyaspc=2U57614 accessed 29lpril 2012
Reitburger B and McCartney M E (2011) Concepts of environmental flow assessment and challenges in the Blue Iile I3asin Ethiopia i11 Nile Rifler B115it Hydroloxy Clinate alld Water Use A M Melesse (cd) ppJ37-35H Springer Heidelberg Germany
SEI (Stockholm Environlllem Instiwte) (2007) WEAl Hlatcr Evaluarion Alld Planning System U5er Cuide Stockholm Environment Institute I3oston MA
SutcliffeJV and ParksY P (1999) The Hydrology fthe Nilr IAHSWallingford UK USBR (United States Bureau ofReclalllation) (1964) Lard and Water Re50urce f lire Bille iVile B05iH Ethiopia
United States Bureau of Reclamation Main report United States Bureau of Reclal11ation Washington DC
VAlCOS (1990) Preimirwry Water Resources neueiopmen [asleY PlanIor Ethipi( Final Rc-port prepared f)r EVDSA Addis Ababa Ethiopia
Whittington D Wu X and Sadoff C (20()5) Water resources management in the Nile Basin the economic value of cooperation ~HlIcr Poicy 7227-252
Yates lJ Sieber] Purkey nand Huber-LeeA (2005) VEAP 21 a demand priority and preference driven water planning model part 1 model characteristics WlIf1 ililertlatiorral 30 4H7~500
YilJ1la D A and Awulachew S 13 (2009) Characterization and atlas of the I3lne Nile I3asin and its sub basins in IprolJCd ~1rcr drld LlIId lvlaI~rmrl1l ill tile Erhiopian H~hlaruls lIs Inpltlct Oil Downstream Stakeholder5 Dependent 011 rhe Blur Nile Intermediate Results Dissemination Workshop held at the International Livestock Research Institute (ILRI) 5-6 Febrmry S B Awulachew T ErkmsaV Smakhtin and F Ashra (cds) Addis Ababa Ethiopia
UJClim the pound40 Local ne 2009 Report submitted to
291

The Nile River Basin
Time series of monthly naturalized How data for the period 1960-1992 obtained from the Abay Basin Master Plan (BCEOM 1998) and modified slightly based on more recent feasibilshyity studies (ENTRO 20(7) were used as input data In the future scenarios considerable time is needed to fill the planned large reservoirs particularly those located on the main stem of the Blue Nile River Hence a 20-year warm-up period was introduced and all comparisons benveen scenarios were made tor just the 13 years 1980-1992
Estimates of current irrigation and hydropower demand were derived from data provided by governmcnt ministries and agencies or from prcvious studies These included information on water passing through the turbines of the power stations and water diverted fix irrigation It was necessary to make several assumptions particularly about irrigation demands and the return t]ows from irrigation schemes Net evaporation fiom Lake Tana and the reservoirs was estimated from raillfall and potential evaporation data obtained from the meteorological station located closest to each dam These data were obtained from the FAO LocClirn datJb~lse (FAn 20(2)
For the mediul1l-term and long-term scenarios the sizes of planned hydropower and irrishygation development schemes were derived trom the basin master plan tor the Ethiopian Blue Nile and through discussion with academics and water resource planners in Sudan New schemes proposed extension of existing irrigation schemes as well as planned hydropower developments were identified (Tables 144 and 145) The medium-term scenario includes the Tma-Beles transfer scheme in EthiopiaThis project which involves the transfer of water from Lake lana to the Beles River to generate hydropower actually came on line in 2010 but after the modelling had been undertaken (McCartney ct al 2010)
hJIe 144 Proposed irrigation development in the Biue Nile Hiver Basin
Scheme Sub-basllI Dcsrriplitlfl Estimaled
completioll
dale -------------------------------------------shy
Ethiopia Lake Tana LakeTana Dams to be constructed OIl the major inflows to Lake Tana Medium
(ie Megech Ribb Guman and Gilgcl Abay) term
Total storage 102H million 111
Irrigation area 61 H53 ha
Average annml demand 516 million m
Bcles Belcs Upper Beles scheme 53700 ha Medium
Lower Beles scheme H5OOO ha term
Average annual demand 1554 million 111
Anger Anger Maximum irrigated area 14450 ha Mediulll
Average annual demand 202 million m ternl
Arjo Didessa Arjo scheme 13665 ha Medium
Average annual deIlland 921 million 111 j term
Dinder Dinder (but Upper Dinder scheme 10000 ha Medium
water Average annual demand 982 million m term
transferred
from Beles)
Finch a Finchaa Extemion of existing scheme Medium
Additional area 12000 ha term
Average annual demand 4566 million m j
280
192 obtained from the
1 more recent feasibilshy-ios considerable time 1 the main stem of the
and all comparisons
from data provided by luded information on ~d for irrigation It was nands and the return ~servoirs was estimated logical station located atabase (FAO 2002) hydropower and irri shy)r the Ethiopian Blue mers in Sudan New
planned hydropower scenario includes the transfer ofwater from line in 2010 but after
Estimated wmpletioll date
keTana Medium
term
Medium terlll
Medium term
Medmll1 terlll
Medium
term
Medium term
Simulating current and future water resources development in the Blue Nile River Basin
Table 144 Continned
Schaw Stih-basin Dcltcriplioll rislilllated
date
Rahad and Rahad Rahad and Galegu scheme 15029 ha Long term Average annual demand 607 millioll Ill
Dinder Dinder Dilldcc scheme 49555 hJ Long term Average annual demand 556 million ll1
Guder Guder Guder diversion 4100 ha Long term Guder 4R96 ha
Average annual demand 544 million Ill
Nekemte Anger Nekemte scheme 11220 ha Long term Averaglt anllual demand 715 million Ill
Dides-a Didessa Didessa irrigation scheme 5405R ha Long term
Average annual demand 7694 million 1lJ
Sudan
Raising Blue Nile Roseries dam raised by 10 III to provide total (gross) Medium
Roscries main stem storage of 7400 million m term
Dam
Extension Rahad Additional irrigation area 1J740 ha Medium of Rahad Rahad II irrigation scheme 210000 ha terlll
irrigation 1btal average annual demand 2433 million m
scheme
Extemion J)ue Nile Additional irrigation area 2940 h33361 ha Mediulll
ofSuki main stem Total average allnual demand 201 million m221 million 111 tcrm
irngation scheme
Extension Blue Nile Additional irrigation area 39910 ha Medium
of Upstrealll main stem Total average annual demand 745 million m term Sennar
Extcnsion Blue Nik Additional irrigation area 44110 h36R04 ha Mcdunn
of 11lain StClll Total average annual demand 1414 million Ill long term
Downstream 1526 million Ill
Sennar
Kenana II Blue Nile Additional irrigation area 420093 ha Medium
and III l11alll stelll Average allnual demand 2352 million m tenn
Soutb Dinder Additional irrigation area ~-lO 19 ha48318 hah Medium
Dindtr Average annual demand 541 million m ~51 million 111 II lung term
llotcs Schelllts arc extended partially in the mediUlll-tcnn future Jnd partially in the long-term filturc
IThe slash in the third C01Ulll11 demarcates values lwtweell the llledilllll-tcrm future and the ]ong-ttnll future
For many potential schemes there is currently considerable uncertainty about the dates when they will be completed In the current study it was assumed that for Ethiopian schemes if prefeasibility studies have been undertaken then the scheme will be completed in the mediulll term For all other planned schemes it was assumed that they will be completed in the long term For the Sudanese schemes information on likely completion dates was obtained
281
The Nile River Basin
TiJhle 14) Proposed hydropower development in the Blue Nile River Basin
Scheme Suh-basin Descriptioll Estimated
wmpletioN date
Ethiopia Tana-Beles TlIld and Beles Transfer of water from Lake Tana to Beles catchment for
hydropower production and lrrigatioll Hydropower capacity 460 MW
Average anllual transfer 2424 million 111
Medium
term
Anger Anger Linked to the Anger irrigation scheme Hydropower capacity 18-96 MW
Medium
term
Arjo Didessa Linked to the Atjo irrigation scheme
Hydropower capacity 33 MW
Medium
term
Karadobi Blue Nile main stem
Height of dam 250 m
Total storage 40220 million m
Hydropower capacity 1600 MW
Medium term
Mendaya Blue Nile
main stem
Height of dam 164
Total storage 15900 million 111
Hydropower capacity 1620 MW
Medium
term
Border Blue Nile
main stem
Height of dam 90 111
Total storage 11100 million 111
Hydropower capacity 1400 MW
Long term
Mabil Blue Nile
main stem
Height of dam 170 J1l
Total storage 17200 million III 1
Hydropower capacity 1200 MW
Long term
Lower Didessa Didessa Height of dam 110 Il1
final storage 5510 million 111
Hydropower capacity 1)0 MW
Long terlll
Dabus Dabl1s Linked to the Dabus irrigation cheme
Hydropower capacity 152 MW
Long term
Danguar Beles Height of dam 120 m
Total storage 4640 million m
Hydropower capacity 33 MW
Long term
Lower Daills Dabus Height of dam 50 1Il
10tal storage 1290 million m
Hydropower capacity 164 MW
Long term
from discussions with water resources experts within the country However clearly the two scenarios reflect only an approximate timeline tor water resources development in the basin In reality development is dependent on many external factors and so it is impossible to predict exactly when many planned schemes will actually be implemented or indeed the exact sequencing of schemes As they stand the medium-term and long-term future scenarios represhysent a plausible development trajectory but it is unlikely that it will actually come to pass in exactly the way envisaged
282
Estimated
compleril dale
lent for Medium term
Medium term
Medium
term
Medium term
Medium term
Long term
Long term
Long term
Long term
Long term
Long term
rever clearly the two )ment in the basin In impossible to predict or indeed the exact Iture scenarios represhy1ally come to pass in
Simulating current and future water resources development in tile Blue Nile River Basin
The water withdrawals for irrigation schemes were derived from a variety of sources including the Ethiopia Basin master plan and where available feasibility studies For Sudan useful information on irrigation water use was obtained from a study of the Roseries irrigation scheme (Ibrahim ct al 20(9) In schemes for which there were no data it was assumed that withdrawals per hectare would be similar to those at the nearest scheme where data were availshyable with some allowances for differences in rainf111 where this ditTered signifIcantly between locations Irrigation return flows were estimated from existing feasibility studies and averaged approximately 20 per cent of withdrawals in Ethiopia and 15 per cent in Sudan Where it is planned to extend irrigation schemes the future withdrawals and return flows were estimated based on current values but weighted by the new area Thus no allowance was made tor possishyble future improvements in irrigation dhciency Furthermore no allowance was made tor inter-annual variations in rainfall which might affect irrigation demand between years
Results
Model validation
Figure 145 shows the simulated and observed flows at the Ethiopia-Sudan border and at Khartoum for the current situation At Khartoum observed data (obtained from the Global Data Runoff Centre) were only available tor the period 1960--1982 Over this period the error in the simulated mean annual flow was 19 per cent_ As a result of current abstractions primashyrily tor irrigation in Sudan the flow at Khartoum is estimated to be approximately 7J-l billion m yc less than would have occurred naturally over this period (ie 424 billion 111 yr- 1 rather than 502 billion tn yr 1) At the border there are two flow gauging stations One is operated by the Government of Ethiopia and just a few kilometres downstream another is operated by the Government of Sudan Possibly because of differences in periods of missing data observed flows at these two stations differ and there is a 10 per cent difference in mean annual flow over the period 1960-1992 506 billion m measured by Ethiopia and 455 billion m measured by Sudan Without a detailed analysis which was beyond the scope of the present study it is not possible to know which of the two flow series is the more accurate The WEAP model simushylation falls between the two with a mean annual discharge of 462 billion m
Figure 146 compares the simulated and observed water levels of Lake Tana also over the period 1960-1992 Although the average simulated water level (17863 masl) is close to the observed average (17860 masl) it is clear that the variability ill the simulated water levels does not quite match that of the observed levels Nevertheless these results in conjunction with the flow results indicate that the WEAP simulation of the current situation is reasonably accurate and provides credibility for the results of the simulated future scenarios
Comparison ofscenarios
Currently irrigation water withdrawals in Sudan greatly exceed those in Ethiopia because of the differences in irrigated area The total irrigation demand in Sudan is estimated to average 845 billion nr yr-This compares with an average ofjust 026 billion m yr- in EthiopiaWith the planned irrigation development demand is estimated to increase to 1339 billion and 238 billion m yC in the medium-term scenarios and to 1383 billion and 381 billion 111 yr 1 in the long-term scenarios in Sudan and Ethiopia respectively (Table 146) If all planned dams are constructed the total reservoir storage in Ethiopia is estimated to increase to 70 billion Ill (ie 15 times the mean annual flow at the border) in the mid-term and to 167 biJ1ion 11 (ie
283
The Nile River Basin
36 times the mean annual flow at the border) in the long term Hydropower generated in Ethiopia from the Tis Abay and Finchaa power stations is currently estimated to be 1383 GWh yr With the construction of the Tana Ueles transfer the Karadobi dam and other smaller schemes this is estimated to increase to 12908 GWh yr in the medium term With Uorder Mendaya and Mabil hydropower stations as well as with additional smaller schemes electricity production in the long terll1 could increase to 31297 GWh yr
Hydropower generated on the U1ue Nile in Sudan is currently estimated to be just over 1000 GWh ye but there arc no publicly available data to confirm this estimate Because of the additional head and increased storage the raising of the Roseries dam will result in a very small increase to 1134 GWh yr I in the medium term and to 1205 GWh yr I in the long term The increase in the long term is due entirely to greater dry season resulting from increased regulation upstream in Ethiopb
40000a bull bullI35000
bull30000 bull 25000 bullbull
bull l
f bull I I I
~ 20000 ~ o I f u 15000 I~10000
II bull III bull I III III rl ~ 5000 II II I I
bull bull t II Ie IIbull middotI bull o
0 0 0 M VI 0) N VI 00 0 co ltXl q~ i9 C C C C c c C c c C C S C C t S ~ ~ ~ ~ ~ ~ ~ ~ ~ ~ ~
- Observed Flow at Khartoum bullbullbullbullSimUlated Flow at Khartoum
18000
16000
14000 ~E
eshy 12000
g ~ 10000 gtshyc 8000C 0 E 6000 c ltlgt 40002
2000
0
Jan Feb Mar Apr May June July Aug Sep Oct Nov Dec
- Observed flow at Khartoum bullbullbullbull Simulated flow at Khartoum
b
cu cat
ah lIH
tio lIlt
284
ropower generated in ated to be 1383 GWh
am and other smaller m term With Border
b
Simulating current and jutllre water resources development in the Blue Nile River Basin
40000
middot 35000 t I
30000 t I
er schemes electricity
11ated to be just over timate Because of the J result in a very small in the long term The u1ting from increased
- 0
C 9 q 0 i~ ~i Ji
lUm
-
~ -ltshy
~ ~ - _ Nov Dec
n
_ 25000 E 620000 0 u 15000
10000
5000
0
-
18000
16000
~ 14000 ~E
5 12000
g 10000 raquo
J 8000C 0 E 6000 c (J) 4000i
2000
o
bullbull
0 - 0 0 N M 0 0 q~ ~ ~ 9 r-- r-- - r-- P P f ltXl f l i c r C i C i c C C c ~ ~ ~ ~ ~ ~ ~ ~ ~ ~ ~Ji Ji Ji Ji Ji Ji Ji Ji Ji Ji Ji
Observed flow at the border - - - bull Simulated flow at the border
Measured MAF in Ethiopia 5068 m
Measured MAF in Sudan = WEAP Simulated MAF = 462 8m
455Bm
Jan Feb Mar Apr May June July Aug 5ep Oct Nov Dec
- Observed flow in Ethiopia - - - bull Simulated flow at the border
-- Observed flow in Sudan
F(qWf 145 Simulated and observed flow series and mean monthly flows (1960-1992) for the Blue Nile (current situation) at (a) Khartoum and (b) the Ethiopia-Sudan border
Comparison of the mean monthly flows at Khartoum tor the simulated natural condition current situation and the mediulIl- and long-term scenarios tor the 13 years 1980-1 SlSl2 indishy
cates how the mean annual flow is progressively reduced as a consequence of greater upstream abstractions (Table 147) Wet season flmvs are reduced significantly but dry season flows are increased as a consequence offlow regulation (Figure 147Table 147) Under natural condishytions 84 per cent of the river flow occurs in the wet season months (July-October) In the medium-term and long-term scenarios this is reduced to 61 and 37 per cent respectively
285
The Nile River Basin
17875
17870
17865
17860
17855
I
17850 0 M U r- 00 0 N ~ U r- 01 N ~ 0 00 01 0 0 0 r- r- r- I 00 00 00 co cof r- r- ~ C ~ C ~ C C C
u 5 3 u 5 Q u 5 Q u 5 Q uC1l C1l C1l C1l C1l ~ 0 lt( 0 lt( 0 lt( 0 lt( 0
- WEAP simulated water level bullbullbullbullbull Observed water level
Figure 146 Simulated and observed water levels in Lake Tana (1960-1992)
Tablc 146 Comparison of current Jnd future irrigation demand and hydropower production in the Ethiopian and Sudanese parts of the Blue Nile
Curreri Jfedil1n-lerm Ji4t1ire LOl1g-teml future
Eilliopia Slldal1 Ethiopia Sudal1 Ethiopia SlIdml
Total storage (lllillion 111) ] l57H 3370 70244 10770 167079 10770
Formal irrigatiotl Area (ha) lt]0000 ]305000 210000 2]26000 461000 2190000
Water withdrawJls per year 026 845 238 1339 381 n83 (millio1111l yr)
Hydropower Installed capacity (MW) 218 295 2194 295 6426 295 Production (GWh yr ) 1383 1029 12908 1134 31297 1205
10[( Allowance llladc for sedinlentation of both the Roscrlcs and Sennar reservoirs
At the Ethiopia-Sudan border the current situation is almost identical to the natural condishytion so this is not shown (Figure 147) Mean annual flow is reduced from 452 to 432 and 427 billion nr in the medium-term and long-term future scenarios respectively As in Khartoum there is a significant reduction in wet season flows but there are signifICant increases
in dry season flows as a consequence of flow regulation (Figure 147Table 147) Under natushyral conditions 81 per cent of the river flow occurs in the wet season but this decreases to 59 and 43 per cent in the medium-term and long-te-m scenarios respectively The total decrease in border flow in the long-term scenario is less than might be ex-pected given the increased
286
ltt 00 000 00 00 J or CiJ C Q ra u laquo 0
water level
ver production in the
LOlx-term fu lure
Ethiopia
167079
461000 381
6426 31297
Sudan
10770
2190000 1383
295 1205
Simulating current al1d future water resources developmel1t il1 the Blue Nile River Basin
a 18000 Simulated natural MAF 482 Bm 3
Simulated current MAF =40A Bm 316000 Simulated medium -term future MAF =33ABm 3f 14000 Simulated long-term future MAF =319Bm 3
~ 12000
~ 10000 gt -pound 8000 c 0 E 6000 c
~ (1l 4000
2000
0
Jan Feb Mar Apr May June July Aug Sep Oct Nov Dec
-Natural flow -Current flow - - -Medium-term future _ Long-term future
18000 Simulated natural MAF = 452 Bm3
16000
b
Simulated current MAF = 452 Bm)
f 14000 Simulated medium middotterm future MAF = 432 Bm 3
Simulated longmiddotterm future MAF =427 Bm~ 12000 3 g 10000 gt pound 8000 c 0
6000E c
~ (1l 4000
2000
0
Jan Feb Mar Apr May June July Aug Sep Oct Nov Dec
- Natural flow - - bull Medium-term future _ Long-term future
Fixure 147 Comparison of simulated mean monthly flow derived for natural current mecHum-term and long-term future scenarios at (a) Khartoum and (b) the Ethiopiamiddot-Sudan border
irrigation demand in Ethiopia The reason is partly that less water is diverted fi-om the Tana to the Beles catchmem ano more flow is routed down the main stem of Blue Nile
rurrently shortfalls (ie failure in any given month to supply the full amount of water needed for irrigation withdrawals or hydropower needs) in Ethiopia are negligible However in the medium-term scenario shortfalls increase to 08 and 50 billion m l yr for irrigation and hydropower respectively In the long term the increased storage means that shortfalls will avershyage 04 billion m for irrigation and 07 billion m l yr- for hydropower In comparison under current conditions there is an average shortfall of 08 billion m in water for the Sudanese irrigation schemes However because of the improved flow regulation there are no shortfalls in irrigation or hydropower in Sudan in either the medium- or the long-term scenarshyios These results reflect the fact that in each scenario the Sudanese schemes were given the same priority as those in Ethiopia Hence although in the medium term and long term more water is stored in Ethiopia in these scenarios no preference was given to the schemes in Ethiopia
I to the natural condishyrom 452 to 432 and )S respectively As in
re significant increases le 147) Under natushyIt this decreases to 59
dy The total decrease f given the increased
287
The Nile River Basin
lablr 147 Simulated mean monthly flow (million m) at the Ethiopia-Sudan border and Khartoum for natural current medium- and long-term tiJture scenarios (1980-1992)
Atom Naruml Currcrlt Aledium-term filturr Long-term future Border Khartollm Border Khartoum Border Khartoutll Border Khartoum
--~---~-~--------~---------
January 835 835 955 B55 1565 3220 2710 4405 February 470 470 380 740 1180 2220 2110 3175 March 350 350 400 475 845 1615 19BO 2770 April 310 310 520 620 710 1315 1635 2250 May 390 390 645 710 680 1235 14B5 2055
June 980 990 1230 640 1390 2273 2203 3125
July 5930 6235 6105 5365 3870 2560 4820 3420 August 15770 16830 15430 15950 8400 8615 4H20 4245 September 10590 116HO 10130 10165 H020 7490 4665 3760 October 53()O SH25 4970 3865 5315 1740 4105 420 November 2750 2795 2() 15 3JO 8870 2ltgt0 9095 250 December 1510 1510 1575 740 2305 H50 3055 1990 10ta1 45245 48220 45155 40435 43150 33395 426H5 3LB65
Net evaporation (ie the difference between evaporation trom a reservoir and the rainfall directly onto its surface) from the Ethiopian reservoirs currently averages 08 billion m yr- However by f3r the bulk of this is from Lake Tana which is a natural geographic feature and would be evaporating even without regulation By comparison net evaporation from the Sudanese reservoirs is 04 billion 111 yr- In the medium term this increases to 12 billion 111
yr in Ethiopia (03 billion m yr excluding Lake Tam) and to 14 billion m yr in Sudan The increase in Sudan is due to the increased area of the Roseries reservoir arising from raisshying the Roseries Dam and the fact that water levels in both Roseries and Sennar reservoirs are maintained at higher levels because of the higher dry season inflows In the long term total net reservoir evaporation increases to 17 billion m yr in Ethiopia (08 billion 111 yr bull excluding Lake Tam) and remains at 14 billion m l yr- in Sudan However evaporation losses per cubic metre of water stored are considerably lower in Ethiopia than in Sudan in all the scenarios In
fact as a result of the locations of the planned reservoirs as storage increases in Ethiopia losses per cubic metre of water stored decrease significantly over time (Table 14H)
labe 148 Simulated average annual net evaporation trom reservoirs in Ethiopia and Sudan for each of the scenarios
Sccnario Ethiopir SHdml
Tiltal lillal EJaptJratiou Iblal Iotal Elapomrioll storage evaporation from stOlalZe st()ra~e (U(1poration fn)Jn _f)ra~~l
(millioll ml (millivlI II) Imm) (millioll m) (millioll tn) (m i 111-)
Current 1157il H46 007 3370 443 013 Medium term 70244 l1SB (l02 10770 1363 013 Long term 167079 1732 Cl01 10770 13H7 013
N(lres Including from Lake 1ma which is a natural lake though regulated by the Char Chara weir
288
der and Khartoum for )
Long-term future Border Khartoum
2710 4405 2110 3175 1980 2770 1635 2250 1485 2055 2205 3125 4820 3420 4820 4245 4665 3760 4105 420 9095 250 3055 1990 42685 31865
~voir and the rainfall s 08 billion m 1 yc agraphic feature and vaporation from the Ises to 12 billion m on m yr I in Sudan oir arising from raisshySennaI reservoirs are long term total net on 111 yr excluding tion losses per cubic I all the scenarios In es in Ethiopia losses 8)
Ind Sudan fix each of
Euaporati()11 )ratiol1 I1om _forage
Oil m (111 I1l )
013 013 013
nra we-ir
Simulating current and future water resources development in the Blue Nile River Basin
Discussion
The results presented in this chapter are based on many assumptiolls Lack of data on flow and water demand and use particularly in Sudall makes it very difficult to validate the model for the current situation However where it has been possible to verifY them the model results appear to be reasonably accurate For example in the current scenario simulated flows closely match the observed flows at key locations on the main stem of the river and the simulated water levels in Lake Tana were reasonably accurate (Figures 145 and 146) Consequently though the results should be treated with caution they arc believed to be broadly indicative of the likely impacts arising trom the development currently being considered in both Ethiopia and Sudan By illustrating what may occur the scenarios provide information that is useful for resource pbnning and the results provide a basis for discussion
Climate and hence hydrological variability possibly increased by future climate change will remain key tilCtorS in the economic development of both Ethiopia and Sudan in the future As in the past future water resources development in the Blue Nile will be driven predominantly by the need felf water for agriculture and hydropower and hence the need for large volumes of stored water Irrigation will remain by filf the largest user of water and the future scenarios indicate significantly increased water withdrawals as a conseqnence of increasing irrigation predominantly in Sudan and also increasingly in Ethiopia The construction of the dams particularly the very large hydropower dams proposed by Ethiopia though not consuming large amounts of water vill sihrnificantly alter the flow regime of the river resulting in lower wet season flows and much greater dry season flows The results of this are likely to be benetlmiddotshycial for SudanThe frequency of flooding which occurs ewry few years in the flat areas of the country and is particularly devastating in and around Khartoum may be reduced Higher dry season flows mean greater availability of water at a time when it is naturally scarce and hence increased opportunities for withdrawals f()r irrigation and other uses Thus increased water storshyage in Ethiopia has the potential to provide benefits for Sudan too
As a result of higher rainfall and lower evaporative demand net evaporation loss per cubic metre of water stored in the Ethiopian reservoirs (including Lake Tana which is a natural lake) is currently approximately 50 per cent of that in Sudan As more water is stored in Ethiopia this ratio decreases so that in the long term it could be as low as 8 per cent of that in Sudan (Table 148) This confirms that one of the most signifICant benefits of storing water in the Ethiopian Highlands rather than in the lower more arid regions ofSudan (or indeed in Egypt) is significantly reduced evaporation losses
For all scenarios the model was run as a single system making no allowance tor the fact that Ethiopia and Sudan are separate countries Water demands in Sudan were given the same priorshyity as those in Ethiopia and water was released from reservoirs in Ethiopia to meet downstream demands in Sudan This assumes a much higher level of cooperation between the two states in relation to both the planning and managel1lent of water resources than at present
Future research is needed to refme the model Key to improving the simulatiom are
improved estimates of irrigation water demand improved estimates of the dates on which schemes will become operational more realistic dam operating rules detailed economic livelihood and environmental assessments of the cumulative impacts of all the proposed schemes and evaluation of the possible hydrological implications of climate change
289
The Nile River Basin
An important issue not considered in the current model simulations is the transient stages of reservoir tilling Given the large cumulative volume of the planned reservoirs in Ethiopia it is essential that reservoir filling is planned and managed in such a way that adverse downstream impacts including potentially negative environmental and social impacts are minimized The need to give due consideration to dam operation that provides for environmental (lows to avoid degradation of riverine ecosystems has recently been emphasized (Reitburger and McCartney 2(11)
Conclusion
The WEAP model has been configured to simulate the impacts of water resources developshyment in the I3NI3 Currently Ethiopia utilizes very little water for irrigation but does reb1llate some tlow for hydropower production In contrast Sudan uses some water for hydropower production and also abstracts large volumes for irrigation Both countries plan to develop water resources substantially in the near future The extent to which actual water resources developshyment will match the plans of both countries in the long term is unclear and will depend a lot on unpredictable social and economic factors However in both Ethiopia and Sudan hydropower and irrigation are widely perceived as critical to national development and in both countries current investment in water infrastructure is substantial and increasing Consequently pressures on water resources are rising and will increase substantially in the near future
The results of this study have confirmed that if the states cooperate effectively mutually beneficial scenarios are possible upstream regulation in Ethiopia reduces evaporation losses probably reduces the frequency of flooding and provides opportunities for greatly increased water development in Sudan However maximizing benefits and minimizing potential adverse impacts (eg to the environment) especially when the large reservoirs are being filled require much greater cooperation than currently exim between the riparian states The key to success is the establishment of pragmatic institutional arrangements that enable the water resources of the basin to be planned and managed as a single entity (ie without consideration of national borders) in the most effective and equitable manner possible It is to be hoped that such arrangements will be devised through the protracted negotiations currently under way
References
Awulachew S B McCartney M P Steenhuis T SAhmedAA (200H) A Review oHydrology Sedimcnt and vVater Resource Use ill the Blue Nile Basil International Water Management Institute Colombo Sri Lanka
[lCEOM (1998) Abbay RiFcr Basin Jltlc~ralcd Development A1astcr Plan Section II v[lilme v 11latcr Resources De1Jeopcnl Parr 1 1rr(~ion awl Draillfljlc Ministry ofWater Resources Addis Abtba Ethiopia
Beyelle T md Abebe Jv1 (2006) Potential and development plan in Ethiopia Hydropower and Datlls 13 61-64
Block P Strzepek K and Rajagopalan B (2007) blfegrated Jv1anagement of till Blue Nile Basin ill Ethiopia Hydropower and Irr(llaquo(lrion rvtdeli~ IFPRI Discussion Paper 00700 International Food Policy Research Institute Wasbington DC p22
Cascao1 E (2009) Changing power relations in the Nile River Basin Cnilateralism vs cooperation Water Alternalives 2 2 245-268
Ebla G (2008) Study ofMainstem Dams on the Blue Nile MSc thesis Arba Minch University Ethiopia pp94 ENTRO (Eastern Nile Technical Regional Office) (2007) Preeasibility study of Border Hydrnpucr PJfct
Ethiopia ENTROAddis Ababa Ethiopia FAO (Food and Agriculture Organization of the Cnited Nations) (2002) Aruwuncing LJCCim the FAa Local
Climate Estimator CDROll] wwwfaoorgsd2002EN1203a_enhtm accessed June 2009 GeorgakakosA P (200)) Nile Decision Support Tool (Nile DST) Executive Summary Report submitted to
FAO and the Nile riparian states Rome Italy June
290
Ie transient stages of Dirs in Ethiopia it is adverse downstream are minimized The iron mental flows to ed (Reitburger and
r resources developshym but does regulate Iter for hydropower Ian to develop water r resources developshyI1d will depend a lot hiopia and Sudan opment and in both asing Consequently e near future effectively mutually evaporation losses or greatly increased ng potential adverse being filled require The key to success e water resources of deration of national )e hoped that such y under way
Hydrolog Sedimcrll and ~ Colombo Sri Lanka fume ~ Hlaler Resources lba Ethiopia
and Dams 13
Nile Basin ill Ethiopia Food Policy Research
vs cooperation Hlatcr
iversiry Ethiopia pp94 dey Hydropower Project
Simulating current and future water resources development in the Blue Nile River Basin
Guariso C and Whittington n (19H7) Implications of Ethiopian water development for Egypt and Sudan bltcrnaliltllllllJolJrnal Hater Resources Dncpmml 3 2 105-114
IbrahimY A Ahmed A A and Ramdan M S (2009) Improving water management practices in the Rahad Scheme (Sudan) in Improved Hlaler md Lmd lvanuJlClllcnt ill Ihe Ethiopian H(~hlallds lis lmpaa 01
DowlIStrealgtl Stakrlwlders Dependent )11 tile Blllt Nile Intermediate Results Dissemination Vorkshop held at the International Livestock Research Institute (ILRI) 5-6 February S 13 Awulachew T Erkossa V Smakhtin and EAshra (eds)Addis Ababa Ethiopia
Jigerskog A GranitJ Risberg A and Yn V (2007) Tramboundary water management as a regional public good in fillaflcil1g Exampllfrom rhe Nile Basin Report no 20 SIWI Stockholm Sweden
JICA (lapan International Cooperation Agency) (1997) Feasibility Reporr uti Power Declopmellt at Lake lim Rf~IOIIJapan Internatiol Cooperariol1 Agency Tokyo Japan
Lahmeyer Consulting Engineers (1962) GilJlfl Abay Scheme Imperial Ethiopian Government Ministry of Public Works Addis Ahaba Ethiopia
McCartney M I~ Alcmayehu T Shiferaw A and Awulachew S ]3 (2010) Evaluation of current and future water resources development in the Lake Tana Basin Ethiopia IWMI Research Report 134 International Water Management Institute Colombo Sri Lanka
MetawieA E (2()04) History of co-operation in the Nile Basin Hlater Resources Dedopmer 20 147-63 MonteithJ L (1981) Evaporation and surface temperature QII1rIcry Joumal of lile Royal A1etrorologiral SariOy
107 1~~27
Norconsult (2006) Karadobi Hultipurpo5c Projea Preea5ibility Sludy Report to the Ministry of Water ResoUTces The Federal Republic of Ethiopia Addis Ababa Ethiopia
Omer A M (2009) Hydropouer polcurial atld Priority for Dams Developmel1t ill Slitiall wwwscitopicscomHydropower_potentiaLand_priority_for_da1l1s_developmellcill_Suda11html accessed November 2010
Omer A M (2010) S14dmese dec[opmelll 20 September wwwwaterpowermagazinecom storyaspc=2U57614 accessed 29lpril 2012
Reitburger B and McCartney M E (2011) Concepts of environmental flow assessment and challenges in the Blue Iile I3asin Ethiopia i11 Nile Rifler B115it Hydroloxy Clinate alld Water Use A M Melesse (cd) ppJ37-35H Springer Heidelberg Germany
SEI (Stockholm Environlllem Instiwte) (2007) WEAl Hlatcr Evaluarion Alld Planning System U5er Cuide Stockholm Environment Institute I3oston MA
SutcliffeJV and ParksY P (1999) The Hydrology fthe Nilr IAHSWallingford UK USBR (United States Bureau ofReclalllation) (1964) Lard and Water Re50urce f lire Bille iVile B05iH Ethiopia
United States Bureau of Reclamation Main report United States Bureau of Reclal11ation Washington DC
VAlCOS (1990) Preimirwry Water Resources neueiopmen [asleY PlanIor Ethipi( Final Rc-port prepared f)r EVDSA Addis Ababa Ethiopia
Whittington D Wu X and Sadoff C (20()5) Water resources management in the Nile Basin the economic value of cooperation ~HlIcr Poicy 7227-252
Yates lJ Sieber] Purkey nand Huber-LeeA (2005) VEAP 21 a demand priority and preference driven water planning model part 1 model characteristics WlIf1 ililertlatiorral 30 4H7~500
YilJ1la D A and Awulachew S 13 (2009) Characterization and atlas of the I3lne Nile I3asin and its sub basins in IprolJCd ~1rcr drld LlIId lvlaI~rmrl1l ill tile Erhiopian H~hlaruls lIs Inpltlct Oil Downstream Stakeholder5 Dependent 011 rhe Blur Nile Intermediate Results Dissemination Workshop held at the International Livestock Research Institute (ILRI) 5-6 Febrmry S B Awulachew T ErkmsaV Smakhtin and F Ashra (cds) Addis Ababa Ethiopia
UJClim the pound40 Local ne 2009 Report submitted to
291
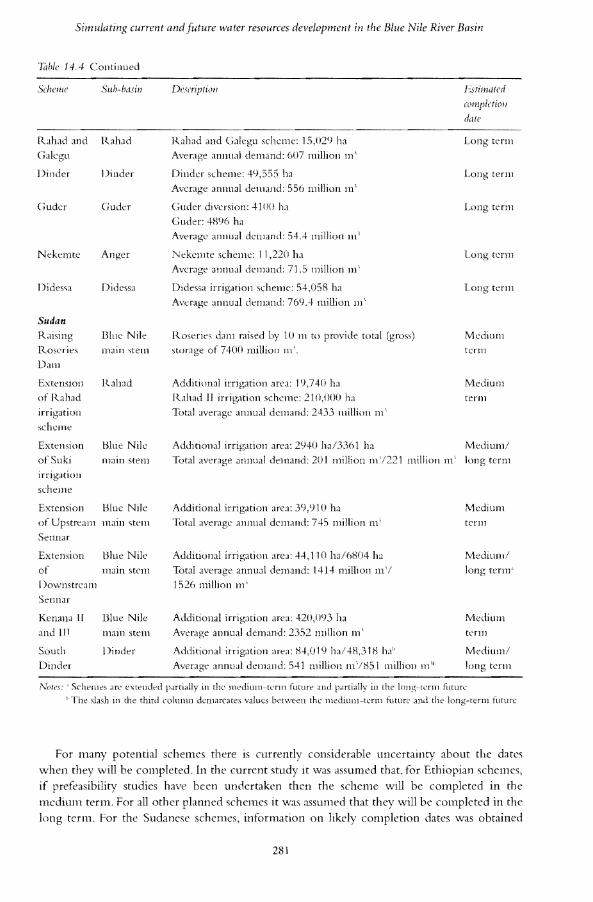

The Nile River Basin
TiJhle 14) Proposed hydropower development in the Blue Nile River Basin
Scheme Suh-basin Descriptioll Estimated
wmpletioN date
Ethiopia Tana-Beles TlIld and Beles Transfer of water from Lake Tana to Beles catchment for
hydropower production and lrrigatioll Hydropower capacity 460 MW
Average anllual transfer 2424 million 111
Medium
term
Anger Anger Linked to the Anger irrigation scheme Hydropower capacity 18-96 MW
Medium
term
Arjo Didessa Linked to the Atjo irrigation scheme
Hydropower capacity 33 MW
Medium
term
Karadobi Blue Nile main stem
Height of dam 250 m
Total storage 40220 million m
Hydropower capacity 1600 MW
Medium term
Mendaya Blue Nile
main stem
Height of dam 164
Total storage 15900 million 111
Hydropower capacity 1620 MW
Medium
term
Border Blue Nile
main stem
Height of dam 90 111
Total storage 11100 million 111
Hydropower capacity 1400 MW
Long term
Mabil Blue Nile
main stem
Height of dam 170 J1l
Total storage 17200 million III 1
Hydropower capacity 1200 MW
Long term
Lower Didessa Didessa Height of dam 110 Il1
final storage 5510 million 111
Hydropower capacity 1)0 MW
Long terlll
Dabus Dabl1s Linked to the Dabus irrigation cheme
Hydropower capacity 152 MW
Long term
Danguar Beles Height of dam 120 m
Total storage 4640 million m
Hydropower capacity 33 MW
Long term
Lower Daills Dabus Height of dam 50 1Il
10tal storage 1290 million m
Hydropower capacity 164 MW
Long term
from discussions with water resources experts within the country However clearly the two scenarios reflect only an approximate timeline tor water resources development in the basin In reality development is dependent on many external factors and so it is impossible to predict exactly when many planned schemes will actually be implemented or indeed the exact sequencing of schemes As they stand the medium-term and long-term future scenarios represhysent a plausible development trajectory but it is unlikely that it will actually come to pass in exactly the way envisaged
282
Estimated
compleril dale
lent for Medium term
Medium term
Medium
term
Medium term
Medium term
Long term
Long term
Long term
Long term
Long term
Long term
rever clearly the two )ment in the basin In impossible to predict or indeed the exact Iture scenarios represhy1ally come to pass in
Simulating current and future water resources development in tile Blue Nile River Basin
The water withdrawals for irrigation schemes were derived from a variety of sources including the Ethiopia Basin master plan and where available feasibility studies For Sudan useful information on irrigation water use was obtained from a study of the Roseries irrigation scheme (Ibrahim ct al 20(9) In schemes for which there were no data it was assumed that withdrawals per hectare would be similar to those at the nearest scheme where data were availshyable with some allowances for differences in rainf111 where this ditTered signifIcantly between locations Irrigation return flows were estimated from existing feasibility studies and averaged approximately 20 per cent of withdrawals in Ethiopia and 15 per cent in Sudan Where it is planned to extend irrigation schemes the future withdrawals and return flows were estimated based on current values but weighted by the new area Thus no allowance was made tor possishyble future improvements in irrigation dhciency Furthermore no allowance was made tor inter-annual variations in rainfall which might affect irrigation demand between years
Results
Model validation
Figure 145 shows the simulated and observed flows at the Ethiopia-Sudan border and at Khartoum for the current situation At Khartoum observed data (obtained from the Global Data Runoff Centre) were only available tor the period 1960--1982 Over this period the error in the simulated mean annual flow was 19 per cent_ As a result of current abstractions primashyrily tor irrigation in Sudan the flow at Khartoum is estimated to be approximately 7J-l billion m yc less than would have occurred naturally over this period (ie 424 billion 111 yr- 1 rather than 502 billion tn yr 1) At the border there are two flow gauging stations One is operated by the Government of Ethiopia and just a few kilometres downstream another is operated by the Government of Sudan Possibly because of differences in periods of missing data observed flows at these two stations differ and there is a 10 per cent difference in mean annual flow over the period 1960-1992 506 billion m measured by Ethiopia and 455 billion m measured by Sudan Without a detailed analysis which was beyond the scope of the present study it is not possible to know which of the two flow series is the more accurate The WEAP model simushylation falls between the two with a mean annual discharge of 462 billion m
Figure 146 compares the simulated and observed water levels of Lake Tana also over the period 1960-1992 Although the average simulated water level (17863 masl) is close to the observed average (17860 masl) it is clear that the variability ill the simulated water levels does not quite match that of the observed levels Nevertheless these results in conjunction with the flow results indicate that the WEAP simulation of the current situation is reasonably accurate and provides credibility for the results of the simulated future scenarios
Comparison ofscenarios
Currently irrigation water withdrawals in Sudan greatly exceed those in Ethiopia because of the differences in irrigated area The total irrigation demand in Sudan is estimated to average 845 billion nr yr-This compares with an average ofjust 026 billion m yr- in EthiopiaWith the planned irrigation development demand is estimated to increase to 1339 billion and 238 billion m yC in the medium-term scenarios and to 1383 billion and 381 billion 111 yr 1 in the long-term scenarios in Sudan and Ethiopia respectively (Table 146) If all planned dams are constructed the total reservoir storage in Ethiopia is estimated to increase to 70 billion Ill (ie 15 times the mean annual flow at the border) in the mid-term and to 167 biJ1ion 11 (ie
283
The Nile River Basin
36 times the mean annual flow at the border) in the long term Hydropower generated in Ethiopia from the Tis Abay and Finchaa power stations is currently estimated to be 1383 GWh yr With the construction of the Tana Ueles transfer the Karadobi dam and other smaller schemes this is estimated to increase to 12908 GWh yr in the medium term With Uorder Mendaya and Mabil hydropower stations as well as with additional smaller schemes electricity production in the long terll1 could increase to 31297 GWh yr
Hydropower generated on the U1ue Nile in Sudan is currently estimated to be just over 1000 GWh ye but there arc no publicly available data to confirm this estimate Because of the additional head and increased storage the raising of the Roseries dam will result in a very small increase to 1134 GWh yr I in the medium term and to 1205 GWh yr I in the long term The increase in the long term is due entirely to greater dry season resulting from increased regulation upstream in Ethiopb
40000a bull bullI35000
bull30000 bull 25000 bullbull
bull l
f bull I I I
~ 20000 ~ o I f u 15000 I~10000
II bull III bull I III III rl ~ 5000 II II I I
bull bull t II Ie IIbull middotI bull o
0 0 0 M VI 0) N VI 00 0 co ltXl q~ i9 C C C C c c C c c C C S C C t S ~ ~ ~ ~ ~ ~ ~ ~ ~ ~ ~
- Observed Flow at Khartoum bullbullbullbullSimUlated Flow at Khartoum
18000
16000
14000 ~E
eshy 12000
g ~ 10000 gtshyc 8000C 0 E 6000 c ltlgt 40002
2000
0
Jan Feb Mar Apr May June July Aug Sep Oct Nov Dec
- Observed flow at Khartoum bullbullbullbull Simulated flow at Khartoum
b
cu cat
ah lIH
tio lIlt
284
ropower generated in ated to be 1383 GWh
am and other smaller m term With Border
b
Simulating current and jutllre water resources development in the Blue Nile River Basin
40000
middot 35000 t I
30000 t I
er schemes electricity
11ated to be just over timate Because of the J result in a very small in the long term The u1ting from increased
- 0
C 9 q 0 i~ ~i Ji
lUm
-
~ -ltshy
~ ~ - _ Nov Dec
n
_ 25000 E 620000 0 u 15000
10000
5000
0
-
18000
16000
~ 14000 ~E
5 12000
g 10000 raquo
J 8000C 0 E 6000 c (J) 4000i
2000
o
bullbull
0 - 0 0 N M 0 0 q~ ~ ~ 9 r-- r-- - r-- P P f ltXl f l i c r C i C i c C C c ~ ~ ~ ~ ~ ~ ~ ~ ~ ~ ~Ji Ji Ji Ji Ji Ji Ji Ji Ji Ji Ji
Observed flow at the border - - - bull Simulated flow at the border
Measured MAF in Ethiopia 5068 m
Measured MAF in Sudan = WEAP Simulated MAF = 462 8m
455Bm
Jan Feb Mar Apr May June July Aug 5ep Oct Nov Dec
- Observed flow in Ethiopia - - - bull Simulated flow at the border
-- Observed flow in Sudan
F(qWf 145 Simulated and observed flow series and mean monthly flows (1960-1992) for the Blue Nile (current situation) at (a) Khartoum and (b) the Ethiopia-Sudan border
Comparison of the mean monthly flows at Khartoum tor the simulated natural condition current situation and the mediulIl- and long-term scenarios tor the 13 years 1980-1 SlSl2 indishy
cates how the mean annual flow is progressively reduced as a consequence of greater upstream abstractions (Table 147) Wet season flmvs are reduced significantly but dry season flows are increased as a consequence offlow regulation (Figure 147Table 147) Under natural condishytions 84 per cent of the river flow occurs in the wet season months (July-October) In the medium-term and long-term scenarios this is reduced to 61 and 37 per cent respectively
285
The Nile River Basin
17875
17870
17865
17860
17855
I
17850 0 M U r- 00 0 N ~ U r- 01 N ~ 0 00 01 0 0 0 r- r- r- I 00 00 00 co cof r- r- ~ C ~ C ~ C C C
u 5 3 u 5 Q u 5 Q u 5 Q uC1l C1l C1l C1l C1l ~ 0 lt( 0 lt( 0 lt( 0 lt( 0
- WEAP simulated water level bullbullbullbullbull Observed water level
Figure 146 Simulated and observed water levels in Lake Tana (1960-1992)
Tablc 146 Comparison of current Jnd future irrigation demand and hydropower production in the Ethiopian and Sudanese parts of the Blue Nile
Curreri Jfedil1n-lerm Ji4t1ire LOl1g-teml future
Eilliopia Slldal1 Ethiopia Sudal1 Ethiopia SlIdml
Total storage (lllillion 111) ] l57H 3370 70244 10770 167079 10770
Formal irrigatiotl Area (ha) lt]0000 ]305000 210000 2]26000 461000 2190000
Water withdrawJls per year 026 845 238 1339 381 n83 (millio1111l yr)
Hydropower Installed capacity (MW) 218 295 2194 295 6426 295 Production (GWh yr ) 1383 1029 12908 1134 31297 1205
10[( Allowance llladc for sedinlentation of both the Roscrlcs and Sennar reservoirs
At the Ethiopia-Sudan border the current situation is almost identical to the natural condishytion so this is not shown (Figure 147) Mean annual flow is reduced from 452 to 432 and 427 billion nr in the medium-term and long-term future scenarios respectively As in Khartoum there is a significant reduction in wet season flows but there are signifICant increases
in dry season flows as a consequence of flow regulation (Figure 147Table 147) Under natushyral conditions 81 per cent of the river flow occurs in the wet season but this decreases to 59 and 43 per cent in the medium-term and long-te-m scenarios respectively The total decrease in border flow in the long-term scenario is less than might be ex-pected given the increased
286
ltt 00 000 00 00 J or CiJ C Q ra u laquo 0
water level
ver production in the
LOlx-term fu lure
Ethiopia
167079
461000 381
6426 31297
Sudan
10770
2190000 1383
295 1205
Simulating current al1d future water resources developmel1t il1 the Blue Nile River Basin
a 18000 Simulated natural MAF 482 Bm 3
Simulated current MAF =40A Bm 316000 Simulated medium -term future MAF =33ABm 3f 14000 Simulated long-term future MAF =319Bm 3
~ 12000
~ 10000 gt -pound 8000 c 0 E 6000 c
~ (1l 4000
2000
0
Jan Feb Mar Apr May June July Aug Sep Oct Nov Dec
-Natural flow -Current flow - - -Medium-term future _ Long-term future
18000 Simulated natural MAF = 452 Bm3
16000
b
Simulated current MAF = 452 Bm)
f 14000 Simulated medium middotterm future MAF = 432 Bm 3
Simulated longmiddotterm future MAF =427 Bm~ 12000 3 g 10000 gt pound 8000 c 0
6000E c
~ (1l 4000
2000
0
Jan Feb Mar Apr May June July Aug Sep Oct Nov Dec
- Natural flow - - bull Medium-term future _ Long-term future
Fixure 147 Comparison of simulated mean monthly flow derived for natural current mecHum-term and long-term future scenarios at (a) Khartoum and (b) the Ethiopiamiddot-Sudan border
irrigation demand in Ethiopia The reason is partly that less water is diverted fi-om the Tana to the Beles catchmem ano more flow is routed down the main stem of Blue Nile
rurrently shortfalls (ie failure in any given month to supply the full amount of water needed for irrigation withdrawals or hydropower needs) in Ethiopia are negligible However in the medium-term scenario shortfalls increase to 08 and 50 billion m l yr for irrigation and hydropower respectively In the long term the increased storage means that shortfalls will avershyage 04 billion m for irrigation and 07 billion m l yr- for hydropower In comparison under current conditions there is an average shortfall of 08 billion m in water for the Sudanese irrigation schemes However because of the improved flow regulation there are no shortfalls in irrigation or hydropower in Sudan in either the medium- or the long-term scenarshyios These results reflect the fact that in each scenario the Sudanese schemes were given the same priority as those in Ethiopia Hence although in the medium term and long term more water is stored in Ethiopia in these scenarios no preference was given to the schemes in Ethiopia
I to the natural condishyrom 452 to 432 and )S respectively As in
re significant increases le 147) Under natushyIt this decreases to 59
dy The total decrease f given the increased
287
The Nile River Basin
lablr 147 Simulated mean monthly flow (million m) at the Ethiopia-Sudan border and Khartoum for natural current medium- and long-term tiJture scenarios (1980-1992)
Atom Naruml Currcrlt Aledium-term filturr Long-term future Border Khartollm Border Khartoum Border Khartoutll Border Khartoum
--~---~-~--------~---------
January 835 835 955 B55 1565 3220 2710 4405 February 470 470 380 740 1180 2220 2110 3175 March 350 350 400 475 845 1615 19BO 2770 April 310 310 520 620 710 1315 1635 2250 May 390 390 645 710 680 1235 14B5 2055
June 980 990 1230 640 1390 2273 2203 3125
July 5930 6235 6105 5365 3870 2560 4820 3420 August 15770 16830 15430 15950 8400 8615 4H20 4245 September 10590 116HO 10130 10165 H020 7490 4665 3760 October 53()O SH25 4970 3865 5315 1740 4105 420 November 2750 2795 2() 15 3JO 8870 2ltgt0 9095 250 December 1510 1510 1575 740 2305 H50 3055 1990 10ta1 45245 48220 45155 40435 43150 33395 426H5 3LB65
Net evaporation (ie the difference between evaporation trom a reservoir and the rainfall directly onto its surface) from the Ethiopian reservoirs currently averages 08 billion m yr- However by f3r the bulk of this is from Lake Tana which is a natural geographic feature and would be evaporating even without regulation By comparison net evaporation from the Sudanese reservoirs is 04 billion 111 yr- In the medium term this increases to 12 billion 111
yr in Ethiopia (03 billion m yr excluding Lake Tam) and to 14 billion m yr in Sudan The increase in Sudan is due to the increased area of the Roseries reservoir arising from raisshying the Roseries Dam and the fact that water levels in both Roseries and Sennar reservoirs are maintained at higher levels because of the higher dry season inflows In the long term total net reservoir evaporation increases to 17 billion m yr in Ethiopia (08 billion 111 yr bull excluding Lake Tam) and remains at 14 billion m l yr- in Sudan However evaporation losses per cubic metre of water stored are considerably lower in Ethiopia than in Sudan in all the scenarios In
fact as a result of the locations of the planned reservoirs as storage increases in Ethiopia losses per cubic metre of water stored decrease significantly over time (Table 14H)
labe 148 Simulated average annual net evaporation trom reservoirs in Ethiopia and Sudan for each of the scenarios
Sccnario Ethiopir SHdml
Tiltal lillal EJaptJratiou Iblal Iotal Elapomrioll storage evaporation from stOlalZe st()ra~e (U(1poration fn)Jn _f)ra~~l
(millioll ml (millivlI II) Imm) (millioll m) (millioll tn) (m i 111-)
Current 1157il H46 007 3370 443 013 Medium term 70244 l1SB (l02 10770 1363 013 Long term 167079 1732 Cl01 10770 13H7 013
N(lres Including from Lake 1ma which is a natural lake though regulated by the Char Chara weir
288
der and Khartoum for )
Long-term future Border Khartoum
2710 4405 2110 3175 1980 2770 1635 2250 1485 2055 2205 3125 4820 3420 4820 4245 4665 3760 4105 420 9095 250 3055 1990 42685 31865
~voir and the rainfall s 08 billion m 1 yc agraphic feature and vaporation from the Ises to 12 billion m on m yr I in Sudan oir arising from raisshySennaI reservoirs are long term total net on 111 yr excluding tion losses per cubic I all the scenarios In es in Ethiopia losses 8)
Ind Sudan fix each of
Euaporati()11 )ratiol1 I1om _forage
Oil m (111 I1l )
013 013 013
nra we-ir
Simulating current and future water resources development in the Blue Nile River Basin
Discussion
The results presented in this chapter are based on many assumptiolls Lack of data on flow and water demand and use particularly in Sudall makes it very difficult to validate the model for the current situation However where it has been possible to verifY them the model results appear to be reasonably accurate For example in the current scenario simulated flows closely match the observed flows at key locations on the main stem of the river and the simulated water levels in Lake Tana were reasonably accurate (Figures 145 and 146) Consequently though the results should be treated with caution they arc believed to be broadly indicative of the likely impacts arising trom the development currently being considered in both Ethiopia and Sudan By illustrating what may occur the scenarios provide information that is useful for resource pbnning and the results provide a basis for discussion
Climate and hence hydrological variability possibly increased by future climate change will remain key tilCtorS in the economic development of both Ethiopia and Sudan in the future As in the past future water resources development in the Blue Nile will be driven predominantly by the need felf water for agriculture and hydropower and hence the need for large volumes of stored water Irrigation will remain by filf the largest user of water and the future scenarios indicate significantly increased water withdrawals as a conseqnence of increasing irrigation predominantly in Sudan and also increasingly in Ethiopia The construction of the dams particularly the very large hydropower dams proposed by Ethiopia though not consuming large amounts of water vill sihrnificantly alter the flow regime of the river resulting in lower wet season flows and much greater dry season flows The results of this are likely to be benetlmiddotshycial for SudanThe frequency of flooding which occurs ewry few years in the flat areas of the country and is particularly devastating in and around Khartoum may be reduced Higher dry season flows mean greater availability of water at a time when it is naturally scarce and hence increased opportunities for withdrawals f()r irrigation and other uses Thus increased water storshyage in Ethiopia has the potential to provide benefits for Sudan too
As a result of higher rainfall and lower evaporative demand net evaporation loss per cubic metre of water stored in the Ethiopian reservoirs (including Lake Tana which is a natural lake) is currently approximately 50 per cent of that in Sudan As more water is stored in Ethiopia this ratio decreases so that in the long term it could be as low as 8 per cent of that in Sudan (Table 148) This confirms that one of the most signifICant benefits of storing water in the Ethiopian Highlands rather than in the lower more arid regions ofSudan (or indeed in Egypt) is significantly reduced evaporation losses
For all scenarios the model was run as a single system making no allowance tor the fact that Ethiopia and Sudan are separate countries Water demands in Sudan were given the same priorshyity as those in Ethiopia and water was released from reservoirs in Ethiopia to meet downstream demands in Sudan This assumes a much higher level of cooperation between the two states in relation to both the planning and managel1lent of water resources than at present
Future research is needed to refme the model Key to improving the simulatiom are
improved estimates of irrigation water demand improved estimates of the dates on which schemes will become operational more realistic dam operating rules detailed economic livelihood and environmental assessments of the cumulative impacts of all the proposed schemes and evaluation of the possible hydrological implications of climate change
289
The Nile River Basin
An important issue not considered in the current model simulations is the transient stages of reservoir tilling Given the large cumulative volume of the planned reservoirs in Ethiopia it is essential that reservoir filling is planned and managed in such a way that adverse downstream impacts including potentially negative environmental and social impacts are minimized The need to give due consideration to dam operation that provides for environmental (lows to avoid degradation of riverine ecosystems has recently been emphasized (Reitburger and McCartney 2(11)
Conclusion
The WEAP model has been configured to simulate the impacts of water resources developshyment in the I3NI3 Currently Ethiopia utilizes very little water for irrigation but does reb1llate some tlow for hydropower production In contrast Sudan uses some water for hydropower production and also abstracts large volumes for irrigation Both countries plan to develop water resources substantially in the near future The extent to which actual water resources developshyment will match the plans of both countries in the long term is unclear and will depend a lot on unpredictable social and economic factors However in both Ethiopia and Sudan hydropower and irrigation are widely perceived as critical to national development and in both countries current investment in water infrastructure is substantial and increasing Consequently pressures on water resources are rising and will increase substantially in the near future
The results of this study have confirmed that if the states cooperate effectively mutually beneficial scenarios are possible upstream regulation in Ethiopia reduces evaporation losses probably reduces the frequency of flooding and provides opportunities for greatly increased water development in Sudan However maximizing benefits and minimizing potential adverse impacts (eg to the environment) especially when the large reservoirs are being filled require much greater cooperation than currently exim between the riparian states The key to success is the establishment of pragmatic institutional arrangements that enable the water resources of the basin to be planned and managed as a single entity (ie without consideration of national borders) in the most effective and equitable manner possible It is to be hoped that such arrangements will be devised through the protracted negotiations currently under way
References
Awulachew S B McCartney M P Steenhuis T SAhmedAA (200H) A Review oHydrology Sedimcnt and vVater Resource Use ill the Blue Nile Basil International Water Management Institute Colombo Sri Lanka
[lCEOM (1998) Abbay RiFcr Basin Jltlc~ralcd Development A1astcr Plan Section II v[lilme v 11latcr Resources De1Jeopcnl Parr 1 1rr(~ion awl Draillfljlc Ministry ofWater Resources Addis Abtba Ethiopia
Beyelle T md Abebe Jv1 (2006) Potential and development plan in Ethiopia Hydropower and Datlls 13 61-64
Block P Strzepek K and Rajagopalan B (2007) blfegrated Jv1anagement of till Blue Nile Basin ill Ethiopia Hydropower and Irr(llaquo(lrion rvtdeli~ IFPRI Discussion Paper 00700 International Food Policy Research Institute Wasbington DC p22
Cascao1 E (2009) Changing power relations in the Nile River Basin Cnilateralism vs cooperation Water Alternalives 2 2 245-268
Ebla G (2008) Study ofMainstem Dams on the Blue Nile MSc thesis Arba Minch University Ethiopia pp94 ENTRO (Eastern Nile Technical Regional Office) (2007) Preeasibility study of Border Hydrnpucr PJfct
Ethiopia ENTROAddis Ababa Ethiopia FAO (Food and Agriculture Organization of the Cnited Nations) (2002) Aruwuncing LJCCim the FAa Local
Climate Estimator CDROll] wwwfaoorgsd2002EN1203a_enhtm accessed June 2009 GeorgakakosA P (200)) Nile Decision Support Tool (Nile DST) Executive Summary Report submitted to
FAO and the Nile riparian states Rome Italy June
290
Ie transient stages of Dirs in Ethiopia it is adverse downstream are minimized The iron mental flows to ed (Reitburger and
r resources developshym but does regulate Iter for hydropower Ian to develop water r resources developshyI1d will depend a lot hiopia and Sudan opment and in both asing Consequently e near future effectively mutually evaporation losses or greatly increased ng potential adverse being filled require The key to success e water resources of deration of national )e hoped that such y under way
Hydrolog Sedimcrll and ~ Colombo Sri Lanka fume ~ Hlaler Resources lba Ethiopia
and Dams 13
Nile Basin ill Ethiopia Food Policy Research
vs cooperation Hlatcr
iversiry Ethiopia pp94 dey Hydropower Project
Simulating current and future water resources development in the Blue Nile River Basin
Guariso C and Whittington n (19H7) Implications of Ethiopian water development for Egypt and Sudan bltcrnaliltllllllJolJrnal Hater Resources Dncpmml 3 2 105-114
IbrahimY A Ahmed A A and Ramdan M S (2009) Improving water management practices in the Rahad Scheme (Sudan) in Improved Hlaler md Lmd lvanuJlClllcnt ill Ihe Ethiopian H(~hlallds lis lmpaa 01
DowlIStrealgtl Stakrlwlders Dependent )11 tile Blllt Nile Intermediate Results Dissemination Vorkshop held at the International Livestock Research Institute (ILRI) 5-6 February S 13 Awulachew T Erkossa V Smakhtin and EAshra (eds)Addis Ababa Ethiopia
Jigerskog A GranitJ Risberg A and Yn V (2007) Tramboundary water management as a regional public good in fillaflcil1g Exampllfrom rhe Nile Basin Report no 20 SIWI Stockholm Sweden
JICA (lapan International Cooperation Agency) (1997) Feasibility Reporr uti Power Declopmellt at Lake lim Rf~IOIIJapan Internatiol Cooperariol1 Agency Tokyo Japan
Lahmeyer Consulting Engineers (1962) GilJlfl Abay Scheme Imperial Ethiopian Government Ministry of Public Works Addis Ahaba Ethiopia
McCartney M I~ Alcmayehu T Shiferaw A and Awulachew S ]3 (2010) Evaluation of current and future water resources development in the Lake Tana Basin Ethiopia IWMI Research Report 134 International Water Management Institute Colombo Sri Lanka
MetawieA E (2()04) History of co-operation in the Nile Basin Hlater Resources Dedopmer 20 147-63 MonteithJ L (1981) Evaporation and surface temperature QII1rIcry Joumal of lile Royal A1etrorologiral SariOy
107 1~~27
Norconsult (2006) Karadobi Hultipurpo5c Projea Preea5ibility Sludy Report to the Ministry of Water ResoUTces The Federal Republic of Ethiopia Addis Ababa Ethiopia
Omer A M (2009) Hydropouer polcurial atld Priority for Dams Developmel1t ill Slitiall wwwscitopicscomHydropower_potentiaLand_priority_for_da1l1s_developmellcill_Suda11html accessed November 2010
Omer A M (2010) S14dmese dec[opmelll 20 September wwwwaterpowermagazinecom storyaspc=2U57614 accessed 29lpril 2012
Reitburger B and McCartney M E (2011) Concepts of environmental flow assessment and challenges in the Blue Iile I3asin Ethiopia i11 Nile Rifler B115it Hydroloxy Clinate alld Water Use A M Melesse (cd) ppJ37-35H Springer Heidelberg Germany
SEI (Stockholm Environlllem Instiwte) (2007) WEAl Hlatcr Evaluarion Alld Planning System U5er Cuide Stockholm Environment Institute I3oston MA
SutcliffeJV and ParksY P (1999) The Hydrology fthe Nilr IAHSWallingford UK USBR (United States Bureau ofReclalllation) (1964) Lard and Water Re50urce f lire Bille iVile B05iH Ethiopia
United States Bureau of Reclamation Main report United States Bureau of Reclal11ation Washington DC
VAlCOS (1990) Preimirwry Water Resources neueiopmen [asleY PlanIor Ethipi( Final Rc-port prepared f)r EVDSA Addis Ababa Ethiopia
Whittington D Wu X and Sadoff C (20()5) Water resources management in the Nile Basin the economic value of cooperation ~HlIcr Poicy 7227-252
Yates lJ Sieber] Purkey nand Huber-LeeA (2005) VEAP 21 a demand priority and preference driven water planning model part 1 model characteristics WlIf1 ililertlatiorral 30 4H7~500
YilJ1la D A and Awulachew S 13 (2009) Characterization and atlas of the I3lne Nile I3asin and its sub basins in IprolJCd ~1rcr drld LlIId lvlaI~rmrl1l ill tile Erhiopian H~hlaruls lIs Inpltlct Oil Downstream Stakeholder5 Dependent 011 rhe Blur Nile Intermediate Results Dissemination Workshop held at the International Livestock Research Institute (ILRI) 5-6 Febrmry S B Awulachew T ErkmsaV Smakhtin and F Ashra (cds) Addis Ababa Ethiopia
UJClim the pound40 Local ne 2009 Report submitted to
291
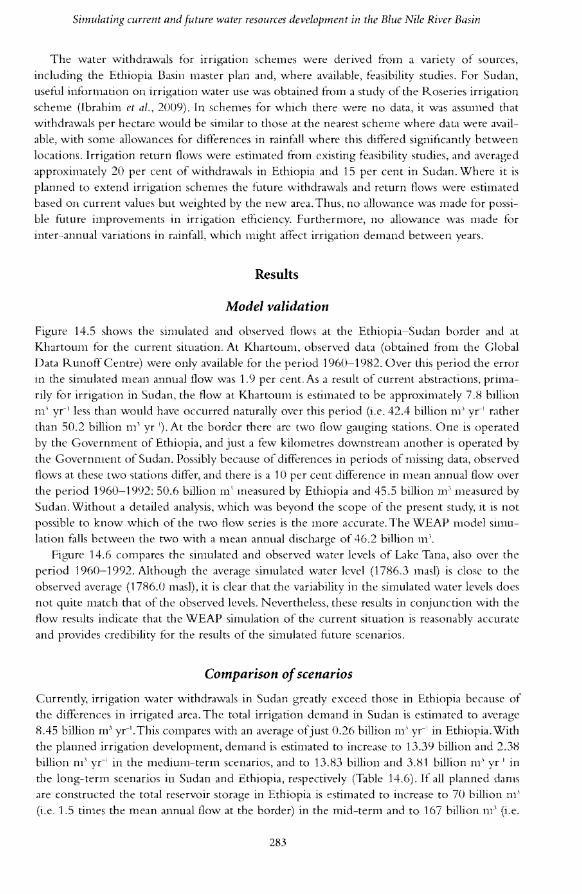

The Nile River Basin
36 times the mean annual flow at the border) in the long term Hydropower generated in Ethiopia from the Tis Abay and Finchaa power stations is currently estimated to be 1383 GWh yr With the construction of the Tana Ueles transfer the Karadobi dam and other smaller schemes this is estimated to increase to 12908 GWh yr in the medium term With Uorder Mendaya and Mabil hydropower stations as well as with additional smaller schemes electricity production in the long terll1 could increase to 31297 GWh yr
Hydropower generated on the U1ue Nile in Sudan is currently estimated to be just over 1000 GWh ye but there arc no publicly available data to confirm this estimate Because of the additional head and increased storage the raising of the Roseries dam will result in a very small increase to 1134 GWh yr I in the medium term and to 1205 GWh yr I in the long term The increase in the long term is due entirely to greater dry season resulting from increased regulation upstream in Ethiopb
40000a bull bullI35000
bull30000 bull 25000 bullbull
bull l
f bull I I I
~ 20000 ~ o I f u 15000 I~10000
II bull III bull I III III rl ~ 5000 II II I I
bull bull t II Ie IIbull middotI bull o
0 0 0 M VI 0) N VI 00 0 co ltXl q~ i9 C C C C c c C c c C C S C C t S ~ ~ ~ ~ ~ ~ ~ ~ ~ ~ ~
- Observed Flow at Khartoum bullbullbullbullSimUlated Flow at Khartoum
18000
16000
14000 ~E
eshy 12000
g ~ 10000 gtshyc 8000C 0 E 6000 c ltlgt 40002
2000
0
Jan Feb Mar Apr May June July Aug Sep Oct Nov Dec
- Observed flow at Khartoum bullbullbullbull Simulated flow at Khartoum
b
cu cat
ah lIH
tio lIlt
284
ropower generated in ated to be 1383 GWh
am and other smaller m term With Border
b
Simulating current and jutllre water resources development in the Blue Nile River Basin
40000
middot 35000 t I
30000 t I
er schemes electricity
11ated to be just over timate Because of the J result in a very small in the long term The u1ting from increased
- 0
C 9 q 0 i~ ~i Ji
lUm
-
~ -ltshy
~ ~ - _ Nov Dec
n
_ 25000 E 620000 0 u 15000
10000
5000
0
-
18000
16000
~ 14000 ~E
5 12000
g 10000 raquo
J 8000C 0 E 6000 c (J) 4000i
2000
o
bullbull
0 - 0 0 N M 0 0 q~ ~ ~ 9 r-- r-- - r-- P P f ltXl f l i c r C i C i c C C c ~ ~ ~ ~ ~ ~ ~ ~ ~ ~ ~Ji Ji Ji Ji Ji Ji Ji Ji Ji Ji Ji
Observed flow at the border - - - bull Simulated flow at the border
Measured MAF in Ethiopia 5068 m
Measured MAF in Sudan = WEAP Simulated MAF = 462 8m
455Bm
Jan Feb Mar Apr May June July Aug 5ep Oct Nov Dec
- Observed flow in Ethiopia - - - bull Simulated flow at the border
-- Observed flow in Sudan
F(qWf 145 Simulated and observed flow series and mean monthly flows (1960-1992) for the Blue Nile (current situation) at (a) Khartoum and (b) the Ethiopia-Sudan border
Comparison of the mean monthly flows at Khartoum tor the simulated natural condition current situation and the mediulIl- and long-term scenarios tor the 13 years 1980-1 SlSl2 indishy
cates how the mean annual flow is progressively reduced as a consequence of greater upstream abstractions (Table 147) Wet season flmvs are reduced significantly but dry season flows are increased as a consequence offlow regulation (Figure 147Table 147) Under natural condishytions 84 per cent of the river flow occurs in the wet season months (July-October) In the medium-term and long-term scenarios this is reduced to 61 and 37 per cent respectively
285
The Nile River Basin
17875
17870
17865
17860
17855
I
17850 0 M U r- 00 0 N ~ U r- 01 N ~ 0 00 01 0 0 0 r- r- r- I 00 00 00 co cof r- r- ~ C ~ C ~ C C C
u 5 3 u 5 Q u 5 Q u 5 Q uC1l C1l C1l C1l C1l ~ 0 lt( 0 lt( 0 lt( 0 lt( 0
- WEAP simulated water level bullbullbullbullbull Observed water level
Figure 146 Simulated and observed water levels in Lake Tana (1960-1992)
Tablc 146 Comparison of current Jnd future irrigation demand and hydropower production in the Ethiopian and Sudanese parts of the Blue Nile
Curreri Jfedil1n-lerm Ji4t1ire LOl1g-teml future
Eilliopia Slldal1 Ethiopia Sudal1 Ethiopia SlIdml
Total storage (lllillion 111) ] l57H 3370 70244 10770 167079 10770
Formal irrigatiotl Area (ha) lt]0000 ]305000 210000 2]26000 461000 2190000
Water withdrawJls per year 026 845 238 1339 381 n83 (millio1111l yr)
Hydropower Installed capacity (MW) 218 295 2194 295 6426 295 Production (GWh yr ) 1383 1029 12908 1134 31297 1205
10[( Allowance llladc for sedinlentation of both the Roscrlcs and Sennar reservoirs
At the Ethiopia-Sudan border the current situation is almost identical to the natural condishytion so this is not shown (Figure 147) Mean annual flow is reduced from 452 to 432 and 427 billion nr in the medium-term and long-term future scenarios respectively As in Khartoum there is a significant reduction in wet season flows but there are signifICant increases
in dry season flows as a consequence of flow regulation (Figure 147Table 147) Under natushyral conditions 81 per cent of the river flow occurs in the wet season but this decreases to 59 and 43 per cent in the medium-term and long-te-m scenarios respectively The total decrease in border flow in the long-term scenario is less than might be ex-pected given the increased
286
ltt 00 000 00 00 J or CiJ C Q ra u laquo 0
water level
ver production in the
LOlx-term fu lure
Ethiopia
167079
461000 381
6426 31297
Sudan
10770
2190000 1383
295 1205
Simulating current al1d future water resources developmel1t il1 the Blue Nile River Basin
a 18000 Simulated natural MAF 482 Bm 3
Simulated current MAF =40A Bm 316000 Simulated medium -term future MAF =33ABm 3f 14000 Simulated long-term future MAF =319Bm 3
~ 12000
~ 10000 gt -pound 8000 c 0 E 6000 c
~ (1l 4000
2000
0
Jan Feb Mar Apr May June July Aug Sep Oct Nov Dec
-Natural flow -Current flow - - -Medium-term future _ Long-term future
18000 Simulated natural MAF = 452 Bm3
16000
b
Simulated current MAF = 452 Bm)
f 14000 Simulated medium middotterm future MAF = 432 Bm 3
Simulated longmiddotterm future MAF =427 Bm~ 12000 3 g 10000 gt pound 8000 c 0
6000E c
~ (1l 4000
2000
0
Jan Feb Mar Apr May June July Aug Sep Oct Nov Dec
- Natural flow - - bull Medium-term future _ Long-term future
Fixure 147 Comparison of simulated mean monthly flow derived for natural current mecHum-term and long-term future scenarios at (a) Khartoum and (b) the Ethiopiamiddot-Sudan border
irrigation demand in Ethiopia The reason is partly that less water is diverted fi-om the Tana to the Beles catchmem ano more flow is routed down the main stem of Blue Nile
rurrently shortfalls (ie failure in any given month to supply the full amount of water needed for irrigation withdrawals or hydropower needs) in Ethiopia are negligible However in the medium-term scenario shortfalls increase to 08 and 50 billion m l yr for irrigation and hydropower respectively In the long term the increased storage means that shortfalls will avershyage 04 billion m for irrigation and 07 billion m l yr- for hydropower In comparison under current conditions there is an average shortfall of 08 billion m in water for the Sudanese irrigation schemes However because of the improved flow regulation there are no shortfalls in irrigation or hydropower in Sudan in either the medium- or the long-term scenarshyios These results reflect the fact that in each scenario the Sudanese schemes were given the same priority as those in Ethiopia Hence although in the medium term and long term more water is stored in Ethiopia in these scenarios no preference was given to the schemes in Ethiopia
I to the natural condishyrom 452 to 432 and )S respectively As in
re significant increases le 147) Under natushyIt this decreases to 59
dy The total decrease f given the increased
287
The Nile River Basin
lablr 147 Simulated mean monthly flow (million m) at the Ethiopia-Sudan border and Khartoum for natural current medium- and long-term tiJture scenarios (1980-1992)
Atom Naruml Currcrlt Aledium-term filturr Long-term future Border Khartollm Border Khartoum Border Khartoutll Border Khartoum
--~---~-~--------~---------
January 835 835 955 B55 1565 3220 2710 4405 February 470 470 380 740 1180 2220 2110 3175 March 350 350 400 475 845 1615 19BO 2770 April 310 310 520 620 710 1315 1635 2250 May 390 390 645 710 680 1235 14B5 2055
June 980 990 1230 640 1390 2273 2203 3125
July 5930 6235 6105 5365 3870 2560 4820 3420 August 15770 16830 15430 15950 8400 8615 4H20 4245 September 10590 116HO 10130 10165 H020 7490 4665 3760 October 53()O SH25 4970 3865 5315 1740 4105 420 November 2750 2795 2() 15 3JO 8870 2ltgt0 9095 250 December 1510 1510 1575 740 2305 H50 3055 1990 10ta1 45245 48220 45155 40435 43150 33395 426H5 3LB65
Net evaporation (ie the difference between evaporation trom a reservoir and the rainfall directly onto its surface) from the Ethiopian reservoirs currently averages 08 billion m yr- However by f3r the bulk of this is from Lake Tana which is a natural geographic feature and would be evaporating even without regulation By comparison net evaporation from the Sudanese reservoirs is 04 billion 111 yr- In the medium term this increases to 12 billion 111
yr in Ethiopia (03 billion m yr excluding Lake Tam) and to 14 billion m yr in Sudan The increase in Sudan is due to the increased area of the Roseries reservoir arising from raisshying the Roseries Dam and the fact that water levels in both Roseries and Sennar reservoirs are maintained at higher levels because of the higher dry season inflows In the long term total net reservoir evaporation increases to 17 billion m yr in Ethiopia (08 billion 111 yr bull excluding Lake Tam) and remains at 14 billion m l yr- in Sudan However evaporation losses per cubic metre of water stored are considerably lower in Ethiopia than in Sudan in all the scenarios In
fact as a result of the locations of the planned reservoirs as storage increases in Ethiopia losses per cubic metre of water stored decrease significantly over time (Table 14H)
labe 148 Simulated average annual net evaporation trom reservoirs in Ethiopia and Sudan for each of the scenarios
Sccnario Ethiopir SHdml
Tiltal lillal EJaptJratiou Iblal Iotal Elapomrioll storage evaporation from stOlalZe st()ra~e (U(1poration fn)Jn _f)ra~~l
(millioll ml (millivlI II) Imm) (millioll m) (millioll tn) (m i 111-)
Current 1157il H46 007 3370 443 013 Medium term 70244 l1SB (l02 10770 1363 013 Long term 167079 1732 Cl01 10770 13H7 013
N(lres Including from Lake 1ma which is a natural lake though regulated by the Char Chara weir
288
der and Khartoum for )
Long-term future Border Khartoum
2710 4405 2110 3175 1980 2770 1635 2250 1485 2055 2205 3125 4820 3420 4820 4245 4665 3760 4105 420 9095 250 3055 1990 42685 31865
~voir and the rainfall s 08 billion m 1 yc agraphic feature and vaporation from the Ises to 12 billion m on m yr I in Sudan oir arising from raisshySennaI reservoirs are long term total net on 111 yr excluding tion losses per cubic I all the scenarios In es in Ethiopia losses 8)
Ind Sudan fix each of
Euaporati()11 )ratiol1 I1om _forage
Oil m (111 I1l )
013 013 013
nra we-ir
Simulating current and future water resources development in the Blue Nile River Basin
Discussion
The results presented in this chapter are based on many assumptiolls Lack of data on flow and water demand and use particularly in Sudall makes it very difficult to validate the model for the current situation However where it has been possible to verifY them the model results appear to be reasonably accurate For example in the current scenario simulated flows closely match the observed flows at key locations on the main stem of the river and the simulated water levels in Lake Tana were reasonably accurate (Figures 145 and 146) Consequently though the results should be treated with caution they arc believed to be broadly indicative of the likely impacts arising trom the development currently being considered in both Ethiopia and Sudan By illustrating what may occur the scenarios provide information that is useful for resource pbnning and the results provide a basis for discussion
Climate and hence hydrological variability possibly increased by future climate change will remain key tilCtorS in the economic development of both Ethiopia and Sudan in the future As in the past future water resources development in the Blue Nile will be driven predominantly by the need felf water for agriculture and hydropower and hence the need for large volumes of stored water Irrigation will remain by filf the largest user of water and the future scenarios indicate significantly increased water withdrawals as a conseqnence of increasing irrigation predominantly in Sudan and also increasingly in Ethiopia The construction of the dams particularly the very large hydropower dams proposed by Ethiopia though not consuming large amounts of water vill sihrnificantly alter the flow regime of the river resulting in lower wet season flows and much greater dry season flows The results of this are likely to be benetlmiddotshycial for SudanThe frequency of flooding which occurs ewry few years in the flat areas of the country and is particularly devastating in and around Khartoum may be reduced Higher dry season flows mean greater availability of water at a time when it is naturally scarce and hence increased opportunities for withdrawals f()r irrigation and other uses Thus increased water storshyage in Ethiopia has the potential to provide benefits for Sudan too
As a result of higher rainfall and lower evaporative demand net evaporation loss per cubic metre of water stored in the Ethiopian reservoirs (including Lake Tana which is a natural lake) is currently approximately 50 per cent of that in Sudan As more water is stored in Ethiopia this ratio decreases so that in the long term it could be as low as 8 per cent of that in Sudan (Table 148) This confirms that one of the most signifICant benefits of storing water in the Ethiopian Highlands rather than in the lower more arid regions ofSudan (or indeed in Egypt) is significantly reduced evaporation losses
For all scenarios the model was run as a single system making no allowance tor the fact that Ethiopia and Sudan are separate countries Water demands in Sudan were given the same priorshyity as those in Ethiopia and water was released from reservoirs in Ethiopia to meet downstream demands in Sudan This assumes a much higher level of cooperation between the two states in relation to both the planning and managel1lent of water resources than at present
Future research is needed to refme the model Key to improving the simulatiom are
improved estimates of irrigation water demand improved estimates of the dates on which schemes will become operational more realistic dam operating rules detailed economic livelihood and environmental assessments of the cumulative impacts of all the proposed schemes and evaluation of the possible hydrological implications of climate change
289
The Nile River Basin
An important issue not considered in the current model simulations is the transient stages of reservoir tilling Given the large cumulative volume of the planned reservoirs in Ethiopia it is essential that reservoir filling is planned and managed in such a way that adverse downstream impacts including potentially negative environmental and social impacts are minimized The need to give due consideration to dam operation that provides for environmental (lows to avoid degradation of riverine ecosystems has recently been emphasized (Reitburger and McCartney 2(11)
Conclusion
The WEAP model has been configured to simulate the impacts of water resources developshyment in the I3NI3 Currently Ethiopia utilizes very little water for irrigation but does reb1llate some tlow for hydropower production In contrast Sudan uses some water for hydropower production and also abstracts large volumes for irrigation Both countries plan to develop water resources substantially in the near future The extent to which actual water resources developshyment will match the plans of both countries in the long term is unclear and will depend a lot on unpredictable social and economic factors However in both Ethiopia and Sudan hydropower and irrigation are widely perceived as critical to national development and in both countries current investment in water infrastructure is substantial and increasing Consequently pressures on water resources are rising and will increase substantially in the near future
The results of this study have confirmed that if the states cooperate effectively mutually beneficial scenarios are possible upstream regulation in Ethiopia reduces evaporation losses probably reduces the frequency of flooding and provides opportunities for greatly increased water development in Sudan However maximizing benefits and minimizing potential adverse impacts (eg to the environment) especially when the large reservoirs are being filled require much greater cooperation than currently exim between the riparian states The key to success is the establishment of pragmatic institutional arrangements that enable the water resources of the basin to be planned and managed as a single entity (ie without consideration of national borders) in the most effective and equitable manner possible It is to be hoped that such arrangements will be devised through the protracted negotiations currently under way
References
Awulachew S B McCartney M P Steenhuis T SAhmedAA (200H) A Review oHydrology Sedimcnt and vVater Resource Use ill the Blue Nile Basil International Water Management Institute Colombo Sri Lanka
[lCEOM (1998) Abbay RiFcr Basin Jltlc~ralcd Development A1astcr Plan Section II v[lilme v 11latcr Resources De1Jeopcnl Parr 1 1rr(~ion awl Draillfljlc Ministry ofWater Resources Addis Abtba Ethiopia
Beyelle T md Abebe Jv1 (2006) Potential and development plan in Ethiopia Hydropower and Datlls 13 61-64
Block P Strzepek K and Rajagopalan B (2007) blfegrated Jv1anagement of till Blue Nile Basin ill Ethiopia Hydropower and Irr(llaquo(lrion rvtdeli~ IFPRI Discussion Paper 00700 International Food Policy Research Institute Wasbington DC p22
Cascao1 E (2009) Changing power relations in the Nile River Basin Cnilateralism vs cooperation Water Alternalives 2 2 245-268
Ebla G (2008) Study ofMainstem Dams on the Blue Nile MSc thesis Arba Minch University Ethiopia pp94 ENTRO (Eastern Nile Technical Regional Office) (2007) Preeasibility study of Border Hydrnpucr PJfct
Ethiopia ENTROAddis Ababa Ethiopia FAO (Food and Agriculture Organization of the Cnited Nations) (2002) Aruwuncing LJCCim the FAa Local
Climate Estimator CDROll] wwwfaoorgsd2002EN1203a_enhtm accessed June 2009 GeorgakakosA P (200)) Nile Decision Support Tool (Nile DST) Executive Summary Report submitted to
FAO and the Nile riparian states Rome Italy June
290
Ie transient stages of Dirs in Ethiopia it is adverse downstream are minimized The iron mental flows to ed (Reitburger and
r resources developshym but does regulate Iter for hydropower Ian to develop water r resources developshyI1d will depend a lot hiopia and Sudan opment and in both asing Consequently e near future effectively mutually evaporation losses or greatly increased ng potential adverse being filled require The key to success e water resources of deration of national )e hoped that such y under way
Hydrolog Sedimcrll and ~ Colombo Sri Lanka fume ~ Hlaler Resources lba Ethiopia
and Dams 13
Nile Basin ill Ethiopia Food Policy Research
vs cooperation Hlatcr
iversiry Ethiopia pp94 dey Hydropower Project
Simulating current and future water resources development in the Blue Nile River Basin
Guariso C and Whittington n (19H7) Implications of Ethiopian water development for Egypt and Sudan bltcrnaliltllllllJolJrnal Hater Resources Dncpmml 3 2 105-114
IbrahimY A Ahmed A A and Ramdan M S (2009) Improving water management practices in the Rahad Scheme (Sudan) in Improved Hlaler md Lmd lvanuJlClllcnt ill Ihe Ethiopian H(~hlallds lis lmpaa 01
DowlIStrealgtl Stakrlwlders Dependent )11 tile Blllt Nile Intermediate Results Dissemination Vorkshop held at the International Livestock Research Institute (ILRI) 5-6 February S 13 Awulachew T Erkossa V Smakhtin and EAshra (eds)Addis Ababa Ethiopia
Jigerskog A GranitJ Risberg A and Yn V (2007) Tramboundary water management as a regional public good in fillaflcil1g Exampllfrom rhe Nile Basin Report no 20 SIWI Stockholm Sweden
JICA (lapan International Cooperation Agency) (1997) Feasibility Reporr uti Power Declopmellt at Lake lim Rf~IOIIJapan Internatiol Cooperariol1 Agency Tokyo Japan
Lahmeyer Consulting Engineers (1962) GilJlfl Abay Scheme Imperial Ethiopian Government Ministry of Public Works Addis Ahaba Ethiopia
McCartney M I~ Alcmayehu T Shiferaw A and Awulachew S ]3 (2010) Evaluation of current and future water resources development in the Lake Tana Basin Ethiopia IWMI Research Report 134 International Water Management Institute Colombo Sri Lanka
MetawieA E (2()04) History of co-operation in the Nile Basin Hlater Resources Dedopmer 20 147-63 MonteithJ L (1981) Evaporation and surface temperature QII1rIcry Joumal of lile Royal A1etrorologiral SariOy
107 1~~27
Norconsult (2006) Karadobi Hultipurpo5c Projea Preea5ibility Sludy Report to the Ministry of Water ResoUTces The Federal Republic of Ethiopia Addis Ababa Ethiopia
Omer A M (2009) Hydropouer polcurial atld Priority for Dams Developmel1t ill Slitiall wwwscitopicscomHydropower_potentiaLand_priority_for_da1l1s_developmellcill_Suda11html accessed November 2010
Omer A M (2010) S14dmese dec[opmelll 20 September wwwwaterpowermagazinecom storyaspc=2U57614 accessed 29lpril 2012
Reitburger B and McCartney M E (2011) Concepts of environmental flow assessment and challenges in the Blue Iile I3asin Ethiopia i11 Nile Rifler B115it Hydroloxy Clinate alld Water Use A M Melesse (cd) ppJ37-35H Springer Heidelberg Germany
SEI (Stockholm Environlllem Instiwte) (2007) WEAl Hlatcr Evaluarion Alld Planning System U5er Cuide Stockholm Environment Institute I3oston MA
SutcliffeJV and ParksY P (1999) The Hydrology fthe Nilr IAHSWallingford UK USBR (United States Bureau ofReclalllation) (1964) Lard and Water Re50urce f lire Bille iVile B05iH Ethiopia
United States Bureau of Reclamation Main report United States Bureau of Reclal11ation Washington DC
VAlCOS (1990) Preimirwry Water Resources neueiopmen [asleY PlanIor Ethipi( Final Rc-port prepared f)r EVDSA Addis Ababa Ethiopia
Whittington D Wu X and Sadoff C (20()5) Water resources management in the Nile Basin the economic value of cooperation ~HlIcr Poicy 7227-252
Yates lJ Sieber] Purkey nand Huber-LeeA (2005) VEAP 21 a demand priority and preference driven water planning model part 1 model characteristics WlIf1 ililertlatiorral 30 4H7~500
YilJ1la D A and Awulachew S 13 (2009) Characterization and atlas of the I3lne Nile I3asin and its sub basins in IprolJCd ~1rcr drld LlIId lvlaI~rmrl1l ill tile Erhiopian H~hlaruls lIs Inpltlct Oil Downstream Stakeholder5 Dependent 011 rhe Blur Nile Intermediate Results Dissemination Workshop held at the International Livestock Research Institute (ILRI) 5-6 Febrmry S B Awulachew T ErkmsaV Smakhtin and F Ashra (cds) Addis Ababa Ethiopia
UJClim the pound40 Local ne 2009 Report submitted to
291

The Nile River Basin
17875
17870
17865
17860
17855
I
17850 0 M U r- 00 0 N ~ U r- 01 N ~ 0 00 01 0 0 0 r- r- r- I 00 00 00 co cof r- r- ~ C ~ C ~ C C C
u 5 3 u 5 Q u 5 Q u 5 Q uC1l C1l C1l C1l C1l ~ 0 lt( 0 lt( 0 lt( 0 lt( 0
- WEAP simulated water level bullbullbullbullbull Observed water level
Figure 146 Simulated and observed water levels in Lake Tana (1960-1992)
Tablc 146 Comparison of current Jnd future irrigation demand and hydropower production in the Ethiopian and Sudanese parts of the Blue Nile
Curreri Jfedil1n-lerm Ji4t1ire LOl1g-teml future
Eilliopia Slldal1 Ethiopia Sudal1 Ethiopia SlIdml
Total storage (lllillion 111) ] l57H 3370 70244 10770 167079 10770
Formal irrigatiotl Area (ha) lt]0000 ]305000 210000 2]26000 461000 2190000
Water withdrawJls per year 026 845 238 1339 381 n83 (millio1111l yr)
Hydropower Installed capacity (MW) 218 295 2194 295 6426 295 Production (GWh yr ) 1383 1029 12908 1134 31297 1205
10[( Allowance llladc for sedinlentation of both the Roscrlcs and Sennar reservoirs
At the Ethiopia-Sudan border the current situation is almost identical to the natural condishytion so this is not shown (Figure 147) Mean annual flow is reduced from 452 to 432 and 427 billion nr in the medium-term and long-term future scenarios respectively As in Khartoum there is a significant reduction in wet season flows but there are signifICant increases
in dry season flows as a consequence of flow regulation (Figure 147Table 147) Under natushyral conditions 81 per cent of the river flow occurs in the wet season but this decreases to 59 and 43 per cent in the medium-term and long-te-m scenarios respectively The total decrease in border flow in the long-term scenario is less than might be ex-pected given the increased
286
ltt 00 000 00 00 J or CiJ C Q ra u laquo 0
water level
ver production in the
LOlx-term fu lure
Ethiopia
167079
461000 381
6426 31297
Sudan
10770
2190000 1383
295 1205
Simulating current al1d future water resources developmel1t il1 the Blue Nile River Basin
a 18000 Simulated natural MAF 482 Bm 3
Simulated current MAF =40A Bm 316000 Simulated medium -term future MAF =33ABm 3f 14000 Simulated long-term future MAF =319Bm 3
~ 12000
~ 10000 gt -pound 8000 c 0 E 6000 c
~ (1l 4000
2000
0
Jan Feb Mar Apr May June July Aug Sep Oct Nov Dec
-Natural flow -Current flow - - -Medium-term future _ Long-term future
18000 Simulated natural MAF = 452 Bm3
16000
b
Simulated current MAF = 452 Bm)
f 14000 Simulated medium middotterm future MAF = 432 Bm 3
Simulated longmiddotterm future MAF =427 Bm~ 12000 3 g 10000 gt pound 8000 c 0
6000E c
~ (1l 4000
2000
0
Jan Feb Mar Apr May June July Aug Sep Oct Nov Dec
- Natural flow - - bull Medium-term future _ Long-term future
Fixure 147 Comparison of simulated mean monthly flow derived for natural current mecHum-term and long-term future scenarios at (a) Khartoum and (b) the Ethiopiamiddot-Sudan border
irrigation demand in Ethiopia The reason is partly that less water is diverted fi-om the Tana to the Beles catchmem ano more flow is routed down the main stem of Blue Nile
rurrently shortfalls (ie failure in any given month to supply the full amount of water needed for irrigation withdrawals or hydropower needs) in Ethiopia are negligible However in the medium-term scenario shortfalls increase to 08 and 50 billion m l yr for irrigation and hydropower respectively In the long term the increased storage means that shortfalls will avershyage 04 billion m for irrigation and 07 billion m l yr- for hydropower In comparison under current conditions there is an average shortfall of 08 billion m in water for the Sudanese irrigation schemes However because of the improved flow regulation there are no shortfalls in irrigation or hydropower in Sudan in either the medium- or the long-term scenarshyios These results reflect the fact that in each scenario the Sudanese schemes were given the same priority as those in Ethiopia Hence although in the medium term and long term more water is stored in Ethiopia in these scenarios no preference was given to the schemes in Ethiopia
I to the natural condishyrom 452 to 432 and )S respectively As in
re significant increases le 147) Under natushyIt this decreases to 59
dy The total decrease f given the increased
287
The Nile River Basin
lablr 147 Simulated mean monthly flow (million m) at the Ethiopia-Sudan border and Khartoum for natural current medium- and long-term tiJture scenarios (1980-1992)
Atom Naruml Currcrlt Aledium-term filturr Long-term future Border Khartollm Border Khartoum Border Khartoutll Border Khartoum
--~---~-~--------~---------
January 835 835 955 B55 1565 3220 2710 4405 February 470 470 380 740 1180 2220 2110 3175 March 350 350 400 475 845 1615 19BO 2770 April 310 310 520 620 710 1315 1635 2250 May 390 390 645 710 680 1235 14B5 2055
June 980 990 1230 640 1390 2273 2203 3125
July 5930 6235 6105 5365 3870 2560 4820 3420 August 15770 16830 15430 15950 8400 8615 4H20 4245 September 10590 116HO 10130 10165 H020 7490 4665 3760 October 53()O SH25 4970 3865 5315 1740 4105 420 November 2750 2795 2() 15 3JO 8870 2ltgt0 9095 250 December 1510 1510 1575 740 2305 H50 3055 1990 10ta1 45245 48220 45155 40435 43150 33395 426H5 3LB65
Net evaporation (ie the difference between evaporation trom a reservoir and the rainfall directly onto its surface) from the Ethiopian reservoirs currently averages 08 billion m yr- However by f3r the bulk of this is from Lake Tana which is a natural geographic feature and would be evaporating even without regulation By comparison net evaporation from the Sudanese reservoirs is 04 billion 111 yr- In the medium term this increases to 12 billion 111
yr in Ethiopia (03 billion m yr excluding Lake Tam) and to 14 billion m yr in Sudan The increase in Sudan is due to the increased area of the Roseries reservoir arising from raisshying the Roseries Dam and the fact that water levels in both Roseries and Sennar reservoirs are maintained at higher levels because of the higher dry season inflows In the long term total net reservoir evaporation increases to 17 billion m yr in Ethiopia (08 billion 111 yr bull excluding Lake Tam) and remains at 14 billion m l yr- in Sudan However evaporation losses per cubic metre of water stored are considerably lower in Ethiopia than in Sudan in all the scenarios In
fact as a result of the locations of the planned reservoirs as storage increases in Ethiopia losses per cubic metre of water stored decrease significantly over time (Table 14H)
labe 148 Simulated average annual net evaporation trom reservoirs in Ethiopia and Sudan for each of the scenarios
Sccnario Ethiopir SHdml
Tiltal lillal EJaptJratiou Iblal Iotal Elapomrioll storage evaporation from stOlalZe st()ra~e (U(1poration fn)Jn _f)ra~~l
(millioll ml (millivlI II) Imm) (millioll m) (millioll tn) (m i 111-)
Current 1157il H46 007 3370 443 013 Medium term 70244 l1SB (l02 10770 1363 013 Long term 167079 1732 Cl01 10770 13H7 013
N(lres Including from Lake 1ma which is a natural lake though regulated by the Char Chara weir
288
der and Khartoum for )
Long-term future Border Khartoum
2710 4405 2110 3175 1980 2770 1635 2250 1485 2055 2205 3125 4820 3420 4820 4245 4665 3760 4105 420 9095 250 3055 1990 42685 31865
~voir and the rainfall s 08 billion m 1 yc agraphic feature and vaporation from the Ises to 12 billion m on m yr I in Sudan oir arising from raisshySennaI reservoirs are long term total net on 111 yr excluding tion losses per cubic I all the scenarios In es in Ethiopia losses 8)
Ind Sudan fix each of
Euaporati()11 )ratiol1 I1om _forage
Oil m (111 I1l )
013 013 013
nra we-ir
Simulating current and future water resources development in the Blue Nile River Basin
Discussion
The results presented in this chapter are based on many assumptiolls Lack of data on flow and water demand and use particularly in Sudall makes it very difficult to validate the model for the current situation However where it has been possible to verifY them the model results appear to be reasonably accurate For example in the current scenario simulated flows closely match the observed flows at key locations on the main stem of the river and the simulated water levels in Lake Tana were reasonably accurate (Figures 145 and 146) Consequently though the results should be treated with caution they arc believed to be broadly indicative of the likely impacts arising trom the development currently being considered in both Ethiopia and Sudan By illustrating what may occur the scenarios provide information that is useful for resource pbnning and the results provide a basis for discussion
Climate and hence hydrological variability possibly increased by future climate change will remain key tilCtorS in the economic development of both Ethiopia and Sudan in the future As in the past future water resources development in the Blue Nile will be driven predominantly by the need felf water for agriculture and hydropower and hence the need for large volumes of stored water Irrigation will remain by filf the largest user of water and the future scenarios indicate significantly increased water withdrawals as a conseqnence of increasing irrigation predominantly in Sudan and also increasingly in Ethiopia The construction of the dams particularly the very large hydropower dams proposed by Ethiopia though not consuming large amounts of water vill sihrnificantly alter the flow regime of the river resulting in lower wet season flows and much greater dry season flows The results of this are likely to be benetlmiddotshycial for SudanThe frequency of flooding which occurs ewry few years in the flat areas of the country and is particularly devastating in and around Khartoum may be reduced Higher dry season flows mean greater availability of water at a time when it is naturally scarce and hence increased opportunities for withdrawals f()r irrigation and other uses Thus increased water storshyage in Ethiopia has the potential to provide benefits for Sudan too
As a result of higher rainfall and lower evaporative demand net evaporation loss per cubic metre of water stored in the Ethiopian reservoirs (including Lake Tana which is a natural lake) is currently approximately 50 per cent of that in Sudan As more water is stored in Ethiopia this ratio decreases so that in the long term it could be as low as 8 per cent of that in Sudan (Table 148) This confirms that one of the most signifICant benefits of storing water in the Ethiopian Highlands rather than in the lower more arid regions ofSudan (or indeed in Egypt) is significantly reduced evaporation losses
For all scenarios the model was run as a single system making no allowance tor the fact that Ethiopia and Sudan are separate countries Water demands in Sudan were given the same priorshyity as those in Ethiopia and water was released from reservoirs in Ethiopia to meet downstream demands in Sudan This assumes a much higher level of cooperation between the two states in relation to both the planning and managel1lent of water resources than at present
Future research is needed to refme the model Key to improving the simulatiom are
improved estimates of irrigation water demand improved estimates of the dates on which schemes will become operational more realistic dam operating rules detailed economic livelihood and environmental assessments of the cumulative impacts of all the proposed schemes and evaluation of the possible hydrological implications of climate change
289
The Nile River Basin
An important issue not considered in the current model simulations is the transient stages of reservoir tilling Given the large cumulative volume of the planned reservoirs in Ethiopia it is essential that reservoir filling is planned and managed in such a way that adverse downstream impacts including potentially negative environmental and social impacts are minimized The need to give due consideration to dam operation that provides for environmental (lows to avoid degradation of riverine ecosystems has recently been emphasized (Reitburger and McCartney 2(11)
Conclusion
The WEAP model has been configured to simulate the impacts of water resources developshyment in the I3NI3 Currently Ethiopia utilizes very little water for irrigation but does reb1llate some tlow for hydropower production In contrast Sudan uses some water for hydropower production and also abstracts large volumes for irrigation Both countries plan to develop water resources substantially in the near future The extent to which actual water resources developshyment will match the plans of both countries in the long term is unclear and will depend a lot on unpredictable social and economic factors However in both Ethiopia and Sudan hydropower and irrigation are widely perceived as critical to national development and in both countries current investment in water infrastructure is substantial and increasing Consequently pressures on water resources are rising and will increase substantially in the near future
The results of this study have confirmed that if the states cooperate effectively mutually beneficial scenarios are possible upstream regulation in Ethiopia reduces evaporation losses probably reduces the frequency of flooding and provides opportunities for greatly increased water development in Sudan However maximizing benefits and minimizing potential adverse impacts (eg to the environment) especially when the large reservoirs are being filled require much greater cooperation than currently exim between the riparian states The key to success is the establishment of pragmatic institutional arrangements that enable the water resources of the basin to be planned and managed as a single entity (ie without consideration of national borders) in the most effective and equitable manner possible It is to be hoped that such arrangements will be devised through the protracted negotiations currently under way
References
Awulachew S B McCartney M P Steenhuis T SAhmedAA (200H) A Review oHydrology Sedimcnt and vVater Resource Use ill the Blue Nile Basil International Water Management Institute Colombo Sri Lanka
[lCEOM (1998) Abbay RiFcr Basin Jltlc~ralcd Development A1astcr Plan Section II v[lilme v 11latcr Resources De1Jeopcnl Parr 1 1rr(~ion awl Draillfljlc Ministry ofWater Resources Addis Abtba Ethiopia
Beyelle T md Abebe Jv1 (2006) Potential and development plan in Ethiopia Hydropower and Datlls 13 61-64
Block P Strzepek K and Rajagopalan B (2007) blfegrated Jv1anagement of till Blue Nile Basin ill Ethiopia Hydropower and Irr(llaquo(lrion rvtdeli~ IFPRI Discussion Paper 00700 International Food Policy Research Institute Wasbington DC p22
Cascao1 E (2009) Changing power relations in the Nile River Basin Cnilateralism vs cooperation Water Alternalives 2 2 245-268
Ebla G (2008) Study ofMainstem Dams on the Blue Nile MSc thesis Arba Minch University Ethiopia pp94 ENTRO (Eastern Nile Technical Regional Office) (2007) Preeasibility study of Border Hydrnpucr PJfct
Ethiopia ENTROAddis Ababa Ethiopia FAO (Food and Agriculture Organization of the Cnited Nations) (2002) Aruwuncing LJCCim the FAa Local
Climate Estimator CDROll] wwwfaoorgsd2002EN1203a_enhtm accessed June 2009 GeorgakakosA P (200)) Nile Decision Support Tool (Nile DST) Executive Summary Report submitted to
FAO and the Nile riparian states Rome Italy June
290
Ie transient stages of Dirs in Ethiopia it is adverse downstream are minimized The iron mental flows to ed (Reitburger and
r resources developshym but does regulate Iter for hydropower Ian to develop water r resources developshyI1d will depend a lot hiopia and Sudan opment and in both asing Consequently e near future effectively mutually evaporation losses or greatly increased ng potential adverse being filled require The key to success e water resources of deration of national )e hoped that such y under way
Hydrolog Sedimcrll and ~ Colombo Sri Lanka fume ~ Hlaler Resources lba Ethiopia
and Dams 13
Nile Basin ill Ethiopia Food Policy Research
vs cooperation Hlatcr
iversiry Ethiopia pp94 dey Hydropower Project
Simulating current and future water resources development in the Blue Nile River Basin
Guariso C and Whittington n (19H7) Implications of Ethiopian water development for Egypt and Sudan bltcrnaliltllllllJolJrnal Hater Resources Dncpmml 3 2 105-114
IbrahimY A Ahmed A A and Ramdan M S (2009) Improving water management practices in the Rahad Scheme (Sudan) in Improved Hlaler md Lmd lvanuJlClllcnt ill Ihe Ethiopian H(~hlallds lis lmpaa 01
DowlIStrealgtl Stakrlwlders Dependent )11 tile Blllt Nile Intermediate Results Dissemination Vorkshop held at the International Livestock Research Institute (ILRI) 5-6 February S 13 Awulachew T Erkossa V Smakhtin and EAshra (eds)Addis Ababa Ethiopia
Jigerskog A GranitJ Risberg A and Yn V (2007) Tramboundary water management as a regional public good in fillaflcil1g Exampllfrom rhe Nile Basin Report no 20 SIWI Stockholm Sweden
JICA (lapan International Cooperation Agency) (1997) Feasibility Reporr uti Power Declopmellt at Lake lim Rf~IOIIJapan Internatiol Cooperariol1 Agency Tokyo Japan
Lahmeyer Consulting Engineers (1962) GilJlfl Abay Scheme Imperial Ethiopian Government Ministry of Public Works Addis Ahaba Ethiopia
McCartney M I~ Alcmayehu T Shiferaw A and Awulachew S ]3 (2010) Evaluation of current and future water resources development in the Lake Tana Basin Ethiopia IWMI Research Report 134 International Water Management Institute Colombo Sri Lanka
MetawieA E (2()04) History of co-operation in the Nile Basin Hlater Resources Dedopmer 20 147-63 MonteithJ L (1981) Evaporation and surface temperature QII1rIcry Joumal of lile Royal A1etrorologiral SariOy
107 1~~27
Norconsult (2006) Karadobi Hultipurpo5c Projea Preea5ibility Sludy Report to the Ministry of Water ResoUTces The Federal Republic of Ethiopia Addis Ababa Ethiopia
Omer A M (2009) Hydropouer polcurial atld Priority for Dams Developmel1t ill Slitiall wwwscitopicscomHydropower_potentiaLand_priority_for_da1l1s_developmellcill_Suda11html accessed November 2010
Omer A M (2010) S14dmese dec[opmelll 20 September wwwwaterpowermagazinecom storyaspc=2U57614 accessed 29lpril 2012
Reitburger B and McCartney M E (2011) Concepts of environmental flow assessment and challenges in the Blue Iile I3asin Ethiopia i11 Nile Rifler B115it Hydroloxy Clinate alld Water Use A M Melesse (cd) ppJ37-35H Springer Heidelberg Germany
SEI (Stockholm Environlllem Instiwte) (2007) WEAl Hlatcr Evaluarion Alld Planning System U5er Cuide Stockholm Environment Institute I3oston MA
SutcliffeJV and ParksY P (1999) The Hydrology fthe Nilr IAHSWallingford UK USBR (United States Bureau ofReclalllation) (1964) Lard and Water Re50urce f lire Bille iVile B05iH Ethiopia
United States Bureau of Reclamation Main report United States Bureau of Reclal11ation Washington DC
VAlCOS (1990) Preimirwry Water Resources neueiopmen [asleY PlanIor Ethipi( Final Rc-port prepared f)r EVDSA Addis Ababa Ethiopia
Whittington D Wu X and Sadoff C (20()5) Water resources management in the Nile Basin the economic value of cooperation ~HlIcr Poicy 7227-252
Yates lJ Sieber] Purkey nand Huber-LeeA (2005) VEAP 21 a demand priority and preference driven water planning model part 1 model characteristics WlIf1 ililertlatiorral 30 4H7~500
YilJ1la D A and Awulachew S 13 (2009) Characterization and atlas of the I3lne Nile I3asin and its sub basins in IprolJCd ~1rcr drld LlIId lvlaI~rmrl1l ill tile Erhiopian H~hlaruls lIs Inpltlct Oil Downstream Stakeholder5 Dependent 011 rhe Blur Nile Intermediate Results Dissemination Workshop held at the International Livestock Research Institute (ILRI) 5-6 Febrmry S B Awulachew T ErkmsaV Smakhtin and F Ashra (cds) Addis Ababa Ethiopia
UJClim the pound40 Local ne 2009 Report submitted to
291
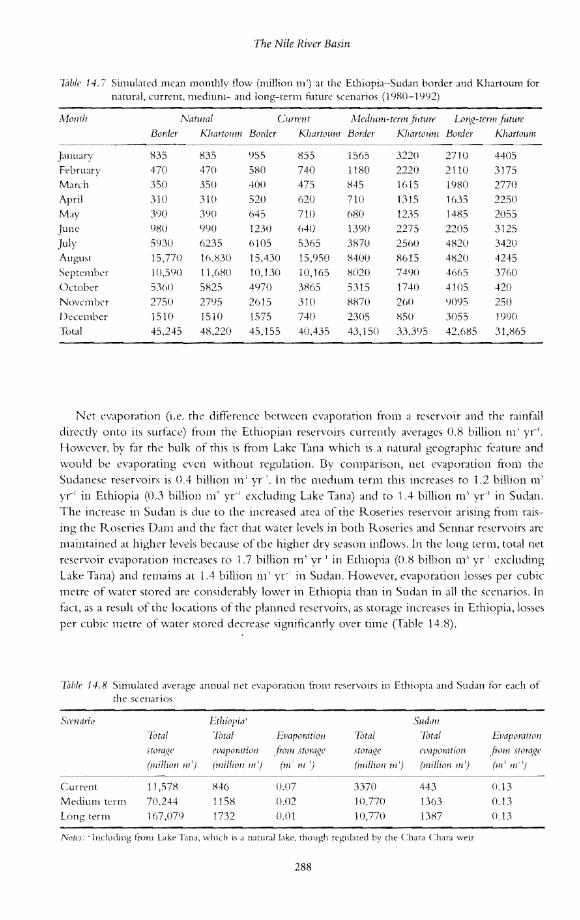
The Nile River Basin
lablr 147 Simulated mean monthly flow (million m) at the Ethiopia-Sudan border and Khartoum for natural current medium- and long-term tiJture scenarios (1980-1992)
Atom Naruml Currcrlt Aledium-term filturr Long-term future Border Khartollm Border Khartoum Border Khartoutll Border Khartoum
--~---~-~--------~---------
January 835 835 955 B55 1565 3220 2710 4405 February 470 470 380 740 1180 2220 2110 3175 March 350 350 400 475 845 1615 19BO 2770 April 310 310 520 620 710 1315 1635 2250 May 390 390 645 710 680 1235 14B5 2055
June 980 990 1230 640 1390 2273 2203 3125
July 5930 6235 6105 5365 3870 2560 4820 3420 August 15770 16830 15430 15950 8400 8615 4H20 4245 September 10590 116HO 10130 10165 H020 7490 4665 3760 October 53()O SH25 4970 3865 5315 1740 4105 420 November 2750 2795 2() 15 3JO 8870 2ltgt0 9095 250 December 1510 1510 1575 740 2305 H50 3055 1990 10ta1 45245 48220 45155 40435 43150 33395 426H5 3LB65
Net evaporation (ie the difference between evaporation trom a reservoir and the rainfall directly onto its surface) from the Ethiopian reservoirs currently averages 08 billion m yr- However by f3r the bulk of this is from Lake Tana which is a natural geographic feature and would be evaporating even without regulation By comparison net evaporation from the Sudanese reservoirs is 04 billion 111 yr- In the medium term this increases to 12 billion 111
yr in Ethiopia (03 billion m yr excluding Lake Tam) and to 14 billion m yr in Sudan The increase in Sudan is due to the increased area of the Roseries reservoir arising from raisshying the Roseries Dam and the fact that water levels in both Roseries and Sennar reservoirs are maintained at higher levels because of the higher dry season inflows In the long term total net reservoir evaporation increases to 17 billion m yr in Ethiopia (08 billion 111 yr bull excluding Lake Tam) and remains at 14 billion m l yr- in Sudan However evaporation losses per cubic metre of water stored are considerably lower in Ethiopia than in Sudan in all the scenarios In
fact as a result of the locations of the planned reservoirs as storage increases in Ethiopia losses per cubic metre of water stored decrease significantly over time (Table 14H)
labe 148 Simulated average annual net evaporation trom reservoirs in Ethiopia and Sudan for each of the scenarios
Sccnario Ethiopir SHdml
Tiltal lillal EJaptJratiou Iblal Iotal Elapomrioll storage evaporation from stOlalZe st()ra~e (U(1poration fn)Jn _f)ra~~l
(millioll ml (millivlI II) Imm) (millioll m) (millioll tn) (m i 111-)
Current 1157il H46 007 3370 443 013 Medium term 70244 l1SB (l02 10770 1363 013 Long term 167079 1732 Cl01 10770 13H7 013
N(lres Including from Lake 1ma which is a natural lake though regulated by the Char Chara weir
288
der and Khartoum for )
Long-term future Border Khartoum
2710 4405 2110 3175 1980 2770 1635 2250 1485 2055 2205 3125 4820 3420 4820 4245 4665 3760 4105 420 9095 250 3055 1990 42685 31865
~voir and the rainfall s 08 billion m 1 yc agraphic feature and vaporation from the Ises to 12 billion m on m yr I in Sudan oir arising from raisshySennaI reservoirs are long term total net on 111 yr excluding tion losses per cubic I all the scenarios In es in Ethiopia losses 8)
Ind Sudan fix each of
Euaporati()11 )ratiol1 I1om _forage
Oil m (111 I1l )
013 013 013
nra we-ir
Simulating current and future water resources development in the Blue Nile River Basin
Discussion
The results presented in this chapter are based on many assumptiolls Lack of data on flow and water demand and use particularly in Sudall makes it very difficult to validate the model for the current situation However where it has been possible to verifY them the model results appear to be reasonably accurate For example in the current scenario simulated flows closely match the observed flows at key locations on the main stem of the river and the simulated water levels in Lake Tana were reasonably accurate (Figures 145 and 146) Consequently though the results should be treated with caution they arc believed to be broadly indicative of the likely impacts arising trom the development currently being considered in both Ethiopia and Sudan By illustrating what may occur the scenarios provide information that is useful for resource pbnning and the results provide a basis for discussion
Climate and hence hydrological variability possibly increased by future climate change will remain key tilCtorS in the economic development of both Ethiopia and Sudan in the future As in the past future water resources development in the Blue Nile will be driven predominantly by the need felf water for agriculture and hydropower and hence the need for large volumes of stored water Irrigation will remain by filf the largest user of water and the future scenarios indicate significantly increased water withdrawals as a conseqnence of increasing irrigation predominantly in Sudan and also increasingly in Ethiopia The construction of the dams particularly the very large hydropower dams proposed by Ethiopia though not consuming large amounts of water vill sihrnificantly alter the flow regime of the river resulting in lower wet season flows and much greater dry season flows The results of this are likely to be benetlmiddotshycial for SudanThe frequency of flooding which occurs ewry few years in the flat areas of the country and is particularly devastating in and around Khartoum may be reduced Higher dry season flows mean greater availability of water at a time when it is naturally scarce and hence increased opportunities for withdrawals f()r irrigation and other uses Thus increased water storshyage in Ethiopia has the potential to provide benefits for Sudan too
As a result of higher rainfall and lower evaporative demand net evaporation loss per cubic metre of water stored in the Ethiopian reservoirs (including Lake Tana which is a natural lake) is currently approximately 50 per cent of that in Sudan As more water is stored in Ethiopia this ratio decreases so that in the long term it could be as low as 8 per cent of that in Sudan (Table 148) This confirms that one of the most signifICant benefits of storing water in the Ethiopian Highlands rather than in the lower more arid regions ofSudan (or indeed in Egypt) is significantly reduced evaporation losses
For all scenarios the model was run as a single system making no allowance tor the fact that Ethiopia and Sudan are separate countries Water demands in Sudan were given the same priorshyity as those in Ethiopia and water was released from reservoirs in Ethiopia to meet downstream demands in Sudan This assumes a much higher level of cooperation between the two states in relation to both the planning and managel1lent of water resources than at present
Future research is needed to refme the model Key to improving the simulatiom are
improved estimates of irrigation water demand improved estimates of the dates on which schemes will become operational more realistic dam operating rules detailed economic livelihood and environmental assessments of the cumulative impacts of all the proposed schemes and evaluation of the possible hydrological implications of climate change
289
The Nile River Basin
An important issue not considered in the current model simulations is the transient stages of reservoir tilling Given the large cumulative volume of the planned reservoirs in Ethiopia it is essential that reservoir filling is planned and managed in such a way that adverse downstream impacts including potentially negative environmental and social impacts are minimized The need to give due consideration to dam operation that provides for environmental (lows to avoid degradation of riverine ecosystems has recently been emphasized (Reitburger and McCartney 2(11)
Conclusion
The WEAP model has been configured to simulate the impacts of water resources developshyment in the I3NI3 Currently Ethiopia utilizes very little water for irrigation but does reb1llate some tlow for hydropower production In contrast Sudan uses some water for hydropower production and also abstracts large volumes for irrigation Both countries plan to develop water resources substantially in the near future The extent to which actual water resources developshyment will match the plans of both countries in the long term is unclear and will depend a lot on unpredictable social and economic factors However in both Ethiopia and Sudan hydropower and irrigation are widely perceived as critical to national development and in both countries current investment in water infrastructure is substantial and increasing Consequently pressures on water resources are rising and will increase substantially in the near future
The results of this study have confirmed that if the states cooperate effectively mutually beneficial scenarios are possible upstream regulation in Ethiopia reduces evaporation losses probably reduces the frequency of flooding and provides opportunities for greatly increased water development in Sudan However maximizing benefits and minimizing potential adverse impacts (eg to the environment) especially when the large reservoirs are being filled require much greater cooperation than currently exim between the riparian states The key to success is the establishment of pragmatic institutional arrangements that enable the water resources of the basin to be planned and managed as a single entity (ie without consideration of national borders) in the most effective and equitable manner possible It is to be hoped that such arrangements will be devised through the protracted negotiations currently under way
References
Awulachew S B McCartney M P Steenhuis T SAhmedAA (200H) A Review oHydrology Sedimcnt and vVater Resource Use ill the Blue Nile Basil International Water Management Institute Colombo Sri Lanka
[lCEOM (1998) Abbay RiFcr Basin Jltlc~ralcd Development A1astcr Plan Section II v[lilme v 11latcr Resources De1Jeopcnl Parr 1 1rr(~ion awl Draillfljlc Ministry ofWater Resources Addis Abtba Ethiopia
Beyelle T md Abebe Jv1 (2006) Potential and development plan in Ethiopia Hydropower and Datlls 13 61-64
Block P Strzepek K and Rajagopalan B (2007) blfegrated Jv1anagement of till Blue Nile Basin ill Ethiopia Hydropower and Irr(llaquo(lrion rvtdeli~ IFPRI Discussion Paper 00700 International Food Policy Research Institute Wasbington DC p22
Cascao1 E (2009) Changing power relations in the Nile River Basin Cnilateralism vs cooperation Water Alternalives 2 2 245-268
Ebla G (2008) Study ofMainstem Dams on the Blue Nile MSc thesis Arba Minch University Ethiopia pp94 ENTRO (Eastern Nile Technical Regional Office) (2007) Preeasibility study of Border Hydrnpucr PJfct
Ethiopia ENTROAddis Ababa Ethiopia FAO (Food and Agriculture Organization of the Cnited Nations) (2002) Aruwuncing LJCCim the FAa Local
Climate Estimator CDROll] wwwfaoorgsd2002EN1203a_enhtm accessed June 2009 GeorgakakosA P (200)) Nile Decision Support Tool (Nile DST) Executive Summary Report submitted to
FAO and the Nile riparian states Rome Italy June
290
Ie transient stages of Dirs in Ethiopia it is adverse downstream are minimized The iron mental flows to ed (Reitburger and
r resources developshym but does regulate Iter for hydropower Ian to develop water r resources developshyI1d will depend a lot hiopia and Sudan opment and in both asing Consequently e near future effectively mutually evaporation losses or greatly increased ng potential adverse being filled require The key to success e water resources of deration of national )e hoped that such y under way
Hydrolog Sedimcrll and ~ Colombo Sri Lanka fume ~ Hlaler Resources lba Ethiopia
and Dams 13
Nile Basin ill Ethiopia Food Policy Research
vs cooperation Hlatcr
iversiry Ethiopia pp94 dey Hydropower Project
Simulating current and future water resources development in the Blue Nile River Basin
Guariso C and Whittington n (19H7) Implications of Ethiopian water development for Egypt and Sudan bltcrnaliltllllllJolJrnal Hater Resources Dncpmml 3 2 105-114
IbrahimY A Ahmed A A and Ramdan M S (2009) Improving water management practices in the Rahad Scheme (Sudan) in Improved Hlaler md Lmd lvanuJlClllcnt ill Ihe Ethiopian H(~hlallds lis lmpaa 01
DowlIStrealgtl Stakrlwlders Dependent )11 tile Blllt Nile Intermediate Results Dissemination Vorkshop held at the International Livestock Research Institute (ILRI) 5-6 February S 13 Awulachew T Erkossa V Smakhtin and EAshra (eds)Addis Ababa Ethiopia
Jigerskog A GranitJ Risberg A and Yn V (2007) Tramboundary water management as a regional public good in fillaflcil1g Exampllfrom rhe Nile Basin Report no 20 SIWI Stockholm Sweden
JICA (lapan International Cooperation Agency) (1997) Feasibility Reporr uti Power Declopmellt at Lake lim Rf~IOIIJapan Internatiol Cooperariol1 Agency Tokyo Japan
Lahmeyer Consulting Engineers (1962) GilJlfl Abay Scheme Imperial Ethiopian Government Ministry of Public Works Addis Ahaba Ethiopia
McCartney M I~ Alcmayehu T Shiferaw A and Awulachew S ]3 (2010) Evaluation of current and future water resources development in the Lake Tana Basin Ethiopia IWMI Research Report 134 International Water Management Institute Colombo Sri Lanka
MetawieA E (2()04) History of co-operation in the Nile Basin Hlater Resources Dedopmer 20 147-63 MonteithJ L (1981) Evaporation and surface temperature QII1rIcry Joumal of lile Royal A1etrorologiral SariOy
107 1~~27
Norconsult (2006) Karadobi Hultipurpo5c Projea Preea5ibility Sludy Report to the Ministry of Water ResoUTces The Federal Republic of Ethiopia Addis Ababa Ethiopia
Omer A M (2009) Hydropouer polcurial atld Priority for Dams Developmel1t ill Slitiall wwwscitopicscomHydropower_potentiaLand_priority_for_da1l1s_developmellcill_Suda11html accessed November 2010
Omer A M (2010) S14dmese dec[opmelll 20 September wwwwaterpowermagazinecom storyaspc=2U57614 accessed 29lpril 2012
Reitburger B and McCartney M E (2011) Concepts of environmental flow assessment and challenges in the Blue Iile I3asin Ethiopia i11 Nile Rifler B115it Hydroloxy Clinate alld Water Use A M Melesse (cd) ppJ37-35H Springer Heidelberg Germany
SEI (Stockholm Environlllem Instiwte) (2007) WEAl Hlatcr Evaluarion Alld Planning System U5er Cuide Stockholm Environment Institute I3oston MA
SutcliffeJV and ParksY P (1999) The Hydrology fthe Nilr IAHSWallingford UK USBR (United States Bureau ofReclalllation) (1964) Lard and Water Re50urce f lire Bille iVile B05iH Ethiopia
United States Bureau of Reclamation Main report United States Bureau of Reclal11ation Washington DC
VAlCOS (1990) Preimirwry Water Resources neueiopmen [asleY PlanIor Ethipi( Final Rc-port prepared f)r EVDSA Addis Ababa Ethiopia
Whittington D Wu X and Sadoff C (20()5) Water resources management in the Nile Basin the economic value of cooperation ~HlIcr Poicy 7227-252
Yates lJ Sieber] Purkey nand Huber-LeeA (2005) VEAP 21 a demand priority and preference driven water planning model part 1 model characteristics WlIf1 ililertlatiorral 30 4H7~500
YilJ1la D A and Awulachew S 13 (2009) Characterization and atlas of the I3lne Nile I3asin and its sub basins in IprolJCd ~1rcr drld LlIId lvlaI~rmrl1l ill tile Erhiopian H~hlaruls lIs Inpltlct Oil Downstream Stakeholder5 Dependent 011 rhe Blur Nile Intermediate Results Dissemination Workshop held at the International Livestock Research Institute (ILRI) 5-6 Febrmry S B Awulachew T ErkmsaV Smakhtin and F Ashra (cds) Addis Ababa Ethiopia
UJClim the pound40 Local ne 2009 Report submitted to
291