1415 fact book - colorado state...
TRANSCRIPT
The Fact Book2014-15
Institutional ResearchFall 2014
www.ir.colostate.edu


Table of ContentsGeneral Information ....................................................................................................................................................5
StudentsStudent Highlights ........................................................................................................................................................9University Enrollment................................................................................................................................................ 11Student Enrollment .................................................................................................................................................... 13New First-Time Freshmen ........................................................................................................................................ 21New Undergraduate Transfer Students................................................................................................................... 31New Graduate Students ............................................................................................................................................. 35Students by Ethnicity ................................................................................................................................................. 43Students by Gender ................................................................................................................................................... 49Students by Geographical Area ............................................................................................................................... 53Students by Registration Type .................................................................................................................................. 59Students by Residency ............................................................................................................................................... 61Student Credit Hour Production ............................................................................................................................. 65Student FTE Production ........................................................................................................................................... 69Student-Faculty Ratio ................................................................................................................................................. 75Degrees Awarded........................................................................................................................................................ 77Persistence and Graduation of New Freshmen and Transfer Students ............................................................. 89Summer Session .......................................................................................................................................................... 93Undergraduate Class Size ......................................................................................................................................... 95Undergraduate Credit Hours by Faculty Type ..................................................................................................... 101Undergraduate Grade Point Average ................................................................................................................... 103Undergraduate Service Load .................................................................................................................................. 105Undergraduate Students by Full-Time/Part-Time Status................................................................................... 107Education Abroad ................................................................................................................................................... 109University Honors Program .................................................................................................................................... 115
EmployeesEmployee Highlights ............................................................................................................................................... 117University Employees............................................................................................................................................... 119Tenure-Track Faculty by Rank ............................................................................................................................... 123Tenure-Track Faculty by Ethnicity ........................................................................................................................ 127Tenure-Track Faculty by Gender .......................................................................................................................... 131Tenure-Track Faculty by Tenure Status ................................................................................................................ 135Tenure-Track Faculty Salaries................................................................................................................................. 139Tenure-Track Faculty Hires and Attrition ............................................................................................................ 143Tenure-Track Faculty Retention and Promotion................................................................................................. 147Tenure-Track Faculty Full-Time Equivalents (FTE) .......................................................................................... 151Faculty Salary Increases Compared to CPI Changes........................................................................................... 155Faculty on Special Appointments........................................................................................................................... 157Faculty on Temporary Appointments ................................................................................................................... 165Administrative Professionals (Excluding Research Associates) .............................................................................. 171Research Associates.................................................................................................................................................. 179State Classified Employees ...................................................................................................................................... 187Post Doctorates......................................................................................................................................................... 195Graduate Assistants ................................................................................................................................................. 197
Institutional ResearchFACT BOOK 2014-15
TABLE OF CONTENTS 3

Table of Contents
Costs and Student Financial AidCosts and Student Financial Aid Highlights ........................................................................................................ 201Tuition Rates ............................................................................................................................................................. 203Mandatory Student Fees ......................................................................................................................................... 205Room and Board Rates ........................................................................................................................................... 207Student Financial Aid ............................................................................................................................................... 209
Expenditures and ResourcesExpenditures and Resources Highlights................................................................................................................ 219Agricultural Experiment Station ............................................................................................................................ 221Capital Construction ................................................................................................................................................ 223Career Center ............................................................................................................................................................. 225Colorado State Forest Service ................................................................................................................................. 227Colorado State University Extension..................................................................................................................... 229Colorado State University Foundation .................................................................................................................. 231Library Resources...................................................................................................................................................... 233Research Awards and Proposals ............................................................................................................................. 237Research Expenditures ............................................................................................................................................. 243University Advancement.......................................................................................................................................... 247University Revenue and Expenditures................................................................................................................... 249
Institutional ResearchFACT BOOK 2014-15TABLE OF CONTENTS 4

General Information
Colorado State University is a land-grant institution and a Carnegie Research University (Very High Research Activity). CSU was founded as the Colorado Agricultural College in 1870, six years before the Colorado Territory gained statehood. It was one of 68 land-grant colleges established under the Morrill Act of 1862. The doors opened to a freshman class of 20 students in 1879. In 1935, the school became the Colorado State College of Agriculture and Mechanic Arts, or Colorado A & M, and was renamed Colorado State University in 1957.
Campus• A 586-acre main campus, which includes 101 acres for
the Veterinary Teaching Hospital• A 1,433-acre foothills campus• A 1,575-acre agricultural campus• A 1,177-acre Pingree Park mountain campus• 4,038 acres of land for research centers and Colorado State Forest Service stations outside of Larimer County
Location• Fort Collins is a mid-size city of approximately 150,000.• Located in northern Colorado at the western edge of
the Great Plains and at the base of the Rocky Mountains• Outside Magazine named Fort Collins an “Editor’s
Choice” for its “America’s Best Towns 2013” list.
Colleges• College of Agricultural Sciences• College of Business• College of Engineering• College of Health & Human Sciences• College of Liberal Arts• College of Natural Sciences• College of Veterinary Medicine &
Biomedical Sciences• Warner College of Natural Resources
Degree Programs• 72 undergraduate degree programs• 100 graduate degree programs• 25 professional master’s degree programs• A degree program in Professional Veterinary Medicine
Tuition, Fees and Housing• Undergraduate tuition and fees for 2014-15 are $9,897
for Colorado residents.• Undergraduate tuition and fees for 2014-15 are $26,076
for non-residents.• Room and board is $10,102 (standard room and 14-meal
option).
Academic Year• The fall semester begins in late August and ends
before Christmas.• The spring semester begins in January and ends in May.• There are 12 weeks in the regular summer session.
University Honors Program• Outstanding academics feature superb students and
faculty. Small discussion-based interdisciplinary seminars fulfill half of the University's general education requirements. A senior-year creative activity and an Honors Thesis are mentored by faculty.
• The Academic Village and Edwards Hall are residential learning communities that include seminarrooms, the Honors office suite and the FiresideLounge. This small community provides studentswith individual attention and support which fosterslearning, social interaction, and an ethic of involvement in University life.
Residence Life• 13 residence halls with a capacity of about 5,600
students• About 600 apartment units for students with families• About 250 apartments for graduate students
Student Life• 620 student organizations• 37 honor societies• 13% of the student population participates in intramural
sports.• 8% of the student population joins one of 21 fraternities
and 16 sororities.
Institutional Research FACT BOOK 2014-15
GENERAL INFORMATION5

General Information
Libraries• Library holdings include more than 2.8 million
books, bound journals, and government documents.• Access to more than 46,700 electronic journals and
over 545,000 e-books available at http://lib.colostate.edu• 325 desktop PCs plus more than 200 laptop computers
(Macs and PCs), Chromebooks, iPads, video cameras, and specialized calculators are available for checkout.
• An expedited interlibrary loan service, includingdesktop delivery of articles
University Center for the Arts• 300 world-class music, theatre and dance
performances; exhibitions; and other high-profilearts events annually
• Facilities include the University Center for theArts with the Runyan Music Hall, Griffin ConcertHall, University Theatre and Studio Theatre, DanceTheatre, the Organ Recital Hall, University Art Museum, and the Avenir Museum of Design andMerchandising.
International Programs• Recipient of the 2013 “Senator Paul Simon National
Award for Outstanding Campus Internationalization”• #1 in the U.S. for international student satisfaction for
academics and student support in the “InternationalStudent Barometer Survey” for 2013
• Over 20% of tenure-track faculty and 25% of newfaculty are international.
• 2,000 international students and scholars representing93+ countries
• 1,200 students participate annually in EducationAbroad programs in 85+ countries.
• Manages Peace Corps programs and CSU ranks 11thin the U.S. for recruitment
• 17 key strategic partnerships around the world,including four with leading Chinese universities
• Host to the new Confucius Institute with its focus onwater and environmental sustainability
• Co-host with East China Normal University in Shanghai for the Joint Research Institute for NewEnergy and the Environment
• Integrally involved with the INTO-CSU partnershipto increase campus globalization and enrollmentwith the CSU Todos Santos Center in Mexico
Engagement• CSU Extension provides services in 62 of 64 Colorado
counties. Extension applies research to address localissues such as cutting-edge agricultural production technologies, water quality and conservation, nutrition and food safety, gardening, 4-H youthdevelopment and community economic development.Additional information at www.ext.colostate.edu.
• The 17 district offices of the Colorado State Forest Service provide landowners with information andtechnical assistance on forest management, wildfiremitigation, urban and community forestry, andconservation education.
• The Colorado Agricultural Experiment Station conductssite-specific research on agriculture and related issuesthrough its eight off-campus research centers.
• CSU OnlinePlus, from the Division of ContinuingEducation, combines CSU’s academic excellence withthe flexibility of online learning, offering high-quality degrees and courses to more than 10,000 students annually.
• The Colorado Water Institute focuses academic water expertise on the evolving water conditions faced by
Colorado citizens.
The Career Center• More than 8,500 one-on-one career advising
appointments annually• Over 8,500+ full-time jobs and internships posted• 2,000+ on-campus interviews• Over 600 employers recruit on campus• 81% of CSU graduates secured their first-destination
plans by the following December, which is 7% higher than the national average.
• CSU graduates were hired by more than 1,100unique employers and accepted by more than200 graduate schools.
Alumni• CSU has 202,013 living alumni with 38 geographic
alumni groups (11 in Colorado and 27 out of state)representing 24 states and 13 common interest groups.
Institutional ResearchFACT BOOK 2014-15GENERAL INFORMATION
6

General Information
Athletics• A member of the National Collegiate Athletic
Association (NCAA) at the Division I Level - MountainWest Conference
• Sponsors 16 intercollegiate sports programs• Athletic facilities include Sonny Lubick Field at Hughes
Stadium (capacity 32,500), Moby Arena (capacity8,745), Ram Field, University Tennis Complex, MobyPool, Harmony Club, Jack Christiansen Track and theGlenn Morris Field House.
• Other facilities include a $20 million, 66,267-square-footindoor practice facility, the Anderson Academic andTraining Center, and a new 12,800-square-foot sports medicine center.
• Since the Mountain West was formed in 1999, CSU haswon 29 conference championships, including 21 regularseason titles and eight tournament titles.
University Distinguished Professors• V. “Chandra” Chandrasekar, Electrical and Computer
Engineering• Edward A. Hoover, Microbiology, Immunology, and
Pathology• Sonia Kreidenweis, Atmospheric Science• Jan E. Leach, Bioagricultural Sciences and Pest
Management• Karolin Luger, Biochemistry and Molecular Biology• C. Wayne McIlwraith, Clinical Sciences• Carmen Menoni, Electrical and Computer Engineering• Ian M. Orme, Microbiology, Immunology, and Pathology• David A. Randall, Atmospheric Science• Philip E. Risbeck, Art• Jorge J. Rocca, Electrical and Computer Engineering,
Physics• Bernard E. Rollin, Philosophy, Biomedical Sciences,
Animal Sciences• John N. Sofos, Animal Sciences• Thomas H. Vonder Haar, Atmospheric Science• Diana Wall, Biology, Natural Resource Ecology Lab,
School of Global Environmental Sustainability• Robert M. Williams, Chemistry• Stephen J. Withrow, Clinical Sciences
University Distinguished Teaching Scholars• Ken Barbarick, Soil and Crop Sciences• Stephanie Clemons, Design and Merchandising• Darrell Fontane, Civil and Environmental Engineering• Matthew Hickey, Health and Exercise Science• K. Douglas Hoffman, Marketing• Paul A. Kennedy, Mathematics• John Moore, Ecosystem Science and Sustainability• Nancy E. Levinger, Chemistry• Mike Palmquist, English• Erica Suchman, Microbiology, Immunology, and
Pathology• Ray Whalen, Biomedical Sciences• Toni Schindler Zimmerman, Human Development
and Family Studies
Programs of Research and Scholarly Excellence• Animal Reproduction and Biotechnology Laboratory• Atmospheric Sciences and Cooperative Institute
for Research in the Atmosphere (CIRA)• Center for Extreme Ultraviolet (EUV) Science and
Technology• Center for Interdisciplinary Mathematics and
Statistics (CIMS)• Center for Meat Safety and Quality• Graduate & Research Program in Biochemistry and
Molecular Biology• Graduate Degree Program in Ecology• High Energy Physics and Particle Astrophysics• Human Performance/Clinical Research Laboratory• Molecular, Cellular, and Integrative Neuroscience
Program• Musculoskeletal Research Program• Natural Resource Ecology Laboratory (NREL)• Occupational Therapy Program• Prion Research Center• Program in Chemical and Molecular Sciences• Program in Molecular Plant Biology• Sustainable Bioenergy Development Center• Water Science for Environmental Sustainability• Wheat Research, Outreach and Education Program
Institutional Research FACT BOOK 2014-15
GENERAL INFORMATION7

General Information
Board of Governors’ Peer Group• Iowa State University• Kansas State University• Michigan State University• North Carolina State University• Oklahoma State University• Oregon State University• Purdue University• Texas A & M University• University of California, Davis• University of Illinois, Urbana-Champaign• University of Tennessee, Knoxville• Virginia Tech• Washington State University
Other Facts• CSU is accredited by the Higher Learning Commission,
a commission of the North Central Association of Colleges and Schools, along with numerous other accrediting organizations.
• CSU ranks 58th among public universities nationwide,according to U.S. News and World Report’s Best Colleges, 2015 edition.
• The Professional Veterinary Medicine program iscurrently tied for third in the nation by U.S. Newsand World Report and is also ranked second in the country in federal research dollars.
• U.S. News and World Report also ranked the College ofEngineering’s Undergraduate Program 73rd (amonginstitutions offering doctorates) in the nation. TheUndergraduate Program in the College of Business wasranked 93rd in the same category.
• U.S. News and World Report, America’s Best Graduate Schools Rankings
Top Programs (Ranked in 2014)Biological Sciences - 75th
Chemistry - 49th
Computer Science - 70th
Earth Science - 77th
Mathematics - 73rd
Physics - 70th
Statistics - 42nd
• U.S. News and World Report, America’s Best Graduate Schools Rankings continued
Top Engineering Schools (Ranked in 2014) Civil Engineering - 31st
Electrical Engineering - 64th
Environmental/Environmental HealthEngineering - 50th
Mechanical Engineering - 71st
Top Programs (Ranked in 2013)Psychology - 101st
Sociology - 84th
Top Programs (Ranked in 2012)Occupational Therapy Master’s - 6th
Social Work - 60th
• When asked by U.S. News and World Reportto rate national universities, high school guidance counselors ranked CSU 136th out of 268 institutions nationwide (including unranked institutions).
• The Princeton Review regards CSU as one of “The Best379 Colleges” for 2015 and named the University a “BestWestern College” (schools that stand out within theirregion). Colorado State also received the highestpossible score in their Green Rating and joins only 23 other schools in the “Green College Honor Roll.”
• Bloomberg Business Week ranked CSU as one of the top undergraduate business programs in the country (73rd
out of 187) for 2014.
Institutional ResearchFACT BOOK 2014-15GENERAL INFORMATION
8

Student Highlights
Total university headcount enrollment (includes non-resident instruction students): 31,725 up 17% from fall 2005
Total on-campus, resident instruction headcount enrollment:: 27,086 up 9% from fall 2005
Five departments with the largest number of undergraduate primary and secondary majors (excludes open option):Biology (1,427), Health and Exercise Science (1,418), Psychology (1,034), Animal Sciences (862), and Mechanical Engineering (854)
Five departments with the largest number of graduate primary and secondary majors: Electrical and ComputerEngineering (245), Civil and Environmental Engineering (233), School of Education (212), Chemistry (155),Business Intra-College (154)
Total new freshmen enrolled: 4,353, up 12% from fall 2005
Total new undergraduate transfer students: 1,426, down 1% from fall 2005
Total new and readmitted graduate students enrolled: 1,232, up 27% from fall 2005
College with the most new freshmen (excludes open option majors): Natural Sciences with 790 students
Total student population who are ethnic minorities: 17%, up from 12% in fall 2005
Undergraduate student population who are women: 51%
Five home states for the largest number of non-resident undergraduate students: California (872), Texas (395),Illinois (387), New Mexico (167), Washington (147)
Undergraduate student population who are Colorado residents: 77%
Total student credit hour production for the academic year 2013-14: 688,212 up 6% from AY 2004-05
Total student full-time equivalent (FTE) for the academic year 2013-14: 22,940 up 6% from AY 2004-05
Student-faculty ratio: 16.1
Number of degrees awarded in 2013-14: 6,937 up 26% from AY 2004-05
First-year persistence rate for new freshmen (fall 2013 to fall 2014): 86.0%
Six-year graduation rate for new freshmen (entered fall 2008 and graduated by summer 2014): 66.6%
Undergraduate classes with fewer than 20 students in fall 2013: 37.0%
Undergraduate classes with 50 or more students in fall 2013: 19.0%
Undergraduate student credit hours taught by tenure-track faculty in AY 2013-14: 37.0%
College with the highest average undergraduate term GPA for fall 2013: Business with 3.12 followed byVeterinary Medicine and Biomedical Sciences with 3.08 and Health and Human Sciences with 2.99
Note: Student highlights are for fall term 2014 (unless otherwise noted).
Institutional ResearchFACT BOOK 2014-15
STUDENT INFORMATION9

0
500
1,000
1,500
2,000
2,500
3,000
3,500
4,000
4,500
5,000
1
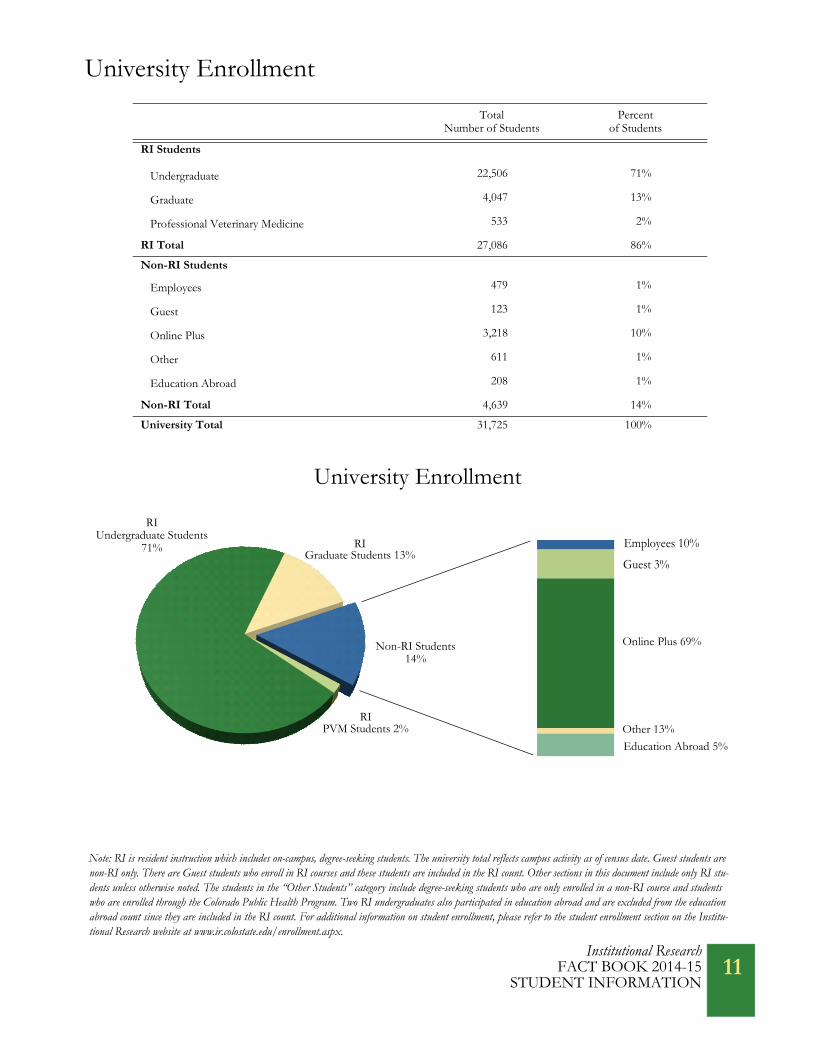
University Enrollment
Total Number of Students
Percent of Students
RI Students
Undergraduate 22,506 71%
Graduate 4,047 13%
Professional Veterinary Medicine 533 2%
RI Total 27,086 86%
Non-RI Students
Employees 479 1%
Guest 123 1%
Online Plus 3,218 10%
Other 611 1%
Education Abroad 208 1%
Non-RI Total 4,639 14%
University Total 31,725 100%
Note: RI is resident instruction which includes on-campus, degree-seeking students. The university total reflects campus activity as of census date. Guest students are non-RI only. There are Guest students who enroll in RI courses and these students are included in the RI count. Other sections in this document include only RI stu-dents unless otherwise noted. The students in the “Other Students” category include degree-seeking students who are only enrolled in a non-RI course and students who are enrolled through the Colorado Public Health Program. Two RI undergraduates also participated in education abroad and are excluded from the education abroad count since they are included in the RI count. For additional information on student enrollment, please refer to the student enrollment section on the Institu-tional Research website at www.ir.colostate.edu/enrollment.aspx.
University Enrollment
Graduate Students 13%RI
Undergraduate Students71%
RI
Non-RI Students14%
PVM Students 2%RI
Education Abroad 5%
Guest 3%
Employees 10%
Online Plus 69%
Other 13%
Institutional ResearchFACT BOOK 2014-15
STUDENT INFORMATION 11

University Enrollment
History of University EnrollmentFall2005
Fall2006
Fall2007
Fall2008
Fall2009
Fall2010
Fall2011
Fall2012
Fall2013
Fall2014
FA05 to FA14 Percent Change
RI Students
Undergraduate 20,720 20,500 20,765 20,829 21,204 21,953 22,300 22,412 22,565 22,506 9%
Graduate 3,690 3,636 3,679 3,655 3,671 3,864 3,887 3,808 3,927 4,047 10%
ProfessionalVeterinary Med 537 534 539 527 538 539 548 549 542 533 -1%
Total RI Students 24,947 24,670 24,983 25,011 25,413 26,356 26,735 26,769 27,034 27,086 9%
Non-RI Students
Employees 183 192 219 258 270 238 256 400 433 479 162%
Guest Students 352 322 357 368 305 292 213 165 160 123 -65%
Online Plus/Continuing Education
1,503 1,386 1,823 1,999 2,424 2,879 2,780 2,841 3,140 3,218 114%
Other Students N/A N/A N/A N/A N/A N/A 283 284 555 611 N/A
Education Abroad 148 153 187 164 135 167 183 188 192 208 41%
Total Non-RI Students 2,186 2,053 2,586 2,789 3,134 3,576 3,715 3,878 4,480 4,639 112%
University Total 27,133 26,723 27,569 27,800 28,547 29,932 30,450 30,647 31,514 31,725 17%
FA05 to FA14 Percent Change in University Enrollment
-75%
-25%
25%
75%
125%
175%
RI UndergradStudents
RI GraduateStudents
PVMStudents
Employees GuestStudents
Online PlusStudents
EducationAbroad
Institutional ResearchFACT BOOK 2014-15STUDENT INFORMATION
12
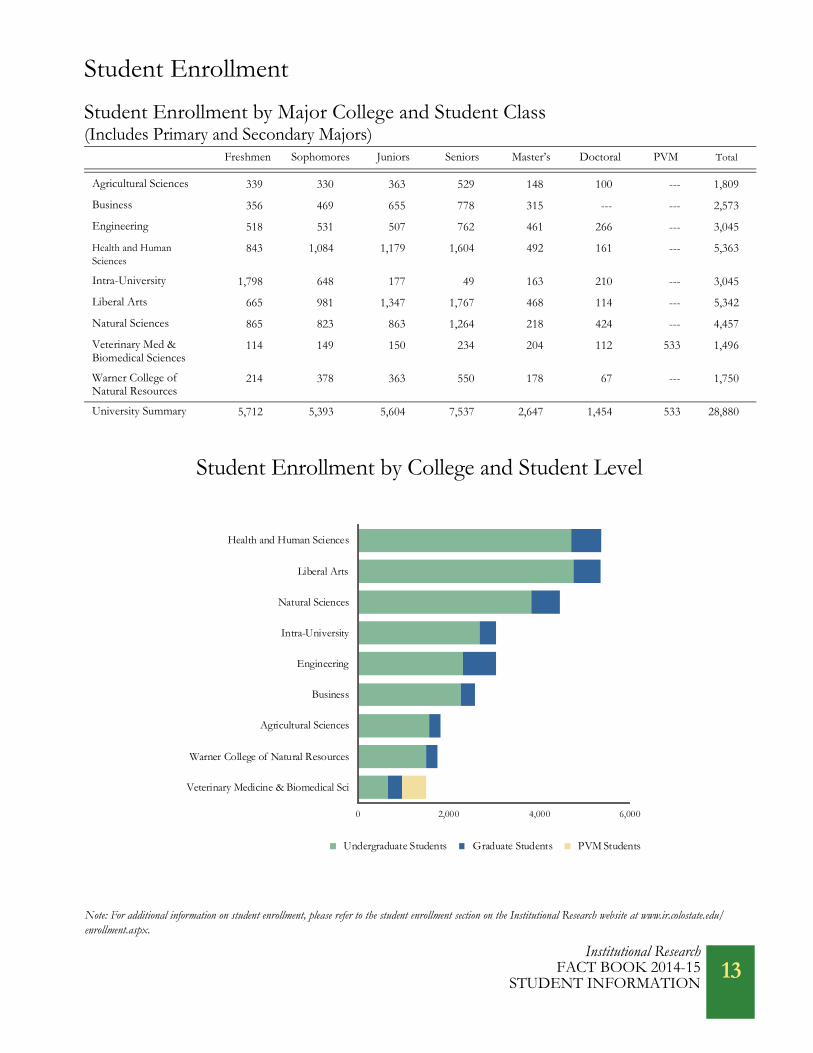
Student Enrollment
Student Enrollment by Major College and Student Class(Includes Primary and Secondary Majors)
Freshmen Sophomores Juniors Seniors Master’s Doctoral PVM Total
Agricultural Sciences 339 330 363 529 148 100 --- 1,809
Business 356 469 655 778 315 --- --- 2,573
Engineering 518 531 507 762 461 266 --- 3,045
Health and Human Sciences
843 1,084 1,179 1,604 492 161 --- 5,363
Intra-University 1,798 648 177 49 163 210 --- 3,045
Liberal Arts 665 981 1,347 1,767 468 114 --- 5,342
Natural Sciences 865 823 863 1,264 218 424 --- 4,457
Veterinary Med &Biomedical Sciences
114 149 150 234 204 112 533 1,496
Warner College ofNatural Resources
214 378 363 550 178 67 --- 1,750
University Summary 5,712 5,393 5,604 7,537 2,647 1,454 533 28,880
Note: For additional information on student enrollment, please refer to the student enrollment section on the Institutional Research website at www.ir.colostate.edu/enrollment.aspx.
Student Enrollment by College and Student Level
0 2,000 4,000 6,000
Veterinary Medicine & Biomedical Sci
Warner College of Natural Resources
Agricultural Sciences
Business
Engineering
Intra-University
Natural Sciences
Liberal Arts
Health and Human Sciences
Undergraduate Students Graduate Students PVM Students
Institutional ResearchFACT BOOK 2014-15
STUDENT INFORMATION 13

Student Enrollment
Number of Majors
Biology 1,427
Health and Exercise Science 1,418
Psychology 1,034
Animal Sciences 862
Mechanical Engineering 854
Human Development and Family Studies 812
Business, Intra-College 667
Communication Studies 649
Construction Management 624
Food Science and Human Nutrition 579
Art 543
Computer Science 541
Sociology 489
Design and Merchandising 482
Civil and Environmental Engineering 437
Departments with the Largest Number
Note: All open option majors are excluded.
of Undergraduate Majors(Includes Primary and Secondary Majors)
0 400 800 1,200 1,600
Civil and Environmental Engineering
Design and Merchandising
Sociology
Computer Science
Art
Food Science & Human Nutrition
Construction Management
Communication Studies
Business Intra-College
Human Development & Family Studies
Mechanical Engineering
Animal Sciences
Psychology
Health and Exercise Science
Biology
Institutional ResearchFACT BOOK 2014-15STUDENT INFORMATION
14

Student Enrollment
Number of Majors
Electrical and Computer Engineering 245
Civil and Environmental Engineering 233
School of Education 212
Chemistry 155
Business Intra-College 154
Computer Science 139
Occupational Therapy 131
English 106
Biomedical Sciences 103
Psychology 99
Environmental & Radiological Health Sciences 94
Microbiology, Immunology and Pathology 93
Mechanical Engineering 88
School of Social Work 88
Atmospheric Science 82
.
Departments with the Largest Numberof Graduate Majors
(Includes Primary and Secondary Majors)
0 100 200 300
Atmospheric Science
Mechanical Engineering
School of Social Work
Microbiology, Immunology and Pathology
Environmental & Radiological Health Sciences
Psychology
Biomedical Sciences
English
Occupational Therapy
Computer Science
Business Intra-College
Chemistry
School of Education
Civil and Environmental Engineering
Electrical and Computer Engineering
Institutional ResearchFACT BOOK 2014-15
STUDENT INFORMATION 15

Student Enrollment
History of Total Student Enrollment by Major College (Includes Primary and Secondary Majors)
Fall2005
Fall2006
Fall 2007
Fall2008
Fall2009
Fall2010
Fall2011
Fall2012
Fall2013
Fall2014
FA05 - FA14 Change
Agricultural Sciences 1,652 1,619 1,610 1,610 1,591 1,697 1,735 1,748 1,702 1,809 10%
Business 2,282 2,226 2,231 2,165 2,194 2,315 2,408 2,480 2,524 2,573 13%
Engineering 1,969 1,937 2,011 2,030 2,171 2,370 2,507 2,687 2,952 3,045 55%
Health & HumanSciences 5,362 5,748 5,724 5,890 5,980 5,984 5,888 5,526 5,299 5,363 0%
Intra-University 2,983 2,891 2,950 2,977 3,062 3,260 2,961 3,088 3,028 3,045 2%
Liberal Arts 5,855 5,812 5,898 5,907 5,945 6,052 6,165 5,968 5,687 5,342 -9%
Natural Sciences 4,092 3,946 3,943 3,761 3,805 3,941 4,218 4,359 4,540 4,457 9%
Veterinary Medicine &Biomedical Sciences 1,452 1,519 1,580 1,484 1,537 1,557 1,551 1,531 1,499 1,496 3%
Warner College ofNatural Resources 1,289 1,285 1,279 1,223 1,265 1,455 1,578 1,641 1,731 1,750 36%
University Summary 26,936 26,983 27,226 27,047 27,550 28,631 29,011 29,028 28,962 28,880 7%
Fall 2005 to Fall 2014 Percent Change in Total Enrollment by College
-20%
0%
20%
40%
60%
AgriculturalSciences
Business Engineering Health &Human Sci
Intra-University
LiberalArts
NaturalSciences
Vet Med &Bio Sci
Warner Collof Nat Res
Institutional ResearchFACT BOOK 2014-15STUDENT INFORMATION
16
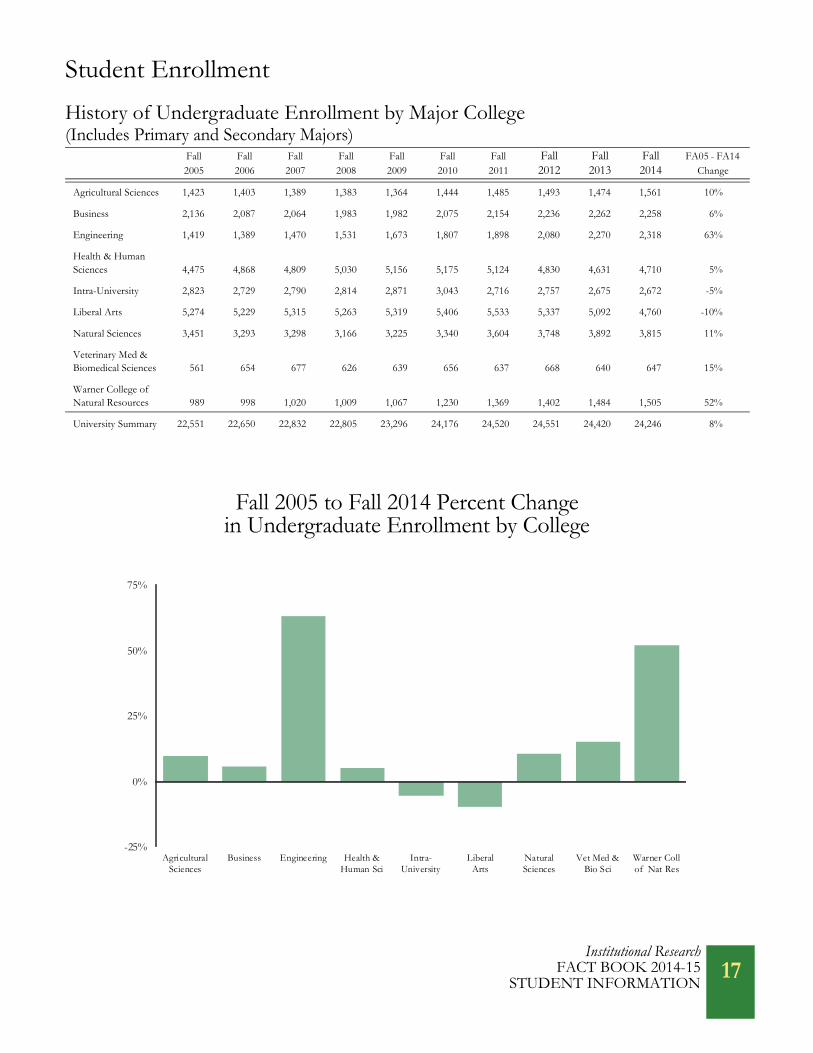
Student Enrollment
History of Undergraduate Enrollment by Major College(Includes Primary and Secondary Majors)
Fall 2005
Fall2006
Fall2007
Fall2008
Fall2009
Fall2010
Fall2011
Fall2012
Fall2013
Fall2014
FA05 - FA14 Change
Agricultural Sciences 1,423 1,403 1,389 1,383 1,364 1,444 1,485 1,493 1,474 1,561 10%
Business 2,136 2,087 2,064 1,983 1,982 2,075 2,154 2,236 2,262 2,258 6%
Engineering 1,419 1,389 1,470 1,531 1,673 1,807 1,898 2,080 2,270 2,318 63%
Health & HumanSciences 4,475 4,868 4,809 5,030 5,156 5,175 5,124 4,830 4,631 4,710 5%
Intra-University 2,823 2,729 2,790 2,814 2,871 3,043 2,716 2,757 2,675 2,672 -5%
Liberal Arts 5,274 5,229 5,315 5,263 5,319 5,406 5,533 5,337 5,092 4,760 -10%
Natural Sciences 3,451 3,293 3,298 3,166 3,225 3,340 3,604 3,748 3,892 3,815 11%
Veterinary Med &Biomedical Sciences 561 654 677 626 639 656 637 668 640 647 15%
Warner College ofNatural Resources 989 998 1,020 1,009 1,067 1,230 1,369 1,402 1,484 1,505 52%
University Summary 22,551 22,650 22,832 22,805 23,296 24,176 24,520 24,551 24,420 24,246 8%
Fall 2005 to Fall 2014 Percent Change in Undergraduate Enrollment by College
-25%
0%
25%
50%
75%
AgriculturalSciences
Business Engineering Health &Human Sci
Intra-University
LiberalArts
NaturalSciences
Vet Med &Bio Sci
Warner Collof Nat Res
Institutional ResearchFACT BOOK 2014-15
STUDENT INFORMATION 17
Student Enrollment
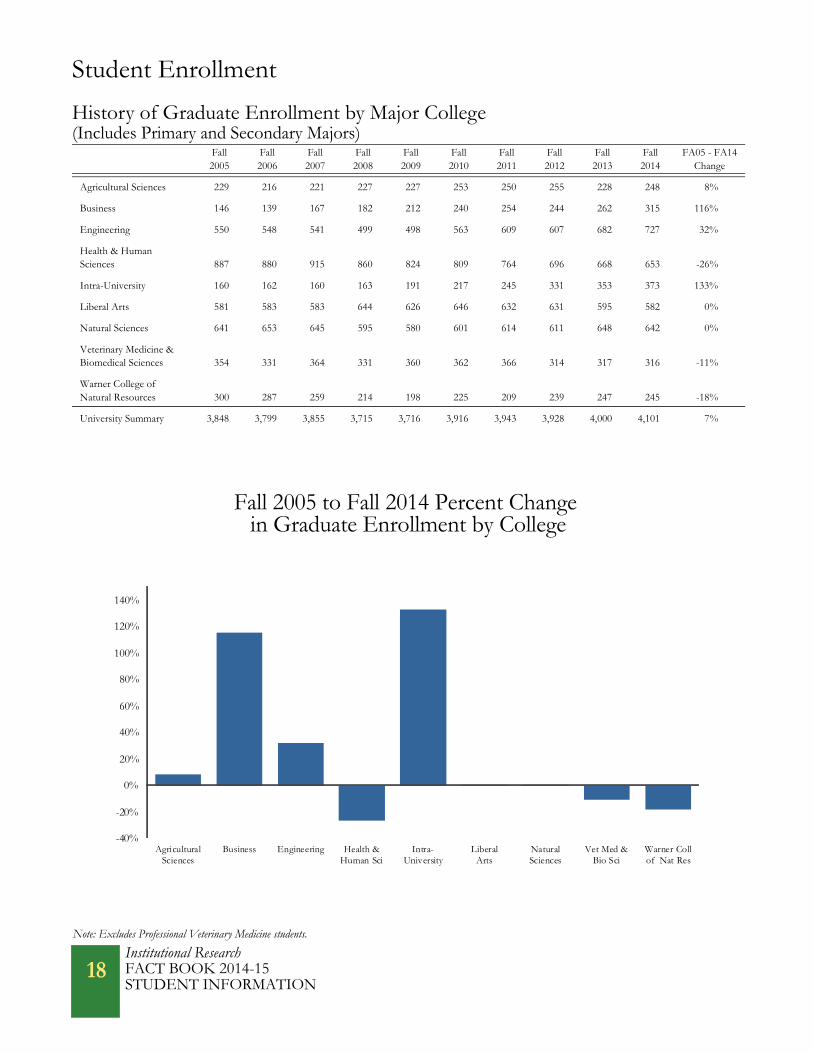
History of Graduate Enrollment by Major College(Includes Primary and Secondary Majors)
Fall 2005
Fall2006
Fall2007
Fall2008
Fall2009
Fall2010
Fall2011
Fall2012
Fall2013
Fall2014
FA05 - FA14Change
Agricultural Sciences 229 216 221 227 227 253 250 255 228 248 8%
Business 146 139 167 182 212 240 254 244 262 315 116%
Engineering 550 548 541 499 498 563 609 607 682 727 32%
Health & HumanSciences 887 880 915 860 824 809 764 696 668 653 -26%
Intra-University 160 162 160 163 191 217 245 331 353 373 133%
Liberal Arts 581 583 583 644 626 646 632 631 595 582 0%
Natural Sciences 641 653 645 595 580 601 614 611 648 642 0%
Veterinary Medicine &Biomedical Sciences 354 331 364 331 360 362 366 314 317 316 -11%
Warner College ofNatural Resources 300 287 259 214 198 225 209 239 247 245 -18%
University Summary 3,848 3,799 3,855 3,715 3,716 3,916 3,943 3,928 4,000 4,101 7%
Fall 2005 to Fall 2014 Percent Change in Graduate Enrollment by College
Note: Excludes Professional Veterinary Medicine students.
-40%
-20%
0%
20%
40%
60%
80%
100%
120%
140%
AgriculturalSciences
Business Engineering Health &Human Sci
Intra-University
LiberalArts
NaturalSciences
Vet Med &Bio Sci
Warner Collof Nat Res
Institutional ResearchFACT BOOK 2014-15STUDENT INFORMATION
18

Student Enrollment
Fall Enrollment Fall Enrollment Fall Enrollment Fall Enrollment Fall Enrollment Fall Enrollment
1912 367 1930 1,072 1948 4,431 1966 12,701 1984 18,094 2002 24,735
1913 492 1931 1,050 1949 4,392 1967 11,510 1985 18,084 2003 25,042
1914 569 1932 1,067 1950 4,138 1968 15,361 1986 18,381 2004 25,382
1915 579 1933 985 1951 3,820 1969 16,252 1987 19,192 2005 24,947
1916 663 1934 1,042 1952 4,036 1970 17,045 1988 19,885 2006 24,670
1917 501 1935 1,472 1953 3,938 1971 17,608 1989 20,149 2007 24,983
1918 493 1936 1,732 1954 4,478 1972 16,656 1990 20,795 2008 25,011
1919 633 1937 1,844 1955 4,992 1973 16,860 1991 20,967 2009 25,413
1920 567 1938 1,750 1956 5,525 1974 16,798 1992 21,210 2010 26,356
1921 819 1939 2,048 1957 5,282 1975 16,809 1993 21,110 2011 26,735
1922 841 1940 2,057 1958 5,593 1976 17,426 1994 21,461 2012 26,769
1923 675 1941 1,982 1959 5,977 1977 17,812 1995 21,914 2013 27,034
1924 871 1942 1,707 1960 6,131 1978 18,223 1996 21,970 2014 27,086
1925 876 1943 756 1961 6,529 1979 18,255 1997 22,344
1926 909 1944 736 1962 7,304 1980 18,083 1998 22,523
1927 904 1945 2,057 1963 8,460 1981 18,651 1999 22,782
1928 914 1946 4,015 1964 10,175 1982 18,909 2000 23,098
1929 1,408 1947 4,175 1965 11,848 1983 18,295 2001 23,934
History of Student Enrollment
0
5,000
10,000
15,000
20,000
25,000
30,000
1 5 9 13 17 21 25 29 33 37 41 45 49 53 57 61 65 69 73 77 81 85 89 93 97 1011912 1944 1971 2014
Institutional ResearchFACT BOOK 2014-15
STUDENT INFORMATION 19

Student Enrollment
UndergraduateStudents
Undergraduates as a Percent of Student
Population
Graduate andProfessional
Students
Graduates and Professionals as a Percent of Student
PopulationTotal
Students
Colorado State University 22,565 83% 4,469 17% 27,034
Iowa State University 27,112 84% 5,018 16% 32,130
Kansas State University 19,647 83% 4,021 17% 23,668
Michigan State University 37,625 78% 10,310 22% 47,935
North Carolina State University 22,977 73% 8,500 27% 31,477
Oklahoma State University 20,260 79% 5,243 21% 25,503
Oregon State University 22,353 85% 3,845 15% 26,198
Purdue University 29,216 76% 9,137 24% 38,353
Texas A & M University 43,930 80% 11,064 20% 54,994
University of California, Davis 26,483 84% 5,002 16% 31,485
University of Illinois, Urbana-Champaign 31,663 73% 11,871 27% 43,534
University of Tennessee, Knoxville 21,068 71% 8,654 29% 29,722
Virginia Tech 23,928 77% 7,171 23% 31,099
Washington State University 22,825 84% 4,335 16% 27,160
Board of Governors’ Peer Group Comparison Students by Level - Fall Term 2013
Source: Common Data Set, 2013-14
0 20,000 40,000 60,000
Kansas State University
Oklahoma State University
Oregon State University
Washington State University
University of Tennessee, Knoxville
Virginia Tech
North Carolina State University
University of California, Davis
Iowa State University
Purdue University
University of Illinois, Urbana-Champaign
Michigan State University
Texas A & M University
Undergraduate Students Graduate and Professional Students
Colorado State University
Institutional ResearchFACT BOOK 2014-15STUDENT INFORMATION
20

New First-Time Freshmen
New Freshmen 4,353
Percent of Admitted Students Who Enroll 32%
Mean High School Percentile Rank 72nd
Mean High School GPA 3.61
Mean ACT Composite 24.9
Mean SAT Math 574Mean SAT Critical Reading 569
Mean CDHE Index 115
New Freshman Profile
By Gender By Residency
Note: The CDHE Index is a Colorado Department of Higher Education standard, derived by using components of high school work (GPA and/or rank) and standard test scores (ACT or SAT). For additional information on new, first-time freshmen, please refer to the Freshman Profile on the Institutional Research web-site at www.ir.colostate.edu/freshman_profile.aspx.
By Minority Status
Total New Freshmen = 4,353 79%
Non-Minority
Minority21%
Non-Resident28%
Resident 72%
Male45%
Female55%
Institutional ResearchFACT BOOK 2014-15
STUDENT INFORMATION21

New First-Time Freshmen
History of First-Time Freshman EnrollmentFall2005
Fall 2006
Fall2007
Fall2008
Fall2009
Fall2010
Fall2011
Fall2012
Fall2013
Fall2014
FA05 - FA14 Change
Men 1,658 1,759 1,990 1,965 1,921 1,980 2,004 2,022 2,016 1,963 18%
Women 2,235 2,334 2,402 2,439 2,364 2,492 2,500 2,522 2,427 2,390 7%
Full-Time 3,840 4,010 4,330 4,348 4,233 4,412 4,458 4,485 4,398 4,300 12%
Part-Time 53 83 62 56 52 60 46 59 45 53 0%
Resident 3,156 3,259 3,445 3,482 3,350 3,541 3,461 3,386 3,289 3,154 0%
Non-Resident 737 834 947 922 935 931 1,043 1,158 1,154 1,199 63%
Minority 542 600 641 600 667 738 852 872 912 896 65%
Non-Minority 3,351 3,493 3,751 3,804 3,618 3,734 3,652 3,672 3,531 3,457 3%
Total First-TimeFreshmen 3,893 4,093 4,392 4,404 4,285 4,472 4,504 4,544 4,443 4,353 12%
Note: Non-resident alien students are reported with non-minority students.
Fall 2005 to Fall 2014 Percent Change in New Freshmen by Category
-25%
0%
25%
50%
75%
100%
Men Women Full-Time Part-Time Resident Non-Resident Minority Non-Minority
Institutional ResearchFACT BOOK 2014-15STUDENT INFORMATION
22

New First-Time Freshmen
History of New Freshmen by CollegeFall 2005
Fall 2006
Fall2007
Fall2008
Fall2009
Fall2010
Fall2011
Fall2012
Fall2013
Fall2014
FA05 - FA14 Change
Agricultural Sciences 220 189 229 239 194 221 222 210 234 265 20%
Business 303 320 330 350 300 337 379 311 343 324 7%
Engineering 260 291 364 395 446 454 490 590 579 520 100%
Health & Human Sci 470 548 612 633 553 552 524 503 525 572 22%
Intra-University 1,103 1,181 1,167 1,255 1,248 1,273 1,196 1,307 1,165 1,130 2%
Liberal Arts 614 640 676 633 600 601 628 573 563 472 -23%
Natural Sciences 633 571 684 666 693 750 789 773 741 790 25%
Veterinary Medicine &Biomedical Sciences 182 227 203 129 140 126 126 132 121 116 -36%
Warner College of Natural Resources 108 126 127 104 111 158 150 145 172 164 52%
University Total 3,893 4,093 4,392 4,404 4,285 4,472 4,504 4,544 4,443 4,353 12%
Fall 2005 to Fall 2014 Percent Change in New Freshmen by College
-50%
0%
50%
100%
150%
AgriculturalSciences
Business Engineering Health &Human Sci
Intra-University
LiberalArts
NaturalSciences
Vet Med& Bio Sci
Warner Collof Nat Res
Institutional ResearchFACT BOOK 2014-15
STUDENT INFORMATION23

New First-Time Freshmen
Resident New Freshmen by Colorado County
Adams 170 Fremont 11 Morgan 14
Alamosa 1 Garfield 21 Otero 6
Arapahoe 406 Gilpin 2 Ouray 1
Archuleta 4 Grand 6 Park 3
Baca 0 Gunnison 11 Phillips 1
Bent 0 Hinsdale 0 Pitkin 3
Boulder 184 Huerfano 0 Prowers 1
Broomfield 85 Jackson 0 Pueblo 54
Chaffee 11 Jefferson 233 Rio Blanco 3
Cheyenne 2 Kiowa 0 Rio Grande 2
Clear Creek 3 Kit Carson 1 Routt 14
Conejos 3 Lake 1 Saguache 1
Costilla 0 La Plata 21 San Juan 0
Crowley 0 Larimer 421 San Miguel 5
Custer 3 Las Animas 2 Sedgewick 0
Delta 5 Lincoln 0 Summit 17
Denver 210 Logan 5 Teller 5
Dolores 0 Mesa 40 Washington 2
Douglas 547 Mineral 0 Weld 166
Eagle 27 Moffat 2 Yuma 11
Elbert 22 Montezuma 16 Not Reported 5
El Paso 353 Montrose 11 Total 3,154
Total = 3,154
Top Ten Colorado Counties of Residence for Resident New Freshmen
0 200 400 600 800
Broomfield
Weld
Adams
Boulder
Denver
Jefferson
El Paso
Arapahoe
Larimer
Douglas
Institutional ResearchFACT BOOK 2014-15STUDENT INFORMATION
24
New First-Time Freshmen
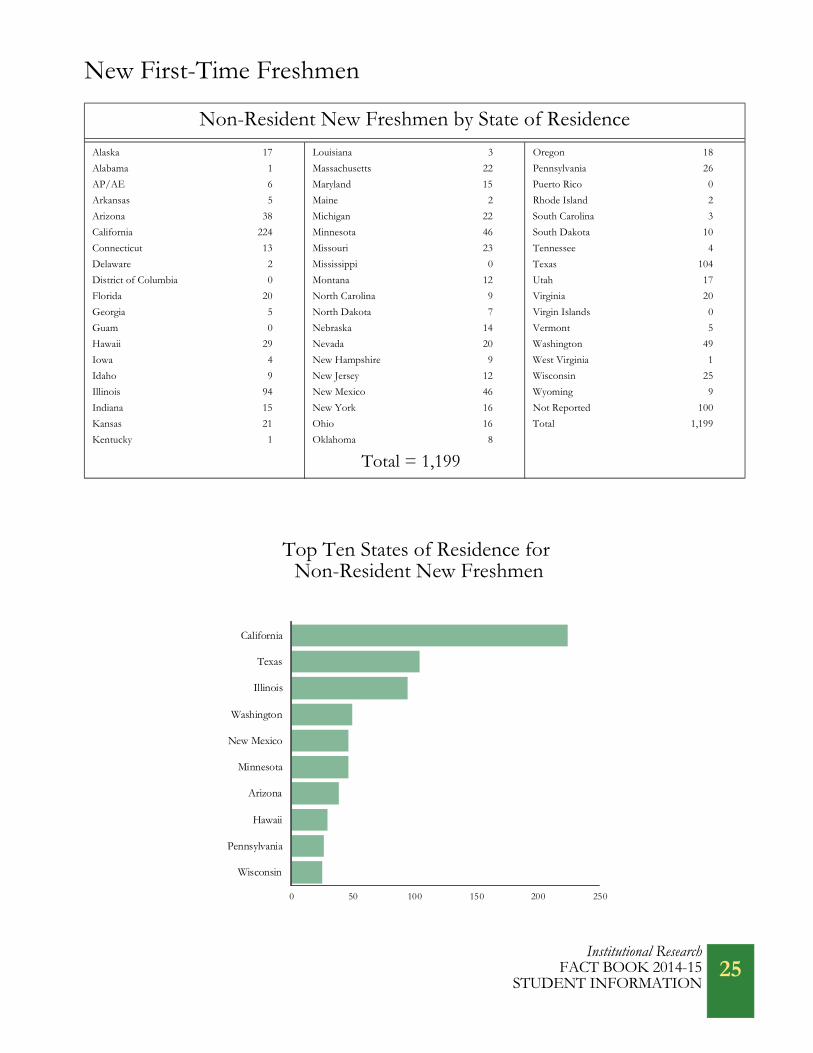
Non-Resident New Freshmen by State of Residence
Alaska 17 Louisiana 3 Oregon 18
Alabama 1 Massachusetts 22 Pennsylvania 26
AP/AE 6 Maryland 15 Puerto Rico 0
Arkansas 5 Maine 2 Rhode Island 2
Arizona 38 Michigan 22 South Carolina 3
California 224 Minnesota 46 South Dakota 10
Connecticut 13 Missouri 23 Tennessee 4
Delaware 2 Mississippi 0 Texas 104
District of Columbia 0 Montana 12 Utah 17
Florida 20 North Carolina 9 Virginia 20
Georgia 5 North Dakota 7 Virgin Islands 0
Guam 0 Nebraska 14 Vermont 5
Hawaii 29 Nevada 20 Washington 49
Iowa 4 New Hampshire 9 West Virginia 1
Idaho 9 New Jersey 12 Wisconsin 25
Illinois 94 New Mexico 46 Wyoming 9
Indiana 15 New York 16 Not Reported 100
Kansas 21 Ohio 16 Total 1,199
Kentucky 1 Oklahoma 8
Total = 1,199
Top Ten States of Residence for Non-Resident New Freshmen
0 50 100 150 200 250
Wisconsin
Pennsylvania
Hawaii
Arizona
Minnesota
New Mexico
Washington
Illinois
Texas
California
Institutional ResearchFACT BOOK 2014-15
STUDENT INFORMATION25

New First-Time Freshmen
Fall2005
Fall2006
Fall2007
Fall2008
Fall2009
Fall2010
Fall2011
Fall2012
Fall2013
Fall2014
Asian American 126 144 147 130 141 87 82 81 104 143
Black 102 98 111 117 129 109 111 92 84 114
Hawaiian/Pacific Islander N/A N/A N/A N/A N/A 9 5 4 1 8
Hispanic 252 293 310 290 315 378 475 479 529 527
Multi-Racial N/A N/A N/A N/A N/A 139 161 199 176 64
Native American 62 65 73 63 82 16 18 17 18 40
Minority New Freshmen 542 600 641 600 667 738 852 872 912 896
All New Freshmen 3,893 4,093 4,392 4,404 4,285 4,472 4,504 4,544 4,443 4,353
Minority New Freshmen as a Percent of All New Freshmen
13.9% 14.7% 14.6% 13.6% 15.6% 16.5% 18.9% 19.2% 20.5% 20.6%
History of Ethnicity of Minority Entering Freshmen
Note: New federal ethnicity and race categories were implemented in the fall of 2010. Part of the increase in Hispanic students in fall 2010 was due to the change in ethnic categories requiring all students who are part Hispanic to be reported as Hispanic instead of with their other ethnic group. The addition of the Multi-Racial category may have decreased the number of students reported in the Asian American, Black and Native American categories. The number of Asian American students may have decreased with the addition of the Hawaiian/Pacific Islander category. Non-resident alien students are not reported in the minority categories.
0
250
500
750
1,000
Fall 2005 Fall 2008 Fall 2011 Fall 2014
Asian Students Black Students
Hawaiian/Pacific Islander Students Hispanic Students
Multi-Racial Students Native American Students
Institutional ResearchFACT BOOK 2014-15STUDENT INFORMATION
26

New First-Time Freshmen
Fall Term Mean CDHE Index
2005 113
2006 113
2007 113
2008 113
2009 114
2010 114
2011 115
2012 115
2013 115
2014 115
Average CDHE Index for New Freshmen
109.0
112.0
115.0
118.0
Fall 2005 Fall 2008 Fall 2011 Fall 2014
Institutional ResearchFACT BOOK 2014-15
STUDENT INFORMATION27

New First-Time Freshmen
Fall TermCompleted
Applications Admits Enrolls Yield Rate
2005 10,770 9,516 3,893 40.9%
2006 11,310 9,692 4,093 42.2%
2007 11,797 10,077 4,392 43.6%
2008 12,494 10,688 4,404 41.2%
2009 15,253 11,013 4,285 38.9%
2010 14,685 11,825 4,472 37.8%
2011 16,559 12,564 4,504 35.8%
2012 17,886 13,351 4,544 34.0%
2013 18,014 13,916 4,443 31.9%
2014 16,655 13,404 4,353 32.5%
New Freshmen
Yield RateApplications, Admits and Enrolls
Note: The yield rate is calculated by dividing the number of enrolled students by the number of admitted students.
0
4,000
8,000
12,000
16,000
20,000
Fall2005
Fall2008
Fall2011
Fall2014
Completed Applications Admits Enrolls
0%
25%
50%
75%
Fall 2005 Fall 2008 Fall 2011 Fall 2014
Institutional ResearchFACT BOOK 2014-15STUDENT INFORMATION
28

New First-Time Freshmen
New First-Time Minority
Freshmen
New First-TimeNon-Resident
Alien Freshmen
New First-Time Non-Minority
Freshmen
All NewFirst-TimeFreshmen
Minority New Freshmen as a Percent of All New Freshmen
Colorado State University 912 61 3,470 4,443 21%
Iowa State University 782 361 4,946 6,089 13%
Kansas State University 571 134 3,116 3,821 15%
Michigan State University 1,508 1,305 5,248 8,061 19%
North Carolina State University 752 151 3,262 4,165 18%
Oklahoma State University 1,035 72 2,765 3,872 27%
Oregon State University 1,083 111 2,745 3,939 27%
Purdue University 953 976 4,354 6,283 15%
Texas A & M University 3,701 63 6,477 10,241 36%
University of California, Davis 3,021 562 1,539 5,122 59%
University of Illinois, Urbana-Champaign 2,649 1,171 3,509 7,329 36%
University of Tennessee, Knoxville 703 52 3,521 4,276 16%
Virginia Tech 1,175 202 3,987 5,364 22%
Washington State University 1,419 119 2,625 4,163 34%
Board of Governors’ Peer Group ComparisonNew First-Time Freshmen by Minority Status - Fall 2013
Source: Common Data Set, 2013-14
0% 25% 50% 75% 100%
Iowa State University
Purdue University
Kansas State University
University of Tennessee, Knoxville
North Carolina State University
Michigan State University
Virginia Tech
Oregon State University
Oklahoma State University
Washington State University
University of Illinois, Urbana-Champaign
Texas A & M University
University of California, Davis
Minority Students Non-Minority Students Non-Resident Alien Students
Colorado State University
Institutional ResearchFACT BOOK 2014-15
STUDENT INFORMATION29

New First-Time Freshmen
Board of Governors’ Peer Group Comparison - Fall 2013SAT and ACT Test Scores - 25th and 75th Percentile
SAT CriticalReading
SATMath
ACT Composite
ACTEnglish
ACT Math
Colorado State University 510-620 510-630 22-27 22-28 22-27
Iowa State University 460-620 530-680 22-28 21-28 22-28
Kansas State University 460-590 480-620 21-27 21-27 20-27
Michigan State University 420-580 550-690 23-28 23-29 22-27
North Carolina State University 560-640 590-680 26-30 25-31 26-30
Oklahoma State University 480-590 510-620 22-28 21-28 21-27
Oregon State University 480-600 290-620 21-27 20-27 21-27
Purdue University 520-630 560-690 24-30 23-31 25-32
Texas A & M University 520-630 550-660 23-29 22-29 24-29
University of California, Davis 510-640 570-700 24-30 23-30 25-31
University of Illinois, Urbana-Champaign 560-670 700-780 26-31 26-32 26-33
University of Tennessee, Knoxville 520-640 520-650 24-29 24-31 23-28
Virginia Tech 540-640 580-680 N/A N/A N/A
Washington State University 450-570 460-580 19-25 18-25 18-25
Source: Common Data Set, 2013-14Note: SAT and ACT scores are reported for first-time freshmen students enrolled in fall 2012 who submitted test scores to the institution where they enrolled.
Institutional ResearchFACT BOOK 2014-15STUDENT INFORMATION
30

New Undergraduate Transfer Students
History of New Undergraduate Transfer Student EnrollmentFall2005
Fall 2006
Fall2007
Fall2008
Fall2009
Fall2010
Fall2011
Fall2012
Fall2013
Fall2014
FA05 - FA14Change
Men 706 687 751 660 713 796 818 730 751 760 8%
Women 730 680 666 589 640 626 755 699 696 666 -9%
Full-Time 1,286 1,176 1,236 1,099 1,199 1,272 1,422 1,268 1,323 1,289 0%
Part-Time 150 191 181 150 154 150 151 161 124 137 -9%
Resident 1,097 1,044 1,090 978 1,127 1,157 1,190 1,098 1,076 1,021 -7%
Non-Resident 339 323 327 271 226 265 383 331 371 405 19%
Minority 177 173 200 156 151 181 217 223 228 228 29%
Non-Minority 1,259 1,194 1,217 1,093 1,202 1,241 1,356 1,206 1,219 1,198 -5%
Total Transfers 1,436 1,367 1,417 1,249 1,353 1,422 1,573 1,429 1,447 1,426 -1%
Note: Non-resident alien students are reported with non-minority students.
Fall 2005 to Fall 2014 Percent Change in New Transfer Students
-50%
-25%
0%
25%
50%
Men Women Full-Time Part-Time Resident Non-Resident Minority Non-Minority
Institutional ResearchFACT BOOK 2014-15
STUDENT INFORMATION 31

New Undergraduate Transfer Students
History of New Undergraduate Transfer Students by CollegeFall 2005
Fall 2006
Fall2007
Fall2008
Fall2009
Fall2010
Fall2011
Fall2012
Fall 2013
Fall2014
FA05 -FA14 Change
Agricultural Sciences 118 111 103 97 113 101 121 117 105 118 0%
Business 45 43 43 38 50 62 78 58 70 72 60%
Engineering 62 44 62 62 53 56 59 68 85 93 50%
Health & Human Sciences 270 286 272 257 274 222 254 231 257 244 -10%
Intra-University 326 286 315 309 339 388 344 324 280 265 -19%
Liberal Arts 278 282 287 233 273 280 350 280 269 267 -4%
Natural Sciences 214 195 206 150 130 173 229 229 262 211 -1%
Veterinary Med &Biomedical Sciences 31 37 37 23 27 26 15 26 21 36 16%
Warner College of Natural Resources 92 83 92 80 94 114 123 96 98 120 30%
University Total 1,436 1,367 1,417 1,249 1,353 1,422 1,573 1,429 1,447 1,426 -1%
Undergraduates
.
Fall 2005 to Fall 2014 Percent Change in New Transfer Students by College
-50%
0%
50%
100%
AgriculturalSciences
Business Engineering Health &Human Sci
Intra-University
LiberalArts
NaturalSciences
Vet Med &Bio Sci
Warner Collof Nat Res
Institutional ResearchFACT BOOK 2014-15STUDENT INFORMATION
32

New Undergraduate Transfer Students
Fall2005
Fall2006
Fall2007
Fall2008
Fall2009
Fall2010
Fall2011
Fall2012
Fall2013
Fall2014
Asian American 37 43 42 30 34 18 27 18 30 38
Black 26 27 37 30 16 18 13 14 24 31
Hawaiian/Pacific Islander N/A N/A N/A N/A N/A 1 4 2 0 5
Hispanic 86 84 84 75 79 103 120 140 130 127
Native American 28 19 37 21 22 5 6 5 5 24
Multi-Racial N/A N/A N/A N/A N/A 36 47 44 39 3
New MinorityTransfer Students 177 173 200 156 151 181 217 223 228 228
All New Transfer Students 1,436 1,367 1,417 1,249 1,353 1,422 1,573 1,429 1,447 1,426
New Minority Transfer Students as a Percent of All New Transfer Students
12.3% 12.7% 14.1% 12.5% 11.2% 12.7% 13.8% 15.6% 15.8% 16.0%
History of Ethnicity of Entering Transfer Students
Note: New federal ethnicity and race categories were implemented in the fall of 2010. Part of the increase in Hispanic students in fall 2010 was due to the change in ethnic categories requiring all students who are part Hispanic to be reported as Hispanic instead of with their other ethnic group. The addition of the Multi-Racial category may have decreased the number of students reported in the Asian American, Black and Native American categories. The number of Asian Americans may have decreased withthe addition of the Hawaiian/Pacific Islander category. Non-resident alien students are not reported in the minority categories.
0
50
100
150
200
250
Fall 2005 Fall 2008 Fall 2011 Fall 2014
Asian Students Black Students
Hawaiian/Pacific Islander Students Hispanic Students
Native American Students Multi-Racial Students
Institutional ResearchFACT BOOK 2014-15
STUDENT INFORMATION 33

New Undergraduate Transfer Students
Fall Term Applications Admits Enrolls Yield Rate
2005 2,391 2,042 1,436 70.3%
2006 2,305 1,963 1,367 69.6%
2007 2,388 2,013 1,417 70.4%
2008 2,203 1,828 1,249 68.3%
2009 3,068 1,924 1,353 70.3%
2010 2,472 2,021 1,420 70.3%
2011 3,447 2,278 1,573 69.1%
2012 3,347 2,081 1,429 68.7%
2013 3,352 2,167 1,447 66.8%
2014 3,240 2,133 1,426 66.9%
New Undergraduate Transfer Students
Applications, Admits and Enrolls Yield Rate
Note: The yield rate is calculated by dividing the number of enrolled students by the number of admitted students.
0
1,000
2,000
3,000
4,000
5,000
Fall 2005 Fall 2008 Fall 2011 Fall 2014
Applications
Admits
Enrolls
60%
65%
70%
75%
80%
F all 2 005 F all 2 008 F all 2 011 F all 2 014
Institutional ResearchFACT BOOK 2014-15STUDENT INFORMATION
34

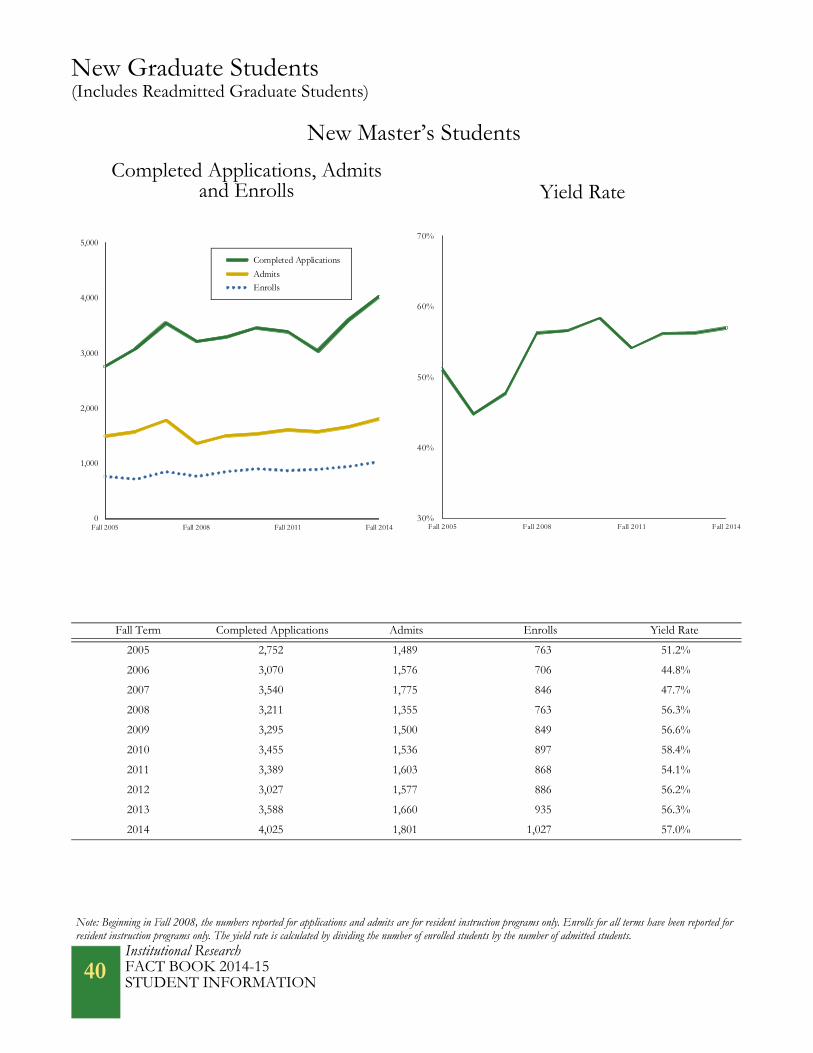
New Graduate Students (Includes Readmitted Graduate Students)
New Master’s Students
Number of New Master’s Students 1,027Percent of Admitted Students Who Enroll 57.0%Mean GRE Verbal Score Reported on Previous Scale 521.2Mean GRE Verbal Score Reported on New Scale 153.5Mean GRE Quantitative Score Reported on Previous Scale 673.1Mean GRE Quantitative Score Reported on New Scale 154.6
New Doctoral Students
Number of New Doctoral Students 205Percent of Admitted Students Who Enroll 52.4%Mean GRE Verbal Score Reported on Previous Scale 544.4Mean GRE Verbal Score Reported on New Scale 155.7Mean GRE Quantitative Score Reported on Previous Scale 681.5Mean GRE Quantitative Score Reported on New Scale 157.1
New Graduate Student Profile
By Gender By Minority Status
Note: On August 1, 2011 GRE test scores changed from a 200-800 scale to a 130-170 scale. For additional information on new and readmitted graduate students, please refer to the student enrollment section on the Institutional Research website at www.ir.colostate.edu/enrollment.aspx.
Men50%
Women50%
Minority11%
Non-Minority89%
Total New Graduate Students = 1,232
Non-Residents60%
ColoradoResidents
40%
By Residency
Institutional ResearchFACT BOOK 2014-15
STUDENT INFORMATION35

New Graduate Students(Includes Readmitted Graduate Students)
History of New Master’s Students by CollegeFall2005
Fall2006
Fall2007
Fall2008
Fall2009
Fall2010
Fall2011
Fall2012
Fall2013
Fall2014
FA05 - FA14Change
Agricultural Sciences 44 34 47 46 49 57 49 54 39 57 30%
Business 55 62 86 90 121 115 160 130 147 180 227%
Engineering 87 75 99 72 82 118 106 112 145 155 78%
Health & HumanSciences 216 195 211 178 210 177 159 173 153 154 -29%
Intra-University 16 15 17 11 21 14 22 21 15 11 -31%
Liberal Arts 154 154 185 175 177 192 164 183 165 172 12%
Natural Sciences 66 64 62 55 39 49 43 51 68 80 21%
Veterinary Medicine & Bio Sciences 70 60 106 96 108 115 126 99 115 139 99%
Warner College ofNatural Resources 51 43 33 40 42 60 39 63 88 79 55%
University Total 759 702 846 763 849 897 868 886 935 1,027 35%
Fall 2005 to Fall 2014 Percent Change in New Master’s Students by College
-50%
0%
50%
100%
150%
200%
250%
AgriculturalSciences
Business Engineering Health &Human Sci
Intra-University
LiberalArts
NaturalSciences
Vet Med &Bio Sci
Warner Collof Nat Res
Institutional ResearchFACT BOOK 2014-15STUDENT INFORMATION
36
New Graduate Students(Includes Readmitted Graduate Students)
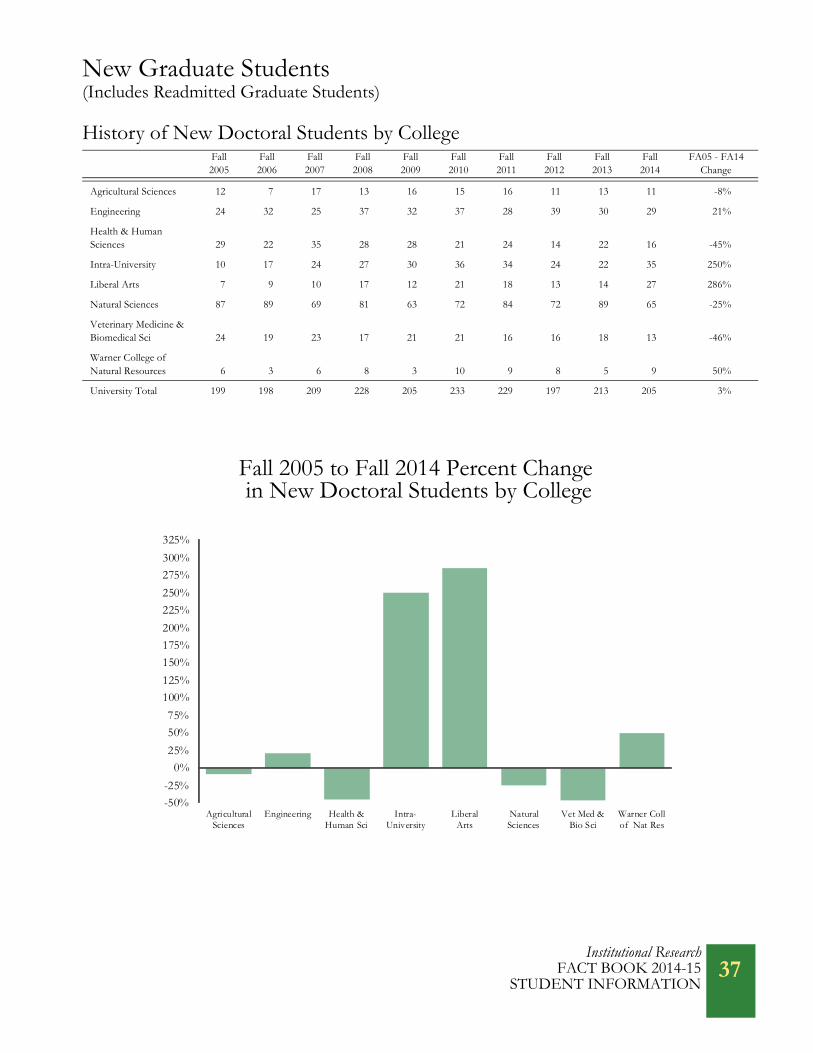
History of New Doctoral Students by CollegeFall2005
Fall2006
Fall2007
Fall2008
Fall2009
Fall2010
Fall2011
Fall2012
Fall2013
Fall2014
FA05 - FA14Change
Agricultural Sciences 12 7 17 13 16 15 16 11 13 11 -8%
Engineering 24 32 25 37 32 37 28 39 30 29 21%
Health & HumanSciences 29 22 35 28 28 21 24 14 22 16 -45%
Intra-University 10 17 24 27 30 36 34 24 22 35 250%
Liberal Arts 7 9 10 17 12 21 18 13 14 27 286%
Natural Sciences 87 89 69 81 63 72 84 72 89 65 -25%
Veterinary Medicine & Biomedical Sci 24 19 23 17 21 21 16 16 18 13 -46%
Warner College ofNatural Resources 6 3 6 8 3 10 9 8 5 9 50%
University Total 199 198 209 228 205 233 229 197 213 205 3%
Fall 2005 to Fall 2014 Percent Change in New Doctoral Students by College
-50%
-25%
0%
25%
50%
75%
100%
125%
150%
175%
200%
225%
250%
275%
300%
325%
AgriculturalSciences
Engineering Health &Human Sci
Intra-University
LiberalArts
NaturalSciences
Vet Med &Bio Sci
Warner Collof Nat Res
Institutional ResearchFACT BOOK 2014-15
STUDENT INFORMATION37

New Graduate Students(Includes Readmitted Graduate Students)
Fall2005
Fall2006
Fall2007
Fall2008
Fall2009
Fall2010
Fall2011
Fall2012
Fall2013
Fall2014
Asian American 21 16 20 34 23 15 12 17 20 23
Black 8 8 7 10 7 9 12 8 14 18
Hawaiian/Pacific Islander N/A N/A N/A N/A N/A 2 1 0 0 0
Hispanic 30 34 34 35 46 55 50 45 38 51
Native American 9 4 8 13 11 1 4 4 4 2
Multi-Racial N/A N/A N/A N/A N/A 11 18 17 21 20
New Minority Master’sStudents 68 62 69 92 87 93 97 91 97 114
All New Master’s Students 759 702 846 763 849 897 868 886 935 1,027
New Minority Master’s Students as a Percent of All New Master’s Students
9.0% 8.8% 8.2% 12.1% 10.2% 10.4% 11.2% 10.3% 10.4% 11.1%
History of Ethnicity of Entering Master’s Students
Note: New federal ethnicity and race categories were implemented in the fall of 2010. Part of the increase in Hispanic students in fall 2010 was due to the change in ethnic categories requiring all students who are part Hispanic to be reported as Hispanic instead of with their other ethnic group. The addition of the Multi-Racial category may have decreased the number of students reported in the Asian American and Native American categories. The number of Asian American students may have decreased with the addition of the Hawaiian/Pacific Islander category. Non-resident alien students are not reported in the minority categories.
0
50
100
150
Fall 2005 Fall 2008 Fall 2011 Fall 2014
Asian Students Black Students
Hawaiian/Pacific Islander Students Hispanic Students
Native American Students Multi-Racial Students
Institutional ResearchFACT BOOK 2014-15STUDENT INFORMATION
38
New Graduate Students(Includes Readmitted Graduate Students)
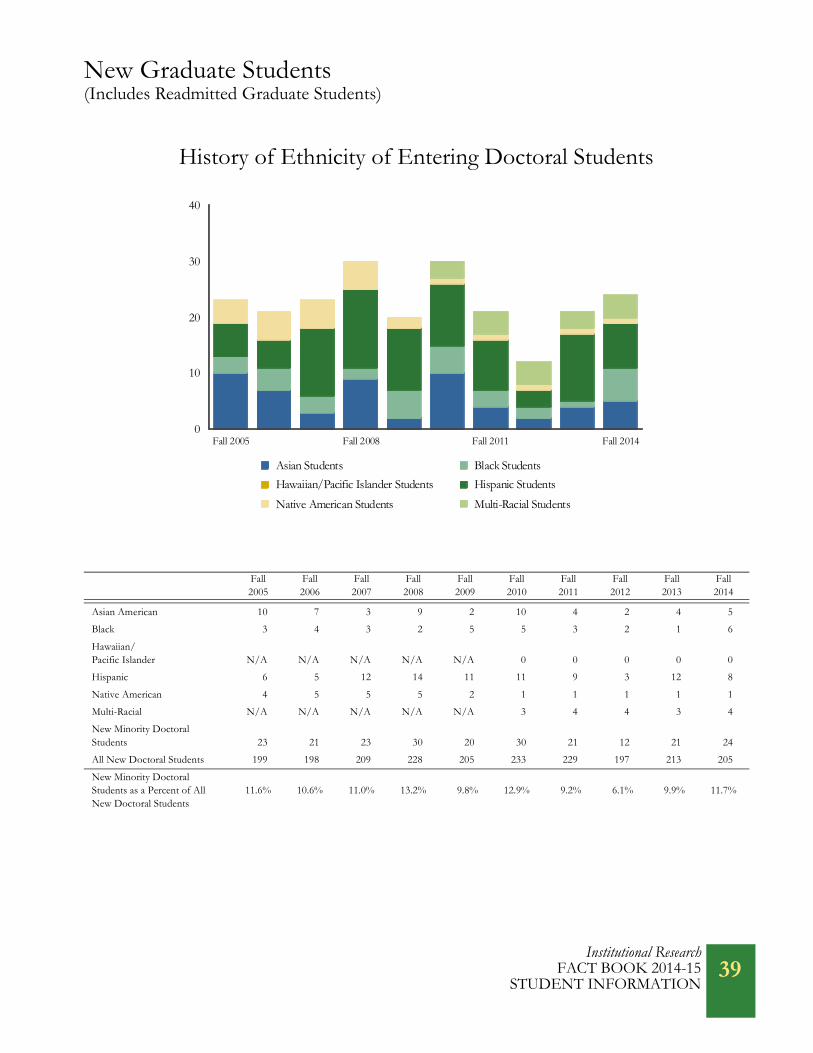
Fall2005
Fall2006
Fall2007
Fall2008
Fall2009
Fall2010
Fall2011
Fall2012
Fall2013
Fall2014
Asian American 10 7 3 9 2 10 4 2 4 5
Black 3 4 3 2 5 5 3 2 1 6
Hawaiian/Pacific Islander N/A N/A N/A N/A N/A 0 0 0 0 0
Hispanic 6 5 12 14 11 11 9 3 12 8
Native American 4 5 5 5 2 1 1 1 1 1
Multi-Racial N/A N/A N/A N/A N/A 3 4 4 3 4
New Minority DoctoralStudents 23 21 23 30 20 30 21 12 21 24
All New Doctoral Students 199 198 209 228 205 233 229 197 213 205
New Minority Doctoral Students as a Percent of All New Doctoral Students
11.6% 10.6% 11.0% 13.2% 9.8% 12.9% 9.2% 6.1% 9.9% 11.7%
History of Ethnicity of Entering Doctoral Students
0
10
20
30
40
Fall 2005 Fall 2008 Fall 2011 Fall 2014
Asian Students Black Students
Hawaiian/Pacific Islander Students Hispanic Students
Native American Students Multi-Racial Students
Institutional ResearchFACT BOOK 2014-15
STUDENT INFORMATION39
New Graduate Students(Includes Readmitted Graduate Students)
Fall Term Completed Applications Admits Enrolls Yield Rate
2005 2,752 1,489 763 51.2%
2006 3,070 1,576 706 44.8%
2007 3,540 1,775 846 47.7%
2008 3,211 1,355 763 56.3%
2009 3,295 1,500 849 56.6%
2010 3,455 1,536 897 58.4%
2011 3,389 1,603 868 54.1%
2012 3,027 1,577 886 56.2%
2013 3,588 1,660 935 56.3%
2014 4,025 1,801 1,027 57.0%
New Master’s Students
Note: Beginning in Fall 2008, the numbers reported for applications and admits are for resident instruction programs only. Enrolls for all terms have been reported for resident instruction programs only. The yield rate is calculated by dividing the number of enrolled students by the number of admitted students.
Completed Applications, Admitsand Enrolls Yield Rate
0
1,000
2,000
3,000
4,000
5,000
Fall 2005 Fall 2008 Fall 2011 Fall 2014
Completed Applications
Admits
Enrolls
30%
40%
50%
60%
70%
Fall 2005 Fall 2008 Fall 2011 Fall 2014
Institutional ResearchFACT BOOK 2014-15STUDENT INFORMATION
40

New Graduate Students(Includes Readmitted Graduate Students)
Fall Term Completed Applications Admits Enrolls Yield Rate
2005 1,212 423 195 46.1%
2006 1,377 393 194 49.4%
2007 1,526 433 209 48.3%
2008 1,783 437 228 52.2%
2009 1,595 412 205 49.8%
2010 1,487 482 233 48.3%
2011 1,308 428 229 53.5%
2012 1,475 309 197 63.8%
2013 1,053 368 213 57.9%
2014 1,068 391 202 51.7%
New Doctoral Students
Completed Applications, Admitsand Enrolls Yield Rate
0
500
1,000
1,500
2,000
2,500
Fall 2005 Fall 2008 Fall 2011 Fall 2014
Completed Applications
Admits
Enrolls
30%
40%
50%
60%
70%
Fall 2005 Fall 2008 Fall 2011 Fall 2014
Institutional ResearchFACT BOOK 2014-15
STUDENT INFORMATION41

New Graduate Students(Includes Readmitted Graduate Students)
Fall Term Master’s Students Doctoral Students Total Students
2005 63 42 105
2006 49 41 90
2007 88 42 130
2008 60 43 103
2009 68 53 121
2010 111 54 165
2011 106 53 159
2012 127 44 171
2013 176 40 216
2014 224 42 266
History of New International Graduate Students by Level
0
50
100
150
200
Fall 2005 Fall 2008 Fall 2011 Fall 2014
Master's Level
Doctoral Level
Institutional ResearchFACT BOOK 2014-15STUDENT INFORMATION
42

Students by Ethnicity
Undergraduate Students
GraduateStudents
PVM Students
TotalStudents
Non-Hispanic/Latino
Asian American 500 74 35 609
Black 517 51 1 569
Hawaiian/Pacific Islander 26 0 1 27
Multi-Racial 637 71 18 726
Native American 121 14 4 139
Hispanic 2,340 180 40 2,560
Total Minority Students 4,141 390 99 4,630
Non-Hispanic White 16,603 2,410 393 19,406
No Response 877 276 38 1,191
Non-Resident Aliens 885 971 3 1,859
University Total 22,506 4,047 533 27,086
Note: New federal ethnicity and race categories were implemented in the fall of 2010. For additional information on student ethnicity, please refer to the student enroll-ment section on the Institutional Research website at www.ir.colostate.edu/enrollment.aspx.
Total Students = 27,086
Students by Ethnicity
Native American 3%
Black 12%
Hispanic 55%
Asian American 13%
Hawaiian/
Multi-Racial 16%
Pacific Islander 1%
Minority Students17%
Non-Minority Students83%
Institutional ResearchFACT BOOK 2014-15
STUDENT INFORMATION 43

Students by Ethnicity
Undergraduate Students by Ethnicity and CollegeAsian
American BlackHawaiian
Pac Islander HispanicMulti-Racial
NativeAmerican
MinorityTotal White
Non-ResAlien
NoResponse Total
Agricultural Sciences
12 11 3 107 39 9 181 1,109 27 45 1,362
Business 49 28 2 194 47 7 327 1,643 101 92 2,163
Engineering 45 16 2 155 51 12 281 1,760 122 122 2,285
Health & HumanSciences
89 115 3 497 126 22 852 3,165 37 148 4,202
Intra-University 65 89 4 318 44 17 537 1,607 372 43 2,559
Liberal Arts 73 146 5 479 153 23 879 3,050 98 182 4,209
Natural Sciences 128 90 5 418 123 20 784 2,608 101 148 3,641
Vet Medicine &Biomedical Sci
21 13 0 63 14 2 113 456 15 41 625
Warner College of Natural Res
18 9 2 109 40 9 187 1,205 12 56 1,460
University Total 500 517 26 2,340 637 121 4,141 16,603 885 877 22,506
Undergraduate Minority Students by College
Note: The ethnic categories of Asian, Black, Hawaiian/Pacific Islander, Multi-Racial and White include only non-Hispanics.
0% 25% 50% 75% 100%
Engineering
Warner College of Natural Resources
Agricultural Sciences
Business
Veterinary Medicine & Biomedical Sciences
Health & Human Sciences
Liberal Arts
Intra-University
Natural Sciences
Minority Students Non-Minority Students Non-Resident Alien Students
Institutional ResearchFACT BOOK 2014-15STUDENT INFORMATION
44

Students by Ethnicity
Graduate Students by Ethnicity and CollegeAsian
American BlackHawaiianPac Island Hispanic
Multi-Racial
NativeAmerican
MinorityTotal White
Non-ResAlien
NoResponse Total
AgriculturalSciences
0 2 0 9 2 1 14 157 64 13 248
Business 5 7 0 8 6 2 28 161 110 15 314
Engineering 12 3 0 19 10 0 44 284 350 49 727
Health & HumanSciences
11 20 0 54 16 5 106 451 39 34 630
Intra-University 6 4 0 8 2 0 20 179 118 32 349
Liberal Arts 6 6 0 30 12 1 55 414 68 40 577
Natural Sciences 19 1 0 29 14 0 63 371 166 41 641
Vet Medicine &Biomedical Sci
13 6 0 16 4 5 44 212 32 28 316
Warner College ofNatural Resources
2 2 0 7 5 0 16 181 24 24 245
University Total 74 51 0 180 71 14 390 2,410 971 276 4,047
Graduate Minority Students by College
0% 25% 50% 75% 100%
Agricultural Sciences
Intra-University
Engineering
Warner College of Natural Resources
Business
Liberal Arts
Natural Sciences
Veterinary Medicine & Biomedical Sciences
Health & Human Sciences
Minority Students Non-Minority Students Non-Resident Alien Students
Institutional ResearchFACT BOOK 2014-15
STUDENT INFORMATION 45

Students by Ethnicity
History of Students by Minority Status
Minority Undergraduate Students as a Percent of Total Undergraduate Enrollment by College
Fall Term Minority Students Non-Minority Students
2005 11.8% 88.2%
2006 12.2% 87.8%
2007 12.7% 87.3%
2008 12.9% 87.1%
2009 13.1% 86.9%
2010 13.8% 86.2%
2011 14.6% 85.4%
2012 15.6% 84.4%
2013 16.4% 83.6%
2014 17.1% 82.9%
Fall 2005
Fall2006
Fall2007
Fall2008
Fall2009
Fall2010
Fall2011
Fall2012
Fall2013
Fall2014
Fall 2005 to Fall 2014
Point Change
Agricultural Sciences 7.3% 6.7% 8.7% 9.7% 9.1% 8.8% 11.8% 11.0% 12.9% 13.3% 6.0
Business 10.6% 11.5% 11.6% 11.5% 11.9% 12.4% 13.0% 13.3% 14.1% 15.1% 4.5
Engineering 9.5% 10.2% 10.1% 11.3% 11.6% 12.3% 15.7% 11.6% 11.9% 12.3% 2.8
Health & Human Sci 11.9% 11.9% 12.5% 12.2% 13.5% 13.5% 15.6% 17.0% 18.3% 20.3% 8.4
Intra-University 14.4% 15.2% 15.7% 15.6% 14.7% 17.2% 19.0% 21.3% 21.6% 21.0% 6.6
Liberal Arts 13.9% 14.1% 14.6% 14.8% 15.5% 16.2% 16.8% 18.1% 19.5% 20.9% 7.0
Natural Sciences 15.0% 15.5% 16.2% 15.7% 16.1% 16.9% 18.1% 19.4% 21.2% 21.5% 6.5
Veterinary Med &Biomedical Sciences 14.7% 16.9% 17.5% 17.7% 16.2% 13.9% 14.1% 16.9% 17.2% 18.1% 3.4
Warner College ofNatural Resources 7.7% 8.4% 7.8% 7.2% 7.0% 8.0% 9.9% 9.5% 10.3% 12.8% 5.1
University Summary 12.5% 12.9% 13.4% 13.4% 13.7% 14.3% 15.3% 16.5% 17.5% 18.4% 5.9
Note: Non-resident alien students are reported with non-minority students.
Institutional ResearchFACT BOOK 2014-15STUDENT INFORMATION
46

Students by Ethnicity
Fall2005
Fall2006
Fall2007
Fall2008
Fall2009
Fall2010
Fall2011
Fall2012
Fall2013
Fall2014
Asian 726 755 767 772 763 481 468 468 528 609
Black 484 474 503 534 580 457 508 515 511 569
Hawaiian/PacificIslander N/A N/A N/A N/A N/A 46 42 36 22 27
Hispanic 1,396 1,428 1,532 1,517 1,595 1,881 2,066 2,254 2,401 2,560
Multi-Racial N/A N/A N/A N/A N/A 656 718 808 873 726
Native American 344 359 376 391 401 110 108 104 96 139
Total Minority Students 2,950 3,016 3,178 3,214 3,339 3,631 3,910 4,185 4,431 4,630
All Students 24,947 24,670 24,983 25,011 25,413 26,356 26,735 26,769 27,034 27,086
Minority Students as aPercentage of the AllStudents
11.8% 12.2% 12.7% 12.9% 13.1% 13.8% 14.6% 15.6% 16.4% 17.1%
History of Total Minority Student Enrollment
Note: New federal ethnicity and race categories were implemented in the fall of 2010. Part of the increase in Hispanic students in fall 2010 was due to the change in ethnic categories requiring all students who are part Hispanic to be reported as Hispanic instead of with their other ethnic group. The addition of the Multi-Racial category may have decreased the number of students reported in the Asian American, Black and Native American categories. The number of Asian American students may have decreased with the addition of the Hawaiian/Pacific Islander category. Non-resident alien students are not reported in the minority categories.
0
2,000
4,000
6,000
Fall 2005 Fall 2008 Fall 2011 Fall 2014
Asian Students Black Students
Hawaiian/Pacific Islander Students Hispanic Students
Multi-Racial Students Native American Students
Institutional ResearchFACT BOOK 2014-15
STUDENT INFORMATION 47

Students by Ethnicity
UndergraduateMinorityStudents
Percent of Undergraduate
Minority Students
UndergraduateNon-Minority
Students
UndergraduateNon-ResidentAlien Students
TotalUndergraduate
Students
Colorado State University 3,947 18% 17,936 682 22,565
Iowa State University 3,189 12% 22,080 1,843 27,112
Kansas State University 2,863 15% 15,634 1,150 19,647
Michigan State University 6,489 17% 26,611 4,525 37,625
North Carolina State University 4,609 20% 17,775 613 22,997
Oklahoma State University 4,913 24% 14,771 576 20,260
Oregon State University 4,951 22% 16,122 1,280 22,353
Purdue University 4,187 14% 20,094 4,935 29,216
Texas A & M University 13,443 31% 29,916 571 43,930
University of California, Davis 16,033 61% 8,814 1,636 26,483
University of Illinois, Urbana-Champaign 10,040 32% 16,994 4,629 31,663
University of Tennessee, Knoxville 3,356 16% 17,275 317 20,948
Virginia Tech 5,123 21% 17,891 914 23,928
Washington State University 6,192 27% 15,661 972 22,825
Ethnic Minorities as a Percent of Undergraduate PopulationBoard of Governors’ Peer Group Comparison
Fall 2013
Source: Common Data Set, 2013-14
0% 25% 50% 75% 100%
Iowa State University
Purdue University
Kansas State University
University of Tennessee, Knoxville
Michigan University
North Carolina State University
Virginia Tech
Oregon State University
Oklahoma State University
Washington State University
Texas A & M University
University of Illinois, Urbana-Champaign
University of California, Davis
Minority Students Non-Minority Students Non-Resident Alien Students
Colorado State University
Institutional ResearchFACT BOOK 2014-15STUDENT INFORMATION
48

Students by Gender
Undergraduate Students by Gender and College Numberof Men
Men as a Percent of Undergraduates
Numberof Women
Women as a Percent of Undergraduates
Total Undergraduates
Agricultural Sciences 473 35% 889 65% 1,362
Business 1,300 60% 863 40% 2,163
Engineering 1,766 77% 519 23% 2,285
Health & Human Sciences 1,484 35% 2,718 65% 4,202
Intra-University 1,493 58% 1,066 42% 2,559
Liberal Arts 1,860 44% 2,349 56% 4,209
Natural Sciences 1,599 44% 2,042 56% 3,641
Veterinary Medicine & Biomedical Sciences 207 33% 418 67% 625
Warner College of Natural Resources 846 58% 614 42% 1,460
University Summary 11,208 49% 11,478 51% 22,506
Undergraduate Students by Gender and College
Note: For additional information on students by gender, please refer to the student enrollment section on the Institutional Research website at www.ir.colostate.edu/enrollment.aspx.
0% 25% 50% 75% 100%
Engineering
Business
Intra-University
Warner College of Natural Resources
Liberal Arts
Natural Sciences
Agricultural Sciences
Health & Human Sciences
Veterinary Medicine & Biomedical Sciences
Women Men
Institutional ResearchFACT BOOK 2014-15
STUDENT INFORMATION 49
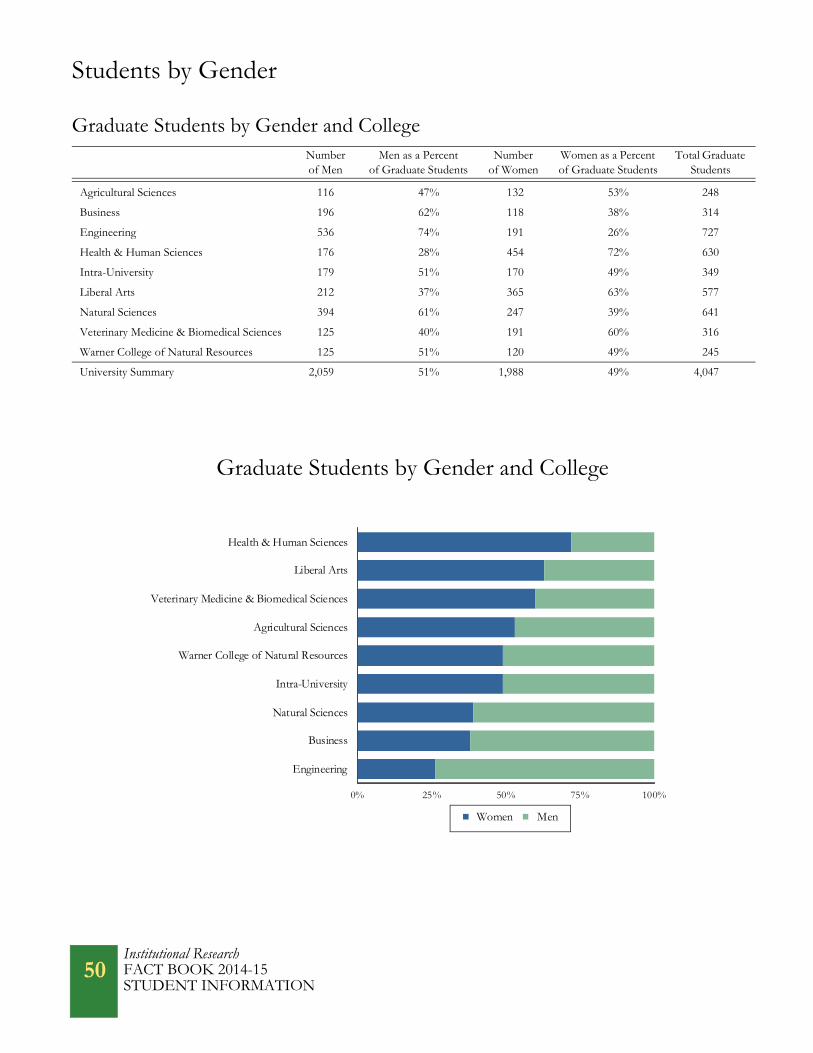
Students by Gender
Graduate Students by Gender and College Numberof Men
Men as a Percent of Graduate Students
Numberof Women
Women as a Percent of Graduate Students
Total Graduate Students
Agricultural Sciences 116 47% 132 53% 248
Business 196 62% 118 38% 314
Engineering 536 74% 191 26% 727
Health & Human Sciences 176 28% 454 72% 630
Intra-University 179 51% 170 49% 349
Liberal Arts 212 37% 365 63% 577
Natural Sciences 394 61% 247 39% 641
Veterinary Medicine & Biomedical Sciences 125 40% 191 60% 316
Warner College of Natural Resources 125 51% 120 49% 245
University Summary 2,059 51% 1,988 49% 4,047
Graduate Students by Gender and College
0% 25% 50% 75% 100%
Engineering
Business
Natural Sciences
Intra-University
Warner College of Natural Resources
Agricultural Sciences
Veterinary Medicine & Biomedical Sciences
Liberal Arts
Health & Human Sciences
Women Men
Institutional ResearchFACT BOOK 2014-15STUDENT INFORMATION
50

Students by Gender
History of Students by GenderUndergraduate Students Graduate Students PVM Students
Fall Term Men Women % Women Men Women % Women Men Women % Women
2005 10,028 10,692 51.6% 1,804 1,886 51.1% 108 429 79.9%
2006 9,843 10,657 52.0% 1,795 1,841 50.6% 110 424 79.4%
2007 10,047 10,718 51.6% 1,790 1,889 51.3% 115 424 78.7%
2008 10,049 10,780 51.8% 1,760 1,895 51.8% 130 397 75.3%
2009 10,308 10,896 51.4% 1,766 1,905 51.9% 130 408 75.8%
2010 10,778 11,175 50.9% 1,937 1,927 50.0% 115 424 78.7%
2011 10,890 11,410 51.2% 1,922 1,965 50.6% 111 437 79.7%
2012 10,983 11,429 51.0% 1,849 1,959 51.4% 108 441 80.3%
2013 11,067 11,498 51.0% 1,949 1,978 50.4% 109 433 79.9%
2014 11,028 11,478 51.0% 2,059 1,988 49.1% 108 425 79.7%
Students by Gender
Undergraduate Students Graduate Students
Professional Veterinary Medicine Students
9,000
10,000
11,000
12,000
Fall 2005 Fall 2008 Fall 2011 Fall 2014
Men
Women
1,650
1,750
1,850
1,950
2,050
2,150
Fall 2005 Fall 2008 Fall 2011 Fall 2014
Men
Women
0
100
200
300
400
500
Fall 2005 Fall 2008 Fall 2011 Fall 2014
Men
Women
Institutional ResearchFACT BOOK 2014-15
STUDENT INFORMATION 51

Students by Gender
Number ofUndergraduate
Women
Women Undergraduates as a Percent of Total
Undergraduates
Numberof Undergraduate
Men
TotalUndergraduate
Students
Colorado State University 11,498 51% 11,067 22,565
Iowa State University 11,780 43% 15,332 27,112
Kansas State University 9,364 48% 10,283 19,647
Michigan State University 18,871 50% 18,754 37,625
North Carolina State University 10,038 44% 12,939 22,977
Oklahoma State University 9,912 49% 10,348 20,260
Oregon State University 10,338 46% 12,015 22,353
Purdue University 12,490 43% 16,726 29,216
Texas A & M University 21,007 48% 22,923 43,930
University of California, Davis 14,923 56% 11,560 26,483
University of Illinois, Urbana-Champaign 13,870 44% 17,793 31,663
University of Tennessee, Knoxville 10,311 49% 10,637 20,948
Virginia Tech 9,893 41% 14,035 23,928
Washington State University 11,552 51% 11,273 22,825
Board of Governors’ Peer Group Comparison
Source: Common Data Set, 2013-14
Fall 2013Undergraduate Students by Gender
0% 25% 50% 75% 100%
Virginia Tech
Purdue University
Iowa State University
University of Illinois, Urbana-Champaign
North Carolina State University
Oregon State University
Texas A & M University
Kansas State University
University of Tennessee, Knoxville
Oklahoma State University
Michigan State University
Washington State University
University of California, Davis
Women Men
Colorado State University
Institutional ResearchFACT BOOK 2014-15STUDENT INFORMATION
52

Institutional ResearchFACT BOOK 2014-15
STUDENT INFORMATION 53
Students by Geographical Area
CT 47DC 5DE 7MA 74MD 60NH 34NJ 68RI 6VT 14WV 2
Total Undergraduate Students = 22,506
APO 10FPO 7Guam 2Puerto Rico 2Unknown 91
State of Residence for Undergraduate Students
ME11
GA25
TN 25
WY66
AK99
NM167
AZ143
CO17,406
UT54
SD35
HI108
WA147
OR64
CA872
MT35
ID50
NV68
TX395
NE60
KS74 KY 8
SC 13OK34
WI83
NY65
IA26
ND20 MN
138
MI65
IL387
PA76
VA81MO
94
MS3
IN50
AL7
LA9
AR18
OH60
FL70
NC29
Note: For additional information on students by geographic area, please refer to the student enrollment section on the Institutional Research website at www.ir.colos-tate.edu/enrollment.aspx.

Students by Geographical Area
Undergraduate Students
California 872
Texas 395
Illinois 387
New Mexico 167
Washington 147
Arizona 143
Minnesota 138
Hawaii 108
Alaska 99
Missouri 94
Wisconsin 83
Virginia 81
Pennsylvania 76
Massachusetts 74
All Other States 1,403
Total Non-Resident Undergraduate Students 4,267
0 200 400 600 800
Massachusetts
Pennsylvania
Virginia
Wisconsin
Missouri
Alaska
Hawaii
Minnesota
Arizona
Washington
New Mexico
Illinois
Texas
California
Top States for Non-Resident Undergraduates
Note: Non-resident alien students are excluded.
Institutional ResearchFACT BOOK 2014-15STUDENT INFORMATION
54

Students by Geographical Area
UndergraduateStudents
GraduateStudents
TotalStudents
China 322 230 552
India 6 286 292
Saudi Arabia 113 48 161
Brazil 89 10 99
Vietnam 46 19 65
Oman 55 3 58
South Korea 24 27 51
Libya 2 47 49
Iran 1 42 43
Kuwait 24 3 27
Thailand 1 25 26
Pakistan 12 9 21
Australia 17 2 19
United Kingdom 15 4 19
76 Other Countries 158 219 377
Total Non-Resident Alien Students 885 974 1,859
Top Countries of Origin for Non-Resident Alien Students
Note: The Graduate Students, Total Students, and Other Countries include 3 PVM students.
0 100 200 300 400 500 600
Australia
United Kingdom
Pakistan
Thailand
Kuwait
Iran
Libya
South Korea
Oman
Vietnam
Brazil
Saudi Arabia
India
China
Undergraduate Students
Graduate Students
Institutional ResearchFACT BOOK 2014-15
STUDENT INFORMATION 55

Students by Geographical Area
History of Non-Resident Alien Undergraduate Student Enrollment by College
Fall2005
Fall2006
Fall2007
Fall2008
Fall2009
Fall2010
Fall2011
Fall2012
Fall2013
Fall2014
FA05 - FA14Change
Agricultural Sciences 10 7 7 10 8 10 13 14 17 27 170%
Business 21 30 33 32 57 73 66 83 95 101 381%
Engineering 46 66 91 89 99 117 101 95 112 122 165%
Health & Human Sciences 16 19 26 26 21 19 21 24 26 37 131%
Intra-University 72 58 98 102 83 98 125 153 226 372 417%
Liberal Arts 38 38 31 37 28 39 66 63 87 98 158%
Natural Sciences 29 39 44 59 54 64 79 85 92 101 248%
Veterinary Medicine &Biomedical Sciences 7 6 9 14 9 15 11 11 14 15 114%
Warner College ofNatural Resources 5 6 4 2 2 9 7 11 13 12 140%
University Summary 244 269 343 371 361 444 489 539 682 885 263%
Fall 2005 to Fall 2014 Percent Change in Non-Resident AlienUndergraduate Students by College
0%
100%
200%
300%
400%
500%
AgriculturalSciences
Business Engineering Health &Human Sci
Intra-University
LiberalArts
NaturalSciences
Vet Med &Bio Sci
Warner Collof Nat Res
Institutional ResearchFACT BOOK 2014-15STUDENT INFORMATION
56

Students by Geographical Area
History of Non-Resident Alien Graduate Student Enrollment by College
Fall2005
Fall2006
Fall2007
Fall2008
Fall2009
Fall2010
Fall2011
Fall2012
Fall2013
Fall2014
FA05 - FA14Change
Agricultural Sciences 25 27 37 34 37 50 52 52 56 64 156%
Business 21 10 26 33 48 52 45 55 79 110 424%
Engineering 172 168 171 162 164 192 212 226 290 350 103%
Health & Human Sciences 37 34 35 37 46 47 41 41 39 39 5%
Intra-University 21 19 21 21 21 20 29 40 79 118 462%
Liberal Arts 69 61 57 56 53 59 64 64 64 68 -1%
Natural Sciences 161 142 133 114 109 115 140 139 156 166 3%
Veterinary Medicine &Biomedical Science 47 37 41 37 39 37 38 40 36 32 -32%
Warner College ofNatural Resources 21 19 19 17 11 21 22 28 22 24 14%
University Summary 574 517 540 511 528 593 643 685 821 971 69%
Fall 2005 to Fall 2014 Percent Change in Non-Resident AlienGraduate Students by College
-50%
0%
50%
100%
150%
200%
250%
300%
350%
400%
450%
500%
AgriculturalSciences
Business Engineering Health &Human Sci
Intra-University
LiberalArts
NaturalSciences
Vet Med &Bio Sci
Warner Collof Nat Res
Institutional ResearchFACT BOOK 2014-15
STUDENT INFORMATION 57

Students by Geographical Area
Total Non-Resident Alien Students
TotalStudents
Non-Resident Alien Students as a Percent of the Total Student Population
Colorado State University 1,506 27,034 6%
Iowa State University 3,797 33,241 11%
Kansas State University 2,106 24,581 9%
North Carolina State University 3,349 34,009 10%
Oklahoma State University 1,941 25,939 7%
Oregon State University 2,859 27,925 10%
Purdue University 8,702 38,788 22%
Texas A & M University 4,605 52,449 9%
University of Tennessee, Knoxville 1,218 27,171 5%
Virginia Tech 2,730 29,071 9%
Washington State University 1,874 27,642 7%
Source: Common Data Set, 2013-14
Board of Governors’ Peer ComparisonInternational Students as a Percent of All Students - Fall 2013
0% 10% 20% 30%
University of Tennessee, Knoxville
Washington State University
Oklahoma State University
Virginia Tech
Texas A & M University
Kansas State University
Oregon State University
North Carolina State University
Iowa State University
Purdue University
Colorado State University
Institutional ResearchFACT BOOK 2014-15STUDENT INFORMATION
58

Students by Registration Type
ResidentStudents
Non-ResidentStudents
Residents as a Percent of Students
Total Students
Undergraduate Students
New Freshmen 3,154 1,199 72% 4,353
Transfer Students 1,021 405 72% 1,426
Readmitted Students 267 40 87% 307
Continuing Students 12,881 3,257 80% 16,138
Non-Degree Students 83 199 29% 282
Undergraduate Student Total 17,406 5,100 77% 22,506
Graduate Students
New and Readmitted Students 497 735 40% 1,232
Continuing Students 1,965 770 72% 2,735
Non-Degree Students 4 76 5% 80
Graduate Student Total 2,466 1,581 61% 4,047
Professional Veterinary MedicineStudents 290 243 54% 533
University Total 20,162 6,924 74% 27,086
Continuing Undergraduate Students 60%
New Freshmen16%
New and Readmitted
New Transfer Students5%
PVM Students 2%
Readmitted UndergraduateStudents 1%
Continuing Graduate
Graduate Students 5%
Students 10%
Non-Degree Students1%
Note: For additional information on students by registration type, please refer to the student enrollment section on the Institutional Research website at www.ir.colos-tate.edu/enrollment.aspx.
Students by Registration Type
Total Students = 27,086
Institutional ResearchFACT BOOK 2014-15
STUDENT INFORMATION 59

Students by Registration Type
Undergraduate Registration Type by College
History of Undergraduates by Registration Type
NewFreshmen Transfer Readmits Continuing
Non-Degree
TotalStudents
Agricultural Sciences 265 118 18 961 0 1,362
Business 324 72 12 1,755 0 2,163
Engineering 520 93 22 1,650 0 2,285
Health & Human Sciences 572 244 51 3,303 32 4,202
Intra-University 1,130 265 38 876 250 2,559
Liberal Arts 472 267 72 3,398 0 4,209
Natural Sciences 790 211 62 2,578 0 3,641
Veterinary Medicine & Biomedical Sciences 116 36 9 464 0 625
Warner College of Natural Resources 164 120 23 1,153 0 1,460
University Total 4,353 1,426 307 16,138 282 22,506
Fall2005
Fall2006
Fall2007
Fall2008
Fall2009
Fall2010
Fall2011
Fall2012
Fall2013
Fall2014
FA05 - FA14 Change
NewFreshmen 3,893 4,093 4,392 4,404 4,285 4,472 4,504 4,544 4,443 4,353 12%
TransferStudents 1,436 1,367 1,417 1,249 1,353 1,422 1,573 1,429 1,447 1,426 -1%
Readmits 464 396 393 447 535 372 426 378 398 307 -34%
ContinuingStudents 14,791 14,529 14,492 14,650 14,953 15,491 15,728 15,971 16,123 16,138 9%
Non-DegreeStudents 136 115 71 79 78 196 69 90 154 282 107%
Total Students 20,720 20,500 20,765 20,829 21,204 21,953 22,300 22,412 22,565 22,506 9%
Institutional ResearchFACT BOOK 2014-15STUDENT INFORMATION
60
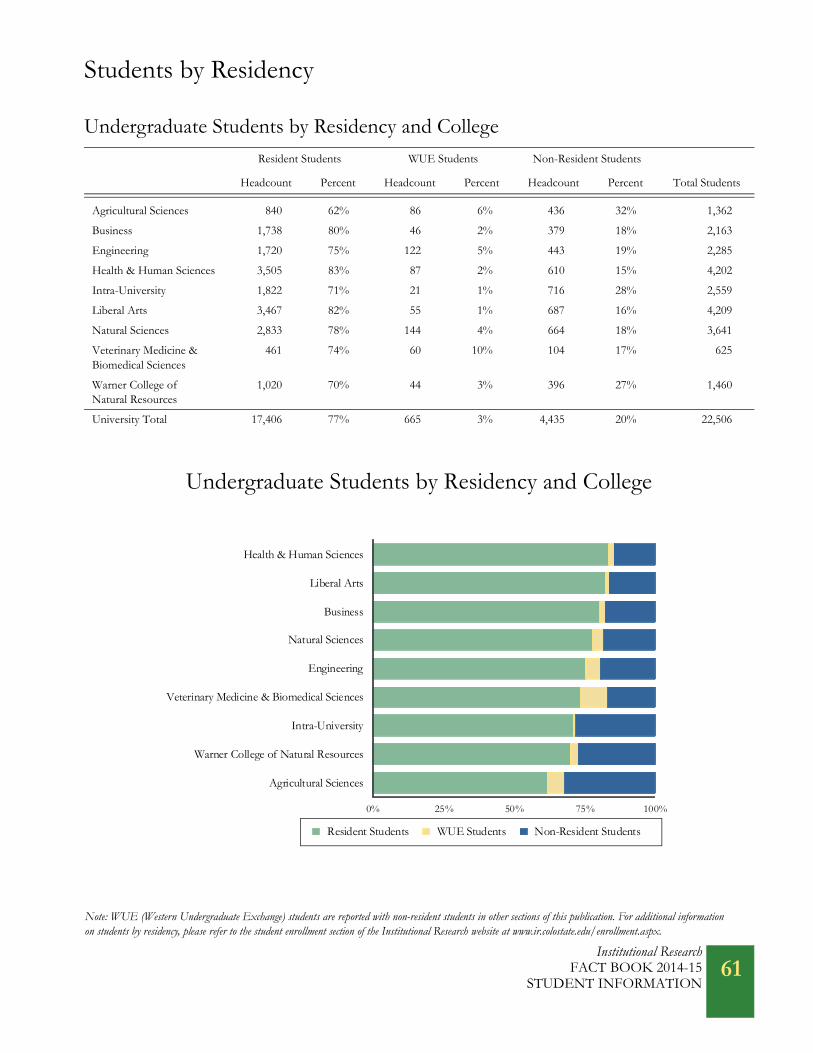
Students by Residency
Undergraduate Students by Residency and CollegeResident Students WUE Students Non-Resident Students
Headcount Percent Headcount Percent Headcount Percent Total Students
Agricultural Sciences 840 62% 86 6% 436 32% 1,362
Business 1,738 80% 46 2% 379 18% 2,163
Engineering 1,720 75% 122 5% 443 19% 2,285
Health & Human Sciences 3,505 83% 87 2% 610 15% 4,202
Intra-University 1,822 71% 21 1% 716 28% 2,559
Liberal Arts 3,467 82% 55 1% 687 16% 4,209
Natural Sciences 2,833 78% 144 4% 664 18% 3,641
Veterinary Medicine & Biomedical Sciences
461 74% 60 10% 104 17% 625
Warner College of Natural Resources
1,020 70% 44 3% 396 27% 1,460
University Total 17,406 77% 665 3% 4,435 20% 22,506
Undergraduate Students by Residency and College
Note: WUE (Western Undergraduate Exchange) students are reported with non-resident students in other sections of this publication. For additional information on students by residency, please refer to the student enrollment section of the Institutional Research website at www.ir.colostate.edu/enrollment.aspx.
0% 25% 50% 75% 100%
Agricultural Sciences
Warner College of Natural Resources
Intra-University
Veterinary Medicine & Biomedical Sciences
Engineering
Natural Sciences
Business
Liberal Arts
Health & Human Sciences
Resident Students WUE Students Non-Resident Students
Institutional ResearchFACT BOOK 2014-15
STUDENT INFORMATION 61

Students by Residency
Graduate Students by Residency and CollegeResident Students Non-Resident Students
Headcount Percent Headcount Percent Total Students
Agricultural Sciences 147 59% 101 41% 248
Business 178 57% 136 43% 314
Engineering 315 43% 412 57% 727
Health & Human Sciences 484 77% 146 23% 630
Intra-University 194 56% 155 44% 349
Liberal Arts 390 68% 187 32% 577
Natural Sciences 375 59% 266 41% 641
Veterinary Medicine & Biomedical Sciences
213 67% 103 33% 316
Warner College of NaturalResources
170 69% 75 31% 245
University Total 2,466 61% 1,581 39% 4,047
Note: Professional Veterinary Medicine is excluded from graduate enrollment.
Graduate Students by Residency and College
0% 25% 50% 75% 100%
Engineering
Intra-University
Business
Natural Sciences
Agricultural Sciences
Veterinary Medicine & Biomedical Sciences
Liberal Arts
Warner College of Natural Resources
Health & Human Sciences
Resident Students Non-Resident Students
Institutional ResearchFACT BOOK 2014-15STUDENT INFORMATION
62

Students by Residency
History of Undergraduate Enrollment by Residency
History of Graduate Enrollment by Residency
Resident Students Non-Resident Students
Headcount Percent Headcount Percent
Fall 2005 17,057 82% 3,663 18%
Fall 2006 16,917 83% 3,583 17%
Fall 2007 17,108 82% 3,747 18%
Fall 2008 17,137 82% 3,692 18%
Fall 2009 17,564 83% 3,640 17%
Fall 2010 18,149 83% 3,804 17%
Fall 2011 18,248 82% 4,052 18%
Fall 2012 18,045 81% 4,367 19%
Fall 2013 17,865 79% 4,700 21%
Fall 2014 17,406 77% 5,100 23%
Resident Students Non-Resident Students
Headcount Percent Headcount Percent
Fall 2005 2,533 69% 1,157 31%
Fall 2006 2,579 71% 1,057 29%
Fall 2007 2,587 70% 1,092 30%
Fall 2008 2,619 72% 1,036 28%
Fall 2009 2,628 72% 1,043 28%
Fall 2010 2,727 71% 1,137 29%
Fall 2011 2,685 69% 1,202 31%
Fall 2012 2,564 67% 1,244 33%
Fall 2013 2,542 65% 1,385 35%
Fall 2014 2,466 61% 1,581 39%
Institutional ResearchFACT BOOK 2014-15
STUDENT INFORMATION 63

Students by Residency
Non-Resident Undergraduates as a Percentof All Undergraduates
Colorado State University 19%
Iowa State University 29%
Kansas State University 16%
Michigan State University 14%
North Carolina State University 10%
Oklahoma State University 26%
Oregon State University 25%
Purdue University 32%
Texas A & M University 4%
University of California, Davis 3%
University of Illinois, Urbana-Champaign 14%
University of Tennessee, Knoxville 9%
Virginia Tech 24%
Washington State University 8%
Undergraduate Students by Residency - Fall 2013Board of Governors’ Peer Group Comparison
Source: Common Data Set, 2013-14Note: Non-resident alien students are excluded from the base population.
0% 25% 50% 75% 100%
University of California, Davis
Texas A & M University
Washington State University
University of Tennessee, Knoxville
North Carolina State University
University of Illinois, Urbana-Champaign
Michigan State University
Kansas State University
Virginia Tech
Oregon State University
Oklahoma State University
Iowa State University
Purdue University
Non-Resident Undergraduates Resident Undergraduates
Colorado State University
Institutional ResearchFACT BOOK 2014-15STUDENT INFORMATION
64

Student Credit Hour Production
Student Credit Hours by College and Course Level - Academic Year 2013-14LowerLevel
Upper Level
Master’sLevel
DoctoralLevel
Professional Vet Med
TotalSCH
Agricultural Sciences 15,758.5 15,543.8 2,167.5 904.5 --- 34,374.2
Business 19,658.0 41,228.0 5,659.0 --- --- 66,545.0
Engineering 12,295.0 16,288.0 6,725.7 2,422.6 --- 37,731.3
Health & Human Sciences 24,826.0 43,111.0 9,052.0 1,182.0 --- 78,171.0
Intra-University 6,157.0 4,726.0 275.9 22.0 --- 11,180.9
Liberal Arts 131,198.5 72,562.5 6,611.6 889.0 --- 211,261.6
Natural Sciences 117,273.0 42,154.1 6,513.0 4,547.5 --- 170,487.5
Veterinary Medicine &Biomedical Sciences 3,499.0 17,509.7 4,382.0 1,700.4 22,148.2 49,239.3
Warner College ofNatural Resources 11,383.0 14,312.0 3,195.5 331.0 --- 29,221.5
University Total 342,048.0 267,435.1 44,582.2 11,999.0 22,148.2 688,212.3
Note: Course credit reassignment is included. Course level student credit hours are the number of credit hours generated at the level of the course. For example, student credit hours for a senior student enrolled in a 100-level course would be reported as lower level. Student credit hours provided in this section are for the academic year (fall and spring terms) and exclude summer session. For additional information on student credit hours, please refer to the student credit hour and FTE section on the Institutional Research website at www.ir.colostate.edu/credit-hours-fte.aspx.
Percentage of Student Credit Hours by College
Total Student Credit Hours = 688,212.3
Veterinary Medicine &Biomedical Sciences
7%Warner College of
4%Natural Resources
Agricultural Sciences5%
Business10%
Engineering6%
Intra-University1%
Health & Human Sciences11%
Liberal Arts31%
Natural Sciences25%
Institutional ResearchFACT BOOK 2014-15
STUDENT INFORMATION 65

Student Credit Hour Production
Average Credit Hour Load - Fall 2014New
FreshmenAll
Undergraduate Students
Agricultural Sciences 14.69 14.20
Business 15.04 14.50
Engineering 14.88 14.10
Health & Human Sciences 14.64 13.87
Intra-University 14.41 13.70
Liberal Arts 15.03 13.86
Natural Sciences 14.90 13.88
Veterinary Medicine & Biomedical Sciences 15.00 14.46
Warner College of Natural Resources 14.52 13.67
University Average 14.74 13.96
Average Credit Load by College
13.0 13.5 14.0 14.5 15.0 15.5 16.0
Intra-University
Warner College of Natural Resources
Health & Human Sciences
Agricultural Sciences
Engineering
Natural Sciences
Veterinary Medicine & Biomedical Sciences
Liberal Arts
Business
New Freshmen All Undergraduate Students
Institutional ResearchFACT BOOK 2014-15STUDENT INFORMATION
66

Student Credit Hour Production
Fall TermFewer Than 12 Credit Hours
12 to 14Credit Hours
15 or MoreCredit Hours
TotalUndergraduates
2005 1,729 7,969 11,022 20,720
2006 1,699 7,862 10,939 20,500
2007 1,726 8,597 10,442 20,765
2008 1,620 8,372 10,837 20,829
2009 1,661 8,566 10,977 21,204
2010 1,718 8,923 11,312 21,953
2011 1,753 9,132 11,415 22,300
2012 1,715 8,913 11,784 22,412
2013 1,797 8,597 12,171 22,565
2014 1,864 8,700 11,942 22,506
Distribution of Credit Hours for Undergraduate Students
0%
25%
50%
75%
100%
Fall 2005 Fall 2008 Fall 2011 Fall 2014
15 or More Credits 12 to 14 Credits Fewer Than 12 Credits
Institutional ResearchFACT BOOK 2014-15
STUDENT INFORMATION 67

Student Credit Hour Production
History of Total Student Credit Hour Production by College
AY2004-05
AY2005-06
AY2006-07
AY2007-08
AY2008-09
AY2009-10
AY2010-11
AY2011-12
AY2012-13
AY2013-14
AY 2004-05 to AY 2013-14 Change
Agricultural Sciences 29,147.3 29,312.4 29,780.0 29,500.6 30,172.6 30,343.2 31,323.4 33,900.0 33,721.2 34,374.2 18%
Business 46,662.0 47,186.0 48,235.0 50,845.5 55,357.0 58,874.5 60,413.0 62,753.0 63,863.0 66,545.0 43%
Engineering 29,434.8 27,921.1 28,090.3 26,520.7 26,605.6 28,011.2 31,562.2 31,895.6 33,138.8 37,731.3 28%
Health &Human Sci 89,515.1 90,822.7 89,154.0 85,952.0 87,408.0 86,022.7 84,361.5 79,345.2 79,256.5 78,171.0 -13%
Intra-University 4,932.6 4,902.3 6,076.6 5,736.7 7,025.4 7,796.1 8,706.3 8,448.1 9,758.5 11,180.9 127%
Liberal Arts 216,001.4 209,694.6 203,489.8 207,130.9 209,135.2 215,384.9 223,737.5 222,159.5 220,657.5 211,261.6 -2%
NaturalSciences 156,632.0 153,455.3 151,495.0 152,614.2 149,456.0 150,196.2 154,860.2 162,087.6 165,880.8 170,487.5 9%
Vet Med &Bio Sci 51,654.2 49,645.0 48,266.5 48,125.4 46,348.1 49,142.9 50,303.0 51,765.0 50,350.1 49,239.3 -5%
Warner Collof Nat Res 24,173.1 22,766.1 23,084.4 24,968.1 25,553.5 26,466.0 27,523.5 28,598.5 29,926.7 29,221.5 21%
University 648,152.5 635,705.5 627,671.6 631,394.1 637,061.4 652,237.7 627,790.6 680,952.5 686,553.1 688,212.3 6%
AY 2004-05 to AY 2013-14 Percent Change in Student Credit Hours by College
-25%
0%
25%
50%
AgriculturalSciences
Business Engineering Health &Human Sci
LiberalArts
NaturalSciences
Vet Med &Bio Sci
Warner Collof Nat Res
Institutional ResearchFACT BOOK 2014-15STUDENT INFORMATION
68

Student FTE Production
Student FTE by College and Course Level - Academic-Year 2013-14Lower
Level FTEUpper
Level FTEMaster’s
Level FTEDoctoral
Level FTEProfessional Vet
Med FTETotal FTE
Agricultural Sciences 525.3 518.1 72.3 30.1 --- 1,145.8
Business 655.3 1,374.3 188.6 --- --- 2,218.2
Engineering 409.8 542.9 224.2 80.8 --- 1,257.7
Health & Human Sciences 827.5 1,437.0 301.7 39.4 --- 2,605.7
Intra-University 205.2 157.5 9.2 0.7 --- 372.7
Liberal Arts 4,373.3 2,418.8 220.4 29.6 --- 7,042.1
Natural Sciences 3,909.1 1,405.1 217.1 151.6 --- 5,682.9
Veterinary Medicine &Biomedical Sciences 116.6 583.7 146.1 56.7 738.3 1,641.3
Warner College ofNatural Resources 379.4 477.1 106.5 11.0 --- 974.1
Total FTE 11,401.6 8.914.5 1,486.1 400.0 738.3 22,940.4
Note: FTE (Full-Time Equivalent) students are calculated by dividing student credit hours generated by 30. Course credit reassignment is included. Course level FTE are the number of FTE generated at the level of the course. For example, a senior student enrolled in a 100-level course would be reported as lower level. FTE students provided in this section are for the academic year (fall and spring terms) and exclude summer session. For additional information on Student FTE, please refer to the student credit hour and FTE section on the Institutional Research website at www.ir.colostate.edu/credit-hours-fte.aspx.
Percentage of Student FTE by College
Total Student FTE = 22,940.4
Natural Sciences25%
Liberal Arts31%
Veterinary Medicine & Biomedical Sciences 7%
Warner College of Natural Resources 4%
Agricultural Sciences 5%
Health & Human Sciences11%
Business10%
Engineering6%
Intra-University1%
Institutional ResearchFACT BOOK 2014-15
STUDENT INFORMATION 69

Student FTE Production
Student FTE by College and Student ClassFreshman
FTESophomore
FTEJuniorFTE
SeniorFTE
Master’sFTE
DoctoralFTE
PVMFTE
TotalFTE
Agricultural Sciences 218.7 220.7 234.0 363.2 67.6 39.4 2.2 1,145.8
Business 121.7 352.4 723.0 834.9 181.5 0.9 3.8 2,218.2
Engineering 94.2 164.1 227.6 486.8 176.9 108.2 0.0 1,257.7
Health & Human Sciences 285.1 439.3 563.2 960.0 305.3 52.8 0.0 2,605.7
Intra-University 128.9 64.1 49.6 111.0 14.8 4.3 0.0 372.7
Liberal Arts 2,021.6 1,673.2 1,520.8 1,532.6 248.5 45.4 0.0 7,042.1
Natural Sciences 1,579.9 1,450.3 1,110.3 1,145.2 160.0 239.3 0.0 5,682.9
Veterinary Medicine &Biomedical Sciences 48.4 121.1 191.5 327.3 140.4 72.2 740.4 1,641.3
Warner College ofNatural Resources 154.6 150.4 189.6 358.9 93.7 26.8 0.0 974.1
University Total 4,653.0 4,635.7 4,809.5 6,117.9 1,388.4 589.4 746.4 22,940.4
Student FTE by Student Class
Total Student FTE =22,904.4
Note: Student level FTE are the number of FTE generated at the level of the student. A senior student enrolled in a 100-level course would be reported with the senior FTE.
Master’s6%
Sophomore20%
Junior21%
Freshman20%
Senior27%
Professional3%
Doctoral3%
Institutional ResearchFACT BOOK 2014-15STUDENT INFORMATION
70

Student FTE Production
Undergraduate FTE
GraduateFTE
PVMFTE
TotalFTE
Mathematics 1,162.6 37.6 0.0 1,200.2
English 1,042.9 56.7 0.0 1,099.6
Chemistry 955.2 99.9 0.0 1,055.1
Biology 797.9 34.0 0.0 831.9
Psychology 771.8 47.8 0.0 819.6
Music, Theatre & Dance 646.9 29.2 0.0 676.1
Management 617.4 30.1 0.0 647.5
Communication Studies 604.8 17.3 0.0 622.1
History 601.1 12.2 0.0 613.3
Biomedical Sciences 423.8 69.4 99.6 592.8
Economics 549.6 32.4 0.0 582.0
Physics 542.5 25.6 0.0 568.1
Sociology 510.0 12.3 0.0 522.3
Foreign Languages & Literatures 512.2 9.2 0.0 521.4
Health & Exercise Science 491.9 18.7 0.0 510.6
Departments with the Largest Student FTE Production for AY 2013-14
0 300 600 900 1,200 1,500
Health & Exercise Science
Foreign Languages & Literatures
Sociology
Physics
Economics
Biomedical Sciences
History
Communication Studies
Management
Music, Theatre & Dance
Psychology
Biology
Chemistry
English
Mathematics
Undergraduate FTE Graduate FTE PVM FTE
Institutional ResearchFACT BOOK 2014-15
STUDENT INFORMATION 71

Student FTE Production
History of Student FTE by Residency and Student Level
AY2004-05
AY2005-06
AY2006-07
AY2007-08
AY2008-09
AY2009-10
AY2010-11
AY2011-12
AY2012-13
AY2013-14
AY 2004-05 to AY 2013-14 Change
UndergraduateResident 15,429.7 15,291.6 15,130.9 15,139.7 15,357.5 15,737.5 16,212.1 16,263.4 16,167.6 15,886.5 3%
Undergraduate Nonresident 3,566.7 3,371.1 3,318.4 3,395.6 3,337.9 3,344.9 3,452.2 3,723.0 4,043.9 4,329.7 21%
Graduate Resident 1,304.8 1,233.3 1,222.4 1,220.5 1,277.0 1,322.4 1,339.0 1,264.3 1,202.4 1,186.4 -9%
GraduateNonresident 593.4 588.3 536.1 581.5 581.3 609.1 688.8 701.1 720.6 800.0 35%
Prof Vet MedResident 402.4 390.3 394.3 388.1 374.1 394.0 401.3 410.1 413.1 400.6 0%
Prof Vet MedNonresident 308.0 315.6 320.2 321.0 307.7 333.4 332.9 336.5 337.4 337.7 10%
TotalResident 17,137.0 16,915.2 16,747.6 16,748.3 17,008.5 17,453.9 17,952.4 17,937.8 17,783.2 17,473.4 2%
TotalNonresident 4,468.1 4,275.0 4,174.8 4,298.1 4,226.9 4,287.4 4,474.0 4,760.6 5,101.9 5,467.0 22%
Total FTE 21,605.1 21,190.2 20,922.4 21,046.5 21,235.5 21,741.3 22,426.4 22,698.4 22,885.1 22,940.4 6%
AY 2004-05 to AY 2013-14Percent Change in Student FTE by Residency and Student Level
-25%
0%
25%
50%
UndergraduateResident
UndergraduateNon-Resident
GraduateResident
GraduateNon-Resident
PVMResident
PVMNon-Resident
Institutional ResearchFACT BOOK 2014-15STUDENT INFORMATION
72

Student FTE Production
History of Total Student FTE by College
AY 2004-05
AY2005-06
AY2006-07
AY2007-08
AY2008-09
AY2009-10
AY2010-11
AY2011-12
AY2012-13
AY2013-14
AY 2004-05 to AY 2013-14 Change
Agricultural Sciences 971.6 977.1 992.7 983.5 1,005.8 1,011.4 1,044.1 1,130.0 1,124.0 1,145.8 18%
Business 1,555.4 1,572.9 1,607.8 1,694.8 1,845.2 1,962.5 2,013.8 2,091.8 2,128.8 2,218.2 43%
Engineering 981.2 930.7 936.3 884.0 886.9 933.7 1,052.1 1,063.2 1,104.6 1,257.7 28%
Health & Human Sciences 2,983.8 3,027.4 2,971.8 2,865.1 2,913.6 2,867.4 2,812.1 2,644.8 2,641.9 2,605.7 -13%
Intra-University 164.4 163.4 202.6 191.2 234.2 259.9 290.2 281.6 325.3 372.7 127%
Liberal Arts 7,200.0 6,989.8 6,783.0 6,904.4 6,971.2 7,179.5 7,457.9 7,405.3 7,355.2 7,042.1 -2%
Natural Sciences 5,221.1 5,115.2 5,049.8 5,087. 1 4,981.9 5,006.5 5,162.0 5,402.9 5,529.4 5,682.9 9%
Veterinary Med & Biomed Sci 1,721.8 1,654.8 1,608.8 1,604.1 1,545.0 1,638 1 1,676.8 1,725.5 1,678.3 1,641.3 -5%
Warner College of Nat Res 805.8 758.9 769.5 832.3 851.8 882.2 917.5 953.3 997.6 974.1 21%
Total FTE 21,605.1 21,190.2 20,922.4 21,046.5 21,235.5 21,741.3 22,426.4 22,698.4 22,885.1 22,940.4 6%
AY 2004-05 to AY 2013-14Percent Change in Student FTE by College
-25%
0%
25%
50%
AgriculturalSciences
Business Engineering Health &Human Sci
LiberalArts
NaturalSciences
Vet Med &Bio Sci
Warner Collof Nat Res
Institutional ResearchFACT BOOK 2014-15
STUDENT INFORMATION 73
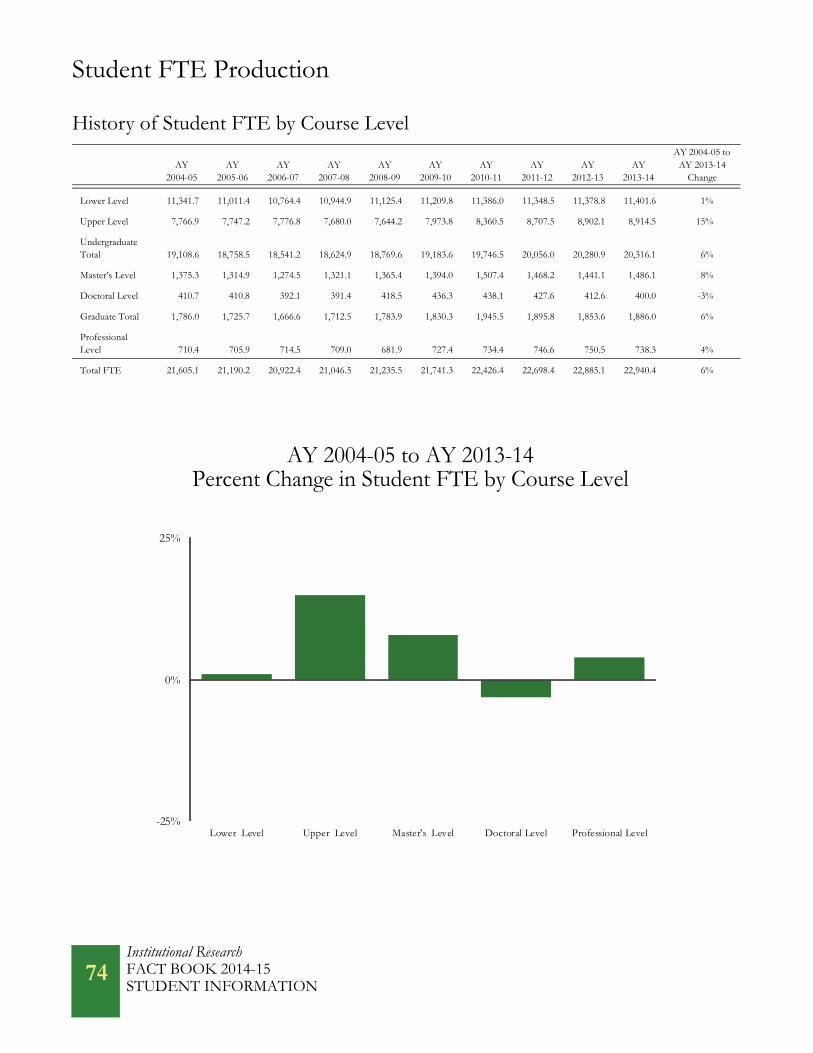
Student FTE Production
History of Student FTE by Course Level
AY2004-05
AY2005-06
AY2006-07
AY2007-08
AY2008-09
AY2009-10
AY2010-11
AY2011-12
AY2012-13
AY2013-14
AY 2004-05 to AY 2013-14
Change
Lower Level 11,341.7 11,011.4 10,764.4 10,944.9 11,125.4 11,209.8 11,386.0 11,348.5 11,378.8 11,401.6 1%
Upper Level 7,766.9 7,747.2 7,776.8 7,680.0 7,644.2 7,973.8 8,360.5 8,707.5 8,902.1 8,914.5 15%
Undergraduate Total 19,108.6 18,758.5 18,541.2 18,624.9 18,769.6 19,183.6 19,746.5 20,056.0 20,280.9 20,316.1 6%
Master’s Level 1,375.3 1,314.9 1,274.5 1,321.1 1,365.4 1,394.0 1,507.4 1,468.2 1,441.1 1,486.1 8%
Doctoral Level 410.7 410.8 392.1 391.4 418.5 436.3 438.1 427.6 412.6 400.0 -3%
Graduate Total 1,786.0 1,725.7 1,666.6 1,712.5 1,783.9 1,830.3 1,945.5 1,895.8 1,853.6 1,886.0 6%
Professional Level 710.4 705.9 714.5 709.0 681.9 727.4 734.4 746.6 750.5 738.3 4%
Total FTE 21,605.1 21,190.2 20,922.4 21,046.5 21,235.5 21,741.3 22,426.4 22,698.4 22,885.1 22,940.4 6%
AY 2004-05 to AY 2013-14Percent Change in Student FTE by Course Level
-25%
0%
25%
Lower Level Upper Level Master's Level Doctoral Level Professional Level
Institutional ResearchFACT BOOK 2014-15STUDENT INFORMATION
74
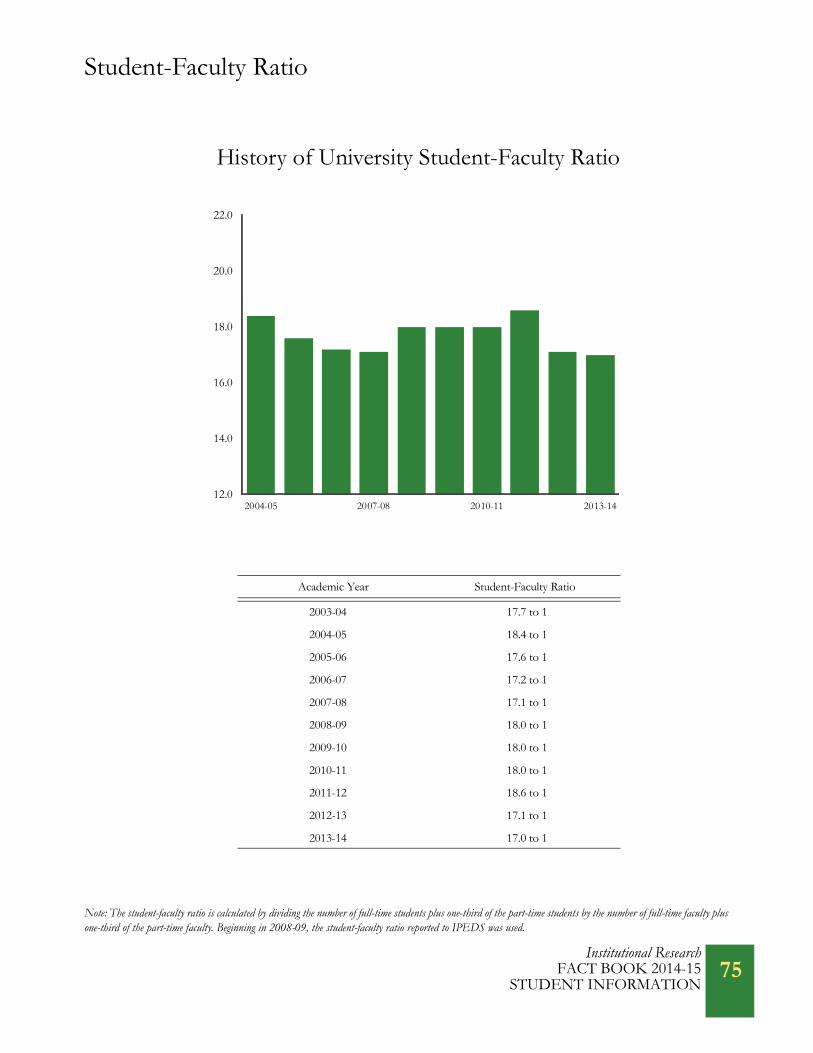
Institutional ResearchFACT BOOK 2014-15
STUDENT INFORMATION 75
Student-Faculty Ratio
Academic Year Student-Faculty Ratio
2003-04 17.7 to 1
2004-05 18.4 to 1
2005-06 17.6 to 1
2006-07 17.2 to 1
2007-08 17.1 to 1
2008-09 18.0 to 1
2009-10 18.0 to 1
2010-11 18.0 to 1
2011-12 18.6 to 1
2012-13 17.1 to 1
2013-14 17.0 to 1
Note: The student-faculty ratio is calculated by dividing the number of full-time students plus one-third of the part-time students by the number of full-time faculty plus one-third of the part-time faculty. Beginning in 2008-09, the student-faculty ratio reported to IPEDS was used.
History of University Student-Faculty Ratio
12.0
14.0
16.0
18.0
20.0
22.0
2004-05 2007-08 2010-11 2013-14

Institutional ResearchFACT BOOK 2014-15STUDENT INFORMATION
76
Student-Faculty Ratio
Student-Faculty Ratio
Colorado State University 17 to 1
Iowa State University 19 to 1
Kansas State University 19 to 1
Michigan State University 17 to 1
North Carolina State University 17 to 1
Oklahoma State University 20 to 1
Oregon State University 21 to 1
Purdue University 13 to 1
Texas A & M University 22 to 1
University of California, Davis 17 to 1
University of Illinois, Urbana-Champaign 18 to 1
University of Tennessee, Knoxville 17 to 1
Virginia Tech 16 to 1
Washington State University 15 to 1
Board of Governors’ Peer Group ComparisonStudent-Faculty Ratio - Fall 2013
Source: Common Data Set, 2013-14
0.0 10.0 20.0 30.0
Texas A & M University
Oregon State University
Oklahoma State University
Kansas State University
Iowa State University
University of Illinois, Urbana-Champaign
University of Tennessee, Knoxville
University of California, Davis
North Carolina State University
Michigan State University
Virginia Tech
Washington State University
Purdue University
Colorado State University

Degrees Awarded
TotalDegrees Awarded
Percent of Degrees Awarded
Bachelor’s Degrees 4,962 72%
Master’s Degrees 1,606 23%
Doctoral Degrees 230 3%
Professional Veterinary Medicine Degrees 139 2%
Total Degrees 6,937 100%
Total Degrees Awarded - 2013-14
Note: Degrees are awarded by the full year which includes summer, fall and spring, e.g., 2013-14 includes degrees awarded for the summer 2013, fall 2013 and spring 2014 terms. For additional information on degrees awarded, please refer to the degrees awarded section on the Institutional Research website at www.ir.colos-tate.edu/degree.aspx.
Total Degrees Awarded = 6,937
Master’s Degrees23%
Doctoral Degrees3%
DVM Degrees2%
Bachelor’s Degrees72%
Institutional ResearchFACT BOOK 2014-15
STUDENT INFORMATION 77

Degrees Awarded
Degrees Awarded by College - 2013-14Bachelor’sDegrees
Master’sDegrees
DoctoralDegrees
DVMDegrees
TotalDegrees
Agricultural Sciences 305 87 12 0 404
Business 663 478 0 0 1,141
Engineering 334 151 33 0 518
Health & Human Sciences 1,016 276 44 0 1,336
Intra-University 0 23 15 0 38
Liberal Arts 1,429 207 10 0 1,646
Natural Sciences 723 131 79 0 933
Veterinary Medicine & Biomedical Sciences 159 144 23 139 465
Warner College of Natural Resources 333 109 14 0 456
University Summary 4,962 1,606 230 139 6,937
Total Degrees Awarded
0 500 1,000 1,500 2,000
Intra-University
Agricultural Sciences
Warner College of Natural Resources
Veterinary Medicine & Biomedical Sciences
Engineering
Natural Sciences
Business
Health & Human Sciences
Liberal Arts
Bachelor's Degrees
Master's Degrees
Doctoral Degrees
DVM Degrees
Institutional ResearchFACT BOOK 2014-15STUDENT INFORMATION
78

Degrees Awarded
Bachelor’s Degrees Awarded
Health and Exercise Science 289
Human Development and Family Studies 260
Biology 241
Psychology 230
Communication Studies 198
Finance and Real Estate 168
Marketing 165
Economics 161
Management 147
Animal Sciences 143
Sociology 142
Food Science and Human Nutrition 141
Mechanical Engineering 134
Journalism and Technical Communication 130
Liberal Arts, Intra-College 125
Departments with the Largest Number of Bachelor’s Degrees Awarded
0 100 200 300
Liberal Arts Intra-College
Journalism and Technical Commnction
Mechanical Engineering
Food Science & Human Nutrition
Sociology
Animal Sciences
Management
Economics
Marketing
Finance & Real Estate
Communication Studies
Psychology
Biology
Human Development and Family Studies
Health and Exercise Science
Institutional ResearchFACT BOOK 2014-15
STUDENT INFORMATION 79

Degrees Awarded
Master’s Degrees Awarded
Business, Intra-College 400
School of Education 142
Music, Theatre and Dance 60
English 60
Human Dimensions of Natural Resources 53
Biomedical Sciences 51
Environmental and Radiological Health Sciences 48
Agricultural Sciences, Intra-College 46
School of Social Work 46
Engineering, Intra-College 45
Occupational Therapy 44
Civil and Environmental Engineering 42
Computer Science 39
Electrical and Computer Engineering 34
Accounting 34
Departments with the Largest Number of Master’s Degrees Awarded
0 100 200 300 400
Accounting
Electrical and Computer Engineering
Computer Science
Civil and Environmental Engineering
Occupational Therapy
Engineering Intra-College
School of Social Work
Agricultural Sciences Intra-College
Environmntl & Radiolgicl Health Sci
Biomedical Sciences
Human Dimensions of Natural Res.
English
Music, Theatre, & Dance
School of Education
Business Intra-College
Institutional ResearchFACT BOOK 2014-15STUDENT INFORMATION
80

Degrees Awarded
Doctoral Degrees Awarded
School of Education 36
Chemistry 20
Psychology 16
Physics 11
Microbiology, Immunology, and Pathology 11
Computer Science 11
Electrical and Computer Engineering 9
Civil and Environmental Engineering 9
Mathematics 8
Mechanical Engineering 8
Ecology 8
Environmental and Radiological Health Sciences 7
Cell and Molecular Biology 7
Atmospheric Science 6
Biochemistry and Molecular Biology 5
Statistics 5
Departments with the Largest Number of Doctoral Degrees Awarded
0 10 20 30 40 50
Statistics
Biochemistry & Molecular Bio
Atmospheric Science
Cell and Molecular Biology
Environmental & Radiological Health Sci
Ecology
Mechanical Engineering
Mathematics
Civil and Environmental EngineeringElectrical and Computer Engineering
Computer Science
Microbiolgy, Immunolgy and Pathology
Physics
Psychology
Chemistry
School of Education
Institutional ResearchFACT BOOK 2014-15
STUDENT INFORMATION 81

Degrees Awarded
History of Bachelor’s Degrees Awarded
History of Master’s Degrees Awarded
History of Doctoral Degrees Awarded
2004-05 2005-06 2006-07 2007-08 2008-09 2009-10 2010-11 2011-12 2012-13 2013-142004-05 to
2013-14 Change
Agricultural Sci 285 300 276 256 282 262 259 272 298 305 7%
Business 688 670 592 537 528 525 602 577 638 663 -4%
Engineering 291 279 222 290 225 224 238 306 295 334 15%
Health & Hum Sci 806 854 933 965 970 1,031 1,050 1,081 1,035 1,016 26%
Liberal Arts 1,284 1,331 1,295 1,240 1,286 1,360 1,328 1,426 1,473 1,429 11%
Natural Sciences 574 616 567 648 588 557 588 599 647 723 26%
Veterinary Med &Biomedical Sci 103 83 76 115 144 130 142 147 160 159 54%
Warner College of Natural Resources 250 236 208 238 211 247 229 268 333 333 33%
University Total 4,281 4,369 4,169 4,289 4,234 4,336 4,436 4,676 4,879 4,962 16%
2004-05 2005-06 2006-07 2007-08 2008-09 2009-10 2010-11 2011-12 2012-13 2013-142004-05 to
2013-14 Change
Agricultural Sci 48 48 44 37 60 41 75 71 84 87 81%
Business 202 195 161 191 294 403 400 465 462 478 137%
Engineering 129 117 106 105 92 94 104 106 149 151 17%
Health & Hum Sci 304 336 277 288 359 396 346 399 352 276 -9%
Intra-University 16 16 16 20 14 11 17 21 17 23 44%
Liberal Arts 147 163 134 145 155 210 191 227 194 207 41%
Natural Sciences 94 102 105 116 107 117 107 115 136 131 39%
Veterinary Med &Biomedical Sci 69 58 67 70 92 100 111 110 125 144 109%
Warner College ofNatural Resources 36 55 55 52 52 48 48 63 68 109 203%
University Total 1,045 1,090 965 1,024 1,225 1,420 1,399 1,577 1,587 1,606 54%
2004-05 2005-06 2006-07 2007-08 2008-09 2009-10 2010-11 2011-12 2012-13 2013-142004-05 to
2013-14 Change
Agricultural Sci 14 11 11 8 13 21 12 17 22 12 -14%
Engineering 33 27 34 36 40 38 40 40 42 33 0%
Health & Hum Sci 42 40 33 38 58 38 35 43 46 44 5%
Intra-University 12 12 23 21 17 14 12 20 19 15 25%
Liberal Arts 17 10 14 6 8 9 10 11 11 10 -41%
Natural Sciences 38 55 59 56 53 53 65 66 61 79 108%
Veterinary Med &Biomedical Sci 21 23 25 31 27 20 22 31 23 23 10%
Warner College ofNatural Resources 10 8 12 10 11 10 8 7 8 14 40%
University Total 187 186 211 206 227 203 204 235 232 230 23%
Institutional ResearchFACT BOOK 2014-15STUDENT INFORMATION
82

Degrees Awarded
2004-05 to 2013-14Percent Change in Degrees Awarded by College
Bachelor’s Degrees
Master’s Degrees
Doctoral Degrees
-50%
0%
50%
100%
AgriculturalSciences
Business Engineering Health &Human Sci
LiberalArts
NaturalSciences
Vet Med &Bio Sci
Warner Collof Nat Res
-50%
0%
50%
100%
150%
200%
AgriculturalSciences
Business Engineering Health &Human Sci
Intra-University
LiberalArts
NaturalSciences
Vet Med &Bio Sci
Warner Collof Nat Res
-50%
0%
50%
100%
150%
AgriculturalSciences
Engineering Health &Human Sci
Intra-University
LiberalArts
NaturalSciences
Vet Med &Bio Sci
Warner Collof Nat Res
Institutional ResearchFACT BOOK 2014-15
STUDENT INFORMATION 83

Degrees Awarded
History of Degrees Awarded by Gender
History of Degrees Awarded by Minority Status
2004-05 2005-06 2006-07 2007-08 2008-09 2009-10 2010-11 2011-12 2012-13 2013-142004-05 to
2013-14 Change
Bachelor’s Degrees
Men 1,983 2,047 1,981 1,997 1,931 1,987 2,024 2,170 2,275 2,335 18%
Women 2,298 2,322 2,188 2,292 2,303 2,349 2,412 2,506 2,604 2,627 14%
Total 4,281 4,369 4,169 4,289 4,234 4,336 4,436 4,676 4,879 4,962 16%
Master’s Degrees
Men 505 483 450 493 578 662 700 776 808 799 58%
Women 540 607 515 531 647 758 699 801 779 807 49%
Total 1,045 1,090 965 1,024 1,225 1,420 1,399 1,577 1,587 1,606 54%
Doctoral Degrees
Men 120 100 121 112 119 107 116 124 119 136 13%
Women 67 86 90 94 108 96 88 111 113 94 40%
Total 187 186 211 206 227 203 204 235 232 230 23%
2004-05 2005-06 2006-07 2007-08 2008-09 2009-10 2010-11 2011-12 2012-13 2013-142004-05 to
2013-14 Change
Bachelor’s Degrees
Minority 441 508 431 511 500 538 567 575 638 662 50%
Non-Minority 3,840 3,861 3,738 3,778 3,734 3,798 3,869 4,101 4,241 4,300 12%
Total 4,281 4,369 4,169 4,289 4,234 4,336 4,436 4,676 4,879 4,962 16%
Master’s Degrees
Minority 94 81 89 87 122 176 166 213 214 203 116%
Non-Minority 951 1,009 876 937 1,103 1,244 1,233 1,364 1,373 1,403 48%
Total 1,045 1,090 965 1,024 1,225 1,420 1,399 1,577 1,587 1,606 54%
Doctoral Degrees
Minority 13 14 14 21 24 18 19 29 24 27 108%
Non-Minority 174 172 197 185 203 185 185 206 208 203 17%
Total 187 186 211 206 227 203 204 235 232 230 23%
Note: Non-resident alien students are reported in the non-minority category.
Institutional ResearchFACT BOOK 2014-15STUDENT INFORMATION
84

Degrees Awarded
History of STEM Bachelor’s Degrees Awarded
2004-05 2005-06 2006-07 2007-08 2008-09 2009-10 2010-11 2011-12 2012-23 2013-142004-05 to
2013-14 Change
STEM Bachelor’s Degrees Awarded by Gender
Men 701 739 720 836 729 831 821 891 869 961 37%
Women 462 472 400 558 528 539 501 575 646 664 44%
All STEM Degrees 1,163 1,211 1,120 1,394 1,257 1,370 1,322 1,466 1,515 1,625 40%
STEM Bachelor’s Degrees Awarded by Ethnicity
Asian 23 47 31 45 44 42 34 22 22 29 26%
Black 16 11 8 11 12 13 12 13 10 22 38%
Hawaiian/PacificIslander N/A N/A N/A N/A N/A N/A 3 1 4 1 N/A
Hispanic 48 47 47 67 74 66 66 72 93 76 58%
Native American 10 11 16 17 15 20 2 6 9 6 -40%
Multi-Racial N/A N/A N/A N/A N/A N/A 30 37 32 45 N/A
Total Minority Students 97 116 102 140 145 141 147 151 170 179 85%
All STEM Degrees 1,163 1,211 1,120 1,394 1,257 1,370 1,322 1,466 1,515 1,625 40%
Minority Students as a Percent of All STEM Degrees 8.3% 9.6% 9.1% 10.0% 11.5% 10.3% 11.1% 10.3% 11.2% 11.0%
2004-05 to 2013-14 STEM Bachelor’s Degrees Awarded as a Percentof Total Bachelor’s Degrees Awarded
Note: STEM degrees include those awarded to students in the fields of science, technology, engineering and mathematics. New federal ethnicity and race categories were implemented in fall 2010. Non-resident alien students were not reported in ethnic categories.
0%
10%
20%
30%
40%
50%
2004-05 2007-08 2010-11 2013-14
Institutional ResearchFACT BOOK 2014-15
STUDENT INFORMATION 85

Degrees Awarded
History of STEM Master’s Degrees Awarded
2004-05 2005-06 2006-07 2007-08 2008-09 2009-10 2010-11 2011-12 2012-13 2013-142004-05 to
2013-14 Change
STEM Master’s Degrees Awarded by Gender
Men 185 203 199 211 213 219 254 242 307 305 65%
Women 135 156 134 156 156 180 160 180 203 232 72%
All STEM Degrees 320 359 333 367 369 399 414 422 510 537 68%
STEM Master’s Degrees Awarded by Ethnicity
Asian 10 2 14 9 7 18 8 10 16 17 70%
Black 3 1 2 1 4 4 1 2 5 6 100%
Hawaiian/PacificIslander N/A N/A N/A N/A N/A N/A 0 1 0 0 N/A
Hispanic 6 4 8 9 10 13 18 20 37 27 350%
Native American 2 3 2 3 4 8 4 3 0 2 0%
Multi-Racial N/A N/A N/A N/A N/A N/A 5 4 11 8 N/A
Total Minority Students 21 10 26 22 25 43 36 40 69 60 186%
All STEM Degrees 320 359 333 367 369 399 414 422 510 537 68%
Minority Students as a Percent ofAll STEM Degrees 6.6% 2.8% 7.8% 6.0% 6.8% 10.8% 8.7% 9.5% 13.5% 11.2%
2004-05 to 2013-14 STEM Master’s Degrees Awarded as a Percentof Total Master’s Degrees Awarded
Note: STEM degrees include those awarded to students in the fields of science, technology, engineering and mathematics.
0%
10%
20%
30%
40%
50%
2004-05 2007-08 2010-11 2013-14
Institutional ResearchFACT BOOK 2014-15STUDENT INFORMATION
86
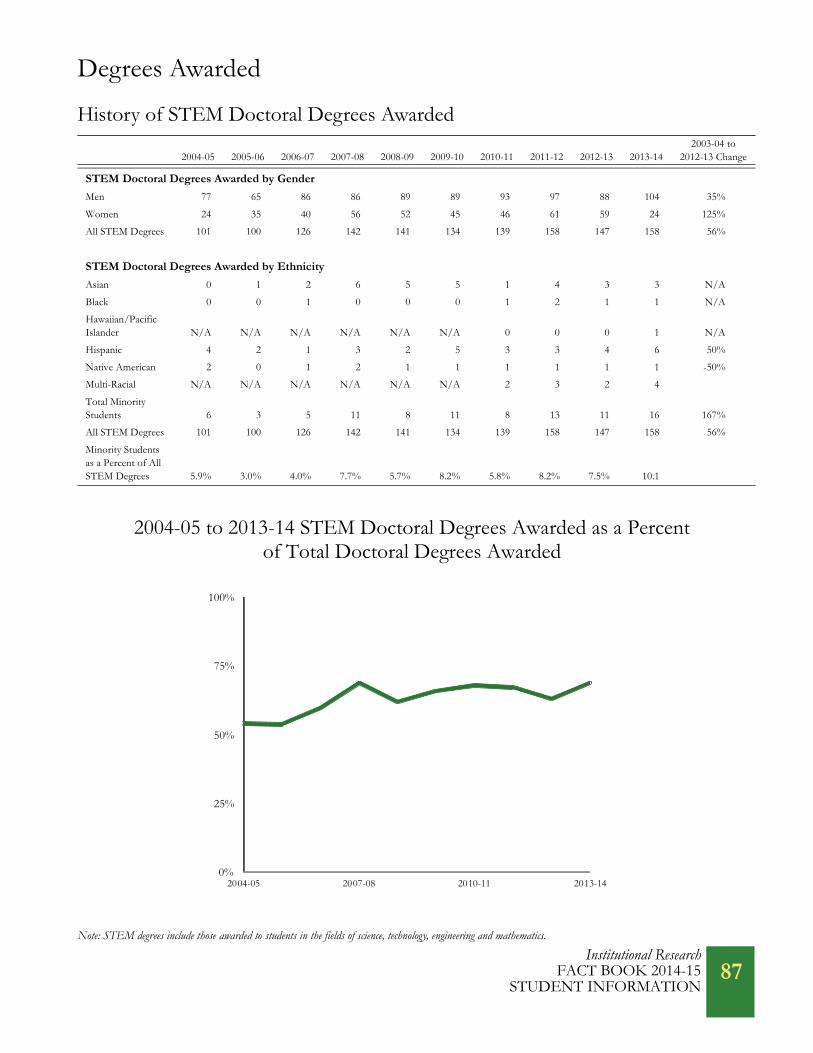
Degrees Awarded
History of STEM Doctoral Degrees Awarded
2004-05 2005-06 2006-07 2007-08 2008-09 2009-10 2010-11 2011-12 2012-13 2013-142003-04 to
2012-13 Change
STEM Doctoral Degrees Awarded by Gender
Men 77 65 86 86 89 89 93 97 88 104 35%
Women 24 35 40 56 52 45 46 61 59 24 125%
All STEM Degrees 101 100 126 142 141 134 139 158 147 158 56%
STEM Doctoral Degrees Awarded by Ethnicity
Asian 0 1 2 6 5 5 1 4 3 3 N/A
Black 0 0 1 0 0 0 1 2 1 1 N/A
Hawaiian/PacificIslander N/A N/A N/A N/A N/A N/A 0 0 0 1 N/A
Hispanic 4 2 1 3 2 5 3 3 4 6 50%
Native American 2 0 1 2 1 1 1 1 1 1 -50%
Multi-Racial N/A N/A N/A N/A N/A N/A 2 3 2 4
Total Minority Students 6 3 5 11 8 11 8 13 11 16 167%
All STEM Degrees 101 100 126 142 141 134 139 158 147 158 56%
Minority Students as a Percent of All STEM Degrees 5.9% 3.0% 4.0% 7.7% 5.7% 8.2% 5.8% 8.2% 7.5% 10.1
2004-05 to 2013-14 STEM Doctoral Degrees Awarded as a Percentof Total Doctoral Degrees Awarded
Note: STEM degrees include those awarded to students in the fields of science, technology, engineering and mathematics.
0%
25%
50%
75%
100%
2004-05 2007-08 2010-11 2013-14
Institutional ResearchFACT BOOK 2014-15
STUDENT INFORMATION 87

Degrees Awarded
Bachelor’sDegrees
Master’sDegrees
DoctoralDegrees
ProfessionalDegrees
TotalDegrees
Colorado State University 4,879 1,587 232 140 6,838
Iowa State University 5,047 783 349 142 6,321
Kansas State University 3,677 990 158 105 4,930
Michigan State University 7,976 2,042 499 494 11,011
North Carolina State University 5,475 2,337 488 72 8,372
Oklahoma State University 3,652 1,099 239 89 5,079
Oregon State University 4,157 746 212 141 5,256
Purdue University 6,829 1,538 687 232 9,286
Texas A & M University 9,570 2,240 726 129 12,665
University of California, Davis 7,015 1,026 582 459 9,082
University of Illinois, Urbana-Champaign 7,645 3,222 809 350 12,026
University of Tennessee, Knoxville 4,659 1,814 477 628 7,578
Virginia Tech 5,604 1,469 479 93 7,645
Washington State University 5,275 800 268 189 6,532
Source: Common Data Set, 2013-14
Board of Governors’ Peer Group ComparisonDegrees Awarded in 2012-13
0 5,000 10,000 15,000
Kansas State University
Oklahoma State University
Oregon State University
Iowa State University
Washington State University
University of Tennessee, Knoxville
Virginia Tech
North Carolina State University
University of California, Davis
Purdue University
Michigan State University
University of Illinois, Urbana-Champaign
Texas A & M University
Bachelor's Degrees Master's Degrees Doctoral Degrees Professional Degrees
Colorado State University
Institutional ResearchFACT BOOK 2014-15STUDENT INFORMATION
88

Persistence and Graduation of New Freshmen and Transfer Students
First-Time Freshmen New Transfer Students
Fall 2011 Fall 2012 Fall 2013 Fall 2011 Fall 2012 Fall 2013
Resident Students 85.1% 87.5% 87.2% 84.9% 87.8% 87.8%
Pell Grant Recipients 83.6% 83.8% 84.9% 86.1% 85.1% 86.3%
Non-Pell Grant Recipients 85.7% 88.8% 87.9% 84.2% 89.5% 88.5%
First-Generation Students 79.7% 82.9% 82.7% 84.8% 84.6% 88.5%
Non-First-Generation Students 87.2% 89.4% 88.8% 85.0% 89.7% 87.4%
Minority Students 84.4% 85.7% 86.3% 87.7% 83.9% 85.1%
Non-Minority Students 85.3% 88.0% 87.4% 84.4% 88.6% 88.3%
Non-Resident Students 83.3% 84.0% 82.5% 84.7% 84.6% 86.8%
Pell Grant Recipients 65.5% 67.9% 69.9% 65.0% 75.9% 75.9%
Non-Pell Grant Recipients 86.1% 86.1% 84.0% 89.1% 86.6% 89.1%
First-Generation Students 72.5% 74.4% 72.6% 72.7% 59.4% 75.0%
Non-First-Generation Students 85.6% 85.8% 84.3% 88.3% 92.6% 90.1%
Minority Students 80.6% 80.7% 76.3% 78.4% 72.2% 76.3%
Non-Minority Students 83.8% 84.6% 83.6% 85.5% 86.4% 88.2%
Total Students 84.7% 86.6% 86.0% 84.9% 87.1% 87.5%
Pell Grant Recipients 81.2% 81.7% 82.9% 83.2% 83.9% 84.8%
Non-Pell Grant Recipients 85.8% 88.1% 86.8% 85.7% 88.7% 88.7%
First-Generation Students 78.6% 81.6% 81.0% 82.7% 80.4% 86.1%
Non-First-Generation Students 86.8% 88.4% 87.5% 85.9% 90.5% 88.2%
Minority Students 83.7% 84.7% 84.3% 85.9% 81.7% 83.4%
Non-Minority Students 84.9% 87.1% 86.4% 84.7% 88.1% 88.3%
First-Year Persistence Rates
Note: Includes only full-time students who enrolled for their second fall semester. For example, the percentage of students listed under fall 2013 includes students who enrolled for fall 2012. Excludes students who completed a full-university withdrawal. For additional information on the persistence and graduation of new freshmen and transfer students, please refer to the student success section on the Institutional Research website at www.ir.colostate.edu/retention.aspx.
Institutional ResearchFACT BOOK 2014-15
STUDENT INFORMATION 89

Persistence and Graduation of New Freshmen and Transfer Students
First-Time Freshmen New Transfer Students
Fall 2006 Fall 2007 Fall 2008 Fall 2006 Fall 2007 Fall 2008
Resident Students 65.7% 66.9% 68.2% 72.6% 71.8% 72.8%
Pell Grant Recipients 60.3% 58.7% 62.2% 74.3% 67.8% 68.6%
Non-Pell Grant Recipients 66.6% 68.4% 69.3% 72.1% 73.0% 74.0%
First-Generation Students 59.1% 58.4% 61.0% 69.2% 68.5% 70.5%
Non-First-Generation Students 68.3% 70.1% 70.6% 74.3% 73.4% 74.0%
Minority Students 56.5% 62.7% 59.5% 62.3% 68.6% 69.9%
Non-Minority Students 67.3% 67.6% 69.6% 74.1% 72.4% 73.2%
Nonresident Students 56.1% 58.8% 60.7% 68.3% 62.7% 63.4%
Pell Grant Recipients 42.9% 49.5% 45.3% 57.5% 52.4% 63.9%
Non-Pell Grant Recipients 57.5% 60.0% 62.4% 70.3% 64.7% 63.3%
First-Generation Students 47.7% 50.0% 47.4% 60.4% 57.3% 60.7%
Non-First-Generation Students 58.5% 60.8% 63.9% 72.8% 64.9% 64.3%
Minority Students 50.0% 48.5% 46.0% 65.5% 50.0% 63.0%
Non-Minority Students 57.1% 60.6% 62.6% 68.6% 64.5% 63.5%
Total Students 63.7% 65.2% 66.6% 71.6% 69.8% 70.8%
Pell Grant Recipients 57.7% 57.2% 59.9% 71.3% 65.2% 67.8%
Non-Pell Grant Recipients 64.7% 66.5% 67.8% 71.7% 71.0% 71.6%
First-Generation Students 57.3% 57.2% 58.8% 67.1% 66.2% 68.9%
Non-First-Generation Students 66.2% 67.9% 69.1% 74.0% 71.4% 71.7%
Minority Students 55.3% 59.7% 57.2% 62.9% 65.1% 68.6%
Non-Minority Students 65.2% 66.1% 68.1% 72.9% 70.5% 71.1%
Six-Year Graduation Rates
Note: The six-year graduation rate for fall 2008 indicates the percentage of students who entered CSU as new freshman in fall 2008 and graduated by summer 2014.
Institutional ResearchFACT BOOK 2014-15STUDENT INFORMATION
90

Persistence and Graduation of New Freshmen and Transfer Students
Graduation Rate
Colorado State University 62.8%
Iowa State University 70.8%
Kansas State University 58.4%
Michigan State University 79.4%
North Carolina State University 71.3%
Oklahoma State University 62.2%
Oregon State University 60.9%
Purdue University 70.0%
Texas A & M University 79.6%
University of California, Davis 81.3%
University of Illinois, Urbana-Champaign 84.0%
University of Tennessee, Knoxville 66.1%
Virginia Tech 82.8%
Washington State University 67.3%
Board of Governors’ Peer Group ComparisonSix-Year Graduation Rate for the Fall 2007 Entering Freshman Class
Source: IPEDS data as reported in the College Measures Initiative at www.collegemeasures.org. Note: The IPEDS six-year graduation rate differs from graduation rates reported on page 90 because IPEDS includes summer starts and excludes education abroad students.
0% 25% 50% 75% 100%
Kansas State University
Oregon State University
Oklahoma State University
University of Tennessee, Knoxville
Washington State University
Purdue University
Iowa State University
North Carolina State University
Michigan State University
Texas A & M University
University of California, Davis
Virginia Tech
University of Illinois, Urbana-Champaign
Colorado State University
Institutional ResearchFACT BOOK 2014-15
STUDENT INFORMATION 91
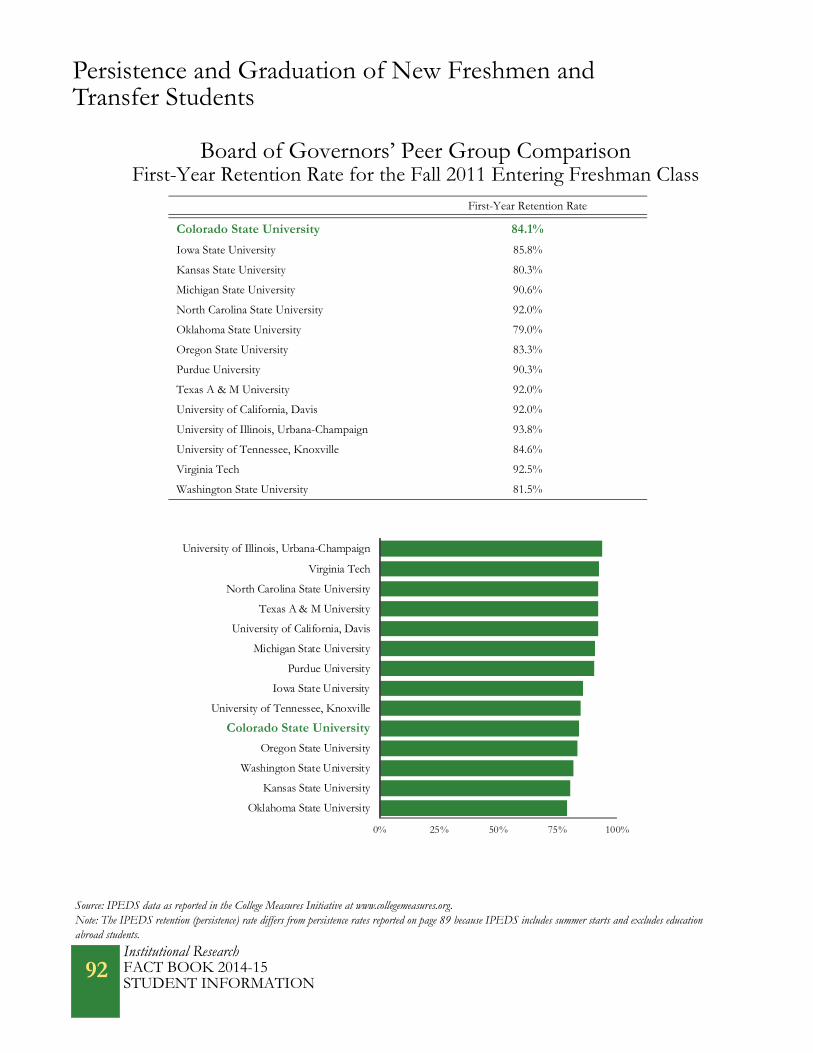
Persistence and Graduation of New Freshmen and Transfer Students
First-Year Retention Rate
Colorado State University 84.1%
Iowa State University 85.8%
Kansas State University 80.3%
Michigan State University 90.6%
North Carolina State University 92.0%
Oklahoma State University 79.0%
Oregon State University 83.3%
Purdue University 90.3%
Texas A & M University 92.0%
University of California, Davis 92.0%
University of Illinois, Urbana-Champaign 93.8%
University of Tennessee, Knoxville 84.6%
Virginia Tech 92.5%
Washington State University 81.5%
Board of Governors’ Peer Group ComparisonFirst-Year Retention Rate for the Fall 2011 Entering Freshman Class
Source: IPEDS data as reported in the College Measures Initiative at www.collegemeasures.org. Note: The IPEDS retention (persistence) rate differs from persistence rates reported on page 89 because IPEDS includes summer starts and excludes education abroad students.
0% 25% 50% 75% 100%
Oklahoma State University
Kansas State University
Washington State University
Oregon State University
University of Tennessee, Knoxville
Iowa State University
Purdue University
Michigan State University
University of California, Davis
Texas A & M University
North Carolina State University
Virginia Tech
University of Illinois, Urbana-Champaign
Colorado State University
Institutional ResearchFACT BOOK 2014-15STUDENT INFORMATION
92

Institutional ResearchFACT BOOK 2014-15
STUDENT INFORMATION 93
Summer Session
Resident Students Non-Resident Students Total Students
Undergraduate Students
Freshmen 178 216 394
Sophomores 480 168 648
Juniors 1,035 309 1,344
Seniors 2,022 395 2,417
Total Undergraduate Students 3,715 1,088 4,803
Graduate Students
Master’s 469 149 618
Doctoral 151 49 200
Total Graduate Students 620 198 818
Professional Veterinary Medicine 72 56 128
Total Students 4,407 1,342 5,749
Enrollment by Student Class - Summer 2014
Note: For additional information on summer session enrollment, please refer to the student enrollment section on the Institutional Research website at www.ir.colos-tate.edu/enrollment.aspx.
Total Summer Session Enrollment = 5,749
Freshmen7%
Sophomores11%
Juniors23%
Seniors42%
Master’s11%
Doctoral4%
PVM2%

Institutional ResearchFACT BOOK 2014-15STUDENT INFORMATION
94
Summer Session
Undergraduate Courses with the Largest Enrollments for Summer 2014
History of Summer Session FTE
Course Course Title Enrollment
NR 220 Natural Resources Ecology and Measurements 192
CHEM 113 General Chemistry II 105
JTC 300 Professional and Technical Communications 100
SPCM 200 Public Speaking 100
MATH 118 College Algebra in Context II 97
MATH 124 Logarithmic and Exponential Functions 92
CHEM 111 General Chemistry I 89
MATH 125 Numerical Trigonometry 88
ECON 202 Principles of Microeconomics 85
CHEM 245 Fundamentals of Organic Chemistry 84
STAT 301 Introduction to Statistical Methods 84
BMS 301 Human Gross Anatomy 81
BMS 300 Principles of Human Physiology 76
SPCM 100 Communication and Popular Culture 76
Summer2005
Summer2006
Summer2007
Summer2008
Summer2009
Summer2010
Summer2011
Summer2012
Summer2013
Summer2014
SM05 - SM14 Change
Agricultural Sci 16.9 14.9 15.3 16.0 17.7 21.5 16.6 21.8 18.9 25.8 53%
Business 167.1 151.0 126.2 117.3 122.2 130.6 125.3 115.0 115.7 105.0 -37%
Engineering 16.9 14.6 17.5 14.4 17.6 19.3 21.1 17.5 17.3 16.9 0%
Health & Human Sciences 222.1 227.3 222.2 192.0 174.6 178.5 185.0 168.1 187.2 184.3 -17%
Intra-University 1.7 1.4 1.7 0.0 2.0 1.6 1.7 1.7 1.1 1.2 -29%
Liberal Arts 386.6 367.3 320.3 324.6 317.4 326.6 292.5 270.6 237.8 204.3 -47%
Natural Sciences 292.4 284.4 288.3 259.8 272.3 300.4 310.9 286.3 307.5 266.5 -9%
Veterinary Med &Biomedical Sci 88.2 89.3 88.7 89.6 93.0 97.1 96.8 103.7 101.7 94.7 7%
Warner College of Natural Resources 56.0 54.2 52.5 61.9 54.2 62.9 69.7 64.5 70.8 60.7 8%
Total FTE 1,247.9 1,204.4 1,132.7 1,075.6 1,071.0 1,138.5 1,119.6 1,049.2 1,058.0 959.4 -23%
Note: FTE is calculated by dividing student credit hours by 30. Course credit reassignment is included. For additional information on summer session student credit hours and FTE, please refer to the student credit hour and FTE section on the Institutional Research website at www.ir.colostate.edu/credit-hours-fte.aspx.

Undergraduate Class Size
Fall TermPercentage of Sections with Fewer
Than 20 StudentsPercentage of Sections with 50 or
More Students
2004 37% 18%
2005 38% 17%
2006 39% 16%
2007 37% 17%
2008 37% 17%
2009 35% 18%
2010 34% 19%
2011 33% 19%
2012 34% 18%
2013 37% 19%
Fewer Than 20 and 50 or More StudentsPercentage of Undergraduate Sections with
Note: For additional information on student class size, please refer to the class size section on the Institutional Research website at www.ir.colostate.edu/class-section.aspx.
0%
20%
40%
60%
Fall2004
Fall2007
Fall2010
Fall2013
Sections with Fewer Than 20 Students
Sections with 50 or More Students
Institutional ResearchFACT BOOK 2014-15
STUDENT INFORMATION 95

Undergraduate Class Size
Average Class Size by College - Academic Year 2013-14Lower Level
LecturesUpper Level
LecturesLower Level
LabsUpper Level
LabsLower LevelRecitations
Upper LevelRecitations
Agricultural Sciences
Number of Sections 56 132 67 107 21 5
Mean Class Size 67 34 21 18 17 12
Largest Class 274 157 49 45 49 22
Business
Number of Sections 132 288 --- 2 --- ---
Mean Class Size 53 46 --- 15 --- ---
Largest Class 155 109 --- 20 --- ---
Engineering
Number of Sections 42 102 91 112 --- 4
Mean Class Size 97 45 20 20 --- 59
Largest Class 191 153 32 136 --- 100
Health & Human Sciences
Number of Sections 139 262 124 190 1 40
Mean Class Size 58 41 24 20 17 26
Largest Class 252 151 68 85 17 52
Intra-University
Number of Sections 63 24 149 4 37 5
Mean Class Size 74 38 22 23 17 35
Largest Class 312 134 57 29 25 59
Institutional ResearchFACT BOOK 2014-15STUDENT INFORMATION
96

Undergraduate Class Size
Average Class Size by College - Academic Year 2013-14Lower Level
LecturesUpper Level
LecturesLower Level
LabsUpper Level
LabsLower LevelRecitations
Upper LevelRecitations
Liberal Arts
Number of Sections 993 782 174 193 133 93
Mean Class Size 41 27 17 13 26 24
Largest Class 306 125 233 63 40 49
Natural Sciences
Number of Sections 231 208 535 179 160 25
Mean Class Size 111 55 26 18 38 19
Largest Class 339 243 245 50 76 43
Veterinary Medicine & Biomedical Sciences
Number of Sections 7 57 3 36 9 9
Mean Class Size 55 75 14 41 48 75
Largest Class 148 302 17 99 77 131
Warner College of Natural Resources
Number of Sections 31 113 61 84 --- 12
Mean Class Size 122 38 24 21 --- 22
Largest Class 344 199 78 46 --- 49
University Summary
Number of Sections 1,694 1,968 1,204 907 361 193
Mean Class Size 58 38 23 19 30 27
Largest Class 344 302 245 136 77 131
Institutional ResearchFACT BOOK 2014-15
STUDENT INFORMATION 97

Undergraduate Class Size
Lower Division Lecture Courses
Upper Division Lecture Courses
Agricultural Sciences 67 34
Business 53 46
Engineering 97 45
Health & Human Sciences 58 41
Intra-University 74 38
Liberal Arts 41 27
Natural Sciences 111 55
Veterinary Medicine & Biomedical Sciences 55 75
Warner College of Natural Resources 122 38
University Summary 58 38
Average Class Size for Lecture CoursesAcademic Year 2013-14
0 50 100 150
Liberal Arts
Business
Veterinary Medicine & Biomedical Sciences
Health & Human Sciences
Agricultural Sciences
Intra-University
Engineering
Natural Sciences
Warner College of Natural Resources
Lower Division Lecture Courses Upper Division Lecture Courses
Institutional ResearchFACT BOOK 2014-15STUDENT INFORMATION
98

Undergraduate Class Size
Percentage of Classes with FewerThan 20 Students
Colorado State University 37%
Iowa State University 30%
Kansas State University 41%
Michigan State University 25%
North Carolina State University 28%
Oklahoma State University 36%
Oregon State University 28%
Purdue University 38%
Texas A & M University 21%
University of California, Davis 40%
University of Illinois, Urbana-Champaign 42%
University of Tennessee, Knoxville 28%
Virginia Tech 27%
Washington State University 37%
Source: Common Data Set, 2013-14
0% 20% 40% 60%
Texas A & M University
Michigan State University
Virginia Tech
University of Tennessee, Knoxville
Oregon State University
North Carolina State University
Iowa State University
Oklahoma State University
Washington State University
Purdue University
University of California, Davis
Kansas State University
University of Illinois, Urbana-Champaign
Colorado State University
Board of Governors’ Peer Group Comparison - Fall 2013Percentage of Classes with 50 or More Students
Institutional ResearchFACT BOOK 2014-15
STUDENT INFORMATION 99

Undergraduate Class Size
Board of Governors’ Peer Group Comparison - Fall 2013Percentage of Classes with 50 or More Students
Percentage of Classes with 50 orMore Students
Colorado State University 19%
Iowa State University 23%
Kansas State University 13%
Michigan State University 22%
North Carolina State University 17%
Oklahoma State University 12%
Oregon State University 22%
Purdue University 18%
Texas A & M University 25%
University of California, Davis 23%
University of Illinois, Urbana-Champaign 20%
University of Tennessee, Knoxville 15%
Virginia Tech 20%
Washington State University 20%
Source: Common Data Set, 2013-14
0% 10% 20% 30%
Texas A & M University
University of California, Davis
Iowa State University
Oregon State University
Michigan State University
Washington State University
University of Illinois, Urbana-Champaign
Virginia Tech
Purdue University
North Carolina State University
University of Tennessee, Knoxville
Kansas State University
Oklahoma State University
Colorado State University
Institutional ResearchFACT BOOK 2014-15STUDENT INFORMATION
100

Institutional Research FACT BOOK 2014-15
STUDENT INFORMATION 101
Undergraduate Credit Hour Production by Faculty Type
UndergraduateCredit Hours
Percentage Taught byFaculty Type
Tenure-Track Full Professors 92,598.3 15%
Tenure-Track Associate Professors 85,090.0 14%
Tenure-Track Assistant Professors 47,618.7 8%
Special Faculty 195,502.6 32%
Temporary Faculty 72,402.6 12%
Graduate Assistants 71,874.6 12%
Other Employees 44,387.2 7%
University Total 609,483.0 100%
Percentage of Undergraduate Student Credit Hours
Total Undergraduate Student Credits Hours Taught = 609,483.0
Taught by Faculty Type
Note: The time period used is academic year 2013-14. The “Other Employees” category includes deans, associate deans, administrative professionals and state classi-fied staff. Full professors, associate professors and assistant professors include only those on tenure-track appointments. Credit hours by college may not match credit hours on other reports because this section is reported by course department and does not include credit assignment. For additional information, please refer to the Undergraduate Credit Hour Production by Faculty Type Report on the Institutional Research website at www.ir.colostate.edu/faculty.aspx.
Graduate Assistants12%
Other Employees7%
Associate Professors14%
Assistant Professors8%
Special Faculty32%
Temporary Faculty12%
Full Professors15%
Tenure-Track
Tenure-Track
Tenure-Track

Institutional ResearchFACT BOOK 2014-15STUDENT INFORMATION
102
Undergraduate Credit Hour Production by Faculty Type
History of Undergraduate Credit Hours Taught by Tenure-Track Faculty
AY2004-05
AY2005-06
AY2006-07
AY2007-08
AY2008-09
AY2009-10
AY2010-11
AY2011-12
AY2012-13
AY2013-14
AY 2004-05 to AY 2013-14
Point Change
Agricultural Sciences 80% 76% 76% 78% 76% 76% 78% 74% 75% 72% -8
Business 50% 43% 36% 37% 48% 52% 51% 49% 47% 41% -9
Engineering 76% 60% 69% 76% 79% 83% 80% 71% 72% 70% -6
Health & Human Sci 42% 41% 43% 41% 47% 49% 45% 38% 34% 36% -6
Liberal Arts 40% 38% 36% 38% 35% 39% 34% 30% 27% 25% -15
Natural Sciences 41% 41% 37% 37% 37% 45% 42% 41% 39% 35% -6
Veterinary Med &Biomedical Sciences 56% 64% 63% 66% 68% 67% 67% 66% 65% 73% 17
Warner College of Natural Resources 68% 64% 68% 75% 72% 71% 73% 59% 61% 50% -18
University Summary 47% 43% 42% 43% 44% 48% 45% 41% 40% 37% -10
AY 2004-05 to AY 2013-14 Percentage Point Change Undergraduate Credit Hours Taught by Tenure-Track Faculty
-30
-20
-10
0
10
20
30
AgriculturalSciences
Business Engineering Health &Human Sci
LiberalArts
NaturalSciences
Vet Med &Bio Sci
Warner Coll ofNat Res

Undergraduate Grade Point Average
First-Year CSU Grade Point Average and CDHE Index for Fall 2013 Entering Freshmen
Note: The University GPA by Index Group graph displays the minimum and maximum in green and yellow. Box plots represent the 25th and 75th percentiles; whiskers represent the 10th and 90th percentiles. Medians are labeled. For additional information on the GPA for new, first-time freshmen, please refer to the Fresh-man Profile on the Institutional Research website at www.ir.colostate.edu/freshman_profile.aspx.
Institutional ResearchFACT BOOK 2014-15
STUDENT INFORMATION 103

Undergraduate Grade Point Average
History of Undergraduate Term GPA by CollegeFall2004
Fall2005
Fall2006
Fall2007
Fall2008
Fall2009
Fall2010
Fall2011
Fall2012
Fall2013
FA04 - FA13 Point Change
Agricultural Sciences 2.90 2.90 2.86 2.84 2.85 2.83 2.83 2.80 2.84 2.90 0.00
Business 3.07 3.10 3.10 3.10 3.07 3.12 3.12 3.14 3.13 3.12 0.05
Engineering 2.74 2.82 2.75 2.64 2.70 2.70 2.75 2.87 2.80 2.84 0.10
Health & Human Sci 2.91 2.90 2.87 2.86 2.90 2.94 2.95 2.98 3.01 2.99 0.08
Intra-University 2.50 2.47 2.49 2.42 2.55 2.60 2.56 2.65 2.66 2.68 0.18
Liberal Arts 2.89 2.87 2.87 2.88 2.89 2.94 2.94 2.95 2.96 2.97 0.08
Natural Sciences 2.81 2.80 2.79 2.75 2.77 2.82 2.81 2.80 2.83 2.80 -0.01
Veterinary Medicine &Biomedical Sciences 2.84 2.87 2.90 2.97 3.11 3.18 3.20 3.15 3.17 3.08 0.24
Warner College ofNatural Resources 2.75 2.75 2.79 2.79 2.86 2.83 2.81 2.83 2.88 2.82 0.07
University Summary 2.83 2.83 2.82 2.80 2.84 2.87 2.85 2.87 2.87 2.91 0.08
Fall 2004 to Fall 2013 Percentage Point Change in Undergraduate Term GPA by College
-0.10
0.00
0.10
0.20
0.30
AgriculturalSciences
Business Engineering Health &Human Sci
Intra-University
LiberalArts
NaturalSciences
Vet Med &Bio Sci
Warner Collof Nat Res
Institutional ResearchFACT BOOK 2014-15STUDENT INFORMATION
104

Institutional ResearchFACT BOOK 2014-15
STUDENT INFORMATION 105
Undergraduate Service Load
Percent of Credit Hours Taken by College Majors
Percent of Credit Hours Taken by Non-College Majors
Total Credit Hours
Agricultural Sciences 67% 33% 26,717
Business 66% 34% 60,878
Engineering 97% 3% 29,145
Health & Human Sciences 79% 21% 67,892
Intra-University 11% 89% 26,946
Liberal Arts 46% 54% 202,449
Natural Sciences 38% 62% 147,303
Veterinary Medicine & Biomedical Sciences 33% 67% 19,100
Warner College of Natural Resources 63% 37% 26,056
University Summary 52% 48% 606,486
Note: The time period used is academic year 2013-14. Majors indicate the percentage of credit hours generated by majors in a college while non-majors indicate the percentage of credit hours generated by majors outside a college. Undergraduate student credit hours in this section will not match those reported in other sections since this section includes undergraduate students in undergraduate courses and excludes course credit reassignment. For additional information, please refer to the Service Load Analysis on the Institutional Research website at www.ir.colostate.edu/credit-hours-fte.aspx.
All Undergraduate Courses by CollegeCredit Hours Generated by Majors and Non-Majors
0% 25% 50% 75% 100%
Intra-University
Veterinary Medicine & Biomedical Sciences
Natural Sciences
Liberal Arts
Warner College of Natural Resources
Business
Agricultural Sciences
Health & Human Sciences
Engineering
College Majors Non-College Majors
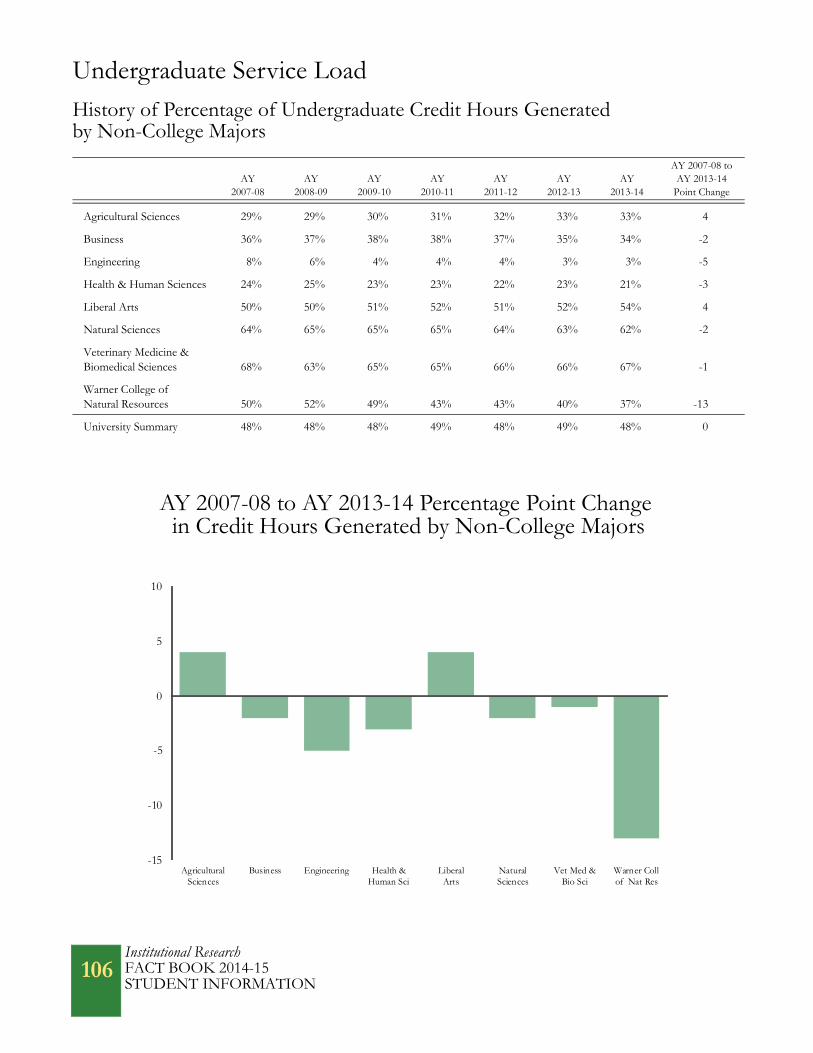
Institutional ResearchFACT BOOK 2014-15STUDENT INFORMATION
106
Undergraduate Service Load
History of Percentage of Undergraduate Credit Hours Generatedby Non-College Majors
AY 2007-08
AY 2008-09
AY 2009-10
AY2010-11
AY2011-12
AY2012-13
AY2013-14
AY 2007-08 to AY 2013-14
Point Change
Agricultural Sciences 29% 29% 30% 31% 32% 33% 33% 4
Business 36% 37% 38% 38% 37% 35% 34% -2
Engineering 8% 6% 4% 4% 4% 3% 3% -5
Health & Human Sciences 24% 25% 23% 23% 22% 23% 21% -3
Liberal Arts 50% 50% 51% 52% 51% 52% 54% 4
Natural Sciences 64% 65% 65% 65% 64% 63% 62% -2
Veterinary Medicine &Biomedical Sciences 68% 63% 65% 65% 66% 66% 67% -1
Warner College ofNatural Resources 50% 52% 49% 43% 43% 40% 37% -13
University Summary 48% 48% 48% 49% 48% 49% 48% 0
AY 2007-08 to AY 2013-14 Percentage Point Change in Credit Hours Generated by Non-College Majors
-15
-10
-5
0
5
10
AgriculturalSciences
Business Engineering Health &Human Sci
LiberalArts
NaturalSciences
Vet Med &Bio Sci
Warner Collof Nat Res
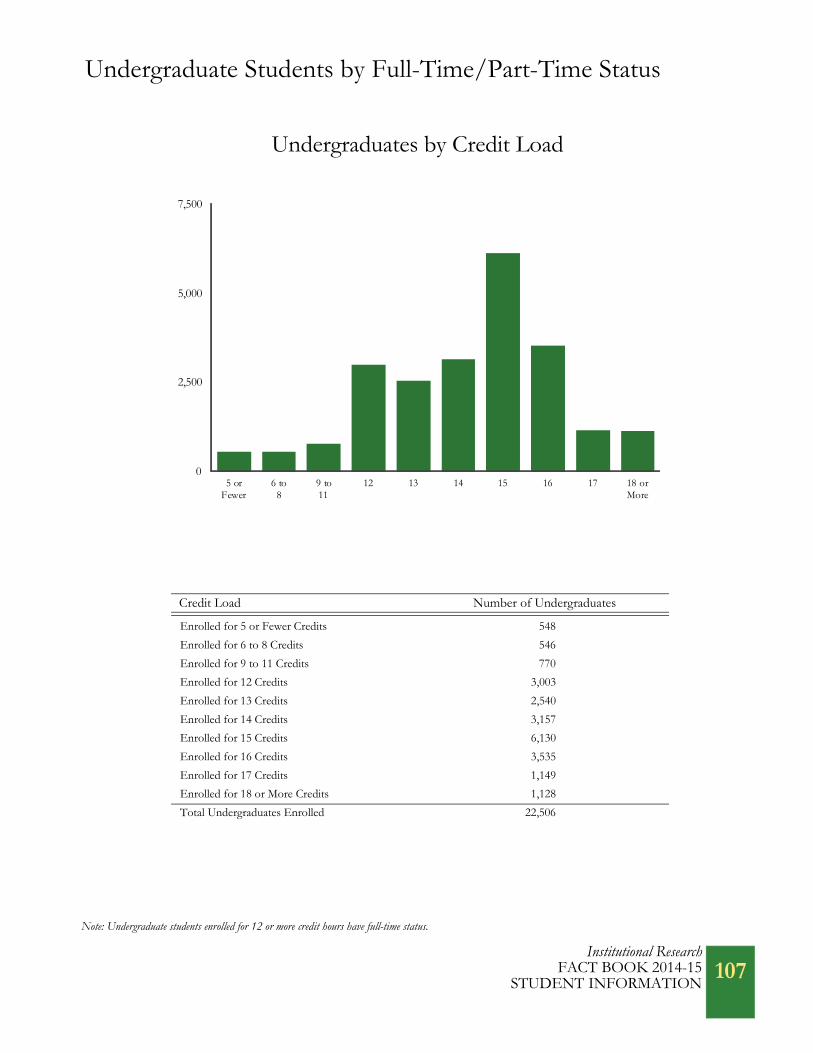
Undergraduate Students by Full-Time/Part-Time Status
Credit Load Number of Undergraduates
Enrolled for 5 or Fewer Credits 548
Enrolled for 6 to 8 Credits 546
Enrolled for 9 to 11 Credits 770
Enrolled for 12 Credits 3,003
Enrolled for 13 Credits 2,540
Enrolled for 14 Credits 3,157
Enrolled for 15 Credits 6,130
Enrolled for 16 Credits 3,535
Enrolled for 17 Credits 1,149
Enrolled for 18 or More Credits 1,128
Total Undergraduates Enrolled 22,506
Undergraduates by Credit Load
Note: Undergraduate students enrolled for 12 or more credit hours have full-time status.
0
2,500
5,000
7,500
5 orFewer
6 to8
9 to11
12 13 14 15 16 17 18 orMore
Institutional ResearchFACT BOOK 2014-15
STUDENT INFORMATION 107

Undergraduate Students by Full-Time/Part-Time Status
Enrolled for5 or fewer Credits
Enrolled for6-8 Credits
Enrolled for9-11 Credits
Enrolled for12-14 Credits
Enrolled for 15 or More Credits
TotalStudents
Agricultural Sciences 37 30 46 541 708 1,362
Business 20 28 31 625 1,459 2,163
Engineering 45 43 66 974 1,157 2,285
Health & Human Sciences 92 120 162 1,692 2,136 4,202
Intra-University 72 48 76 1,110 1,253 2,559
Liberal Arts 122 109 158 1,399 2,421 4,209
Natural Sciences 103 109 151 1,458 1,820 3,641
Veterinary Medicine & Biomedical Sciences 5 11 19 260 330 625
Warner College ofNatural Resources 52 48 61 641 658 1,460
University Summary 548 546 770 8,700 11,942 22,506
Undergraduate Students by Credit Load
0% 25% 50% 75% 100%
Veterinary Medicine & Biomedical Sciences
Intra-University
Natural Sciences
Engineering
Health & Human Sciences
Agricultural Sciences
Warner College of Natural Resources
Liberal Arts
Business
15 or More Credits 12-14 Credits 9-11 Credits 6-8 Credits 5 or fewer
Institutional ResearchFACT BOOK 2014-15STUDENT INFORMATION
108

Education Abroad
Program Participants Percent by Program
For Credit - More Than Eight Weeks 494 41.7%
For Credit - Eight Weeks or Less 346 29.2%
Not for Credit - More Than Two Weeks 80 6.8%
Not for Credit - Two Weeks or Less 260 21.9%
Non-CSU Participants 5 0.4%
Total Education Abroad Students 1,185 100.0%
Education Abroad Participants by Program Type
Total Education Abroad Students = 1,185
Source: Office of International ProgramsNote: Exchange students attending CSU are not counted.
For Credit - More Than
For Credit - Eight Weeks
Not for Credit - More Than
Not for Credit - Two Weeks or Less - 21.9%
Non-CSU Participants0.4%
Two Weeks - 6.8%
or Less - 29.2%
Eight Weeks - 41.7%
Institutional ResearchFACT BOOK 2014-15
STUDENT INFORMATION109

Education Abroad
Education Abroad by CountryProgram
ParticipantsProgram
Participants
Africa and the Middle East Americas
Burkina Faso 1 Argentina 14
Ethiopia 8 Bahamas 12
Kenya 47 Belize 10
Malawi 1 Brazil 14
Mali 1 Brazil, Argentina 1
Morocco 16 Canada 62
Rwanda 1 Chile 22
South Africa 13 Columbia 4
Tanzania 3 Costa Rica 32
Uganda, Kenya 1 Cuba 3
Zimbabwe 1 Dominican Republic 2
Cyprus 2 Ecuador 16
Israel 3 El Salvador 10
Jordan 5 Honduras 3
Turkey 1 Mexico 57
United Arab Emirates 1 Nicaragua 25
Nicaragua, Costa Rica 1
Panama 17
Peru 13
Peru, Ecuador 1
Trinidad and Tobago 4
Uruguay 1
Total Africa and the Middle East 105 Total Americas 324
Institutional ResearchFACT BOOK 2014-15STUDENT INFORMATION
110

Education Abroad
Education Abroad by CountryProgram
ParticipantsProgram
Participants
Asia Europe (continued)
Bhutan 3 Italy 91
China 95 Italy, Switzerland 2
India 18 Multiple - Europe 25
Japan 43 Netherlands 7
Kazakhstan 1 Norway 3
Korea (South) 2 Poland 3
Mongolia 2 Portugal 1
Nepal 5 Russia 1
Sri Lanka 1 SeaMester 1
Thailand 6 Spain 80
Vietnam 7 Sweden 1
Switzerland 1
Total Asia 183 United Kingdom 66
Total Europe 458
Europe
Austria 5 Oceania, Indian Ocean, Antarctica
Belgium 5 Australia 33
Belgium, Austria 1 Fiji 2
Bulgaria 1 Indonesia 1
Czech Republic 51 New Guinea 1
Czech Republic, France 1 New Zealand 44
Denmark 5 New Zealand, Antarctica 1
Denmark, Germany 1 Philippines 3
Estonia 2 SeaMester 1
Finland 1 Total Oceania, Indian Ocean, Antarctica 86
France 28
France, Italy 16
Germany 20
Greece 1 Multiple Regions
Hungary 1 Semester at Sea 29
Iceland 6 Total Multiple Regions 29
Ireland 31 Total Participants 1,185
Institutional ResearchFACT BOOK 2014-15
STUDENT INFORMATION111
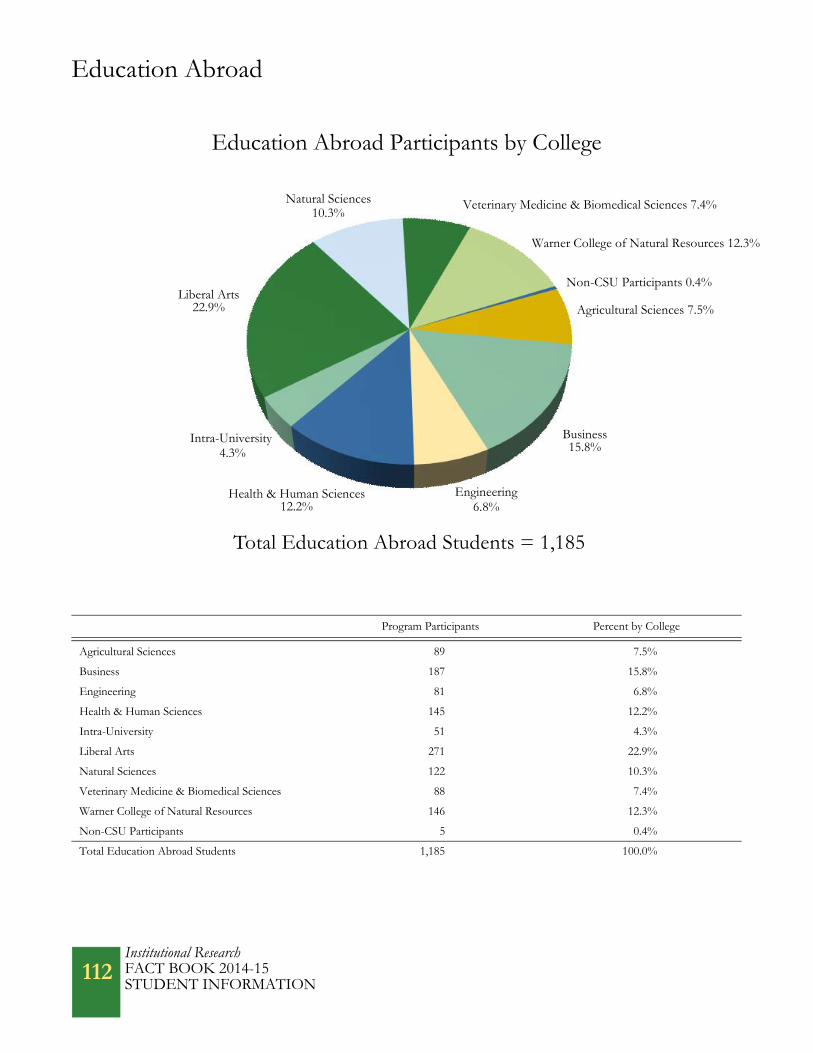
Education Abroad
Program Participants Percent by College
Agricultural Sciences 89 7.5%
Business 187 15.8%
Engineering 81 6.8%
Health & Human Sciences 145 12.2%
Intra-University 51 4.3%
Liberal Arts 271 22.9%
Natural Sciences 122 10.3%
Veterinary Medicine & Biomedical Sciences 88 7.4%
Warner College of Natural Resources 146 12.3%
Non-CSU Participants 5 0.4%
Total Education Abroad Students 1,185 100.0%
Education Abroad Participants by College
Total Education Abroad Students = 1,185
Natural Sciences10.3%
Liberal Arts22.9%
Health & Human Sciences12.2%
Intra-University 4.3%
Veterinary Medicine & Biomedical Sciences 7.4%
Warner College of Natural Resources 12.3%
Business15.8%
Agricultural Sciences 7.5%
Engineering6.8%
Non-CSU Participants 0.4%
Institutional ResearchFACT BOOK 2014-15STUDENT INFORMATION
112
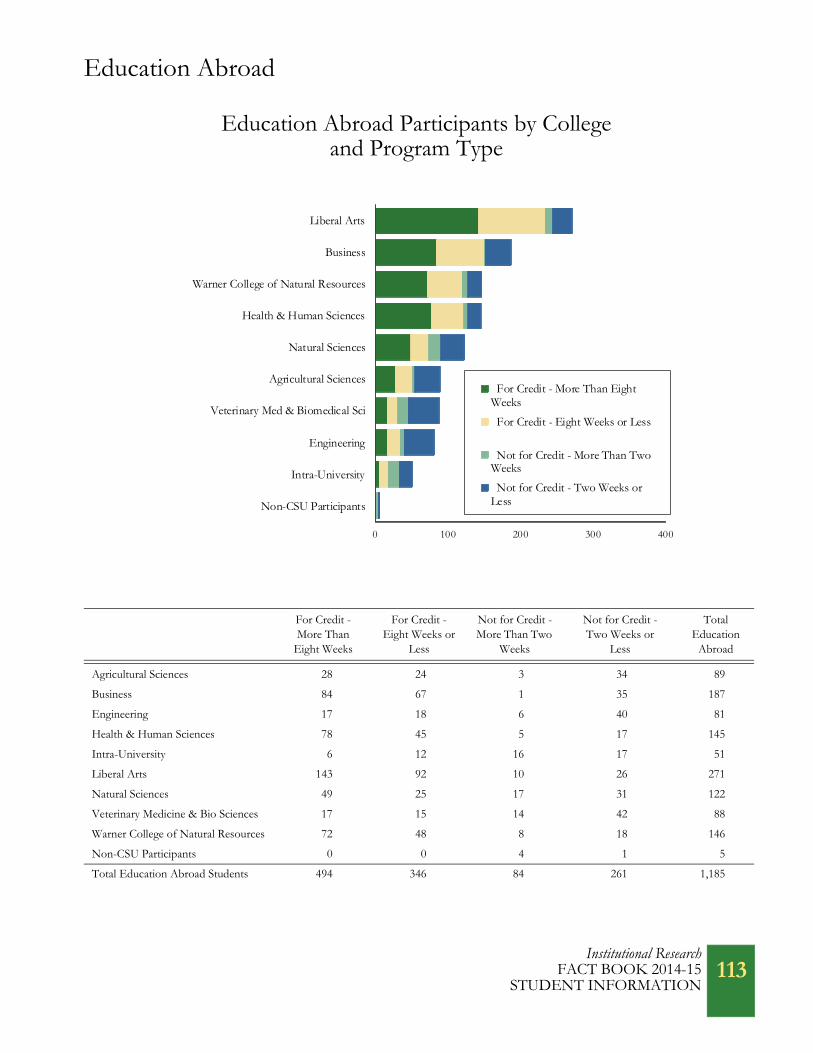
Education Abroad
For Credit -More Than
Eight Weeks
For Credit - Eight Weeks or
Less
Not for Credit -More Than Two
Weeks
Not for Credit -Two Weeks or
Less
TotalEducation
Abroad
Agricultural Sciences 28 24 3 34 89
Business 84 67 1 35 187
Engineering 17 18 6 40 81
Health & Human Sciences 78 45 5 17 145
Intra-University 6 12 16 17 51
Liberal Arts 143 92 10 26 271
Natural Sciences 49 25 17 31 122
Veterinary Medicine & Bio Sciences 17 15 14 42 88
Warner College of Natural Resources 72 48 8 18 146
Non-CSU Participants 0 0 4 1 5
Total Education Abroad Students 494 346 84 261 1,185
Education Abroad Participants by College and Program Type
0 100 200 300 400
Non-CSU Participants
Intra-University
Engineering
Veterinary Med & Biomedical Sci
Agricultural Sciences
Natural Sciences
Health & Human Sciences
Warner College of Natural Resources
Business
Liberal Arts
For Credit - More Than EightWeeks
For Credit - Eight Weeks or Less
Not for Credit - More Than TwoWeeks
Not for Credit - Two Weeks orLess
Institutional ResearchFACT BOOK 2014-15
STUDENT INFORMATION113

Education Abroad
For Credit - More ThanEight Weeks
For Credit - EightWeeks or Less
Not forCredit
TotalEducation Abroad
2004-05 409 154 -- 563
2005-06 343 164 103 610
2006-07 373 212 130 715
2007-08 452 163 253 868
2008-09 429 212 265 906
2009-10 389 244 331 964
2010-11 367 280 413 1,060
2011-12 460 278 407 1,145
2012-13 441 393 538 1,372
2013-14 494 346 345 1,185
History of Education Abroad Programs
Note: The not-for-credit count in 2012-13 includes 222 members of the Marching Band trip to Dublin, Ireland. Exchange students attending CSU are not counted.
0
500
1,000
1,500
2004-05 20 07-08 2010-11 2013-14
For Credit - More Than Eight Weeks For Credit - Eight Weeks or Less Not for Credit
Institutional ResearchFACT BOOK 2014-15STUDENT INFORMATION
114
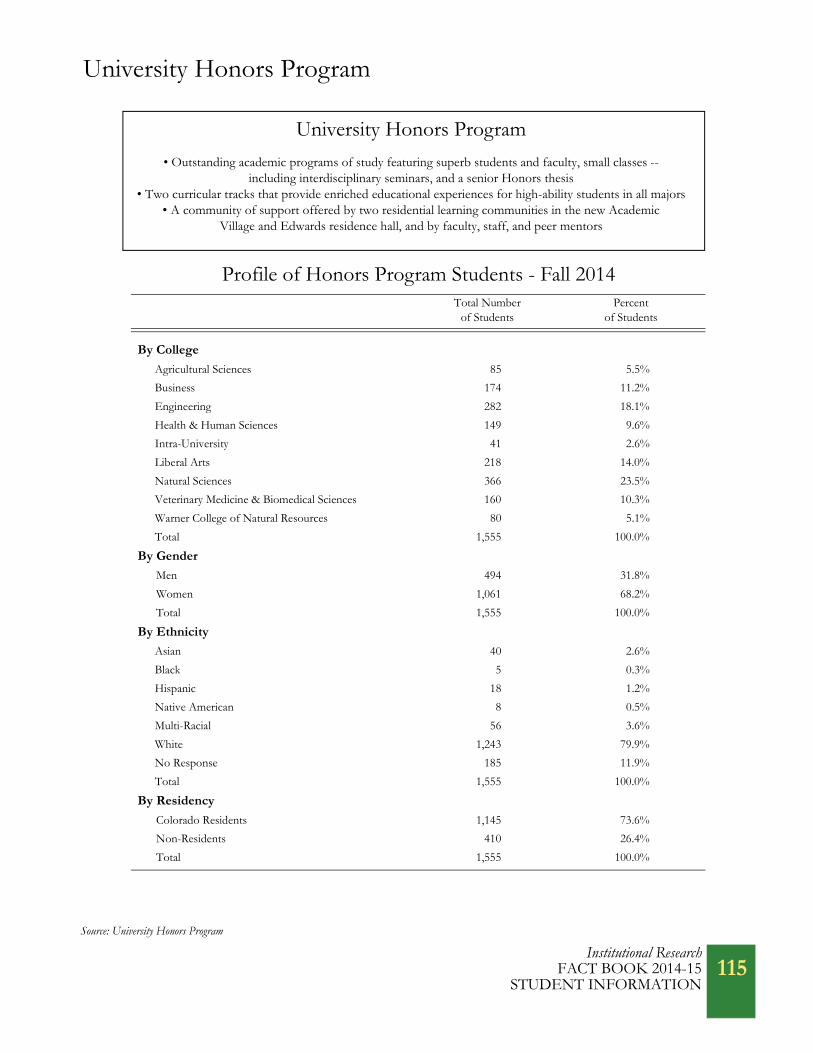
University Honors Program
Profile of Honors Program Students - Fall 2014Total Number
of StudentsPercent
of Students
By College
Agricultural Sciences 85 5.5%
Business 174 11.2%
Engineering 282 18.1%
Health & Human Sciences 149 9.6%
Intra-University 41 2.6%
Liberal Arts 218 14.0%
Natural Sciences 366 23.5%
Veterinary Medicine & Biomedical Sciences 160 10.3%
Warner College of Natural Resources 80 5.1%
Total 1,555 100.0%
By Gender
Men 494 31.8%
Women 1,061 68.2%
Total 1,555 100.0%
By Ethnicity
Asian 40 2.6%
Black 5 0.3%
Hispanic 18 1.2%
Native American 8 0.5%
Multi-Racial 56 3.6%
White 1,243 79.9%
No Response 185 11.9%
Total 1,555 100.0%
By Residency
Colorado Residents 1,145 73.6%
Non-Residents 410 26.4%
Total 1,555 100.0%
University Honors Program
• Outstanding academic programs of study featuring superb students and faculty, small classes -- including interdisciplinary seminars, and a senior Honors thesis
• Two curricular tracks that provide enriched educational experiences for high-ability students in all majors• A community of support offered by two residential learning communities in the new Academic
Village and Edwards residence hall, and by faculty, staff, and peer mentors
Source: University Honors Program
Institutional ResearchFACT BOOK 2014-15
STUDENT INFORMATION 115

University Honors Program
Term Headcount
Fall 2005 249
Fall 2006 286
Fall 2007 369
Fall 2008 326
Fall 2009 384
Fall 2010 352
Fall 2011 360
Fall 2012 364
Fall 2013 384
Fall 2014 377
Academic Year Headcount
2004-05 148
2005-06 142
2006-07 142
2007-08 160
2008-09 148
2009-10 224
2010-11 258
2011-12 280
2012-13 349
2013-14 315
University Honors Program New Freshmen and Graduates
History of Entering New Freshmen
History of Honors Program Graduates
0
100
200
300
400
500
Fall 2005 Fall 2008 Fall 2011 Fall 2014
0
100
200
300
400
2004-05 2007-08 2010-11 2013-14
Institutional ResearchFACT BOOK 2014-15STUDENT INFORMATION
116
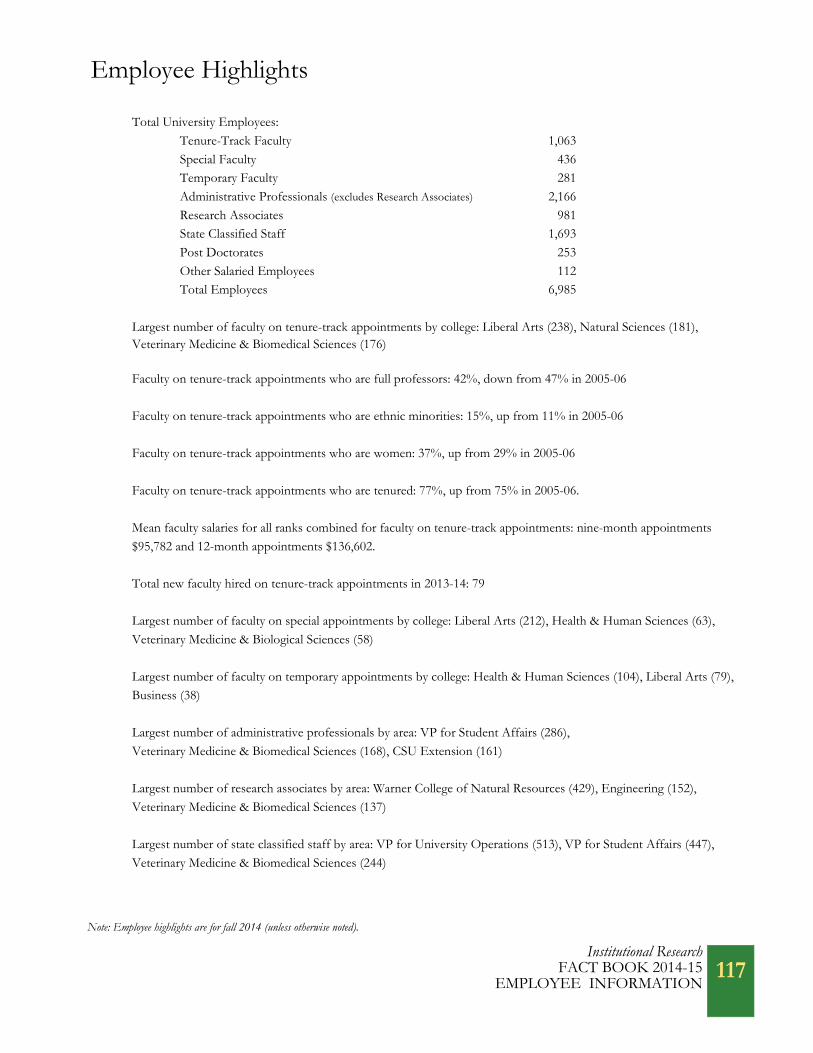
Employee Highlights
Total University Employees:
Tenure-Track Faculty 1,063
Special Faculty 436Temporary Faculty 281
Administrative Professionals (excludes Research Associates) 2,166
Research Associates 981State Classified Staff 1,693
Post Doctorates 253
Other Salaried Employees 112Total Employees 6,985
Largest number of faculty on tenure-track appointments by college: Liberal Arts (238), Natural Sciences (181),Veterinary Medicine & Biomedical Sciences (176)
Faculty on tenure-track appointments who are full professors: 42%, down from 47% in 2005-06
Faculty on tenure-track appointments who are ethnic minorities: 15%, up from 11% in 2005-06
Faculty on tenure-track appointments who are women: 37%, up from 29% in 2005-06
Faculty on tenure-track appointments who are tenured: 77%, up from 75% in 2005-06.
Mean faculty salaries for all ranks combined for faculty on tenure-track appointments: nine-month appointments
$95,782 and 12-month appointments $136,602.
Total new faculty hired on tenure-track appointments in 2013-14: 79
Largest number of faculty on special appointments by college: Liberal Arts (212), Health & Human Sciences (63),
Veterinary Medicine & Biological Sciences (58)
Largest number of faculty on temporary appointments by college: Health & Human Sciences (104), Liberal Arts (79),
Business (38)
Largest number of administrative professionals by area: VP for Student Affairs (286),
Veterinary Medicine & Biomedical Sciences (168), CSU Extension (161)
Largest number of research associates by area: Warner College of Natural Resources (429), Engineering (152),
Veterinary Medicine & Biomedical Sciences (137)
Largest number of state classified staff by area: VP for University Operations (513), VP for Student Affairs (447),
Veterinary Medicine & Biomedical Sciences (244)
Note: Employee highlights are for fall 2014 (unless otherwise noted).
Institutional ResearchFACT BOOK 2014-15
EMPLOYEE INFORMATION117


University Employees
Total Employees Percent of Total Employees
Faculty
Tenure-Track Faculty 1,063 15%
Special Faculty 436 6%
Temporary Faculty 281 4%
Total Faculty 1,780 25%
Administrative Professionals
Administrative Professionals 2,166 31%
Research Associates 981 14%
Total Administrative Professionals 3,147 45%
Other Employees
State Classified Staff 1,693 24%
Post Doctorates 253 4%
Other Salaried Employees 112 2%
Total Other Employees 2,058 30%
Total Employees 6,985 100%
Note: The “Other Salaried Employees” category includes Clinical Psychology Interns, Fellowship Grant Trainee Postdoctorals, Fellowship Grant Trainee Pre-doctorals, and Veterinary Interns. Research Associates are reported separately from other Administrative Professionals. Includes Administrative Professionals and Research Associates on temporary appointments. Includes employees as of September 30, 2014.
Total Employees = 6,985
University Employees
Tenure-Track Faculty15%
Special Faculty6%
Temporary Faculty4%
Administrative Professionals31%
Research Associates14%
State Classified Staff24%
Post Doctorates4%
Other Salaried Employees2%
119Institutional Research
FACT BOOK 2014-15 EMPLOYEE INFORMATION

University Employees
University Employees by Type and Agency, College or Administrative AreaTenure-Track
FacultySpecialFaculty
Temporary Faculty
Admin-istrative
ProfessionalsResearch
Associates
StateClassified
StaffPost
Doctorates
OtherSalaried
EmployeesTotal
Employees
Agencies
Agricultural Experiment Station 6 1 0 17 31 8 1 0 64
Colorado State Forest Service 0 0 0 79 0 21 0 0 100
CSU Extension 0 0 0 167 3 32 0 0 202
Colleges
Agricultural Sciences 96 20 8 51 61 17 13 2 268
Business 68 22 38 103 5 10 0 0 246
Engineering 108 11 10 171 160 20 35 30 545
Health & Human Sciences 104 63 104 75 36 18 2 1 403
Liberal Arts 238 212 79 65 4 32 0 0 630
Natural Sciences 181 31 24 102 55 47 49 16 505
Veterinary Medicine & Biomedical Sciences 176 58 8 179 143 244 123 52 983
Warner College of NaturalResources 66 8 6 88 443 20 27 7 665
Administration
President 0 0 0 119 0 3 0 0 122
Provost & Executive VP 0 0 0 33 0 2 0 0 35
Graduate School 0 0 2 10 0 9 0 0 21
International Programs 0 0 0 24 0 5 0 0 29
Libraries 20 3 1 43 1 59 0 0 127
VP for Advancement 0 0 0 75 0 13 0 0 88
VP for Diversity 0 0 0 3 0 1 0 0 4
VP for Engagement 0 0 1 51 2 12 0 0 66
VP for Enrollment & Access 0 0 0 102 0 63 0 0 165
VP for External Relations 0 0 0 42 0 22 0 0 64
VP for Faculty Affairs 0 0 0 25 0 1 0 0 26
VP for InformationTechnology 0 0 0 24 0 40 0 0 64
VP for Research 0 0 0 81 32 27 1 0 141
VP for Student Affairs 0 0 0 288 0 447 2 4 741
VP for Undergraduate Affairs 0 7 0 35 0 7 0 0 49
VP for University Operations 0 0 0 114 5 513 0 0 632
University Summary 1,063 436 281 2,166 981 1,693 253 112 6,985
Institutional ResearchFACT BOOK 2014-15EMPLOYEE INFORMATION
120
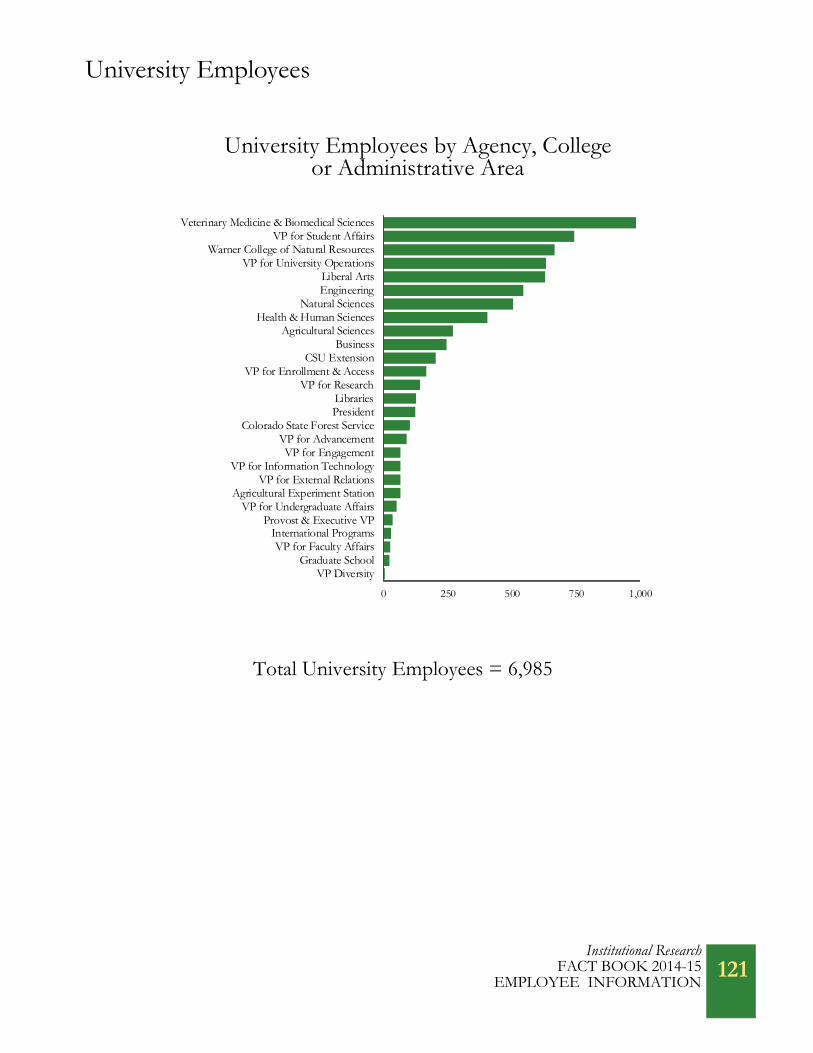
University Employees
University Employees by Agency, Collegeor Administrative Area
Total University Employees = 6,985
0 250 500 750 1,000
VP DiversityGraduate School
VP for Faculty AffairsInternational Programs
Provost & Executive VPVP for Undergraduate Affairs
Agricultural Experiment StationVP for External Relations
VP for Information TechnologyVP for Engagement
VP for AdvancementColorado State Forest Service
PresidentLibraries
VP for ResearchVP for Enrollment & Access
CSU ExtensionBusiness
Agricultural SciencesHealth & Human Sciences
Natural SciencesEngineeringLiberal Arts
VP for University OperationsWarner College of Natural Resources
VP for Student AffairsVeterinary Medicine & Biomedical Sciences
121Institutional Research
FACT BOOK 2014-15 EMPLOYEE INFORMATION

University Employees
History of University Employees
AY2005-06
AY2006-07
AY2007-08
AY2008-09
AY2009-10
AY2010-11
AY2011-12
AY2012-13
AY2013-14
AY2014-15
AY 2005-06 to AY 2014-15 Change
Tenure-Track Faculty 930 943 973 1,019 1,033 1,000 1,003 1,008 1,045 1,063 14%
Special Faculty 198 215 346 303 302 331 331 401 425 436 120%
Temporary Faculty 295 303 149 196 182 209 225 253 240 281 -5%
AdministrativeProfessionals 1,085 1,172 1,258 1,356 1,362 1,417 1,491 1,641 1,944 2,166 100%
Research Associates 858 867 891 902 894 877 866 863 905 981 14%
State Classified Staff 2,048 2,035 2,092 2,121 2,060 2,035 1,940 1,910 1,764 1,693 -17%
Other Employees 313 327 361 352 307 314 342 399 378 112 -64%
Total Employees 5,727 5,862 6,070 6,249 6,140 6,183 6,198 6,475 6,701 6,985 22%
AY 2005-06 to AY 2014-15Percent Change in University Employees
-50%
0%
50%
100%
150%
Tenure-TrackFaculty
SpecialFaculty
TemporaryFaculty
AdministrativeProfessionals
ResearchAssociates
State ClassifiedStaff
OtherEmployees
Institutional ResearchFACT BOOK 2014-15EMPLOYEE INFORMATION
122
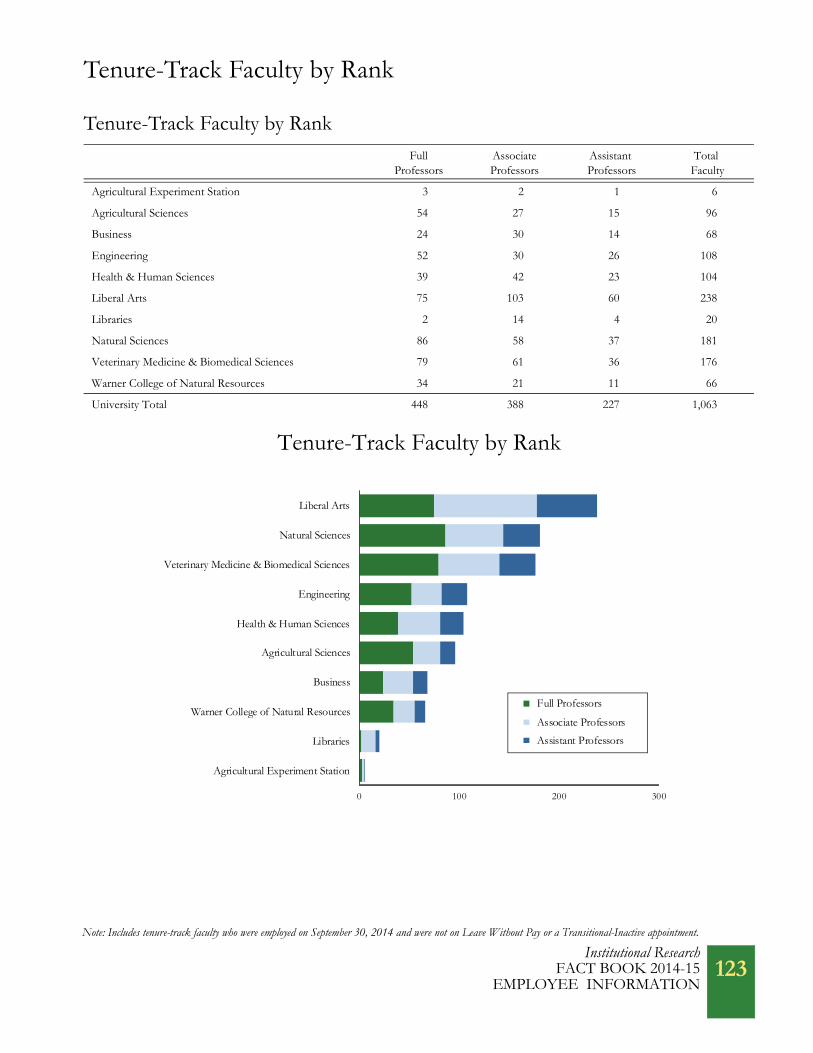
Tenure-Track Faculty by Rank
Tenure-Track Faculty by RankFull
ProfessorsAssociate Professors
Assistant Professors
Total Faculty
Agricultural Experiment Station 3 2 1 6
Agricultural Sciences 54 27 15 96
Business 24 30 14 68
Engineering 52 30 26 108
Health & Human Sciences 39 42 23 104
Liberal Arts 75 103 60 238
Libraries 2 14 4 20
Natural Sciences 86 58 37 181
Veterinary Medicine & Biomedical Sciences 79 61 36 176
Warner College of Natural Resources 34 21 11 66
University Total 448 388 227 1,063
Tenure-Track Faculty by Rank
Note: Includes tenure-track faculty who were employed on September 30, 2014 and were not on Leave Without Pay or a Transitional-Inactive appointment.
0 100 200 300
Agricultural Experiment Station
Libraries
Warner College of Natural Resources
Business
Agricultural Sciences
Health & Human Sciences
Engineering
Veterinary Medicine & Biomedical Sciences
Natural Sciences
Liberal Arts
Full Professors
Associate Professors
Assistant Professors
Institutional Research FACT BOOK 2014-15
EMPLOYEE INFORMATION 123

Tenure-Track Faculty by Rank
Percentage of Tenure-Track Faculty by RankFull
ProfessorsAssociateProfessors
AssistantProfessors
TotalFaculty
Agricultural Experiment Station 50% 33% 17% 100%
Agricultural Sciences 56% 28% 16% 100%
Business 35% 44% 21% 100%
Engineering 48% 28% 24% 100%
Health & Human Sciences 38% 40% 22% 100%
Liberal Arts 32% 43% 25% 100%
Libraries 10% 70% 20% 100%
Natural Sciences 48% 32% 20% 100%
Veterinary Medicine & Biomedical Sciences 45% 35% 20% 100%
Warner College of Natural Resources 52% 32% 17% 100%
University Total 42% 37% 21% 100%
Percentage of Tenure-Track Faculty by Rank
0% 25% 50% 75% 100%
Libraries
Liberal Arts
Health & Human Sciences
Business
Engineering
Warner College of Natural Resources
Natural Sciences
Veterinary Medicine & Biomedical Sciences
Agricultural Experiment Station
Agricultural Sciences
Full Professors Associate Professors Assistant Professors
Institutional ResearchFACT BOOK 2014-15EMPLOYEE INFORMATION
124

Tenure-Track Faculty by Rank
History of the Percentage of Full Professors by College
AY2005-06
AY2006-07
AY2007-08
AY2008-09
AY2009-10
AY2010-11
AY2011-12
AY2012-13
AY2013-14
AY2014-15
AY 2005-06 to AY 2014-15
Point Change
Agricultural Exp St - - - - - - - - - 50% N/A
Agricultural Sci 56% 54% 53% 50% 50% 50% 53% 55% 59% 56% 0
Business 40% 37% 33% 28% 31% 32% 33% 35% 34% 35% -5
Engineering 66% 61% 59% 55% 52% 49% 49% 48% 44% 48% -16
Health & Human Sciences 41% 42% 43% 40% 37% 36% 36% 37% 33% 38% -3
Liberal Arts 35% 34% 33% 31% 31% 29% 33% 32% 32% 32% -3
Libraries 14% 12% 15% 15% 16% 15% 10% 15% 11% 10% -4
Natural Sciences 53% 52% 49% 46% 45% 48% 48% 48% 47% 48% -5
Veterinary Med &Biomedical Sci 50% 48% 48% 44% 43% 45% 45% 44% 47% 45% -5
Warner College ofNatural Resources 56% 51% 47% 45% 43% 41% 41% 44% 46% 52% -4
University Total 47% 45% 44% 41% 40% 40% 42% 42% 42% 42% -5
AY 2005-06 to AY 2014-15 Percentage Point Change in Full Professors as a Percent of Total Faculty
-20
-10
0
10
20
AgriculturalExperiment
Station
AgriculturalSciences
Business Engineering Health &Human Sci
LiberalArts
Libraries NaturalSciences
Vet Med &Bio Sci
Warner Collof Nat Res
Institutional Research FACT BOOK 2014-15
EMPLOYEE INFORMATION 125

Tenure-Track Faculty by Rank
FullProfessors
AssociateProfessors
AssistantProfessors
TotalFaculty
Colorado State University 42% 36% 22% 1,009
Iowa State University 42% 33% 25% 1,224
Kansas State University 34% 34% 32% 855
Michigan State University 41% 29% 30% 2,015
North Carolina State University 43% 33% 24% 1,151
Oklahoma State University 38% 36% 26% 856
Oregon State University 28% 34% 38% 620
Purdue University 44% 32% 24% 1,827
Texas A & M University 48% 34% 18% 1,635
University of California, Davis 62% 22% 16% 1,249
University of Illinois, Urbana-Champaign 46% 31% 23% 1,777
University of Tennessee, Knoxville 40% 33% 27% 1,415
Virginia Tech 38% 37% 25% 1,229
Washington State University 40% 36% 24% 874
Board of Governors’ Peer Group ComparisonTenure-Track Faculty by Rank - 2013-14
Source: Peer Comparison, Academe, The Annual Report on the Economic Status of the Profession, 2013-14Note: Includes instructional faculty only.
0% 25% 50% 75% 100%
Oregon State University
Kansas State University
Virginia Tech
Oklahoma State University
Washington State University
University of Tennessee, Knoxville
Michigan State University
Iowa State University
North Carolina State University
Purdue University
University of Illinois, Urbana-Champaign
Texas A & M University
University of California, Davis
Full Professors Associate Professors Assistant Professors
Colorado State University
Institutional ResearchFACT BOOK 2014-15EMPLOYEE INFORMATION
126
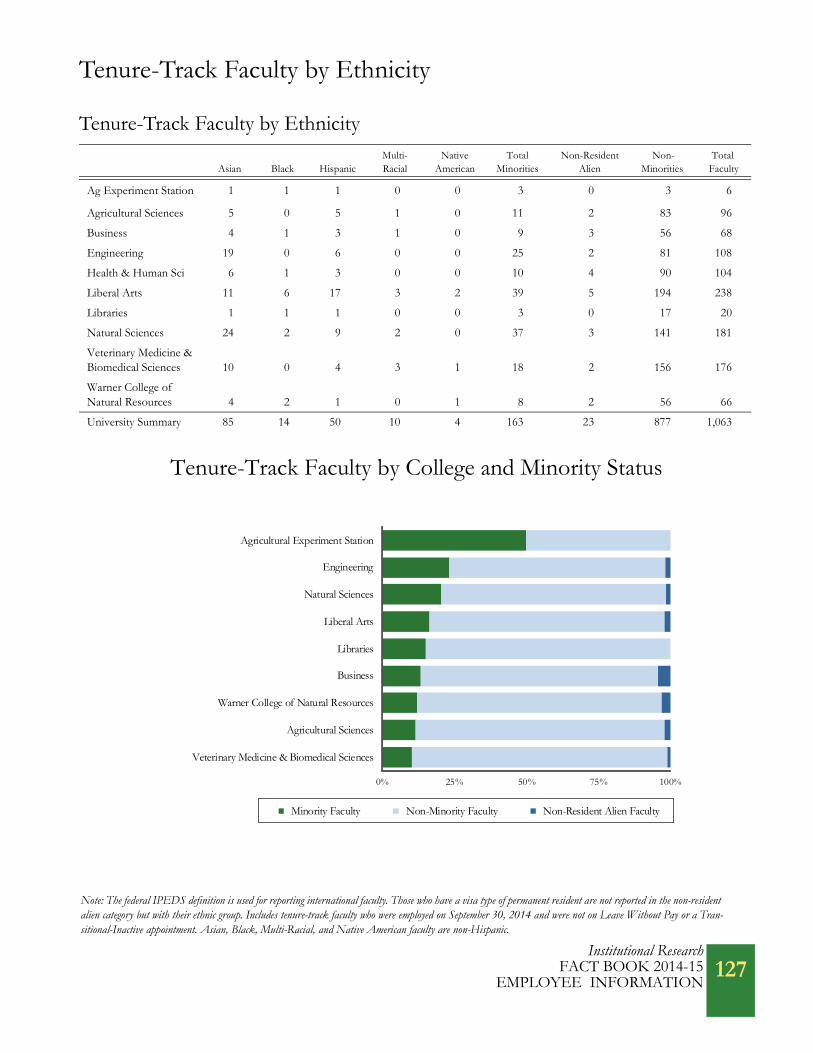
Tenure-Track Faculty by Ethnicity
Tenure-Track Faculty by Ethnicity
Asian Black HispanicMulti-Racial
NativeAmerican
TotalMinorities
Non-Resident Alien
Non-Minorities
Total Faculty
Ag Experiment Station 1 1 1 0 0 3 0 3 6
Agricultural Sciences 5 0 5 1 0 11 2 83 96
Business 4 1 3 1 0 9 3 56 68
Engineering 19 0 6 0 0 25 2 81 108
Health & Human Sci 6 1 3 0 0 10 4 90 104
Liberal Arts 11 6 17 3 2 39 5 194 238
Libraries 1 1 1 0 0 3 0 17 20
Natural Sciences 24 2 9 2 0 37 3 141 181
Veterinary Medicine &Biomedical Sciences 10 0 4 3 1 18 2 156 176
Warner College ofNatural Resources 4 2 1 0 1 8 2 56 66
University Summary 85 14 50 10 4 163 23 877 1,063
Tenure-Track Faculty by College and Minority Status
Note: The federal IPEDS definition is used for reporting international faculty. Those who have a visa type of permanent resident are not reported in the non-resident alien category but with their ethnic group. Includes tenure-track faculty who were employed on September 30, 2014 and were not on Leave Without Pay or a Tran-sitional-Inactive appointment. Asian, Black, Multi-Racial, and Native American faculty are non-Hispanic.
0% 25% 50% 75% 100%
Veterinary Medicine & Biomedical Sciences
Agricultural Sciences
Warner College of Natural Resources
Business
Libraries
Liberal Arts
Natural Sciences
Engineering
Agricultural Experiment Station
Minority Faculty Non-Minority Faculty Non-Resident Alien Faculty
Institutional Research FACT BOOK 2014-15
EMPLOYEE INFORMATION127

Institutional Research
Tenure-Track Faculty by Ethnicity
History of Minority Faculty as a Percent of the Total Faculty by College
AY2005-06
AY2006-07
AY2007-08
AY2008-09
AY2009-10
AY2010-11
AY2011-12
AY2012-13
AY2013-14
AY2014-15
AY 2005-06 to AY 2014-15
Point Change
Ag Experiment Station - - - - - - - - - 50% N/A
Agricultural Sciences 6% 7% 8% 10% 12% 11% 13% 15% 14% 11% 5
Business 10% 8% 8% 9% 9% 9% 13% 13% 12% 13% 3
Engineering 20% 22% 23% 23% 23% 27% 26% 26% 22% 23% 3
Health & Human Sci 15% 13% 13% 13% 15% 14% 14% 11% 11% 10% -5
Liberal Arts 13% 12% 12% 14% 12% 13% 14% 14% 13% 16% 3
Libraries 4% 4% 4% 8% 8% 11% 10% 10% 11% 15% 11
Natural Sciences 14% 14% 15% 15% 16% 16% 17% 18% 18% 20% 6
Veterinary Med &Biomedical Sciences 6% 6% 6% 5% 5% 5% 7% 9% 10% 10% 4
Warner College ofNatural Resources 12% 11% 12% 11% 12% 12% 11% 13% 13% 12% 0
University Summary 11% 11% 11% 12% 12% 13% 14% 14% 14% 15% 4
of Minority Faculty by College AY 2005-06 to AY 2014-15 Percentage Point Change in the Percent
-5
0
5
10
15
AgExperiment
Station
AgriculturalSciences
Business Engineering Health &Human Sci
LiberalArts
Libraries NaturalSciences
Vet Med &Bio Sci
Warner Collof Nat Res
FACT BOOK 2014-15EMPLOYEE INFORMATION
128

Tenure-Track Faculty by Ethnicity
History of Faculty by Ethnicity
AY2005-06
AY2006-07
AY2007-08
AY2008-09
AY2009-10
AY2010-11
AY2011-12
AY2012-13
AY2013-14
AY2014-15
AY 2005-2006 to AY 2014-2015 Change
Asian 56 56 59 64 66 63 71 75 77 85 52%
Black 13 13 12 14 15 16 13 11 11 14 8%
Hispanic 30 30 34 39 41 42 50 52 51 50 67%
Multi-Racial N/A N/A N/A N/A N/A N/A 7 6 7 10 N/A
Native American 7 6 6 5 4 4 2 2 2 4 -43%
Total Minority 106 105 111 122 126 125 143 146 148 163 54%
Non-ResidentAlien 27 36 38 49 49 40 25 18 25 23 -15%
Non-Minority 796 801 824 848 858 835 835 844 872 877 10%
Total Faculty 929 942 973 1,019 1,033 1,000 1,003 1,008 1,045 1,063 14%
Minority Faculty as a Percent of Total Faculty
11.4% 11.1% 11.4% 12.0% 12.2% 12.5% 14.3% 14.5% 14.2% 15.3%
History of Minority Faculty
Note: New federal ethnicity and race categories were implemented in the fall of 2010. However, this information was incomplete at the time of publication so previous categories were used for 2010-11. Part of the increase in Hispanic faculty in fall 2011 may be due to the change in ethnic categories requiring all faculty who are part Hispanic to be reported as Hispanic instead of with their other ethnic group. The addition of the Multi-Racial category may have decreased the number of faculty reported in the Black and Native American categories. Non-resident alien faculty are not reported in the minority categories. Asian, Black, Multi-Racial, and Native American faculty are non-Hispanic.
0
50
100
150
200
AY2005-06
AY2008-09
AY2011-12
AY2014-15
Asian Black Hispanic Multi-Racial Native American
Institutional Research FACT BOOK 2014-15
EMPLOYEE INFORMATION129

Tenure-Track Faculty by Ethnicity
MinorityFaculty
Minority Faculty as a Percent ofTotal Faculty
Non-Resident Alien
FacultyNon-Minority
FacultyTotal
Faculty
Colorado State University 165 16% 24 820 1,009
Kansas State University 164 13% 57 1,044 1,265
Michigan State University 557 20% 109 2,090 2,756
North Carolina State University 296 15% 187 1,438 1,921
Oklahoma State University 142 11% 158 1,031 1,331
Oregon State University 195 14% 62 1,159 1,416
Purdue University 495 21% 103 1,778 2,376
Texas A & M University 773 29% 215 1,707 2,695
University of California, Davis 431 24% 56 1,305 1,792
University of Tennessee, Knoxville 343 16% 55 1,676 2,074
Virginia Tech 274 17% 74 1,317 1,665
Washington State University 218 13% 42 1,475 1,735
Instructional Faculty by Minority Status - 2013-14Board of Governors’ Peer Group Comparison
Source: Common Data Set, 2013-14Note: Includes instructional faculty only. The federal IPEDS definition is used for reporting international faculty. Those who have a visa type of permanent resident are not reported in the international category but with their ethnic group. Data for Iowa State University and University of Illinois, Urbana-Champaign were not available.
0% 25% 50% 75% 100%
Oklahoma State University
Washington State University
Kansas State University
Oregon State University
North Carolina State University
University of Tennessee, Knoxville
Virginia Tech
Michigan State University
Purdue University
University of California, Davis
Texas A & M University
Minority Faculty Non-Minority Faculty Non-Resident Alien Faculty
Colorado State University
Institutional ResearchFACT BOOK 2014-15EMPLOYEE INFORMATION
130

Tenure-Track Faculty by Gender
Tenure-Track Faculty by College and Gender
Men WomenWomen Faculty as a
Percent of Total FacultyTotal
Faculty
Agricultural Experiment Station 5 1 17% 6
Agricultural Sciences 73 23 24% 96
Business 47 21 31% 68
Engineering 92 16 15% 108
Health & Human Sciences 43 61 59% 104
Liberal Arts 134 104 44% 238
Libraries 3 17 85% 20
Natural Sciences 123 58 32% 181
Veterinary Medicine & Biomedical Sciences 107 69 39% 176
Warner College of Natural Resources 47 19 29% 66
University Total 674 389 37% 1,063
Tenure-Track Faculty by College and Gender
Note: Includes tenure-track faculty who were employed on September 30, 2014 and were not on Leave Without Pay or a Transitional-Inactive appointment.
0% 25% 50% 75% 100%
Engineering
Agricultural Experiment Station
Agricultural Sciences
Warner College of Natural Resources
Business
Natural Sciences
Veterinary Medicine & Biomedical Sciences
Liberal Arts
Health & Human Sciences
Libraries
Women Men
Institutional ResearchFACT BOOK 2014-15
EMPLOYEE INFORMATION 131

Tenure-Track Faculty by Gender
Full Professors by Gender Men WomenWomen Faculty as a
Percent of Total FacultyTotal
Faculty
Agricultural Experiment Station 3 0 0% 3
Agricultural Sciences 46 8 15% 54
Business 20 4 17% 24
Engineering 46 6 12% 52
Health & Human Sciences 17 22 56% 39
Liberal Arts 47 28 37% 75
Libraries 0 2 100% 2
Natural Sciences 61 25 29% 86
Veterinary Medicine & Biomedical Sciences 63 16 20% 79
Warner College of Natural Resources 29 5 15% 34
University Total 332 116 26% 448
Associate Professors by Gender Men WomenWomen Faculty as a
Percent of Total FacultyTotal
Faculty
Agricultural Experiment Station 2 0 0% 2
Agricultural Sciences 21 6 22% 27
Business 19 11 37% 30
Engineering 27 3 10% 30
Health & Human Sciences 20 22 52% 42
Liberal Arts 52 51 50% 103
Libraries 2 12 86% 14
Natural Sciences 38 20 34% 58
Veterinary Medicine & Biomedical Sciences 31 30 49% 61
Warner College of Natural Resources 12 9 43% 21
University Total 224 164 42% 388
Assistant Professors by Gender Men WomenWomen Faculty as a
Percent of Total FacultyTotal
Faculty
Agricultural Experiment Station 0 1 100% 1
Agricultural Sciences 6 9 60% 15
Business 8 6 43% 14
Engineering 19 7 27% 26
Health & Human Sciences 6 17 74% 23
Liberal Arts 35 25 42% 60
Libraries 1 3 75% 4
Natural Sciences 24 13 35% 37
Veterinary Medicine & Biomedical Sciences 13 23 64% 36
Warner College of Natural Resources 6 5 45% 11
University Total 118 109 48% 227
Institutional ResearchFACT BOOK 2014-15EMPLOYEE INFORMATION
132

Tenure-Track Faculty by Gender
History of Tenure-Track Faculty by GenderAcademic
Year Men WomenWomen Faculty as a
Percent of Total FacultyTotal
Faculty
2005-06 661 268 28.8% 929
2006-07 665 277 29.4% 942
2007-08 677 296 30.4% 973
2008-09 693 326 32.0% 1,019
2009-10 696 337 32.6% 1,033
2010-11 668 332 33.2% 1,000
2011-12 661 342 34.1% 1,003
2012-13 658 350 34.7% 1,008
2013-14 664 381 36.5% 1,045
2014-15 674 389 36.6% 1,063
History of Tenure-Track Faculty by Gender
0
250
500
750
1,000
AY2005-06
AY2008-09
AY2011-12
AY2014-15
Women Men
Institutional ResearchFACT BOOK 2014-15
EMPLOYEE INFORMATION 133

Tenure-Track Faculty by GenderBoard of Governors’ Peer Group ComparisonWomen Faculty as a Percent of Total Faculty by Rank - 2013-14
FullProfessors
Associate Professors
Assistant Professors
Colorado State University 25% 41% 47%
Iowa State University 20% 36% 44%
Kansas State University 18% 40% 48%
Michigan State University 23% 38% 51%
North Carolina State University 19% 34% 39%
Oklahoma State University 20% 36% 40%
Oregon State University 27% 37% 40%
Purdue University 17% 35% 48%
Texas A & M University 16% 31% 40%
University of California, Davis 27% 45% 42%
University of Illinois, Urbana-Champaign 22% 36% 42%
University of Tennessee, Knoxville 23% 43% 54%
Virginia Tech 19% 32% 42%
Washington State University 22% 40% 40%
Source: Academe, The Annual Report on the Economic Status of the Profession, 2013-14Note: Includes instructional faculty only.
Women Assistant Professors as a Percent of All Assistant Professors
0% 25% 50% 75% 100%
North Carolina State University
Washington State University
Texas A & M University
Oregon State University
Oklahoma State University
Virginia Tech
University of Illinois, Urbana-Champaign
University of California, Davis
Iowa State University
Purdue University
Kansas State University
Michigan State University
University of Tennessee, Knoxville
Colorado State University
Institutional ResearchFACT BOOK 2014-15EMPLOYEE INFORMATION
134
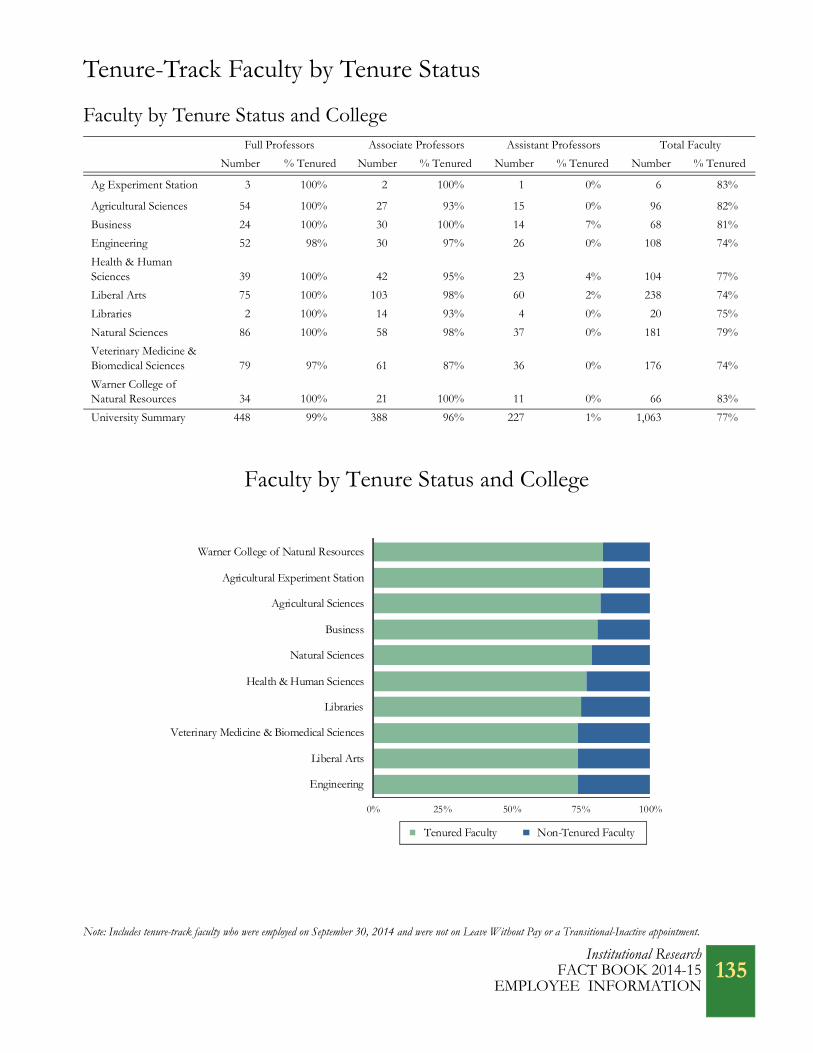
Tenure-Track Faculty by Tenure Status
Faculty by Tenure Status and College Full Professors Associate Professors Assistant Professors Total Faculty
Number % Tenured Number % Tenured Number % Tenured Number % Tenured
Ag Experiment Station 3 100% 2 100% 1 0% 6 83%
Agricultural Sciences 54 100% 27 93% 15 0% 96 82%
Business 24 100% 30 100% 14 7% 68 81%
Engineering 52 98% 30 97% 26 0% 108 74%
Health & HumanSciences 39 100% 42 95% 23 4% 104 77%
Liberal Arts 75 100% 103 98% 60 2% 238 74%
Libraries 2 100% 14 93% 4 0% 20 75%
Natural Sciences 86 100% 58 98% 37 0% 181 79%
Veterinary Medicine &Biomedical Sciences 79 97% 61 87% 36 0% 176 74%
Warner College of Natural Resources 34 100% 21 100% 11 0% 66 83%
University Summary 448 99% 388 96% 227 1% 1,063 77%
Faculty by Tenure Status and College
Note: Includes tenure-track faculty who were employed on September 30, 2014 and were not on Leave Without Pay or a Transitional-Inactive appointment.
0% 25% 50% 75% 100%
Engineering
Liberal Arts
Veterinary Medicine & Biomedical Sciences
Libraries
Health & Human Sciences
Natural Sciences
Business
Agricultural Sciences
Agricultural Experiment Station
Warner College of Natural Resources
Tenured Faculty Non-Tenured Faculty
Institutional ResearchFACT BOOK 2014-15
EMPLOYEE INFORMATION 135
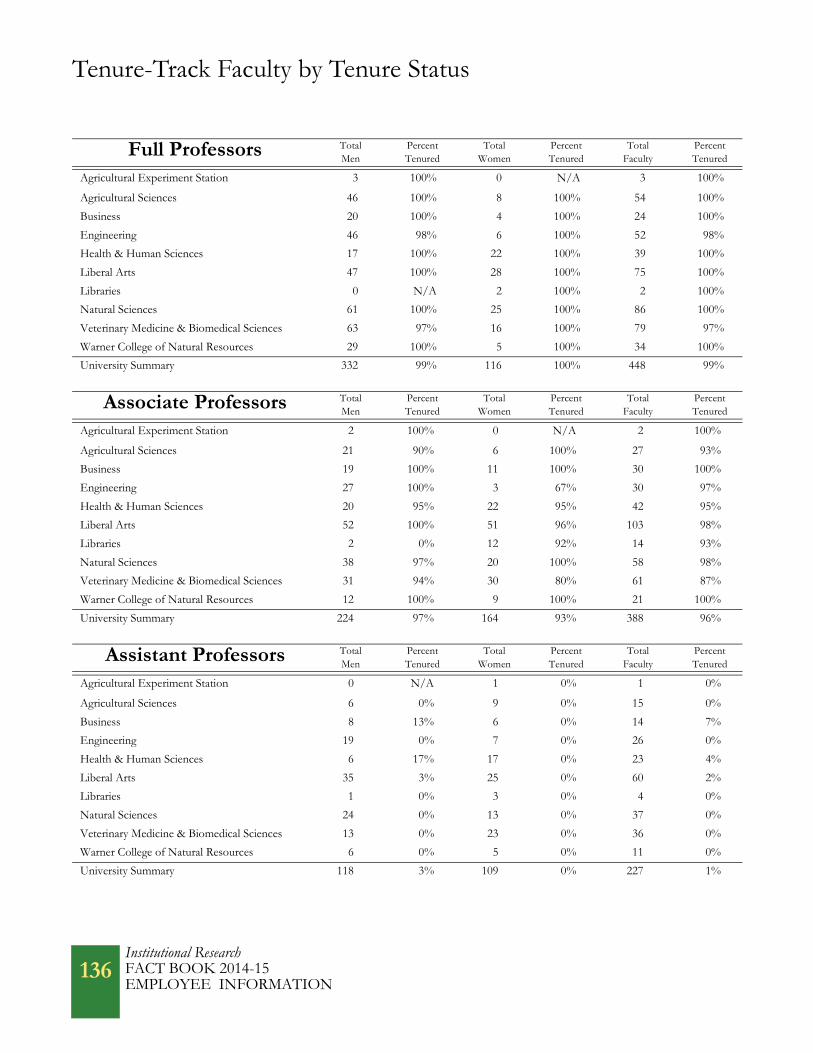
Tenure-Track Faculty by Tenure Status
Full Professors Total Men
PercentTenured
TotalWomen
PercentTenured
TotalFaculty
PercentTenured
Agricultural Experiment Station 3 100% 0 N/A 3 100%
Agricultural Sciences 46 100% 8 100% 54 100%
Business 20 100% 4 100% 24 100%
Engineering 46 98% 6 100% 52 98%
Health & Human Sciences 17 100% 22 100% 39 100%
Liberal Arts 47 100% 28 100% 75 100%
Libraries 0 N/A 2 100% 2 100%
Natural Sciences 61 100% 25 100% 86 100%
Veterinary Medicine & Biomedical Sciences 63 97% 16 100% 79 97%
Warner College of Natural Resources 29 100% 5 100% 34 100%
University Summary 332 99% 116 100% 448 99%
Associate Professors Total Men
PercentTenured
TotalWomen
PercentTenured
TotalFaculty
PercentTenured
Agricultural Experiment Station 2 100% 0 N/A 2 100%
Agricultural Sciences 21 90% 6 100% 27 93%
Business 19 100% 11 100% 30 100%
Engineering 27 100% 3 67% 30 97%
Health & Human Sciences 20 95% 22 95% 42 95%
Liberal Arts 52 100% 51 96% 103 98%
Libraries 2 0% 12 92% 14 93%
Natural Sciences 38 97% 20 100% 58 98%
Veterinary Medicine & Biomedical Sciences 31 94% 30 80% 61 87%
Warner College of Natural Resources 12 100% 9 100% 21 100%
University Summary 224 97% 164 93% 388 96%
Assistant Professors Total Men
PercentTenured
TotalWomen
PercentTenured
TotalFaculty
PercentTenured
Agricultural Experiment Station 0 N/A 1 0% 1 0%
Agricultural Sciences 6 0% 9 0% 15 0%
Business 8 13% 6 0% 14 7%
Engineering 19 0% 7 0% 26 0%
Health & Human Sciences 6 17% 17 0% 23 4%
Liberal Arts 35 3% 25 0% 60 2%
Libraries 1 0% 3 0% 4 0%
Natural Sciences 24 0% 13 0% 37 0%
Veterinary Medicine & Biomedical Sciences 13 0% 23 0% 36 0%
Warner College of Natural Resources 6 0% 5 0% 11 0%
University Summary 118 3% 109 0% 227 1%
Institutional ResearchFACT BOOK 2014-15EMPLOYEE INFORMATION
136

Tenure-Track Faculty by Tenure Status
History of Faculty by Tenure Status and RankAY
2005-06AY
2006-07AY
2007-08AY
2008-09AY
2009-10AY
2010-11AY
2011-12AY
2012-13AY
2013-14AY
2014-15
Full Professors 99% 99% 99% 99% 99% 99% 98% 99% 99% 98%
Associate Professors 93% 93% 93% 93% 94% 94% 96% 96% 96% 96%
Assistant Professors 3% 3% 2% 1% 1% 1% 1% 1% 1% 1%
All Ranks 75% 74% 72% 69% 69% 71% 73% 75% 76% 77%
History of Percentage of Faculty with Tenure
25%
50%
75%
100%
AY2005-06
AY2008-09
AY2011-12
AY2014-15
Institutional ResearchFACT BOOK 2014-15
EMPLOYEE INFORMATION 137

Tenure-Track Faculty by Tenure Status
Board of Governors’ Peer Group ComparisonFaculty by Tenure Status and Rank - 2013-14
Full ProfessorsPercent Tenured
Associate ProfessorsPercent Tenured
Assistant ProfessorsPercent Tenured
Colorado State University 99% 96% 1%
Iowa State University 99% 97% 1%
Kansas State University 99% 95% 1%
Michigan State University 94% 90% 0%
North Carolina State University 99% 87% 1%
Oklahoma State University 100% 98% 1%
Oregon State University 96% 85% 1%
Purdue University 98% 91% 1%
Texas A & M University 98% 92% 3%
University of California, Davis 97% 92% 0%
University of Illinois, Urbana-Champaign 98% 96% 0%
University of Tennessee, Knoxville 97% 83% 2%
Virginia Tech 99% 93% 0%
Washington State University 99% 98% 0%
Source: Academe, The Annual Report on the Economic Status of the Profession, 2013-14
0% 25% 50% 75% 100%
University of Tennessee, Knoxville
Oregon State University
North Carolina State University
Michigan State University
Purdue University
Texas A & M University
University of California, Davis
Virginia Tech
Kansas State University
University of Illinois, Urbana-Champaign
Iowa State University
Oklahoma State University
Washington State University
Full Professors Associate Professors Assistant Professors
Colorado State University
Institutional ResearchFACT BOOK 2014-15EMPLOYEE INFORMATION
138
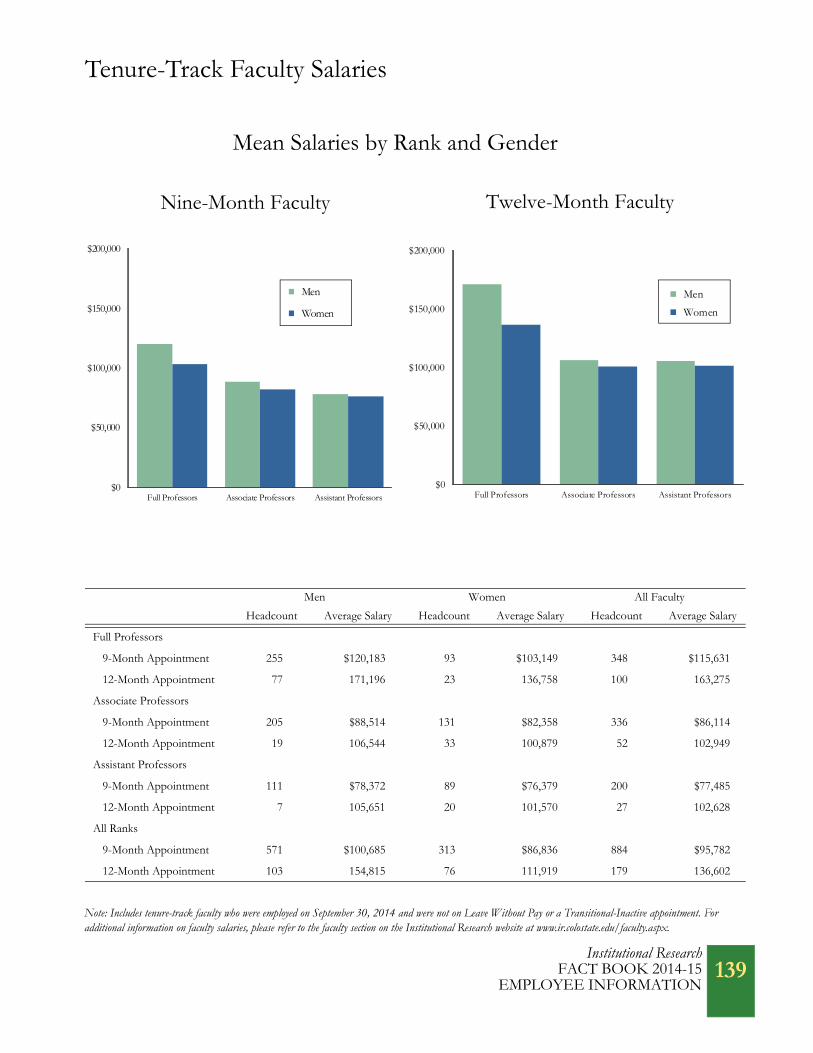
Tenure-Track Faculty Salaries
Men Women All Faculty
Headcount Average Salary Headcount Average Salary Headcount Average Salary
Full Professors
9-Month Appointment 255 $120,183 93 $103,149 348 $115,631
12-Month Appointment 77 171,196 23 136,758 100 163,275
Associate Professors
9-Month Appointment 205 $88,514 131 $82,358 336 $86,114
12-Month Appointment 19 106,544 33 100,879 52 102,949
Assistant Professors
9-Month Appointment 111 $78,372 89 $76,379 200 $77,485
12-Month Appointment 7 105,651 20 101,570 27 102,628
All Ranks
9-Month Appointment 571 $100,685 313 $86,836 884 $95,782
12-Month Appointment 103 154,815 76 111,919 179 136,602
Mean Salaries by Rank and Gender
Nine-Month Faculty Twelve-Month Faculty
Note: Includes tenure-track faculty who were employed on September 30, 2014 and were not on Leave Without Pay or a Transitional-Inactive appointment. For additional information on faculty salaries, please refer to the faculty section on the Institutional Research website at www.ir.colostate.edu/faculty.aspx.
$0
$50,000
$100,000
$150,000
$200,000
Full Professors Associate Professors Assistant Professors
Men
Women
$0
$50,000
$100,000
$150,000
$200,000
Full Professors Associate Professors Assistant Professors
Men
Women
Institutional ResearchFACT BOOK 2014-15
EMPLOYEE INFORMATION139

Tenure-Track Faculty Salaries
Faculty Salaries by Rank, Basis of Service, and CollegeFull Professors Associate Professors Assistant Professors All Ranks
Headcount Avg Salary Headcount Avg Salary Headcount Avg Salary Headcount Avg Salary
Ag Experiment Station
9-Month Appt 1 * --- --- --- --- 1 *
12-Month Appt 2 * 2 * 1 * 5 $91,110
Agricultural Sciences
9-Month Appt 40 $114,252 26 $85,356 15 $77,748 81 $98,217
12-Month Appt 14 157,247 1 * --- --- 15 152,636
Business
9-Month Appt 24 $158,207 30 $134,056 14 $129,243 68 $141,589
12-Month Appt --- --- --- --- --- --- --- ---
Engineering
9-Month Appt 45 $144,332 30 $108,267 26 $93,627 101 $120,567
12-Month Appt 7 232,886 --- --- --- --- 7 232,886
Health & Human Sci
9-Month Appt 31 $97,176 41 $79,533 23 $71,187 95 $83,278
12-Month Appt 8 178,889 1 104,455 --- --- 9 170,618
Liberal Arts
9-Month Appt 64 $90,343 100 $68,293 59 $59,716 223 $72,352
12-Month Appt 11 128,153 3 110,965 1 * 15 124,726
Libraries
9-Month Appt --- --- --- --- --- --- --- ---
12-Month Appt 2 * 14 $64,899 4 $53,241 20 $63,973
Natural Sciences
9-Month Appt 78 $118,270 58 $87,876 37 $79,660 173 $99,823
12-Month Appt 8 172,806 --- --- --- --- 8 172,806
Veterinary Medicine & Biomedical Sciences
9-Month Appt 35 $121,286 30 $87,946 15 $82,529 80 $101,517
12-Month Appt 44 164,529 31 121,291 21 112,330 96 139,148
Warner College of Natural Resources
9-Month Appt 30 $100,278 21 $77,110 11 $67,383 62 $86,595
12-Month Appt 4 162,486 --- --- --- --- 4 162,486
University Summary
9-Month Appt 348 $115,631 336 $86,114 200 $77,485 884 $95,782
12-Month Appt 100 163,275 52 102,949 27 102,628 179 136,602
Note: * indicates fewer than three faculty in the category and therefore, salaries are excluded. However, the salaries are included in the all ranks category if the all ranks total headcount is three or more.
Institutional ResearchFACT BOOK 2014-15EMPLOYEE INFORMATION
140

Tenure-Track Faculty Salaries and Compensation
History of Mean Faculty Salaries by Rank and Basis of Service
AY2005-06
AY2006-07
AY2007-08
AY2008-09
AY2009-10
AY2010-11
AY2011-12
AY2012-23
AY2013-14
AY2014-15
AY 2005-06 to AY 2014-15 Change
Nine-Month AppointmentsFullProfessors $92,422 $94,904 $99,416 $104,904 $105,024 $105,389 $105,224 $109,898 $112,408 $115,631 25%
AssociateProfessors 69,472 71,049 75,421 80,384 79,952 79,532 78,964 81,628 84,528 86,114 24%
Assistant Professors 59,135 60,948 64,139 67,868 68,800 68,443 70,185 73,803 75,669 77,485 31%
All Ranks 77,145 78,801 82,312 86,092 86,088 85,862 86,612 90,665 92,995 95,782 24%
Twelve-Month Appointments
FullProfessors $120,939 $124,026 $132,516 $140,553 $142,094 $143,152 $145,208 $148,693 $155,252 $163,275 35%
AssociateProfessors 88,288 91,559 96,946 99,628 100,290 99,324 94,890 96,761 99,730 102,949 17%
AssistantProfessors 69,317 72,042 78,655 84,766 85,158 83,694 88,405 94,433 101,651 102,628 48%
All Ranks 103,266 105,456 112,854 117,971 118,810 121,044 122,155 126,306 132,705 136,602 32%
AY 2005-06 to AY 2014-15Percent Change in Mean Faculty Salaries
0%
25%
50%
75%
Full Professors Associate Professors Assistant Professors
Nine-Month Faculty Twelve-Month Faculty
Institutional ResearchFACT BOOK 2014-15
EMPLOYEE INFORMATION141
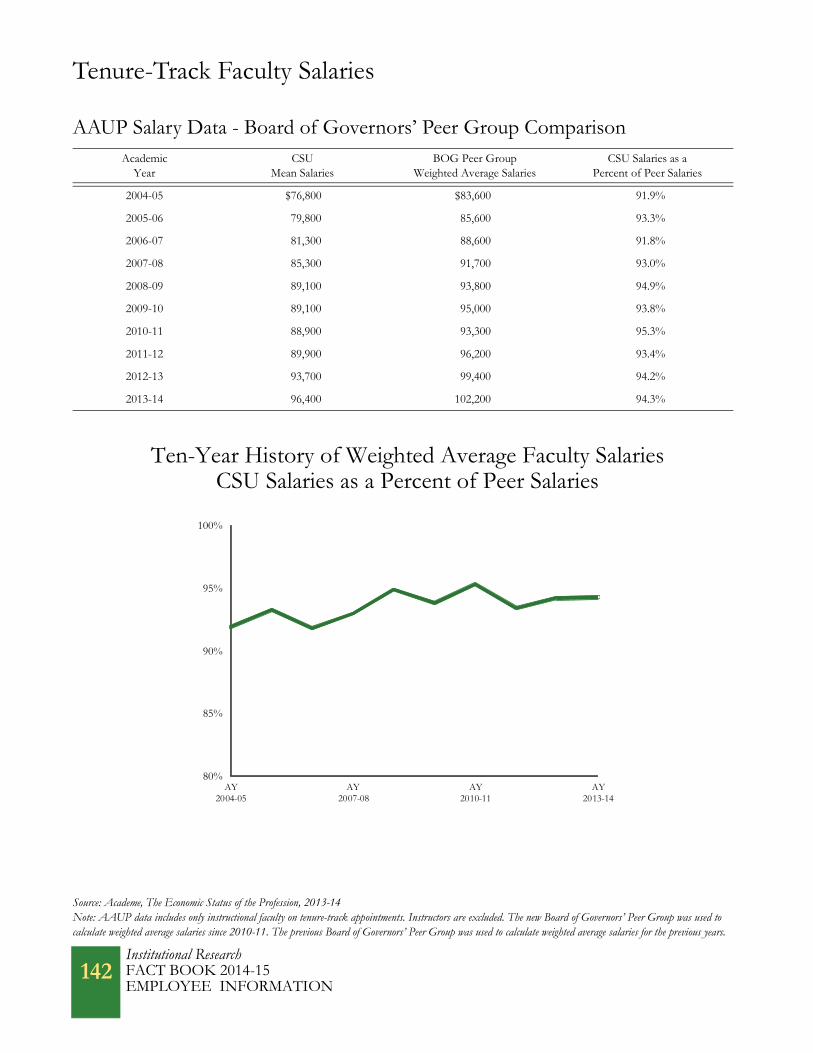
Tenure-Track Faculty Salaries
AAUP Salary Data - Board of Governors’ Peer Group Comparison Academic
YearCSU
Mean SalariesBOG Peer Group
Weighted Average SalariesCSU Salaries as a
Percent of Peer Salaries
2004-05 $76,800 $83,600 91.9%
2005-06 79,800 85,600 93.3%
2006-07 81,300 88,600 91.8%
2007-08 85,300 91,700 93.0%
2008-09 89,100 93,800 94.9%
2009-10 89,100 95,000 93.8%
2010-11 88,900 93,300 95.3%
2011-12 89,900 96,200 93.4%
2012-13 93,700 99,400 94.2%
2013-14 96,400 102,200 94.3%
Source: Academe, The Economic Status of the Profession, 2013-14Note: AAUP data includes only instructional faculty on tenure-track appointments. Instructors are excluded. The new Board of Governors’ Peer Group was used to calculate weighted average salaries since 2010-11. The previous Board of Governors’ Peer Group was used to calculate weighted average salaries for the previous years.
Ten-Year History of Weighted Average Faculty SalariesCSU Salaries as a Percent of Peer Salaries
80%
85%
90%
95%
100%
AY2004-05
AY2007-08
AY2010-11
AY2013-14
Institutional ResearchFACT BOOK 2014-15EMPLOYEE INFORMATION
142

Tenure-Track Faculty Hires and Attrition
History of Faculty Hires and AttritionAcademic
YearTotal Tenure-Track
FacultyNew Faculty
HiresFaculty Not Returning for
Following Year
2004-05 933 43 60
2005-06 929 67 57
2006-07 942 77 41
2007-08 973 76 53
2008-09 1,019 101 39
2009-10 1,033 57 43
2010-11 1,000 18 47
2011-12 1,003 53 48
2012-13 1,008 53 42
2013-14 1,045 79 N/A
History of Faculty Hires and Attrition
Note: The total number of faculty will not track with the number of faculty hires and attrition due to faculty on leave without pay, an inactive transitional appoint-ment or faculty leaving a tenure-track position to become an administrator or returning to a tenure-track position from an administrative position. For additional information on tenure-track faculty hires and attrition, please refer to the Tenure-Track Faculty Hires and Attrition Report on the Institutional Research website at www.ir.colostate.edu/faculty.aspx.
0
25
50
75
100
125
AY2004-05
AY2007-08
AY2010-11
AY2013-14
New Faculty Hires Faculty Attrition
Institutional ResearchFACT BOOK 2014-15
EMPLOYEE INFORMATION143
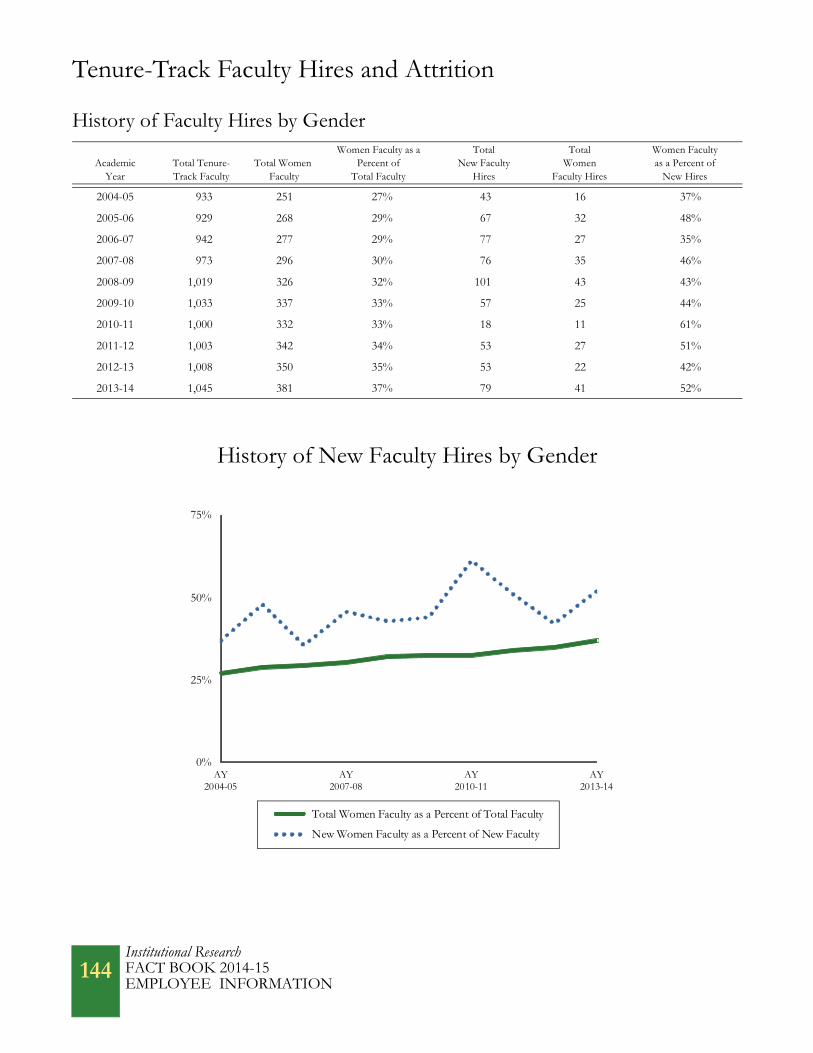
Tenure-Track Faculty Hires and Attrition
History of Faculty Hires by Gender
AcademicYear
Total Tenure-Track Faculty
Total Women Faculty
Women Faculty as a Percent of
Total Faculty
TotalNew Faculty
Hires
TotalWomen
Faculty Hires
Women Facultyas a Percent of
New Hires
2004-05 933 251 27% 43 16 37%
2005-06 929 268 29% 67 32 48%
2006-07 942 277 29% 77 27 35%
2007-08 973 296 30% 76 35 46%
2008-09 1,019 326 32% 101 43 43%
2009-10 1,033 337 33% 57 25 44%
2010-11 1,000 332 33% 18 11 61%
2011-12 1,003 342 34% 53 27 51%
2012-13 1,008 350 35% 53 22 42%
2013-14 1,045 381 37% 79 41 52%
History of New Faculty Hires by Gender
0%
25%
50%
75%
AY2004-05
AY2007-08
AY2010-11
AY2013-14
Total Women Faculty as a Percent of Total Faculty
New Women Faculty as a Percent of New Faculty
Institutional ResearchFACT BOOK 2014-15EMPLOYEE INFORMATION
144

Tenure-Track Faculty Hires and Attrition
History of Faculty Hires by Minority Status
AcademicYear
Total Tenure-Track Faculty
Total MinorityFaculty
Minority Faculty as a Percent of
Total Faculty
TotalNew Faculty
Hires
TotalMinority
Faculty Hires
Minority Facultyas a Percent of
New Hires
2004-05 933 100 11% 43 5 12%
2005-06 929 106 11% 67 10 15%
2006-07 942 105 11% 77 5 7%
2007-08 973 111 11% 76 6 8%
2008-09 1,019 122 12% 99 11 11%
2009-10 1,033 127 12% 57 7 12%
2010-11 1,000 125 13% 18 3 17%
2011-12 1,003 143 14% 53 9 17%
2012-13 1,008 146 15% 53 8 15%
2013-14 1,045 148 14% 79 9 11%
History of New Faculty Hires by Minority Status
Note: Non-resident alien faculty are reported in the non-minority faculty category.
0%
5%
10%
15%
20%
25%
AY2004-05
AY2007-08
AY2010-11
AY2013-14
Total Minority Faculty as a Percent of Total Faculty
New Minority Faculty as a Percent of New Faculty
Institutional ResearchFACT BOOK 2014-15
EMPLOYEE INFORMATION145

Tenure-Track Faculty Hires and AttritionHistory of Faculty Attrition by Rank and Separation Reason
AY2004-05
AY2005-06
AY2006-07
AY2007-08
AY2008-09
AY2009-10
AY2010-11
AY2011-12
AY2012-13
Nine-YearAttrition
Full Professors
Retirement 29 26 20 23 17 23 21 19 17 195
Other Reasons 6 4 2 7 1 4 3 1 4 32
Total 35 30 22 30 18 27 24 20 21 227
Associate Professors
Retirement 9 4 2 2 6 0 5 3 3 34
Other Reasons 6 8 3 8 6 9 3 7 6 56
Total 15 12 5 10 12 9 8 10 9 90
Assistant Professors
Retirement 0 0 1 1 0 0 1 1 1 5
Other Reasons 10 15 13 12 9 7 14 17 11 108
Total 10 15 14 13 9 7 15 18 12 113
All Ranks
Retirement 38 30 23 26 23 23 27 23 21 234
Other Reasons 22 27 18 27 16 20 20 25 21 196
Total 60 57 41 53 39 43 47 48 42 430
Note: The “Other” separation reason includes faculty who leave CSU or enter an administrative or other non-tenure-track position at CSU.
Faculty Attrition by Separation ReasonNine-Year History of
0
10
20
30
40
50
AY2004-05
AY2006-07
AY2008-09
AY2010-11
AY2012-13
Retirement Other Reasons
Institutional ResearchFACT BOOK 2014-15EMPLOYEE INFORMATION
146

Tenure-Track Faculty Retention and Promotion
Year Appointed or Promoted to
Associate Professor
Total Associate Professors Appointed
or Promoted
Associate ProfessorsPromoted
to Full Professor
Prior to theSeventh Year
Associate Professors
Promoted to Full Professor
in theSeventh or
Eighth Year
AssociateProfessors
Promoted to Full
Professor in the Ninth orTenth Year
AssociateProfessors
Not Promoted to
Full Professorby the
Tenth Year
Associate Professors Who Left a
Tenure-Track Position - Not Promoted to
Full Professor
AssociateProfessors Who Left a
Tenure-Track Position -
Promoted to Full Professor
AssociateProfessors
whoEntered an
Administrative Position at
CSU
1995-96 43 6 8 7 12 7 0 3
1996-97 35 4 7 3 11 8 1 1
1997-98 34 2 11 0 12 6 1 2
1998-99 30 4 10 3 4 8 0 1
1999-00 22 3 4 2 7 6 0 0
2000-01 30 4 12 3 8 3 0 0
2001-02 42 5 7 4 14 11 0 1
2002-03 23 2 7 5 5 3 0 1
2003-04 39 4 2 6 12 13 2 0
2004-05 27 3 6 1 10 6 1 0
Ten-Year Total 325 37 74 34 95 71 5 9
Ten-Year Percentage 100% 11% 23% 10% 29% 22% 2% 3%
Status of Associate Professors Ten Years After Promotion or Appointment
Note: For additional information on faculty retention and promotion, please refer to the Study of Faculty Retention and Promotion on the Institutional Research website at www.ir.colostate.edu/faculty.aspx
0
10
20
30
40
50
AY1995-96
AY1998-99
AY2001-02
AY2004-05
Promoted Prior to the Seventh Year
Promoted in the Seventh or Eighth Year
Promoted in the Ninth or Tenth Year
Not Promoted by the Tenth Year
Left Position - Not Promoted to Full Professor
Left Position - Promoted to Full Professor
Administrative Position at CSU
Year Appointedor Promoted:
Institutional Research FACT BOOK 2014-15 EMPLOYEE INFORMATION 147

Institutional Research FACT BOOK 2014-15EMPLOYEE INFORMATION
148
Tenure-Track Faculty Retention and Promotion
Year Appointed or Promoted to
Associate Professor
Men Women Minorities Total
Number
Average Years to
Promotion Number
Average Years to
Promotion Number
Average Years to
Promotion Number
Average Years to
Promotion
1995-96 13 7.1 8 8.3 1 10.0 21 7.5
1996-97 6 8.0 8 6.1 1 10.0 14 6.9
1997-98 7 6.4 6 7.0 2 7.5 13 6.7
1998-99 8 7.3 9 7.1 4 7.5 17 7.2
1999-00 6 6.8 3 6.7 0 0.0 9 6.8
2000-01 13 6.5 6 7.2 4 6.3 19 6.7
2001-02 12 6.0 4 9.0 0 0.0 16 6.9
2002-03 7 7.7 7 8.0 2 8.0 14 7.9
2003-04 10 7.6 2 7.5 1 10.0 12 7.6
2004-05 6 8.5 4 6.8 2 5.5 10 7.8
Ten-Year History 88 7.1 57 7.3 17 7.5 145 7.2
Average Promotion Time from Associate Professorto Full Professor
Note: Includes only associate professors who were still employed and had been promoted by the tenth year. Minority associate professors are included in the gender and total categories.
0.0
3.0
6.0
9.0
12.0
AY1995-96
AY1998-99
AY2001-02
AY2004-05
Men Women Minorities

Tenure-Track Faculty Retention and Promotion
YearAppointed
as an Assistant Professor
Total Assistant
Professors Appointed
AssistantProfessors
Promoted to Associate Professor
Prior to the Sixth Year
Assistant Professors
Promoted to Associate Professor
in the Sixth Year
Assistant Professors
Promoted to Associate Professor
by the Seventh Year
Assistant Professors
Not Promoted to Associate
Professorby the
Seventh Year
Assistant Professors Who
Left a Tenure-Track Position Before
Seven Years - Not Promoted to
Associate Professor
Assistant Professors Who
Left a Tenure-Track Position Before Seven Years - Promoted to
Associate Professor
1998-99 37 5 4 10 4 14 0
1999-00 47 8 4 11 3 18 3
2000-01 59 8 8 23 1 19 0
2001-02 33 2 6 11 3 11 0
2002-03 39 5 4 16 4 9 1
2003-04 41 6 7 15 3 10 0
2004-05 31 8 2 13 2 6 0
2005-06 56 7 5 26 7 10 1
2006-07 59 9 5 27 5 12 1
2007-08 61 4 8 29 7 13 0
Ten-Year History 463 62 53 181 39 122 6
Ten-Year Percentage 100% 13% 11% 39% 8% 26% 1%
Status of Assistant Professors Seven Years After Appointment
0
25
50
75
AY1998-99
AY2001-02
AY2004-05
AY2007-08
Promoted Prior to the Sixth Year
Promoted in the Sixth Year
Promoted in the Seventh Year
Not Promoted by the Seventh Year
Left Position Before Seven Years -Not Promoted to Associate Professor Left Position Before Seven Years -Promoted to Associate Professor
Year Appointed:
Institutional Research FACT BOOK 2014-15 EMPLOYEE INFORMATION 149
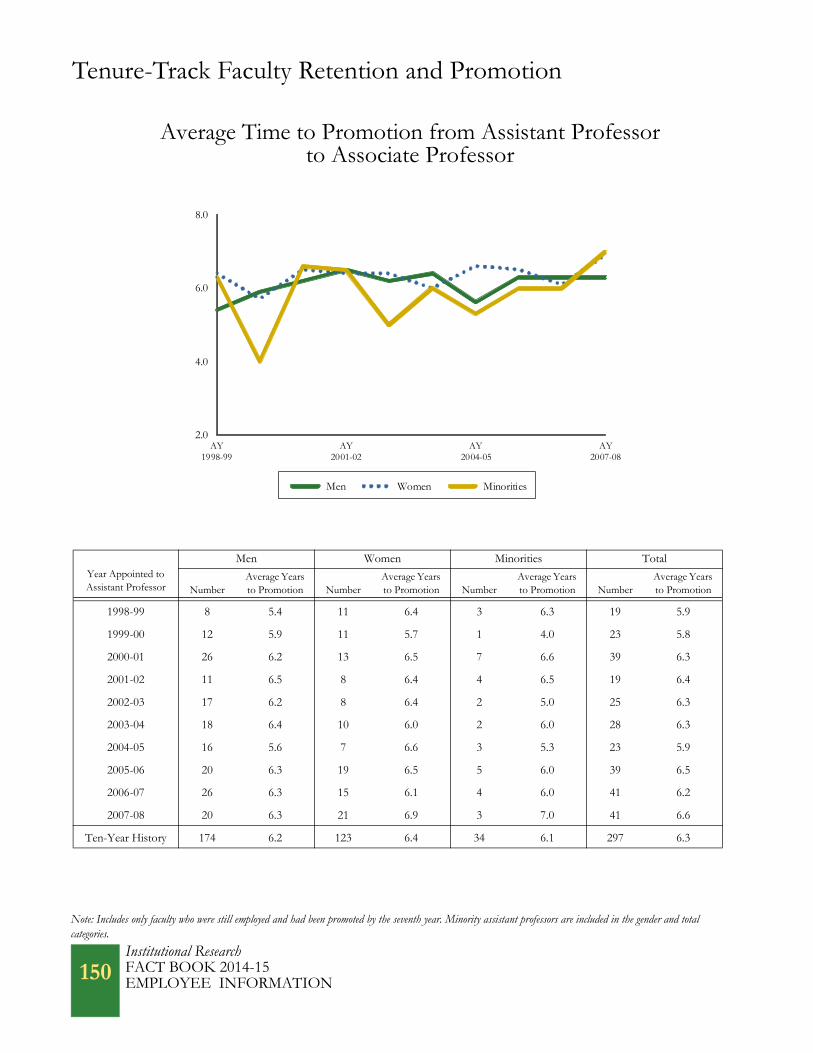
Institutional Research FACT BOOK 2014-15EMPLOYEE INFORMATION
150
Tenure-Track Faculty Retention and Promotion
Year Appointed to Assistant Professor
Men Women Minorities Total
NumberAverage Years to Promotion Number
Average Years to Promotion Number
Average Years to Promotion Number
Average Years to Promotion
1998-99 8 5.4 11 6.4 3 6.3 19 5.9
1999-00 12 5.9 11 5.7 1 4.0 23 5.8
2000-01 26 6.2 13 6.5 7 6.6 39 6.3
2001-02 11 6.5 8 6.4 4 6.5 19 6.4
2002-03 17 6.2 8 6.4 2 5.0 25 6.3
2003-04 18 6.4 10 6.0 2 6.0 28 6.3
2004-05 16 5.6 7 6.6 3 5.3 23 5.9
2005-06 20 6.3 19 6.5 5 6.0 39 6.5
2006-07 26 6.3 15 6.1 4 6.0 41 6.2
2007-08 20 6.3 21 6.9 3 7.0 41 6.6
Ten-Year History 174 6.2 123 6.4 34 6.1 297 6.3
Average Time to Promotion from Assistant Professorto Associate Professor
Note: Includes only faculty who were still employed and had been promoted by the seventh year. Minority assistant professors are included in the gender and total categories.
2.0
4.0
6.0
8.0
AY1998-99
AY2001-02
AY2004-05
AY2007-08
Men Women Minorities

Tenure-Track Faculty Full-Time Equivalents (FTE)
Fund Group Total FTE Percent of FTE
Education & General 812.4 74%
Experiment Station 38.0 3%
Extension Service 21.4 2%
Professional Veterinary Medicine 117.3 11%
Sponsored Programs 64.1 6%
All Other Fund Groups 51.2 4%
Total 1,104.4 100%
.
Tenure-Track Faculty FTE by Fund Group - 2013-14
Total FTE = 1,104.4
Note: 9 months = 1 FTE. Summer months for faculty on 9-month appointments are excluded. Faculty FTE may be larger than headcount because faculty on 12-month appointments are counted as 1.3 FTE. All FTE is reported as of the end of the fiscal year.
Education & General74%
Sponsored Programs
Professional Veterinary Medicine
Extension Service 2%
Experiment Station 3%
11%
6%
All Other Fund Groups 4%
Institutional ResearchFACT BOOK 2014-15
EMPLOYEE INFORMATION151

Tenure-Track Faculty Full-Time Equivalents (FTE)
Education & General Funds
AllOther Funds
Total Funds
Agricultural Sciences 45.9 51.6 97.5
Business 62.1 23.3 85.4
Engineering 93.3 15.5 108.8
Health & Human Sciences 95.7 13.8 109.5
Liberal Arts 225.4 2.9 228.3
Libraries 24.4 0.0 24.4
Natural Sciences 162.5 12.8 175.3
Non-College 4.7 11.6 16.3
Veterinary Medicine & Biomedical Sciences 46.7 149.7 196.4
Warner College of Natural Resources 53.8 8.7 62.5
University Summary 814.5 289.9 1,104.4
Tenure-Track Faculty FTE by College
0.0 50.0 100.0 150.0 200.0 250.0
Non-College
Libraries
Warner College of Natural Resources
Business
Agricultural Sciences
Engineering
Health & Human Sciences
Natural Sciences
Veterinary Medicine & Biomedical Sciences
Liberal Arts
Education and General Funds All Other Funds
Institutional ResearchFACT BOOK 2014-15EMPLOYEE INFORMATION
152

Tenure-Track Faculty Full-Time Equivalents (FTE)
Tenure-Track Faculty FTE
Graduate Teaching Assistant FTE
Tenure-Track Faculty:GTA Ratio
Agricultural Sciences 45.9 9.3 4.9
Engineering 93.3 40.5 2.3
Health & Human Sciences 95.7 45.6 2.1
Liberal Arts 225.4 231.9 1.0
Natural Sciences 162.5 276.8 0.6
Veterinary Medicine & Biomedical Sciences 46.7 13.0 3.6
Warner College of Natural Resources 53.8 36.9 1.5
University Summary 723.3 654.0 1.1
Tenure-Track Faculty FTE to GTA FTE Comparison
Note: Tenure-track faculty to GTA comparison includes months paid on Education & General funds only. Faculty in non-college areas are excluded from this page. Faculty FTE is determined by dividing total months paid by 9. GTA FTE is determined by dividing total months paid by 4.5. The College of Business is excluded from this page because they do not employ GTAs.
0% 25% 50% 75% 100%
Agricultural Sciences
Veterinary Medicine & Biomedical Sciences
Health & Human Sciences
Engineering
Warner College of Natural Resources
Liberal Arts
Natural Sciences
Faculty FTE GTA FTE
Institutional ResearchFACT BOOK 2014-15
EMPLOYEE INFORMATION153

Tenure-Track Faculty Full-Time Equivalents (FTE)
Fiscal Year Education & General FTE Other FTE Total Faculty FTE
2005 730 226 956
2006 710 237 947
2007 734 221 955
2008 754 249 1,003
2009 795 259 1,054
2010 798 252 1,050
2011 777 251 1,028
2012 774 260 1,034
2013 771 264 1,035
2014 814 290 1,104
History of Tenure-Track Faculty FTE
0
300
600
900
1,200
2004-05 2007-08 2010-11 2013-14
Education & General Faculty FTE Other Faculty FTE
Institutional ResearchFACT BOOK 2014-15EMPLOYEE INFORMATION
154

Faculty Salary Increases Compared to Changesin the Consumer Price Index
Year Faculty Salary Increase U.S. CPI Change Denver-Boulder CPI Change
2001-02 5.0% 2.8% 4.7%
2002-03 5.0% 1.6% 1.9%
2003-04 0.0% 2.3% 1.1%
2004-05 2.0% 2.7% 0.1%
2005-06 4.3% 3.4% 2.1%
2006-07 3.0% 3.2% 3.6%
2007-08 5.0% 2.8% 2.2%
2008-09 5.0% 3.8% 3.9%
2009-10 0.0% -0.4% -0.6%
2010-11 0.0% 1.6% 1.9%
2011-12 0.0% 3.1% 3.7%
2012-13 3.0% 2.1% 1.9%
2013-14 3.0% 1.5% 2.9%
Comparison of Faculty Salary and CPI Changes
Source: Consumer Price Index, Legislative Council Staff, Colorado General Assembly and the Bureau of Labor Statistics
-2%
0%
2%
4%
6%
8%
2001-02 2003-04 2005-06 2007-08 2009-10 2011-12 2013-14
Salary Increase U.S. CPI Change Denver-Boulder CPI Change
Institutional ResearchFACT BOOK 2014-15
EMPLOYEE INFORMATION155

Faculty Salary Increases Compared to Changesin the Consumer Price Index
Year Faculty Salary Change U.S. CPI Change Denver-Boulder CPI Change
2001-02 100.0 100.0 100.0
2002-03 105.0 101.6 101.9
2003-04 105.0 103.9 103.0
2004-05 107.1 106.7 103.1
2005-06 111.7 110.4 105.3
2006-07 115.1 113.9 109.1
2007-08 120.8 117.1 111.5
2008-09 126.8 121.5 115.8
2009-10 126.8 121.1 115.1
2010-11 126.8 123.0 117.3
2011-12 126.8 126.8 121.7
2012-13 130.7 129.5 124.0
2013-14 134.6 131.4 127.6
Cumulative History of Faculty Salaries Compared to the CPI Changes
100.0
110.0
120.0
130.0
140.0
2001-02 2003-04 2005-06 2007-08 2009-10 2011-12 2013-14
Faculty Salary Change U.S. CPI Change Denver-Boulder CPI Change
Institutional ResearchFACT BOOK 2014-15EMPLOYEE INFORMATION
156

Faculty on Special Appointments
Faculty by College and RankFull
ProfessorsAssociate Professors
Associate Prof (STA)
Assistant Professors
Assistant Prof (STA) Instructors
Instructors(STA)
Total Faculty
Ag Experiment Station 0 1 0 0 0 0 0 1
Agricultural Sciences 2 1 0 9 0 8 0 20
Business 1 0 0 0 0 21 0 22
Engineering 2 0 0 0 0 9 0 11
Health & Human Sciences 2 4 1 22 2 32 0 63
Liberal Arts 0 0 0 23 3 152 34 212
Libraries 0 0 0 2 0 1 0 3
Natural Sciences 1 3 0 13 2 10 2 31
Non-College 0 0 0 0 0 7 0 7
Veterinary Medicine & Biomedical Sciences 5 12 0 34 0 6 1 58
Warner College of Natural Resources 0 0 0 2 0 6 0 8
University Total 13 21 1 105 7 252 37 436
Faculty on Special Appointments by College and Rank
Note: Includes all faculty employed on a special appointment as of September 30, 2014. STA indicates those faculty with a Senior Teaching Appointment.
0 50 100 150 200 250
Ag Experiment Station
Libraries
Non-College
Warner College of Natural Resources
Engineering
Agricultural Sciences
Business
Natural Sciences
Veterinary Medicine & Biomedical Sciences
Health & Human Sciences
Liberal Arts
Full Professors Associate Professors Associate Prof (STA) Assistant Professors Assistant Prof (STA) Instructors Instructors (STA)
Institutional Research FACT BOOK 2014-15
EMPLOYEE INFORMATION 157
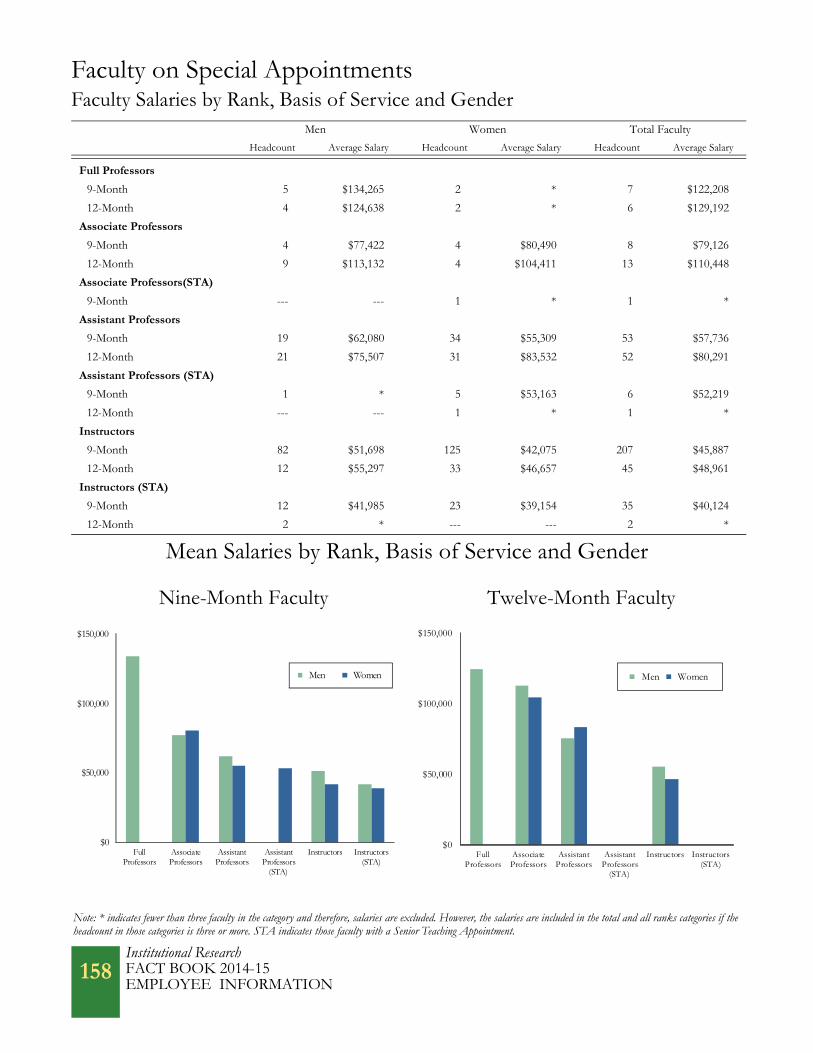
Faculty on Special AppointmentsFaculty Salaries by Rank, Basis of Service and Gender
Men Women Total Faculty
Headcount Average Salary Headcount Average Salary Headcount Average Salary
Full Professors
9-Month 5 $134,265 2 * 7 $122,208
12-Month 4 $124,638 2 * 6 $129,192
Associate Professors
9-Month 4 $77,422 4 $80,490 8 $79,126
12-Month 9 $113,132 4 $104,411 13 $110,448
Associate Professors(STA)
9-Month --- --- 1 * 1 *
Assistant Professors
9-Month 19 $62,080 34 $55,309 53 $57,736
12-Month 21 $75,507 31 $83,532 52 $80,291
Assistant Professors (STA)
9-Month 1 * 5 $53,163 6 $52,219
12-Month --- --- 1 * 1 *
Instructors
9-Month 82 $51,698 125 $42,075 207 $45,887
12-Month 12 $55,297 33 $46,657 45 $48,961
Instructors (STA)
9-Month 12 $41,985 23 $39,154 35 $40,124
12-Month 2 * --- --- 2 *
Mean Salaries by Rank, Basis of Service and Gender
Nine-Month Faculty Twelve-Month Faculty
Note: * indicates fewer than three faculty in the category and therefore, salaries are excluded. However, the salaries are included in the total and all ranks categories if the headcount in those categories is three or more. STA indicates those faculty with a Senior Teaching Appointment.
$0
$50,000
$100,000
$150,000
FullProfessors
AssociateProfessors
AssistantProfessors
AssistantProfessors
(STA)
Instructors Instructors(STA)
Men Women
$0
$50,000
$100,000
$150,000
FullProfessors
AssociateProfessors
AssistantProfessors
AssistantProfessors
(STA)
Instructors Instructors(STA)
Men Women
Institutional ResearchFACT BOOK 2014-15EMPLOYEE INFORMATION
158

Faculty on Special Appointments
History of Faculty on Special Appointments by College
AY2005-06
AY2006-07
AY2007-08
AY2008-09
AY 2009-10
AY2010-11
AY2011-12
AY2012-13
AY 2013-14
AY2014-15
AY 2005-06 to AY 2014-15 Change
Ag Exp Station - - - - - - - - - 1 N/A
Ag Sciences 15 18 15 15 17 18 17 17 18 20 33%
Business 7 13 12 10 11 11 11 10 18 22 214%
Engineering 2 2 3 2 2 5 6 7 9 11 450%
Health & HumanSciences 24 28 29 28 32 40 47 58 59 63 163%
Liberal Arts 47 45 189 150 143 156 161 213 219 212 351%
Libraries 4 4 2 2 1 2 2 1 3 3 -25%
Natural Sciences 15 21 17 16 16 17 19 25 26 31 107%
Non-College 3 6 6 6 6 6 6 6 8 7 133%
Veterinary Med & Biomedical Sci 73 72 70 71 70 71 58 59 57 58 -21%
Warner College ofNatural Resources 8 6 3 3 4 5 4 5 8 8 0%
University Total 198 215 346 303 302 331 331 401 425 436 120%
AY 2005-06 to AY 2014-15 Percent Change in Faculty onSpecial Appointments by College
-100%
200%
500%
Ag ExpStation
AgriculturalSciences
Business Engineering Health &Human Sci
LiberalArts
Libraries NaturalSciences
Vet Med &Bio Sci
Note: In 2007-08, 105 faculty were moved from temporary to special appointments.
Institutional Research FACT BOOK 2014-15
EMPLOYEE INFORMATION 159

Faculty on Special Appointments
History of Faculty on Special Appointments by Ethnicity
AY2005-06
AY2006-07
AY2007-08
AY2008-09
AY2009-10
AY2010-11
AY2011-12
AY2012-13
AY2013-14
AY2014-15
AY 2005-06 to AY 2014-15
Change
Asian 14 16 16 18 16 18 17 17 16 17 21%
Black 1 1 0 0 0 0 1 3 2 2 100%
Hispanic 4 7 12 8 8 10 12 21 21 20 400%
Multi-Racial N/A N/A N/A N/A N/A N/A 1 3 3 6 N/A
Native American 1 2 1 2 2 4 2 2 1 0 -100%
Total MinorityFaculty 20 26 29 28 26 32 33 46 43 45 125%
Non-residentAlien 6 10 5 13 15 11 5 4 8 10 67%
Non-MinorityFaculty 172 179 312 262 261 288 293 351 374 381 122%
Total Faculty 198 215 346 303 302 331 331 401 425 436 120%
Minority Facultyas a Percent of Total Faculty
10.1% 12.1% 8.4% 9.2% 8.6% 9.7% 10.0% 11.5% 10.1% 10.3%
Note: New federal ethnicity and race categories were implemented in the fall of 2010. However, this information was incomplete at the time of publication so previous categories were used. The federal IPEDS definition is used for reporting international faculty. Faculty with a visa type of permanent residents are not reported in the international category but with their ethnic group. In 2007-08, 105 faculty were moved from temporary to special appointments.
on Special Appointments History of Minority Faculty as a Percentage of Total Faculty
0%
5%
10%
15%
20%
AY2005-06
AY2008-09
AY2011-12
AY2014-15
Institutional ResearchFACT BOOK 2014-15EMPLOYEE INFORMATION
160
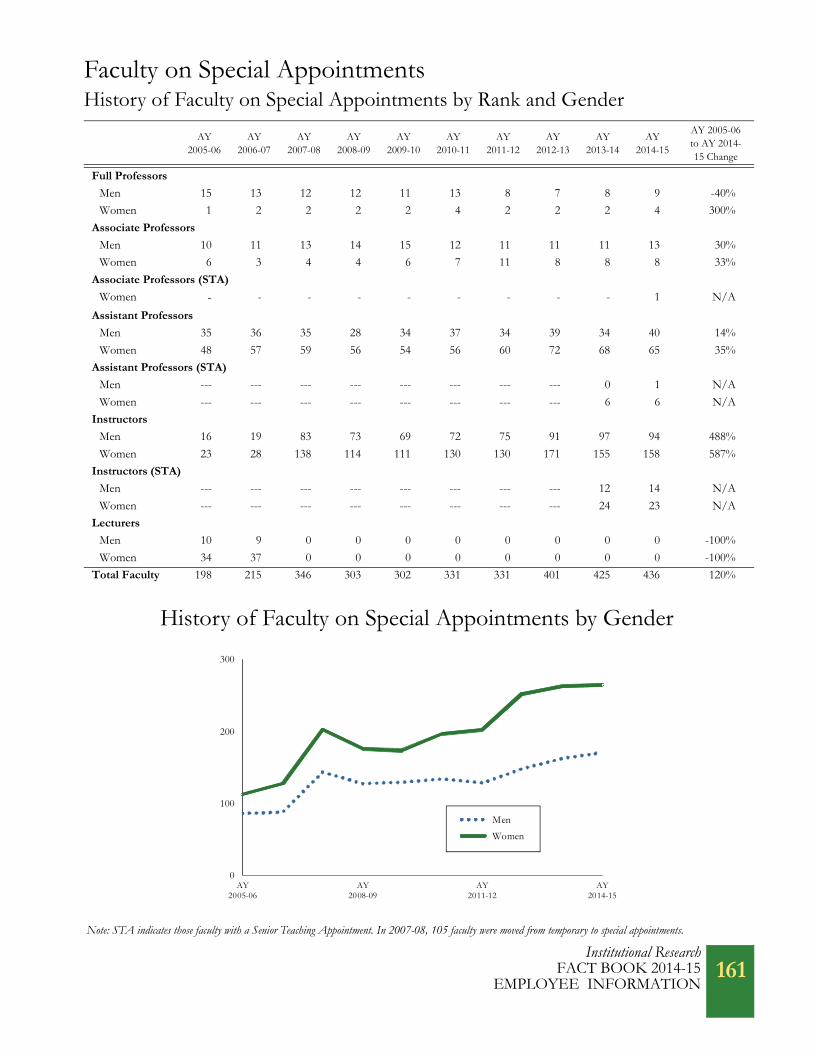
Faculty on Special AppointmentsHistory of Faculty on Special Appointments by Rank and Gender
AY2005-06
AY2006-07
AY2007-08
AY2008-09
AY2009-10
AY2010-11
AY 2011-12
AY 2012-13
AY2013-14
AY2014-15
AY 2005-06 to AY 2014-15 Change
Full Professors
Men 15 13 12 12 11 13 8 7 8 9 -40%
Women 1 2 2 2 2 4 2 2 2 4 300%
Associate Professors
Men 10 11 13 14 15 12 11 11 11 13 30%
Women 6 3 4 4 6 7 11 8 8 8 33%
Associate Professors (STA)
Women - - - - - - - - - 1 N/A
Assistant Professors
Men 35 36 35 28 34 37 34 39 34 40 14%
Women 48 57 59 56 54 56 60 72 68 65 35%
Assistant Professors (STA)
Men --- --- --- --- --- --- --- --- 0 1 N/A
Women --- --- --- --- --- --- --- --- 6 6 N/A
Instructors
Men 16 19 83 73 69 72 75 91 97 94 488%
Women 23 28 138 114 111 130 130 171 155 158 587%
Instructors (STA)
Men --- --- --- --- --- --- --- --- 12 14 N/A
Women --- --- --- --- --- --- --- --- 24 23 N/A
Lecturers
Men 10 9 0 0 0 0 0 0 0 0 -100%
Women 34 37 0 0 0 0 0 0 0 0 -100%
Total Faculty 198 215 346 303 302 331 331 401 425 436 120%
History of Faculty on Special Appointments by Gender
Note: STA indicates those faculty with a Senior Teaching Appointment. In 2007-08, 105 faculty were moved from temporary to special appointments.
0
100
200
300
AY2005-06
AY2008-09
AY2011-12
AY2014-15
Men
Women
Institutional Research FACT BOOK 2014-15
EMPLOYEE INFORMATION 161
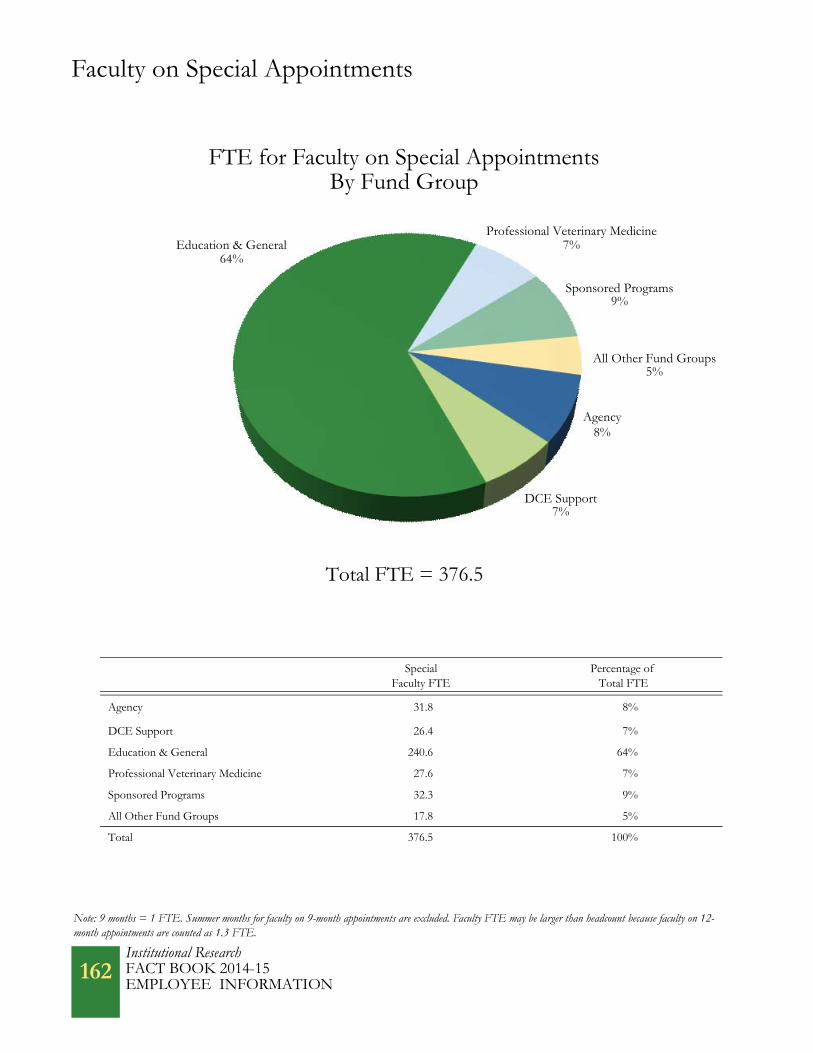
Faculty on Special Appointments
Special Faculty FTE
Percentage of Total FTE
Agency 31.8 8%
DCE Support 26.4 7%
Education & General 240.6 64%
Professional Veterinary Medicine 27.6 7%
Sponsored Programs 32.3 9%
All Other Fund Groups 17.8 5%
Total 376.5 100%
Total FTE = 376.5
FTE for Faculty on Special Appointments By Fund Group
Note: 9 months = 1 FTE. Summer months for faculty on 9-month appointments are excluded. Faculty FTE may be larger than headcount because faculty on 12-month appointments are counted as 1.3 FTE.
Professional Veterinary Medicine7%
Sponsored Programs9%
All Other Fund Groups5%
DCE Support7%
Education & General64%
Agency8%
Institutional ResearchFACT BOOK 2014-15EMPLOYEE INFORMATION
162

Faculty on Special Appointments
Education & General FTE
All Other Fund Group FTE
Total FTE
Agricultural Sciences 11.3 5.7 17.0
Business 15.9 4.8 20.7
Engineering 8.3 1.3 9.6
Health & Human Sciences 47.4 18.6 66.0
Liberal Arts 112.7 11.3 124.0
Libraries 3.3 0.0 3.3
Natural Sciences 19.1 7.0 26.1
Non-College 5.2 34.3 39.5
Veterinary Medicine &Biomedical Sciences 12.6 49.7 62.3
Warner College ofNatural Resources 8.0 0.0 8.0
University Total 243.8 132.7 376.5
FTE for Faculty on Special Appointmentsby College
0.0 50.0 100.0 150.0
Libraries
Warner College of Natural Resources
Engineering
Agricultural Sciences
Business
Natural Sciences
Non-College
Veterinary Medicine & Biomedical Sciences
Health & Human Sciences
Liberal Arts
Education & General FTE
All Other FTE
Institutional Research FACT BOOK 2014-15
EMPLOYEE INFORMATION 163
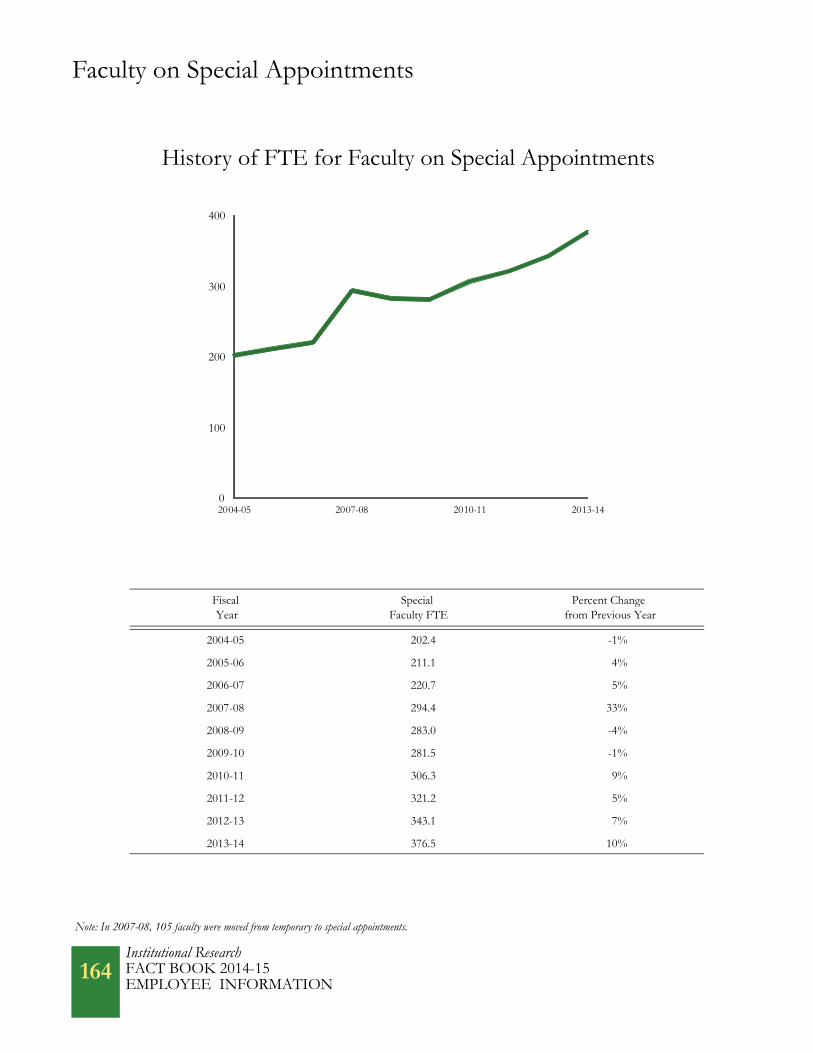
Faculty on Special Appointments
Fiscal Year
Special Faculty FTE
Percent Change from Previous Year
2004-05 202.4 -1%
2005-06 211.1 4%
2006-07 220.7 5%
2007-08 294.4 33%
2008-09 283.0 -4%
2009-10 281.5 -1%
2010-11 306.3 9%
2011-12 321.2 5%
2012-13 343.1 7%
2013-14 376.5 10%
History of FTE for Faculty on Special Appointments
0
100
200
300
400
2004-05 2007-08 2010-11 2013-14
Note: In 2007-08, 105 faculty were moved from temporary to special appointments.
Institutional ResearchFACT BOOK 2014-15EMPLOYEE INFORMATION
164

Faculty on Temporary Appointments
Faculty by College and RankFull
ProfessorsAssociate Professors
Assistant Professors Instructors
Total Faculty
Agricultural Sciences 2 2 0 4 8
Business 0 0 0 38 38
Engineering 0 0 1 9 10
Health & Human Sciences 4 0 1 99 104
Liberal Arts 0 0 0 79 79
Libraries 1 0 0 0 1
Natural Sciences 0 1 1 22 24
Non-College 0 0 0 3 3
Veterinary Medicine & Biomedical Sciences 7 0 0 1 8
Warner College of Natural Resources 0 0 0 6 6
University Total 14 3 3 261 281
Faculty on Temporary Appointments by College and Rank
Note: Includes all faculty employed on a temporary appointment as of September 30, 2014.
0 25 50 75 100 125
Libraries
Non-College
Warner College of Natural Resources
Agricultural Sciences
Veterinary Medicine & Biomedical Sciences
Engineering
Natural Sciences
Business
Liberal Arts
Health & Human Sciences
Full Professors
Associate Professors
Assistant Professors
Instructors
Institutional Research FACT BOOK 2014-15
EMPLOYEE INFORMATION 165

Faculty on Temporary Appointments
History of Faculty on Temporary Appointments by College
AY 2005-06
AY2006-07
AY 2007-08
AY 2008-09
AY 2009-10
AY2010-11
AY 2011-12
AY 2012-13
AY2013-14
AY2014-15
AY 2005-06 to AY 2014-15 Change
AgriculturalSciences 6 3 2 6 5 4 4 4 7 8 33%
Business 27 27 29 24 20 29 31 34 35 38 41%
Engineering 8 9 6 6 8 7 8 6 8 10 25%
Health & Human Sciences 56 54 70 75 70 75 83 99 89 104 86%
Liberal Arts 165 179 15 53 53 65 71 71 69 79 -52%
Libraries 0 0 0 0 0 0 1 1 1 1 N/A
Natural Sciences 12 18 18 23 21 23 18 24 20 24 100%
Non-College 11 6 5 3 1 3 2 2 1 3 -73%
Veterinary Med & Biomedical Sci 3 4 3 4 4 2 5 6 6 8 167%
Warner College ofNatural Resources 7 3 1 2 0 1 2 6 4 6 -14%
University Total 295 303 149 196 182 209 225 253 240 281 -5%
AY 2005-06 to AY 2014-15 Percent Change in Facultyon Temporary Appointments by College
Note: In 2007-08, 105 faculty were moved from temporary to special appointments.
-200%
0%
200%
AgriculturalSciences
Business Engineering Health &Human Sci
LiberalArts
NaturalSciences
Non-College Vet Med &Bio Sci
Warner Collof Nat Res
Institutional ResearchFACT BOOK 2014-15EMPLOYEE INFORMATION
166
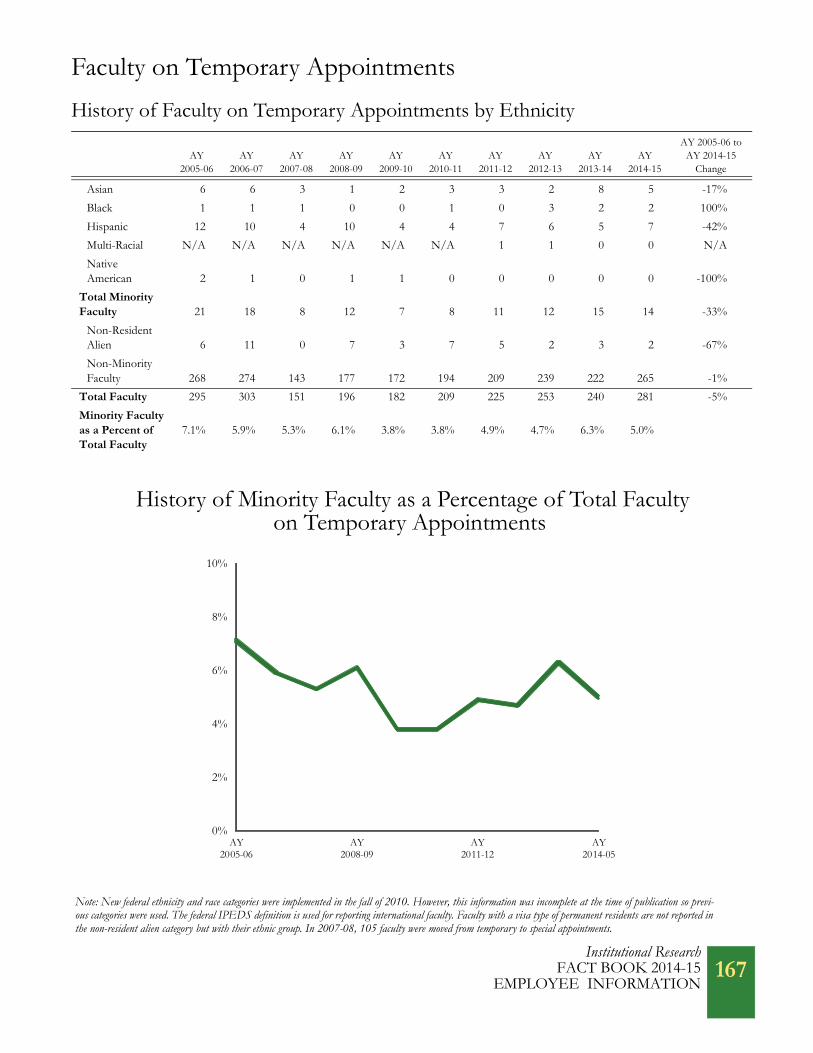
Faculty on Temporary Appointments
History of Faculty on Temporary Appointments by Ethnicity
AY2005-06
AY2006-07
AY 2007-08
AY 2008-09
AY 2009-10
AY 2010-11
AY 2011-12
AY 2012-13
AY 2013-14
AY2014-15
AY 2005-06 to AY 2014-15
Change
Asian 6 6 3 1 2 3 3 2 8 5 -17%
Black 1 1 1 0 0 1 0 3 2 2 100%
Hispanic 12 10 4 10 4 4 7 6 5 7 -42%
Multi-Racial N/A N/A N/A N/A N/A N/A 1 1 0 0 N/A
Native American 2 1 0 1 1 0 0 0 0 0 -100%
Total MinorityFaculty 21 18 8 12 7 8 11 12 15 14 -33%
Non-ResidentAlien 6 11 0 7 3 7 5 2 3 2 -67%
Non-MinorityFaculty 268 274 143 177 172 194 209 239 222 265 -1%
Total Faculty 295 303 151 196 182 209 225 253 240 281 -5%
Minority Facultyas a Percent ofTotal Faculty
7.1% 5.9% 5.3% 6.1% 3.8% 3.8% 4.9% 4.7% 6.3% 5.0%
on Temporary Appointments History of Minority Faculty as a Percentage of Total Faculty
Note: New federal ethnicity and race categories were implemented in the fall of 2010. However, this information was incomplete at the time of publication so previ-ous categories were used. The federal IPEDS definition is used for reporting international faculty. Faculty with a visa type of permanent residents are not reported in the non-resident alien category but with their ethnic group. In 2007-08, 105 faculty were moved from temporary to special appointments.
0%
2%
4%
6%
8%
10%
AY2005-06
AY2008-09
AY2011-12
AY2014-05
Institutional Research FACT BOOK 2014-15
EMPLOYEE INFORMATION 167

Faculty on Temporary Appointments
History of Faculty on Temporary Appointments by Rank and Gender
AY 2005-06
AY 2006-07
AY 2007-08
AY 2008-09
AY 2009-10
AY 2010-11
AY 2011-12
AY 2012-13
AY 2013-14
AY2014-15
AY 2005-06 to AY 2014-15 Change
Full Professors
Men 11 14 7 7 5 7 8 10 10 14 27%
Women 0 0 0 0 0 1 3 1 1 0 N/A
Associate Professors
Men 1 1 1 2 1 3 2 2 2 2 100%
Women 1 1 1 1 0 0 0 0 0 1 0%
Assistant Professors
Men 5 9 3 4 1 1 3 3 1 3 -40%
Women 6 7 5 9 6 5 5 6 4 0 -100%
Instructors
Men 102 102 54 78 72 77 91 95 88 98 -4%
Women 135 147 78 95 97 115 113 136 134 163 21%
Lecturers
Men 12 7 0 0 0 0 0 0 0 0 -100%
Women 22 15 0 0 0 0 0 0 0 0 -100%
Total by Gender
Men 131 133 65 91 79 88 104 110 101 117 -11%
Women 164 170 84 105 103 121 121 143 139 164 0%
Total Faculty 295 303 149 196 182 209 225 253 240 281 -5%
History of Faculty on Temporary Appointments by Gender
0
50
100
150
200
AY2005-06
AY2008-09
AY2011-12
AY2014-15
Men Women
Note: In 2007-08, 105 faculty were moved from temporary to special appointments.
Institutional ResearchFACT BOOK 2014-15EMPLOYEE INFORMATION
168
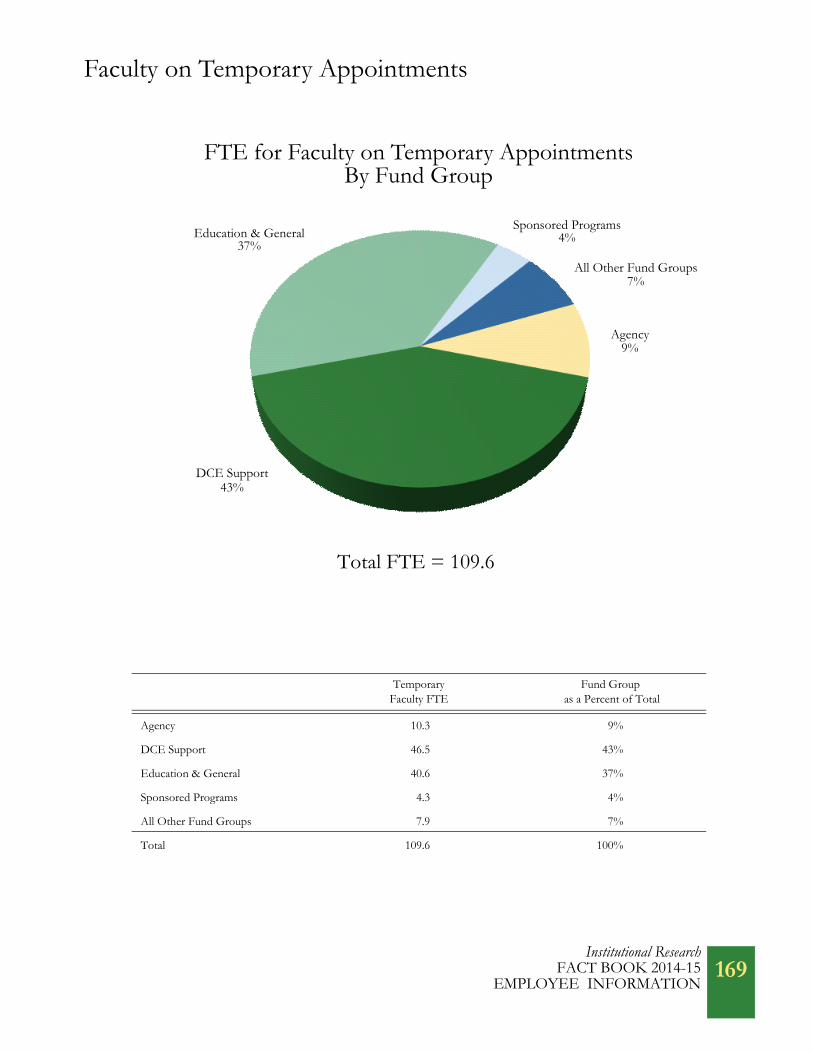
Faculty on Temporary Appointments
Temporary Faculty FTE
Fund Group as a Percent of Total
Agency 10.3 9%
DCE Support 46.5 43%
Education & General 40.6 37%
Sponsored Programs 4.3 4%
All Other Fund Groups 7.9 7%
Total 109.6 100%
Total FTE = 109.6
FTE for Faculty on Temporary AppointmentsBy Fund Group
Education & General37%
DCE Support43%
All Other Fund Groups7%
Sponsored Programs4%
Agency9%
Institutional Research FACT BOOK 2014-15
EMPLOYEE INFORMATION 169

Faculty on Temporary Appointments
Fiscal Year
Temporary Faculty FTE
Percent Change from Previous Year
2004-05 154.8 8%
2005-06 172.8 12%
2006-07 173.5 0%
2007-08 85.9 -50%
2008-09 95.0 11%
2009-10 88.1 -7%
2010-11 101.5 15%
2011-12 112.5 11%
2012-13 110.8 -2%
2013-14 109.6 -1%
History of FTE for Faculty on Temporary Appointments
0.0
50.0
100.0
150.0
200.0
250.0
2004-05 2007-08 2010-11 2013-14
Note: In 2007-08, 150 faculty were moved from temporary to special appointments.
Institutional ResearchFACT BOOK 2014-15EMPLOYEE INFORMATION
170

Administrative Professionals (Excludes Research Associates)
Administrative Professionals by Gender and Agency, College or Administrative Area
Men Percent Men Women Percent Women Total
Agencies
Agricultural Experiment Station 12 71% 5 29% 17
Colorado State Forest Service 57 72% 22 28% 79
CSU Extension 66 41% 95 59% 161
Colleges
Agricultural Sciences 18 39% 28 61% 46
Business 26 38% 43 62% 69
Engineering 75 50% 75 50% 150
Health & Human Sciences 19 26% 53 74% 72
Liberal Arts 22 34% 42 66% 64
Natural Sciences 41 46% 49 54% 90
Veterinary Medicine & Biomedical Sciences 50 30% 118 70% 168
Warner College of Natural Resources 44 57% 33 43% 77
Administration
President 79 69% 36 31% 115
Provost & Executive Vice President 13 39% 20 61% 33
Graduate School 1 10% 9 90% 10
International Programs 9 38% 15 63% 24
Libraries 33 80% 8 20% 41
VP for Advancement 25 33% 50 67% 75
VP for Diversity 0 0% 3 100% 3
VP for Engagement 24 47% 27 53% 51
VP for Enrollment & Access 33 33% 68 67% 101
VP for External Affairs 24 59% 17 41% 41
VP for Faculty Affairs 10 43% 13 57% 23
VP for Information Technology 15 63% 9 38% 24
VP for Research 38 48% 42 53% 80
VP for Student Affairs 111 39% 175 61% 286
VP for Undergraduate Affairs 10 29% 25 71% 35
VP for University Operations 59 53% 52 47% 111
University Total 914 45% 1,132 55% 2,046
Note: Because the funding and function of research associates differs significantly from most other administrative professional positions, they are reported separately in the next section. Includes administrative professionals on regular or special appointments as of September 30, 2014.
Institutional ResearchFACT BOOK 2014-15
EMPLOYEE INFORMATION 171

Administrative Professionals (Excludes Research Associates)
Administrative Professionalsby Agency, College or Administrative Area
Total Administrative Professionals (excludes Research Associates) = 2,046
0 50 100 150 200 250 300 350
VP for Diversity
Graduate SchoolAgricultural Sciences
VP for Faculty AffairsInternational Programs
VP for Information Technology
Provost & Executive VPVP for Undergraduate Affairs
LibrariesVP for External Affairs
Agricultural Experiment StationVP for Engagement
Liberal ArtsBusiness
Health & Human Sciences
VP for AdvancementWarner College of Natural Resources
Colorado State Forest ServiceVP for Research
Natural SciencesVP for Enrollment & Access
VP for University OperationsPresident
Engineering
CSU ExtensionVeterinary Medicine & Biomedical Sciences
VP for Student Affairs
Men
Women
Institutional ResearchFACT BOOK 2014-15EMPLOYEE INFORMATION
172

Administrative Professionals (Excludes Research Associates)
History of Administrative Professionals by Job Title
AY 2005-06
AY 2006-07
AY 2007-08
AY 2008-09
AY 2009-10
AY 2010-11
AY 2011-12
AY 2012-13
AY 2013-14
AY2014-15
AY 2005-06 to AY 2014-15 Change
Administrator 8 9 9 9 11 11 11 13 13 11 38%
Assistant Coach 23 24 24 24 23 24 25 28 30 32 39%
Assistant Coordinator 15 14 20 21 22 20 24 26 38 27 80%
Assistant Director 68 80 94 103 109 108 115 129 149 148 118%
Assistant Manager 5 5 9 12 12 16 18 19 27 31 520%
Assistant to Dean 11 13 14 13 13 14 12 12 16 16 45%
Assistant toDirector 5 5 9 10 10 11 10 11 13 10 100%
Associate Director 23 29 32 32 36 31 34 43 44 48 109%
Coach 10 10 10 10 10 10 10 12 13 13 30%
Coordinator 169 183 191 231 258 280 287 329 383 376 122%
Counselor 35 32 45 45 49 48 48 60 62 54 54%
County ExtensionDirector 32 35 34 31 27 25 28 32 34 37 16%
Director 115 125 143 151 145 166 171 177 194 186 62%
Executive Director 10 9 8 10 10 8 12 14 15 14 40%
Extension Agent 91 101 101 89 79 78 68 71 71 68 -25%
Extension Specialist 30 31 30 21 19 30 23 24 20 20 -33%
Forester 88 89 87 83 84 91 90 75 64 64 -27%
Manager 35 39 47 57 58 60 69 97 128 125 257%
Research Coordinator 5 8 12 16 14 11 12 13 16 15
200%
Res Sci/Scholar I 36 38 34 40 43 52 66 67 69 77 114%
Res Sci/Scholar II 53 46 55 63 58 60 62 68 74 79 49%
Res Sci/Scholar III 32 28 28 33 35 32 28 24 27 22 -31%
SC to AP Conversion --- --- --- --- --- --- --- --- 110 0 N/A
Sr Res Sci/Scholar 20 22 21 19 20 20 27 25 23 27 35%
All Other JobTitles 103 120 131 142 136 135 150 172 204 546 430%
University Total 1,022 1,095 1,188 1,265 1,281 1,341 1,400 1,541 1,837 2,046 100%
Note: The “All Other Job Titles” category includes employees in job titles with fewer than 13 employees in 2013-14. In 2012-13 and 2013-14, 110 state classified staff were moved to administrative professional positions and are listed under SC to AP Conversion.
Institutional ResearchFACT BOOK 2014-15
EMPLOYEE INFORMATION 173

Administrative Professionals (Excludes Research Associates)
History of Administrative Professionals by Ethnicity
AY 2005-06
AY 2006-07
AY 2007-08
AY 2008-09
AY 2009-10
AY 2010-11
AY 2011-12
AY 2012-13
AY 2013-14
AY2014-15
AY 2005-06 to AY 2014-15 Change
Asian 30 29 29 33 35 41 41 44 51 62 107%
Black 25 25 28 34 32 34 34 41 44 47 88%
Hawaiian/Pac Islander N/A N/A N/A N/A N/A N/A 3 3 3 9 N/A
Hispanic 51 54 62 60 57 58 81 93 98 125 145%
Multi-Racial N/A N/A N/A N/A N/A N/A 17 22 25 36 N/A
Native American 10 10 9 10 8 9 8 9 11 11 10%
Total Minority 116 118 128 137 132 142 184 212 232 290 150%
Non-residentAliens 41 37 33 43 46 34 38 31 34 32 -22%
Non-Minority 865 940 1,027 1,085 1,103 1,165 1,178 1,298 1,571 1,724 99%
University Total 1,022 1,095 1,188 1,265 1,281 1,341 1,400 1,541 1,837 2,046 100%
Minorities as a Percent of Total AdministrativeProfessionals
11.4% 10.8% 10.8% 10.8% 10.3% 10.6% 13.1% 13.8% 12.6% 14.2%
Administrative Professional Minorities as a Percentof All Administrative Professionals
Note: New federal ethnicity and race categories were implemented in the fall of 2010. However, this information was incomplete at the time of publication so previous categories were used for 2010-11. The federal IPEDS definition is used for reporting international employees. Employees with a visa type of permanent resident are not reported in the non-resident alien category but with their ethnic group. Part of the increase in Hispanic employees may be due to the change in ethnic categories requiring all faculty who are part Hispanic to be reported as Hispanic instead of with their other ethnic group.
0%
5%
10%
15%
20%
A Y20 05-06
A Y20 08-09
A Y20 11-12
AY20 14-15
Institutional ResearchFACT BOOK 2014-15EMPLOYEE INFORMATION
174

Administrative Professionals (Excludes Research Associates)History of Administrative Professionals
AY 2005-06
AY 2006-07
AY 2007-08
AY 2008-09
AY 2009-10
AY 2010-11
AY 2011-12
AY 2012-13
AY 2013-14
AY2014-15
AY 2005-06 to AY 2014-15 Change
Agencies
Agricultural Experiment Station 13 15 15 15 15 13 14 15 14 17 31%
Colorado State Forest Service 92 93 91 90 91 100 100 83 72 79 -14%
CSU Extension 158 172 172 165 154 168 153 164 160 161 2%
Colleges
Agricultural Sciences 19 28 30 32 33 32 30 30 43 46 142%
Business 15 21 27 30 34 32 36 45 61 69 360%
Engineering 106 102 105 113 110 120 135 146 149 150 42%
Health & Human Sci 24 26 32 32 36 36 45 56 62 72 200%
Liberal Arts 26 31 35 34 39 46 45 46 65 64 146%
Natural Sciences 45 44 49 56 63 62 71 76 88 90 100%
Veterinary Medicine& Biomedical Sciences 61 71 68 82 86 94 102 125 143 168 175%
Warner College of Natural Resources 42 41 40 44 40 41 44 43 50 77 83%
Administration
President 72 95 106 111 97 96 103 118 130 115 60%
Provost & ExecutiveVice President 55 12 31 37 40 27 33 42 24 33 -40%
Graduate School 2 3 7 9 7 7 6 5 8 10 400%
International Programs - - - - - - - - - 24 N/A
Libraries 13 15 22 20 20 16 15 15 12 41 215%
VP for Advancement 46 19 32 39 39 35 34 33 43 75 63%
VP for Diversity - - - - - - - - - 3 N/A
VP for Engagement -- 34 40 24 22 39 44 56 74 51 N/A
VP for Enrollment& Access -- 38 48 49 47 52 50 56 80 101 N/A
VP for External Relations -- -- -- 18 21 25 26 28 39 41 N/A
VP for Faculty Affairs -- -- -- -- -- -- -- -- 23 23 N/A
VP for InformationTechnology -- 8 7 7 6 9 12 15 49 24 N/A
VP for Research 21 25 29 34 36 35 35 42 66 80 281%
VP for Student Affairs 171 155 165 164 172 181 189 219 256 286 67%
VP for UndergraduateAffairs 18 18 24 25 26 27 27 30 33 35 94%
VP for UniversityOperations 23 29 13 35 47 48 51 53 93 111 383%
University Total 1,022 1,095 1,188 1,265 1,281 1,341 1,400 1,541 1,837 2,046 100%
Institutional ResearchFACT BOOK 2014-15
EMPLOYEE INFORMATION 175

Administrative Professionals (Excludes Research Associates)
Regular Appointments Special Appointments
Total FTE Percent of FTE Total FTE Percent of FTE
Agency 47.0 3% 3.2 1%
Athletics 98.4 7% 0.0 0%
Auxiliaries 189.7 13% 2.1 0%
Education & General 650.0 45% 85.0 20%
Extension Service 68.2 5% 3.2 1%
Professional Veterinary Medicine 36.5 3% 28.3 7%
Sponsored Programs 55.2 4% 199.5 47%
All Other Fund Groups 286.6 20% 103.4 24%
Total FTE 1,431.6 100% 424.7 100%
Total FTE =1,431.6
Administrative Professional FTE
Regular Appointments
Total FTE =424.7
Special Appointments
Education & General45%
Sponsored Programs 4%
All Other Funds20%Extension
Service 5%
Agency3%
Athletics7%
Auxiliaries13%
All Other Funds26%
Education
20% & General
PVM 7%
Sponsored Programs 47%
PVM 3%
Institutional ResearchFACT BOOK 2014-15EMPLOYEE INFORMATION
176

Administrative Professionals (Excludes Research Associates)
Administrative Professional FTE by Agency, College or Administrative Area
Total FTE =1,856.3
0.0 50.0 100.0 150.0 200.0 250.0 300.0
Graduate SchoolLibraries
Agricultural Experiment StationProvost & Executive VP
Vice Provost for Faculty AffairsVice Provost for Undergraduate Affairs
Vice President for External RelationsAgricultural Sciences
Vice President for AdvancementVice President for Information Technology
Warner College of Natural ResourcesLiberal Arts
Health & Human SciencesBusiness
Vice President for ResearchColorado State Forest Service
Natural SciencesVice President for Engagement
Vice President for Enrollment & AccessVice President for University Operations
PresidentEngineering
Veterinary Medicine & Biomedical SciencesCSU Extension
Vice President for Student Affairs
Education & General Fund Group
All Other Fund Groups
Institutional ResearchFACT BOOK 2014-15
EMPLOYEE INFORMATION 177

Administrative Professionals (Excludes Research Associates)
Fiscal YearTotal Education & General
Administrative Professional FTEPercent Change
from Previous Year
2004-05 279 3%
2005-06 314 13%
2006-07 370 18%
2007-08 404 9%
2008-09 436 8%
2009-10 447 3%
2010-11 454 2%
2011-12 498 10%
2012-13 596 20%
2013-14 749 26%
Education & General Administrative Professional FTE
0
200
400
600
800
2004-05 2007-08 2010-11 2013-14
Institutional ResearchFACT BOOK 2014-15EMPLOYEE INFORMATION
178

Research Associates
MenPercent
Men WomenPercentWomen
Total Research Associates
Agencies
Agricultural Experiment Station 16 57% 12 43% 28
CSU Extension 1 33% 2 67% 3
Colleges
Agricultural Sciences 25 54% 21 46% 46
Business 0 0% 1 100% 1
Engineering 118 78% 34 22% 152
Health & Human Sciences 3 9% 29 91% 32
Liberal Arts 1 33% 2 67% 3
Natural Sciences 12 36% 21 64% 33
Veterinary Medicine & Biomedical Sciences 46 34% 91 66% 137
Warner College of Natural Resources 259 60% 170 40% 429
Administration
Libraries 0 0% 1 100% 1
VP for Engagement 0 0% 2 100% 2
VP for Research 15 48% 16 52% 31
VP for University Operations 4 80% 1 20% 5
Total Research Associates 500 55% 403 45% 903
Note: Because the funding and function of research associates differs significantly from most other administrative professional positions, they are reported separately in this section. Includes research associates on regular or special appointments who were employed as of September 30, 2014.
Research Associates by College or Area
0 100 200 300 400
Business
Libraries
VP for Engagement
CSU Extension
Liberal Arts
VP for University Operations
Agricultural Experiment Station
VP for Research
Health & Human Sciences
Natural Sciences
Agricultural Sciences
Veterinary Medicine & Biomedical Sciences
Engineering
Warner College of Natural Resources
Institutional ResearchFACT BOOK 2014-15
EMPLOYEE INFORMATION 179

Research AssociatesResearch Associates by Job Title and College or Administrative Area
Research Associate I
Research Associate II
ResearchAssociate III
Research Associate IV
Senior Research Associate Total
Agencies
Agricultural Experiment Station 15 11 2 0 0 28
CSU Extension 2 0 1 0 0 3
Colleges
Agricultural Sciences 7 15 10 9 5 46
Business 1 0 0 0 0 1
Engineering 12 32 59 31 18 152
Health & Human Sciences 7 15 7 2 1 32
Liberal Arts 1 1 0 1 0 3
Natural Sciences 5 9 9 8 2 33
Veterinary Medicine &Biomedical Sciences 47 51 29 6 4 137
Warner College of Natural Resources 92 161 116 41 19 429
Administration
Libraries 1 0 0 0 0 1
VP for Engagement 0 1 1 0 0 2
VP for Research 18 6 6 0 1 31
VP for University Operations 0 1 1 2 1 5
University Total 208 303 241 100 51 903
Research Associates by Job Title
Total Research Associates =903
Research Associate I23%
Research Associate II34%
Research Associate III27%
Research Associate IV11%
Senior Research Associate 6%
Institutional ResearchFACT BOOK 2014-15EMPLOYEE INFORMATION
180

Research Associates
History of Research Associates by College or Administrative Area
AY 2005-06
AY 2006-07
AY 2007-08
AY 2008-09
AY 2009-10
AY 2010-11
AY 2011-12
AY 2012-13
AY 2013-14
AY2014-15
AY 2005-06 to AY 2014-15 Change
Agencies
Agricultural Experiment Station 15 16 15 18 19 21 27 28 29 28 87%
Colorado State Forest Service 0 0 0 0 1 0 0 0 0 0 0%
CSU Extension 2 3 3 4 5 4 4 4 2 3 50%
Colleges
Agricultural Sci 62 57 59 58 49 58 52 52 45 46 -26%
Business 1 1 2 2 2 3 4 3 2 1 0%
Engineering 165 167 139 149 150 149 146 146 145 152 -8%
Health & HumanSciences 27 29 31 31 26 31 35 32 34 32 19%
Liberal Arts 1 3 8 6 4 6 3 2 2 3 200%
Natural Sciences 24 23 25 24 31 32 29 36 32 33 38%
Veterinary Med& Biomedical Sci 159 161 160 161 153 153 148 136 142 137 -14%
Warner College ofNatural Resources 284 307 347 348 350 304 320 322 366 429 51%
Administration
Executive VP -- -- 5 5 -- -- -- -- --- --- N/A
Provost & Executive VP 1 0 0 0 0 0 0 0 0 0 N/A
Libraries 0 0 0 0 0 0 0 0 1 1 N/A
VP for Engagement 0 0 1 1 3 4 5 4 3 2 N/A
VP for Research 4 5 5 11 13 14 12 13 21 31 675%
VP for University Operations 4 5 0 0 5 4 4 4 5 5 25%
University Total 749 777 800 818 811 783 789 782 829 903 21%
Institutional ResearchFACT BOOK 2014-15
EMPLOYEE INFORMATION 181

Research Associates
History of Research Associates by Job Title
AY 2005-06
AY 2006-07
AY 2007-08
AY 2008-09
AY 2009-10
AY 2010-11
AY 2011-12
AY 2012-13
AY 2013-14
AY2014-15
AY 2005-06 to AY 2014-15 Change
Research Associate I 170 183 193 201 198 199 189 164 184 208 22%
Research Associate II 215 225 231 241 253 241 245 257 273 303 41%
Research Associate III 219 224 233 240 226 207 215 222 226 241 10%
Research Associate IV 102 94 90 83 82 81 88 84 92 100 -2%
Senior Research Associate 43 51 53 53 52 55 52 55 54 51 19%
Total 749 777 800 818 811 783 789 782 829 903 21%
AY 2005-06 to AY 2014-15 Percent Change in Research Associates by Job Title
-25%
0%
25%
50%
ResearchAssociate I
ResearchAssociate II
ResearchAssociate III
ResearchAssociate IV
Senior ResearchAssociate
Institutional ResearchFACT BOOK 2014-15EMPLOYEE INFORMATION
182

Research Associates
History of Research Associates by Ethnicity
AY 2005-06
AY 2006-07
AY 2007-08
AY 2008-09
AY 2009-10
AY 2010-11
AY 2011-12
AY 2012-13
AY 2013-14
AY2014-15
AY 2005-06 to AY 2014-15 Change
Asian 38 34 38 31 34 38 29 34 37 44 16%
Black 5 6 4 5 5 6 10 9 11 16 220%
Hawaiian/Pacific Islander N/A N/A N/A N/A N/A N/A 6 6 7 6 N/A
Hispanic 17 18 20 23 21 20 32 31 34 36 112%
Multi-Racial N/A N/A N/A N/A N/A N/A 6 8 9 12 N/A
Native American 7 7 7 8 8 7 7 5 5 4 -43%
Total Minority 67 65 69 67 68 71 90 93 103 118 76%
Non-resident Alien 27 21 22 19 20 15 17 16 14 15 -44%
Non-Minority 655 691 709 732 723 697 682 673 712 770 18%
Total Research Associates 749 777 800 818 811 783 789 782 829 903 21%
Minority Research Associates as a Percent of TotalResearch Associates
8.9% 8.4% 8.6% 8.2% 8.4% 9.1% 11.4% 11.9% 12.4% 13.1%
Note: New federal ethnicity and race categories were implemented in the fall of 2010. However, this information was incomplete at the time of publication so previous categories were used for 2010-11. The IPEDS federal definition is used for reporting international employees. Employees with a visa type of permanent resident are not reported in the non-resident alien category but in their ethnic group. A portion of the increase in Hispanic employees may be due to the change in ethnic categories requiring all employees who are part Hispanic to be reported as Hispanic instead of with their other ethnic group.
Research Associate Minorities as a Percent of Total Research Associates
0%
5%
10%
15%
AY2005-06
AY2008-09
AY2011-12
AY2014-15
Institutional ResearchFACT BOOK 2014-15
EMPLOYEE INFORMATION 183
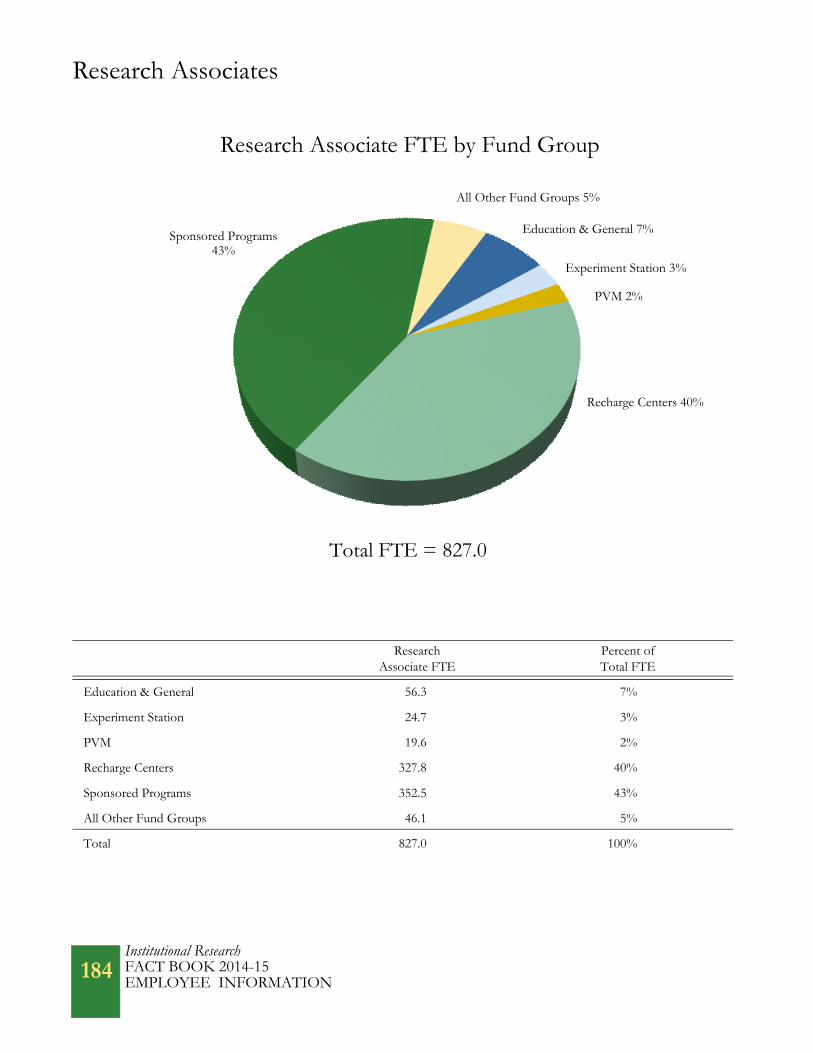
Research Associates
Research Associate FTE
Percent of Total FTE
Education & General 56.3 7%
Experiment Station 24.7 3%
PVM 19.6 2%
Recharge Centers 327.8 40%
Sponsored Programs 352.5 43%
All Other Fund Groups 46.1 5%
Total 827.0 100%
Total FTE = 827.0
Research Associate FTE by Fund Group
Sponsored Programs43%
Education & General 7%
PVM 2%
Recharge Centers 40%
All Other Fund Groups 5%
Experiment Station 3%
Institutional ResearchFACT BOOK 2014-15EMPLOYEE INFORMATION
184
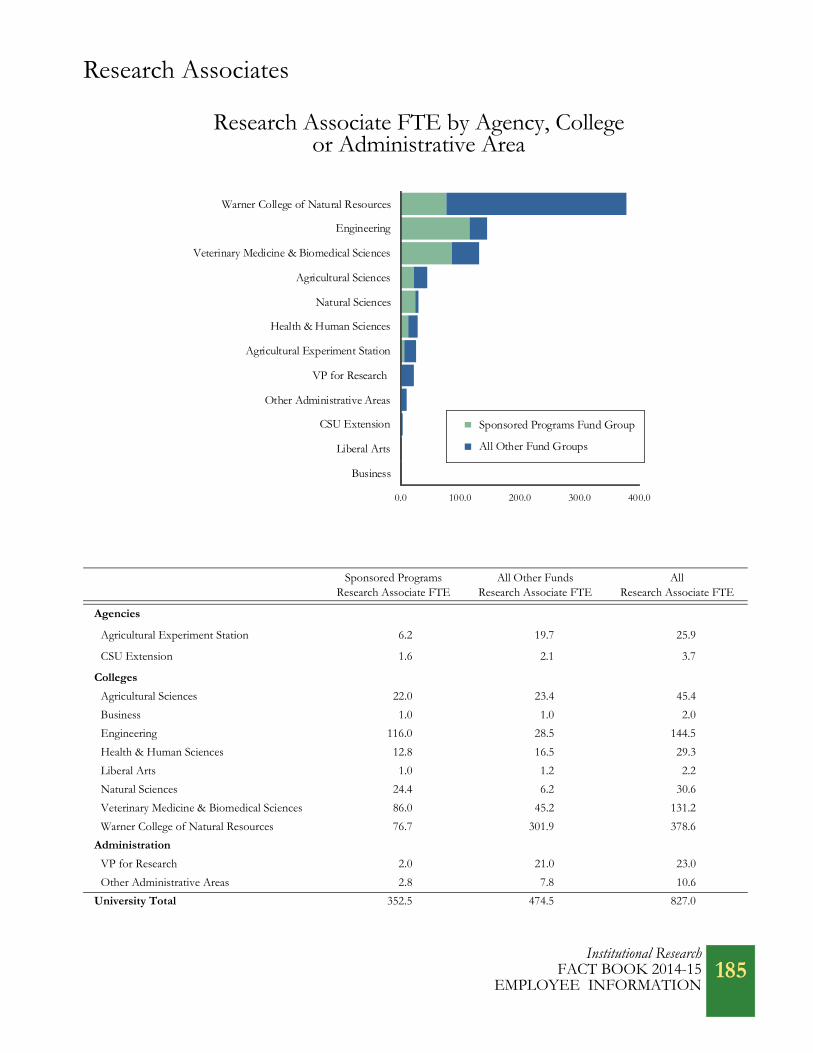
Research Associates
Sponsored ProgramsResearch Associate FTE
All Other FundsResearch Associate FTE
AllResearch Associate FTE
Agencies
Agricultural Experiment Station 6.2 19.7 25.9
CSU Extension 1.6 2.1 3.7
Colleges
Agricultural Sciences 22.0 23.4 45.4
Business 1.0 1.0 2.0
Engineering 116.0 28.5 144.5
Health & Human Sciences 12.8 16.5 29.3
Liberal Arts 1.0 1.2 2.2
Natural Sciences 24.4 6.2 30.6
Veterinary Medicine & Biomedical Sciences 86.0 45.2 131.2
Warner College of Natural Resources 76.7 301.9 378.6
Administration
VP for Research 2.0 21.0 23.0
Other Administrative Areas 2.8 7.8 10.6
University Total 352.5 474.5 827.0
Research Associate FTE by Agency, College or Administrative Area
0.0 100.0 200.0 300.0 400.0
Business
Liberal Arts
CSU Extension
Other Administrative Areas
VP for Research
Agricultural Experiment Station
Health & Human Sciences
Natural Sciences
Agricultural Sciences
Veterinary Medicine & Biomedical Sciences
Engineering
Warner College of Natural Resources
Sponsored Programs Fund Group
All Other Fund Groups
Institutional ResearchFACT BOOK 2014-15
EMPLOYEE INFORMATION 185

Research Associates
Fiscal YearTotal Education & General
Research Associate FTEPercent Change
from Previous Year
2005 36 9%
2006 43 19%
2007 50 16%
2008 44 -12%
2009 51 16%
2010 43 -16%
2011 49 14%
2012 44 -10%
2013 55 25%
2014 56 2%
Education & General Research Associate FTE
0.0
20.0
40.0
60.0
80.0
2004-05 2007-08 2010-11 2013-14
Institutional ResearchFACT BOOK 2014-15EMPLOYEE INFORMATION
186

State Classified Employees
State Classified Employees by Gender
MenPercent
Men WomenPercent Women
Total StateClassified Employees
Agencies
Agricultural Experiment Station 5 63% 3 38% 8
Colorado State Forest Service 1 5% 20 95% 21
CSU Extension 1 3% 31 97% 32
Colleges
Agricultural Sciences 2 12% 15 88% 17
Business 1 10% 9 90% 10
Engineering 2 10% 18 90% 20
Health & Human Sciences 3 17% 15 83% 18
Liberal Arts 1 3% 31 97% 32
Natural Sciences 6 13% 41 87% 47
Veterinary Medicine &Biomedical Sciences 51 21% 193 79% 244
Warner College of Natural Resources 3 15% 17 85% 20
Administration
President 0 0% 3 100% 3
Provost & Executive Vice President 0 0% 2 100% 2
Graduate School 0 0% 9 100% 9
International Programs 0 0% 5 100% 5
Libraries 30 51% 29 49% 59
VP for Advancement 3 23% 10 77% 13
VP for Diversity 0 0% 1 100% 1
VP for Engagement 3 25% 9 75% 12
VP for Enrollment & Access 6 10% 57 90% 63
VP for External Relations 7 32% 15 68% 22
VP for Faculty Affairs 0 0% 1 100% 1
VP for Information Technology 30 75% 10 25% 40
VP for Research 11 41% 16 59% 27
VP for Student Affairs 175 39% 272 61% 447
VP for Undergraduate Affairs 1 14% 6 86% 7
VP for University Operations 346 67% 167 33% 513
University Total 688 41% 1,005 59% 1,693
Note: Includes state classified employees who were employed as of September 30, 2013. In 2012-13 and 2013-14, 110 state classified staff were moved from state classified positions to administrative professional positions.
Institutional ResearchFACT BOOK 2014-15
EMPLOYEE INFORMATION187

State Classified Employees
State Classified Employees
Total State Classified Employees =1,693
by Agency, College or Administrative Area
0 200 400 600
VP for DiversityVP for Faculty Affairs
Provost & Executive Vice PresidentPresident
International ProgramsVP for Undergraduate Affairs
Agricultural Experiment StationGraduate School
BusinessVP for Engagement
VP for AdvancementAgricultural Sciences
Health & Human SciencesEngineering
Warner College of Natural ResourcesColorado State Forest Service
VP for External RelationsVP for ResearchCSU Extension
Liberal ArtsVP for Information Technology
Natural SciencesLibraries
VP for Enrollment & AccessVeterinary Medicine & Biomedical Sciences
VP for Student AffairsVP for University Operations
Institutional ResearchFACT BOOK 2014-15EMPLOYEE INFORMATION
188

State Classified Employees
Total Employees
Custodian I 185
Administrative Assistant III 139
Administrative Assistant II 134
Accounting Technician III 70
IT Professional 56
Program Assistant I 47
Accounting Technician II 40
Structural Trades II 38
Dining Services II 38
Pipe/Mechanical Trades II 38
Veterinary Technology II 37
Custodian III 32
Dining Services III 32
Program Assistant II 31
General Professional III 27
Custodian II 23
State Classified Positions with the Largest Number of Employees
0 50 100 150 200
Custodian II
General Professional III
Program Assistant II
Custodian III
Dining Services III
Veterinary Technology II
Pipe/Mech Trades II
Dining Services II
Structural Trades II
Accounting Technician II
Program Assistant I
IT Professional
Accounting Technician III
Admin Assistant II
Admin Assistant III
Custodian I
Institutional ResearchFACT BOOK 2014-15
EMPLOYEE INFORMATION189

State Classified Employees
History of State Classified Employees by Ethnicity
AY 2005-06
AY 2006-07
AY 2007-08
AY 2008-09
AY 2009-10
AY 2010-11
AY 2011-12
AY 2012-13
AY 2013-14
AY2014-15
AY 2005-06 to AY 2014-15 Change
Asian 37 41 39 36 37 48 26 24 21 24 -35%
Black 16 22 19 22 23 20 17 19 11 11 -31%
Hawaiian/Pac Islander N/A N/A N/A N/A N/A N/A 13 11 10 2 N/A
Hispanic 242 268 262 279 265 263 272 261 241 264 9%
Multi-Racial N/A N/A N/A N/A N/A N/A 19 25 23 21 N/A
Native American 30 29 28 24 21 20 19 17 17 17 -43%
Total Minority 325 360 348 361 346 351 366 357 323 339 4%
Non-ResidentAlien 4 3 2 4 5 5 6 3 3 3 -25%
Non-Minority 1,719 1,672 1,742 1,756 1,709 1,679 1,568 1,550 1,438 1,351 -21%
University Total 2,048 2,035 2,092 2,121 2,060 2,035 1,940 1,910 1,764 1,693 -17%
Minorities as a Percent of Total State ClassifiedEmployees
15.9% 17.7% 16.6% 17.0% 16.8% 17.2% 18.9% 18.7% 18.3% 20.0%
State Classified Minorities as a Percent of Total State Classified Employees
Note: New federal ethnicity and race categories were implemented in the fall of 2010. The federal IPEDS definition is used for reporting international employees. Employees with a visa type of permanent resident are not reported in the non-resident alien category but with their ethnic group. Part of the increase in Hispanic employees may be due to the change in ethnic categories requiring all employees who are part Hispanic to be reported as Hispanic instead of with their other ethnic group. The addi-tion of the Multi-Racial category may have decreased the number of employees reported in the Asian, Black and Native American categories. The addition of the Hawai-ian/Pacific Islander category may have decreased the number of employees in the Asian category.
0%
5%
10%
15%
20%
25%
AY2005-06
AY2008-09
AY2011-12
AY2014-15
Institutional ResearchFACT BOOK 2014-15EMPLOYEE INFORMATION
190

State Classified EmployeesHistory of State Classified Employees by Agency, College or Administrative Area
AY2005-06
AY2006-07
AY2007-08
AY2008-09
AY 2009-10
AY 2010-11
AY 2011-12
AY 2012-13
AY 2013-14
AY2014-15
AY 2005-06 to AY 2014-15 Change
Agencies
Agricultural Experiment Station 11 10 11 11 11 11 10 9 8 8 -27%
Colorado State Forest Service 29 27 37 39 44 46 44 24 25 21 -28%
CSU Extension 23 28 30 30 28 27 26 36 37 32 39%
Colleges
Agricultural Sciences 30 31 25 27 24 22 20 20 16 17 -43%
Business 13 14 15 16 14 14 14 15 11 10 -23%
Engineering 42 40 42 45 43 40 33 27 23 20 -52%
Health & Human Sci 36 35 39 40 37 34 30 20 20 18 -50%
Liberal Arts 34 37 40 40 38 33 35 36 32 32 -6%
Natural Sciences 60 57 54 53 48 50 45 47 44 47 -22%
Veterinary Medicine & Biomedical Sci 264 274 284 274 261 251 242 246 229 244 -8%
Warner College of Natural Resources 54 50 48 44 48 65 55 58 48 20 -63%
Administration
President 17 63 15 14 11 8 7 6 6 3 -82%
Executive VP -- -- 122 72 -- -- -- -- -- -- N/A
Provost & Exec VP 132 75 7 10 9 4 3 3 3 2 -98%
Graduate School 8 7 8 7 7 9 9 10 9 9 13%
International Prog -- -- -- -- -- -- -- -- -- 5 N/A
Libraries 58 54 53 54 53 43 37 34 35 59 2%
VP for Advancement 65 19 19 18 17 16 15 15 13 13 -80%
VP for Diversity -- -- -- -- -- -- -- -- -- 1 N/A
VP for Engagement -- 19 21 15 16 19 21 18 17 12 N/A
VP for Enrollment & Access -- 109 116 116 115 112 105 107 74 63 N/A
VP for ExternalRelations -- -- -- 52 50 42 38 37 25 22 N/A
VP for FacultyAffairs -- -- -- -- -- -- -- -- 1 1 N/A
VP for InformationTechnology -- 99 115 115 114 113 105 98 69 40 N/A
VP for Research 57 58 48 52 53 49 43 41 35 27 -53%
VP for StudentAffairs 604 469 467 482 479 487 470 460 453 447 -26%
VP for Undergradu-ate Affairs -- 8 8 8 8 7 7 7 7 7 N/A
VP for University Operations 511 452 468 487 532 533 526 536 524 513 N/A
University Total 2,048 2,035 2,092 2,121 2,060 2,035 1,940 1,910 1,764 1,693 -17%
Institutional ResearchFACT BOOK 2014-15
EMPLOYEE INFORMATION191
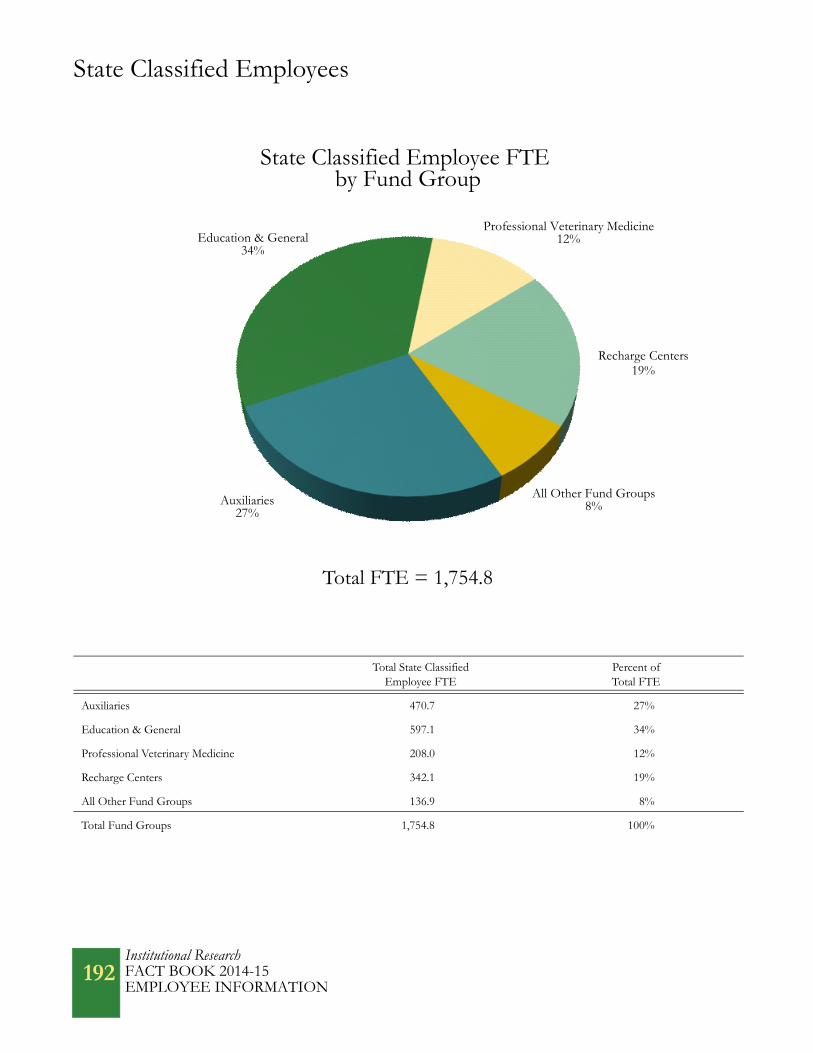
State Classified Employees
Total State ClassifiedEmployee FTE
Percent of Total FTE
Auxiliaries 470.7 27%
Education & General 597.1 34%
Professional Veterinary Medicine 208.0 12%
Recharge Centers 342.1 19%
All Other Fund Groups 136.9 8%
Total Fund Groups 1,754.8 100%
State Classified Employee FTE
Total FTE = 1,754.8
by Fund Group
Education & General34%
Auxiliaries27%
Professional Veterinary Medicine12%
Recharge Centers19%
All Other Fund Groups8%
Institutional ResearchFACT BOOK 2014-15EMPLOYEE INFORMATION
192

State Classified Employees
State Classified Employee FTEby Agency, College or Administrative Area
Total FTE = 1,754.8
0.0 200.0 400.0 600.0
Vice Provost for Faculty Affairs
Provost & Executive VP
President
Vice Provost for Undergraduate Affairs
Graduate School
Agricultural Experiment Station
Business
Vice President for Advancement
Agricultural Sciences
Vice President for Engagement
Health & Human Sciences
Colorado State Forest Service
Vice President for External Relations
Engineering
Warner College of Natural Resources
CSU Extension
Liberal Arts
Libraries
Vice President for Research
Natural Sciences
Vice President for Enrollment & Access
Vice President for Information Technology
Veterinary Medicine & Biomedical Sciences
Vice President for Student Affairs
Vice President for University Operations
Education & General Fund Group All Other Fund Groups
Institutional ResearchFACT BOOK 2014-15
EMPLOYEE INFORMATION193
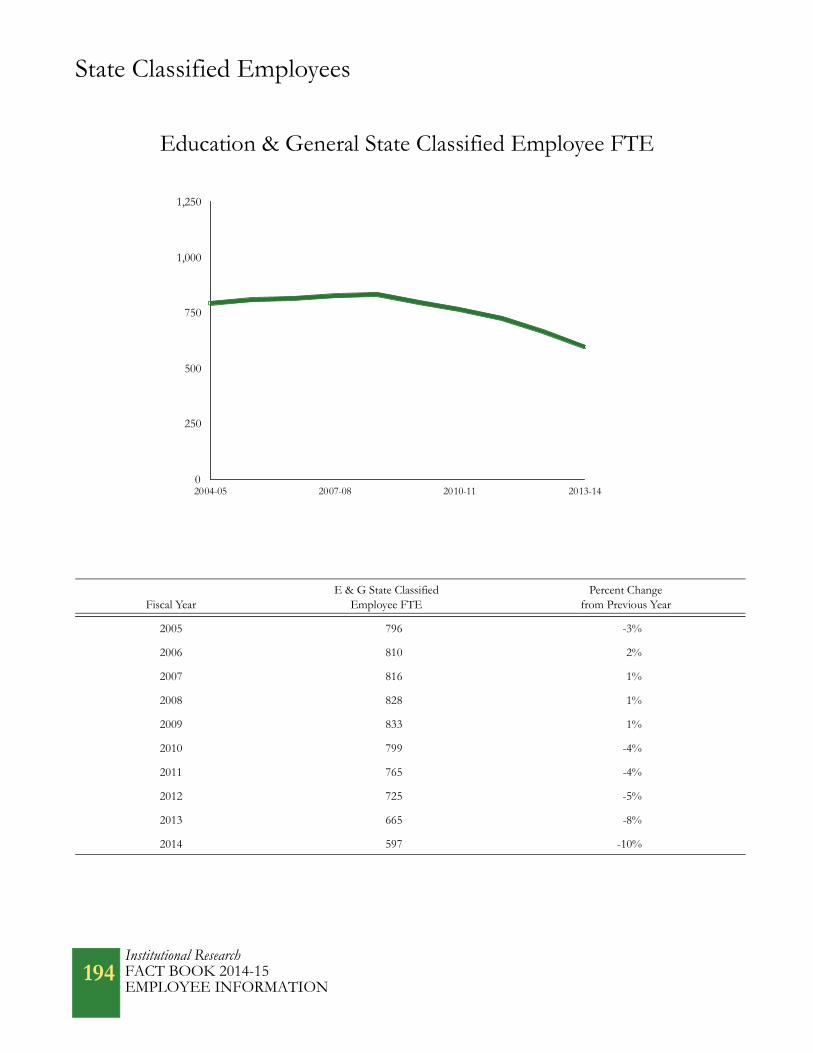
State Classified Employees
Fiscal YearE & G State Classified
Employee FTEPercent Change
from Previous Year
2005 796 -3%
2006 810 2%
2007 816 1%
2008 828 1%
2009 833 1%
2010 799 -4%
2011 765 -4%
2012 725 -5%
2013 665 -8%
2014 597 -10%
Education & General State Classified Employee FTE
0
250
500
750
1,000
1,250
2004-05 2007-08 2010-11 2013-14
Institutional ResearchFACT BOOK 2014-15EMPLOYEE INFORMATION
194

Post Doctorates
Post Doctorates by College and GenderMen Women Total
Number Percent Number Percent Post Doctorates
Agricultural Sciences 6 46% 7 54% 13
Engineering 23 66% 12 34% 35
Health and Human Sciences 0 0% 2 100% 2
Natural Sciences 34 69% 15 31% 49
Non-College 2 50% 2 50% 4
Veterinary Medicine & Biomedical Sciences 46 37% 77 63% 123
Warner College of Natural Resources 19 70% 8 30% 27
University Total 130 51% 123 49% 253
Post Doctorates by College
Note: Includes all post doctorates employed as of September 30, 2014.
0 25 50 75 100 125
Health and Human Sciences
Non-College
Agricultural Sciences
Warner College of Natural Resources
Engineering
Natural Sciences
Veterinary Medicine & Biomedical Sciences
Men
Women
Institutional Research FACT BOOK 2014-15
EMPLOYEE INFORMATION 195

Post Doctorates
History of Post Doctorates
AY 2005-06
AY 2006-07
AY 2007-08
AY 2008-09
AY 2009-10
AY 2010-11
AY 2011-12
AY 2012-13
AY 2013-14
AY2014-15
AY 2005-06 to AY 2014-15 Change
Agricultural Sci 9 10 15 15 14 13 18 17 11 13 44%
Engineering 18 27 33 34 33 30 30 38 39 35 94%
Health & Human Sciences 0 1 1 2 3 1 1 1 0 2 N/A
Liberal Arts 0 0 0 0 0 0 0 0 0 0 0%
Natural Sciences 93 84 75 68 63 64 76 78 66 49 -47%
Non-College 1 1 0 2 2 1 3 4 3 4 300%
Veterinary Med &Biomedical Sci 55 58 67 63 50 52 47 108 108 123 124%
Warner College ofNatural Resources 10 10 9 14 15 14 18 23 20 27 170%
University Total 186 191 200 198 180 175 193 269 247 253 36%
AY 2005-06 to AY 2014-15 Percent Changein Post Doctorates by College
-200%
-100%
0%
100%
200%
300%
AgriculturalSciences
Engineering Health &Human Sci
LiberalArts
NaturalSciences
Non-College
Vet Med &Bio Sci
Warner Collof Nat Res
Institutional ResearchFACT BOOK 2014-15EMPLOYEE INFORMATION
196

Graduate Assistants
Graduate Assistants by Gender and College Men Women Total Graduate
AssistantsNumber Percent Number Percent
Agricultural Sciences 56 45% 69 55% 125
Business 33 52% 30 48% 63
Engineering 186 70% 79 30% 265
Health & Human Sciences 38 29% 93 71% 131
Liberal Arts 113 41% 164 59% 277
Natural Sciences 313 61% 196 39% 509
Non-College 21 46% 25 54% 46
Veterinary Medicine & Biomedical Sciences 42 38% 70 63% 112
Warner College of Natural Resources 67 48% 74 52% 141
University Total 869 52% 800 48% 1,669
Note: Includes graduate assistants employed as of September 30, 2014.
Graduate Assistants by College
0 200 400 600
Non-College
Business
Veterinary Medicine & Biomedical Sciences
Agricultural Sciences
Health & Human Sciences
Warner College of Natural Resources
Engineering
Liberal Arts
Natural Sciences
Men
Women
Institutional ResearchFACT BOOK 2014-15
EMPLOYEE INFORMATION 197

Graduate Assistants
History of Graduate Assistants by College
AY 2005-06
AY 2006-07
AY 2007-08
AY 2008-09
AY 2009-10
AY 2010-11
AY 2011-12
AY 2012-13
AY 2013-14
AY2014-15
AY 2005-06 to AY 2014-15 Change
Agricultural Sciences 88 87 99 106 93 101 109 103 108 125 42%
Business 29 36 46 59 56 66 55 58 55 63 117%
Engineering 241 241 249 236 208 253 301 263 258 265 10%
Health & Human Sci 105 99 104 109 106 133 119 125 132 131 25%
Liberal Arts 161 160 222 225 226 268 257 264 257 277 72%
Natural Sciences 470 473 469 460 414 500 504 490 507 509 8%
Non-College 44 47 47 45 34 49 50 51 49 46 5%
Veterinary Medicine & Biomedical Sci 131 117 120 111 107 114 108 107 109 112 -15%
Warner College ofNatural Resources 123 118 104 109 84 138 149 135 140 141 15%
University Total 1,392 1,378 1,460 1,460 1,328 1,622 1,652 1,596 1,615 1,669 20%
AY 2005-06 to AY 2014-15 Percent Change in Graduate Assistants by College
-50%
0%
50%
100%
150%
AgriculturalSciences
Business Engineering Health &Human Sci
LiberalArts
NaturalSciences
Non-College
Vet Med &Bio Sci
Warner Collof Nat Res
Institutional ResearchFACT BOOK 2014-15EMPLOYEE INFORMATION
198

Graduate Assistants
Graduate Assistant FTE by Type and College - 2013-14Graduate Research
Assistant FTEGraduate Support
Assistant FTEGraduate Teaching
Assistant FTETotal GraduateAssistant FTE
Agricultural Sciences 72.8 0.0 33.0 105.8
Business 0.0 19.6 0.0 19.6
Engineering 200.6 0.0 43.8 244.4
Health & Human Sciences 29.8 7.5 53.1 90.4
Liberal Arts 3.3 0.0 240.6 243.9
Natural Sciences 158.6 11.8 338.4 508.8
Non-College 24.0 47.9 13.9 85.8
Veterinary Medicine & BiomedicalSciences 92.7 0.0 15.0 107.7
Warner College of Natural Resources 96.0 0.0 32.0 128.0
University Total 677.8 86.8 769.8 1,534.4
Note: Graduate teaching assistant FTE is calculated by dividing months paid by 4.5. Graduate research assistant and graduate support assistant FTE are calcu-lated by dividing months paid by 6. Summer months are excluded for graduate teaching assistants. FTE is reported as of the end of the fiscal year.
Graduate Assistant FTE by College
0.0 200.0 400.0 600.0
Business
Non-College
Health & Human Sciences
Agricultural Sciences
Veterinary Medicine & Biomedical Sciences
Warner College of Natural Resources
Liberal Arts
Engineering
Natural Sciences
Graduate Research Assistant FTE
Graduate Support Assistant FTE
Graduate Teaching Assistant FTE
Institutional ResearchFACT BOOK 2014-15
EMPLOYEE INFORMATION 199

Graduate Assistants
History of Graduate Assistant FTE by Type
AY 2005-06
AY 2006-07
AY 2007-08
AY 2008-09
AY 2009-10
AY 2010-11
AY 2011-12
AY 2012-13
AY2013-14
AY 2005-06 to AY 2013-14 Change
Graduate Research Assistants 678.8 644.6 639.6 680.8 701.3 740.8 722.5 680.0 677.8 0%
Graduate Support Assistants 85.7 84.7 89.2 102.9 100.4 91.3 84.6 87.4 86.8 1%
Graduate Teaching Assistants 572.5 596.1 681.4 704.4 675.1 696.7 738.6 740.3 769.8 34%
Total Graduate Assistants 1,337.0 1,325.4 1,410.2 1,488.1 1,476.8 1,528.8 1,545.7 1,507.7 1,534.4 15%
AY 2005-06 to AY 2013-14 Percent Change inGraduate Assistant FTE
-25%
0%
25%
50%
GraduateResearch Assistants
GraduateSupport Assistants
GraduateTeaching Assistants
Institutional ResearchFACT BOOK 2014-15EMPLOYEE INFORMATION
200
Costs and Student Financial Aid Highlights
Resident undergraduate tuition for 2014-15 is $7,868, while non-resident undergraduate tuition is $24,048.
Resident undergraduate tuition increased 5% in 2014-15, while non-resident undergraduate tuition increased 3%.
Resident undergraduate tuition increased 133% between 2005-06 and 2014-15, while non-resident undergraduate tuition increased 68%.
CSU ranked 8th of 14 peer institutions in the amount of tuition paid per resident undergraduate student and8th of 14 peer institutions in the amount of tuition paid per non-resident student.
Total mandatory student fees are $2,029 per student for 2014-15.
Total mandatory student fees increased 72% between 2005-06 and 2014-15.
CSU ranked 7th of 13 peer institutions in the amount of mandatory student fees paid per student.
Room and board rates for a standard room and the 21-meal plan for 2014-15 are $10,488.
CSU ranked 3rd of 14 peer institutions in the cost of room and board.
Student financial aid increased from $170,217,865 in 2006-07 to $284,691,359 in 2013-14 or 67%.
In 2013-14, 76% of all students received financial aid.
In 2013-14, students brought 3,073 outside scholarships worth $7.1 million to CSU.
In fall 2014, 7 Boettcher Scholars and 5 National Merit Scholars entered CSU as new freshmen.
In 2013-14, the average Pell Grant awarded was $3,880 while the average Stafford Loan(including subsidized and unsubsidized) was $6,489.
CSU ranked 10th of 14 peer institutions for the total state and institutional aid awarded to undergraduate students.
CSU’s student loan default rate was 3.9% in FY 2011.
Institutional ResearchFACT BOOK 2014-15
COSTS AND STUDENT FINANCIAL AID201


Tuition Rates
History of Tuition Rates
AY2005-06
AY2006-07
AY2007-08
AY2008-09
AY2009-10
AY2010-11
AY2011-12
AY2012-13
AY2013-14
AY2014-15
AY 2005-06 to 2014-15
Change
Resident Undergraduate $3,381 $3,466 $4,040 $4,424 $4,822 $5,256 $6,307 $6,875 $7,494 $7,868 133%
Non-Resident Undergraduate 14,343 14,994 17,480 20,140 20,744 21,366 22,007 22,667 23,347 24,048 68%
Resident Graduate 3,690 4,248 4,887 5,621 6,464 7,434 7,992 8,392 8,811 9,075 146%
Non-Resident Graduate 14,958 15,642 16,425 17,253 18,116 19,022 19,592 20,572 21,600 22,248 49%
AY 2005-06 to AY 2014-15 Percent Change in Tuition
0%
50%
100%
150%
200%
UndergraduateResident
UndergraduateNon-Resident
GraduateResident
GraduateNon-Resident
Institutional ResearchFACT BOOK 2014-15
COSTS AND STUDENT FINANCIAL AID203

Tuition Rates
Resident Undergraduate Tuition
Non-ResidentUndergraduate Tuition
Colorado State University $7,494 $23,347
Iowa State University 6,648 19,200
Kansas State University 7,317 19,416
Michigan State University 14,295 34,815
North Carolina State University 6,038 19,493
Oklahoma State University 4,425 16,440
Oregon State University 6,876 22,068
Purdue University 9,208 28,010
Texas A & M University 5,297 21,917
University of California, Davis 11,020 34,098
University of Illinois, Urbana-Champaign 11,104 25,246
University of Tennessee, Knoxville 9,780 27,970
Virginia Tech 9,620 24,770
Washington State University 11,396 24,478
Board of Governors’ Peer Group Comparison2013-14 Academic Year Undergraduate Tuition
Source: Common Data Set, 2013-14
Residents Non-Residents
$0 $5,000 $10,000 $15,000 $20,000
Oklahoma State University
Texas A & M University
North Carolina State University
Iowa State University
Oregon State University
Kansas State University
Purdue University
Virginia Tech
University of Tennessee, Knoxville
University of California, Davis
University of Illinois, Urbana-Champaign
Washington State University
Michigan State University
$0 $10,000 $20,000 $30,000 $40,000
Oklahoma State University
Iowa State University
Kansas State University
North Carolina State University
Texas A & M University
Oregon State University
Washington State University
Virginia Tech
University of Illinois, Urbana-Champaign
University of Tennessee, Knoxville
Purdue University
University of California, Davis
Michigan State University
Colorado State University Colorado State University
Institutional ResearchFACT BOOK 2014-15COSTS AND STUDENT FINANCIAL AID
204
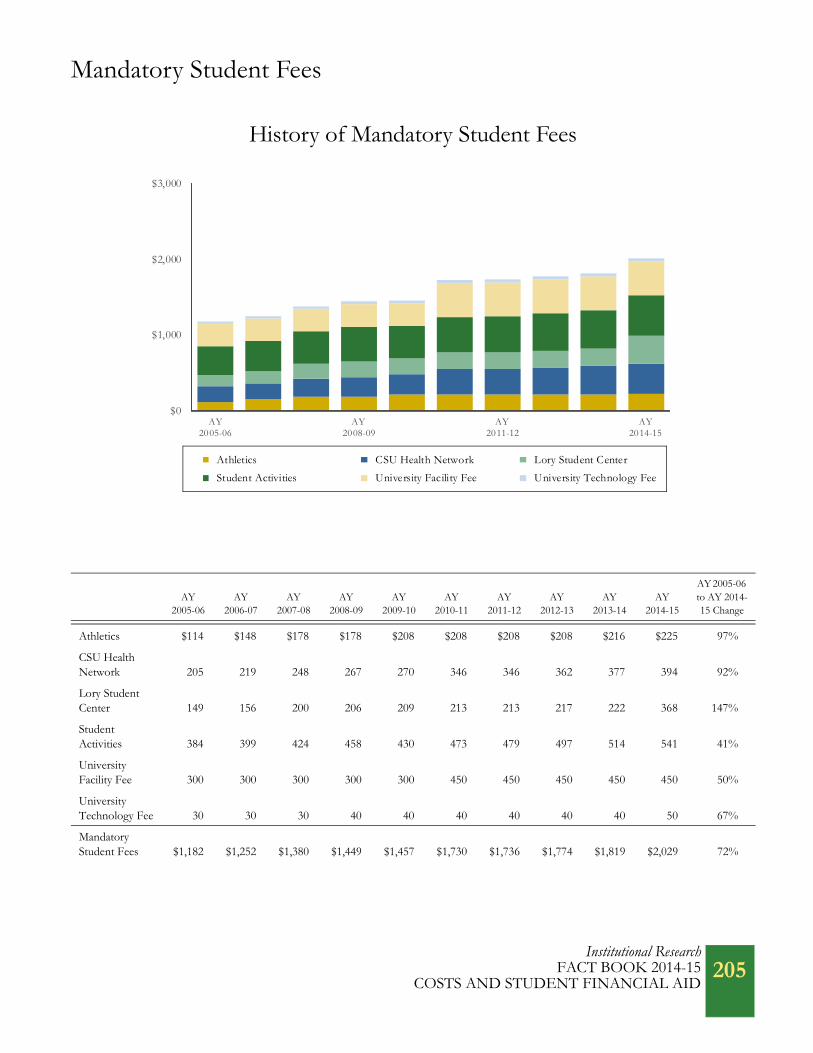
Mandatory Student Fees
AY2005-06
AY2006-07
AY2007-08
AY2008-09
AY2009-10
AY2010-11
AY2011-12
AY2012-13
AY2013-14
AY2014-15
AY 2005-06 to AY 2014-15 Change
Athletics $114 $148 $178 $178 $208 $208 $208 $208 $216 $225 97%
CSU Health Network 205 219 248 267 270 346 346 362 377 394 92%
Lory StudentCenter 149 156 200 206 209 213 213 217 222 368 147%
Student Activities 384 399 424 458 430 473 479 497 514 541 41%
UniversityFacility Fee 300 300 300 300 300 450 450 450 450 450 50%
University Technology Fee 30 30 30 40 40 40 40 40 40 50 67%
Mandatory Student Fees $1,182 $1,252 $1,380 $1,449 $1,457 $1,730 $1,736 $1,774 $1,819 $2,029 72%
History of Mandatory Student Fees
$0
$1,000
$2,000
$3,000
AY2005-06
AY2008-09
AY2011-12
AY2014-15
Athletics CSU Health Network Lory Student Center
Student Activities University Facility Fee University Technology Fee
Institutional ResearchFACT BOOK 2014-15
COSTS AND STUDENT FINANCIAL AID205

Mandatory Student Fees
Academic Year Student Fees
Colorado State University $1,820
Iowa State University 1,078
Kansas State University 730
North Carolina State University 2,168
Oklahoma State University 3,017
Oregon State University 1,446
Purdue University 784
Texas A & M University 3,209
University of California, Davis 2,676
University of Illinois, Urbana-Champaign 3,324
University of Tennessee, Knoxville 1,414
Virginia Tech 1,840
Washington State University 930
Board of Governors’ Peer Group Comparison2013-14 Academic Year Student Fees
Source: Common Data Set, 2013-14
$0 $1,000 $2,000 $3,000 $4,000
Kansas State University
Purdue University
Washington State University
Iowa State University
University of Tennessee, Knoxville
Oregon State University
Virginia Tech
North Carolina State University
University of California, Davis
Oklahoma State University
Texas A & M University
University of Illinois, Urbana-Champaign
Colorado State University
Institutional ResearchFACT BOOK 2014-15COSTS AND STUDENT FINANCIAL AID
206

Room and Board Rates
Room Board Total
Standard Room
Any 21 Meals $5,104 $5,384 $10,488
Any 14 Meals 5,104 4,998 10,102
Any 10 Meals 5,104 4,624 9,728
Suite
Any 21 Meals $5,986 $5,384 $11,370
Any 14 Meals 5,986 4,998 10,984
Any 10 Meals 5,986 4,624 10,610
Room and Board Rates
$0
$3,000
$6,000
$9,000
$12,000
$15,000
Standard Room Suite
Any 21 Meals Any 14 Meals Any 10 Meals
Institutional ResearchFACT BOOK 2014-15
COSTS AND STUDENT FINANCIAL AID207

Room and Board Rates
Room and Board Rates
Colorado State University $10,776
Iowa State University 7,721
Kansas State University 7,450
Michigan State University 8,806
North Carolina State University 8,434
Oklahoma State University 6,868
Oregon State University 10,695
Purdue University 10,590
Texas A & M University 8,450
University of California, Davis 13,961
University of Illinois, Urbana-Champaign 10,332
University of Tennessee, Knoxville 9,170
Virginia Tech 8,170
Washington State University 10,868
Board of Governors’ Peer Group ComparisonRoom and Board Rates - Academic-Year 2013-14
Source: Common Data Set, 2013-14Note: The maximum meal plan was used for the peer comparison.
$0 $5,000 $10,000 $15,000
Oklahoma State University
Kansas State University
Iowa State University
Virginia Tech
North Carolina State University
Texas A & M University
Michigan State University
University of Tennessee, Knoxville
University of Illinois, Urbana-Champaign
Purdue University
Oregon State University
Washington State University
University of California, Davis
Colorado State University
Institutional ResearchFACT BOOK 2014-15COSTS AND STUDENT FINANCIAL AID
208
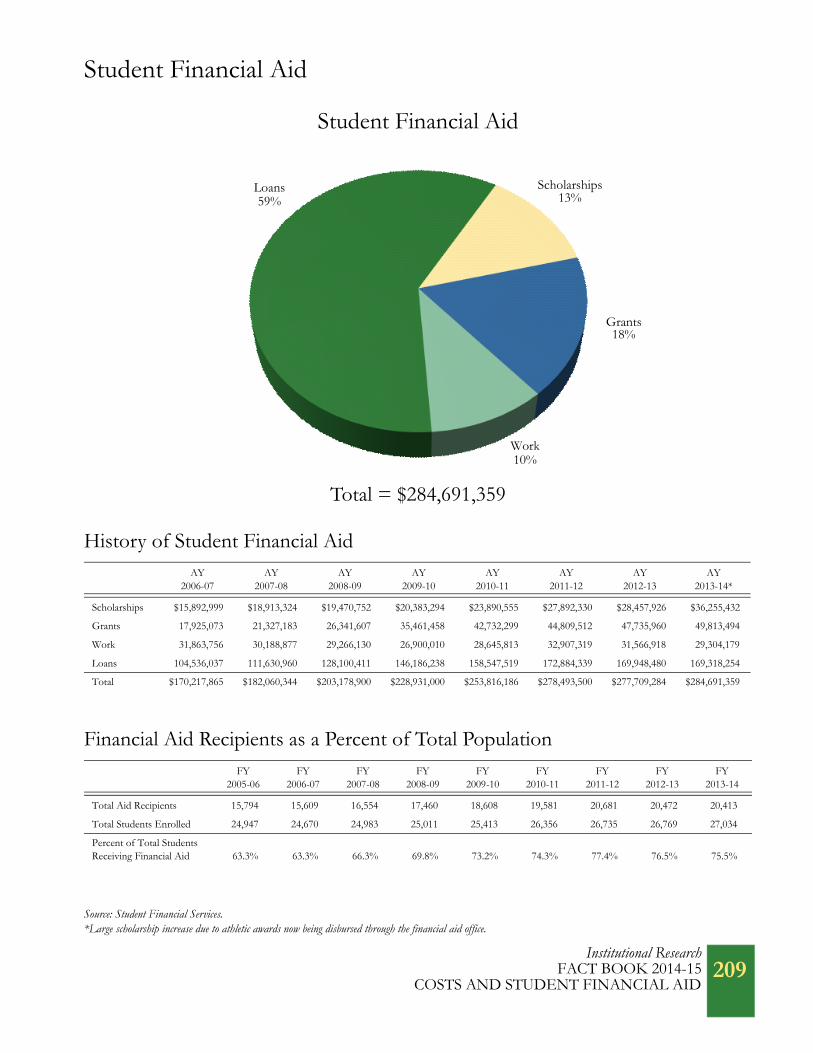
Student Financial Aid
History of Student Financial Aid
Financial Aid Recipients as a Percent of Total Population
AY2006-07
AY2007-08
AY2008-09
AY2009-10
AY2010-11
AY2011-12
AY2012-13
AY2013-14*
Scholarships $15,892,999 $18,913,324 $19,470,752 $20,383,294 $23,890,555 $27,892,330 $28,457,926 $36,255,432
Grants 17,925,073 21,327,183 26,341,607 35,461,458 42,732,299 44,809,512 47,735,960 49,813,494
Work 31,863,756 30,188,877 29,266,130 26,900,010 28,645,813 32,907,319 31,566,918 29,304,179
Loans 104,536,037 111,630,960 128,100,411 146,186,238 158,547,519 172,884,339 169,948,480 169,318,254
Total $170,217,865 $182,060,344 $203,178,900 $228,931,000 $253,816,186 $278,493,500 $277,709,284 $284,691,359
FY2005-06
FY2006-07
FY2007-08
FY2008-09
FY2009-10
FY2010-11
FY2011-12
FY2012-13
FY2013-14
Total Aid Recipients 15,794 15,609 16,554 17,460 18,608 19,581 20,681 20,472 20,413
Total Students Enrolled 24,947 24,670 24,983 25,011 25,413 26,356 26,735 26,769 27,034
Percent of Total StudentsReceiving Financial Aid 63.3% 63.3% 66.3% 69.8% 73.2% 74.3% 77.4% 76.5% 75.5%
Student Financial Aid
Source: Student Financial Services. *Large scholarship increase due to athletic awards now being disbursed through the financial aid office.
Total = $284,691,359
Loans59%
Scholarships13%
Grants18%
Work10%
Institutional ResearchFACT BOOK 2014-15
COSTS AND STUDENT FINANCIAL AID209
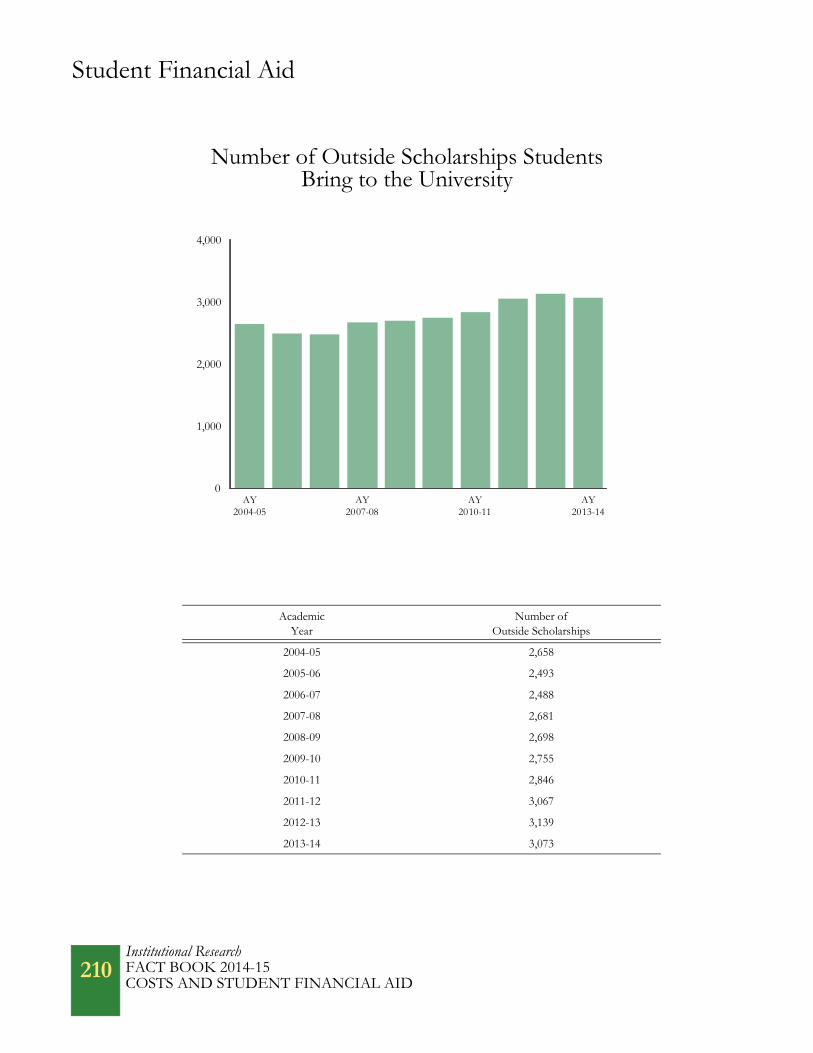
Student Financial Aid
Academic Year
Number ofOutside Scholarships
2004-05 2,658
2005-06 2,493
2006-07 2,488
2007-08 2,681
2008-09 2,698
2009-10 2,755
2010-11 2,846
2011-12 3,067
2012-13 3,139
2013-14 3,073
Number of Outside Scholarships StudentsBring to the University
0
1,000
2,000
3,000
4,000
AY2004-05
AY2007-08
AY2010-11
AY2013-14
Institutional ResearchFACT BOOK 2014-15COSTS AND STUDENT FINANCIAL AID
210
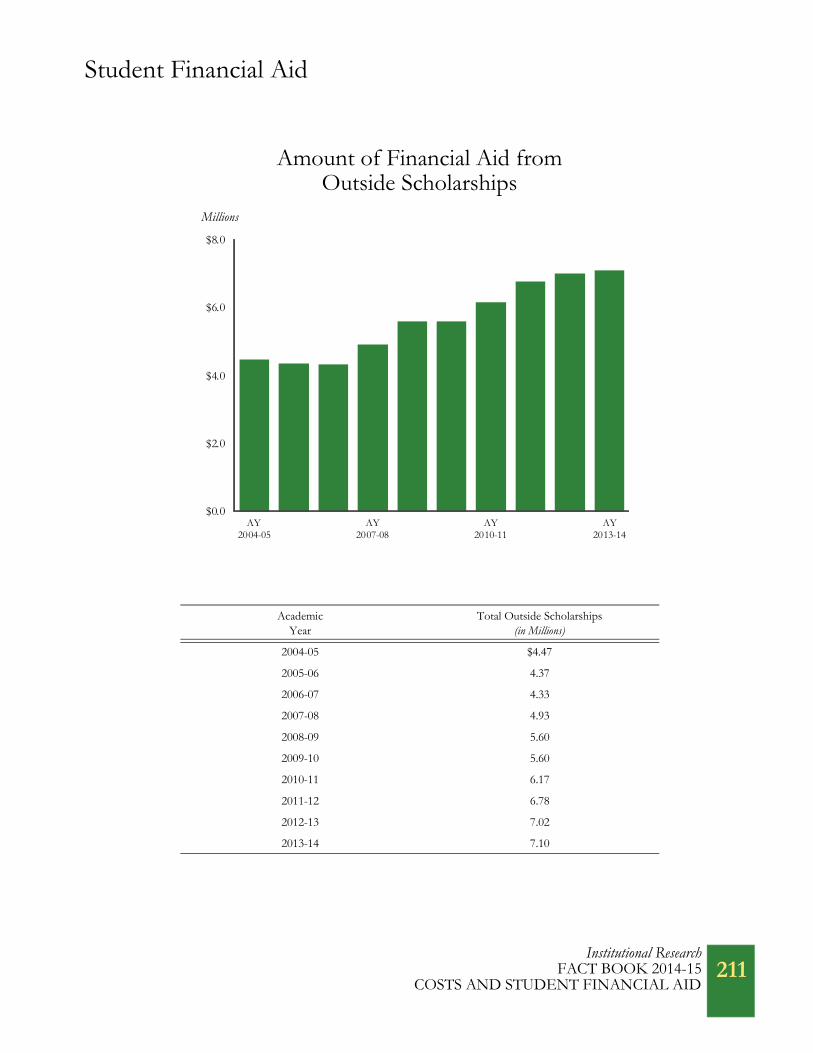
Student Financial Aid
Academic Year
Total Outside Scholarships(in Millions)
2004-05 $4.47
2005-06 4.37
2006-07 4.33
2007-08 4.93
2008-09 5.60
2009-10 5.60
2010-11 6.17
2011-12 6.78
2012-13 7.02
2013-14 7.10
Amount of Financial Aid fromOutside Scholarships
Millions
$0.0
$2.0
$4.0
$6.0
$8.0
AY2004-05
AY2007-08
AY2010-11
AY2013-14
Institutional ResearchFACT BOOK 2014-15
COSTS AND STUDENT FINANCIAL AID211
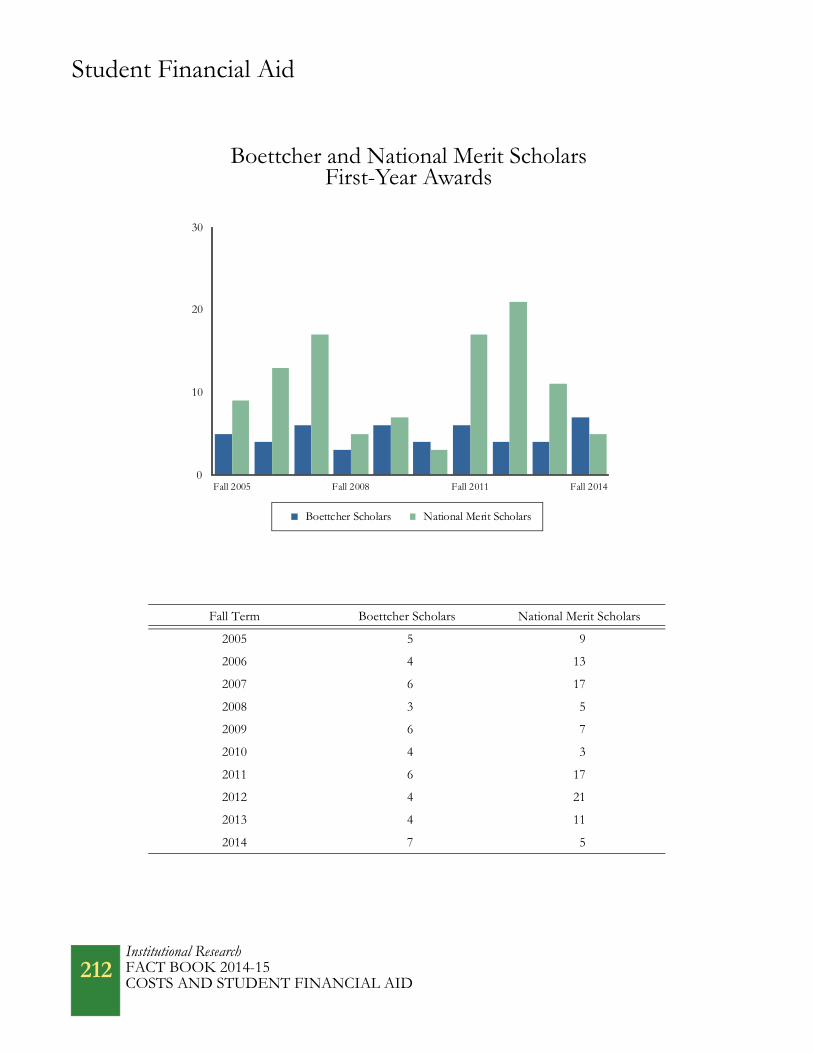
Student Financial Aid
Fall Term Boettcher Scholars National Merit Scholars
2005 5 9
2006 4 13
2007 6 17
2008 3 5
2009 6 7
2010 4 3
2011 6 17
2012 4 21
2013 4 11
2014 7 5
Boettcher and National Merit ScholarsFirst-Year Awards
0
10
20
30
Fall 2005 Fall 2008 Fall 2011 Fall 2014
Boettcher Scholars National Merit Scholars
Institutional ResearchFACT BOOK 2014-15COSTS AND STUDENT FINANCIAL AID
212

Student Financial Aid
AcademicYear
Academic Year Resident Tuition
AveragePell Grant
Average Stafford Loan
2004-05 $2,940 $2,425 $3,749
2005-06 3,381 2,448 3,899
2006-07 3,466 2,565 3,987
2007-08 4,040 2,773 4,564
2008-09 4,424 3,171 4,655
2009-10 4,822 3,868 4,687
2010-11 5,256 4,072 4,658
2011-12 6,307 3,764 4,743
2012-13 6,875 3,829 5,135
2013-14 7,494 3,880 6,489*
Resident Tuition Compared to Average Pell Grantand Average Stafford Loan
$0
$2,000
$4,000
$6,000
$8,000
AY2004-05
AY2007-08
AY2010-11
AY2013-14
Average Pell Grant Average Stafford Loan Resident Tuition
*Includes total of subsidized and unsubsidized Stafford loans; previous years only include subsidized.
Institutional ResearchFACT BOOK 2014-15
COSTS AND STUDENT FINANCIAL AID213
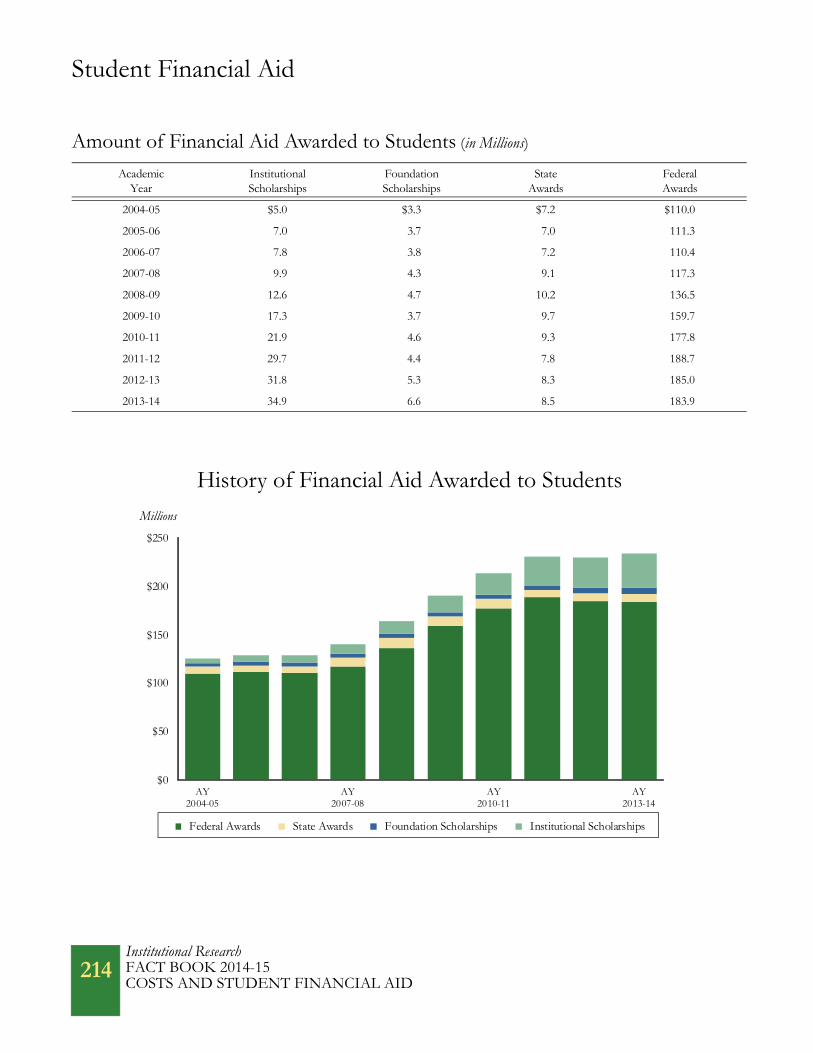
Student Financial Aid
Amount of Financial Aid Awarded to Students (in Millions)
AcademicYear
Institutional Scholarships
FoundationScholarships
StateAwards
FederalAwards
2004-05 $5.0 $3.3 $7.2 $110.0
2005-06 7.0 3.7 7.0 111.3
2006-07 7.8 3.8 7.2 110.4
2007-08 9.9 4.3 9.1 117.3
2008-09 12.6 4.7 10.2 136.5
2009-10 17.3 3.7 9.7 159.7
2010-11 21.9 4.6 9.3 177.8
2011-12 29.7 4.4 7.8 188.7
2012-13 31.8 5.3 8.3 185.0
2013-14 34.9 6.6 8.5 183.9
History of Financial Aid Awarded to Students
$0
$50
$100
$150
$200
$250
AY2004-05
AY2007-08
AY2010-11
AY2013-14
Federal Awards State Awards Foundation Scholarships Institutional Scholarships
Millions
Institutional ResearchFACT BOOK 2014-15COSTS AND STUDENT FINANCIAL AID
214

Student Financial Aid
Number of Financial Aid AwardsAcademic
YearInstitutional Scholarships
FoundationScholarships
StateAwards
FederalAwards
2004-05 2,371 1,912 2,626 12,220
2005-06 3,256 2,006 2,371 12,051
2006-07 3,511 2,076 2,491 11,638
2007-08 8,231 2,166 4,587 11,840
2008-09 9,809 2,332 4,903 12,539
2009-10 10,459 2,045 5,635 13,833
2010-11 9,595 2,355 6,223 14,861
2011-12 11,459 2,338 5,171 15,480
2012-13 11,351 2,529 5,637 15,205
2013-14 12,124 2,817 6,093 14,930
History of Financial Aid Awards
0
5,000
10,000
15,000
20,000
AY2004-05
AY2007-08
AY2010-11
AY2013-14
Federal Awards State Awards
Foundation Scholarships Institutional Scholarships
Institutional ResearchFACT BOOK 2014-15
COSTS AND STUDENT FINANCIAL AID215
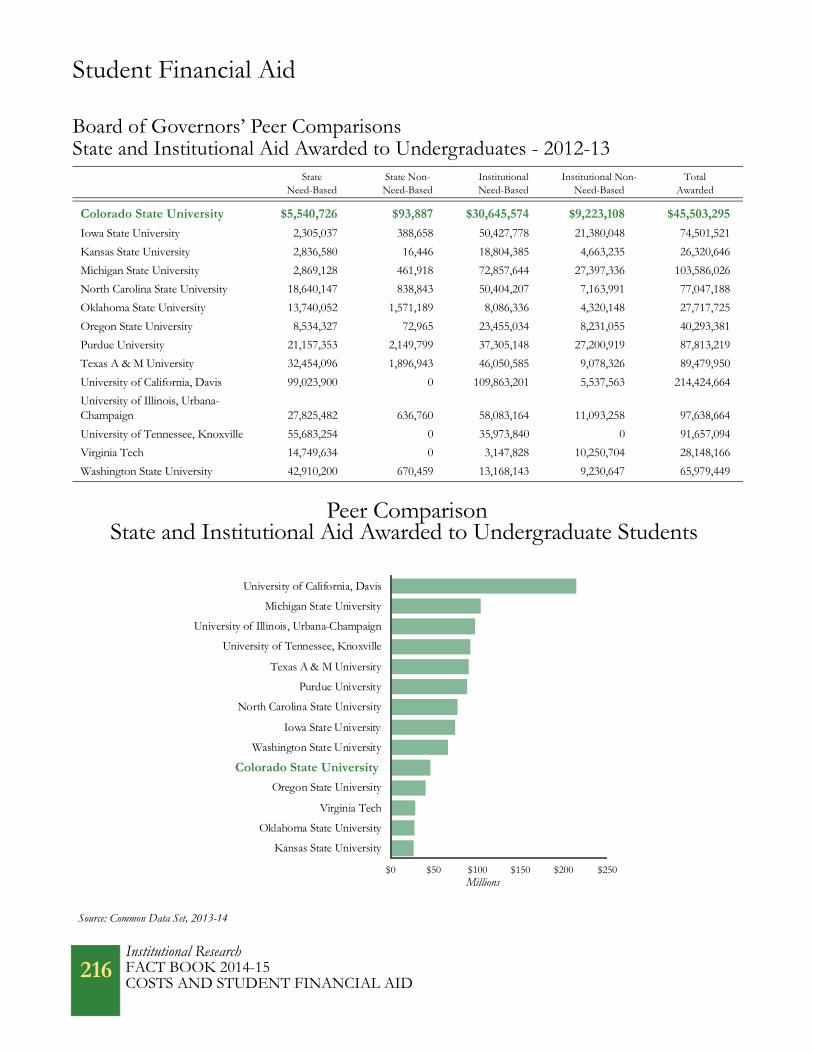
Student Financial Aid
Board of Governors’ Peer ComparisonsState and Institutional Aid Awarded to Undergraduates - 2012-13
StateNeed-Based
State Non-Need-Based
InstitutionalNeed-Based
Institutional Non-Need-Based
Total Awarded
Colorado State University $5,540,726 $93,887 $30,645,574 $9,223,108 $45,503,295
Iowa State University 2,305,037 388,658 50,427,778 21,380,048 74,501,521
Kansas State University 2,836,580 16,446 18,804,385 4,663,235 26,320,646
Michigan State University 2,869,128 461,918 72,857,644 27,397,336 103,586,026
North Carolina State University 18,640,147 838,843 50,404,207 7,163,991 77,047,188
Oklahoma State University 13,740,052 1,571,189 8,086,336 4,320,148 27,717,725
Oregon State University 8,534,327 72,965 23,455,034 8,231,055 40,293,381
Purdue University 21,157,353 2,149,799 37,305,148 27,200,919 87,813,219
Texas A & M University 32,454,096 1,896,943 46,050,585 9,078,326 89,479,950
University of California, Davis 99,023,900 0 109,863,201 5,537,563 214,424,664
University of Illinois, Urbana-Champaign 27,825,482 636,760 58,083,164 11,093,258 97,638,664
University of Tennessee, Knoxville 55,683,254 0 35,973,840 0 91,657,094
Virginia Tech 14,749,634 0 3,147,828 10,250,704 28,148,166
Washington State University 42,910,200 670,459 13,168,143 9,230,647 65,979,449
Source: Common Data Set, 2013-14
State and Institutional Aid Awarded to Undergraduate Students Peer Comparison
$0 $50 $100 $150 $200 $250
Kansas State University
Oklahoma State University
Virginia Tech
Oregon State University
Washington State University
Iowa State University
North Carolina State University
Purdue University
Texas A & M University
University of Tennessee, Knoxville
University of Illinois, Urbana-Champaign
Michigan State University
University of California, Davis
Colorado State University
Millions
Institutional ResearchFACT BOOK 2014-15COSTS AND STUDENT FINANCIAL AID
216

Student Financial Aid
Student Loan Default Rate
Colorado State University 3.9%
Iowa State University 3.8%
Kansas State University 6.4%
Michigan State University 4.7%
North Carolina State University 3.3%
Oklahoma State University 6.9%
Purdue University 4.6%
Texas A & M University 3.3%
University of California, Davis 3.1%
University of Illinois, Urbana-Champaign 3.0%
University of Tennessee, Knoxville 4.1%
Virginia Tech 2.6%
Washington State University 2.7%
Board of Governors’ Peer ComparisonStudent Loan Default Rate - FY 2011
Source: Data were reported in the College Measures Initiative at www.collegemeasures.org. Data for Oregon State University were not available.
0.0% 2.0% 4.0% 6.0% 8.0%
Virginia Tech
Washington State University
University of Illinois, Urbana-Champaign
University of California, Davis
North Carolina State University
Texas A & M University
Iowa State University
University of Tennessee, Knoxville
Purdue University
Michigan State University
Kansas State University
Colorado State University
Institutional ResearchFACT BOOK 2014-15
COSTS AND STUDENT FINANCIAL AID217
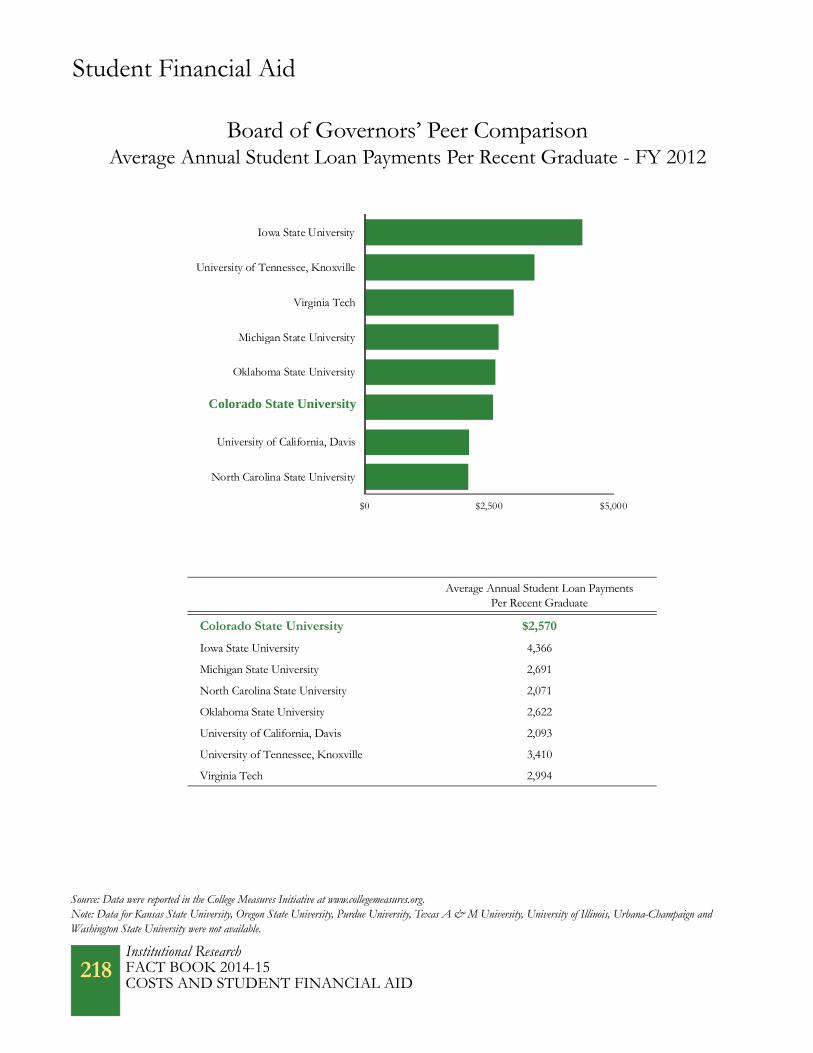
Student Financial Aid
Average Annual Student Loan PaymentsPer Recent Graduate
Colorado State University $2,570
Iowa State University 4,366
Michigan State University 2,691
North Carolina State University 2,071
Oklahoma State University 2,622
University of California, Davis 2,093
University of Tennessee, Knoxville 3,410
Virginia Tech 2,994
Board of Governors’ Peer ComparisonAverage Annual Student Loan Payments Per Recent Graduate - FY 2012
Source: Data were reported in the College Measures Initiative at www.collegemeasures.org.Note: Data for Kansas State University, Oregon State University, Purdue University, Texas A & M University, University of Illinois, Urbana-Champaign and Washington State University were not available.
$0 $2,500 $5,000
North Carolina State University
University of California, Davis
Oklahoma State University
Michigan State University
Virginia Tech
University of Tennessee, Knoxville
Iowa State University
Colorado State University
Institutional ResearchFACT BOOK 2014-15COSTS AND STUDENT FINANCIAL AID
218

Expenditure and Resource Highlights
Total Agricultural Experiment Station revenue for FY 2014: $14.9 million
CSU’s capital construction bond projects since 2008 total $447.4 million.
Total Colorado State University Extension funding for FY 2015: $27.9 million
Total CSU Foundation invested assets for FY 2014: $375.7 million, up 107% from FY 2005
Total library materials expenditures in FY 2013: $7.6 million, up 21% from FY 2007
Total library expenditures in FY 2013: $16.5 million, up 16% from FY 2007
Total library volumes held in FY 2013: 2.9 million, up 45% from FY 2007
CSU ranked 10th of 12 peer institutions in total library volumes held in FY 2013 and 11th of 12 peer institutionsin library expenditures.
Total research awards received in FY 2014: 1,993, up 6% from FY 2005
Total research expenditures for FY 2014: $308.0 million, up 15% from FY 2007
CSU ranked 6th of 14 peer institutions in federal research and development expenditures in FY 2012.
According to the Career Center, 81% of undergraduates secured their future plans by graduation, which is 7% abovethe national average.
Total alumni supporters in FY 2014: 14,806, up 25% from FY 2005
Total alumni support in FY 2014: $21.9 million, up 321% from FY 2005
Total private supporters in FY 2014: 33,716, up 27% from FY 2005
Total private support in FY 2014: $143.2 million, up 144% from FY 2005
Total budgeted revenue (education and general - excludes PVM, CSU agencies, course & technology fees) for FY 2015: $430.4 million
Total budgeted revenue (education and general - includes PVM, CSU agencies, course & technology fees) for FY 2015: $520.7 million
Total budgeted revenue for FY 2015: $1 billion
CSU ranked 14th of 14 peer institutions in the cost per student FTE and 13th of 14 in the cost per degree awarded in FY 2011.
Institutional ResearchFACT BOOK 2014-15
EXPENDITURES AND RESOURCES 219


Agricultural Experiment Station Research Centers
Agricultural Experiment Station
Arkansas Valley Research CenterMike Bartolo, Manager(719) 254-631227901 Road 21Rocky Ford, CO 81067
Eastern Colorado Research CenterDoug Couch, Manager(970) 345-640226206 County Road 57Akron, CO 80720
Southwestern Colorado ResearchCenterAbdel Berrada, Manager(970) 562-425516910 County Road ZP.O. Box 233Yellow Jacket, CO 81335
San Luis Valley Research CenterAndrew Houser, Interim Manager(719) 754-35940249 E. Road 9 NorthCenter, CO 81125
Plainsman Research CenterKevin Larson, Superintendent(719) 324-5643P.O. Box 477Walsh, CO 81090
Western Colorado Research CenterGreg Litus, Manager
Fruita Site(970) 858-36291910 “L” RoadFruita, CO 81521
Orchard Mesa Site(970) 434-32643168 B 5 RoadGrand Junction, CO 81503
ARDEC (Agricultural ResearchDevelopment and Education Center)Jennifer Bornhoft, Manager(970) 491-24054616 NE Frontage RoadFort Collins, CO 80524
Source: Agricultural Experiment Station
Institutional ResearchFACT BOOK 2014-15
EXPENDITURES AND RESOURCES221

Agricultural Experiment Station
History of Revenue
FY 2008 FY 2009 FY 2010 FY 2011 FY 2012 FY 2013 FY 2014FY 2008 to FY 2014 Change
State General Fund $8,512,963 $8,512,715 $8,457,264 $8,059,937 $7,897,943 $7,923,446 $8,077,466 -5%
Federal Appropriations 4,673,407 3,328,311 3,450,550 3,825,399 3,647,067 3,800,115 4,808,435 3%
Cash Sales 1,500,980 1,285,000 1,285,000 1,911,432 1,300,000 1,400,000 2,000,000 33%
Total Revenue 14,687,350 13,126,026 13,192,814 13,796,768 $12,845,010 $13,123,561 14,885,901 1%
Research Distribution Program2014-15
Note: The Research Distribution Program is based on program expenditures in the state general fund, federal appropriations and self-generated cash funds.
Animal Production Systems17%
Food Safety and Nutrition12%
Natural Resources & Environment29%
Plant Production Systems35%
Community Resource Development
7%
Institutional ResearchFACT BOOK 2014-15EXPENDITURES AND RESOURCES
222

Capital Construction
History of Capital Construction and Controlled Maintenance AppropriationsFY 2009Long Bill
FY 2010Long Bill
FY 2011Long Bill
FY 2012Long Bill
FY 2013Long Bill
FY 2014Long Bill
FY 2015Long Bill
Statewide
Capital Construction Fund $180,574,268 $50,659,524 $3,444,661 $48,987,765 $62,108,178 $188,069,493 $364,420,213
Higher Education
Capital Construction Fund $118,520,777 $17,619,428 -$3,080,914 $8,708,997 $20,952,481 $112,542,840 $253,696,974
Colorado State University
Capital Construction Fund $21,156,307 $0 $0 $0 $0 $0 $15,000,000
Controlled Maintenance Projects 424,256 2,505,301 0 0 1,540,225 2,337,905 3,524,645
Colorado State University Total $21,580,563 $2,505,301 $0 $0 $1,540,225 $2,337,905 $18,524,645
Capital Construction and Controlled Maintenance Appropriations
Source: Facilities Management
-$50
$0
$50
$100
$150
$200
$250
$300
$350
$400
FY 2009 FY 2011 FY 2013 FY 2015
Statewide Higher Education Colorado State University
Appropriation Amount (Millions)
Institutional ResearchFACT BOOK 2014-15
EXPENDITURES AND RESOURCES223

Capital Construction
Project Budget
2008 Bond Academic Computing Center $1,998,000
Aspen Hall 22,144,617
Lake Street Parking Garage 21,600,000
Student Recreation Center Expansion 32,122,697
2008 Bond Total $77,865,314
2009 Bond Cooperative Institute for Research in the Atmosphere Addition $1,200,000
2010 Bond Braiden and Parmalee Fourth Floor Additions $26,000,000
Classroom Upgrades - Various Buildings 10,000,000
Engineering II 40,000,000
Lory Student Center Theater Renovation 6,000,000
Morgan Library Expansion 16,400,000
2010 Bond Total $98,400,000
2012 Bond Academic Village North and Durrell Dining Center $57,000,000
Animal Sciences Building 7,500,000
Engineering II 4,000,000
Lory Student Center Revitalization 60,000,000
2012 Bond Total $128,500,000
2013 Bond Eddy Building Revitalization $7,000,000
Aggie Village North 112,265,000
Animal Sciences Building 3,900,000
Eddy Phase 2 Entrance Edition 4,800,000
Engineering II tenant finish 8,500,000
Lory Student Center Seismic Upgrades 5,000,000
2013 Bond Total $141,465,000
Total Capital Construction Bonds $447,430,314
Colorado State University Bond Projects Since 2008
Institutional ResearchFACT BOOK 2014-15EXPENDITURES AND RESOURCES
224

The Career Center
Undergraduate Students with Future Plans Secured at the Time of Graduation
• 81% of 2012-13 undergraduates secured their future plans by December 2013, which is 7% above the national average of 74%. (Source: National Association of Colleges and Employer survey of 881universities)
• 52% of students employed
• 29% attending graduate/professional school or continuing education
• 19% looking for employment
Source: The Career Center
Employed56%
Looking for Employment19%
Attending Graduate/Professional School/Continuing Education - 29%
Institutional ResearchFACT BOOK 2014-15
EXPENDITURES AND RESOURCES225
The Career Center
Student-Employer Engagement
• Twelve unique career fairs were hosted in 2013-14.
• All-Campus Career Fairs in 2013-14 hosted over 3,000 students andalumni and 400 diverse hiring organizations.
• Over 8,500 full-time jobs and internships were posted in 2013-14.
• Over 500 unique hiring organizations came to campus to hire students in 2013-14.
• Approximately 3,000 interviews of students took place in 2013-14.
• The number of internship postings increased 30% in 2012-13.
Institutional ResearchFACT BOOK 2014-15EXPENDITURES AND RESOURCES
226

Colorado State Forest Service
The mission of the Colorado State Forest Service is to achieve stewardship of Colorado’sdiverse forest environments for the benefit of present and future generations.
The Colorado State Forest Service, a service and outreach agency of the Warner College of Natural Resources at ColoradoState University, is one of only five state forestry organizations in the United States that is affiliated with a university. Through its State Office in Fort Collins, Colorado, and its 19 field offices located through the state, the CSFS promotesdiverse, resilient, and sustainable forest environments by:
• Providing professional forestry expertise/technical assistance and implementing forest management to accomplish stewardship objectives
• Reducing hazardous fuels to help mitigate wildfire risk• Increasing awareness about the benefits of forest management that results in informed action and stewardship• Informing, training, and preparing agency personnel and our publics to anticipate and address changing
forest conditions• Effectively responding to emerging forest health issues• Encouraging the continued development and advancement of a sustainable forest products industry
Source: Colorado State Forest Service
Unit: Colorado State Forest Service (CSFS)State Forester/Director: Michael B. Lester
Website: www.csfs.colostate.eduPhone: 970-491-6303
Address: Foothills Campus, 5060 Campus DeliveryFort Collins, Colorado 80523-5060
Colorado State Forest Service District and Field Offices
Institutional ResearchFACT BOOK 2014-15
EXPENDITURES AND RESOURCES227
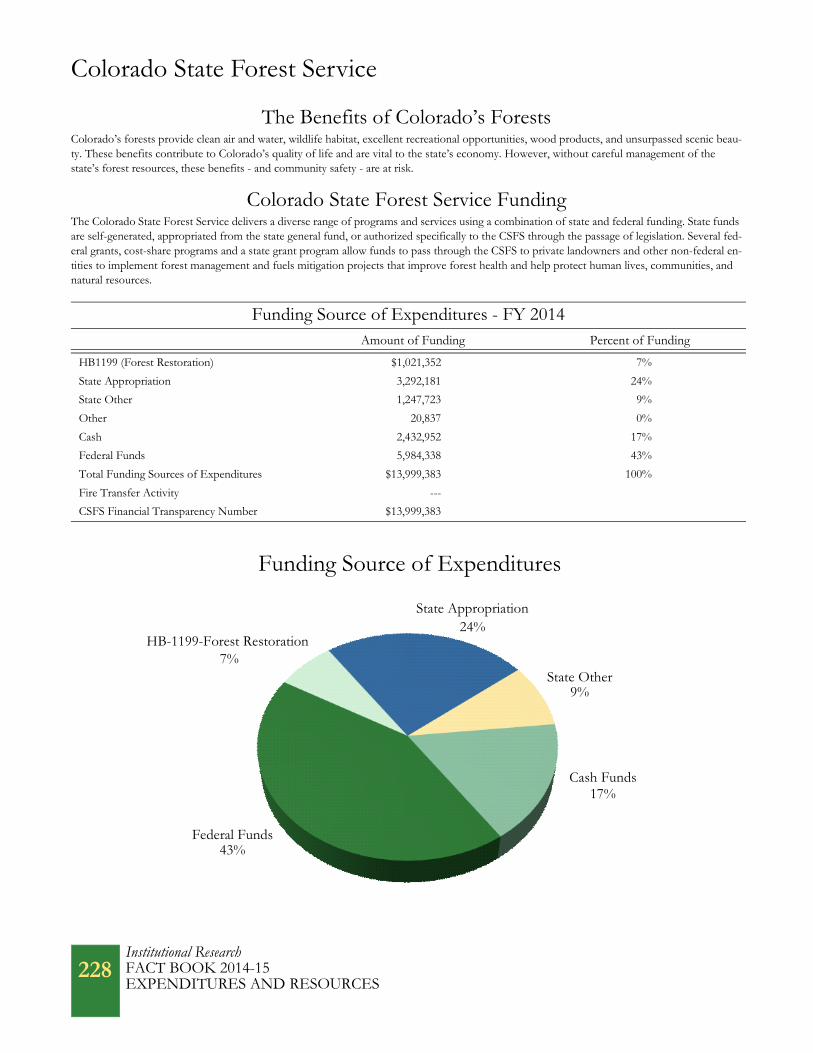
Colorado State Forest Service
The Benefits of Colorado’s ForestsColorado’s forests provide clean air and water, wildlife habitat, excellent recreational opportunities, wood products, and unsurpassed scenic beau-ty. These benefits contribute to Colorado’s quality of life and are vital to the state’s economy. However, without careful management of the state’s forest resources, these benefits - and community safety - are at risk.
Colorado State Forest Service FundingThe Colorado State Forest Service delivers a diverse range of programs and services using a combination of state and federal funding. State funds are self-generated, appropriated from the state general fund, or authorized specifically to the CSFS through the passage of legislation. Several fed-eral grants, cost-share programs and a state grant program allow funds to pass through the CSFS to private landowners and other non-federal en-tities to implement forest management and fuels mitigation projects that improve forest health and help protect human lives, communities, and natural resources.
Funding Source of Expenditures - FY 2014Amount of Funding Percent of Funding
HB1199 (Forest Restoration) $1,021,352 7%
State Appropriation 3,292,181 24%
State Other 1,247,723 9%
Other 20,837 0%
Cash 2,432,952 17%
Federal Funds 5,984,338 43%
Total Funding Sources of Expenditures $13,999,383 100%
Fire Transfer Activity ---
CSFS Financial Transparency Number $13,999,383
Funding Source of Expenditures
Federal Funds43%
HB-1199-Forest Restoration
State Other9%
State Appropriation24%
Cash Funds
7%
17%
Institutional ResearchFACT BOOK 2014-15EXPENDITURES AND RESOURCES
228

Institutional ResearchFACT BOOK 2014-15
EXPENDITURES AND RESOURCES229
Colorado State University Extension
Extension is the major off-campus educational arm of Colorado State University. A partnership of Colorado State University, Colorado counties and the U.S. Department of Agriculture, Extension is the informal, non-credit educational system that links education and research with the needs of Colorado citizens. Extension delivers the resources of the University to the people of the state in 62 of Colorado’s 64 counties.
CSU Extension FTEState and Federal Sponsored County Total
Campus (Administrative Professional) 16.50 5.50 0.00 22.00
Integrated Specialists 25.00 4.00 0.00 29.00
Field (Administrative Professional) 104.50 11.00 55.85 171.35
Paraprofessional 0.00 19.50 0.00 19.50
Support Staff 11.25 2.00 82.50 95.75
Total Staff 157.25 42.00 138.35 337.60
Purpose
Source: CSU Extension

230Institutional ResearchFACT BOOK 2014-15EXPENDITURES AND RESOURCES
Colorado State University Extension
Extension Funding Appropriated Budget
Colorado State University Extension Priority Programs
CSU Extension develops and implements educational programs in areas of high priority to Colorado citizens. For FY 2014, CSU Extension has focused its resources on ten program areas:
• 4-H and Youth Development • Family and Financial Stability
• Community and Economic Development • Food Systems
• Cropping Systems • Livestock and Range
• Energy • Natural Resources
• Environmental Horticulture • Nutrition, Food Safety, and Health
Note: The appropriated budget excludes county and grant funding.
Fiscal Year 2015
Total Funding = $27.9 Million State Appropriated Budget = $8.4 Million
County37%
State30%
Federal14%
Other/ Grants19% Campus Programs
34%
Field Programs66%

Colorado State University Foundation
Fiscal Year Invested Assets (in Millions) Percent Change from Previous Year
2005 $181.4 1%
2006 200.3 10%
2007 241.8 21%
2008 239.8 -1%
2009 211.0 -12%
2010 233.0 10%
2011 296.9 27%
2012 302.2 2%
2013 325.4 8%
2014 375.7 15%
History of Total Invested Assets
Source: CSU Foundation
$0
$100
$200
$300
$400
FY 2005 FY 2008 FY 2011 FY 2014
Millions
Institutional ResearchFACT BOOK 2014-15
EXPENDITURES AND RESOURCES231

Colorado State University FoundationBoard of Governors’ Peer Group Comparison University Endowments
FY 2012 FY 2013 Percent Change
Colorado State University Foundation $225,362,000 $245,887,000 9%
Iowa State University and Foundation 604,897,000 673,515,000 11%
Kansas State University Foundation 329,240,000 364,676,000 11%
Michigan State University 1,407,483,000 1,637,164,000 16%
North Carolina State University and Foundations 635,326,000 769,404,000 21%
Oklahoma State University and Foundation 675,030,000 817,625,000 21%
Oregon State University Foundation 403,606,000 443,826,000 10%
Purdue University 1,916,968,000 2,182,171,000 14%
Texas A & M University System and Foundations 7,638,555,000 8,732,010,000 14%
University of California, Davis Foundation 211,056,000 240,391,000 14%
University of Illinois and Foundation 1,649,346,000 1,925,949,000 17%
University of Tennessee System 826,701,000 919,408,000 11%
Virginia Tech Foundation 594,776,000 660,340,000 11%
Washington State University 737,409,000 777,628,000 5%
Source: The Chronicle of Higher Education, 1/28/14
University Endowments - FY 2013
$0 $2,500 $5,000 $7,500 $10,000
University of California, Davis Foundation
Kansas State University Foundation
Oregon State University Foundation
Virginia Tech Foundation
Iowa State University and Foundation
North Carolina State University Foundations
Washington State University
Oklahoma State University and Foundation
University of Tennessee System
Michigan State University
University of Illinois and Foundation
Purdue University
Texas A & M University System and Foundations
Millions
Colorado State University Foundation
Institutional ResearchFACT BOOK 2014-15EXPENDITURES AND RESOURCES
232

Library Resources
History of Materials Expenditures by Category
FY 2007
FY2008
FY 2009
FY 2010
FY2011
FY2012
FY2013
FY 2007 to FY 2013 Change
Monograph Expenditures $1,380,545 $1,322,568 $1,055,691 $1,068,921 $876,152 $727,330 $734,768 -14%
Print-Serial Expenditures 845,217 419,088 641,447 590,972 506,084 343,607 373,247 -56%
E-Serial Expenditures 3,531,548 4,192,556 4,431,194 4,734,614 5,012,460 5,366,730 5,825,025 65%
Other Expenditures 521,971 611,752 381,057 626,503 373,891 793,564 690,949 32%
Total Materials Expenditures $6,279,281 $6,545,964 $6,509,389 $7,021,010 $6,768,587 $7,231,231 $7,623,989 21%
Source: CSU Libraries
History of Materials Expenditures by Category
$0.0
$5.0
$10.0
FY 2007 FY 2009 FY 2011 FY 2013
Monograph Expenditures Print-Serial Expenditures
E-Serial Expenditures Other Expenditures
Millions
Institutional ResearchFACT BOOK 2014-15
EXPENDITURES AND RESOURCES 233

Library Resources
Fiscal Year Library Volumes Held Library Expenditures
2007 2,066,079 $14,165,408
2008 2,045,603 15,187,932
2009 2,366,608 15,334,082
2010 2,385,266 14,264,719
2011 2,354,738 18,937,624
2012 2,896,131 16,012,746
2013 2,907,025 16,535,128
History of Total Library ExpendituresTotal Library Volumes Held
$0
$5
$10
$15
$20
$25
FY 2007 FY 2009 FY 2011 FY 20130.0
1.0
2.0
3.0
FY 2007 FY 2009 FY 2011 FY 2013
Millions Millions
Institutional ResearchFACT BOOK 2014-15EXPENDITURES AND RESOURCES
234
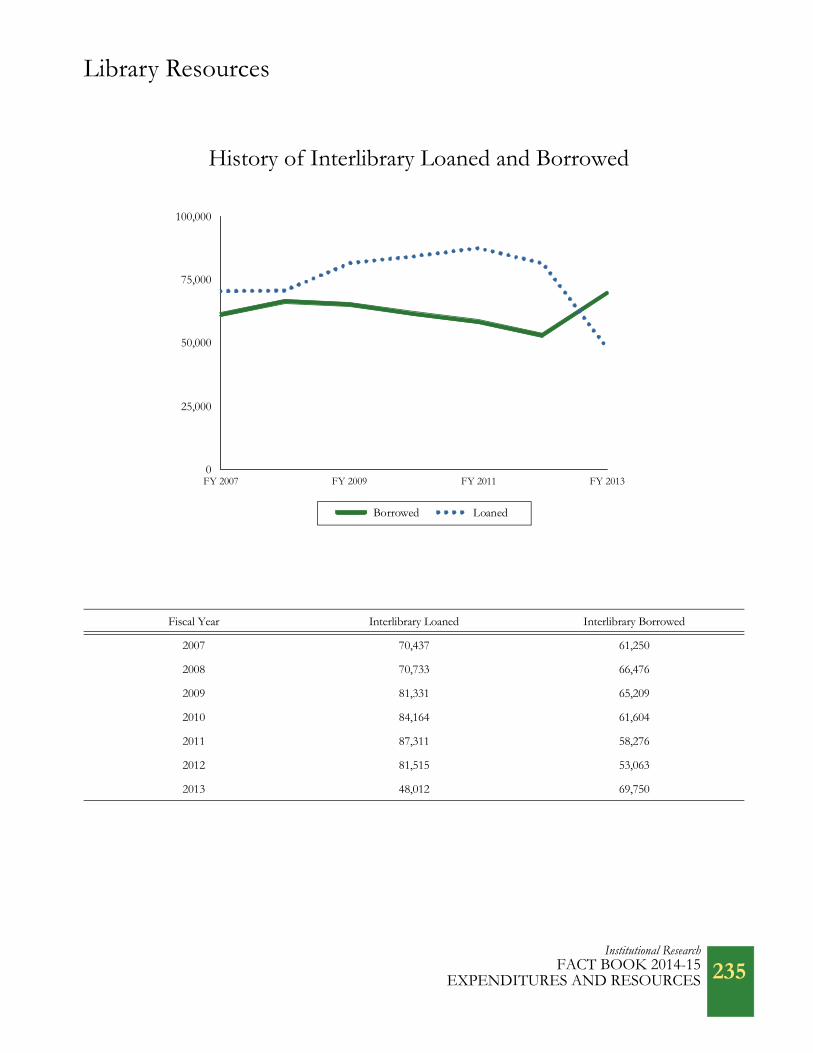
Library Resources
Fiscal Year Interlibrary Loaned Interlibrary Borrowed
2007 70,437 61,250
2008 70,733 66,476
2009 81,331 65,209
2010 84,164 61,604
2011 87,311 58,276
2012 81,515 53,063
2013 48,012 69,750
History of Interlibrary Loaned and Borrowed
0
25,000
50,000
75,000
100,000
FY 2007 FY 2009 FY 2011 FY 2013
Borrowed Loaned
Institutional ResearchFACT BOOK 2014-15
EXPENDITURES AND RESOURCES 235

Library Resources
Board of Governors’ Peer Group ComparisonUniversity Research Libraries - FY 2013
Volumes in Library Total Expenditures
Colorado State University 2,907,025 $16,535,128
Iowa State University 3,017,893 21,888,536
Michigan State University 6,463,589 30,898,942
North Carolina State University 4,858,743 36,764,177
Oklahoma State University 3,970,525 17,701,860
Purdue University 3,635,568 25,537,014
Texas A & M University 4,858,731 40,384,246
University of California, Davis 4,401,308 19,060,268
University of Illinois, Urbana-Champaign 13,810,754 45,342,923
University of Tennessee, Knoxville 3,446,032 26,006,293
Virginia Tech 2,554,204 17,909,100
Washington State University 2,666,360 13,692,351
Peer Comparison
Total Library Volumes Held
Source: Association of Research LibrariesNote: Kansas State University and Oregon State University are not members of the Association of Research Libraries.
Total Library Expenditures
0 3 6 9 12 15
Virginia Tech
Washington State University
Iowa State University
University of Tennessee, Knoxville
Purdue University
Oklahoma State University
University of California, Davis
Texas A & M University
North Carolina State University
Michigan State University
University of Illinois, Urbana-Champaign
$0 $20 $40 $60
Washington State University
Oklahoma State University
Virginia Tech
University of California, Davis
Iowa State University
Purdue University
University of Tennessee, Knoxville
Michigan State University
North Carolina State University
Texas A & M University
University of Illinois, Urbana-Champaign
Colorado State University
Colorado State University
Millions Millions
Institutional ResearchFACT BOOK 2014-15EXPENDITURES AND RESOURCES
236

Research Awards and Proposals
Number of Research Awards Received - FY 2014
Number of ResearchAwards Received
Percent of Research Awards Received
Agricultural Sciences 174 9%
Business 12 1%
Engineering 478 24%
Health & Human Sciences 85 4%
Liberal Arts 51 3%
Natural Sciences 267 13%
Non-College 158 8%
Veterinary Medicine & Biomedical Sciences 330 17%
Warner College of Natural Resources 438 22%
University Total 1,993 100%
Number of Research Awards Received
Source: Vice President for Research
by College
0 200 400 600
Business
Liberal Arts
Health & Human Sciences
Non-College
Agricultural Sciences
Natural Sciences
Veterinary Medicine & Biomedical Sciences
Warner College of Natural Resources
Engineering
Institutional ResearchFACT BOOK 2014-15
EXPENDITURES AND RESOURCES237
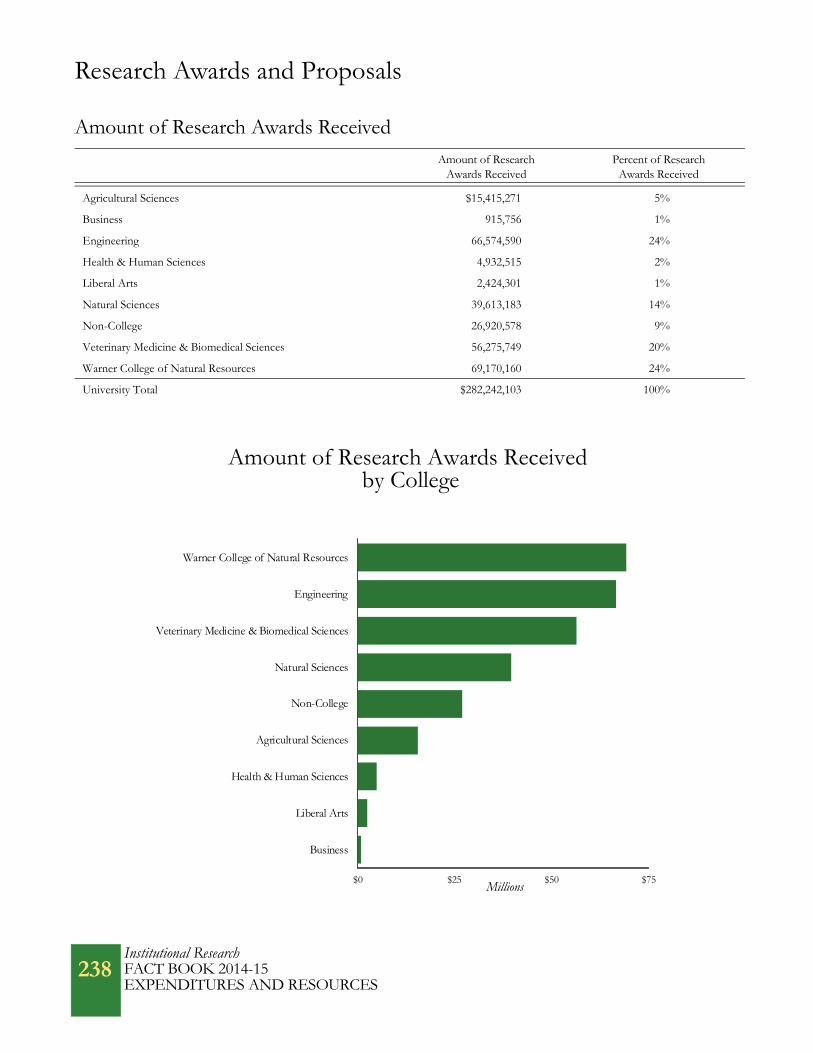
Research Awards and Proposals
Amount of Research Awards Received Amount of Research
Awards ReceivedPercent of Research
Awards Received
Agricultural Sciences $15,415,271 5%
Business 915,756 1%
Engineering 66,574,590 24%
Health & Human Sciences 4,932,515 2%
Liberal Arts 2,424,301 1%
Natural Sciences 39,613,183 14%
Non-College 26,920,578 9%
Veterinary Medicine & Biomedical Sciences 56,275,749 20%
Warner College of Natural Resources 69,170,160 24%
University Total $282,242,103 100%
Amount of Research Awards Received by College
$0 $25 $50 $75
Business
Liberal Arts
Health & Human Sciences
Agricultural Sciences
Non-College
Natural Sciences
Veterinary Medicine & Biomedical Sciences
Engineering
Warner College of Natural Resources
Millions
Institutional ResearchFACT BOOK 2014-15EXPENDITURES AND RESOURCES
238
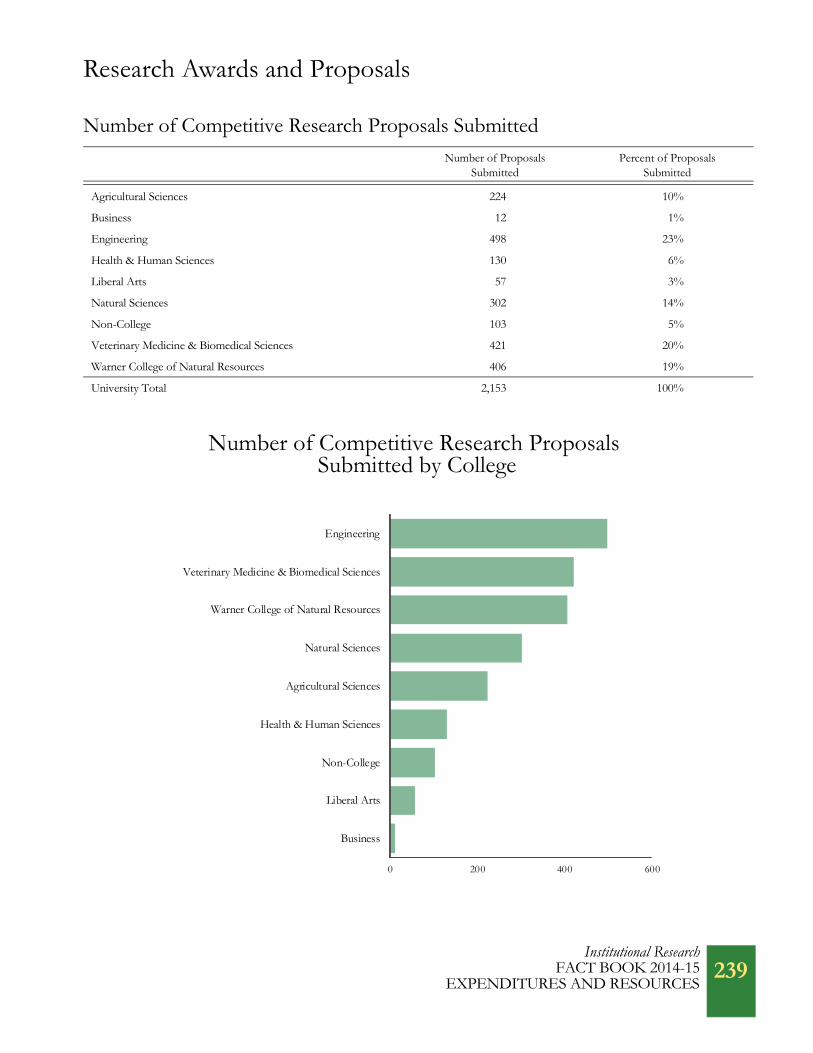
Research Awards and Proposals
Number of Competitive Research Proposals Submitted Number of Proposals
SubmittedPercent of Proposals
Submitted
Agricultural Sciences 224 10%
Business 12 1%
Engineering 498 23%
Health & Human Sciences 130 6%
Liberal Arts 57 3%
Natural Sciences 302 14%
Non-College 103 5%
Veterinary Medicine & Biomedical Sciences 421 20%
Warner College of Natural Resources 406 19%
University Total 2,153 100%
Number of Competitive Research Proposals Submitted by College
0 200 400 600
Business
Liberal Arts
Non-College
Health & Human Sciences
Agricultural Sciences
Natural Sciences
Warner College of Natural Resources
Veterinary Medicine & Biomedical Sciences
Engineering
Institutional ResearchFACT BOOK 2014-15
EXPENDITURES AND RESOURCES239

Research Awards and Proposals
History of the Number of Research Awards Received
FY2005
FY2006
FY2007
FY2008
FY2009
FY2010
FY2011
FY2012
FY2013
FY2014
FY 2005 to FY 2014 Change
Agricultural Sciences 176 166 197 181 190 195 165 171 148 174 -1%
Business 17 14 12 12 18 15 12 16 18 12 -29%
Engineering 371 439 390 405 379 429 407 466 444 478 29%
Health & HumanSciences 57 77 97 72 78 71 91 76 90 85 49%
Liberal Arts 38 31 33 29 50 39 44 50 39 51 34%
Natural Sciences 215 194 202 205 218 261 259 257 260 267 24%
Non-College 209 193 161 124 156 175 180 185 143 158 -24%
Veterinary Med & Biomedical Sciences 306 344 359 362 431 336 367 361 321 330 8%
Warner College of Natural Resources 496 415 486 588 501 511 448 467 440 438 -12%
University Total 1,885 1,873 1,937 1,978 2,021 2,032 1,973 2,049 1,903 1,993 6%
FY 2005 to FY 2014 Percent Change inResearch Awards Received by College
-50%
-25%
0%
25%
50%
75%
AgriculturalSciences
Business Engineering Health &Human Sci
LiberalArts
NaturalSciences
Non-College
Vet Med &Bio Sci
Warner Collof Nat Res
Institutional ResearchFACT BOOK 2014-15EXPENDITURES AND RESOURCES
240

Research Awards and Proposals
History of the Amount of Research Awards ReceivedFY
2009FY
2010FY
2011FY
2012FY
2013FY
2014FY 2009 to FY 2014 Change
Agricultural Sciences $17,833,030 $16,508,736 $12, 784,609 $12,112,817 $11,775,503 $15,415,271 -7%
Business 4,495,635 1,786,359 978,025 1,197,822 1,515,843 915,756 -49%
Engineering 62,763,611 78,745,667 63,227,765 65,543,975 58,386,473 66,574,590 -15%
Health & HumanSciences 16,080,987 9,271,609 10,775,315 6,394,346 7,617,788 4,932,515 -47%
Liberal Arts 1,522,441 2,477,144 1,553,362 2,279,525 1,531,279 2,424,301 -2%
Natural Sciences 25,507,934 38,706,946 32,172,389 34,755,824 37,259,300 39,613,183 2%
Non-College 28,357,508 35,743,371 27,314,888 35,358,172 21,992,069 26,920,578 -25
Veterinary Med &Biomedical Sciences 59,348,204 51,179,352 53,982,290 58,430,726 46,856,993 56,275,749 10%
Warner College of Natural Resources 58,440,108 51,209,641 51,037,203 51,716,463 60,645,583 69,170,160 35%
University Total $274,349,457 $285,628,825 $253,825,846 $267,789,670 $247,580,831 $282,242,103 -1%
FY 2009 to FY 2014 Percent Change in the Amount of Research Awards Received by College
-50%
0%
50%
AgriculturalSciences
Business Engineering Health &Human Sci
LiberalArts
NaturalSciences
Non-College
Vet Med &Bio Sci
Warner Collof Nat Res
Institutional ResearchFACT BOOK 2014-15
EXPENDITURES AND RESOURCES241

Research Awards and Proposals
History of Competitive Research Proposals SubmittedFY
2005FY
2006FY
2007FY
2008FY
2009FY
2010FY
2011FY
2012FY
2013FY
2014FY 2005 to FY 2014 Change
Agricultural Sciences 162 189 221 208 251 227 270 249 250 224 38%
Business 6 9 9 8 15 9 8 16 13 12 100%
Engineering 252 335 326 376 431 479 433 471 499 498 98%
Health & HumanSciences 93 98 79 102 118 114 95 140 144 130 40%
Liberal Arts 33 32 42 50 51 55 57 65 60 57 73%
Natural Sciences 209 207 275 265 327 377 300 330 282 302 44%
Non-College 74 68 86 93 98 111 125 120 115 103 39%
Veterinary Med & Biomedical Sci 305 349 358 425 500 391 426 436 438 421 38%
Warner College of Natural Resources 343 372 401 397 391 382 383 428 402 406 18%
University Total 1,477 1,659 1,797 1,924 2,182 2,145 2,097 2,255 2,203 2,153 46%
FY 2005 to FY 2014 Percent Change in Competitive ResearchProposals Submitted by College
0%
50%
100%
150%
AgriculturalSciences
Business Engineering Health &Human Sci
LiberalArts
NaturalSciences
Non-College
Vet Med &Bio Sci
Warner Collof Nat Res
Institutional ResearchFACT BOOK 2014-15EXPENDITURES AND RESOURCES
242

Research Expenditures
FY 2014 Expenditures (in Millions) Percent of Total Expenditures
Federal Funds
Department of Agriculture (USDA) $31.0 10%
Department of Defense 44.3 14%
Department of Energy 12.7 4%
Health and Human Services 42.5 14%
NASA - National Aero and Space Administration 7.7 3%
National Science Foundation 31.6 10%
Miscellaneous Federal 37.2 12%
Non-Science and Engineering (Federal) 5.1 2%
Total Federal Funds 212.1 69%
Non-Federal Funds
Industrials $23.6 8%
State and Local 13.8 4%
Non-Science and Engineering (Non-Federal) 1.3 < 1%
Foundations 5.6 2%
All Other Non-Federal Sources 8.9 3%
Total Non-Federal Funds 53.2 17%
Total Sponsored Funds $265.3 86%
Local Funds $42.7 14%
Total Funds $308.0 100%
Source: Vice President for ResearchNote: The change in expenditures for FY13 compared to FY12 is due to the transfer of a major segment of the Colorado State Forest Service to the State of Colorado effective 7/1/12. This change is evident in the USDA, Miscellaneous Federal and the State and Local categories. Expenditures for most colleges/units were flat to slightly higher compared to the prior fiscal year.
Total = $308.0 Million
Sources of Research Expenditures - FY 2014
Non-Federal Funds17%
Local Funds14%
Federal Funds69%
Health and Human Services 20%
Department of Agriculture 15%
National Science Foundation 15%
Department of Defense 21%
NASA 4%
Department of Energy 6%
Miscellaneous Federal 17%
Non-Science & Engineering 2%
Institutional ResearchFACT BOOK 2014-15
EXPENDITURES AND RESOURCES243

Research ExpendituresHistory of Research Expenditures (In Millions)
FY 2007
FY 2008
FY 2009
FY2010
FY2011
FY2012
FY2013
FY2014
FY 2007 to FY 2014 Change
Federal Funds
Department of Agriculture (USDA) $55.5 $61.1 $64.7 $53.3 $48.3 $47.2 $31.6 $31.0 -25%
Department of Defense 16.0 15.4 23.1 22.3 29.5 36.3 39.4 44.3 177%
Department of Energy 7.6 8.6 8.0 7.4 9.2 9.5 11.4 12.7 38%
Health & Human Services 67.5 54.2 47.3 50.5 52.9 52.3 50.0 42.5 -20%
Miscellaneous Federal 26.1 27.8 25.4 29.0 43.1 54.9 35.2 37.2 38%
National Science Foundation 26.2 30.0 31.9 31.9 36.7 36.7 37.4 31.6 32%
NASA 11.8 11.8 11.5 11.6 11.1 8.7 8.3 7.7 -34%
Non-Science & Engineering (Federal) 6.4 6.0 5.1 5.7 5.8 6.7 6.5 5.1 -49%
Total Federal Funds 217.1 214.9 217.0 211.7 236.6 252.3 219.8 212.1 10%
Non-Federal Funds
Industrials 14.7 18.1 19.1 17.4 14.7 15.5 19.1 23.6 70%
State and Local 12.3 12.8 18.6 14.6 18.4 46.1 12.3 13.8 -9%
Non-Science & Engineering(Non-Federal) 0.7 1.0 1.2 4.7 4.0 1.7 2.0 1.3 -32%
Foundations 1.4 3.7 4.2 8.6 7.4 5.4 5.9 5.6 273%
All Other Non-Federal Sources 6.7 7.8 8.5 3.8 1.5 7.0 7.6 8.9 82%
Total Non-Federal Funds 35.8 43.4 51.6 49.1 46.0 75.7 46.9 53.2 42%
Total Sponsored Funds 252.9 258.3 268.6 260.8 282.6 328.0 266.7 265.3 5%
Local Funds 43.1 44.3 43.1 42.1 48.2 47.9 46.5 42.7 14%
Total Funds $296.0 $302.6 $311.7 $302.9 $330.8 $375.9 $313.2 $308.0 15%
History of Research Expenditures
Note: The change in expenditures for FY13 compared to FY12 is due to the transfer of a major segment of the Colorado State Forest Service to the State of Colorado effective 7/1/12. This change is evident in the USDA, Miscellaneous Federal and the State and Local categories. Expenditures for most colleges/units were flat to slightly higher compared to the prior fiscal year.
$0
$100
$200
$300
$400
$500
FY2007
FY2009
FY2012
FY2014
Federal Funds Non-Federal Funds Local Funds
Millions
Institutional ResearchFACT BOOK 2014-15EXPENDITURES AND RESOURCES
244

Research Expenditures
History of Research Expenditures by College
FY 2010 FY 2011 FY 2012 FY 2013 FY 2014FY 2010 to FY 2014 Change
Agricultural Sciences $13,282,762 $13,754,050 $13,095,281 $13,831,079 $11,775,614 -11.3%
Business 4,214,609 1,321,033 1,600,542 1,480,805 1,310,321 -68.9%
Engineering 57,640,408 62,160,762 63,915,079 63,491,306 60,500,167 5.0%
Health & Human Sciences 9,796,763 9,566,357 9,700,817 7,141,502 7,060,139 -27.9%
Liberal Arts 1,687,976 1,898,468 1,927,546 2,081,446 1,626,014 -3.7%
Natural Sciences 28,167,309 31,131,052 32,773,041 36,295,681 34,639,658 23.0%
Veterinary Medicine &Biomedical Sciences 57,132,847 54,156,980 54,786,886 51,144,349 49,848,922 -12.7%
Warner College of Natural Resources 48,516,544 49,358,971 50,321,679 53,202,947 59,685,413 23.0%
Total Expenditures $220,439,218 $223,347,673 $228,120,871 $228,669,115 $226,446,248 2.7%
FY 2010 to FY 2014 Percent Change inResearch Expenditures by College
-75%
-50%
-25%
0%
25%
50%
AgriculturalSciences
Business Engineering Health &Human Sci
LiberalArts
NaturalSciences
Vet Med &Bio Sci
Warner Collof Nat Res
Institutional ResearchFACT BOOK 2014-15
EXPENDITURES AND RESOURCES245

Research Expenditures
Board of Governors’ Peer Group ComparisonFederal Research and Development Expenditures
FY 2012 2007 Rank 2012 RankFive-Year Change
in Rank
Colorado State University $252,286,000 48 53 -5
Iowa State University 118,242,000 100 96 4
Kansas State University 77,689,000 142 132 10
Michigan State University 268,952,000 56 50 6
North Carolina State University 174,758,000 73 70 3
Oklahoma State University 85,876,000 157 123 34
Oregon State University 156,446,000 89 78 11
Purdue University 270,655,000 60 47 13
Texas A & M University 269,460,000 43 49 -6
University of California, Davis 358,577,000 35 29 6
University of Illinois, Urbana-Champaign 359,989,000 38 27 11
University of Tennessee, Knoxville 112,471,000 76 102 -26
Virginia Tech 184,175,000 74 69 5
Washington State University 129,255,000 114 88 26
Source: National Science Foundation Survey of Research and Development Expenditures - Rankings by Federal R and D Expenditures FY 2011 represents the latest available NSF data.
Peer ComparisonFederal Research and Development Expenditures
$0 $100 $200 $300 $400
Kansas State University
Oklahoma State University
University of Tennessee, Knoxville
Iowa State University
Washington State University
Oregon State University
North Carolina State University
Virginia Tech
Michigan State University
Texas A & M University
Purdue University
University of California, Davis
University of Illinois, Urbana-Champaign
Colorado State University
Millions
Institutional ResearchFACT BOOK 2014-15EXPENDITURES AND RESOURCES
246

University Advancement
University Net Private Support
FY2005
FY2006
FY2007
FY2008
FY2009
FY2010
FY2011
FY2012
FY2013
FY2014
FY 2005 to FY 2014 Change
Number of Alumni Supporters 11,803 12,638 13,515 12,461 10,424 10,793 11,157 13,256 15,190 14,806 25%
Alumni Support(in Millions) $5.2 $46.9 $4.0 $10.9 $3.7 $7.8 $11.5 $7.9 $19.1 $21.9 321%
Number of Total Supporters 26,650 28,489 28,916 27,104 24,885 28,686 27,677 31,690 33,614 33,716 27%
Total Support(in Millions) $58.6 $94.9 $52.6 $79.5 $54.5 $58.0 $85.1 $111.6 $112.5 $143.2 144%
Private Support HistorySupporter History
Source: University AdvancementNote: As of 2003-04, private support includes outright gifts, pledge payments, unpaid commitments and private grants, contracts and cooperative agreements, but does not include payments made to pledges from prior years. As of 2004-05, revocable commitments are also included. As of 2007-08, any overpaid portion toward a pledge from a prior year is included. The count of alumni supporters and the total for alumni support does not include non-graduates or alumni support made through estates, family foundations or corporate support provided on behalf of alumni. However, this support is included in the total numbers.
0
10,000
20,000
30,000
40,000
FY 2005 FY 2008 FY 2011 FY 2014
Alumni Supporters All Supporters
$0
$25
$50
$75
$100
$125
$150
FY 2005 FY 2008 FY 2011 FY 2014
Alumni Support Total Support
Millions
Institutional ResearchFACT BOOK 2014-15
EXPENDITURES AND RESOURCES 247

University Advancement
1870 Club($1,870 within calendar
or fiscal year)
Frontier Society(Pursuing or have given
a planned gift)
Morgan Society(Lifetime support of
$100K-$999K)
Lory Society(Lifetime support of
$1M plus)
Fiscal Year 2005 1,730 207 638 102
Fiscal Year 2006 1,782 215 704 107
Fiscal Year 2007 1,753 225 744 116
Fiscal Year 2008 1,871 270 821 134
Fiscal Year 2009 1,731 290 886 138
Fiscal Year 2010 1,841 320 918 142
Calendar Year 2010 1,767 512 932 145
Calendar Year 2011 1,864 566 988 158
Calendar Year 2012 1,957 670 1,054 169
Calendar Year 2013 2,405 813 1,141 185
President’s Council Members
Note: In FY 14 the giving clubs were restructured due to the retirement of the President’s Council. An alternative view was created that focuses on the lifetime giving societies while retaining the history for the 1870club. Beginning in 2010, the annual gift club structure changed from the fiscal year to a calendar year measurement. This was accomplished by using an 18-month transition window. For the initial year, members may overlap between the old structure (FY2010) and the new (CY2010).
0
2,500
FY 2005 FY 2008 FY 2011 CY 2013
1870 Club Frontier Society Morgan Society Lory Society
Institutional ResearchFACT BOOK 2014-15EXPENDITURES AND RESOURCES
248

University Revenue and Expenditures
Source: Office of BudgetsNote: COF = College Opportunity Fund
Total E & G Budget = $430,351,869
Revenue
Total E & G Budget = $430,351,869
Expenditures
FY 2015 Education & General Budget (13 and 16 Funds Only)Excludes PVM, CSU Agencies, Course & Technology Fees
Tuition67%
State Financial Aid (COF)9%
State Fee for Service 7%
Interest Income < 1%
Indirect Cost Recoveries10%
Miscellaneous Revenue 3%
Internal Overhead Allocations 4%
Operating Costs, Materials& Supplies 21%
Salaries & Benefits20%
Administrative Professional
Graduate Student Salaries &
Salaries & Benefits 1%All Temporary
Capital Outlay <1% Benefits 3%
Academic Faculty
30%
State Classified
10%Salaries & Benefits
Travel < 1%
Salaries & Benefits
Utilities 4%
Student Hourly & WorkstudySalaries & Benefits < 1%
Institutional Scholarships 11%
Institutional ResearchFACT BOOK 2014-15
EXPENDITURES AND RESOURCES249

University Revenue and Expenditures
FY 2015 Education & General BudgetIncludes PVM, CSU Agencies, Course & Technology Fees
Revenue
Total E & G Budget = $520,654,058
Tuition60%
State Financial Aid (COF) 7%
State Fee for Service14%
Interest Income < 1%
Course & Technology Fees 1%
Self-Funded &
Federal Grants & Appropriations 2%
Other State &
Indirect Cost Recovery9%
Cash Operations 6%
Restricted Funds <1%
Miscellaneous Revenues 3%
Institutional ResearchFACT BOOK 2014-15EXPENDITURES AND RESOURCES
250

University Revenue and Expenditures
FY 2015 Education & General BudgetIncludes PVM, CSU Agencies, Course & Technology Fees
Expenditures
Total E & G Budget = $520,654,058
Administrative ProfessionalSalaries & Benefits 21%
Graduate Student Salaries &Benefits 3%
Institutional Scholarships 9%
Capital Outlay < 1%
All Temporary Salaries & Benefits 1%
Student Hourly & WorkstudySalaries & Benefits 1%
Academic Faculty Salaries &Benefits 29%
State Classified Salaries& Benefits 10%
Operating Costs, Materials & Supplies23%
Utilities 3%
Travel 1%
Institutional ResearchFACT BOOK 2014-15
EXPENDITURES AND RESOURCES251

University Revenue and Expenditures
GeneralFund
Total Revenue Budget = $1,002,927,086
FY 2015 Total Budgeted Revenue
Tuition and Fees32%
Sponsored Programs25%
State Support11%
Auxiliary Enterprises14%
Indirect Cost Recoveries4%
Federal & Restricted Funds1%
Self-Funded Activities9%
Miscellaneous Revenue & Cash Operations
4%
Institutional ResearchFACT BOOK 2014-15EXPENDITURES AND RESOURCES
252

University Revenue and Expenditures
FY 2015 Total Budgeted Expenditures
Total Expenditure Budget = $1,002,927,086
& Fringe Benefits40%
Travel 1%
Support Salaries
12%
Faculty and Professional Salaries
Debt Service & Facilities Reserves
3%
Overhead Allocations 5%
& Fringe Benefits
Operating Expenses33%
Cost of Sales 3%
Capital Outlay 1%
Utilities 2%
Institutional ResearchFACT BOOK 2014-15
EXPENDITURES AND RESOURCES253

University Revenue and Expenditures
History of RevenueFY
2008FY
2009FY
2010FY
2011FY
2012FY
2013FY
2014FY 2008 -FY 2014 Change
General Fund/State Support $80,102,874 $89,844,969 $89,733,229 $78,735,593 $52,799,061 $49,564,170 $52,947,939 -34%
Tuition 155,487,902 173,850,471 187,586,687 208,158,924 241,832,981 263,016,955 $289,321,337 86%
Total $235,590,776 $263,695,440 $277,319,916 $286,894,517 $294,632,042 $312,581,125 $342,269,276 45%
Tuition and General Fund/State Support Revenue
Note: For FY07 and future years, State Support includes College Opportunity Fund and Fee-for-Service appropriations. For FY09-FY11, State Support also includes State Fiscal Stabilization Funds (ARRA).
$0
$100
$200
$300
$400
FY2005
FY2008
FY2011
FY2014
Tuition General Fund/State Support
Millions
Institutional ResearchFACT BOOK 2014-15EXPENDITURES AND RESOURCES
254

University Revenue and Expenditures
History of Revenue per Student FTEFY
2007FY
2008FY
2009FY
2010FY
2011FY
2012FY
2013FY
2014FY 2007 to FY 2014 Change
Student FTE 21,359 21,413 21,574 22,026 22,771 23,012 23,121 23,197 9%
General Fund/State Support/ FTE $3,454 $4,489 $4,165 $4,074 $3,458 $2,294 $2,144 $2,283 -34%
Tuition/FTE $6,260 $7,260 $8,058 $8,517 $9,142 $10,509 $11,376 $12,472 99%
History of Revenue per Student FTE
$0
$3,000
$6,000
$9,000
$12,000
FY2005
FY2008
FY2011
FY2014
General Fund/State Support per FTE Tuition per FTE
Institutional ResearchFACT BOOK 2014-15
EXPENDITURES AND RESOURCES255

University Revenue and Expenditures
History of Financial EnvironmentFY 2006 FY 2007 FY 2008 FY 2009 FY 2010 FY 2011 FY 2012 FY 2013 FY 2014
State Support - State General Fund 5.70% 15.82% 8.56% 12.16% -0.12% -12.26% -32.94% -6.13% 6.83%
Resident Undergraduate Tuition Rates 15.00% 2.50% 5.00% 9.00% 9.00% 9.00% 20.00% 9.00% 9.00%
Faculty Salary Average Increase 4.30% 3.00% 5.00% 5.00% 0.00% 0.00% 0.00% 3.00% 3.00%
Denver-Boulder CPI Change 0.10% 2.10% 3.60% 2.20% 3.90% -0.60% 1.90% 3.70% 1.90%
Annual Change in Financial Environment
Note: The Denver-Boulder CPI is used by the Joint Budget Committee for the annual appropriations process (March Forecast). Excludes PVM and the CSU agencies.
Annual Percent Change
-50%
-25%
0%
25%
FY 2005 FY 2007 FY 2009 FY 2011 FY 2013
Resident Undergraduate Tuition Rate Denver-Boulder CPI State Support - State General Fund Faculty Salary Average Increase
Institutional ResearchFACT BOOK 2014-15EXPENDITURES AND RESOURCES
256

University Revenue and Expenditures
Higher Education’s Share of the Statewide General Fund
Fiscal YearHigher Education
(in Millions)Total State General Fund
(in Millions)Percent Share
2005 588.0 5,840.9 10.1%
2006 636.5 6,291.3 10.1%
2007 694.1 6,818.6 10.2%
2008 747.7 7,258.8 10.3%
2009 662.0 7,520.9 8.8%
2010 428.8 6,659.3 6.4%
2011 705.1 6,849.8 10.3%
2012 623.9 7,059.2 8.8%
2013 628.6 7,590.6 8.3%
2014 659.1 8,348.4 7.9%
History of Higher Education’s Share of Statewide General Fund
Note: Includes Resident Instruction, PVM, and the CSU agencies. For FY06 and future years, State Support includes College Opportunity Fund and Fee-for-Service appropriations. For FY 2009-FY2011, State Support also includes State Fiscal Stabilization Funds (ARRA).
0%
5%
10%
15%
FY2005
FY2008
FY2011
FY2014
Institutional ResearchFACT BOOK 2014-15
EXPENDITURES AND RESOURCES257

University Revenue and Expenditures
Fiscal YearTotal Current Fund
Expenditures (In Millions)CSU Institutional SupportExpenditures (In Millions)
Institutional Support as aPercent of Total Expenditures
2005 579.9 18.5 3.2%
2006 622.8 21.1 3.4%
2007 662.8 22.2 3.3%
2008 737.6 30.7 4.2%
2009 782.4 34.7 4.4%
2010 777.3 40.3 5.2%
2011 811.2 37.9 4.7%
2012 892.8 40.4 4.5%
2013 871.1 45.6 5.2%
CSU Institutional Support Expenditures as a Percentof Total Expenditures
Source: IPEDS Finance Report
0%
2%
4%
6%
8%
FY2005
FY2007
FY2009
FY2011
FY2013
Institutional ResearchFACT BOOK 2014-15EXPENDITURES AND RESOURCES
258

University Revenue and Expenditures
Comparison of General Fund Appropriations(Includes Resident Instruction, PVM, and the CSU Agencies)
Change in General Fund/State Support Appropriations
CSU StateSupport
Percent of Total
State General
Fund
Percent of Total Higher
Education State Support
Dollar Change in CSU State Support
Percent Change in CSU State Support
Total State of Colorado
General FundBudget
Total State Support
Appropriated to Higher
Education
Higher EducationPercent ofTotal State
General Fund
FY02 Actual $119,175,674 2.1% 15.5% $479,709 0.40% $5,613,095,990 $770,615,074 13.7%
FY03 Actual 110,312,260 2.0% 16.1% -8,863,414 -7.40% 5,544,343,746 685,529,236 12.4%
FY04 Actual 94,930,319 1.7% 16.1% -15,381,941 -13.9% 5,635,747,579 591,409,402 10.5%
FY05 Actual 94,885,277 1.1% 16.1% -45,042 -0.05% 5,840,888,476 587,972,772 10.1%
FY06 Actual 97,289,326 1.5% 15.3% 2,404,049 2.50% 6,291,272,501 636,485,608 10.1%
FY07 Actual 108,809,757 1.6% 15.7% 11,520,431 11.80% 6,818,634,838 694,142,988 10.2%
FY08 Actual 118,237,135 1.6% 15.8% 9,427,378 8.70% 7,258,816,455 747,717,300 10.3%
FY09 Actual 129,909,785 1.7% 19.6% 11,672,650 9.90% 7,520,881,000 661,973,800 8.8%
FY10 Actual 128,768,240 1.9% 30.0% -1,141,545 -0.9% 6,659,257,846 428,761,033 6.4%
FY11 Actual 116,297,447 1.7% 16.5% -12,470,793 -9.7% 6,849,850,513 705,108,145 10.3%
FY12 Actual 93,647,621 1.3% 15.0% -22,649,826 -19.5% 7,059,292,871 623,962,700 8.8%
FY13 Actual 91,424,169 1.2% 14.5% -2,223,452 -2.4% 7,590,614,383 628,569,790 8.3%
FY14 Actual 97,077,228 1.2% 14.7% 5,656,827 6.2% 8,348,395,679 659,108,061 8.1%
FY15 Appropriated 107,877,228 1.2% 14.2% 10,796,232 11.1% 8,916,045,149 761,983,052 8.55%
FY 2009 FY 2015 Percent Change
CSU State Support $129,909,785 $107,877,228 -17%
Higher Education State Support 661,973,800 761,983,052 15%
State of Colorado General Fund 7,520,881,000 8,916,045,149 19%
Note: Includes Resident Instruction, PVM, and the CSU agencies. For FY06 and future years, State Support includes College Opportunity Fund and Fee-for-Service appropriations. For FY09-FY11, State Support also includes State Fiscal Stabilization Funds (ARRA).
Institutional ResearchFACT BOOK 2014-15
EXPENDITURES AND RESOURCES259

University Revenue and Expenditures
Board of Governors’ Peer ComparisonInstitutional Support Expenditures as a Percent of Total Expenditures - FY 2013
InstitutionalSupport
TotalExpenditures
Institutional Support Expenditures as a Percent of Total Expenditures
Colorado State University $45,598,710 $871,096,227 5.2%
Iowa State University 55,200,898 1,051,387,385 5.3%
Kansas State University 41,770,739 727,324,545 5.7%
Michigan State University 128,101,713 2,060,044,287 6.2%
North Carolina State University 89,484,210 1,294,690,483 6.9%
Oklahoma State University 24,523,596 798,058,012 3.1%
Oregon State University 63,995,307 878,282,974 7.3%
Purdue University 131,845,996 1,618,365,345 8.1%
Texas A & M University 79,789,783 2,147,278,307 3.7%
University of California, Davis 127,016,000 3,576,494,000 3.6%
University of Illinois, Urbana-Champaign 65,491,438 2,379,757,073 2.8%
University of Tennessee, Knoxville 118,504,033 1,642,770,493 7.2%
Virginia Tech 59,189,699 1,174,902,617 5.0%
Washington State University 83,793,837 937,714,294 8.9%
Peer Average $82,208,250 $1,560,543,832 5.3%
Institutional Support Expenditures as a Percentof Total Expenditures
Source: IPEDS Finance Report
0% 3% 6% 9% 12%
University of Illinois, Urbana-Champaign
Oklahoma State University
University of California, Davis
Texas A & M University
Virginia Tech
Iowa State University
Kansas State University
Michigan State University
North Carolina State University
University of Tennessee, Knoxville
Oregon State University
Purdue University
Washington State University
Colorado State University
Institutional ResearchFACT BOOK 2014-15EXPENDITURES AND RESOURCES
260

University Revenue and Expenditures
Cost Per Student FTE
Colorado State University $11,812
Iowa State University 13,932
Kansas State University 15,305
Michigan State University 17,706
North Carolina State University 16,688
Oklahoma State University 12,236
Oregon State University 13,291
Purdue University 20,499
Texas A & M University 15,583
University of California, Davis 30,893
University of Illinois, Urbana-Champaign 19,955
University of Tennessee, Knoxville 27,037
Virginia Tech 12,926
Washington State University 13,505
Source: IPEDS data as reported in the College Measures Initiative at www.collegemeasures.org.
Board of Governors’ Peer Group ComparisonCost Per Student FTE - FY 2012
$0 $10,000 $20,000 $30,000 $40,000
Oklahoma State University
Virginia Tech
Oregon State University
Washington State University
Iowa State University
Kansas State University
Texas A & M University
North Carolina State University
Michigan State University
University of Illinois, Urbana-Champaign
Purdue University
University of Tennessee, Knoxville
University of California, Davis
Colorado State University
Institutional ResearchFACT BOOK 2014-15
EXPENDITURES AND RESOURCES261

University Revenue and Expenditures
Cost Per Degree
Colorado State University $47,385
Iowa State University 60,512
Kansas State University 67,682
Michigan State University 69,364
North Carolina State University 59,320
Oklahoma State University 47,762
Oregon State University 58,030
Purdue University 77,774
Texas A & M University 60,681
University of California, Davis 109,499
University of Illinois, Urbana-Champaign 68,917
University of Tennessee, Knoxville 100,583
Virginia Tech 46,707
Washington State University 51,508
Board of Governors’ Peer Group ComparisonCost Per Degree - FY 2012
Source: IPEDS data as reported in the College Measures Initiative at www.collegemeasures.org.The cost per degree is calculated by dividing the Total Education and Related Costs by the number of degrees granted.
$0 $50,000 $100,000 $150,000
Virginia Tech
Oklahoma State University
Washington State University
Oregon State University
Iowa State University
Texas A & M University
Kansas State University
University of Illinois, Urbana-Champaign
North Carolina State University
Michigan State University
Purdue University
University of Tennessee, Knoxville
University of California, Davis
Colorado State University
Institutional ResearchFACT BOOK 2014-15EXPENDITURES AND RESOURCES
262