1444 ieee transactions on microwave theory and …
TRANSCRIPT
1444 IEEE TRANSACTIONS ON MICROWAVE THEORY AND TECHNIQUES, VOL. 60, NO. 5, MAY 2012
A Self-Sustained Microwave System forDielectric-Constant Measurement
of Lossy Organic LiquidsVikram Sekar, Member, IEEE, William J. Torke, Student Member, IEEE,Samuel Palermo, Member, IEEE, and Kamran Entesari, Member, IEEE
Abstract—In this paper, dielectric constants of lossy organicliquids are measured using oscillation frequency shifts of a neg-ative-resistance voltage-controlled oscillator (VCO). The designand working principle of the oscillator and the effect of materialloss are presented in detail. The proposed method provides rela-tively large frequency shifts of 10–110 MHz for lossy test samplevolumes of 50–200 L whose dielectric constants are between 2–13at 4.5 GHz, thereby allowing good resolution in dielectric-constantmeasurement. To make the system self-sustained, the VCO is usedas part of a frequency synthesizer system for frequency-to-voltageconversion and digital extraction of the frequency shift using aunique detection algorithm. The dielectric constant of severalorganic liquids have been extracted to an accuracy better than 2%using sample volumes of 50–200 L, and has excellent agreementwith reported values. The applicability of this system for sensingdielectric mixtures has also been shown, and volume fractionestimation has been demonstrated to an accuracy of around 1%.
Index Terms—Dielectric-constant measurement, dielectricmixture, frequency synthesizer, negative resistance oscillator,split-ring resonator (SRR).
I. INTRODUCTION
T HE development of highly accurate systems for detec-tion of dielectric constant of a material has numerous ap-
plications in agriculture, industry, and medicine. Estimation ofmoisture content in grain and timber are of vital importancein industry [1], [2]. In medicine, biological tissues have beencharacterized using microwave permittivity measurements [3].Measurement of dielectric properties of chemicals, polymers,and gels provide important information regarding their chem-ical composition and structure [4].
Manuscript received July 12, 2011; revised December 23, 2011; accepted De-cember 28, 2011. Date of publication February 22, 2012; date of current versionApril 27, 2012.V. Sekar was with the Department of Electrical and Computer Engi-
neering, Texas A&M University, College Station, TX 77843-1372 USA. Heis now with Peregrine Semiconductor, San Diego, CA 92121 USA (e-mail:[email protected]).W. J. Torke was with the Department of Electrical and Computer Engi-
neering, Texas A&M University, College Station, TX 77843-1372 USA. Heis now with National Instruments, Austin, TX 78759-3563 USA (e-mail:[email protected]).S. Palermo and K. Entesari are with the Department of Electrical and Com-
puter Engineering, Texas A&M University, College Station, TX 77843-1372USA (e-mail: [email protected]; [email protected]).Color versions of one or more of the figures in this paper are available online
at http://ieeexplore.ieee.org.Digital Object Identifier 10.1109/TMTT.2012.2187066
Microwave techniques employing waveguide resonators arebased on resonant frequency and -factor changes due to fieldperturbations induced by the material-under-test (MUT), andthey are capable of accurate permittivity measurements at asingle frequency or discrete set of frequencies [5]. Such sensorsare often bulky and expensive when low-cost in situ materialmeasurements need to be performed. In comparison, sub-strate-integrated-waveguide resonators and planar microstripresonators provide a low-cost compact alternative for permit-tivity measurement, although with lower sensitivities [6], [7].However, these approaches are based on measuring relativechanges in the maximum or minimum values of the -param-eter magnitude response ( or ) in the presence of theMUT. For a MUT with high loss, severe degradation of theresonator factor makes the peak or notch in the -parameterresponse completely disappear, thereby making it impossible toextract the permittivity of the MUT. To detect high-loss mate-rials using this technique, the sample volume of the lossy MUTis greatly reduced to lower resonator loading and maintain arelatively high resonator factor. As a result, the resonantfrequency shifts caused by the MUT significantly reduce,making it hard to estimate the dielectric constant accurately.For portable applications, the need for laboratory equipment
must be eliminated. Several approaches have been demonstratedto make the permittivity measurement system completely self-sustained. In [8], frequency sweep generators and power de-tectors are used to digitally obtain the shift in responseof a planar resonator, and obtain the properties of the MUTthrough Lorentzian fitting. In [9], a phase-locked loop (PLL) isemployed where the reflected and transmitted signals throughthe resonator are used for permittivity measurements. Here, thesystem operates by adjusting the frequency of the voltage-con-trolled oscillator (VCO) to match the resonant frequency of thesensor until no energy is reflected from the sensor. Both thesesystems rely on the peak or notch in the magnitude -parameterresponse of the resonator, making it unsuitable for the measure-ment of high-loss MUTs.In this paper, a self-sustained approach is presented to accu-
rately measure dielectric constant using a negative-resistanceVCO embedded in a frequency synthesizer system. Section IIdiscusses the proposed technique, which relies on the changein phase response of a planar sensor present in the gate net-work of a VCO and the corresponding change in oscillation fre-quency for detection of dielectric constant. The dependence ofthe system on phase response allows the use of lossy test sample
0018-9480/$31.00 © 2012 IEEE

SEKAR et al.: SELF-SUSTAINED MICROWAVE SYSTEM FOR DIELECTRIC-CONSTANT MEASUREMENT OF LOSSY ORGANIC LIQUIDS 1445
Fig. 1. Simplified schematic of the negative resistance oscillator used for per-mittivity measurement.
volumes up to 200 L, while maintaining stable oscillations.This provides large frequency shifts and enables improved reso-lution for dielectric-constant measurement. By employing a fre-quency synthesizer system detailed in Section III, the oscillationfrequency shift is converted to a voltage shift. Using a micro-controller unit (MCU) with an integrated analog-to-digital con-verter (ADC), the voltage shift is used to digitally obtain thechange in oscillation frequency through a unique detection al-gorithm. Section IV reports measured chemical calibration anddetection results, and since measurement of dielectric constantalone is enough to distinguish and quantify mixtures [6], the ap-plication of this system is also demonstrated to detect the com-position of a mixture of organic liquids. Finally, Section V con-cludes this paper.
II. OSCILLATORS FOR DIELECTRIC-CONSTANT MEASUREMENT
A. Oscillator Design
Fig. 1 shows the schematic of a negative resistance oscillatoremploying a source series feedback capacitance ( ) to gen-erate negative resistance. The gate network has a transmissionline with characteristic impedance and electricallength in series with a voltage-controlled varactorand a sensing element with complex impedance . When aMUT with complex frequency-dependent relative permittivity
is applied to the sensor, its impedancechanges as . Here, and depict the di-electric constant and loss of the MUT, respectively. In general,the oscillation frequency depends on the variable loads in thegate network, which, in this case, are and ,respectively. The purpose of the varactor is to negate anychanges in oscillation frequency caused by the MUT. Theoscillating signal is available at the output of the drain network,which has two transmission lines of arbitrary electrical length(with characteristic impedance ) with a dc blockingcapacitor between them.1) Source Network: To design an oscillator with an output
frequency of , the value of must be adjusted so that thetransistor provides a negative resistance looking into the gate,implying . To determine the value of , the-parameters of a properly biased transistor, terminated by50- loads at the gate and drain [see Fig. 2(a)] are simulated in
Fig. 2. (a) Simulation setup for the determination of (dc biasing not shown).(b) Variation of magnitude of reflection coefficients at gate and drain with .(c) Phase variation of gate reflection coefficient with frequency.
Agilent ADS1 using the nonlinear model of the transistor. Theactive device is an Avago Technologies’ ATF-36077 pseudo-morphic high electron-mobility transistor (pHEMT) biased at adrain–source voltage ( ) of 1.5 V and gate–source voltage( ) of 0.2 V with a drain current ( ) of 10 mA.Fig. 2(b) shows the variation of and atGHz when different values of are connected to the source
terminal of the transistor. To measure high-loss MUTs, the neg-ative resistance generated must be maximum to ensure stableoscillations. Thus, the value of must be chosen so that themagnitude of reflection coefficients at the gate and drain aremaximized. Choosing pF results in and
. Fig. 2(c) shows the variation of with fre-quency for pF. For stable oscillations at a frequency, the gate network must be designed to meet the following
conditions [10]:
(1)
(2)
Since the overall network looking into the gate is capacitive, thegate network should be made inductive to satisfy the oscillationcondition given by (2).2) Gate Network: The sensing element is a split-ring res-
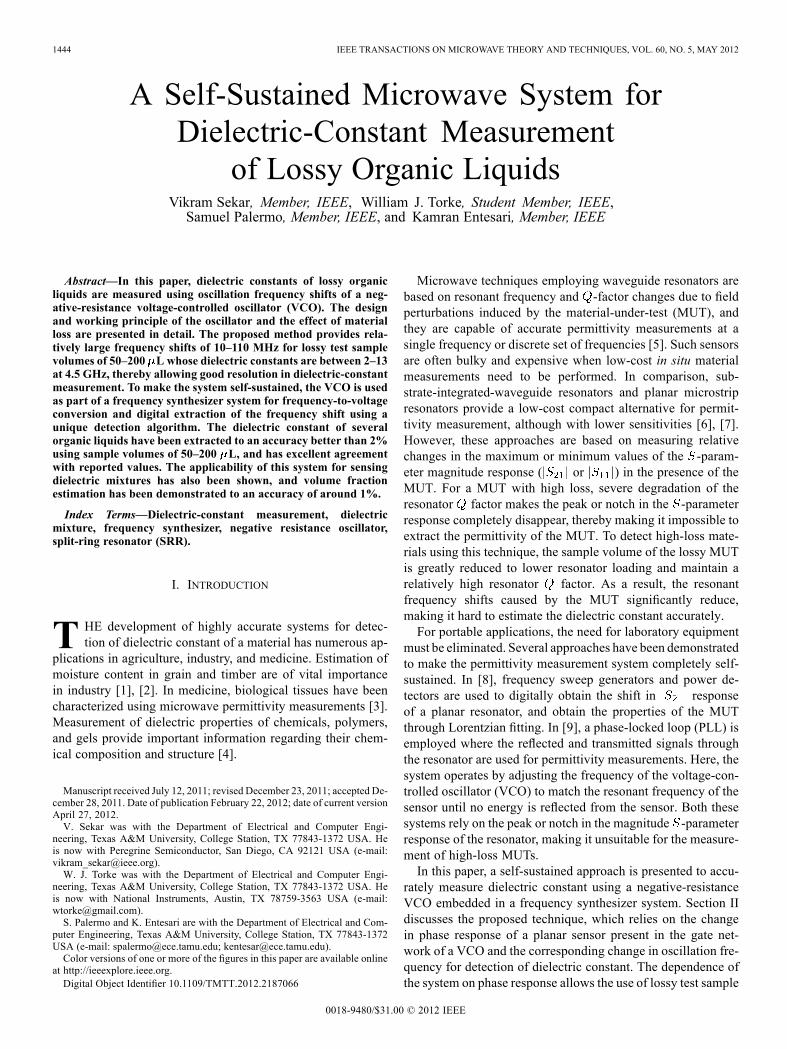
onator (SRR) coupled to a microstrip line, as shown in Fig. 3(a).
1Agilent Technologies’ Advanced Design System (ADS), Palo Alto, CA,2006.
1446 IEEE TRANSACTIONS ON MICROWAVE THEORY AND TECHNIQUES, VOL. 60, NO. 5, MAY 2012
Fig. 3. (a) 3-D view of the sensing element. (b) Dimensions of the SRR.
The high confinement of electric fields at the open ends and be-tween the rings of the SRR makes it highly sensitive to per-mittivity changes in the dielectric layer above it [11]. The SRRis covered by a 100- m-thick sheet of polyethylene terapha-late (PET) with and to prevent thesensor metallization from degrading when the MUT is applied.In order to contain the MUT, a sample well is constructed usinga 5-mm-long polypropylene tube ( ) with a wall thick-ness of 1 mm and inner diameter of 8 mm.The dimensions of the SRR are shown in Fig. 3(b) and are
chosen such that the SRR has an arbitrary resonant frequencythat is above the desired oscillation frequency. This makes theSRR appear inductive at the oscillation frequency, as requiredby the gate network [12]. As a result, any phenomena inducedby the MUT at frequencies close to the resonant frequency ofthe SRR do not affect the performance of the sensing oscillator.The sensing element is simulated using Ansoft HFSS2 to findthe value of at GHz when the MUT is absent. Onaccount of the SRR-to-microstrip coupling and the 13-mm-longtransmission line with an 80- characteristic impedance, thesensing element appears capacitive with an impedance
.The varactor in Fig. 1 is a silicon-hyperabrupt tuning varactor
from Aeroflex/Metelics (MHV500) that provides a capacitanceof V pF. Neglecting varactor para-sitics for simplicity, the equivalent input impedance of the gatenetwork when V is given by
(3)
2Ansoft High Frequency Structure Simulator (HFSS) v11, Ansys Inc.,Canonsburg, PA, 2010.
Fig. 4. Magnitude and phase variation of reflection coefficient of the gate net-work as a function of the electrical length of the gate transmission line.
and the complex gate reflection coefficient is given by
(4)
For an oscillation frequency of GHz in the ab-sence of a MUT when V, the electrical length ofthe transmission line in the gate network should be chosen sothat (1) and (2) are satisfied. Assuming a sensor impedance of
, and can be calculated using (3) and(4). Fig. 4 shows the variation of for different values of .Choosing results in at 4.5 GHz.The simulated values of are close to unity, and hence, sat-isfy the condition in (1). The oscillator design is now complete.The response of the oscillator to MUT dielectric constant andeffect of MUT loss is described below.
B. Response to Material Dielectric Constant
To examine the effect of material dielectric constant ( ) onthe oscillator, the impedance of the sensing element, ,is simulated in HFSSwith lossless isotropicMUTs of various di-electric constants present in the sample well. It is assumed thatthe dielectric constant is frequency independent and the samplewell is completely filled with the MUT, to a height of 5 mmabove the SRR. From the simulated values of , thephase variation of the gate reflection coefficient [
] is calculated using (3) and (4) for each , as shown inFig. 5(a). Negated phase variation of the reflection coefficientlooking into the gate of the transistor [ from Fig. 2(c)]is also superimposed. The points of intersection between thesecurves are the frequencies at which the oscillation conditiongiven by (2) is satisfied and determine the oscillation frequen-cies for each value of . The relative percentage change ofthe oscillation frequency as a function of MUT dielectric con-stant is shown in Fig. 5(b). The effective capacitance ( ) of thesensing element extracted from is also shown and hashigher values as of the MUT increases. Thus, determiningthe change in oscillation frequency is an effective means to es-timate the dielectric constant of the MUT.For losslessMUTs ( ), the real part of sensor impedanceremains unchanged with a value of 1.2 , which is mostly
attributed to metallic losses in microstrip traces and dielectriclosses in the Duroid substrate, polyethylene sample well, andPET sheet. Hence, the oscillation condition given by (1) is metfor all values of since , as shown in Fig. 4, en-suring sustained oscillations at frequencies that only depend onthe MUT dielectric constant.

SEKAR et al.: SELF-SUSTAINED MICROWAVE SYSTEM FOR DIELECTRIC-CONSTANT MEASUREMENT OF LOSSY ORGANIC LIQUIDS 1447
Fig. 5. Simulated: (a) phase of reflection coefficient of the gate network causedby the presence of MUTs. (b) Change in oscillation frequency and effectivesensor capacitance versus dielectric constant.
C. Effect of Material Loss
When aMUTwith loss ( ) is present above the SRR, thesensing element is equivalently represented by a lossy capacitorwhose admittance is given by
(5)
where is a conductance that depends only on the of theMUT. Fig. 6(a) shows the relatively linear increase of withat GHz, obtained from full-wave simulation of
the sensing element in HFSS in the presence of lossy materials.Here, is assumed to be frequency independent and the lossymaterial is assumed to fill the sample well to a height of 5 mm.Simulations also verify that the extracted conductance valuesare independent of and remain almost constant in a narrowbandwidth ( 20 ) of frequencies around . The oscillationfrequencies calculated from (2) also show that they are indepen-dent of material loss. This is because the shift in oscillation fre-quency relies only on the phase change induced by the change insensing capacitance since and affect the real and imaginaryparts of the sensing admittance, respectively, and measurementof is completely independent of . However, the conduc-tance may impose restrictions on the capability for sustainedoscillations.To ensure sustained oscillations in the presence of a lossy
material, the oscillation condition in (1) must be satisfied forall values of and . Fig. 6(b) and (c) shows the simulatedproduct of and as a function of for different valuesof for constant oscillation frequency and constant varactorvoltage cases, respectively. It is important to maintain sustainedoscillations for both these cases to ensure proper operation of thedetection algorithm, as explained in Section III. In the constantfrequency case, the varactor voltage is adjusted to maintaina constant oscillation frequency of 4.5 GHz for each value of
Fig. 6. Simulated: (a) real part of sensor admittance when lossy isotropicMUTswith and various -values are placed in the sample well. Oscillationcondition in (1) as a function of for the case of (b) constant oscillation fre-quency and (c) constant varactor voltage.
. In the constant voltage case, the varactor voltage is constant( V) and the oscillation condition is calculated at thefrequency of oscillation corresponding to the value of [seeFig. 5(c)].When , the oscillator enters a stable mode
of operation and cannot maintain sustained oscillations. Thus,for a given , there is a maximum limit on the range of be-yond which the oscillator does not oscillate. Fig. 6(b) shows thatstable oscillations are supported for a wide range of valuesfor high . For low values, the oscillator enters the stable re-gion, thereby limiting the range of that can be detected. Thisrestriction occurs only when the low materials have loss tan-gents ( ) in the range of 2.5–3, which is a very highvalue for most organic liquids in the gigahertz range [13]. Ma-terial loss does not restrict oscillations for the constant voltagecase, as shown in Fig. 6(c). Hence, this oscillator guaranteessustained oscillations for a wide range of practical materials thatneed to be tested.

1448 IEEE TRANSACTIONS ON MICROWAVE THEORY AND TECHNIQUES, VOL. 60, NO. 5, MAY 2012
Fig. 7. (a) Detailed layout of the negative resistance VCO for dielectric-con-stant measurement. Measured frequency response is also shown. (b) FabricatedVCO prototype. (c) Measured VCO tuning characteristic.
D. Implementation
Fig. 7(a) shows the detailed layout of the VCO on a0.787-mm-thick RT/Duroid 5880 substrate ( ,
). The source capacitor ( pF) isimplemented using an 80- short stub with an electrical lengthof 302 , and is meandered to minimize its area. The microstripline of the sensing element is bent into an L-shape to minimizearea, and the parasitics associated with the bend are included infull-wave simulation. The polypropylene sample well is gluedonto the protective PET sheet, which is then centered over theSRR and firmly attached to the VCO board. Care must be takento reduce the air gap between the SRR and PET sheet since itcan decrease the sensitivity of the VCO to the MUT.The equivalent models of the varactor (Aeroflex/Metelics
MHV500),3 dc blocking and RF-bypass capacitors, biasingresistors4 and nonlinear model of the pHEMT transistor (AvagoTechnologies’ ATF36077) are used in VCO co-simulationusing Agilent ADS and Momentum. DC block and RF bypasscapacitors are AVX Accu-P 10-pF capacitors (0402 size)while biasing resistors are Vishay thick-film resistors (0402size) with values of 150 and 10 k . RF chokes (RFCs) areimplemented using fan-stubs connected to quarter-wavelength
3Aeroflex/Metelics MHV500 silicon hyperabrupt tuning varactor datasheet.[Online.] Available: www.aeroflex.com4Modelithics Inc., passive component (CLR) library, Tampa, FL, 2011.
high-impedance transmission lines. The overall length ofthe transmission lines in the gate network are adjusted usingfull-wave simulations to meet the oscillation conditions at4.5 GHz, as described in Section II-A.Fig. 7(b) shows the fabricated VCO prototype. The measured
oscillation spectrum in the absence of MUT has a center fre-quency of GHz and output power of dBmwhen V. Fig. 7(c) shows the tuning characteristic of theVCO with varactor voltage , which exhibits a tuning slope of
MHz V and a total tuning range of 300 MHz. De-tailed measurements of the VCO response to organic liquids arereported in [12]. To make the system self-sustained, the VCO isembedded in a frequency synthesizer system to convert oscilla-tion frequency shifts to voltages, and is described below.
III. FREQUENCY SYNTHESIZER SYSTEM
A. Functionality
A functional block diagram of the frequency-shift measure-ment system is shown in Fig. 8 [20]. The system consists of aPLL-based frequency synthesizer core along with ADC and anMCU. The ADC is used to digitally sample the loop filter outputor equivalently the control voltage to the oscillator . The pur-pose of the MCU is to administer the frequency-shift measure-ment process and to provide a digital communication interfacebetween the measurement system and a PC. The VCO blockwithin the PLL is the planar microwave VCO with SRR-basedsensing element described in Section II. The purpose of the fre-quency synthesizer system is to calculate the shift in oscillationfrequency exhibited by the VCO due to the dielectric constant( ) of the MUT.The sequence of steps involved in frequency-shift measure-
ment is graphically illustrated in Fig. 9(a) and is tabulated inFig. 9(b). The measurement process consists of three phases.1) Initialization: The programmable frequency divider is ini-
tially set to a value so that the frequency synthesizer islocked to a frequency GHz with no MUT applied.The MCU digitally records the control voltage level at this time,which is denoted by .2) Detection: A known volume of theMUT is dispensed into
the sample well of the VCO. Although the oscillation frequencyof the VCO initially decreases, the PLL returns to the lockedstate and maintains the output frequency at by increasing thecontrol voltage to the oscillator from to . The voltageis then digitally sampled and stored in theMCU. From Fig. 6(b),oscillation is guaranteed for the constant frequency transitionbetween phases 1 and 2 for most practical materials.3) Calculation: Using a binary search algorithm, the MCU
digitally alters the frequency division value from to sothat the oscillator control voltage returns from a value to itsapproximately original value, , limited by the quantizationerror of the frequency divider. As a result, the output frequencyof the synthesizer system changes from to . The oscilla-tion frequency shift caused by the MUT is then computedas . From Fig. 6(c), oscil-lation is guaranteed for the constant voltage transition betweenphases 1 and 3. Since oscillation is guaranteed at phases 2 and 3,stable oscillations are obtained at all voltages (and frequencies)

SEKAR et al.: SELF-SUSTAINED MICROWAVE SYSTEM FOR DIELECTRIC-CONSTANT MEASUREMENT OF LOSSY ORGANIC LIQUIDS 1449
Fig. 8. Block diagram of the frequency-shift measurement system used for dielectric-constant measurement.
Fig. 9. (a) Graphical illustration and (b) detailed description of the frequency-shift measurement procedure.
between and (and between and ) for the transitionbetween phases 2 and 3.
B. System Implementation
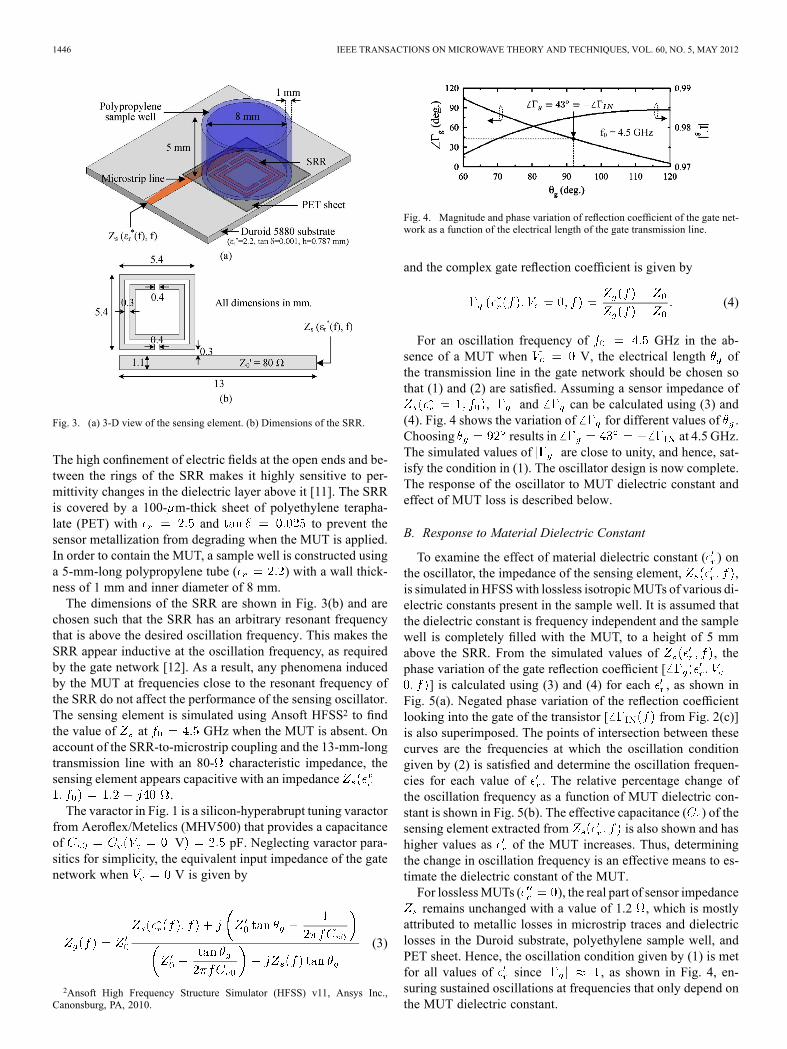
The measurement system pictured in Fig. 10 is realized as adiscrete electronic system constructed on two separate printedcircuit board (PCB) assemblies, i.e.: 1) the “VCO Board” con-tains the negative resistance oscillator with planar microwaveSRR sensor, as described in Section II and 2) all remainingsystem components occupy a second PCB of 62-mil-thick FR4substrate, referred to as the “PLL Board.” A block level dia-gram of the PLL Board is shown in Fig. 11. The RF outputof the VCO Board is fed to a fractional- frequency synthe-sizer integrated circuit (IC) [14], which provides 25-bit resolu-tion fractional- division. This extremely high resolution of theloop division factor allows for precise frequency-shift measure-ments by minimizing the quantization error that occurs whenthe control voltage is returned to the original level measuredbefore MUT introduction. In addition to the programmable fre-quency divider, the frequency synthesizer IC also contains thephase-frequency detector (PFD) and charge pump blocks. Thecharge pump output is fed to a passive loop filter comprised ofdiscrete and components. The output from this loop filter
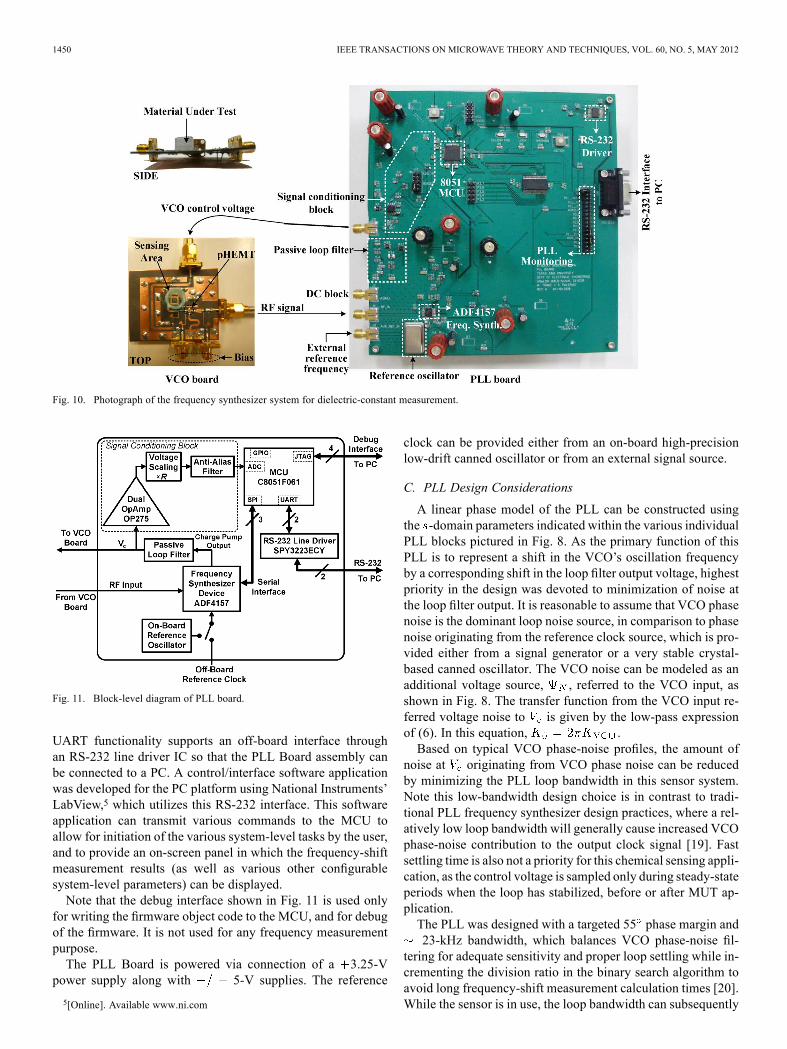
is , which is fed back to the VCO Board assembly, therebycompleting the frequency synthesizer loop.Fig. 11 shows that the loop filter output voltage is also
connected to the input of a unity gain buffer comprised ofa dual low-noise op-amp IC to allow for digital sampling of. This buffer provides a replica of the while presenting
minimal loading to the actual loop filter output. The bufferedversion of is then passed through a simple resistive dividerwith a ratio of to scale the 5-V dynamic range ofthe loop filter output to within the 3.25-V maximum dynamicrange of the ADC input. Before being presented to the ADCinput, this buffered and scaled version of is passed through asingle-pole Butterworth antialiasing filter. The ADC samplingfrequency was set to the highest possible value (250 kHz), theprimary constraint being the MIPs bandwidth required by theMCU firmware to process and then store each successive ADCsample. The 3-dB cutoff frequency of the antialiasing filterwas therefore set to the Nyquist frequency of 125 kHz.The 16-bit ADC is an integrated peripheral within the MCU
device [15]. Firmware was developed for this MCU to ad-minister various system-level tasks, including configuration ofthe frequency synthesizer device (via three-wire serial inter-face), the frequency measurement process, as well as universalasynchronous receiver/transmitter (UART) functionality. The
1450 IEEE TRANSACTIONS ON MICROWAVE THEORY AND TECHNIQUES, VOL. 60, NO. 5, MAY 2012
Fig. 10. Photograph of the frequency synthesizer system for dielectric-constant measurement.
Fig. 11. Block-level diagram of PLL board.
UART functionality supports an off-board interface throughan RS-232 line driver IC so that the PLL Board assembly canbe connected to a PC. A control/interface software applicationwas developed for the PC platform using National Instruments’LabView,5 which utilizes this RS-232 interface. This softwareapplication can transmit various commands to the MCU toallow for initiation of the various system-level tasks by the user,and to provide an on-screen panel in which the frequency-shiftmeasurement results (as well as various other configurablesystem-level parameters) can be displayed.Note that the debug interface shown in Fig. 11 is used only
for writing the firmware object code to the MCU, and for debugof the firmware. It is not used for any frequency measurementpurpose.The PLL Board is powered via connection of a 3.25-V
power supply along with 5-V supplies. The reference
5[Online]. Available www.ni.com
clock can be provided either from an on-board high-precisionlow-drift canned oscillator or from an external signal source.
C. PLL Design Considerations
A linear phase model of the PLL can be constructed usingthe -domain parameters indicated within the various individualPLL blocks pictured in Fig. 8. As the primary function of thisPLL is to represent a shift in the VCO’s oscillation frequencyby a corresponding shift in the loop filter output voltage, highestpriority in the design was devoted to minimization of noise atthe loop filter output. It is reasonable to assume that VCO phasenoise is the dominant loop noise source, in comparison to phasenoise originating from the reference clock source, which is pro-vided either from a signal generator or a very stable crystal-based canned oscillator. The VCO noise can be modeled as anadditional voltage source, , referred to the VCO input, asshown in Fig. 8. The transfer function from the VCO input re-ferred voltage noise to is given by the low-pass expressionof (6). In this equation, .Based on typical VCO phase-noise profiles, the amount of
noise at originating from VCO phase noise can be reducedby minimizing the PLL loop bandwidth in this sensor system.Note this low-bandwidth design choice is in contrast to tradi-tional PLL frequency synthesizer design practices, where a rel-atively low loop bandwidth will generally cause increased VCOphase-noise contribution to the output clock signal [19]. Fastsettling time is also not a priority for this chemical sensing appli-cation, as the control voltage is sampled only during steady-stateperiods when the loop has stabilized, before or after MUT ap-plication.The PLL was designed with a targeted 55 phase margin and23-kHz bandwidth, which balances VCO phase-noise fil-
tering for adequate sensitivity and proper loop settling while in-crementing the division ratio in the binary search algorithm toavoid long frequency-shift measurement calculation times [20].While the sensor is in use, the loop bandwidth can subsequently

SEKAR et al.: SELF-SUSTAINED MICROWAVE SYSTEM FOR DIELECTRIC-CONSTANT MEASUREMENT OF LOSSY ORGANIC LIQUIDS 1451
TABLE IPLL DESIGN PARAMETERS
Fig. 12. Bode plot of VCO phase noise to transfer function.
be lowered even further with relative ease by decreasing thecharge pump current setting of the PLL device.Since the PLL device is configured to achieve the frac-
tional- division by means of a second-order sigma–deltainterpolator, a third-order loop filter was implemented to assistin the noise shaping of the sigma–delta spectrum [14]. Thecritical loop parameters are provided in Table I.A bode plot of the transfer function from the input VCO noise
source to is shown in Fig. 12, when the final PLLparameter and component values are applied to (6) at the bottomof this page. It can be seen that the transfer function has a low-pass characteristic, and the bandwidth is close to the targetedloop bandwidth.Fig. 13 shows the measured transient behavior of in
response to a 0.295-GHz step in frequency. The settling time
Fig. 13. Measured transient response of control voltage for frequency step re-sponse from 4.480 to 4.775 GHz.
closely matches the simulated settling time of 395 s. Thepictured frequency step nearly spans the entire PLL lock range.
IV. MEASUREMENTS
A. Procedure
First, the MCU is initialized by the PC through theRS-232 serial interface and Labview VI. The MCUfirmware then initializes the ADF4157 frequency synthe-sizer chip by programming the frequency divider value to
GHz MHz so thatan output frequency of is obtained when the PLL is in thelocked state. When the loop is locked, the output of the loopfilter has a voltage V, which is digitized by the ADC,averaged 2 times by the MCU and stored in memory.Second, a known sample volume of organic liquid to be an-
alyzed is dispensed into the sample well of the VCO using aFinnpipette II single-channel pipetter6 with adjustable volumesbetween 10–100 L (accuracy 99 ). To maintain lockedstate at a frequency , the loop filter output voltage changesfrom to , which is then digitally averaged 2 times bythe MCU and stored in memory.Finally, when the calculation phase is initiated, the MCU in-
creases the divider value to a value so that the average loopfilter output returns from to , and calculates the fre-quency shift . The result is conveyed tothe PC and displayed on the monitor. The sample well is thendried completely using a cotton swab to remove excess materialand a fan to accelerate evaporation before the next test.
B. Volume Sensitivity
To characterize the frequency shift provided by the system asa function of sample volume ( ), volumes from 10 to 200 L of
6[Online.] Available: http://www.thermoscientific.com
(6)

1452 IEEE TRANSACTIONS ON MICROWAVE THEORY AND TECHNIQUES, VOL. 60, NO. 5, MAY 2012
Fig. 14. (a) Measured frequency shift and (b) standard deviation of frequencyshift, as a function of sample volume.
various MUTs are dispensed into the sample well and frequencyshifts are measured. For each sample volume of each MUT, fivefrequency measurements are taken and average frequency shiftsare computed as shown in Fig. 14(a). The error bars are alsoindicated.For any MUT, the average frequency shift increases with
sample volume up to a certain value, and remains relatively con-stant thereafter. At low sample volumes ( 50 L), a consid-erable part of the SRR fringing field extends above the MUT.Hence, frequency shift increases with sample volume due togreater interaction of the sensor electromagnetic field with theMUT. When the fringing field of the SRR is completely occu-pied by the MUT at large sample volumes, frequency shift be-comes a weak function of sample volume.Fig. 14(b) shows the standard deviation of frequency mea-
surements over five trials for each MUT. For low sample vol-umes ( 35 L), the standard deviation of frequency shift ishigher due to insufficient coverage of the sensor electromagneticfield by the MUT, and errors in the sample volume dispensed.For larger sample volumes ( 35 L), the standard deviationof frequency shift is 1 MHz due to complete coverage of thesensor field by the MUT and relative insensitivity of frequencyshift to sample volumes.
C. Chemical Calibration and Detection
To calibrate the system for dielectric-constant measurement,ethanol and methanol are used as reference materials since
Fig. 15. Curve-fit calibration curves for various sample volumes.
their properties are well known over frequency and temperature[16]. The calibration process imposes a reference for systemresponse due to interaction between the inhomogeneous dielec-tric medium and the electromagnetic field of the SRR. Usingthe frequency shifts in the presence of air ( , ),ethanol ( @ 4.5 GHz and 20 C), and methanol( @ 4.5 GHz and 20 C), a curve-fit equationrelating frequency shift ( ) to is obtained for a particularsample volume, . The general representation of this curve-fitequation is a second-order polynomial expressed as
(7)
where , , and are coefficients that depend onthe sample volume under test. Fig. 15 shows the curve-fit poly-nomials for sample volumes from 10 to 200 L obtained fromaverage frequency shift values of ethanol and methanol. Themean values of calibration coefficients and their measurementuncertainties for the various sample volumes are shown inTable II. Calibration coefficients are calculated by curve-fittingfive polynomial curves corresponding to five frequency-shiftmeasurements obtained for both ethanol and methanol, respec-tively. Uncertainty values represent the maximum deviationof calibration coefficients from their respective mean values.For low sample volumes (e.g., 10 L), the uncertainty in thecalibration coefficients can be as high as 10 due to insuf-ficient sensor coverage by the calibration material. However,for sample volumes 35 L, the uncertainties in coefficientvalues are 1.5 and are relatively independent of samplevolume thereafter.To calculate the dielectric constant based on the fre-
quency-shift measurement obtained from a known samplevolume of MUT, the positive roots of the polynomial in (7) arecalculated using the calibration coefficients in Table II. Fig. 16shows the extracted dielectric constants of 2-butyl alcohol,xylene, ethyl acetate, and ethylene glycol for sample volumesbetween 10–200 L using the frequency shifts in Fig. 14(a) andthe mean values of calibration coefficients. Since the uncer-tainties in calibration coefficients are very small especially forlarger sample volumes, their exclusion does not significantlyaffect detection results.

SEKAR et al.: SELF-SUSTAINED MICROWAVE SYSTEM FOR DIELECTRIC-CONSTANT MEASUREMENT OF LOSSY ORGANIC LIQUIDS 1453
TABLE IICHEMICAL CALIBRATION COEFFICIENTS
Fig. 16. Measured dielectric-constant values of test materials at 4.5 GHz, as afunction of sample volume.
The extracted values are compared to the theoretical valuesobtained from the single relaxation time-constant Cole–Colemodel, which is expressed as [17]
(8)
where is the relaxation time, is a fitting parameter, andand are the values of permittivity at angular frequencies
and , respectively. Table III shows the Cole–Cole-model parameters at 20 C for the organic liquids tested in thiswork [13].From Fig. 16, it is seen that insufficient sensor coverage re-
sults in inaccurate measurements for sample volumes L,while the extracted -value is relatively constant forsample volumes L. Table IV shows the compar-ison between measured dielectric constants of test materials forsample volumes between 50–200 L, and the theoretical valuefrom the Cole–Cole equation at 4.5 GHz. The results are in ex-cellent agreement and are independent of the -values of these
TABLE IIICOLE–COLE-MODEL PARAMETERS FOR ORGANIC LIQUIDS AT 20 C [13]
Fig. 17. Frequency-shift measurements for ethanol–methanol mixtures.
materials which lie approximately between 0.1 (Xylene) and 13(Methanol) at 4.5 GHz [13], thus proving the applicability ofthis system for dielectric-constant measurement of lossy liquidmaterials. The measured mean -values are within 4 of thetheoretical values with a maximum measurement uncertainityof 2 . Some amount of measurement uncertainty can beattributed to frequency dependence of dielectric constant ofthe MUT whose impact can be estimated using (8). As themeasurement frequency varies from 4.5 to 4.4 GHz, there isa maximum increase of only 2% in for the materials listedin Table III. As a result, the assumption of frequency indepen-dence used in the simulation methodology in Section II.B isreasonably justified.Compared to the free-running oscillator approach demon-
strated in [12] where the measured -value differs from thetheoretical value by over 10%, the proposed method in thiswork allows increased accuracy of chemical calibration anddetection due to use of higher sample volumes and accurateestimation of frequency shift due to digital averaging of loopfilter output using the frequency synthesizer system.
D. Applicability to Dielectric Mixtures
Next, the ability of the system to distinguish between mix-tures of two organic liquids is demonstrated. For this purpose,ethanol–methanol mixtures of various volume fractions wereprepared by pipetting proportional volumes of liquids that needto be mixed into a test-tube and shaking them thoroughly toensure a homogeneous solution. The frequency shift for eachvolume fraction of each mixture was measured five times for asample volume of 100 L, averaged and plotted versus volumefraction, as shown in Fig. 17. Here, a volume fraction of ofone liquid implies that there is of the other.

1454 IEEE TRANSACTIONS ON MICROWAVE THEORY AND TECHNIQUES, VOL. 60, NO. 5, MAY 2012
TABLE IVEXTRACTED DIELECTRIC CONSTANTS OF ORGANIC MUTs FOR SAMPLE VOLUMES FROM 50 TO 200 L
Fig. 17(a) shows that the measured frequency shift is rela-tively linear with increasing volume fractions of methanol in anethanol–methanol mixture. The system exhibits a sensitivity ofaround 0.53 MHz of frequency shift for every 1% increase inthe volume fraction of methanol. The frequency resolution ofthis system is ultimately limited by systematic errors in samplevolume dispensed and homogeniety of the sample mixture, andalso random errors caused by oscillator phase noise and tem-perture fluctuations. An approximate estimation of frequencyresolution of this system is obtained from the standard devia-tion of frequency shifts measured in Fig. 14, and is between0.3–0.9 MHz for 50–200- L sample volumes. The ability of thesystem to accurately estimate the volume fraction of constituentelements in a dielectric mixture has been successfully demon-strated.
V. CONCLUSION
A self-sustained low-cost microwave platform has been de-veloped for dielectric-constant measurement of lossy organicliquids. Design of the oscillator for dielectric-constant measure-ment has been presented in detail. The use of a self-sustainedfrequency synthesizer system allows large sample volumes oflossy material to be tested, thereby providing large frequencyshifts, which are then accurately measured using a unique de-tection algorithm. The extracted dielectric constant provides anaccuracy better than 2 , and volume fractions of dielectricmixtures have been measured to around 1% accuracy.
REFERENCES
[1] K-.B. Kim, J.-H. Kim, S. S. Lee, and S. H. Noh, “Measurement of grainmoisture content using microwave attenuation at 10.5 GHz and mois-ture density,” IEEE Trans. Instrum. Meas., vol. 51, no. 1, pp. 72–77,Feb. 2002.
[2] H. M. A. Al-Mattarneh, D. K. Ghodgaonkar, and W. M. M. A. Majid,“Microwave nondestructive testing for classification of Malaysiantimber using free-space techniques,” in 6th Int. Signal Process. and ItsAppl. Symp., Kuala Lumpur, Malaysia, 2001, vol. 2, pp. 450–453.
[3] S. Gabriel, R. W. Lau, and C. Gabriel, “The dielectric properties ofbiological tissues: II. Measurements in the frequency range 10 Hz to20 GHz,” Phys. Med. Biol., vol. 41, pp. 2251–2269, 1996.
[4] G. Smith, A. P. Duffy, J. Shen, and C. J. Olliff, “Dielectric relaxtionspectroscopy and some applications in the pharmaceutical sciences,”J. Pharmaceut. Sci., vol. 84, no. 9, pp. 1029–1044, Sep. 1995.
[5] E. J. Vanzura, R. G. Geyer, and M. D. Janezic, “The NIST 60-mil-limeter diameter cylindrical cavity resonator: Performance evaluationfor permittivity measurements,” NIST, Boulder, CO, Tech. Note 1354,Aug. 1993.
[6] K. Saeed, R. D. Pollard, and I. C. Hunter, “Substrate integrated wave-guide cavity resonators for complex permittivity characterization ofmaterials,” IEEE Trans. Microw. Theory Tech., vol. 56, no. 10, pp.2340–2347, Oct. 2008.
[7] P. A. Bernard and J. M. Gautray, “Measurement of dielectric constantusing a microstrip ring resonator,” IEEE Trans. Microw. Theory Tech.,vol. 39, no. 3, pp. 592–595, Mar. 1991.
[8] E. Fratticcioli, M. Dionigi, and R. Sorrentino, “A simple and low-cost measurement system for the complex permittivity characteriza-tion of materials,” IEEE Trans. Microw. Theory Tech., vol. 53, no. 4,pp. 1071–1077, Apr. 2004.
[9] W. Ho, G. M. Hidy, and R. M. Govan, “Microwave measurements ofthe liquid water content of atmospheric aerosols,” J. Appl. Meteorol.,vol. 13, pp. 871–879, Dec. 1974.
[10] P. G. Wilson and R. D. Carver, “An easy-to-use FET DRO design pro-cedure suited to most CAD programs,” in IEEE MTT-S Microw. Symp.Dig., Jun. 1999, vol. 3, pp. 1033–1036.
[11] H-.J. Lee and J-.G. Yook, “Biosensing using split-ring resonators atmicrowave regime,” Appl. Phys. Lett., vol. 92, 2008, Art. ID 254103.
[12] V. Sekar, W. J. Torke, S. Palermo, and K. Entesari, “A novel approachfor dielectric constant measurement using microwave oscillations,” inIEEE MTT-S Int. Microw. Symp. Dig., Jun. 2011, pp. 1–4.
[13] F. Buckley and A. A. Maryott, “Tables of dielectric dispersion datafor pure liquids and dilute solutions” NIST, Boulder, CO, 1958, NBSCircular 589.
[14] “ADF4157 data sheet,” Analog Devices Inc., Norwood, MA, Rev. Aed., 2007.
[15] “C8051F060/1/2/3/4/5/6/7 data sheet,” Silicon Labs. Inc., Austin, TX,Prelim. Rev. 1.2, 2004.
[16] A. P. Gregory and R. N. Clarke, “Tables of complex permittivity of di-electric reference liquids at frequencies up to 5 GHz,” NPL,Middlesex,U.K., Rep. CETM 33, Sep. 2001.
[17] K. S. Cole and R. H. Cole, “Dispersion and absorption in dielectrics I:Alternating current characteristics,” J. Chem. Phys., vol. 9, no. 4, pp.341–351, Apr. 1941.
[18] G. S. P. Castle and J. Roberts, “A microwave instrument for the con-tinuous monitoring of the water content of crude oil,” Proc. IEEE, vol.62, no. 1, pp. 103–108, Jan. 1974.
[19] S. Palermo, “A multi-band phase-locked loop frequency synthesizer,”M.S. thesis, Dept. Elect. Comput. Eng., Texas A&M Univ., CollegeStation, TX, 1999, pp. 36–41.
[20] F. Garner, Phaselock Techniques, 3rd ed. Hoboken, NJ: Wiley, 2005.[21] G. R. Cooper and C. D. McGillem, Probabilistic Methods of Signal
and System Analysis, 2nd ed. New York: Harcourt Brace Johanovich,1986.
Vikram Sekar (S’07–M’12) received the Bachelorsdegree in electrical engineering from VisveswariahTechnological University, Belgaum, India, in 2006,and the M.S. and Ph.D. degrees in electrical engi-neering from Texas A&M University, College Sta-tion, in 2008 and 2011, respectively.During the summers of 2007 and 2008 he was an
Intern with Texas Instruments Incorporated, Dallas,TX, where he was involved with signal integrity andcrosstalk in wireless handsets. He is currently anElectromagnetic Modeling Engineer with Peregrine
Semiconductor, San Diego, CA, where he is involved with the development ofdevice and package models for UltraCMOS silicon-on-sapphire technology.His research interests include microwave filters, nonlinearity and noise intunable filters, RF microelectromechanical systems, and microwave sensors.Dr. Sekar was the recipient of the Third Place Award of the 2011 IEEE
Microwave Theory and Techniques Society (IEEE MTT-S) InternationalMicrowave Symposium (IMS) Student Paper Competition.

SEKAR et al.: SELF-SUSTAINED MICROWAVE SYSTEM FOR DIELECTRIC-CONSTANT MEASUREMENT OF LOSSY ORGANIC LIQUIDS 1455
William J. Torke (S’11) received the B.S. degreein electrical engineering from Purdue University,West Lafayette, IN, in 1995, and the M.Sc. degree inelectrical engineering from Texas A&M University,College Station, in 2011. His primary M.Sc. researchtopic pertained to PLLs.During his undergraduate study, he was also a
co-op employee with Thomson Consumer Elec-tronics. He has been with several companies inAustin, TX including AMD, Cygnal IntegratedProducts Inc. (since acquired by Silicon Laboratories
Inc.), and Cirrus Logic Inc. He has primarily been an Applications Engineersupporting power metering and microcontroller IC products, and also a Soft-ware/Firmware Engineer. He is currently an Analog Hardware Engineer withNational Instruments, Austin, TX.Mr. Torke was the recipient of the 2009 Hardy Caton Fellowship.
Samuel Palermo (S’98–M’08) received the B.S.and M.S. degrees in electrical engineering fromTexas A&MUniversity, College Station, in 1997 and1999, respectively, and the Ph.D. degree in electricalengineering from Stanford University, Stanford, CA,in 2007.From 1999 to 2000, he was with Texas Instruments
Incorporated, Dallas, TX, where he was involvedwith the design of mixed-signal ICs for high-speedserial-data communication. From 2006 to 2008,he was with the Intel Corporation, Hillsboro, OR,
where he was involved with high-speed optical and electrical I/O architectures.In 2009, he joined the Electrical and Computer Engineering Department, TexasA&M University, where he is currently an Assistant Professor. His researchinterests include high-speed electrical and optical links, clock recovery systems,and techniques for device variability compensation.Dr. Palermo is a member of Eta Kappa Nu. He was a corecipient of the Jack
Raper Award for Outstanding Technology-Directions Paper of the 2009 Inter-national Solid-State Circuits Conference.
Kamran Entesari (S’03–M’06) received the B.S.degree in electrical engineering from the SharifUniversity of Technology, Tehran, Iran, in 1995, theM.S. degree in electrical engineering from TehranPolytechnic University, Tehran, Iran, in 1999, andthe Ph.D. degree from The University of Michiganat Ann Arbor, in 2005.In 2006, he joined the Department of Electrical
and Computer Engineering, Texas A&M University,College Station, where he is currently an AssistantProfessor. His research interests include design of
RF/microwave/millimeter-wave ICs and systems, RF microelectromechanicalsystems (MEMS), and medical electronics.Dr. Entesari was the recipient of the 2011 National Science Foundation (NSF)
CAREER Award. He was a corecipient of the 2009 Semiconductor ResearchCorporation (SRC) Design Contest Second Project Award for his work on dual-band millimeter-wave receivers on silicon.