15 m 9299 provencher scc bf_m454p171 - inter research
TRANSCRIPT

MARINE ECOLOGY PROGRESS SERIESMar Ecol Prog Ser
Vol. 454: 171–182, 2012doi: 10.3354/meps09299
Published May 21
INTRODUCTION
Changing climatic conditions are affecting bio -logical systems worldwide (Edwards & Richardson2004). High latitudes are expected to be particularlyaffected by changing atmospheric and oceanographicconditions, as a result of widespread changes in seaice and snow cover (IPCC 2007). In the CanadianArctic, an overall warming trend and a reduction insummer sea-ice cover have been observed over thelast several decades (Barber et al. 2008). Such changesare likely going to fundamentally alter Arctic ecosys-tems, as sea ice plays a central role to marine organ-isms, and changes in sea ice have direct impacts onlocal species (Gaston et al. 2005a, Soreide et al. 2010).Tracking changes in sea-ice ecosystems over time
can help us understand ecosystem dynamics as wellas how changing climatic conditions may affect thepolar regions.
Seabirds are considered ideal organisms fortrack ing changes in marine environments (Cairns1987). They are highly visible, easy to count, andhave a life history that is tightly coupled with theenvironment, and as a result have been useful instudying changes in fish populations in a numberof ocean basins (Piatt et al. 2007). In the easternCanadian Arctic, the thick-billed murre Uria lomvia(hereinafter referred to as ‘murre’) has beenshown to be a useful indicator species for trackingchanges in the marine environment, based onlong-term monitoring programs (Gaston et al.2005b, 2009).
© Inter-Research 2012 · www.int-res.com*Email: [email protected]
Seabird diet indicates changing Arctic marine communities in eastern Canada
J. F. Provencher1,*, A. J. Gaston2, P. D. O’Hara3, H. G. Gilchrist2
1Department of Biology, University of Victoria, Victoria, British Columbia V8W 3N5, Canada2Science and Technology Branch, National Wildlife Research Centre, Carleton University, Ottawa, Ontario K1A 0H3, Canada
3Canadian Wildlife Service, Sidney, British Columbia V8L 4B2, Canada
ABSTRACT: Changing climatic conditions are affecting ecosystems worldwide, but polar ecosys-tems are experiencing the most rapid changes as the extent of summer sea ice has diminished overthe last several decades. In the Canadian Arctic, thick-billed murres Uria lomvia can be used assamplers of the marine environment, and we examined changes in the diet of the birds betweenrecent and historical studies from the 1970s and 1980s. In the low Arctic, the amount of Arctic cod,an ice-dependent species, declined in the murre diet; and capelin, a subarctic species, has nowbecome the primary prey item. In the mid-Arctic, where summer sea ice is still present during thesummer, Arctic cod persists as an important prey item, but capelin is now regularly observed,marking an apparent northward expansion of this species over the last 30 yr. In the high Arctic,summer sea ice continues to dominate the seascape in most years, and Arctic cod continues todominate the diets of the murres. Changes in Arctic cod in the bird diet were found to be morerelated to sea ice conditions averaged over multiple years rather than single-year indices, indicat-ing that long-term changes in sea ice do impact this prey species. The diversity of the prey sam-pled by the birds has decreased, signaling a potential change in the number of prey species avail-able. Overall, the birds illustrate changes occurring in the marine environment in areas wherelittle other information is available.
KEY WORDS: Seabird · Arctic · Climate change · Diet shift · Fish community · Zooplankton ·Thick-billed murre · Uria lomvia · Sea ice cover
Resale or republication not permitted without written consent of the publisher
Contribution to the Theme Section ‘Seabirds and climate change’ OPENPEN ACCESSCCESS

Mar Ecol Prog Ser 454: 171–182, 2012
Starting in the mid-1970s, several studies exam-ined the diet of adult murres throughout Canada’slow-, mid-, and high-Arctic oceanographic zones asdefined by Salomonsen (1965) (Bradstreet 1980, Gas-ton & Nettleship 1981, Gaston & Noble 1985). Histor-ically, the diet of high-Arctic murres was dominatedby Arctic cod Boreogadus saida, a cold-water school-ing fish that spawns on the under-surface of ice(Craig et al. 1982), while low-Arctic murres also con-sumed Arctic cod along with a number of secondaryprey items (Gaston & Bradstreet 1993).
Since these initial studies, several long-term moni-toring programs have been established by Environ-ment Canada in the Canadian Arctic to study murres,with a major part of the research focused on themurre colony at Coats Island, Nunavut (62° 57’ N,82° 00’ W). In the 1980s and early 1990s, most fooditems delivered to nestlings by parents on CoatsIsland were Arctic cod (Gaston et al. 2003). However,beginning in the mid-1990s, capelin Mallotus villo-sus, a subarctic schooling fish species common off thecoast of Atlantic Canada, became more common inthe nestling diet, whereas the amount of Arctic coddeclined. By 1997, capelin was the most commonprey item delivered to nestlings (Gaston et al. 2003),a pattern that has persisted to date (A. J. Gastonunpubl. data).
In light of the changes observed in the nestling dietat Coats Island, and the changes in sea ice observedthroughout the eastern Canadian Arctic, a re-assessment of adult murre diet throughout the regionwas needed to detect potential widespread changesin murre diets. In the present study, in order to com-pare current murre diets with historical samples,murres were collected for stomach content analysisfrom 2007 to 2009 (International Polar Year) in thesame areas and on similar dates as collections madein the 1970s and 1980s (see Table 1).
As sea ice conditions are a major factor structuringmarine ecosystems in the Arctic, the diets of the birdswere expected to show the greatest changes in thelow Arctic, where dramatic changes have occurred insummer sea-ice cover over the last few decades (Bar-ber et al. 2008). Diversity in prey items at the low-Arctic sites was expected to increase as subarcticspecies start to contribute more to the diversity of themurre diet. In the high Arctic, where sea ice contin-ues to be present for much of the summer, murrediets were expected to show little or no change incomposition or diversity, while in the mid-Arctic,changes were expected to be intermediate betweenthose in the high- and low-Arctic zones (Gaston &Bradstreet 1993).
We also looked at how changes in the 2 main preyspecies, Arctic cod and capelin, in the murre dietwere related to changes in local sea-ice conditionsduring the breeding season in the year of samplingand in the previous 2 yr. Due to the sympagic (ice-associated) nature of Arctic cod, changes in this fishspecies in the diet of the murres was expected to bemore positively related to sea ice over several yearsas compared with any single year of ice cover. Con-versely, as capelin is a subarctic species, and notdependent on sea ice, the presence of this species inthe murre diet was expected to be more negativelyrelated to sea ice cover over a period of several years.
MATERIALS AND METHODS
Stomach content analysis has limitations as adietary study tool, as it is biased toward prey itemswith hard parts or those that have been recentlyingested (Jackson & Ryan 1986). The retention timeof prey items varies with species, and stomach con-tents usually reflect species preyed upon in the last6 to 24 h (Brekke & Gabrielsen 1994, Hawkins etal. 1997). As a result, direct dietary comparisons areadmissible only where they duplicate, as closely aspossible, the methods of the earlier studies.
Collections
Adult murres were collected at 5 sites spreadthroughout the eastern Canadian Arctic. Birds wereshot with a 12-gauge shotgun using steel shot from asmall boat in areas where birds were seen to beactively feeding. During the 2007−09 breeding sea-sons, murres were collected from the waters aroundAkpatok Island (60° 25’ N, 68° 08’ W), Coats Island,and Digges Sound (62° 33’ N, 77° 35’ W) in the lowArctic; the Minarets (also known as Akpait; 66° 56’ N,61°46’ W) in the mid-Arctic; and Prince LeopoldIsland (74° 02’ N, 90° 00’ W) in the high Arctic (Fig. 1,Table 1). Murres were collected as close as possibleto historical collection dates to minimize differencesin diet due to seasonal patterns. After the collectionswere complete, carcasses were kept cool for 6 to 24 h,and then frozen until dissections were carried out.
Laboratory procedures
Each gastrointestinal tract (GIT) was cut longitudi-nally along the entire length of the tract. Once the
172

Provencher et al.: Arctic seabirds indicate changing marine communities
GIT was opened, the stomach was flushed with ethanolto remove all the items, taking care to remove allitems in the folds of the stomach, and placed in 95%ethanol. Prey remains in each stomach sample weresorted, divided into smaller vials, and categorizedusing an MZ6 Leica binocular microscope.
Otoliths were viewed, measured, and photo graphedusing the Leica microscope, a scope-mounted videocamera, and image analysis software. All otolithswere identified using Campana (2004), and voucherotoliths were sent to Otolith Techno logies’ laboratoryin Stillwater, Nova Scotia for con firmation of iden ti -fication (www. marinebiodiversity. ca/ otolith/ english/home.htm). If 2 otoliths from a given stomach mea-sured within 0.2 mm, they were considered to origi-nate from the same fish (Bradstreet 1980). The mini-mum number of fish in each stomach was calculatedas the number of matched otolith pairs plus the num-ber of un matched individual otoliths.
Intact zooplankton individuals, along with headsand tails for each taxon, were enumerated and iden-tified to the lowest taxonomic level possible (Holm -quist 1959, Clarke 1962, Tencati & Leung 1970, Bakeret al. 1990, Klekowski & Weslaw ski 1991, Vino gradovet al. 1996, Audzijonyte & Vainola 2007). Abundanceestimates were based on the sum of whole zooplank-ton and the number of heads or tails, whichever wasmore numerous, giving a minimum number for eachstomach.
Polychaete jaws were identified as left or right, andthe number of individual polychaetes present was de -termined from the maximum number of either rightor left jaws. Squid numbers were estimated by themaximum number of beak hoods or rostrums present.
Diet data analysis
Sampling occurred at 5 colonies,but for dietary comparisons, onlyDigges Sound, the Minarets, andPrince Leopold Island are in -cluded, as these had both robusthistoric and current stomach sam-ples. The 2007−08 dietary resultsfor Coats Island and Akpatok Is -land are included and referred tofor general discussion purposes,but due to a lack of historic stom-ach-contents data from CoatsIsland, and highly degraded cur-rent samples from Akpatok Islandbecause of logistical challenges
173
Fig. 1. Uria lomvia. Location of collections in the easternCanadian Arctic in the 1970s−80s and 2007−09 and theboundaries of the low- and high-Arctic zones as describedby Salomonsen (1965). The mid-Arctic zone is the area at theboundary between the low- and high-Arctic zones. A: PrinceLeopold Island; B: the Minarets; C: Coats Island; D: Digges
Sound; E: Akpatok Island
Colony Collection date Year n Source
Low ArcticAkpatok Island August 7 1983 19 Gaston & Bradstreet (1993)Akpatok Island August 19 2008 31 Present studyCoats Island July 27 2007 25 Present studyDigges Sound July–August 1980 98 Gaston et al. (1985)Digges Sound July–August 1981 44 Gaston et al. (1985)Digges Sound June–August 1982 55 Gaston et al. (1985)Digges Sound August 11 2008 30 Present studyDigges Sound July 28, August 1 2009 61 Present study
Mid ArcticThe Minarets late July 1985 17 Gaston & Smith (1985)The Minarets August 5 2007 30 Present studyThe Minarets August 3 2008 20 Present study
High ArcticPrince Leopold Island June–August 1976 48 Gaston & Nettleship (1981)Prince Leopold Island June–August 1977 48 Gaston & Nettleship (1981)Prince Leopold Island June 5, August 9 2008 50 Present study
Table 1. Collections: Historic and current collections of thick-billed murres for dietary studies in the eastern Canadian Arctic

Mar Ecol Prog Ser 454: 171–182, 2012
during collections, these colonies are not included inthe diet-change analysis. The prey item results arepresented as percent totals, which describe the pro-portion of prey items as a function of the total amountof prey items found in the birds at a given colony (seeFig. 2). Percent occurrence or incidence rate is givenin the supplement (www.int-res.com/ articles/ suppl/m454 p171_ supp. pdf), describing the proportion ofbirds that contained at least one of the prey items asa function of the total number of birds collected dur-ing the sampling (i.e. incidence rate).
To test for differences in the proportion of fish andinvertebrates consumed by the birds as a function oftotal prey items, a generalized linear mixed modelwas used (‘Proc GLIMMIX’: this and other proce-dures run in SAS version 9.2). Fish proportion of totalprey consumed was modeled with time period (his-toric vs. new) and zone (low, mid-, and high Arctic) asexplanatory variables. The effect of year nestedwithin sampling periods was modeled as a randomvariable. Only those birds sampled during the chick-rearing season (July to mid-August) were included inthis analysis to control for any seasonal difference indiet. The model was fitted with a binomial distribu-tion and a logit function, and controlled for over-dispersion of the data by modeling residuals as a random variable (‘random = residual’ statement).
Counts within fish subgroups (e.g. Arctic cod, sand -lance, sculpin) were modeled as response variablesand tested for variation with time period and Arcticzone using a similar generalized linear mixed model.Again, the effect of year nested within time periodswas modeled as a random variable. This model wasfitted with a negative binomial distribution and loglink function to control for over-dispersion in the data.Models failed to converge for capelin, sandlance, andthe remaining fish categories pooled into a single category (‘other’) because of low occurrence in dietssampled in the high-Arctic zone, and for this reasonwe modeled these groups based on data from the low-and mid-Arctic zones only. When a significant inter-action was found between time period and zone in thenumber of individuals within a fish category in the dietsamples, LSMEANS statements were used for posthoc comparisons of fixed effects within this model.
The invertebrate diet data (hyperiids, gammarids,mysids, squid, other) were highly zero-inflated andover-dispersed, precluding the use of generalizedlinear mixed models. Instead, these data were mod-eled using maximum likelihood estimation (‘ProcGENMOD’) and a negative binomial distributionwith a log link function. This modeling techniquedoes not allow for the inclusion of year nested within
time sample period as a random variable. When asignificant interaction was found between timeperiod and zone in the number of individuals withinan invertebrate subgroup in the diet samples,LSMEANS statements were used for post hoc com-parisons of fixed effects within this model.
Sea ice analysis
To examine the relationship between the sea iceand the main fish species found in the murres, weused the historical percentage of sea ice cover on 16July from the area around the colonies as reportedfrom the Canadian Sea Ice Service (using IceGraph1.03, available at http://ice-glaces.ec.gc.ca/IceGraph103/?id=11874&lang=eng) as a linear explanatoryvariable for predicting diet composition in the mur-res. Sea ice on this date has been shown to be relatedto murre diet (Gaston et al. 2005b). These analyseswere more complicated than comparing diet compo-sition between sampling periods because prey popu-lations are likely determined by ice conditions in pre-vious years. For this reason, indices of ice conditionsat variable lag-times were created as predictors fordiet composition among the 3 Arctic zones. Indices ofice conditions used were conditions during the sam-ple year (t0), the year before sample (t−1), and 2 yrbefore sample (t−2), as well as mean indices com -bining sample year and the year prior to sample, (t0 +t−1)/2, and mean combining sample year, year priorto sample, and 2 yr prior to sample, (t0 + t−1 + t−2)/3.
To explore the relationship between the proportionof fish in overall diet and subgroup abundance withthe various ice condition indices, we used maximumlikelihood estimation and the Akaike information cri-terion (AIC) to guide our choice among the differentindices. For the analysis based on fish proportion, wemodeled with a logit link function and binary distrib-ution for proportion of fish, and for both analysesbased on the fish subgroup abundance data, we useda log link function and negative binomial distributionto account for over-dispersion within the data. Allexploratory models included zone and interactions asexplanatory parameters.
Once the best-fit ice index was determined for bothproportion of fish in overall diet and fish subgroupabundance, we tested the relationship between thebest-fit ice condition index with proportion of fish andsubgroup abundance in diet samples among zones,again using ‘Proc GENMOD’ with logit link functionand a binary distribution (proportion data), and with alog link function and a negative binomial distribution
174

Provencher et al.: Arctic seabirds indicate changing marine communities
to correct for over-dispersion in the subgroup abun-dance data. Insignificant explanatory variables andhigher-order variables were removed in the final model.
Prey diversity
Prey diversity for each site was examined usingspecies-richness accumulation curves, which allowfor standardized comparison of diversity across col-lections that differ in sample size (Gotelli & Colwell2001). This approach was used to examine prey spe-cies diversity in murre diets at the 3 colonies withrobust historic and current diet sampling (DiggesSound, the Minarets, and Prince Leopold Island). Allbirds sampled in July and August (the chick-rearingperiod) that contained at least 1 identified item intheir GIT (leading to smaller sample sizes) weregrouped together by colony and sampling period,and the prey abundances for each bird were put intoa matrix in EcoSim (Gotelli & Entsminger 2009) tocreate a sample-based curve, with a rarefactioncurve as the randomization algorithm and speciesrichness as the prey species diversity index. Preydiversity curves were then produced in Excel inorder to compare the species richness with 95% con-fidence intervals. Non-overlapping endpoints out-side of 95% confidence interval curves indicate sig-nificantly different diversity levels.
RESULTS
During 2007−09, 247 GITs were examined, ofwhich 191 were from Digges Sound, the Minarets,and Prince Leopold Island, compared with 331 fromthe 1970s and 1980s from the same sites (Gaston &Bradstreet 1993). In the present study, 12 488 preyitems were identified (Tables S1 & S2 in the supple-ment at www.int-res.com/ articles/ suppl/m 454 p171_supp.pdf), with fish accounting for 21% of the totalnumber of prey items and invertebrates making upthe rest. Most GITs contained >1 type of prey andonly 14 (5.6%) contained no identifiable prey remains.
Differences among colonies
The primary prey items identified varied among the5 colonies sampled. At Prince Leopold Island, Arcticcod was predominant (Fig. 2); at the Minarets, it wasArctic cod and mysids, with other fish and inverte-brates in smaller numbers; at Coats Island, hyperiid
amphipods were the most numerous prey item, withcapelin the most numerous fish; and at Digges Sound,sandlance and capelin were the most common fishand mysids the most abundant invertebrates. At Ak-patok Island, the stomach contents were highly de-graded due to an unexpected delay in preserving thebirds, resulting in many of the otoliths not being iden-tifiable. Hence most of the fish in the diet are un-known, but by numbers, hyperiid amphipods were thelargest group of invertebrates consumed at Akpatok.
175
0
10
20
30
40
50
60
70
80
90
100
(n=31) (n=25) (n=50) (n=50)(n=91)
Unknown
Gadidae
Liparis sp.Leptoclinus maculatusCottidae
Ammodytes sp.
Mallotus villosus
Boreogadus saida
0
10
20
30
40
50
60
70
80
90
100
Akpatok Island
Coats Island
Digges Sound
The Minarets
Prince Leopold
Akpatok Island
Coats Island
Digges Sound
The Minarets
Prince Leopold
Crustacea
Decapod
Squid
Euphausiid
Copepod
Polychaete
Cumacea
Mysid
GammaridamphipodHyperiidamphipod
b
a
Per
centa
ge
Per
centa
ge
Fig. 2. Uria lomvia. Percent totals of (a) invertebrate and (b)fish prey items from eastern Canadian Arctic samples in2007−09. Akpatok Island (n = 31), Coats Island (n = 25), andDigges Sound (n = 91) are in the low Arctic; the Minarets(n = 50) is in the mid-Arctic; and Prince Leopold Island
(n = 50) is in the high Arctic

Mar Ecol Prog Ser 454: 171–182, 2012
Differences in prey composition between recentand earlier samples
Overall, fish proportion (mean ± SD) varied betweensampling periods inconsistently among zones (Fig. 3;F2,376 = 3.46, p = 0.032). In particular, the proportionof fish decreased in the low-Arctic zone (historic:0.40 ± 0.18; new: 0.055 ± 0.045; t = 2.11, df = 376, p =0.036), did not change in the mid-Arctic zone (t =0.09, p = 0.93), and in the high-Arctic zone it may
have increased (old proportion: 0.43 ± 0.30; newproportion: 0.98 ± 0.05) but we failed to detectsignificance (t = 1.56, df = 376, p = 0.12).
Fish species abundance varied between timeperiods differently among the 3 Arctic zones forthe 2 fish species with sufficient data to test (Arc-tic cod, sculpin). The proportion of Arctic cod dif-fered sig nificantly between time periods andamong zones (F2,304 = 6.91, p = 0.0012). In the lowArctic, there was a significant decrease in theproportion of Arctic cod in the diet from 30%of the fish consumed to <5% (t = −2.85, df = 304,p = 0.005). In the mid-Arctic, Arctic cod in -creased from 15% of the fish consumed in 1985to almost 70% (t = 2.02, df = 304, p = 0.04) in the2007−08 sample. In the high Arctic, Arctic codcontinued to be the main fish prey species (t =0.97, df = 304, p = 0.33). Sculpins (family Cotti-dae) did not show a significant change over time(F1,5 = 0.81, p = 0.41).
Analyses based on capelin, sandlance, and‘other’ fish data were restricted to murres sam-pled in the low- and mid-Arctic zones only,because of an extremely low rate of occurrencefor these species in samples from the high Arctic.The number of capelin found in murre dietsincreased with time (χ2
1,265 = 17.8, p < 0.0001) inboth zones (χ2
1,264 = 3.34, p = 0.07), from 0 to 12%in the mid-Arctic and from 8 to almost 30% in thelow Arctic zone. A change in sandlance Ammo -dytes sp. abundance was not detected betweentime periods (χ2
1,264 = 1.23, p = 0.27) or time peri-ods and zones (χ2
1,265 = 0.03, p = 0.86). Therewere no significant changes in analyses based ondata pooled among the remaining fish species(‘other’), likely because of small sample size.
176
Low Arctic Mid-Arctic High Arctic
Fish ↓ = =
Arctic cod ↓ ↑ =Capelin ↑ ↑ na
MysidsHyperiid amphipods ↓ ↑ =Gammarid amphipods ↓ ↓ ↓
Table 2. Uria lomvia. Summary of changes in prey itemssampled in the 1970s−80s and 2007−09 diets in the low Arc-tic (Digges Sound), mid-Arctic (the Minarets), and high Arc-tic (Prince Leopold Island) based on significant changes inprey abundance. Only those prey items that showed a sig-nificant interaction over time are shown. ‘↑’ denotes an in-crease, ‘↓’ denotes a decrease, ‘=’ denotes no change, and
‘na’ denotes not able to test
0102030405060708090
100
Low Arctic
1981/82/83
Low Arctic
2008/09
Mid Arctic1985
Mid Arctic
2007/08
High Arctic
1976/77
HighArctic2008
Invertebrates
Fish
a
b
c
0
20
40
60
80
100
Low Arctic
1981/82/83
Low Arctic
2008/09
Mid Arctic1985
Mid Arctic
2007/08
High Arctic
1976/77
High Arctic2008
Sculpin
Sandlance
Capelin
Arctic cod
0
10
20
30
40
50
60
70
80
90
100
Low Arctic
1981/82/83
(n=197)
Low Arctic
2008/09
(n=91)
Mid Arctic 1985
(n=17)
Mid Arctic
2007/08
(n=50)
High Arctic
1976/77
(n=39)
High Arctic2008
(n=50)
Other
Squid
Copepod
Mysid
GammaridamphipodsHyperid amphipods
Per
centa
ge
Per
centa
ge
Per
centa
ge
Fig. 3. Uria lomvia. Historic and current diet samples in thelow Arctic (Digges Sound), mid-Arctic (the Minarets), andhigh Arctic (Prince Leopold Island). Percent total of (a) fishand invertebrates, (b) identified fish species, and (c) inver-
tebrate prey items

Provencher et al.: Arctic seabirds indicate changing marine communities
Overall invertebrates in the diet of the murresalso changed over time (Fig. 3; χ2 = 22.3, df = 5, p =0.0005). Both copepod and squid abundance inmurre diet did not vary with time (copepod: χ2 = 3.38,df = 1, p = 0.070; squid: χ2 = 1.51, df = 1, p = 0.22) anddid not vary with time period by zone interaction(copepod: χ2 = 0.98, df = 2, p = 0.61; squid: χ2 = 3.65,df = 2, p = 0.16). Gammarid amphipods decreasedsignificantly with time period (χ2 = 23.8, df = 2, p <0.0001) consistently among zones (χ2 = 2.85, df = 2, p= 0.24). Mysids also decreased significantly with time(χ2 = 8.11, df = 1, p = 0.0014) consistently amongzones (χ2 = 1.35, df = 2, p = 0.51).
The amount of hyperiid amphipods in the diets ofthe murres varied inconsistently with time among thezones (χ2 =16.8, df = 2, p = 0.0002). In the low Arctic,where hyperiid amphipods formed a relatively largeportion of the murre diet in the earlier period, therewas a significant decrease (from 30% of inverte-brates to 8%: χ2 = 20.48, df = 1, p < 0.0001). In themid-Arctic, hyperiids contributed a small amount tothe bird’s diet but showed a significant increase withtime (χ2 = 6498.3, df = 1, p < 0.0001) (Fig. 3). In thehigh Arctic, hyperiid amphipods continued to con-tribute to the diet of the birds in very small numbers,with only 14 hyperiids found in 50 birds from thehigh Arctic in 2008 (χ2 = 2.91, df = 1, p = 0.09).
Other invertebrate prey items found in small numbers include annelids, cumaceans, decapods, andeuphausiids. Grouped together, these prey itemswere found to account for <10% of total invertebrateprey items, except at the Minarets in 1985, where>20% of the invertebrates were from these 4 groups.Independently, changes in these groups could not bemodeled due to limited numbers in the samples.
Considering all of the above changes, the greatestamount of change occurred in the diet of the murresin the low Arctic, with fewer changes in the mid-Arctic and the least amount of changes in the highArctic (Table 2).
Changes in ice conditions
Between 1971 and 2010, the sea ice cover in north-ern Hudson Bay, around Digges Sound (low Arctic),decreased strongly, especially after 1993 (Fig. 4). Onaverage, the extent on 16 July was 33% during theperiod 1971 to 1993 and only 7% after 1993, and theoverall slope of the trend line for sea ice cover (mean± SD) for this time period is −7.45 ± 5.13% decade−1,suggesting a long-term decrease in sea ice. In DavisStrait (mid-Arctic), summer sea ice showed only a
small decline in sea ice over the last 40 yr (slope:−3.36 ± 2.11% decade−1), and in Lancaster Sound(high Arctic), sea ice cover showed substantial fluc -tuations and no strong trend (slope: −2.60 ± 7.49%decade−1) between 1971 and 2010.
177
Fig. 4. Uria lomvia. Sea ice cover in the eastern CanadianArctic during the chick-rearing period from 1971 to 2010 on16 July of each year in (a) North Hudson Bay Narrows (lowArctic; slope: −7.45 ± 5.13% decade−1), (b) Davis Strait (mid-Arctic; slope: −3.36 ± 2.11% decade−1), (c) Lancaster Sound(high Arctic; slope: −2.60 ± 7.49% decade−1). The dark grayline indicates the average ice cover and the light gray indi-cates the overall trend in sea ice cover between 1971 and 2010.The slopes listed above are for the trend line for each region
Mar Ecol Prog Ser 454: 171–182, 2012
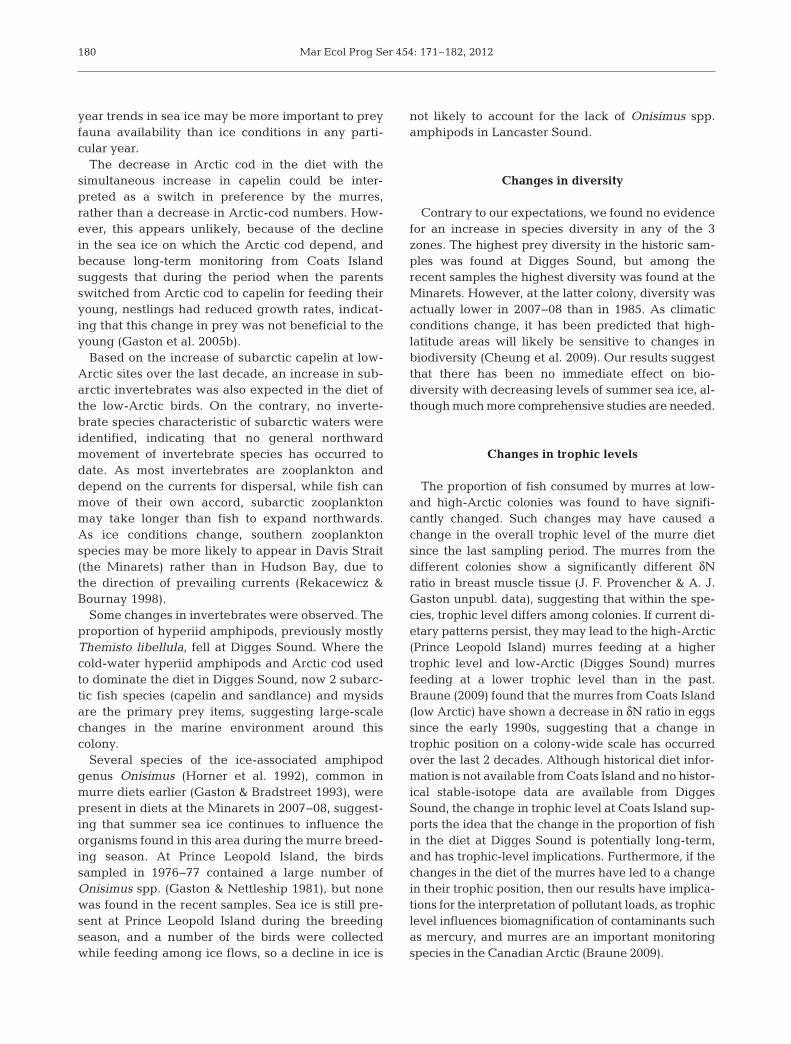
Changes in local sea-ice conditions were signifi-cantly associated with changes in the proportion offish in general and specifically with the 2 main fishprey species consumed by murres, Arctic cod andcapelin, but the nature of this association variedamong zones. The ice index reflecting ice conditions2 yr prior to the sample year had the highest explana-tory power for variation in the proportion of fish inmurre diets (Table 3), the ice index reflecting ice con-ditions averaged over 3 yr up to and including thesample year was most effective for explaining varia-tion in Arctic-cod abundance, and ice conditionsprior to the sample year best predicted capelin abun-dance in murre diets.
Proportion of fish in the diet varied significantlywith the best-fit ice index reflecting ice conditions2 yr prior to sample year (F2,381 = 9.45, p ≤ 0.0001),and most of this variation occurred in the low-Arcticzone where fish proportion decreased significantlywith the decrease in sea ice (t = 8.46, df = 381, p ≤0.0001). There was no significant relationship in the
mid-Arctic zone (t = 0.52, df =381, p = 0.60), and there was sig-nificant variation in the high Arc-tic where the proportion of fishdecreased with more ice cover(t = −2.02, df = 381, p = 0.044).Capelin abundance varied sig-nificantly with the same best-fitice index as overall fish propor-tion (ice conditions 2 yr prior tosample year) (F1,370 = 26.6, p ≤0.0001), but this variation was
consistent among Arctic zones for this species. Arcticcod abundance in the diet varied with the best-fit iceindex averaged over the previous 3 yr including thesample year, and the nature of the relationship differed significantly among Arctic zones (F2,368 =45.8, p ≤ 0.0001). In the high Arctic, no significantchange was detected in Arctic cod consumed by mur-res as the local ice conditions changed (t = 0.16, df =368, p = 0.69), but in the low Arctic, Arctic codincreased in the murre diet with more sea ice (t =32.2, df = 368, p = 0.0001), and in the mid-Arctic, Arc-tic cod decreased with increasing ice cover (t = 15.0,df = 368, p = 0.0001).
Changes in prey diversity
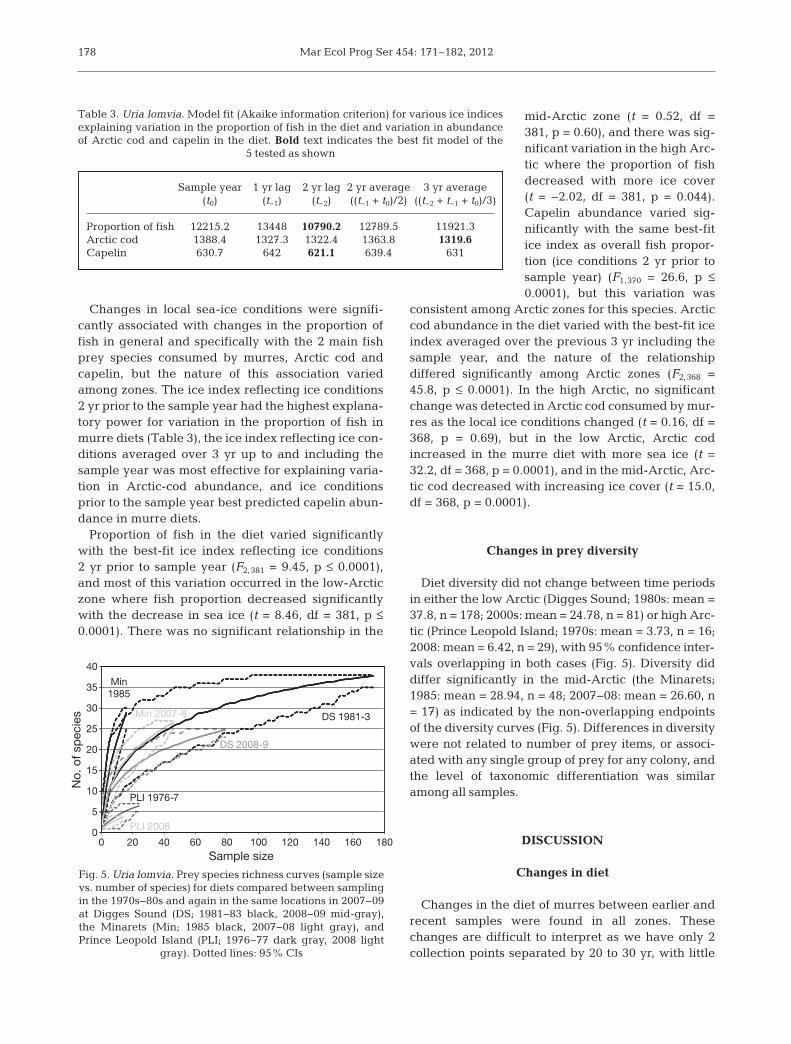
Diet diversity did not change between time periodsin either the low Arctic (Digges Sound; 1980s: mean =37.8, n = 178; 2000s: mean = 24.78, n = 81) or high Arc-tic (Prince Leopold Is land; 1970s: mean = 3.73, n = 16;2008: mean = 6.42, n = 29), with 95% confidence inter-vals overlapping in both cases (Fig. 5). Diversity diddiffer significantly in the mid-Arctic (the Mina rets;1985: mean = 28.94, n = 48; 2007−08: mean = 26.60, n= 17) as indicated by the non-overlapping endpointsof the diversity curves (Fig. 5). Differences in diversitywere not related to number of prey items, or associ-ated with any single group of prey for any colony, andthe level of taxonomic differentiation was similaramong all samples.
DISCUSSION
Changes in diet
Changes in the diet of murres between earlier andrecent samples were found in all zones. Thesechanges are difficult to interpret as we have only 2collection points separated by 20 to 30 yr, with little
178
Sample year 1 yr lag 2 yr lag 2 yr average 3 yr average(t0) (t−1) (t−2) ((t−1 + t0)/2) ((t−2 + t−1 + t0)/3)
Proportion of fish 12215.2 13448 10790.2 12789.5 11921.3Arctic cod 1388.4 1327.3 1322.4 1363.8 1319.6Capelin 630.7 642 621.1 639.4 631
Table 3. Uria lomvia. Model fit (Akaike information criterion) for various ice indicesexplaining variation in the proportion of fish in the diet and variation in abundanceof Arctic cod and capelin in the diet. Bold text indicates the best fit model of the
5 tested as shown
0 20 40 60 80 100 120 140 160 180
30
35
40
15
20
25
0
5
10
Min1985
No.
of s
pec
ies
Sample size
PLI 1976-7
PLI 2008
Min 2007-8
DS 2008-9
DS 1981-3
Fig. 5. Uria lomvia. Prey species richness curves (sample sizevs. number of species) for diets compared between samplingin the 1970s−80s and again in the same locations in 2007−09at Digges Sound (DS; 1981−83 black, 2008−09 mid-gray),the Minarets (Min; 1985 black, 2007−08 light gray), andPrince Leopold Island (PLI; 1976−77 dark gray, 2008 light
gray). Dotted lines: 95% CIs

Provencher et al.: Arctic seabirds indicate changing marine communities
information from the intervening time. One potentialconfounding factor in diet comparisons is timing, asadult birds have been shown to alter their prey spec-trum over the breeding season (Elliott et al. 2009),thus we tried to repeat as near to the original sam-pling dates as possible, which still correspond to thebird’s breeding phenology. Fisheries may also influ-ence prey communities, but no commercial fisheriesoperate in any of the areas sampled, so it is unlikelythat our results are in any way affected by fisheries.Competition among other top predators can alsoinfluence marine communities, but although razor-bills and subarctic gulls have increased in the lowArctic (Gaston & Woo 2008), their numbers are negli-gible relative to the size of the large murre colonies(Brown et al. 1975, Gaston 1991). All these factorsmust be considered when examining and interpret-ing detectable changes in seabird diet, but theireffects in the present study are likely to be small,allowing murres to be used as sentinels of changingmarine ecosystems.
Arctic cod still dominates the diet of the high-Arctic murres. This supports our prediction that littlechange should have occurred in the diet of the high-Arctic murres as sea ice conditions, although vari-able, have shown no consistent trend or change dur-ing the murre’s breeding season. Arctic cod was alsostill the main fish species in the murre diet in themid-Arctic, where sea ice is also still present in thesummer months. In the low Arctic, where summersea ice has declined the most drastically, and is nowrare or non-existent, Arctic cod has all but disap-peared from recent murre diets. Very few Arctic codwere found in the recent sample from Digges Sound,and only slightly more in the birds from Coats Island.At Akpatok Island, where murre diet studies go back6 decades, the recent sampling found no Arctic cod,whereas this species was found to be a main preyitem fed to chicks in 1954 (Tuck & Squires 1955) andwas still present in the murre diet in 1983 (Gaston &Bradstreet 1993). The decrease in Arctic cod in themurre diet is highly associated with ice conditionsover 3 yr prior to and including the sample year in thelow and mid-Arctic, suggesting that changes in thisprey species in murre diets is more likely due tolonger-term, chronic changes than episodic acuteevents.
The dependence of Arctic cod on sea ice (Craig etal. 1982), declining numbers of Arctic cod in murrediets in Digges Sound cumulatively related to sea icechanges, and the disappearance of Arctic cod fromthe diet of murres over the last half century at Akpa-tok Island indicate that changes in Arctic cod as a
prey item in the low Arctic may be a consequence ofchanging sea-ice conditions over the long term.Given the decrease in Arctic cod observed in murrediets in the low Arctic, where summer sea ice is negligible or absent most years, and the variability ofsea ice cover in the high Arctic, where Arctic codcontinues to be the main food item, our results indi-cate that the presence or absence of sea ice is thelargest factor in Arctic cod availability for murres,although percent cover is likely to be a contributingfactor as well.
Alongside the decrease in Arctic cod, the increasein capelin in the diet of the murres sampled in2007−08 in the low and mid-Arctic suggests that thissubarctic fish is becoming an important prey item atthese colonies. Capelin is an abundant item inseabird diets in Atlantic Canada (Davoren & Mon-tevecchi 2003), but before the mid-1990s it was onlyobserved as a secondary prey item for murres in thelow Arctic (Gaston & Bradstreet 1993). Throughoutthe 1980s to the mid-1990s, capelin was a secondaryprey item in northern Hudson Bay (Gaston et al.2003), an area within the described range of this spe-cies (Leim & Scott 1966), but was not found amongnestling diets at Hantzsch Island, off SE Baffin Island(Gaston & Noble 1985), an area just north of thedescribed distribution of capelin at the time. Whilecapelin was present in the low Arctic prior to the1980s, no range maps for capelin extended north tothe Arctic Archipelago, no records existed for capelinon Baffin Island, and no capelin were found in thediets of the mid-Arctic adults at the Minarets in 1985(Tee-van 1948, Leim & Scott 1966, Gaston & Brad-street 1993). Now, in 2007−09, capelin has becomethe dominant prey item at murre colonies in the lowArctic and is common at the Minarets in the mid-Arc-tic, which lies outside of the range described previ-ously (Leim & Scott 1966), but within more recentrange descriptions (Muss et al. 1999), suggestinga northward expansion in the range of this prey species.
In Hudson Bay, the change in sea ice has not beenlinear, but showed a more step-wise change in themid-1990s (Scott & Marshall 2010, A. J. Gastonunpubl. data). The replacement of Arctic cod bycapelin as the main constituent of food fed to nestlingmurres at Coats Island coincided with this decreasein sea ice in the low Arctic (Gaston et al. 2003). It isalso important to note that prey stocks for murres arenot likely to be solely determined by conditions in theyear of collection, but as seen in our analysis can beaffected by conditions over several years prior tosampling. Thus, a more thorough analysis of multi-
179
Mar Ecol Prog Ser 454: 171–182, 2012
year trends in sea ice may be more important to preyfauna availability than ice conditions in any parti -cular year.
The decrease in Arctic cod in the diet with thesimultaneous increase in capelin could be inter-preted as a switch in preference by the murres,rather than a decrease in Arctic-cod numbers. How-ever, this appears unlikely, because of the declinein the sea ice on which the Arctic cod depend, andbecause long-term monitoring from Coats Islandsuggests that during the period when the parentsswitched from Arctic cod to capelin for feeding theiryoung, nestlings had reduced growth rates, indicat-ing that this change in prey was not beneficial to theyoung (Gaston et al. 2005b).
Based on the increase of subarctic capelin at low-Arctic sites over the last decade, an increase in sub-arctic invertebrates was also expected in the diet ofthe low-Arctic birds. On the contrary, no inverte-brate species characteristic of subarctic waters wereidentified, indicating that no general northwardmovement of invertebrate species has occurred todate. As most invertebrates are zooplankton anddepend on the currents for dispersal, while fish canmove of their own accord, subarctic zooplanktonmay take longer than fish to expand northwards.As ice conditions change, southern zooplanktonspecies may be more likely to appear in Davis Strait(the Minarets) rather than in Hudson Bay, due tothe direction of prevailing currents (Rekacewicz & Bournay 1998).
Some changes in invertebrates were observed. Theproportion of hyperiid amphipods, previously mostlyThemisto libellula, fell at Digges Sound. Where thecold-water hyperiid amphipods and Arctic cod usedto dominate the diet in Digges Sound, now 2 subarc-tic fish species (capelin and sandlance) and mysidsare the primary prey items, suggesting large-scalechanges in the marine environment around thiscolony.
Several species of the ice-associated amphipodgenus Onisimus (Horner et al. 1992), common inmurre diets earlier (Gaston & Bradstreet 1993), werepresent in diets at the Minarets in 2007−08, suggest-ing that summer sea ice continues to influence theorganisms found in this area during the murre breed-ing season. At Prince Leopold Island, the birds sampled in 1976−77 contained a large number ofOnisimus spp. (Gaston & Nettleship 1981), but nonewas found in the recent samples. Sea ice is still pre-sent at Prince Leopold Island during the breedingseason, and a number of the birds were collectedwhile feeding among ice flows, so a decline in ice is
not likely to account for the lack of Onisimus spp.amphipods in Lancaster Sound.
Changes in diversity
Contrary to our expectations, we found no evidencefor an increase in species diversity in any of the 3zones. The highest prey diversity in the historic sam-ples was found at Digges Sound, but among therecent samples the highest diversity was found at theMinarets. However, at the latter colony, diversity wasactually lower in 2007−08 than in 1985. As climaticconditions change, it has been predicted that high-latitude areas will likely be sensitive to changes inbiodiversity (Cheung et al. 2009). Our results suggestthat there has been no immediate effect on bio -diversity with decreasing levels of summer sea ice, al-though much more comprehensive studies are needed.
Changes in trophic levels
The proportion of fish consumed by murres at low-and high-Arctic colonies was found to have signifi-cantly changed. Such changes may have caused achange in the overall trophic level of the murre dietsince the last sampling period. The murres from thedifferent colonies show a significantly different δN ratio in breast muscle tissue (J. F. Provencher & A. J.Gaston unpubl. data), suggesting that within the spe-cies, trophic level differs among colonies. If current di-etary patterns persist, they may lead to the high-Arctic(Prince Leopold Island) murres feeding at a highertrophic level and low-Arctic (Digges Sound) murresfeeding at a lower trophic level than in the past.Braune (2009) found that the murres from Coats Island(low Arctic) have shown a decrease in δN ratio in eggssince the early 1990s, suggesting that a change introphic position on a colony-wide scale has occurredover the last 2 decades. Although historical diet infor-mation is not available from Coats Island and no histor-ical stable-isotope data are available from DiggesSound, the change in trophic level at Coats Island sup-ports the idea that the change in the proportion of fishin the diet at Digges Sound is potentially long-term,and has trophic-level implications. Furthermore, if thechanges in the diet of the murres have led to a changein their trophic position, then our results have implica-tions for the interpretation of pollutant loads, as trophiclevel influences biomagnification of contaminants suchas mercury, and murres are an important monitoringspecies in the Canadian Arctic (Braune 2009).
180

Provencher et al.: Arctic seabirds indicate changing marine communities
CONCLUSIONS
With only 2 sampling periods to compare, changesin prey species need to be interpreted carefully, andmore detailed sampling is needed to fully understandpotential biodiversity changes in Arctic waters. How-ever, the decrease in cold-water species across thelow Arctic, along with the increase in capelin andmysids in the low and mid-Arctic, illustrates thatthe biota of these regions is undergoing dramaticchanges.
The contrast between the changes in prey ob -served in the low Arctic and the much less dramaticchanges in the diet of the murres in the mid-Arcticsuggests that what has occurred in the low Arcticmay represent a step-wise change in the marineecosystem. While the low-Arctic areas in Hudson Bayseem to have shifted towards subarctic species overthe last few years, the marine ecosystem of the mid-Arctic appears to be at an Arctic−subarctic transitionperiod, with sympagic species still present but withsubarctic species such as capelin and sandlance nowbecoming regular components of seabird diets.
Overall, we see the greatest change in murre dietin the low Arctic and the least in the high Arctic, withthe mid-Arctic showing an intermediate amount ofchange, as predicted. When this change is comparedwith sea ice data, the greatest change in diet, specif-ically in ice-associated prey species, coincides withthose areas where sea ice has declined and is nolonger present while murres are provisioning theirchicks. In the mid-Arctic, where the sea ice is stillpresent during the chick-rearing period, changes inprey species are already occurring, with capelin andsandlance now found at more northern latitudes thanpreviously reported and now being consumed by thebirds in quantities similar to those observed in thelow Arctic 25 yr ago, suggesting that change willcontinue in this location if summer sea ice continuesto decline. Along with razorbills Alca torda (Gaston &Woo 2008) and great black-backed gulls Larus mari-nus (H. G. Gilchrist & J. F. Provencher unpubl.), 2subarctic marine birds, the movement of capelin tomore northern latitudes adds to our knowledge ofsubarctic species that have become more common inlow- and mid-Arctic areas. These changes may haveseveral different effects on the murre colonies of theArctic Archipelago, and continued work in monitor-ing of populations will help detect long-term changesin this important human-hunted species.
Studying murres in the Canadian Arctic providessignificant and relevant information on changes inthe availability of a number of fish and invertebrate
species where little or no other fisheries-assessmentwork is currently being done. The murre colonies inthe eastern Canadian Arctic, where long-term stud-ies have been established, are strategic study loca-tions where continued monitoring will allow us totrack potential changes in seabird populations andtheir prey species as changing climatic conditionscontinue to be observed.
Acknowledgements. We thank M. Mallory, S. Smith, P.Smith, I. Storm, S. Suppa, and J. Szucs for help collectingthe specimens; G. Savard, S. Robinson, and students fromNunavut Arctic College for assistance with dissections; andJ. Dower (University of Victoria) for providing space andequipment for our use through his Natural Sciences andEngineering Research Council of Canada (NSERC) strategicfunding grant. Scientific studies and collections were con-ducted in accordance with guidelines from the CanadianCouncil on Animal Care, and under appropriate territorialand federal research permits. Financial and logistic supportwas provided by NSERC, Environment Canada, Natural Re -sources Canada (Polar Continental Shelf Project), the Natti -vak Hunters’ and Trappers’ Organization, and InternationalPolar Year 2007−2009. We also thank the Institute of OceanSciences (Department of Fisheries and Oceans Canada) forin-kind support to P.D.O.
LITERATURE CITED
Audzijonyte A, Vainola R (2007) Mysis nordenskioldi n. sp(Crustacea, Mysida), a circumpolar coastal mysid sepa-rated from the NE Pacific M. litoralis (Banner, 1948).Polar Biol 30:1137−1157
Baker AC, Boden BP, Brinton E (1990) A practical guideto the euphausiids of the world. The Natural HistoryMuseum, London
Barber DG, Lukovich JV, Keogak J, Baryluk S, Fortier L,Henry GHR (2008) The changing climate of the Arctic.Arctic 61:7−26
Bradstreet MSW (1980) Thick-billed murres and blackguillemots in the Barrow Strait area, N.W.T., duringspring: diets and food availability along ice edges. Can JZool 58:2120−2140
Braune BM (2009) Effects of climate change on diet and con-taminant exposure in seabirds breeding in northernHudson Bay. Northern Contaminant Program, Indianand Northern Affairs Canada, Ottawa
Brekke B, Gabrielsen G (1994) Assimilation efficiency ofadult kittiwakes and Brunnich’s guillemots fed capelinand Arctic cod. Polar Biol 14:279−284
Brown RGB, Nettleship DN, Germain P, Tull E, Davis T(1975) Atlas of eastern Canadian seabirds. CanadianWildlife Service, Ottawa
Cairns DK (1987) Seabirds as indicators of marine food sup-plies. Biol Oceanogr 5:261−271
Campana SE (2004) Photographic atlas of fish otoliths of theNorthwest Atlantic oceans. National Research CouncilCanada, Ottawa
Cheung WWL, Lam VWY, Sarmiento JL, Kearney K, WatsonR, Pauly D (2009) Projecting global marine biodiversityimpacts under climate change scenarios. Fish Fish 10:235−251
181

Mar Ecol Prog Ser 454: 171–182, 2012182
Clarke MR (1962) The identification of cephalopod ‘beaks’and the relationship between beak size and total bodyweight. Bull Br Mus (Nat Hist) Zool 8:419−480
Craig PC, Griffiths WB, Haldorson L, McElderry H (1982)Ecological studies of Arctic cod (Boreogadus saida) inBeaufort Sea coastal waters, Alaska. Can J Fish AquatSci 39:395−406
Davoren GK, Montevecchi WA (2003) Signals from seabirdsindicate changing biology of capelin stocks. Mar EcolProg Ser 258:253−261
Edwards M, Richardson A (2004) Impact of climate changeon marine pelagic phenology and trophic mismatch.Nature 430:881−884
Elliott KH, Woo KJ, Gaston AJ (2009) Specialization in mur-res: the story of eight specialists. Waterbirds 32:491−506
Gaston AJ (1991) Seabirds of Hudson Bay, Hudson Straitand adjacent waters. In: Croxall JP (ed) Seabird statusand conservation: a supplement. International Councilfor Bird Conservation, Cambridge, p 7−16
Gaston AJ, Bradstreet MSW (1993) Intercolony differencesin the summer diet of thick-billed murres in the easternCanadian Arctic. Can J Zool 71:1831−1840
Gaston AJ, Nettleship DN (1981) The thick-billed murres ofPrince Leopold Island. Environment Canada, Ottawa
Gaston AJ, Noble D (1985) The diet of thick-billed murres(Uria lomvia) in west Hudson Strait and northeast Hud-son Bay. Can J Zool 63:1148−1160
Gaston AJ, Smith SA (1987) Seabirds in the Cape Dyer ReidBay area of Cumberland Peninsula, Northwest Territo-ries. Can Field-Nat 101:49–55
Gaston AJ, Woo K (2008) Razorbills (Alca torda) follow sub-arctic prey into the Canadian Arctic: colonization resultsfrom climate change? Auk 125:939−942
Gaston AJ, Cairns DK, Elliot RD, Noble DG (1986) A naturalhistory of Digges Sound. Can Wildl Serv Rep Ser 46
Gaston AJ, Woo K, Hipfner JM (2003) Trends in forage fishpopulations in northern Hudson Bay since 1981, as deter-mined from the diet of nestling thick-billed murres Urialomvia. Arctic 56:227−233
Gaston AJ, Gilchrist HG, Mallory ML (2005a) Variation inice conditions has strong effects on the breeding ofmarine birds at Prince Leopold Island, Nunavut. Ecogra-phy 28:331−344
Gaston AJ, Gilchrist HG, Hipfner JM (2005b) Climatechange, ice conditions and reproduction in an Arcticnesting marine bird: Brunnich’s guillemot (Uria lomviaL.). J Anim Ecol 74:832−841
Gaston AJ, Bertram DF, Boyne AW, Chardine JW and others(2009) Changes in Canadian seabird populations andecology since 1970 in relation to changes in oceano -graphy and food webs. Environ Rev 17:267−286
Gotelli NJ, Colwell RK (2001) Quantifying biodiversity: pro-cedures and pitfalls in the measurement and comparisonof species richness. Ecol Lett 4:379−391
Gotelli N, Entsminger G (2009) EcoSim: null models soft-
ware for ecology, version 7. Acquired Intelligence &Kesey-Bear, Jericho, VT
Hawkins PAJ, Butler PJ, Woakes AJ, Gabrielsen G (1997)Heat increment of feeding in Brunnich’s guillemot Urialomvia. J Exp Biol 200:1757−1763
Holmquist C (1959) Problems on marine-glacial relicts onaccount of investigations on the genus Mysis. Berlingskaand Boktryckeriet, Lund
Horner R, Ackley SF, Dieckmann GS, Gulliksen B and oth-ers (1992) Ecology of sea ice biota 1. Habitat, termino -logy, and methodology. Polar Biol 12:417−427
IPCC (Intergovernmental Panel on Climate Change) (2007)Climate change 2007: the physical science basis. Sum-mary for policymakers. Cambridge University Press,Cambridge
Jackson S, Ryan PG (1986) Differential digestion rates ofprey by white-chinned petrels (Procellaris aequinoc-tialis). Auk 103:617−619
Klekowski RZ, Weslawski JM (eds) (1991) Atlas of themarine fauna of southern Spitsbergen, Vol 2. Institute ofOceanography, Gdansk
Leim A, Scott W (1966) Fishes of the Atlantic coast ofCanada, Vol 155. Fisheries Research Board of Canada,Ottawa
Muss BJ, Nielsen JG, Dahlstrom P, Nystrom BO (1999) Seafish. Scandinavian Fishing Year Book, Hedehusene
Piatt JF, Sydeman WJ, Wiese F (2007) A modern role forseabirds as indicators. Mar Ecol Prog Ser 352:199−204
Rekacewicz P, Bournay E (1998) Surface currents in HudsonBay, Hudson Strait and Foxe Basin. In: AMAP assess-ment report: Arctic pollution issues. Arctic Monitoringand Assessment Programme (AMAP), Oslo
Salomonsen F (1965) Geographical variation of fulmar (Ful-marus glacialis) and zones of marine environment in theNorth Atlantic. Auk 82:327–355
Scott JBT, Marshall GJ (2010) A step-change in the dateof sea-ice breakup in western Hudson Bay. Arctic 63:155−164
Soreide JE, Leu E, Berge J, Graeve M, Falk-Petersen S(2010) Timing of blooms, algal food quality and Calanusglacialis reproduction and growth in a changing Arctic.Glob Change Biol 16:3154−3163
Tee-van J (ed) (1948) Fishes of the western North Atlantic,Vol 3. Yale University, New Haven, CT
Tencati JR, Leung YM (1970) Taxonomic guides to Arcticzooplankton (I): amphipods of the central Arctic andeuphausiids of the Arctic basin and peripheral seas.Department of Biological Sciences, University of South-ern California, Los Angeles, CA
Tuck LM, Squires HJ (1955) Food and feeding habits ofBrunnich’s murre (Uria lomvia lomvia) on AkpatokIsland. J Fish Res Board Can 12:781−792
Vinogradov M, Volkov A, Semenova T (1996) Hyperiid am -phipods (Amphipoda, Hyperiidea) of the world’s oceans.Smithsonian Institution Libraries, Washington, DC
Submitted: September 30, 2010; Accepted: July 18, 2011 Proofs received from author(s): September 23, 2011