15 years of shipping accidents a review for wwf
TRANSCRIPT
8/12/2019 15 Years of Shipping Accidents a Review for Wwf
http://slidepdf.com/reader/full/15-years-of-shipping-accidents-a-review-for-wwf 1/56
15 Years of Shipping Accidents: A review for WWF
Southampton Solent University
Authors:
Nickie Butt(a)Professor David Johnson(b)
Dr.Kate Pike(c) Nicola Pryce-Roberts(d)
Natalie Vigar (e)
(a,,c,d,e)Southampton Solent Un iversity, School of M ari time and Technology, East Park
Terr ace, Southampton SO14 0YN, UK +44 (0)2380 319000
(b)OSPAR Commission/ Bonn Agreement, Victori a House, 37-63 Southampton Row,
London WC1B 4DA, UK
+44 (0) 20 7430 5200
8/12/2019 15 Years of Shipping Accidents a Review for Wwf
http://slidepdf.com/reader/full/15-years-of-shipping-accidents-a-review-for-wwf 2/56
2
Executive Summary
Shipping accidents, many involving spills of mineral oil, have been a catalyst forenvironmental protection regulation over the past 40 years. Environmental risk is
linked to the type and amount of oil and/or hazardous substances being carriedand the sensitivity of the marine area where any accident happens. A clear linkcan be made between environmental protection and shipping safety, with shippingaccidents, often the subject of dramatic media coverage, provoking a strongresponse from civil society and politicians.
2012 has been a significant year for shipping safety issues. The IMO usedMaritime Day (2012) to mark the 100 year anniversary of the sinking of the Titanicand as a watershed of safety at sea. Recent shipping incidents such as the HebeiSpirit and MV. Rena, and the 10
th year anniversary of the sinking of the Prestige
(2002) further highlight the need to identify and understand the factors contributing
to shipping accidents. These incidences among others renew the spotlight on themain causes of shipping accidents, including the role played by flag States.Despite the continual incr ease in the world’s shipping fleet a decrease in overallnumbers of shipping accidents has been seen over the last few decades. Whilstthe data shows that poorly performing flag States are still an associated factor,there are other criteria that also strongly contribute to accidents, including: vesselage, vessel type, area of operation and challenging sea states (linked to the mostcommon incident type – foundering) and vessel size. Behind these criteria thereare layers of administrative complexities within the shipping industry which areconnected to port and flag State control, flag registration and ratification of IMOconventions. Economic factors also have an impact on shipping safety, such asturn-around times and use of the minimum number of crew required to handle avessel which often has implications such as staff working whilst fatigued.
The key criteria contributing to shipping accidents have been researched for thisreport through an extensive review of the world’s casualty statistics over the past15 years and a review of all the port State Control Agreements and Memorandumsof Understanding. More specific examples were drawn from a review of currentliterature to provide context and the wider picture. The research statistics werethen verified through interviews with six expert industry stakeholders including amajor European shipping insurer, the MAIB, the IMO, Lloyds Register, a Naval
Architect and an English P and I club from the International Group. These criteria,and complexities associated with shipping accidents and the industry generallywere also examined, including insurance and underwriting requirements, the roleof IACS, port State control and class societies.
This is one of the first independent studies to look in detail at the collective dataassociated with shipping accidents. The report produces consolidated evidence offactors that have contributed to shipping accidents over the last 15 years. Thistime period includes maritime disasters such as the Prestige and Erika incidents,which subsequently provoked changes in maritime safety regulations, which are
8/12/2019 15 Years of Shipping Accidents a Review for Wwf
http://slidepdf.com/reader/full/15-years-of-shipping-accidents-a-review-for-wwf 3/56
3
graphically summarised in the report as a timeline. The report highlights areas ofconcern and contributory factors to shipping accidents as well as the generalimplications these incidents have on the marine environment. The report focusesin particular on the issues surrounding the role of flag States and the extent oftheir responsibilities with respect to vessel safety and the implementation of
international regulations.
The evidence confirms that the majority of accidents can be linked with oldervessels, a predominance of general cargo carrier accidents and a suite of worstperforming flags. By far the most common accident is that the ship founders.However it is also encouraging that an outcome of this report is also confirmationof an overall improvement in vessel safety standards and a reduction of shippingaccidents relative to the growth of the world fleet. This reflects the development oftechnology (e.g. electronic charts), the success of enforcement regimes (e.g. PortState control), and cooperative prevention efforts such as HELCOM Response(HELCOM, nd.) and the Bonn Agreement (Bonn Agreement, 2012).
Nevertheless accidents still occur regularly and the need to address and re-assessthe related underlying issues remains if future incidents are going to be avoided orreduced. Even small scale accidents in very sensitive environments can haveprofound environmental consequences (e.g. MV. Pallas). Climate changepredictions are likely to exacerbate the causes of foundering: storm surge,changing wind/wave climates, extreme weather events. Furthermore there is adanger of complacency in the absence of a recent ‘major’ accident and whilstmuch can be inferred from the accident statistics, such data can belie all mannerof near misses.
In light of the issues highlighted in the report, several recommendations are made.These include support for a more cohesive approach towards shipping safetythrough encouragement of ratification of IMO and environmental conventions;balancing port and flag State responsibilities; globalised, standardization ofreporting mechanisms associated with the collection of shipping accident data;transparency and access to this information; encouragement of data sharing andof best practice concerned with safety procedures within the industry; researchand collaborative work to keep older sea going vessels classed with IACS classsocieties. These recommendations are particularly pertinent in light of thecontinued growth of the worlds’ shipping fleet, as the economic crisis influencesthe number of ageing ships transporting high risk products and with the likelygrowth of vessels trading and operating in the sensitive Arctic region.
8/12/2019 15 Years of Shipping Accidents a Review for Wwf
http://slidepdf.com/reader/full/15-years-of-shipping-accidents-a-review-for-wwf 4/56
4
Contents
Executive Summary p. 21.0 Introduction p. 6
1.1 Purpose of the report p. 7
1.2 Data Sources p. 7 1.2.1 MOUs p. 81.2.2 Interviews p. 8
1.3 Flag States p. 9 1.3.1 What is a Flag of Convenience? p. 9 1.3.2 Open Registers p. 10 1.3.3 Why do Flag States exist at all? p. 11 1.3.4 What are the registration requirements
and formalities? p. 14 1.4 Port State Control Inspections p. 16
1.4.1 Regional Port State Control Agreements p. 16
1.4.2 Ship selection criteria p. 17 1.5 Hiding corporate identity p. 18 1.6 Shipping accidents as drivers of maritime legislation p. 18
2.0 Current Trends/ Data presentation p. 21 2.1 Growth of the world fleet p. 21 2.2 Total losses by incident type p. 24 2.3 Losses by geographical area p. 25 2.4 Losses by average age of vessel p. 292.5 Losses by vessel type p. 29 2.6 Losses by registration p. 302.7 Losses as a percentage of registered fleet p. 32 2.8 Information from the MOUs p. 33
3.0 Discussion and key messages from the data p. 40 3.1 Key messages p. 40 3.2 Weaknesses in the existing legal instruments: Should the
genuine link concept by tightened? p. 42 3.2.1 Should effective enforcement by flag
States be strengthened? p. 43 3.2.2 Enforcement by Port State Control p. 43
4.0 Recommendations p. 44 5.0 Conclusions p. 46
References p. 48
Appendix A p. 51 Appendix B p. 52 Appendix C p. 55
8/12/2019 15 Years of Shipping Accidents a Review for Wwf
http://slidepdf.com/reader/full/15-years-of-shipping-accidents-a-review-for-wwf 5/56
5
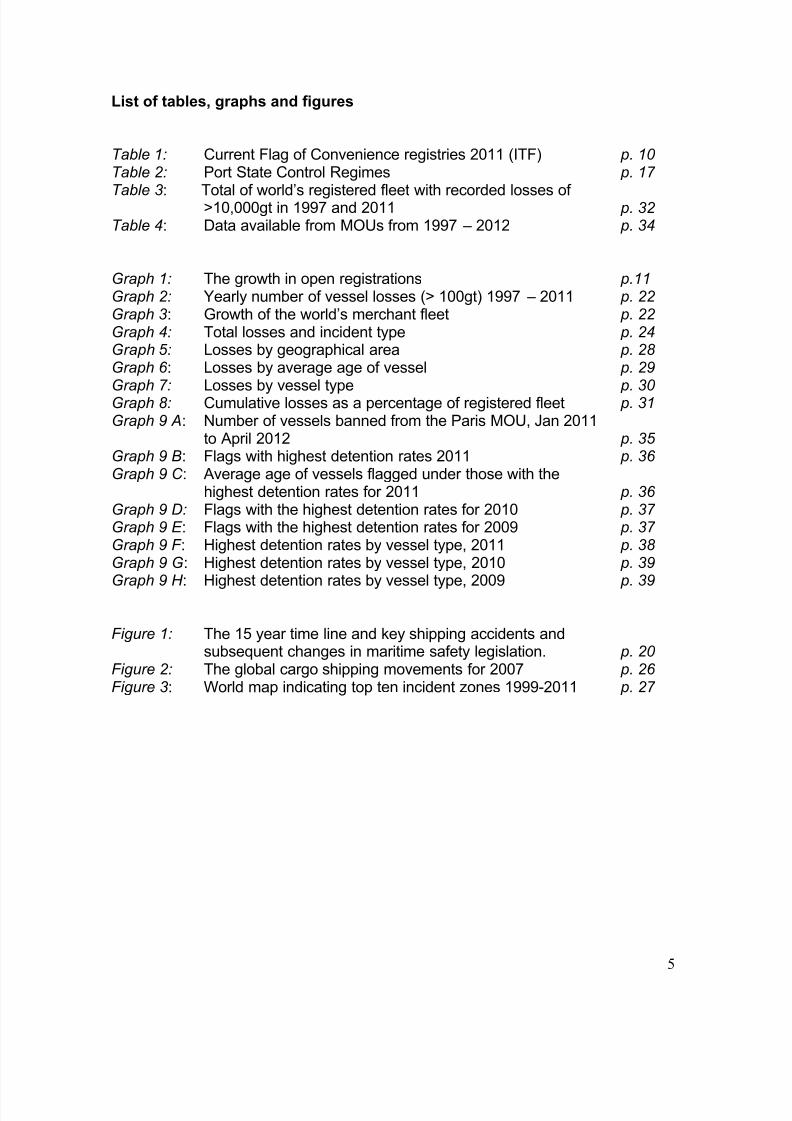
List of tables, graphs and figures
Table 1: Current Flag of Convenience registries 2011 (ITF) p. 10 Table 2: Port State Control Regimes p. 17
Table 3: Total of world’s registered fleet with recorded losses of>10,000gt in 1997 and 2011 p. 32 Table 4: Data available from MOUs from 1997 – 2012 p. 34
Graph 1: The growth in open registrations p.11 Graph 2: Yearly number of vessel losses (> 100gt) 1997 – 2011 p. 22 Graph 3: Growth of the world’s merchant fleet p. 22 Graph 4: Total losses and incident type p. 24 Graph 5: Losses by geographical area p. 28Graph 6 : Losses by average age of vessel p. 29
Graph 7: Losses by vessel type p. 30 Graph 8: Cumulative losses as a percentage of registered fleet p. 31 Graph 9 A: Number of vessels banned from the Paris MOU, Jan 2011
to April 2012 p. 35 Graph 9 B: Flags with highest detention rates 2011 p. 36Graph 9 C : Average age of vessels flagged under those with the
highest detention rates for 2011 p. 36 Graph 9 D: Flags with the highest detention rates for 2010 p. 37 Graph 9 E : Flags with the highest detention rates for 2009 p. 37 Graph 9 F : Highest detention rates by vessel type, 2011 p. 38 Graph 9 G: Highest detention rates by vessel type, 2010 p. 39 Graph 9 H : Highest detention rates by vessel type, 2009 p. 39
Figure 1: The 15 year time line and key shipping accidents andsubsequent changes in maritime safety legislation. p. 20
Figure 2: The global cargo shipping movements for 2007 p. 26 Figure 3: World map indicating top ten incident zones 1999-2011 p. 27

8/12/2019 15 Years of Shipping Accidents a Review for Wwf
http://slidepdf.com/reader/full/15-years-of-shipping-accidents-a-review-for-wwf 6/56
6
1.0 Introduction
Maritime safety is increasingly significant in a growing, global industry where majoraccidents have wide reaching impacts. Whilst large shipping accidents do stilloccur on the scale of the Prestige and the Erika, they are fortunately quite rare.
The overall industry picture is one of continual improvement with Lloyds ListCasualty Survey noting an 18% decrease in the number of accidents and theInternational Union of Marine Insurers recording a continuing downward trend bothin tonnage and the percentage of the world fleet lost since 1980 (over the past 30years). However it is important to keep the pressure focused on this trend forimprovement and clearly understand the factors which are most significant incontributing to losses of lives at sea. Despite the noted improvements, shippingaccidents still occur globally on a regular basis and can often be linked to a certainset of criteria such as certain geographical locations (highlighted by the ‘IncidentsMap’ – Figure 3). Whilst general improvements are apparent, a minority of flagStates and port States are still operating outside of the legislative requirements
resulting in sub-standard shipping slipping through the net and compromisinghuman life and the marine environment.
The steady growth in seaborne trade has meant an increase in global shippingmovements and tonnage. Vessel size has increased the need to benefit fromeconomies of scale, whilst manning levels on ships has tended to be reduced withthe introduction of labour saving and assistive technologies on board. At the sametime mariners are under pressure to meet deadlines imposed by shippingcompanies and to comply with a raft of legislation pertaining to safety, security andthe protection of the marine environment. The associated administrative burden isexpected to be delivered without any additional manning on board the vessels toaccount for the additional hours required to complete the tasks in order to complywith company and industry regulations. All these factors impose additionalstresses and can impact on the safe passage of a vessel (Butt, 2012).
Organisations such as the Marine Accident Investigation Bureau (MAIB) UK andthe European Maritime Safety Agency (EMSA) Europe and others, work to identifythe causes of these accidents and to share information with the industry so thatthey can learn from the experiences and recommendations made as a result. Dataquality and quantity associated with reporting shipping accidents and detentions isthe responsibility of the many organisations and flag States involved, and themember State in whose territorial waters the accident/ detention occurred. Thisbecomes more of an issue when several organisations or member States areinvolved who may not be collecting the same data or using the same criteria ormethods for recording the information.
The International Maritime Organisation (IMO) provides support to member andStates to encourage them to ratify their Conventions, although more needs to bedone in this area. The IMO process is demonstrably effective, but notably slow,
8/12/2019 15 Years of Shipping Accidents a Review for Wwf
http://slidepdf.com/reader/full/15-years-of-shipping-accidents-a-review-for-wwf 7/56
7
which has a bearing on safety response legislation following major accidents, asseen by the time line (Figure 1).
Flag State performance continues to play an important role in the quality andsafety of sea-going vessels around the world. Several organisations publish
guidelines on flag State performance. These include bodies such as theInternational Chamber of Shipping (ICS), the Maritime International SecretariatServices (MARISEC) and the International Transport Workers’ Federation (ITF).These guidelines provide indicators to enable performance measurements in anumber of key areas for example the enforcement of the international maritimetreaties, maritime security, seafarers’ welfare and movement of ships betweenflags (MARISEC, 2006). Yearly performance tables are produced using theseindicators to raise awareness of the best and worst performing flag States. Thefollowing two sections describe the role of flag States addressing the terminologyand definitions surrounding open registries. What becomes clear is the complexityof the subject matter and the lack of common reference points.
1.1 Purpose of the report
This report was initiated by WWF out of concern for shipping safety at sea and thenumber of shipping accidents impacting on human life, the environment and thereputation of the industry. The analysis of key shipping accident data over the past15 years was designed to highlight issues associated with those incidences, andother underlying factors, to flag State performance, and to demonstrate whereimprovements can be made. To help drive change and further improvementswithin the industry and put pressure in the areas that could make a difference.
1.2 Data sources
Various data sources have been consulted and cross-referenced to provide theevidence required for this report with a focus on the past 15 years, 1997 - 2012.Current data trends have been derived from the Institute of Shipping economicsand Logistics (ISL), Fairplay and the MOU data bases. The information regardingshipping incidents has been drawn from several sources including key reportssuch as the ‘Shipping Industry Flag State performance tables’, the ‘ShippingStatistics Year books’ and the ‘Annual Review of Maritime Transport’ amongothers. Additionally, expert interviews were conducted with six key organisationsassociated with shipping safety and accident response (See section 2.2). Theinterviews provided first hand professional evidence from the industry that supportthe data findings.
An issue of data reporting inconsistency became apparent during the researchwith different criteria used to record data from MOUs and from the ShippingStatistic Year Books. This issue is expanded upon in sections 3.8 and 4.1.
8/12/2019 15 Years of Shipping Accidents a Review for Wwf
http://slidepdf.com/reader/full/15-years-of-shipping-accidents-a-review-for-wwf 8/56
8
Additionally the data used for the report is only as good as the data mechanismsused to collect and report shipping accidents. Although there are continuousstrides made towards ensuring data consistency and quality, particularly driven bythe IMO, this area still has great room for improvement throughout the industry.
1.2.1 MOUs
The lists of vessel detentions were derived from the eight InternationalMemorandums of Understanding, as listed in Table 2 : Port State Control Regimes.Data provided by the MOUs varies considerably, including the number of yearsdata has been collected for and the requirements for reporting. For example theParis MOU was the first to be established in 1978 (Paris MOU, 2010). Thereforerecords of detentions have been kept longer in the regions this MOU covers.However, initially only the flags, the number of inspections with deficiencies, shiptype, and number of deficiencies were recorded. It was not until 2009 that many
additional headings were required (see Table 4). The increase in detailedreporting across the MOUs in more recent years indicates tighter regulations andreporting requirements and the need to improve general ship performance onmany levels. The information concerning the datasets held for the MOUs havebeen found on their relevant websites and databases held there. Whilst work istaking place to document data more consistently across the MOUs, this remains amajor task and one that IMO continually supports. Information from the MOUs ispresented in section 3.8.
1.2.2 Interviews
In order to determine an entirely current picture of the state of play in this field, sixsemi-structured interviews with experts working in associated shipping safety, andaccident response organisations were undertaken. The interviewees remainanonymous and the views expressed were their personal opinions based onextensive experience gained within their organisations and the shipping industrygenerally. They included the following:
The Marine Accident Investigation Branch (MAIB)
Lloyds Register
A major European shipping insurer
A naval architect A P and I Club, international group
The International Maritime Organisation (IMO)
8/12/2019 15 Years of Shipping Accidents a Review for Wwf
http://slidepdf.com/reader/full/15-years-of-shipping-accidents-a-review-for-wwf 9/56
9
1.3 Flag States
Whilst the ship owner is ultimately responsible for the safety of his/her ship it is theflag State that sets the standard. Safety standards are not determined at aninternational level, but minimum safety standards are. Some flag States choose to
adopt only the very minimum number of international conventions and it is theseStates that are attractive to those ship owners whose main concern is to cut costsand who care little for the safety of the seafarers employed on their vessels, theimpact their operations have on the marine environment and the poor reputationthey bring to an industry that has made great strides in cleaning up its act. Theyhave been labeled ‘f lags of convenience’, a derogatory term that is sometimesmis-used to refer to all open registries. Labeling all open registers as flags ofconvenience leads to confusion and fails to get to the heart of the matter. It is onlythrough identification of those flag States who, it can be demonstrated, have failedto fulfill their international obligations, that change can take place by activelyencouraging them to improve their standards. It is not possible to prevent a flag
State from operating a shipping registry, but it is possible to shine a spot light onthose who fail to engage in ensuring that ships that take their nationality, operatein a safe way.
1.3.1 What is a Flag of Convenience?
The terms ‘open register ’ and ‘flag of convenience’ are often usedinterchangeably, causing confusion, however they are not the same thing. The ITFdefined a flag of convenience (FOC) as, ‘Where beneficial ownership and controlof a vessel is found to lie elsewhere than in the country of the flag the vessel isflying, the vessel is considered as sailing under a flag of convenience ’ (ITF, 1974).Shipping registers can be either, national registers, second registers or registers.National registers, sometimes called ‘closed’ or ‘traditional’ registers, are operatedby flag States for use by their nations ships only. Open registers are open toforeign-owned vessels. Second registers, or ‘international’ registers as they areoften called, were created by traditional shipping nations as a response to thesignificant losses their national registers suffered as ships were moved out to openregisters. Second registers offer more operational freedom and exemption fromsome taxes. Countries such as Denmark, Norway, France and the UK operate tworegisters, one National and one International. Flag of convenience is a derogatorylabel, used by the ITF, given to those flag States against whom the allegation thatthey care little for safe shipping standards or seafarer welfare is frequently made.The International Maritime Organisation (IMO) does not refer to flags ofConvenience nor do they use the terms white, black or grey lists which are usedby port State MOUs. The International Transport Workers Federation (ITF) hasmaintained a running campaign against those registers that they categorise as aFOC. It should be noted that it is often the ITF ’s definition or classification that isused when identifying a particular flag State (See Table 1).
8/12/2019 15 Years of Shipping Accidents a Review for Wwf
http://slidepdf.com/reader/full/15-years-of-shipping-accidents-a-review-for-wwf 10/56
10
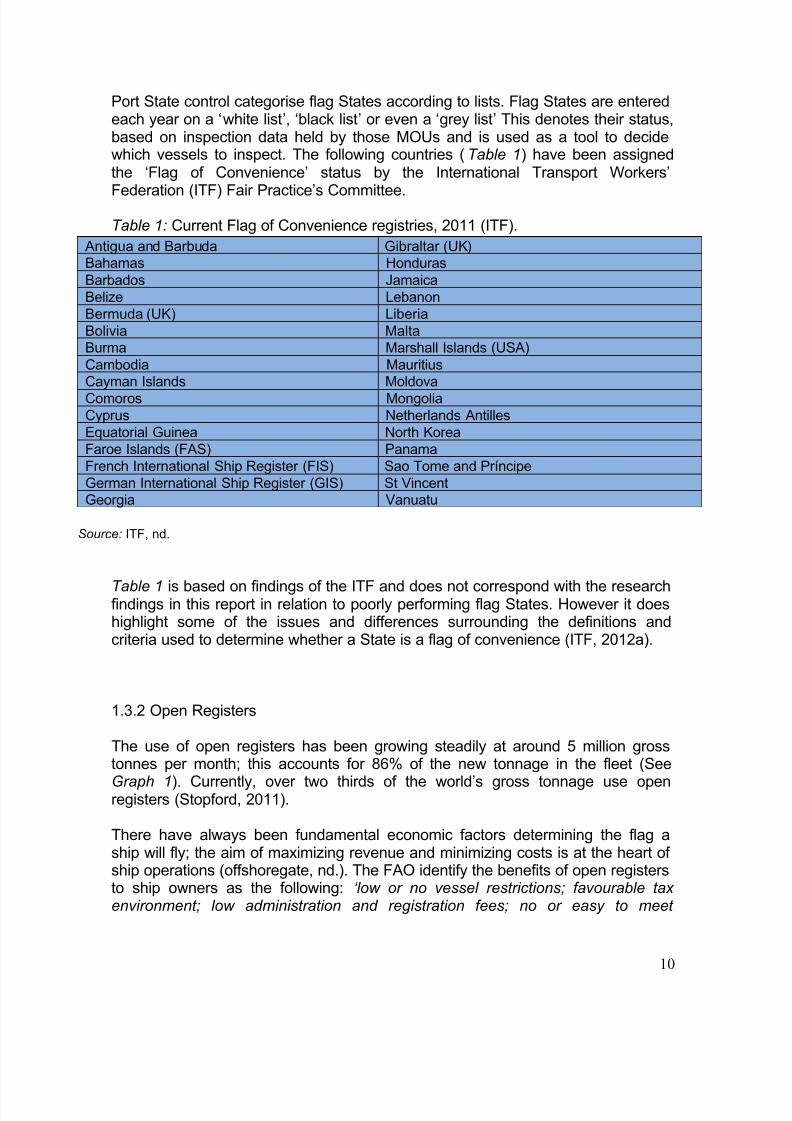
Port State control categorise flag States according to lists. Flag States are enteredeach year on a ‘white list’, ‘black list’ or even a ‘grey list’ This denotes their status,based on inspection data held by those MOUs and is used as a tool to decidewhich vessels to inspect. The following countries (Table 1) have been assignedthe ‘Flag of Convenience’ status by the International Transport Workers’
Federation (ITF) Fair Practice’s Committee.
Table 1: Current Flag of Convenience registries, 2011 (ITF).
Antigua and Barbuda Gibraltar (UK)Bahamas Honduras
Barbados Jamaica
Belize Lebanon
Bermuda (UK) Liberia
Bolivia MaltaBurma Marshall Islands (USA)
Cambodia MauritiusCayman Islands Moldova
Comoros Mongolia
Cyprus Netherlands Antilles
Equatorial Guinea North Korea
Faroe Islands (FAS) Panama
French International Ship Register (FIS) Sao Tome and Príncipe
German International Ship Register (GIS) St VincentGeorgia Vanuatu
Source: ITF, nd.
Table 1 is based on findings of the ITF and does not correspond with the researchfindings in this report in relation to poorly performing flag States. However it doeshighlight some of the issues and differences surrounding the definitions andcriteria used to determine whether a State is a flag of convenience (ITF, 2012a).
1.3.2 Open Registers
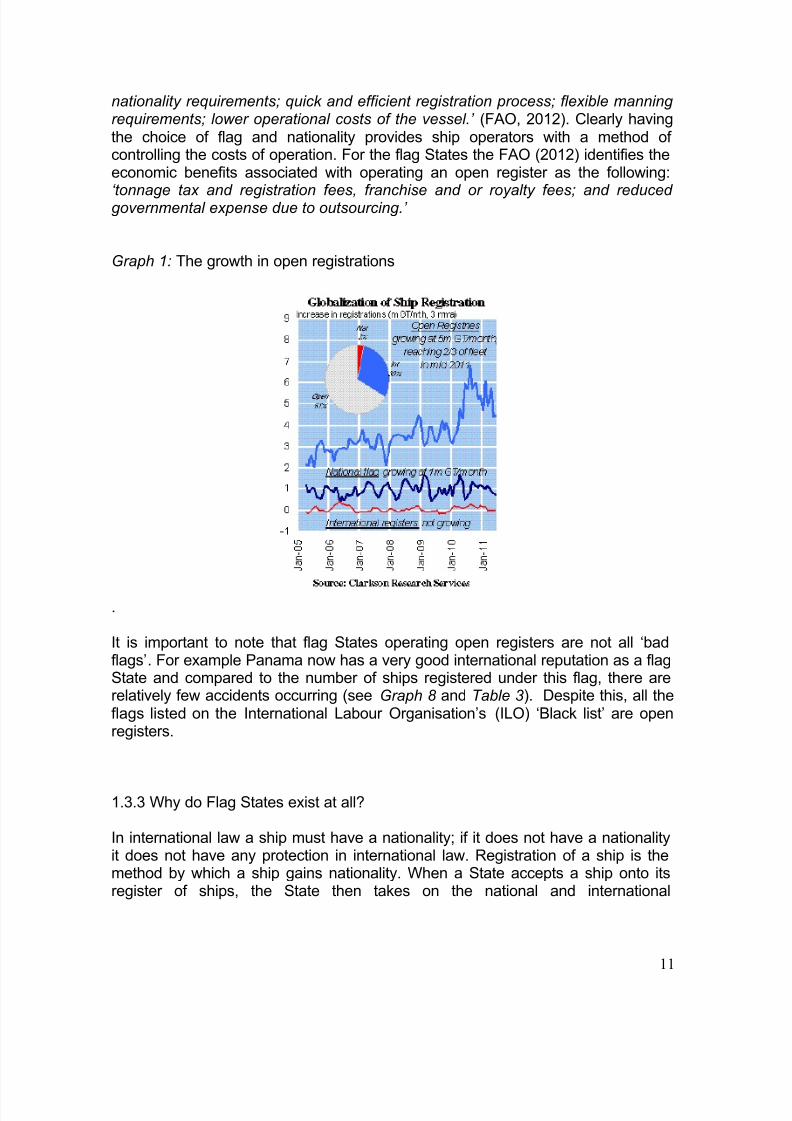
The use of open registers has been growing steadily at around 5 million grosstonnes per month; this accounts for 86% of the new tonnage in the fleet (See
Graph 1). Currently, over two thirds of the world’s gross tonnage use openregisters (Stopford, 2011).
There have always been fundamental economic factors determining the flag aship will fly; the aim of maximizing revenue and minimizing costs is at the heart ofship operations (offshoregate, nd.). The FAO identify the benefits of open registersto ship owners as the following: ‘low or no vessel restrictions; favourable taxenvironment; low administration and registration fees; no or easy to meet
8/12/2019 15 Years of Shipping Accidents a Review for Wwf
http://slidepdf.com/reader/full/15-years-of-shipping-accidents-a-review-for-wwf 11/56
11
nationality requirements; quick and efficient registration process; flexible manningrequirements; lower operational costs of the vessel.’ (FAO, 2012). Clearly havingthe choice of flag and nationality provides ship operators with a method ofcontrolling the costs of operation. For the flag States the FAO (2012) identifies theeconomic benefits associated with operating an open register as the following:
‘tonnage tax and registration fees, franchise and or royalty fees; and reducedgovernmental expense due to outsourcing.’
Graph 1: The growth in open registrations
.
It is important to note that flag States operating open registers are not all ‘badflags’. For example Panama now has a very good international reputation as a flagState and compared to the number of ships registered under this flag, there arerelatively few accidents occurring (see Graph 8 and Table 3). Despite this, all theflags listed on the International Labour Organisation’s (ILO) ‘Black list’ are openregisters.
1.3.3 Why do Flag States exist at all?
In international law a ship must have a nationality; if it does not have a nationalityit does not have any protection in international law. Registration of a ship is themethod by which a ship gains nationality. When a State accepts a ship onto itsregister of ships, the State then takes on the national and international
8/12/2019 15 Years of Shipping Accidents a Review for Wwf
http://slidepdf.com/reader/full/15-years-of-shipping-accidents-a-review-for-wwf 12/56
12
responsibilities required by a flag State in relation to that ship. Individual Statesmay decide for themselves the conditions of registration.
The United Nations Convention on the Law of the Sea (UNCLOS) 1982, Article 91
states:
“Nationality of ships
1. Every State shall fix the conditions for the grant of its nationality toships, for the registration of ships in its territory, and for the right to fly itsflag. Ships have the nationality of the State whose flag they are entitled tofly. There must exist a genuine link between the State and the ship.”
There has been a great deal of discussion about what exactly constitutes agenuine link. It is the vagueness of the term ‘genuine link’ that fuelled the
arguments of those who oppose the concept of open registers. The arguments stillexist but are of a more academic nature now. The practical issue is whether thoseStates that operate open registries meet the very clear obligations thatinternational law places on them. Article 94 of UNCLOS establishes thefundamental principles.
UNCLOS 1982, Article 94 states:
“Duties of the flag State
1. Every State shall effectively exercise its jurisdiction and control inadministrative, technical and social matters over ships flying its flag.
2. In particular every State shall:
(a) maintain a register of ships containing the names and particularsof ships flying its flag
(b) assume jurisdiction under its internal law over each ship flyingits flag and its master, officers and crew in respect ofadministrative, technical and social matters concerning the ship.
3. Every State shall take such measures for ships flying its flag as arenecessary to ensure safety at sea ……
4. Such measures shall include those necessary to ensure:
(a) that each ship, before registration and thereafter at appropriateintervals, is surveyed by a qualified surveyor of ships … (b) that each ship is in the charge of a master and officers who
8/12/2019 15 Years of Shipping Accidents a Review for Wwf
http://slidepdf.com/reader/full/15-years-of-shipping-accidents-a-review-for-wwf 13/56
13
possess appropriate qualifications … (c) that the master, officers and, to the extent appropriate, the creware fully conversant with and required to observe the applicableinternational ….
5. In taking the measures called for in paragraphs 3 and 4 each State isrequired to conform to generally accepted international regulations, procedures and practices and to take any steps which may be necessary tosecure their observance.
6. A State which has clear grounds to believe that proper jurisdictionand control with respect to a ship have not been exercised may report the factsto the flag State. Upon receiving such a report, the flag State shall investigatethe matter and, if appropriate, take any action necessary to remedy thesituation.
7. Each State shall cause an inquiry to be held by or before a suitablyqualified person … into every marine casualty or incident ofnavigation on the high seas involving a ship flying its flag and causing lossof life or serious injury to nationals of another State or serious damage toships or installations of another State or to the marine environment.”
Whilst Article 94 of UNCLOS is clear in detailing the obligations of a flag State themeans by which flag States must achieve these obligations is less clear. Article94(5) establishes the link between municipal and international law. It provides theduty to “take any steps which may be necessary ” to “conform to generallyaccepted international regulations”.
The “generally accepted international regulations” are those concerning safety oflife at sea, standards of training of seafarers, prevention of pollution, prevention ofcollisions, and the provision and maintenance of communications by radio.
Flag States evidence their compliance with these international regulations bycarrying out surveys and issuing certificates to ships on their registry. Flag Stateshave the responsibility in international law for carrying out these functions, but inpractice may sub-contract the administrative and technical functions to otherorganisations such as classification societies. In sub-contracting the administrativeand technical functions they do not sub-contract the obligation of enforcement,they retain this responsibility. Article 217 of UNCLOS is clear that the enforcementof international regulations is the responsibility of the flag State:
“Article 217
Enforcement by flag States
1. States shall ensure compliance by vessels flying their flag or of their
8/12/2019 15 Years of Shipping Accidents a Review for Wwf
http://slidepdf.com/reader/full/15-years-of-shipping-accidents-a-review-for-wwf 14/56
14
registry with applicable international rules and standards, established throughthe competent international organization or general diplomatic conference…. FlagStates shall provide for the effective enforcement of such rules, standards,laws and regulations, irrespective of where a violation occurs.”
It is the approach that some flag States take in discharging their duty ofenforcement that attracts the less than scrupulous ship owner and has been asubject of contention for many years.
1.3.4 What are the registration requirements and formalities?
It is very difficult to provide a concise overview of the registration requirementsand formalities as they vary from State to State. What is clear is that some Statesrequire a minimum level of information and registration can be affected in as littleas one day, and some States have a more robust system requiring a much greater
degree of information and carry out a series of cross checks on that informationincluding carrying out a survey of the ship.
There is no legal obligation for port States to carry out inspections on foreignflagged vessels entering their waters. States may choose to inspect visitingvessels for a variety of reasons. The scope of operations of a body such as the USCoast Guard is wide and it is driven wholly by domestic US law. Similarly thoseStates who are members of the European Union may find that their practices inthis area are driven both by internal policy and externally by European directives;these are often in response to accidents or incidents, for example, the sinking ofthe MV. Erika in December 1999 was the catalyst for many changes at Europeanlevel. Aside from these internal drivers States may opt to cooperate with eachother regionally. Memorandums of Understanding may be signed and a concertedeffort of inspections, according to agreed criteria, is carried out by the memberStates.
The response of the international community to those flag States who fail toensure that ships on their registry meet the minimum of standards was to put inplace a system whereby foreign flagged vessels were inspected in ports theyvisited; this is referred to as port State control (PSC). It goes without saying that ifall flag States met their international obligations PSC would not be necessary.Whilst PSC has proved highly effective in identifying and to some degreeeliminating sub-standard shipping it should never be seen as alternative toensuring flag States meet their obligations.
The right of a port State to carry out inspection on a foreign flagged vessel can befound in Article 218 of UNCLOS III, it states:
“Article 218
8/12/2019 15 Years of Shipping Accidents a Review for Wwf
http://slidepdf.com/reader/full/15-years-of-shipping-accidents-a-review-for-wwf 15/56
15
Enforcement by port States
1. When a vessel is voluntarily within a port or at an off-shore terminal of a State,that State may undertake investigations and, where the evidence so warrants,institute proceedings in respect of any discharge from that vessel outside the
internal waters, territorial sea or exclusive economic zone of that State in violationof applicable international rules and standards established through the competentinternational organization or general diplomatic conference.
2. No proceedings pursuant to paragraph 1 shall be instituted in respect of adischarge violation in the internal waters, territorial sea or exclusive economiczone of another State unless requested by that State, the flag State, or a Statedamaged or threatened by the discharge violation, ….
3. When a vessel is voluntarily within a port or at an off-shore terminal of a State,that State shall, as far as practicable, comply with requests from any State for
investigation of a discharge violation ….
4. The records of the investigation carried out by a port State pursuant to thisarticle shall be transmitted upon request to the flag State or to the coastal State …Reference to “applicable international rules and standards established through thecompetent international organization or general diplomatic conference” isaccepted as referring to the key International Maritime Organisation (IMO)instruments such as;
International Convention on Load Lines 1966 (LL 66),
International Convention on Tonnage Measurement of Ships 1969 (TONNAGE69),
International Convention for the Safety of Life at Sea 1974 (SOLAS 74),
International Convention for the Prevention of Pollution from Ships, as modified bythe Protocol of 1978 relating thereto (MARPOL 73/78) and
International Convention on Standards of Training, Certification and Watchkeeping for Seafarers 1978 (STCW 78)
International Labour Organisations (ILO) Convention 147, Merchant Shipping(Minimum Standards) Convention 1976.
ILO’s Maritime Labour Convention 2006 (ratified August 2012, in force August2013).
8/12/2019 15 Years of Shipping Accidents a Review for Wwf
http://slidepdf.com/reader/full/15-years-of-shipping-accidents-a-review-for-wwf 16/56
16
In order to maintain a consistency across port States, IMO resolutions have beenadopted and the IMO introduced guidelines on how port State inspections shouldbe carried out.
1.4 Port State Control Inspections
Inspections may be undertaken for a number of reasons:i. On the initiative of the port State authorities,
ii. At the request of a third party, or
iii. As result of information received by a member of the ship’s crew, a
professional body or trade union.
The port State control officer (PSCO) on boarding a ship will inspect the ships ’ certificates and documents. If the certificates are valid and the documentssatisfactory, and the general impression of the ship meets the PSCO’sexpectations, the inspection will concentrate on any reported or observed
deficiencies. If the initial inspection reveals deficiencies and the PSCO has cleargrounds to believe that the ship, its equipment or crew do not meet acceptablestandards, then a more detailed inspection will take place.
In theory, but perhaps not always in practice, all deficiencies must be rectified priorto the ship departing the port. However, if the ship is either unsafe to proceed tosea or the deficiencies on the ship are so serious that they will have to be rectifiedbefore the ship sails, the ship will be detained, irrespective of the time the ship isscheduled to stay in port. It should be noted that PSC cannot compel a ship toaffect repairs in a particular port, but it can issue a formal prohibition of a shipcontinuing an operation due to established deficiencies which, individually or
together, would render the continued operation hazardous. The flag State will benotified in writing of the outcome of the inspection and includes a report ofinspection.
1.4.1 Regional Port State Control Agreements
The coordination of port State control activities by groups of port States workingunder a Memorandum Of Understanding (MOU) has enabled a more unifiedapproach to inspection. The maritime authorities of the member States can avoid,or target, ships which have been inspected by fellow members in proceeding
months. There are 10 port State control regimes (see Table 2 ), eight of which areMOUs, one of which is an Agreement (The Acuerdo de Vina del Mar Agreement,Latin America) and The US Coast Guard, which operates their own regime as astand-alone Authority but do cooperate with other maritime authorities.

8/12/2019 15 Years of Shipping Accidents a Review for Wwf
http://slidepdf.com/reader/full/15-years-of-shipping-accidents-a-review-for-wwf 17/56
17
Table 2: Port State Control Regimes1.
MOU Covering Date Effective
US coastguard port Statecontrol
The USA 1975
Paris European coastal States andthe North Atlantic basin fromNorth America to Europe
1978
Acuerdo de Viña del Mar Agreement
Latin America 1992
Tokyo Asia and the Pacific 1994
Caribbean Caribbean 1996
Mediterranean Mediterranean 1997
Indian Ocean Indian Ocean 1999
Abuja West and Central Africa 1999
Black Sea The Black Sea region 2000
Riyadh Arab States of the Gulf 2004Source: Original
1.4.2 Ship selection criteria
The selection criteria for inspections, whilst following similar principles, differs fromMOU to MOU; each however sets a minimum percentage of vessels that memberauthorities will inspect. Along with the practical steps of detaining sub-standard
ships MOU’s collect and collate data on ships. This data is shared betweenmember States and made publically available. This enables organisations such asclassification societies, ship owner associations and the International TransportWorkers Federation to coordinate their activities
The data collected is crucial to the MOU’s wor k in classifying ships and their flags;this enables them to prioritise and target those ships that are registered with flagStates that are known to have a poor record of inspection and enforcement of theirown ships, a much more efficient use of PSC resources. The Paris MOU was thefirst to publish three lists of flag States performance (See Appendix B).
i. The “White List” indicating the quality flags; ii. The “Grey List” for flags with an average PSC score; and
iii. The “Black List” for flags with a consistent poor safety record
The ‘White, Grey and Black List’ presents the full spectrum, from quality flags toflags with a poor performance that are considered high or very high risk. It is
1 See Appendix A for table of MOU member countries
8/12/2019 15 Years of Shipping Accidents a Review for Wwf
http://slidepdf.com/reader/full/15-years-of-shipping-accidents-a-review-for-wwf 18/56
18
based on the total number of inspections and detentions over a 3-year rollingperiod for flags with at least 30 inspections in the period. The Tokyo MOU lateradopted the same methodology as the Paris MOU for the assessment ofperformance of flags. It is a standard formula for statistical calculations in whichcertain values are fixed in accordance with the agreement of the Port State
Control Committee of the MOU (Paris MOU, 2012).
There is no list identifying those States actively involved in port State control. Themember States of the various MOUs are clearly visible in their activities,membership is public and annual reports are published. Individual State activity onthe scale of the US, who are a not member of an MOU, can be clearly identified.However, the level of engagement by States who are not members of an MOU isharder to identify, as is the criteria by which they select vessels for inspection. Itshould not be concluded that PSC is universally carried out across the globe.
1.5 Hiding Corporate Identity
Ensuring effective implementation and enforcement of international maritimeconventions and the compliance of owners and ships, is a major challenge for flagStates. Despite this many flag States do not require disclosure of beneficialownership as a condition for registering ships and some actively advertise secrecyas a benefit of registering ships to their flag (Gianni, 2008).
In 2003, the Maritime Transport Committee of the OECD scrutinised shipregistration provisions of various ship registers. The report was designed toassess the possibilities available to beneficial owners, who for one reason oranother might wish to remain anonymous. The Report of the UN SecretaryGeneral’s Consultative Group on Flag State Implementation (2004) highlights thekey points from the OECD Report as follows. ‘It is very easy, and c omparativelyinexpensive, to establish a complex web of corporate entities to provide veryeffective cover to the identities of beneficial owners who do not want to be known’
(Gianni, 2008). The mechanisms to invoke anonymity are legally available in many jurisdictions and can provide an international business corporation that canconduct business nearly anywhere in the world. For the reasons identified, thisreport does not look at shipping companies or organisations.
1.6 Shipping accidents as drivers of maritime legislation
It has long been recognized that one of the key measures of improving safety atsea is to develop, implement and enforce international regulations. History hasdemonstrated that large-scale shipping accidents serve as key drivers of change,which is often manifested in new or amended safety regulation (Charlebois, 2012).
8/12/2019 15 Years of Shipping Accidents a Review for Wwf
http://slidepdf.com/reader/full/15-years-of-shipping-accidents-a-review-for-wwf 19/56
19
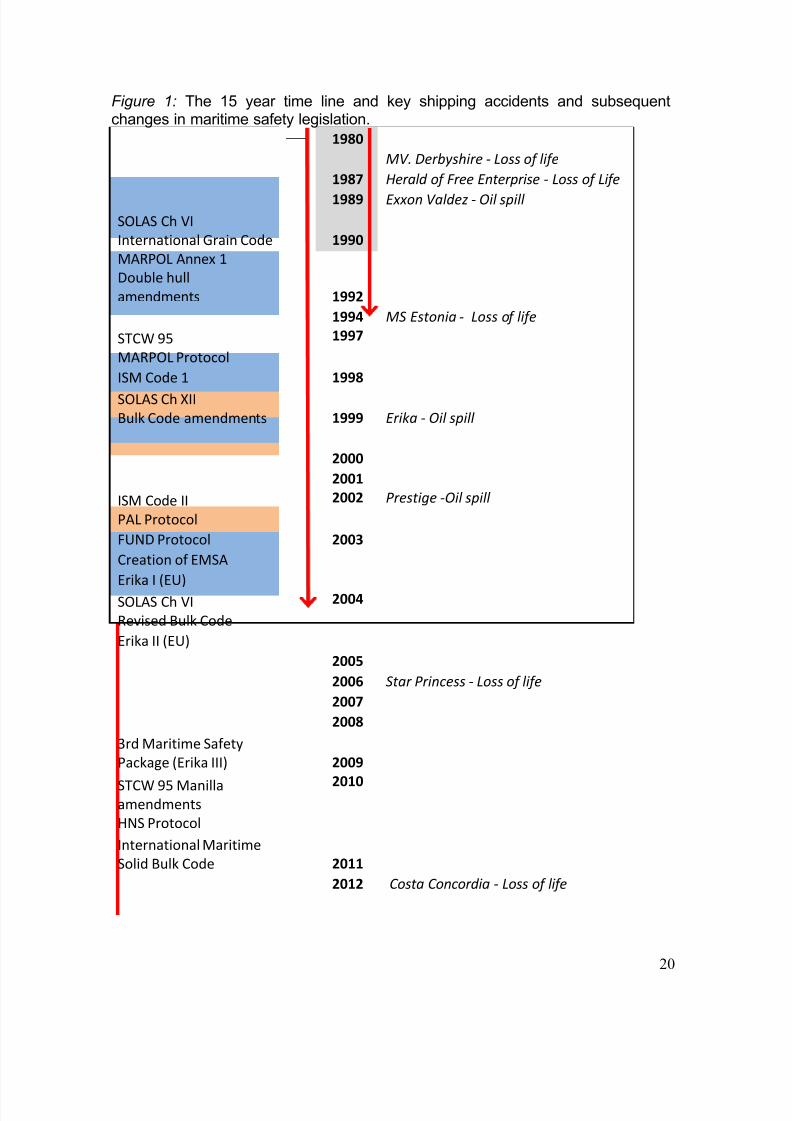
The timeline in Figure 1 highlights the drivers for change through the introductionof new or updated legislation attributed to major incidents or a series of incidentsfocusing on the past 15 years. For example, the Safety of Life at Sea (SOLAS)Convention traces its origins to the loss of the Titanic (1912) with significantupdates in more recent years, such as the introduction of the ISM Code (Chapter
IX of SOLAS) after the lessons learnt from the loss of the Herald of FreeEnterprise in 1987. Similarly changes have taken place to regulations governingthe operation of dry bulk carriers and tankers, including inter alia the amendedBulk Code, amendments to MARPOL Annex I, and the introduction of the USlegislation such as the Oil Pollution Act 1990 (OPA ’90). These were triggered bythe large number of dry bulk carrier losses in the 1980s, most notably theDerbyshire in 1980, and the grounding of the Exxon Valdez oil tanker in 1989.
This retrospective amendment of legislation continues; the loss of the MV. Erika in1999 saw changes to the operation of tankers and new European Regulations.The serious fire on the cruise ship the Star Princess in 2006 brought changes to
fire regulations. It remains to be seen what affect the cruise ship the CostaConcordia (2012) will have after such a serious loss of life. Other contributingfactors to improved vessel safety and reduction in shipping accidents should alsobe considered such as the introduction of the International Safety Management(ISM) code (adopted 1994), the increasing role of port State control with regard tovessel inspections and detentions and the increasing role of corporate socialresponsibility (CSR) for shipping companies.
8/12/2019 15 Years of Shipping Accidents a Review for Wwf
http://slidepdf.com/reader/full/15-years-of-shipping-accidents-a-review-for-wwf 20/56
20
Figure 1: The 15 year time line and key shipping accidents and subsequentchanges in maritime safety legislation.
1980
MV. Derbyshire - Loss of life
1987 Herald of Free Enterprise - Loss of Life
1989 Exxon Valdez - Oil spill
SOLAS Ch VI
International Grain Code 1990
MARPOL Annex 1
Double hull
amendments 1992
1994 MS Estonia - Loss of life
STCW 95
MARPOL Protocol
1997
ISM Code 1 1998
SOLAS Ch XII
Bulk Code amendments 1999 Erika - Oil spill
2000
2001
ISM Code II
PAL Protocol
2002 Prestige -Oil spill
FUND Protocol 2003
Creation of EMSA
Erika I (EU)
SOLAS Ch VI
Revised Bulk Code
2004
Erika II (EU)
2005
2006 Star Princess - Loss of life
2007
2008
3rd Maritime Safety
Package (Erika III) 2009
STCW 95 Manillaamendments
HNS Protocol
2010
International Maritime
Solid Bulk Code 2011
2012 Costa Concordia - Loss of life
8/12/2019 15 Years of Shipping Accidents a Review for Wwf
http://slidepdf.com/reader/full/15-years-of-shipping-accidents-a-review-for-wwf 21/56
21
2.0 Current trends and data presentation
The following graphs and tables summarise factual information held in the publicdomain from the past 15 years, which provide information that can help inassessing the factors which are more likely to contribute to shipping accidents. As
with any statistics it is important to use these tables and graphs with care and takeinto consideration other underlying issues at play, including the supportingevidence provided by the interviews. The graphs have been grouped accordingly:
Growth of the world fleet
Losses by incident type
Losses by geographical area
Losses by average age of vessel
Losses by vessel type
Losses by registration
Losses as a percentage of registered fleet
Information from the MOUs
Losses, unless otherwise stated, in this research refer sea going propelledmerchant ships ‘not less that 100gt which as a result of being a marine casualty[have] ceased to exist, are irrecoverable, or have subsequently been broken up’ (World casualty statistics, 2011).
2.1 Growth of the world fleet
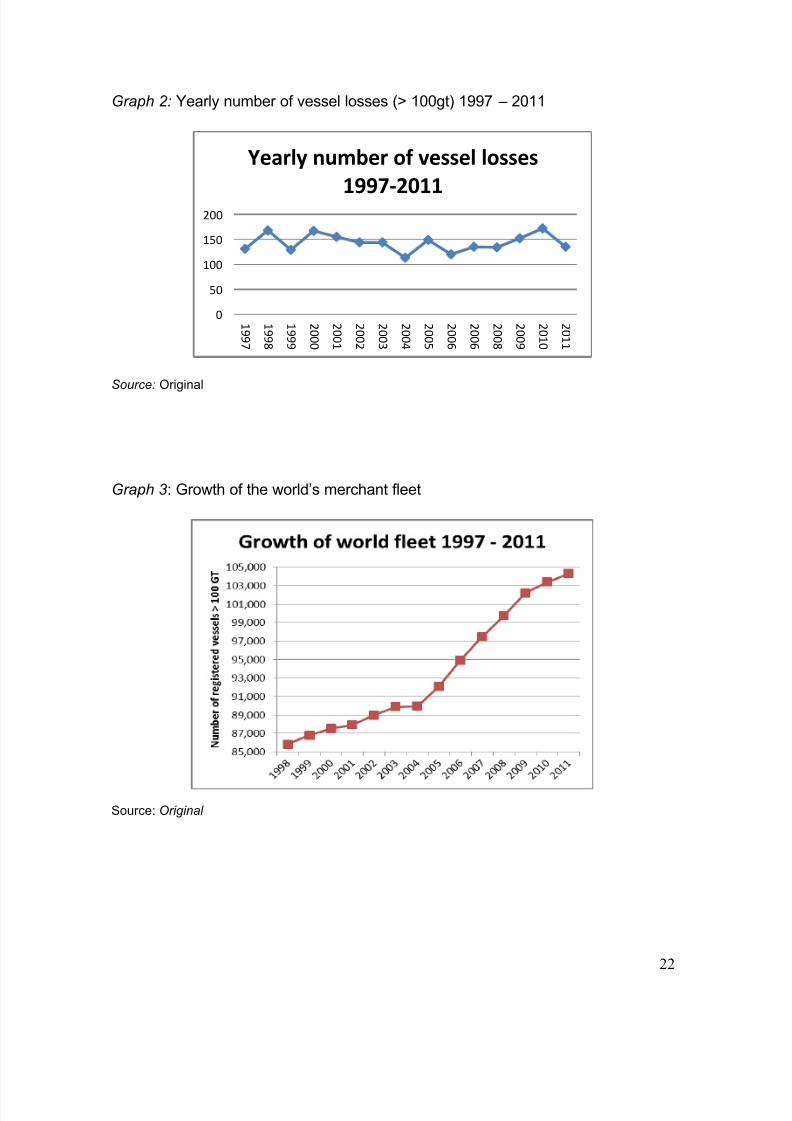
The total number of vessel losses in Graph 2 shows a decrease in numbers for2011 following a peak the previous year. These figures need to be considered inconjunction with the steady increase of the world’s merchant fleet (over 100gt)which has seen a rise of an additional 15,846 vessels over the past decade,representing a growth of 18.1%, (see Graph 3). This demonstrates an overalldecline in the number of vessels lost (World casualty Statistics 1997 - 2011).Despite this encouraging statistic it is clear that the number of global vessel losseson an annual basis is still consistently far too high, indicating a requirement tounderstand and take action against the root causes of such accidents.
8/12/2019 15 Years of Shipping Accidents a Review for Wwf
http://slidepdf.com/reader/full/15-years-of-shipping-accidents-a-review-for-wwf 22/56
22
Graph 2: Yearly number of vessel losses (> 100gt) 1997 – 2011
0
50
100
150
200
1 9 9 7
1 9 9 8
1 9 9 9
2 0 0 0
2 0 0 1
2 0 0 2
2 0 0 3
2 0 0 4
2 0 0 5
2 0 0 6
2 0 0 6
2 0 0 8
2 0 0 9
2 0 1 0
2 0 1 1
Yearly number of vessel losses
1997-2011
Source: Original
Graph 3: Growth of the world’s merchant fleet
Source: Original

8/12/2019 15 Years of Shipping Accidents a Review for Wwf
http://slidepdf.com/reader/full/15-years-of-shipping-accidents-a-review-for-wwf 23/56
23
Other contributing factors to improved vessel safety and reduction in shippingaccidents should also be considered, such as the introduction of the InternationalSafety Management (ISM) code (adopted 1994), the increasing role of port Statecontrol with regard to vessel inspections and detentions and the importance ofcorporate social responsibility (CSR) within most shipping companies. Although
this data shows a generally improving trend in shipping accidents, there are stillsignificant numbers of incidences which can be attributed to factors affecting thevessel itself, such as its age and type, through to the vessel’s geographical area ofoperation, as discussed below.
8/12/2019 15 Years of Shipping Accidents a Review for Wwf
http://slidepdf.com/reader/full/15-years-of-shipping-accidents-a-review-for-wwf 24/56
24
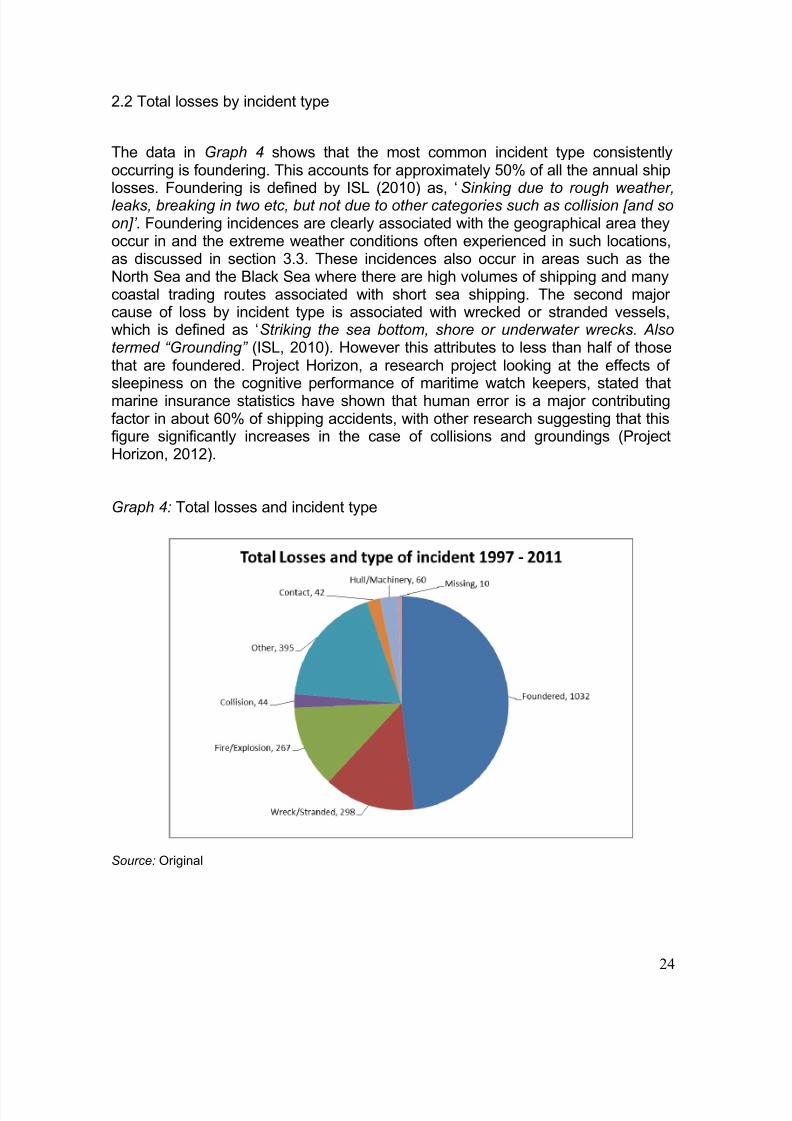
2.2 Total losses by incident type
The data in Graph 4 shows that the most common incident type consistentlyoccurring is foundering. This accounts for approximately 50% of all the annual shiplosses. Foundering is defined by ISL (2010) as, ‘Sinking due to rough weather,leaks, breaking in two etc, but not due to other categories such as collision [and soon] ’. Foundering incidences are clearly associated with the geographical area theyoccur in and the extreme weather conditions often experienced in such locations,as discussed in section 3.3. These incidences also occur in areas such as theNorth Sea and the Black Sea where there are high volumes of shipping and manycoastal trading routes associated with short sea shipping. The second majorcause of loss by incident type is associated with wrecked or stranded vessels,which is defined as ‘Striking the sea bottom, shore or underwater wrecks. Alsotermed “Grounding” (ISL, 2010). However this attributes to less than half of thosethat are foundered. Project Horizon, a research project looking at the effects ofsleepiness on the cognitive performance of maritime watch keepers, stated thatmarine insurance statistics have shown that human error is a major contributingfactor in about 60% of shipping accidents, with other research suggesting that thisfigure significantly increases in the case of collisions and groundings (ProjectHorizon, 2012).
Graph 4: Total losses and incident type
Source: Original
8/12/2019 15 Years of Shipping Accidents a Review for Wwf
http://slidepdf.com/reader/full/15-years-of-shipping-accidents-a-review-for-wwf 25/56
25
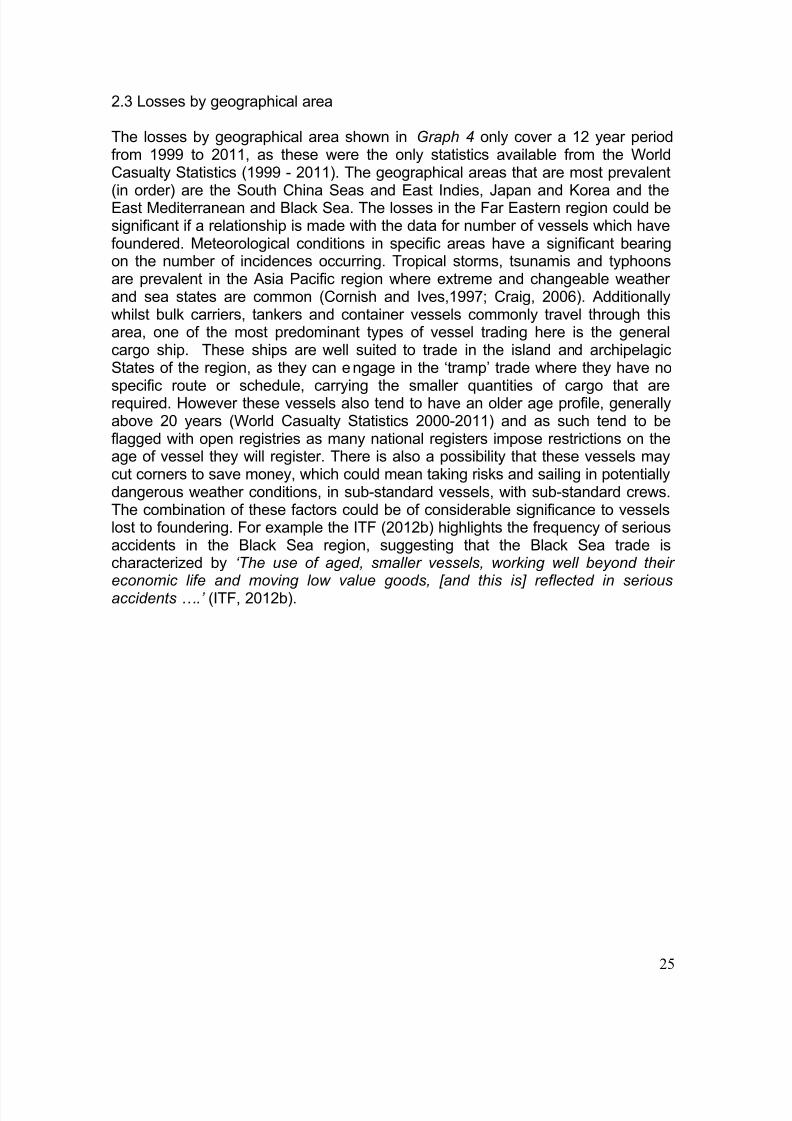
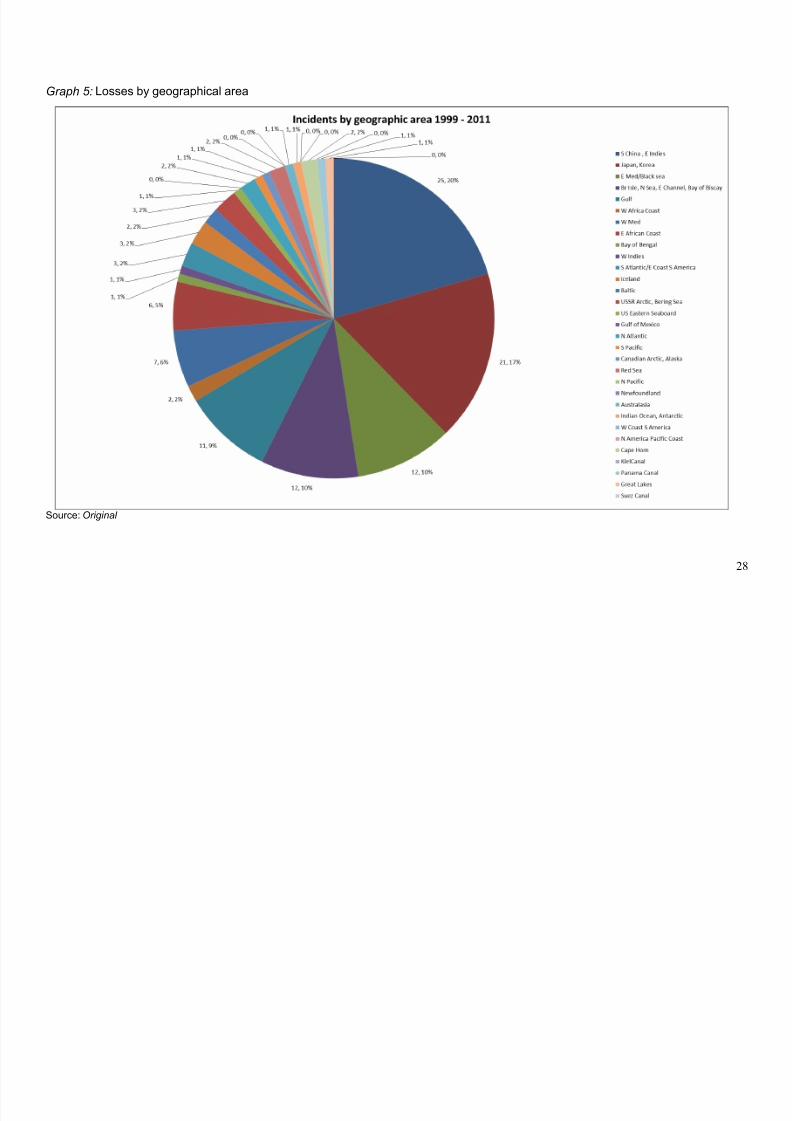
2.3 Losses by geographical area
The losses by geographical area shown in Graph 4 only cover a 12 year periodfrom 1999 to 2011, as these were the only statistics available from the WorldCasualty Statistics (1999 - 2011). The geographical areas that are most prevalent
(in order) are the South China Seas and East Indies, Japan and Korea and theEast Mediterranean and Black Sea. The losses in the Far Eastern region could besignificant if a relationship is made with the data for number of vessels which havefoundered. Meteorological conditions in specific areas have a significant bearingon the number of incidences occurring. Tropical storms, tsunamis and typhoonsare prevalent in the Asia Pacific region where extreme and changeable weatherand sea states are common (Cornish and Ives,1997; Craig, 2006). Additionallywhilst bulk carriers, tankers and container vessels commonly travel through thisarea, one of the most predominant types of vessel trading here is the generalcargo ship. These ships are well suited to trade in the island and archipelagicStates of the region, as they can engage in the ‘tramp’ trade where they have no
specific route or schedule, carrying the smaller quantities of cargo that arerequired. However these vessels also tend to have an older age profile, generallyabove 20 years (World Casualty Statistics 2000-2011) and as such tend to beflagged with open registries as many national registers impose restrictions on theage of vessel they will register. There is also a possibility that these vessels maycut corners to save money, which could mean taking risks and sailing in potentiallydangerous weather conditions, in sub-standard vessels, with sub-standard crews.The combination of these factors could be of considerable significance to vesselslost to foundering. For example the ITF (2012b) highlights the frequency of seriousaccidents in the Black Sea region, suggesting that the Black Sea trade ischaracterized by ‘ The use of aged, smaller vessels, working well beyond theireconomic life and moving low value goods, [and this is] reflected in seriousaccidents ….’ (ITF, 2012b).
8/12/2019 15 Years of Shipping Accidents a Review for Wwf
http://slidepdf.com/reader/full/15-years-of-shipping-accidents-a-review-for-wwf 26/56
26
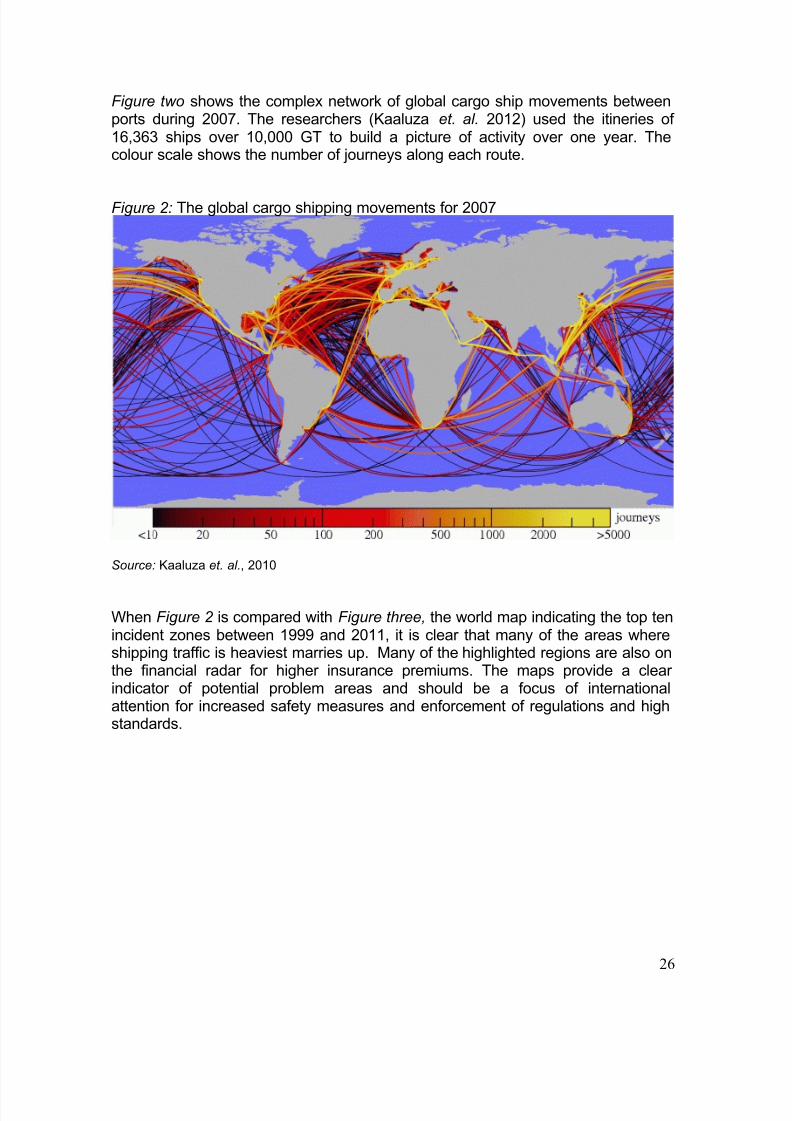
Figure two shows the complex network of global cargo ship movements betweenports during 2007. The researchers (Kaaluza et. al. 2012) used the itineries of16,363 ships over 10,000 GT to build a picture of activity over one year. Thecolour scale shows the number of journeys along each route.
Figure 2: The global cargo shipping movements for 2007
Source: Kaaluza et. al., 2010
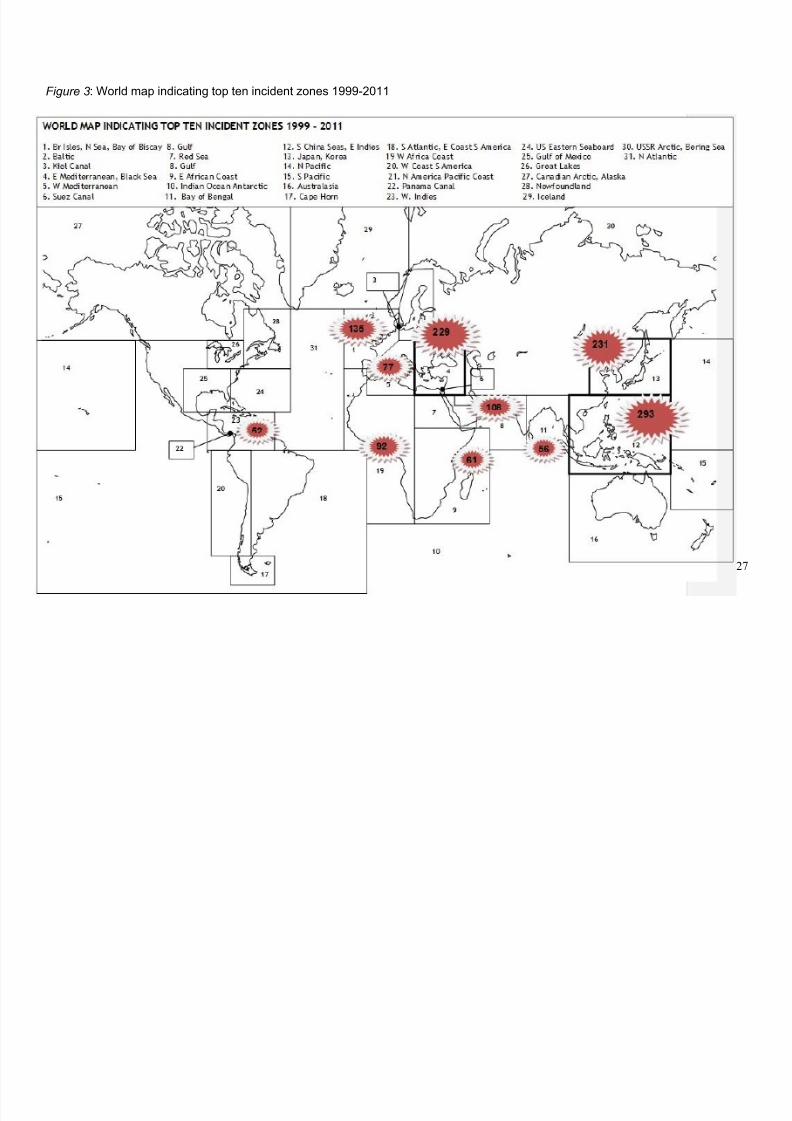
When Figure 2 is compared with Figure three, the world map indicating the top tenincident zones between 1999 and 2011, it is clear that many of the areas whereshipping traffic is heaviest marries up. Many of the highlighted regions are also onthe financial radar for higher insurance premiums. The maps provide a clearindicator of potential problem areas and should be a focus of internationalattention for increased safety measures and enforcement of regulations and highstandards.
8/12/2019 15 Years of Shipping Accidents a Review for Wwf
http://slidepdf.com/reader/full/15-years-of-shipping-accidents-a-review-for-wwf 27/56
2
Figure 3: World map indicating top ten incident zones 1999-2011
8/12/2019 15 Years of Shipping Accidents a Review for Wwf
http://slidepdf.com/reader/full/15-years-of-shipping-accidents-a-review-for-wwf 28/56
2
Graph 5: Losses by geographical area
Source: Original

8/12/2019 15 Years of Shipping Accidents a Review for Wwf
http://slidepdf.com/reader/full/15-years-of-shipping-accidents-a-review-for-wwf 29/56
29
2.4 Losses by average age of vessel
Graph 6 shows that the average age of vessels lost between 1997 and 2011 areall above 20 years with a small but steady increase over the last 15 years. Theage of vessels has been discussed in relation to geographical area of operation,
but is also a consideration to some IACs members who will not class sea-goingvessels over 20 years old.
Graph 6 : Losses by average age of vessel
Source: Original
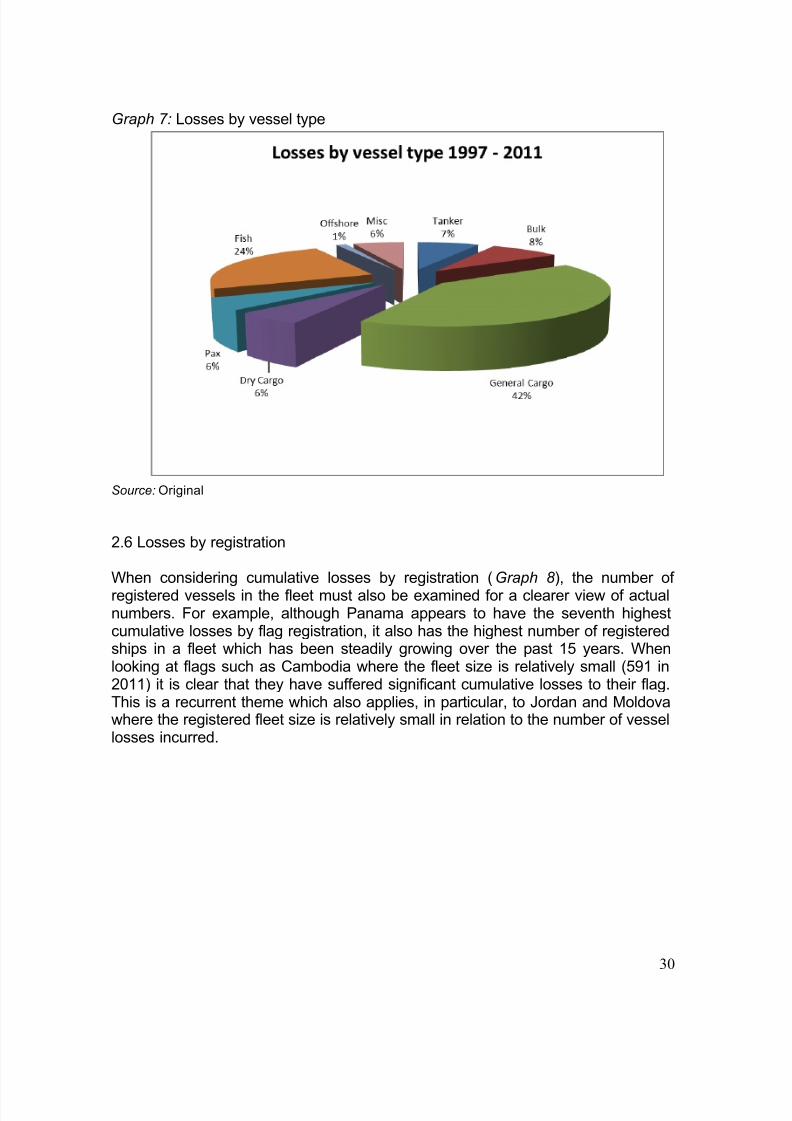
2.5 Losses by vessel type
Graph 7 shows that general cargo vessels account for nearly 50% of all vesseltypes lost at sea over the research timeframe. These types of vessels are oftenoperating short sea shipping routes, particularly in the Far East which involvemany port calls, navigating in congested coastal areas with the risk of difficulthydrographic uncertainties, such as submerged reefs and rocks. By their designthese vessels can carry a multitude of cargos and are therefore more predisposed
to trading in this way, as discussed in Section 3.3.
8/12/2019 15 Years of Shipping Accidents a Review for Wwf
http://slidepdf.com/reader/full/15-years-of-shipping-accidents-a-review-for-wwf 30/56
30
Graph 7: Losses by vessel type
Source: Original
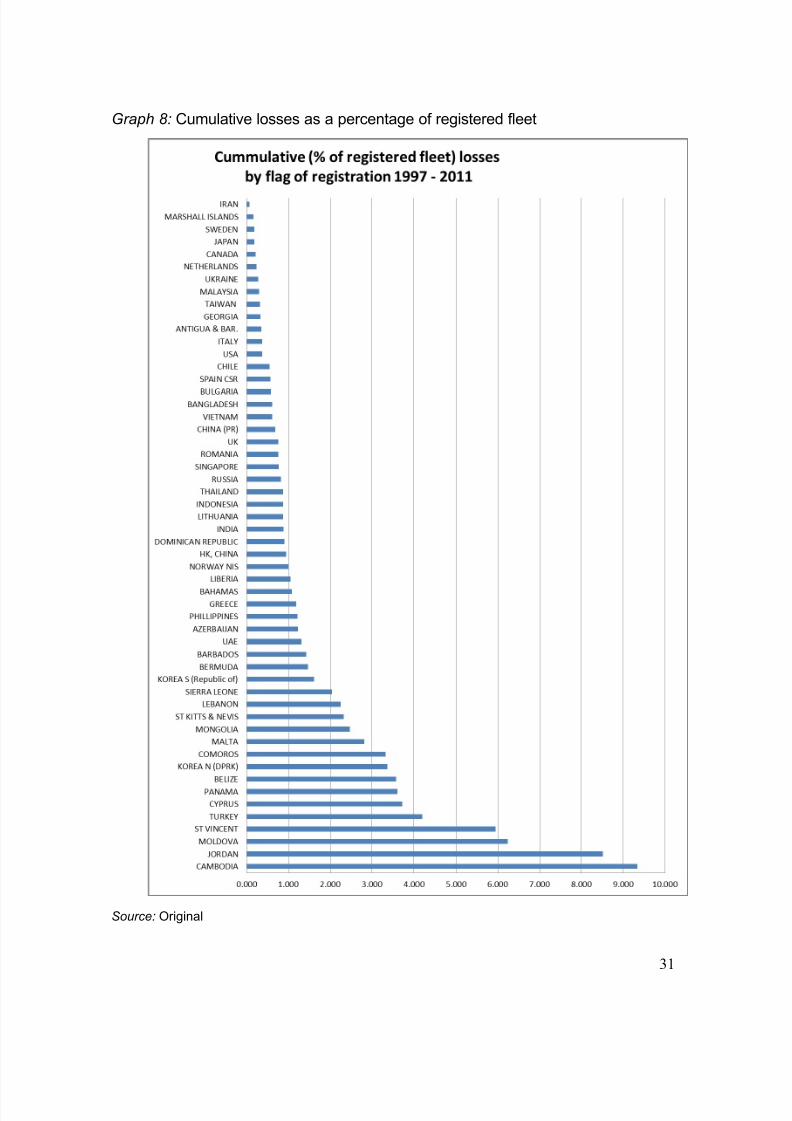
2.6 Losses by registration
When considering cumulative losses by registration (Graph 8 ), the number ofregistered vessels in the fleet must also be examined for a clearer view of actualnumbers. For example, although Panama appears to have the seventh highestcumulative losses by flag registration, it also has the highest number of registeredships in a fleet which has been steadily growing over the past 15 years. Whenlooking at flags such as Cambodia where the fleet size is relatively small (591 in2011) it is clear that they have suffered significant cumulative losses to their flag.This is a recurrent theme which also applies, in particular, to Jordan and Moldovawhere the registered fleet size is relatively small in relation to the number of vessellosses incurred.
8/12/2019 15 Years of Shipping Accidents a Review for Wwf
http://slidepdf.com/reader/full/15-years-of-shipping-accidents-a-review-for-wwf 31/56
31
Graph 8: Cumulative losses as a percentage of registered fleet
Source: Original

8/12/2019 15 Years of Shipping Accidents a Review for Wwf
http://slidepdf.com/reader/full/15-years-of-shipping-accidents-a-review-for-wwf 32/56
32
1997
Registered
Fleet
As % of
world
fleet
vessels
lost
As % of
flag
fleet 2011
Registered
Fleet
As % of
world
fleet
vessels
lost
As % of
flag
fleet
PANAMA 6188 7.24 8 0.129 PANAMA 8127 7.792 22 0.271USA 5260 6.15 11 3.230 INDONESIA 6332 6.071 5 0.079
RUSSIA 4814 5.63 1 0.021 JAPAN 5619 5.387 10 0.178
CYPRUS 1650 1.93 6 0.364 CHINA, PR 4148 3.977 3 0.072
GREECE 1641 1.92 2 0.122 LIBERIA 3030 2.905 1 0.033
MALTA 1378 1.61 2 0.145 KOREA, SOUTH 2916 2.796 3 0.103
ST VINCENT 1343 1.57 7 0.521 MALTA 1815 1.740 5 0.275
BAHAMAS 1221 1.43 3 0.246 VIETNAM 1525 1.462 2 0.131
TURKEY 1146 1.34 7 0.611 BAHAMAS 1409 1.351 1 0.071
INDIA 941 1.10 3 0 .319 CYPRUS 1022 0.980 1 0.098
THAILAND 576 0.67 5 0.868 CAMBODIA 591 0.567 7 1.184
ANTIGUA & BAR. 516 0.60 4 0.775 BELIZE 446 0.428 2 0.448
HK CHINA 375 0.44 1 0.267 JORDAN 23 0.022 1 4.348
World total fleet 85,494 World total fleet 104,305
2.7 Losses as a percentage of registered fleet
In total the percentage loss of the registered fleet may appear small but is ofserious consequence when considering the implied potential loss of life, impacts tothe environment and finances of the ship owner (Table 3).
Table 3: Total of world’s registered fleet as recorded losses of >10,000gt in 1997and 2011.
Source: Original
For example, this means that in 2011 Pamama had 8,127 vessels in its registeredfleet, which equated to 7.79% of the total world fleet. In this year they lost 22vessels, which equates to 0.271 of their fleet which is a relatively small numberwhen compared to flags such as Jordan. In the same year Jordan had 23registered vessels in their fleet. They lost 1 in 2011 representing an overall loss of
4.348% of their registered fleet, clearly a much higher percentage.
8/12/2019 15 Years of Shipping Accidents a Review for Wwf
http://slidepdf.com/reader/full/15-years-of-shipping-accidents-a-review-for-wwf 33/56
33
2.8 Information from the MOUs
It is the IMO’s policy to encourage the establishment of regional port State controlorganizations and agreements on port State control (IMO, 2012), as discussed insection 1.3.1. The following graphs look at a number of statistics collated from the
MOUs. These primarily focus on the Paris MOU as this has the mostcomprehensive data set, having been in operation the longest, since 1978.However, it should be noted that even this MOU has only the bare minimum ofdata collected over the total time period studied (15 years). Data collection for theParis MOU became much more thorough from around 2009 and for this reasonmuch of the detention information reported is from this period.
The Tokyo MOU also has a more comprehensive reporting system, although itwas not initiated until 1994. Until recently none of the data collected for the variousMOUs matched up, with criteria reported on varying broadly. Additionally theinformation collected from the World Casualty lists are not using consistent criteria
or terminology with the MOUs, which makes it difficult to cross reference like forlike between the two data sets.
Table 4 demonstrates the range of data that the MOUs have collected over thepast 15 years and highlights the disparity in regional approaches to detentionmonitoring. For example, the Abuja MOU website database has a list of whichclassification societies had ships detained, but unlike the Paris and Tokyo MOUthey are not linked to specific ships or flags, so there is no way of telling if there isa link between which ships are classified under which society and theirperformance. This is the same for vessel type. Additionally some MOUs such asthe Caribbean MOU was open for signatories in 1996 but it appears from theirwebsite that data was not available to the public until 2009. The IMO intervieweementioned that this is an area they are working on with port State regimes torectify. It is recognised that the data must be reported on in a standardised andconsistent way in order for it to be meaningful and to allow for cross referencingand verification. Therefore the following graphs provide snapshots of certainstatistics only and are supported by published literature and the interview data.

8/12/2019 15 Years of Shipping Accidents a Review for Wwf
http://slidepdf.com/reader/full/15-years-of-shipping-accidents-a-review-for-wwf 34/56
34
Table 4: Data available from MOUs from 1997 - 2012
Source: Original
NameofMOU
YearMOUSigned
Data Availablefrom
ShipFlag
YearBuild
GrossTonnage
ClassSociety
Year ofDetention
Reasonsfor beingdetained
Ship Type Place ofInspection
Paris 1978 Limited datafrom 1997. Fulldetails from2009
Since1997
Since2008
Since2008
Since 2008 Since 1997 Since 2009 Since 1997 Since 2009
Tokyo 1994 Since 1999 Since1999
Since1999
Since1999
Since1999
Since 1999 Since 1999 Since 1999 Since 1999
Mediterranean
1997 Since 2005 Since2005
Since2005
Since2005
Since 2005 Since 2005 Since 2005 Since 2005 Since 2005
Riyadh 2004 Limited dataavailablebetween 2007-2009
No No No No 2007- 2009 No No 2007-2009
Abuja 1999 Limited data for2008, 2010,2011 & no datafor 2009
2008,2010,2011
No No Limited, tonumberper classnot linkedto a flag
200820102011
No Limited, tonumber pertype notlinked to aflag
No
IndianOcean
1999 Limited since2002 furtherdata availablefrom 2005
Since2002
Since2002
Since2000
Since2002
Since2002
No Since2002
Since2002
Caribbean
1996 Since2009
No No Since2009
Since2009
Since2009
No Since2009
Since2009
BlackSea
2000 Since2002
Since2002
Since2002
Since2002
Yesbut limitedinformation
Since2002
Since2002
Since2002
Since2002
8/12/2019 15 Years of Shipping Accidents a Review for Wwf
http://slidepdf.com/reader/full/15-years-of-shipping-accidents-a-review-for-wwf 35/56
35
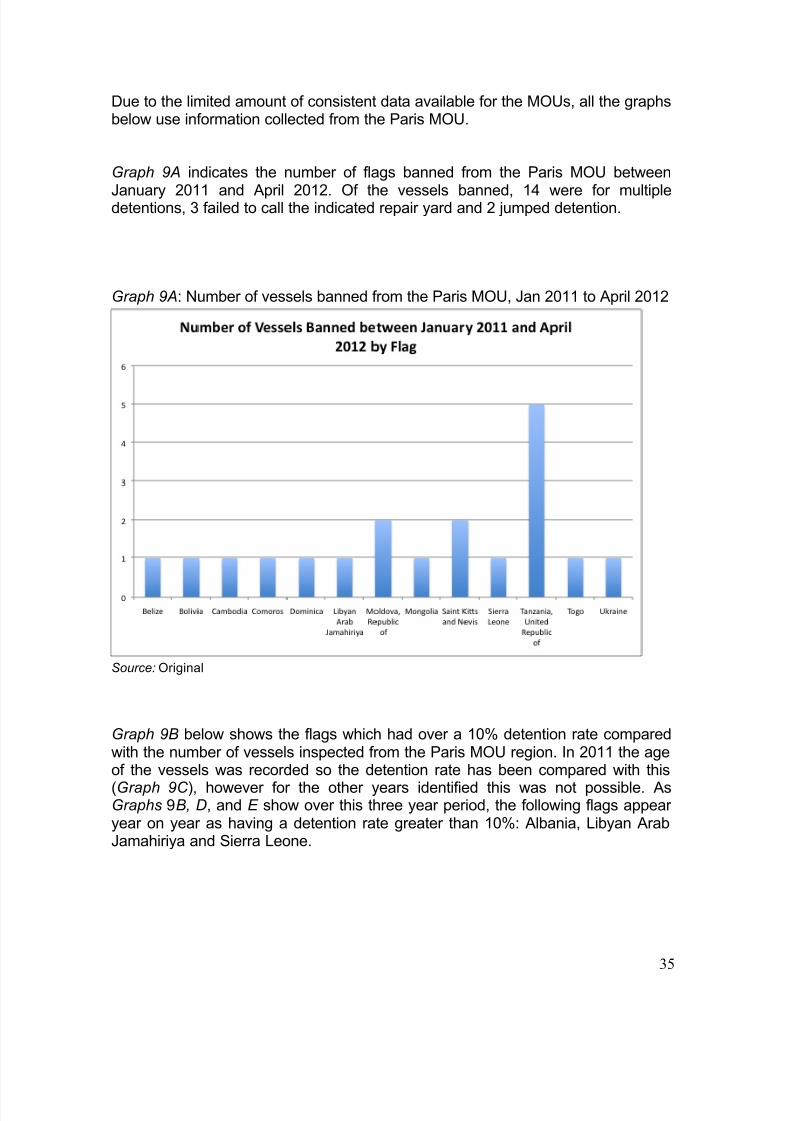
Due to the limited amount of consistent data available for the MOUs, all the graphsbelow use information collected from the Paris MOU.
Graph 9A indicates the number of flags banned from the Paris MOU between
January 2011 and April 2012. Of the vessels banned, 14 were for multipledetentions, 3 failed to call the indicated repair yard and 2 jumped detention.
Graph 9A: Number of vessels banned from the Paris MOU, Jan 2011 to April 2012
Source: Original
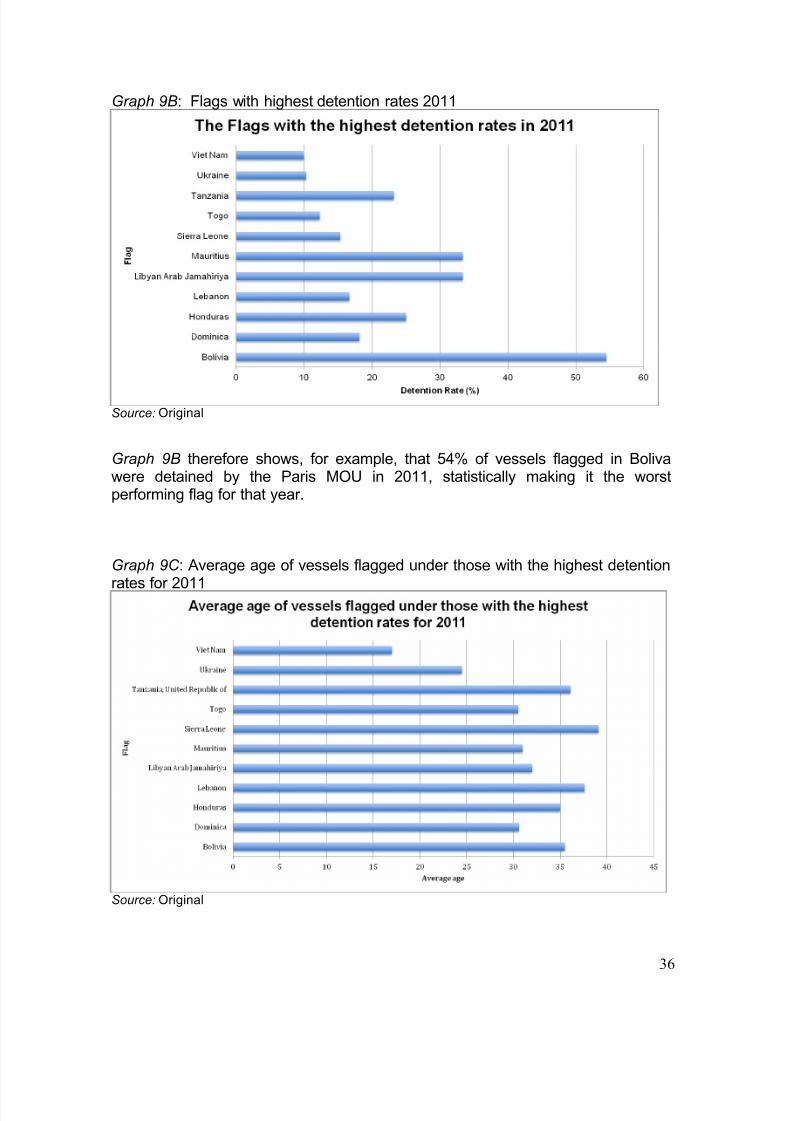
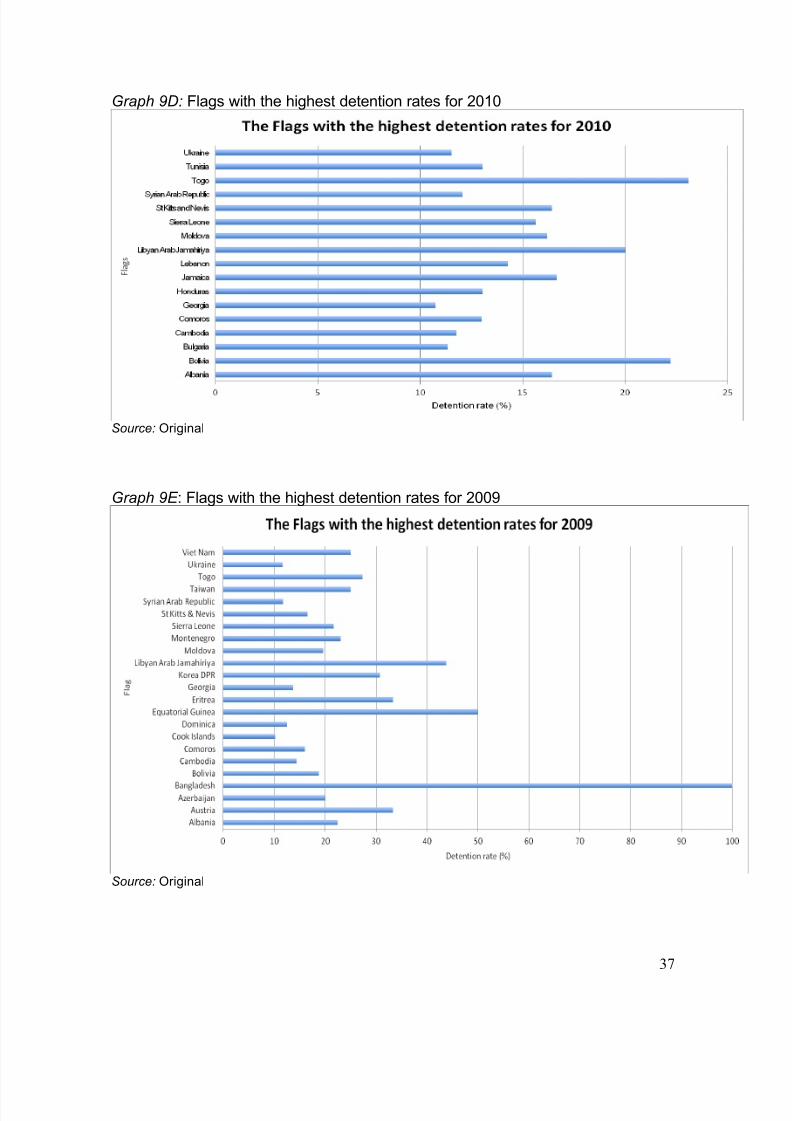
Graph 9B below shows the flags which had over a 10% detention rate comparedwith the number of vessels inspected from the Paris MOU region. In 2011 the ageof the vessels was recorded so the detention rate has been compared with this
(Graph 9C ), however for the other years identified this was not possible. AsGraphs 9B, D, and E show over this three year period, the following flags appearyear on year as having a detention rate greater than 10%: Albania, Libyan ArabJamahiriya and Sierra Leone.
8/12/2019 15 Years of Shipping Accidents a Review for Wwf
http://slidepdf.com/reader/full/15-years-of-shipping-accidents-a-review-for-wwf 36/56
36
Graph 9B: Flags with highest detention rates 2011
Source: Original
Graph 9B therefore shows, for example, that 54% of vessels flagged in Bolivawere detained by the Paris MOU in 2011, statistically making it the worstperforming flag for that year.
Graph 9C : Average age of vessels flagged under those with the highest detention
rates for 2011
Source: Original
8/12/2019 15 Years of Shipping Accidents a Review for Wwf
http://slidepdf.com/reader/full/15-years-of-shipping-accidents-a-review-for-wwf 37/56
37
Graph 9D: Flags with the highest detention rates for 2010
Source: Original
Graph 9E : Flags with the highest detention rates for 2009
Source: Original
8/12/2019 15 Years of Shipping Accidents a Review for Wwf
http://slidepdf.com/reader/full/15-years-of-shipping-accidents-a-review-for-wwf 38/56
38
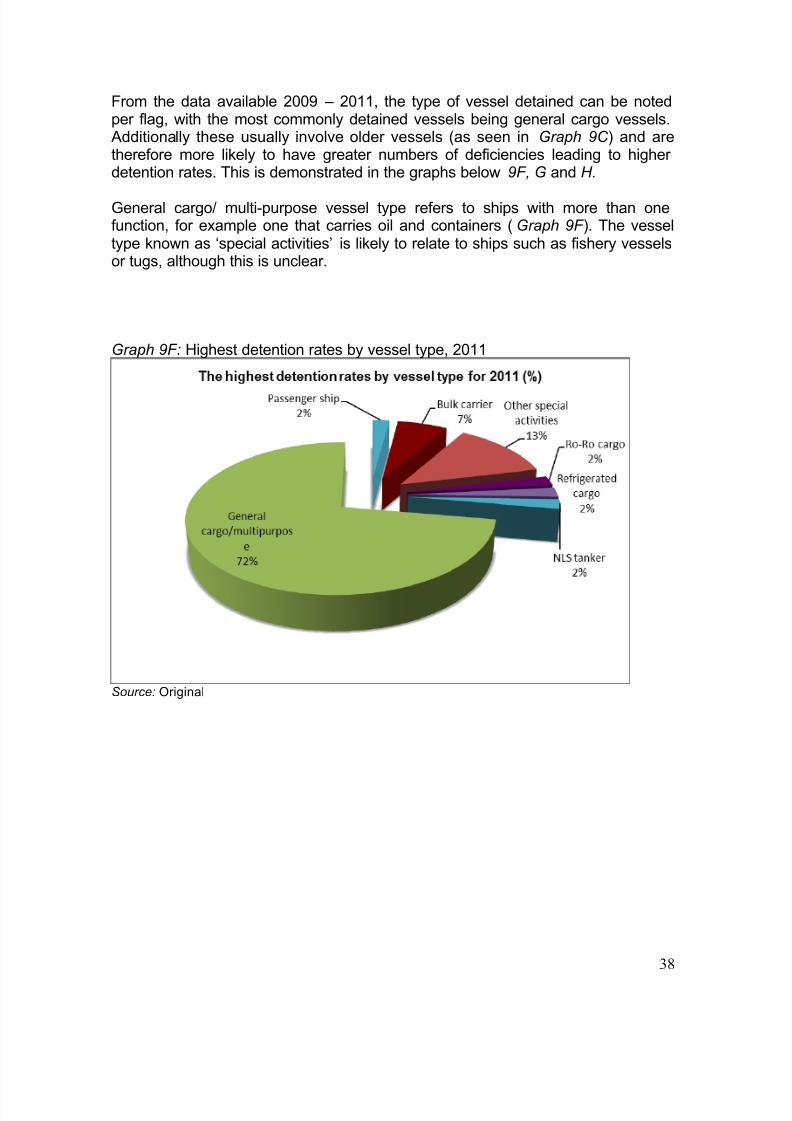
From the data available 2009 – 2011, the type of vessel detained can be notedper flag, with the most commonly detained vessels being general cargo vessels.
Additionally these usually involve older vessels (as seen in Graph 9C ) and aretherefore more likely to have greater numbers of deficiencies leading to higherdetention rates. This is demonstrated in the graphs below 9F, G and H.
General cargo/ multi-purpose vessel type refers to ships with more than onefunction, for example one that carries oil and containers (Graph 9F ). The vesseltype known as ‘special activities’ is likely to relate to ships such as fishery vesselsor tugs, although this is unclear.
Graph 9F: Highest detention rates by vessel type, 2011
Source: Original

8/12/2019 15 Years of Shipping Accidents a Review for Wwf
http://slidepdf.com/reader/full/15-years-of-shipping-accidents-a-review-for-wwf 39/56
39
Graph 9G: Highest detention rates by vessel type, 2010
Source: Original
Graph 9H : Highest detention rates by vessel type, 2009
Source: Original

8/12/2019 15 Years of Shipping Accidents a Review for Wwf
http://slidepdf.com/reader/full/15-years-of-shipping-accidents-a-review-for-wwf 40/56
40
2.0 Discussion and key messages from the data
This section presents a discussion based on the key messages from the datafindings and looks at them in relation to the relevant legal instruments and thecurrent debate in this field.
3.1 Key messages
The shipping industry is inherently global and performs around the clock in manydifferent time zones. The world fleet is steadily growing and operates in anincreasing intense, economically driven environment where cost savings are afundamental part of business. These and other data findings presented in thisreport show a complex picture of factors that are strongly linked to shippingaccidents.
Despite the historical data which demonstrates overall improvements in the
number of shipping accidents, there is still a need to make progress with tacklingthe associated underlying causes and to reduce incidences further. This isparticularly pertinent during a time of economic downturn when there might be atemptation for owners and operators to cut corners but also as the global fleet sizeis predicted to increase significantly over a number of decades. This implies therewill be more ships operating in high risk areas such as those identified on the ‘TopTen Incident Zones’ map (Figure 3) and in areas where potential new shippingroutes may be established, such as the Arctic, and resource rich areas such asthe West coast of Canada. It is important that proactive consideration of thesepotential high risk areas is taken to avert the risk of shipping accidents in thefuture in these highly sensitive and bio-diverse areas.
This report shows that there is the greatest probability of a shipping accidentoccurring when all of the following factors act together.
Key hotspot locations (S.E. Asia (particularly the Coral Triangle area), the
E. Med/ Black Sea, N,Sea/ British Isles)
Age of Vessels (over 10 years)
A minority of poorly performing flag States
Vessel type (General Cargo 42%/ fisheries 24%)
Some flag States are still not behaving responsibly. This can be evidenced by
certain flags experiencing higher than normal incidences (Graph 8 ) and registeringolder vessels. Examples in the report include St. Kitts and Nevis and Moldova,among others. However, this point raises questions. Are these flag States beingremiss in their duty of safety at sea or is it because they register older vesselswhich are statistically involved in a higher number of incidences? (See Table 1 forthe current list of Flags of Convenience, Appendix A for PARIS MOU Black, greyand white list, 2011, and Appendix C for the ICS flag performance list).

8/12/2019 15 Years of Shipping Accidents a Review for Wwf
http://slidepdf.com/reader/full/15-years-of-shipping-accidents-a-review-for-wwf 41/56
41
General cargo vessels account for 42% of all vessel types lost at sea over theresearch timeframe (Graph 6). These types of vessels are often operating shortsea shipping routes, associated with tramp trading, particularly in the South East
Asian region which involve many port calls, navigating in congested coastal areaswith the risk of hydrographic uncertainties such as submerged reefs and rocks.
They often involve older vessels of 10 years and above which can limit theirregistration to less reputable flags States in order to continue trading. This canestablish a cycle of potentially a lowering of standards and cutting safety corners.The South East Asia region, where the majority of these incidences are occurring,is often referred to as the Coral Triangle as it is an area particularly rich inbiodiversity and therefore especially vulnerable to the potential of shippingaccidents (Figure 3).
The report highlights that fishing vessels are also involved in a high number ofshipping incidences, amounting to 24% of the total world’s fleet for this vesseltype. This number could be potentially higher given that accidents involving fishing
vessels are often under reported.
Nearly 50% of all global shipping accidents fall into the foundered category, whichis strongly linked to location and the type and age of vessels operating there. Thisis also strongly associated with human factors, particularly related to sleepdeprivation and shift work, which can lead to errors of judgment when handling aship.
There are many other complexities that contribute to safety at sea and shippingaccidents, including the following:Some IACS members will not class sea-going vessels over 20 years old thuseffectively pushing older and potentially more vulnerable vessels to poorerstandard class societies. The report highlights that there are still a minority ofsignificantly badly performing flags which negatively impact on the reputation ofthe shipping industry. There is a need for the industry to promote bestperformance in flags, particularly the ones that have significantly ‘cleaned up theiract’ in the last 15 years or so. Long term this provides more business andimproves reputation of a flag.
There is a need to encourage countries to ratify and implement IMO Conventionsand regulations as well as international regulations such as UNCLOS (which theUS have not yet ratified), the Convention of Biological Diversity (CBD) and othersthat govern marine environmental protection and behaviour/operations whilst atsea, and monitor shipping performance. It is important that this information ismade publicly available so that business decisions can be made in an informedway and operated on a level playing field. The fact that some conventions andregulations have not entered into force for decades or that certain countries havenever ratified means a base line has not been established in terms of globalregulation. While some countries continue to improve in this regard, otherscontinue to get worse.
8/12/2019 15 Years of Shipping Accidents a Review for Wwf
http://slidepdf.com/reader/full/15-years-of-shipping-accidents-a-review-for-wwf 42/56
42
There is a need to standardise recorded data, particularly between the MOUs andto use the same metrics for undertaking this. Genuinely global standardisedregimes do not yet exist in this context which can cause confusion,misinterpretation of data and potentially poorly performing flags to slip through the
net. This becomes more problematic set against a growing world fleet andcongested shipping hotspot areas which increase the probability of accidents.Future focus on this area is a key recommendation.
3.2 Weaknesses in the existing legal instruments: Should the genuine link conceptby tightened?
The issue of nationality of a ship is frequently cited as an area open to misuse,where the concept of a genuine link between the ship and the State to which isflagged can at times be tenuous. The conditions governing genuine link between
ship owner and registration were initially laid down in the Convention on the HighSeas in the 1950s, and took account of ship ownership and registration models inplace at that time. When it was incorporated into the United Nations Convention ofthe Law of the Sea (UNCLOS III) little was changed, even though discussion hadmoved on from conditions of registration to that of sub-standard ships in general.UNCLOS III addressed sub-standard shipping by providing more detailedprovision with regard to effective jurisdiction for flag States and coastal and portStates. The lack of change within UNCLOS III, with regard to genuine link, mayreflect the fact that this issue had been taken up by the United NationsConference on Trade and Development (UNCTAD), which had been looking atregistrations of ships since the 1970’s. After the ratification of UNCLOS III in1982, the United Nations Convention on Conditions for Registration of Ships (theRegistration Convention) was concluded by UNCTAD; however it had limitedsuccess. Furthermore, it is often ignored by the industry in discussions relating togenuine link, where efforts have concentrated on improving effective jurisdictionand control, particularly that of the port State.
It is suggested that the timing may be appropriate to re-visit the issue of who canoffer nationality to merchant shipping as this has implications with regard to
jurisdiction and control of these ships. This would seek to prevent the veryexistence of some open registries. Alternatively greater focus could be directed towhether flag States are exercising effective jurisdiction and control over ships thatfly their flags. This would accept that any State may operate a ships registry butthat they must be more effective in exercising jurisdiction and control over shipsand their owners to whom they grant nationality. The International TransportWorker’s Federation are clear in their assertions that, ‘there should be a “genuinelink” between the real owner of the vessel and the flag the vessel flies.’ They statethat ‘there is no “genuine link” in the case of ‘Flags of Convenience’ registries (ITF,2012).
8/12/2019 15 Years of Shipping Accidents a Review for Wwf
http://slidepdf.com/reader/full/15-years-of-shipping-accidents-a-review-for-wwf 43/56
43
3.2.1 Should effective enforcement by flag States be strengthened?
Those flag States, identified by the various Port State Control Agreements, asconsistently being deficient in meeting their obligations in international law to
“effectively exercise its jurisdiction and control in administrative, technical andsocial matters over ships flying its flag” should be targeted to ensure they clean uptheir act. If they are not already members of Port State Control Agreements, for example an MOU, they could be encouraged to participate in their regionalagreement and take advantage of the technical support facilitated by the IMO.
The role of the flag State in carrying out investigations has been strengthened bythe IMO. A knowledge based approach to the rule making process could use, forinstance, casualty and Port State control data. A great deal can be learnt fromcasualty investigation. A mandatory framework has been developed by the IMO,which provides a clear way of carrying out an investigation. This Code promotes
cooperation amongst States carrying out joint investigations leading to greatertransparency. By having a standard process for casualty analysis and by makingthe information available to all States, meaningful insight into the causes ofaccidents and any lessons learnt from the data can be used to preventreoccurrences.
The IMO clearly recognize that flag State performance is ultimately down tomonitoring the work of the people who act on their behalf,
‘because they are the ones entering whether a ship has been well surveyed,things which are wrong, that deficiencies have been rectified, that the right peopleare on board, that everything is in order .’
They explain that they have seen changes in the way some flag States choose tooperate,
‘Some of those [flag States] have also decided to scale down to ensure the criticalnumber of ships they can manage’ .
3.2.2 Enforcement by Port State Control
The success of PSC in identifying and publicising flag States who fail to meet theirinternational obligations should be recognized, and where necessary furtherencouraged and strengthened. The strength of Port State Control is thecoordinated approach taken regionally. Greater cooperation between MOU’sinternationally should be encouraged particularly in the areas highlighted ashotspots of sub-standard shipping.
8/12/2019 15 Years of Shipping Accidents a Review for Wwf
http://slidepdf.com/reader/full/15-years-of-shipping-accidents-a-review-for-wwf 44/56
44
Greater cooperation between flag and port States is an area the IMO is exertingconsiderable effort to further encourage and support. Cooperation through theIMO FSI sub-committee provides a forum to rectify the causes of deficiencies andimprove the safety of vessels. This should be supported.
The use of incentive schemes, such as the United States ‘Qualship 21’ shouldalso be encouraged because they inspect the level of compliance withinternational standard. Schemes such as this and the ‘lists’ operated by some portState control MOU may also have an impact on flag State compliance, it may beconsidered bad for business if ships flying your flag are “black” listed and targetedfor inspection in areas their owners wish to trade.
4.0 Recommendations
Based on the research findings several recommendations can be made to helpstrengthen various aspects of shipping safety standards. The recommendationsfocus on several areas of the shipping industry which contribute towards vesseland seafarer safety and reflect the complexity of finding a one stop solution todecreasing shipping accidents. Whilst the recommendations address the issuesraised in the report, they also highlight areas where future research would beinstrumental in providing greater knowledge that could potentially instigate longterm safety improvements within the shipping industry.
The continual growth of the industry, yearly recorded accidents and the potentialfor a large scale disasters occurring, reinforces the need for continual support foran integrated, global, legislative response to increase vessel safety standards.This is slowly being achieved through the IMO and highlights the importance ofratification by flag States of its conventions.
Increased enforcement of global legislation through the port and flag States wouldproduce more cohesive and effective results for shipping safety. Whilst this isrecognised as an inherently complex area, it is important that focus remains onthose ports and flag States that are not complying with international regulations.
Monitoring work conducted by some of the MOUs fails to encompass several keyelements of information such as age of vessel and location of incident forexample. Despite the IMOs continual efforts in this regard, the data collected isoften inconsistent for different years and there appears to be a lack ofcollaboration across all the MOUs to standardise the approach taken to datacollection and monitoring, resulting in a lack of data quality. There needs to be acommon base-line which could be achieved by the development of a globalstandardised framework for data collection and reporting. Investment into researchin this area is highly recommended.
8/12/2019 15 Years of Shipping Accidents a Review for Wwf
http://slidepdf.com/reader/full/15-years-of-shipping-accidents-a-review-for-wwf 45/56
45
Support and encouragement should be given for greater cooperation between thevarious MOUs, particularly in the geographical hotspots where incidences mostoccur. This would help to coordinate efforts on detaining sub-standard shippingand help to ensure that deficiencies are rectified as soon as possible
Currently there is a lack of collaborative exchange of data between the port Stateregimes. Sharing data of shipping accidents and the recommendations made onthe strength of them can be a positive outcome of the incident. It is thereforecrucial that information is made easily accessible, publically available and at nocost, in order to promote transparency and the sharing of best practice.
This report has shown that vessels over 20 years of age often start a geographicalmove East (to the Black Sea area and then the Far East) when they are no longerable to register with better known registries. This is particularly the case withgeneral cargo vessels which can be adaptable with their trade and route. The age
of the vessel means that maintenance is more important than ever but often worksagainst the ship as it is no longer able to register with a registry holding a goodreputation. These registries generally impose more stringent and greater safetystandards such as on-board management systems. Keeping a ship with a goodregistry will help achieve better safety standards overall and therefore this is animportant issue that needs to be looked at in collaboration with those registriesthat could have a positive impact on maritime safety.
Finally, this report has touched on the human elements involved with shippingaccidents which include the competency of crews, their employment conditions,and their training; Organisational, national and safety cultures and even humanfallibilities like fatigue and situation awareness. This is a vast area and there hasbeen much research surrounding these issues in the past. A futurerecommendation would be to tie the existing research in this field to this currentstudy.
The recommendations can be summarised by the following points:
Encourage a more global and cohesive approach towards shipping safetythrough support for the IMO in its pragmatic approach to encouraging flagStates to ratify its conventions.
Advocacy to improve poorer performing flag State standards throughincreased enforcement to produce a more effective and joined upapproach.
Standardised data collection and reporting mechanisms across the MOUs.
Investment in research and design to develop a global frame work for astandardised reporting system to enable commonality of data collection,monitoring and reporting of shipping accidents and detentions at variouslevels. This would help to achieve common, global metrics with the use of
8/12/2019 15 Years of Shipping Accidents a Review for Wwf
http://slidepdf.com/reader/full/15-years-of-shipping-accidents-a-review-for-wwf 46/56
46
clear, simple language which could be adapted to various levels ofreporting.
Transparency and availability of data for all with no charges applied for itsuse.
Data sharing of best practice and lessons learnt from shipping accidents
Work with well-known shipping registries to understand the move East thatoccurs with older vessels. Review the options to keep older vessels in well-known registries so that they can be better maintained particularly at thiscrucial stage in their life cycle.
Support the IMO in its encouragement of greater cooperation betweenMOU’s particularly in the areas highlighted as hotspots of sub-standardshipping.
Consider research of the human elements associated to shipping accidentsin relation to the work in this report.
5.0 Conclusions
Shipping is a highly complex, global industry that provides trade networks acrossthe world contributing to economic progress. As shipping delivers 90% of all worldtrade (IMO, 2011), it follows that this is an industry in growth, and one that isinherently complex. As the report identifies, these issues also apply to all aspectsof shipping safety and many criteria have been highlighted in regard to shippingaccidents. As technology advances and greater awareness of the attributingfactors of shipping accidents are raised, it is essential to insist on better safety
standards, both regarding the vessel itself, its crew and operators and on strictenforcement of procedures and regulations designed to minimise accidents.
The recommendations set out in this report provide logical solutions in response tothe research findings. In some cases they demonstrate the first steps to a solutionand in others they highlight where resources could best be justified.
Although it is logical to consider the global areas where the most incidents occur,the issues raised by this report should also be considered in highly sensitive areaswhere potential new trade routes may open up, such as the Artic and WesternCanada, particularly in light of climate change predictions and the economic
environment where new areas to obtain natural resources are continuously beingsought and exploited.
Despite decreases in shipping accidents over the last 15 years relative to theincrease in the worlds’ fleet, poor flag State performance still has a consistentimpact. Black lists kept by the ITF, the ICS and some of the MOUs can influenceinsurers and class societies against the worst offenders, but these lists themselvesare not always looking at the bigger picture. In regard to the number of ships

8/12/2019 15 Years of Shipping Accidents a Review for Wwf
http://slidepdf.com/reader/full/15-years-of-shipping-accidents-a-review-for-wwf 47/56
47
registered to a flag, those with a high percentage of cumulative losses should betargeted to clean up their act. Ultimately this will be of benefit to the offending flagState itself, both in economic terms and to their reputation, and to the shippingindustry in general.
As highlighted in the report, whilst not a compulsory role, port States can make amajor contribution to vessel safety standards. As such the onus is on them to helpenforce high shipping standards and not turn a blind eye to sub-standards.However economics can make it difficult for some port States to make the rightdecisions in this regard and the reality maybe counter-productive to shippingsafety, particularly in some small island States.
Therefore the findings demonstrate that shipping accidents, whilst still related topoor flag State performance, cannot be reviewed in isolation. Consideration mustbe given in relation to other significant contributing factors identified in the reportand the recommendations made on the strength of them.
8/12/2019 15 Years of Shipping Accidents a Review for Wwf
http://slidepdf.com/reader/full/15-years-of-shipping-accidents-a-review-for-wwf 48/56
48
References:
ABS (2004) ABS Review and Analysis of Accident Databases: 1991-2002 Data. American Bureau of shipping Technical Report: SAHF 2003-5.1, March 2004
Arendt, F. Haasis, H., Lemper, B. 2010. Shipping statistics yearbook 2010:shipping market, shipbuilding, ports and sea canals. Institute of ShippingEconomics and Logistics. Bremen, ISL
Bonn Agreement, 2012. Bonn Agreement [online]. Available:www.bonnagreement.org [accessed 10th December, 2012]
Charlebois, P., 2012. History of Key Conventions – IMO Conventions. Paperpresented at the Interspill Conference, 28th February 2012, London, UK
Cornish M. and Ives E., 1997. Reed’s Maritime Meteorology. East Molesley,
Thomas Reed
Criag, C. 2006. Extreme Waves. Washington, USA. Joseph and Henry Press
FAO, Food and Agriculture Organization of the United Nations, 2012. Fishingvessels operating under open registers and the exercise of flag State [online].
Available: www.fao.org/docrep/005/y3824e/y3824e06.htm [accessed 1stSeptember 2012]
Gianni, M. 2008.Real and present danger: Flag state failure and maritime securityand safety. A report for WWF and ITF. Oslo/ London
HELCOM RESPONSE, nd. Response group (HELCOM RESPONSE) [online]. Available: www.helcom.fi/groups/response/en_GB/main [accessed 10thDecember, 2012]
IMO, International Maritime Organisation, 2012. Port State Control [online]. Available:www.imo.org/ourwork/safety/implementation/pages/portstatecontrol.aspx [accessed 3rd September, 2012]
IMO, International Maritime Organisation, 2011. IMO and the environment [online]. Available:www.imo.org/ourwork/environment/documents/imo%20and%20the%20environment%202011.pdf [accessed 20
th December, 2012]
International Transport Workers’ Federation (ITF), 2012a. What are Flags ofConvenience? [online]. Available: www.itfglobal.org/flags-convenience/index.cfm [accessed 20th August 2012]

8/12/2019 15 Years of Shipping Accidents a Review for Wwf
http://slidepdf.com/reader/full/15-years-of-shipping-accidents-a-review-for-wwf 49/56
49
International Transport Workers’ Federation (ITF), 2012b. Unions slam ‘sea ofshame’,[online]. Available: www.itfglobal.org/press-area/index.cfm/pressdetail/7543/region/1/section/0/order/1[accessed 20
th
Novemeber 2012]
International Transport Workers’ Federation (ITF), 1974. In International TransportWorkers’ Federation (ITF),What are Flags of Convenience? [online]. Available:www.itfglobal.org/flags-convenience/index.cfm [accessed 20th August 2012]
International Chamber of Shipping (ICS) and International Shipping Federation(ISF), 2011. Shipping industry flag State performance table. ICS and ISF
Kaaluza, P., Kolzsch, A., Gastner, M. and Blasius, B. 2010. The complex networkof global cargo ship movements. Journal of The Royal Society Interface.7, 1093-1103
Offshoregate, nd. Open Vs Closed Registry [online]. Available:www.offshoregate.com/foc.html [accessed 1st September, 2012]
Paris MOU, 2010. The Paris Memorandum of Understanding on Port State Control [online]. Available: www.parismou.org [accessed 6th September, 2012]
Maritime International Secretariat Services (MARISEC) Ltd. 2006. Shippingindustry guidelines on flag State performance. (2nd ed.) MARISECParis MOU, 2010. Paris MOU on Port State Control [online]. Available:www.parismou.org [accessed 1
st May 2012]
Review of Maritime Transport, 2010. United Nations Conference on Trade andDevelopment (UNCTAD). Geneva, UNCTAD
Review of Maritime Transport, 2005. United Nations Conference on Trade andDevelopment (UNCTAD). New York, United Nations
Review of Maritime Transport, 2000. United Nations Conference on Trade andDevelopment (UNCTAD). New York, United Nations
STCW, 1995. Standards of Training, Certification and Watchkeeping [online]. Available: www.stcw.org [accessed 1st May 2012]
Stopford, M. 2011. Shipping’s majority – A flag for all nations [online]. Available:www.clarksons.net/markets/feature_display.asp?section=&news_id=31462&title=Shipping%92s+Majority+%96+A+Flag+for+All+Nations [accessed 2nd May 2012]
The International Transport of Workers’ Federation (ITF), nd [online].
8/12/2019 15 Years of Shipping Accidents a Review for Wwf
http://slidepdf.com/reader/full/15-years-of-shipping-accidents-a-review-for-wwf 50/56
50
Available: www.itfglobal.org/flags-convenience/flags-convenien-183.cfm [accessed30th April 2012]
The United Nations Convention on the Law of the Sea (UNCLOS), 1998 [online]. Available:
www.un.org/depts/los/convention_agreements/convention_overview_convention.htm [accessed 30th April 2012]
World casualty statistics, 2010. Annual statistical summary of reported total lossesand disposals of propelled sea-going merchant ships of not less than 100 GT. IHS, Fairplay
World casualty statistics, 2005. Annual statistical summary of reported total lossesand disposals of propelled sea-going merchant ships of not less than 100 GT. Lloyd's Register-Fairplay. Redhill, Lloyd's Register-Fairplay
World casualty statistics, 2000. Annual statistical summary of reported losses anddisposals of propelled sea-going merchant ships of not less than 100 GT. Lloyd'sRegister, London, Lloyd's Register of Shipping
Zachcial, M. and Heideloff, C. 2005. Shipping statistics yearbook 2005. Institute ofShipping Economics and Logistics. Bremen, ISL
Zachcial, M. and Heideloff, C. 2000. Shipping statistics yearbook 2000. Institute ofShipping Economics and Logistics, Bremen, ISL
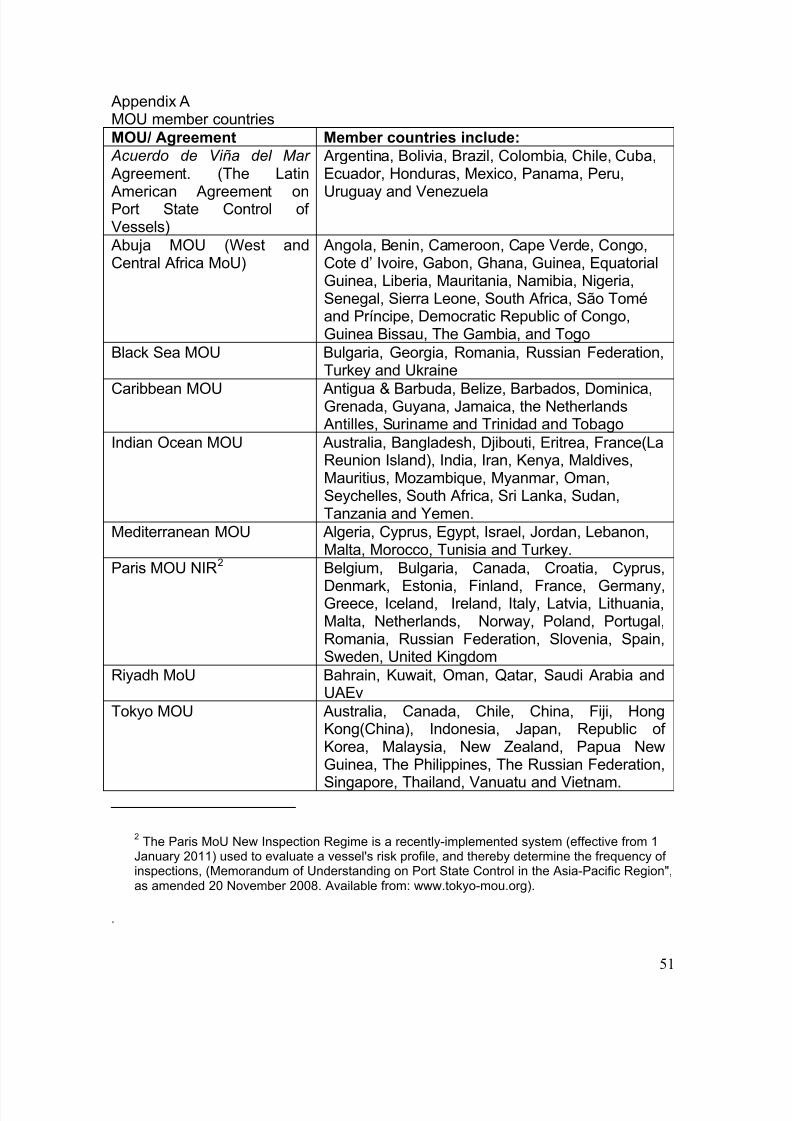
8/12/2019 15 Years of Shipping Accidents a Review for Wwf
http://slidepdf.com/reader/full/15-years-of-shipping-accidents-a-review-for-wwf 51/56
51
Appendix AMOU member countriesMOU/ Agreement Member countries include:
Acuerdo de Viña del Mar Agreement. (The Latin
American Agreement onPort State Control ofVessels)
Argentina, Bolivia, Brazil, Colombia, Chile, Cuba,Ecuador, Honduras, Mexico, Panama, Peru,
Uruguay and Venezuela
Abuja MOU (West andCentral Africa MoU)
Angola, Benin, Cameroon, Cape Verde, Congo,Cote d’ Ivoire, Gabon, Ghana, Guinea, EquatorialGuinea, Liberia, Mauritania, Namibia, Nigeria,Senegal, Sierra Leone, South Africa, São Toméand Príncipe, Democratic Republic of Congo,Guinea Bissau, The Gambia, and Togo
Black Sea MOU Bulgaria, Georgia, Romania, Russian Federation,Turkey and Ukraine
Caribbean MOU Antigua & Barbuda, Belize, Barbados, Dominica,Grenada, Guyana, Jamaica, the Netherlands
Antilles, Suriname and Trinidad and Tobago
Indian Ocean MOU Australia, Bangladesh, Djibouti, Eritrea, France(LaReunion Island), India, Iran, Kenya, Maldives,Mauritius, Mozambique, Myanmar, Oman,Seychelles, South Africa, Sri Lanka, Sudan,Tanzania and Yemen.
Mediterranean MOU Algeria, Cyprus, Egypt, Israel, Jordan, Lebanon,Malta, Morocco, Tunisia and Turkey.
Paris MOU NIR2 Belgium, Bulgaria, Canada, Croatia, Cyprus,
Denmark, Estonia, Finland, France, Germany,Greece, Iceland, Ireland, Italy, Latvia, Lithuania,Malta, Netherlands, Norway, Poland, Portugal,Romania, Russian Federation, Slovenia, Spain,Sweden, United Kingdom
Riyadh MoU Bahrain, Kuwait, Oman, Qatar, Saudi Arabia andUAEv
Tokyo MOU Australia, Canada, Chile, China, Fiji, HongKong(China), Indonesia, Japan, Republic ofKorea, Malaysia, New Zealand, Papua NewGuinea, The Philippines, The Russian Federation,
Singapore, Thailand, Vanuatu and Vietnam.
2 The Paris MoU New Inspection Regime is a recently-implemented system (effective from 1
January 2011) used to evaluate a vessel's risk profile, and thereby determine the frequency ofinspections, (Memorandum of Understanding on Port State Control in the Asia-Pacific Region",as amended 20 November 2008. Available from: www.tokyo-mou.org).
.
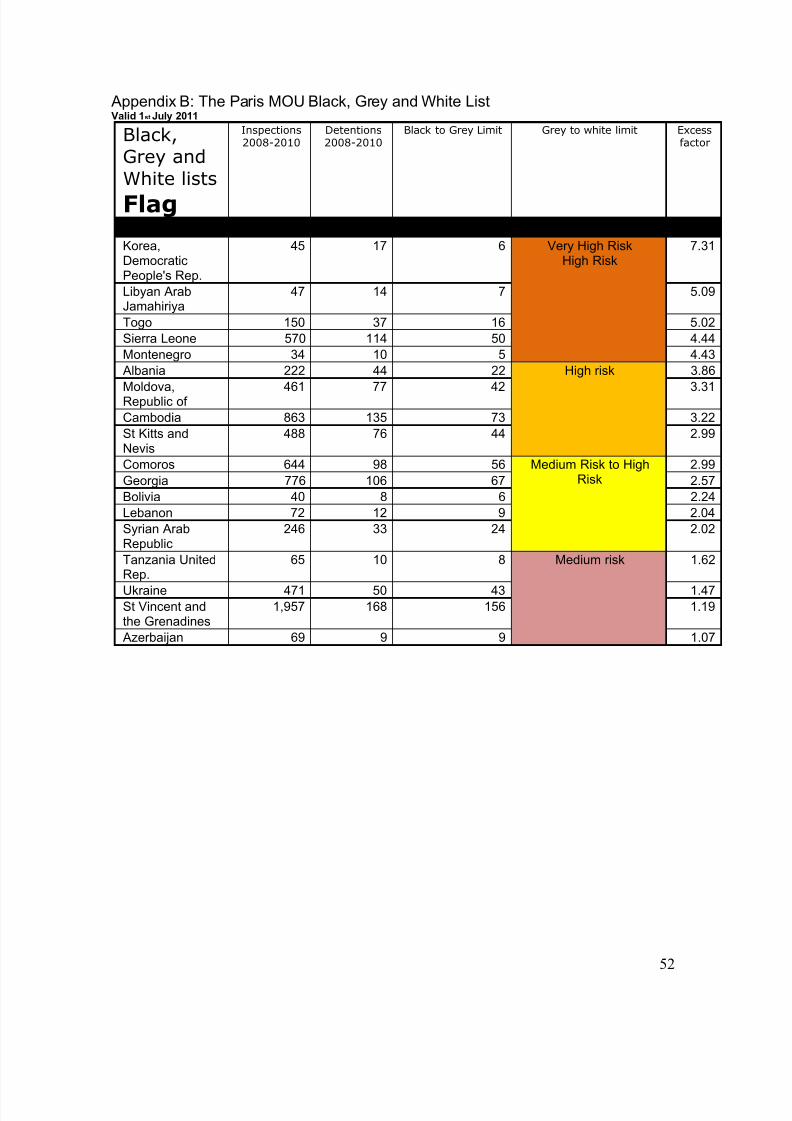
8/12/2019 15 Years of Shipping Accidents a Review for Wwf
http://slidepdf.com/reader/full/15-years-of-shipping-accidents-a-review-for-wwf 52/56
52
Appendix B: The Paris MOU Black, Grey and White ListValid 1st July 2011
Black,
Grey and
White lists
Flag
Inspections2008-2010
Detentions2008-2010
Black to Grey Limit Grey to white limit Excessfactor
Black Black List 2008 - 2010 2008-2010Korea,DemocraticPeople's Rep.
45 17 6 Very High RiskHigh Risk
7.31
Libyan ArabJamahiriya
47 14 7 5.09
Togo 150 37 16 5.02
Sierra Leone 570 114 50 4.44
Montenegro 34 10 5 4.43
Albania 222 44 22 High risk 3.86
Moldova,Republic of 461 77 42 3.31
Cambodia 863 135 73 3.22
St Kitts andNevis
488 76 44 2.99
Comoros 644 98 56 Medium Risk to HighRisk
2.99
Georgia 776 106 67 2.57
Bolivia 40 8 6 2.24
Lebanon 72 12 9 2.04
Syrian ArabRepublic
246 33 24 2.02
Tanzania UnitedRep.
65 10 8 Medium risk 1.62
Ukraine 471 50 43 1.47St Vincent andthe Grenadines
1,957 168 156 1.19
Azerbaijan 69 9 9 1.07
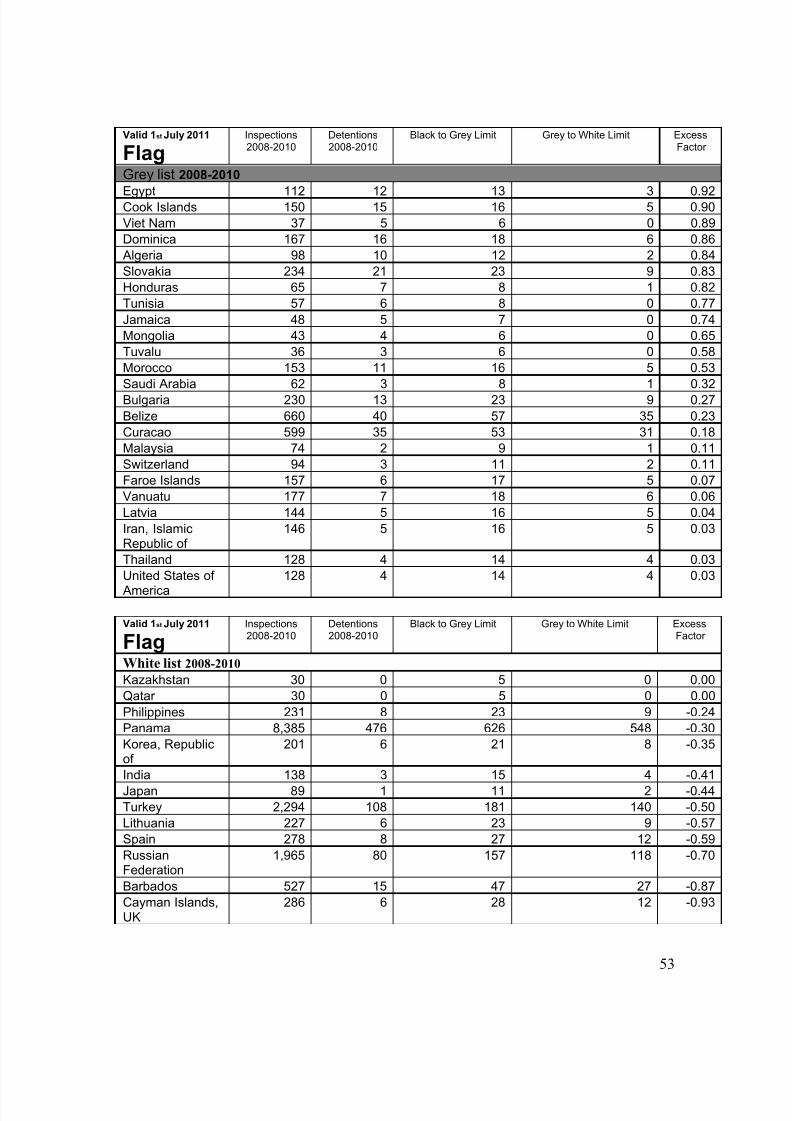
8/12/2019 15 Years of Shipping Accidents a Review for Wwf
http://slidepdf.com/reader/full/15-years-of-shipping-accidents-a-review-for-wwf 53/56
53
Valid 1st July 2011
FlagInspections2008-2010
Detentions2008-2010
Black to Grey Limit Grey to White Limit ExcessFactor
Grey list 2008-2010
Egypt 112 12 13 3 0.92Cook Islands 150 15 16 5 0.90
Viet Nam 37 5 6 0 0.89
Dominica 167 16 18 6 0.86
Algeria 98 10 12 2 0.84
Slovakia 234 21 23 9 0.83
Honduras 65 7 8 1 0.82
Tunisia 57 6 8 0 0.77
Jamaica 48 5 7 0 0.74
Mongolia 43 4 6 0 0.65
Tuvalu 36 3 6 0 0.58
Morocco 153 11 16 5 0.53
Saudi Arabia 62 3 8 1 0.32
Bulgaria 230 13 23 9 0.27
Belize 660 40 57 35 0.23
Curacao 599 35 53 31 0.18
Malaysia 74 2 9 1 0.11
Switzerland 94 3 11 2 0.11
Faroe Islands 157 6 17 5 0.07
Vanuatu 177 7 18 6 0.06
Latvia 144 5 16 5 0.04
Iran, IslamicRepublic of
146 5 16 5 0.03
Thailand 128 4 14 4 0.03
United States of
America
128 4 14 4 0.03
Valid 1st July 2011
FlagInspections2008-2010
Detentions2008-2010
Black to Grey Limit Grey to White Limit ExcessFactor
White list 2008-2010
Kazakhstan 30 0 5 0 0.00
Qatar 30 0 5 0 0.00
Philippines 231 8 23 9 -0.24
Panama 8,385 476 626 548 -0.30
Korea, Republicof
201 6 21 8 -0.35
India 138 3 15 4 -0.41
Japan 89 1 11 2 -0.44
Turkey 2,294 108 181 140 -0.50
Lithuania 227 6 23 9 -0.57
Spain 278 8 27 12 -0.59
RussianFederation
1,965 80 157 118 -0.70
Barbados 527 15 47 27 -0.87
Cayman Islands,UK
286 6 28 12 -0.93
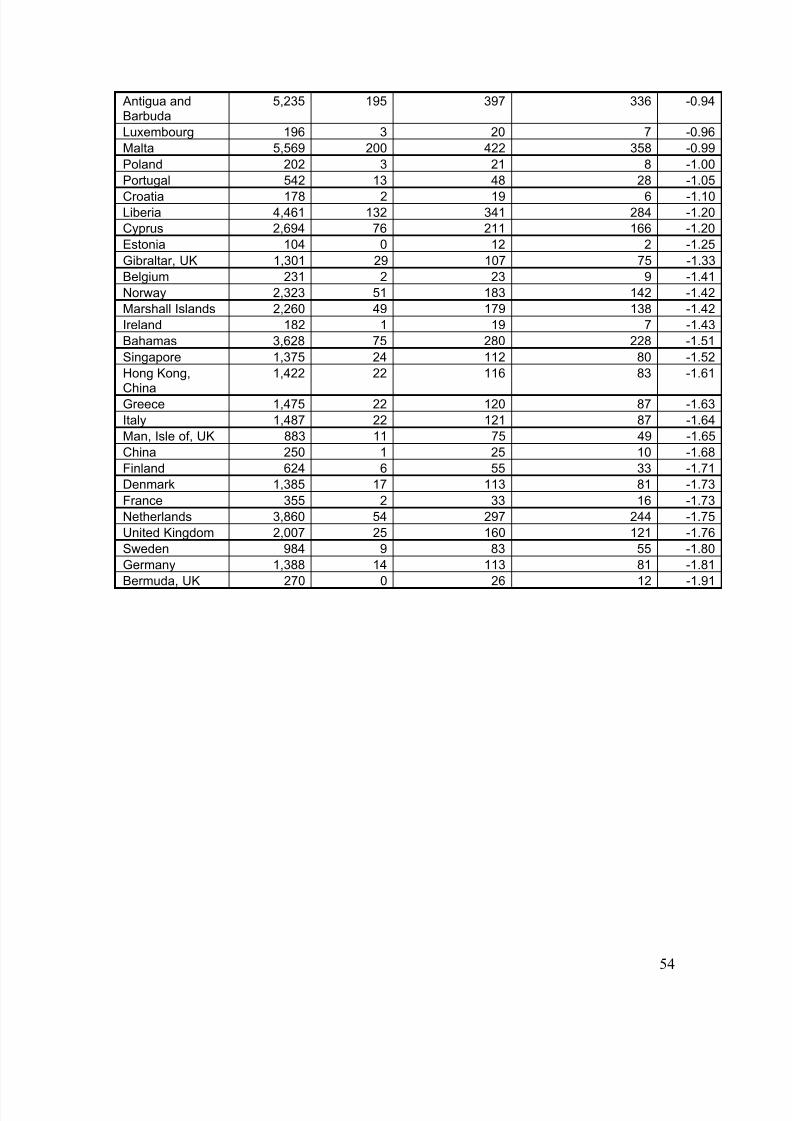
8/12/2019 15 Years of Shipping Accidents a Review for Wwf
http://slidepdf.com/reader/full/15-years-of-shipping-accidents-a-review-for-wwf 54/56
54
Antigua andBarbuda
5,235 195 397 336 -0.94
Luxembourg 196 3 20 7 -0.96
Malta 5,569 200 422 358 -0.99
Poland 202 3 21 8 -1.00
Portugal 542 13 48 28 -1.05
Croatia 178 2 19 6 -1.10Liberia 4,461 132 341 284 -1.20
Cyprus 2,694 76 211 166 -1.20
Estonia 104 0 12 2 -1.25
Gibraltar, UK 1,301 29 107 75 -1.33
Belgium 231 2 23 9 -1.41
Norway 2,323 51 183 142 -1.42
Marshall Islands 2,260 49 179 138 -1.42
Ireland 182 1 19 7 -1.43
Bahamas 3,628 75 280 228 -1.51
Singapore 1,375 24 112 80 -1.52
Hong Kong,
China
1,422 22 116 83 -1.61
Greece 1,475 22 120 87 -1.63
Italy 1,487 22 121 87 -1.64
Man, Isle of, UK 883 11 75 49 -1.65
China 250 1 25 10 -1.68
Finland 624 6 55 33 -1.71
Denmark 1,385 17 113 81 -1.73
France 355 2 33 16 -1.73
Netherlands 3,860 54 297 244 -1.75
United Kingdom 2,007 25 160 121 -1.76
Sweden 984 9 83 55 -1.80
Germany 1,388 14 113 81 -1.81
Bermuda, UK 270 0 26 12 -1.91
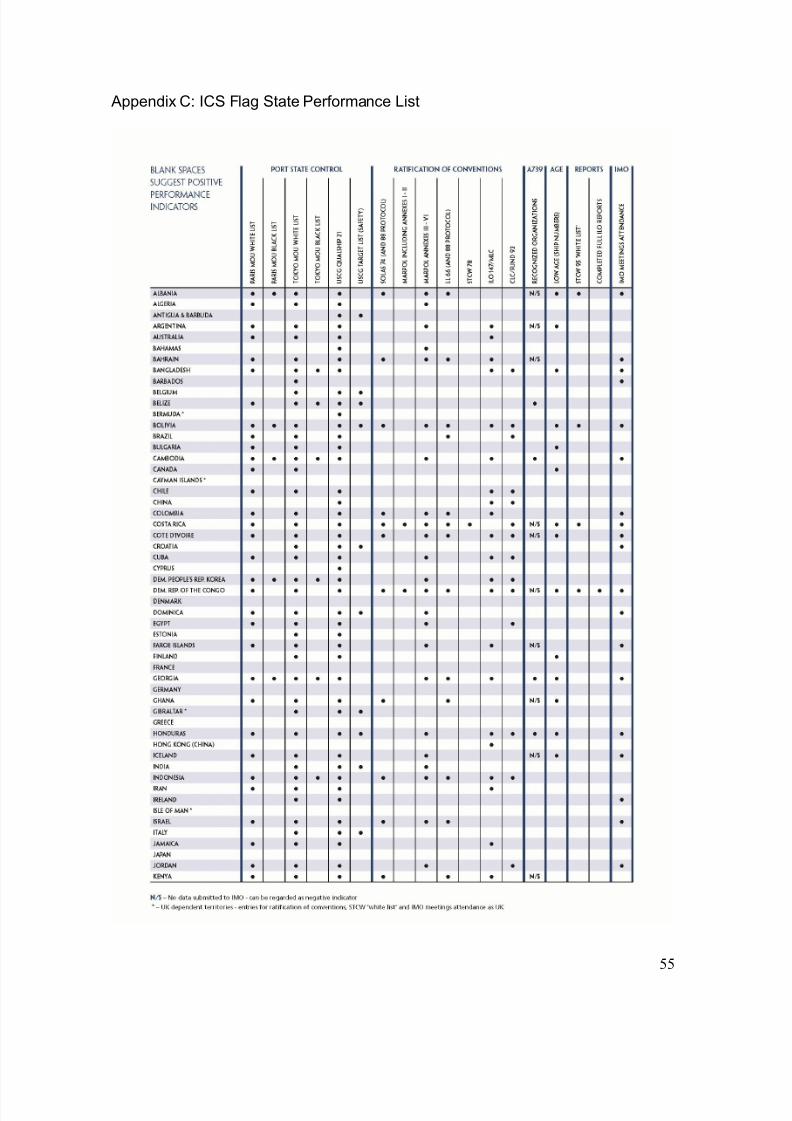
8/12/2019 15 Years of Shipping Accidents a Review for Wwf
http://slidepdf.com/reader/full/15-years-of-shipping-accidents-a-review-for-wwf 55/56
55
Appendix C: ICS Flag State Performance List
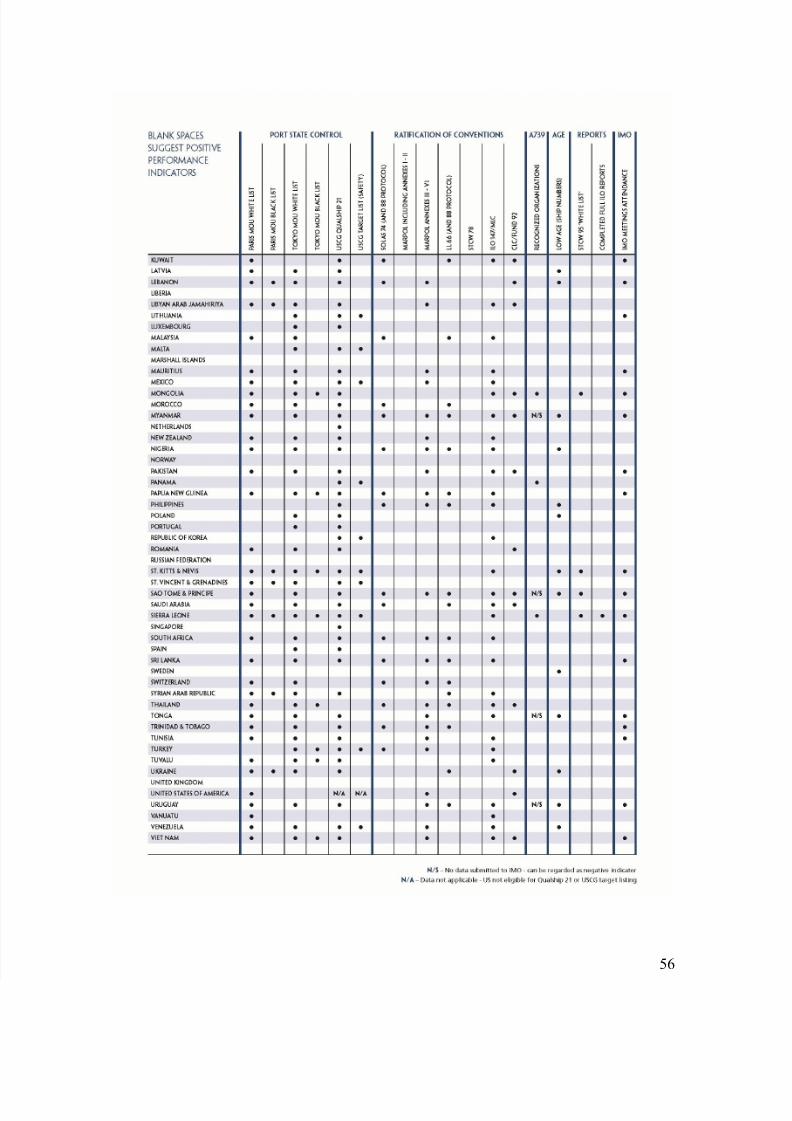
8/12/2019 15 Years of Shipping Accidents a Review for Wwf
http://slidepdf.com/reader/full/15-years-of-shipping-accidents-a-review-for-wwf 56/56