15.023j / 12.848j / esd.128j global climate change ... · material for this chapter. temperature...
TRANSCRIPT
MIT OpenCourseWare http://ocw.mit.edu
15.023J / 12.848J / ESD.128J Global Climate Change: Economics, Science, and PolicySpring 2008
For information about citing these materials or our Terms of Use, visit: http://ocw.mit.edu/terms.

THE CLIMATE MACHINE IV
REGIONAL EFFECTS OF CLIMATE CHANGE
R. PRINN, April 7, 2008
15.023 - 12.848 - 12.308 - ESD.128
GLOBAL CLIMATE CHANGE : ECONOMICS, SCIENCE, AND POLICY

Projecting Future Regional Impacts
How many climate forecasts are needed?
Answer depends on accuracy of forecasts
A CASE STUDY: CLIMATE CHANGE IMPACTSON THE UNITED STATES
(National Assessment Synthesis Team, U.S. Climate Change Research Program, 2000)

Climate Change Impacts on the United States - OverviewNational Assessment Team - US Global Change Research Program
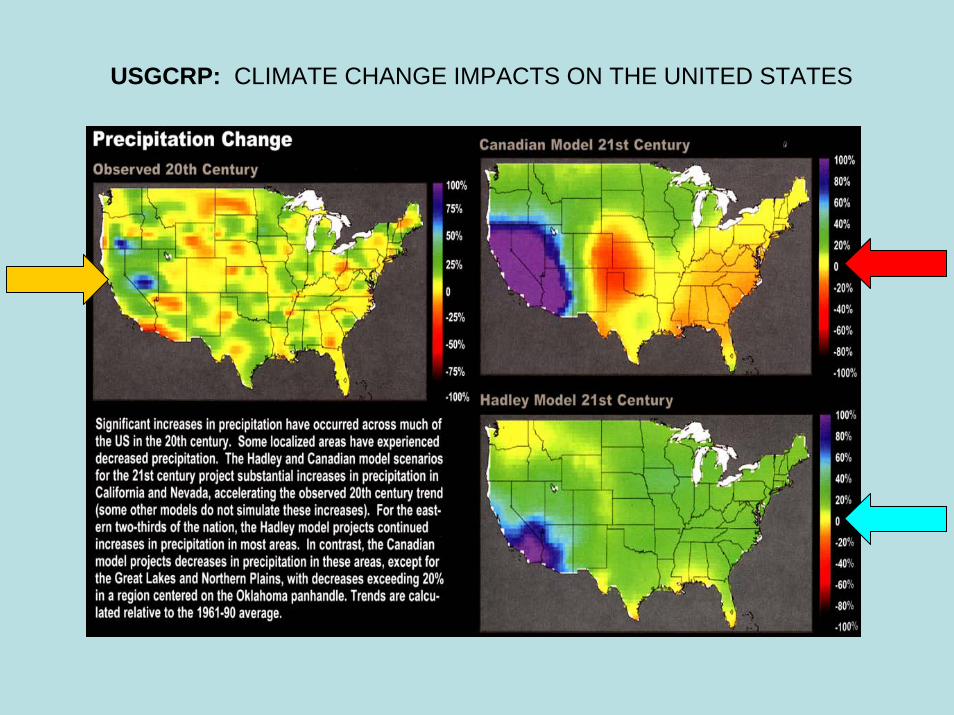
The two primary climate models used in this Assessment have been peer-reviewed and both incorporate similar assumptions about future emissions (both approximate the IPCC “IS92a”scenario with a 1%per year increase in greenhouse gases and growing sulfur emissions).
HOT
MEDIUM
COOL

USGCRP: CLIMATE CHANGE IMPACTSON THE UNITED STATES

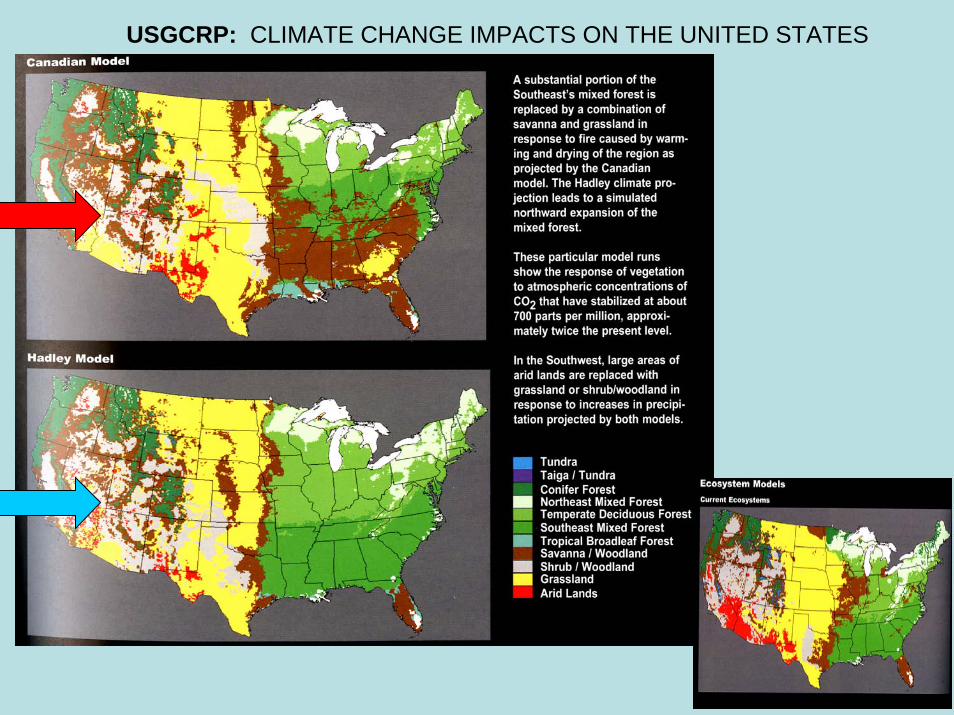
USGCRP: CLIMATE CHANGE IMPACTS ON THE UNITED STATES
USGCRP: CLIMATE CHANGE IMPACTS ON THE UNITED STATES

USGCRP: CLIMATE CHANGE IMPACTSON THE UNITED STATES

CLIMATE CHANGE IMPACTS ON ECOSYSTEMS
National Assessment Synthesis Team, Climate Change Impacts on the United States: The Potential Consequences of Climate Variability and Change (Washington, DC: U.S. Global Change Research Program, 2000). Courtesy of The U.S. Global Change Research Program (USGCRP). Used with permission.

USGCRP: CLIMATE CHANGE IMPACTS ON THE UNITED STATES
USGCRP: CLIMATE CHANGE IMPACTS ON THE UNITED STATES

USGCRP: CLIMATE CHANGE IMPACTS ON THE UNITED STATES

USGCRP: CLIMATE CHANGE IMPACTS ON THE UNITED STATES

What are the strengths of this analysis?
What are the weaknesses?
How could this assessment be more effective next time?
RETROSPECTIVE ANALYSIS

What are the effects on temperature, rainfall & water supply by region over
the globe?How do developing countries
fare relative to developed countries?
Use results from the IPCC 4th Assessment, WG1, Chapters 10-11,
Regional Climate Change
REGIONAL IMPACTS OVER THE GLOBE
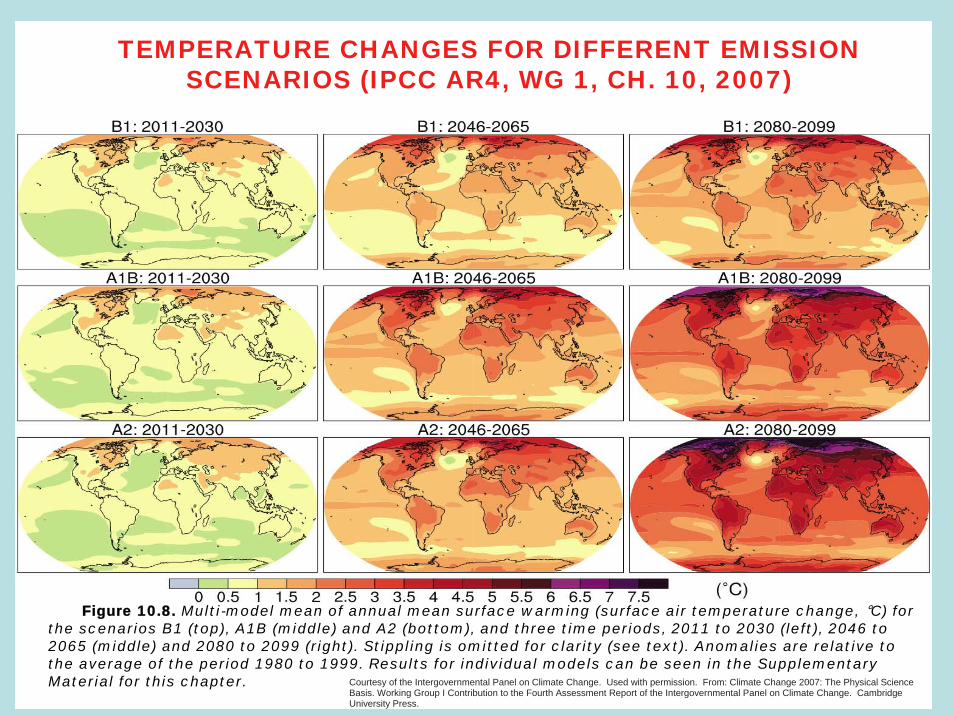
Figure 10.8. Multi-model mean of annual mean surface warming (surface air temperature change, °C) for the scenarios B1 (top), A1B (middle) and A2 (bottom), and three time periods, 2011 to 2030 (left), 2046 to2065 (middle) and 2080 to 2099 (right). Stippling is omitted for clarity (see text). Anomalies are relative tothe average of the period 1980 to 1999. Results for individual models can be seen in the Supplementary Material for this chapter.
TEMPERATURE CHANGES FOR DIFFERENT EMISSION SCENARIOS (IPCC AR4, WG 1, CH. 10, 2007)
Courtesy of the Intergovernmental Panel on Climate Change. Used with permission. From: Climate Change 2007: The Physical Science Basis. Working Group I Contribution to the Fourth Assessment Report of the Intergovernmental Panel on Climate Change. Cambridge University Press.
Ref: IPCC 4th Assessment, Working Group 1, Chapter 11, 2007
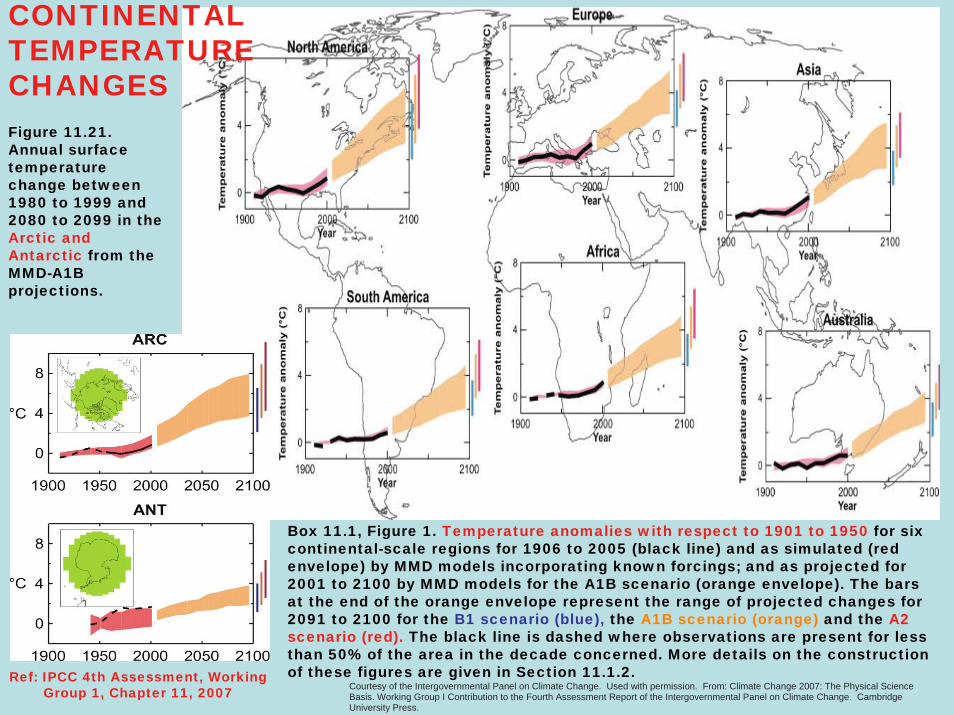
Box 11.1, Figure 1. Temperature anomalies with respect to 1901 to 1950 for six continental-scale regions for 1906 to 2005 (black line) and as simulated (redenvelope) by MMD models incorporating known forcings; and as projected for 2001 to 2100 by MMD models for the A1B scenario (orange envelope). The bars at the end of the orange envelope represent the range of projected changes for2091 to 2100 for the B1 scenario (blue), the A1B scenario (orange) and the A2 scenario (red). The black line is dashed where observations are present for less than 50% of the area in the decade concerned. More details on the constructionof these figures are given in Section 11.1.2.
Figure 11.21.Annual surface temperature change between1980 to 1999 and2080 to 2099 in the Arctic andAntarctic from the MMD-A1B projections.
CONTINENTAL TEMPERATURE CHANGES
Courtesy of the Intergovernmental Panel on Climate Change. Used with permission. From: Climate Change 2007: The Physical Science Basis. Working Group I Contribution to the Fourth Assessment Report of the Intergovernmental Panel on Climate Change. Cambridge University Press.

Box 11.1, Figure 2. Robust findings onregional climate change for mean and extreme precipitation, drought, andsnow. This regional assessment is based upon AOGCM based studies, Regional Climate Models, statistical downscaling and process understanding. More detailon these findings may be found in thenotes below, and their full description, including sources is given in the text. The background map indicates thedegree of consistency between AR4AOGCM simulations (21 simulations used) in the direction of simulated precipitation change.
(1) Very likely annual mean increase in most of northern Europe and the Arctic(largest in cold season), Canada, and the North-East USA; and winter (DJF) mean increase in Northern Asia and the Tibetan Plateau.(2) Very likely annual mean decrease in most of the Mediterranean area, and winter (JJA) decrease in southwestern Australia.(3) Likely annual mean increase in tropical and East Africa, Northern Pacific,the northern Indian Ocean, the South Pacific (slight, mainly equatorial regions),the west of the South Island of New Zealand, Antarctica and winter (JJA)increase in Tierra del Fuego.(4) Likely annual mean decrease in and along the southern Andes, summer(DJF) decrease in eastern French Polynesia, winter (JJA) decrease forSouthern Africa and in the vicinity of Mauritius, and winter and spring decrease in southern Australia.(5) Likely annual mean decrease in North Africa, northern Sahara, CentralAmerica (and in the vicinity of the Greater Antilles in JJA) and in South-West USA.(6) Likely summer (JJA) mean increase in Northern Asia, East Asia, South Asiaand most of Southeast Asia, and likely winter (DJF) increase in East Asia.(7) Likely summer (DJF) mean increase in southern Southeast Asia and southeastern South America(8) Likely summer (JJA) mean decrease in Central Asia, Central Europe and Southern Canada.(9) Likely winter (DJF) mean increase in central Europe, and southern Canada(10) Likely increase in extremes of daily precipitation in northern Europe,South Asia, East Asia, Australia and New Zealand.(11) Likely increase in risk of drought in Australia and eastern New Zealand;the Mediterranean, central Europe (summer drought); in Central America (boreal spring and dry periods of the annual cycle).(12) Very likely decrease in snow season length and likely to very likely decrease in snow depth in most of Europe and North America.
Courtesy of the Intergovernmental Panel on Climate Change. Used with permission. From: Climate Change 2007: The Physical SciencBasis. Working Group I Contribution to the Fourth Assessment Report of the Intergovernmental Panel on Climate Change. Cambridge University Press.
e
Ref: IPCC 4th Assessment, Working Group 1, Chapter 11, 2007
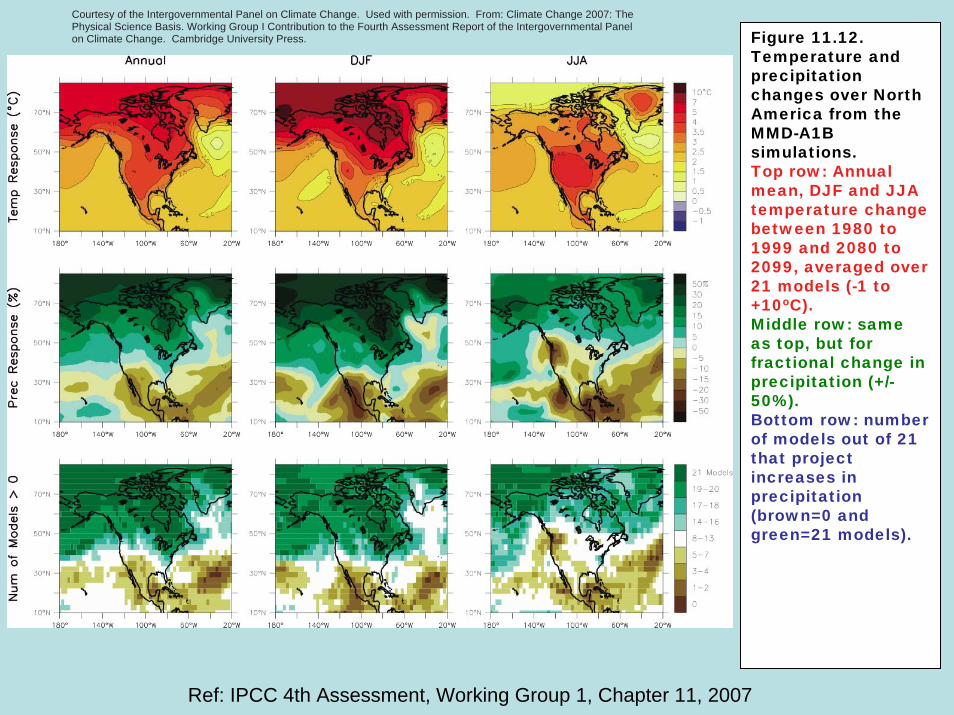
Figure 11.12. Temperature and precipitation changes over North America from the MMD-A1B simulations. Top row: Annual mean, DJF and JJA temperature change between 1980 to 1999 and 2080 to2099, averaged over 21 models (-1 to +10oC).Middle row: sameas top, but for fractional change in precipitation (+/-50%).Bottom row: number of models out of 21 that project increases in precipitation (brown=0 and green=21 models).
Courtesy of the Intergovernmental Panel on Climate Change. Used with permission. From: Climate Change 2007: The Physical Science Basis. Working Group I Contribution to the Fourth Assessment Report of the Intergovernmental Panel on Climate Change. Cambridge University Press.
Ref: IPCC 4th Assessment, Working Group 1, Chapter 11, 2007
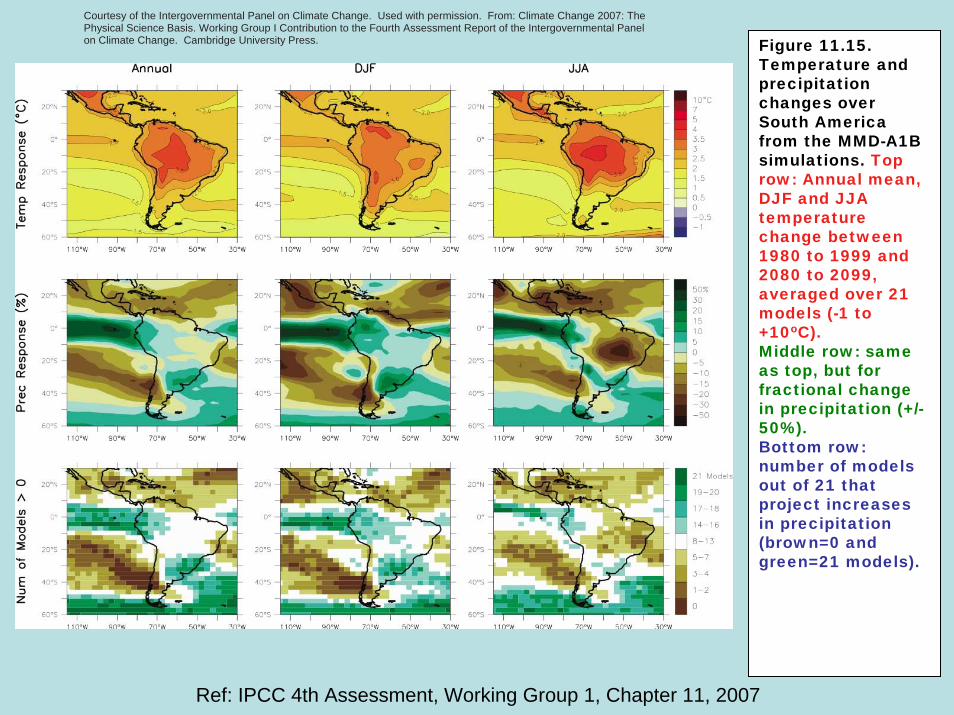
Figure 11.15. Temperature and precipitation changes over South America from the MMD-A1B simulations. Top row: Annual mean, DJF and JJA temperature change between 1980 to 1999 and 2080 to 2099, averaged over 21 models (-1 to +10oC).Middle row: sameas top, but for fractional change in precipitation (+/-50%).Bottom row: number of models out of 21 that project increasesin precipitation (brown=0 and green=21 models).
Courtesy of the Intergovernmental Panel on Climate Change. Used with permission. From: Climate Change 2007: The Physical Science Basis. Working Group I Contribution to the Fourth Assessment Report of the Intergovernmental Panel on Climate Change. Cambridge University Press.
Ref: IPCC 4th Assessment, Working Group 1, Chapter 11, 2007
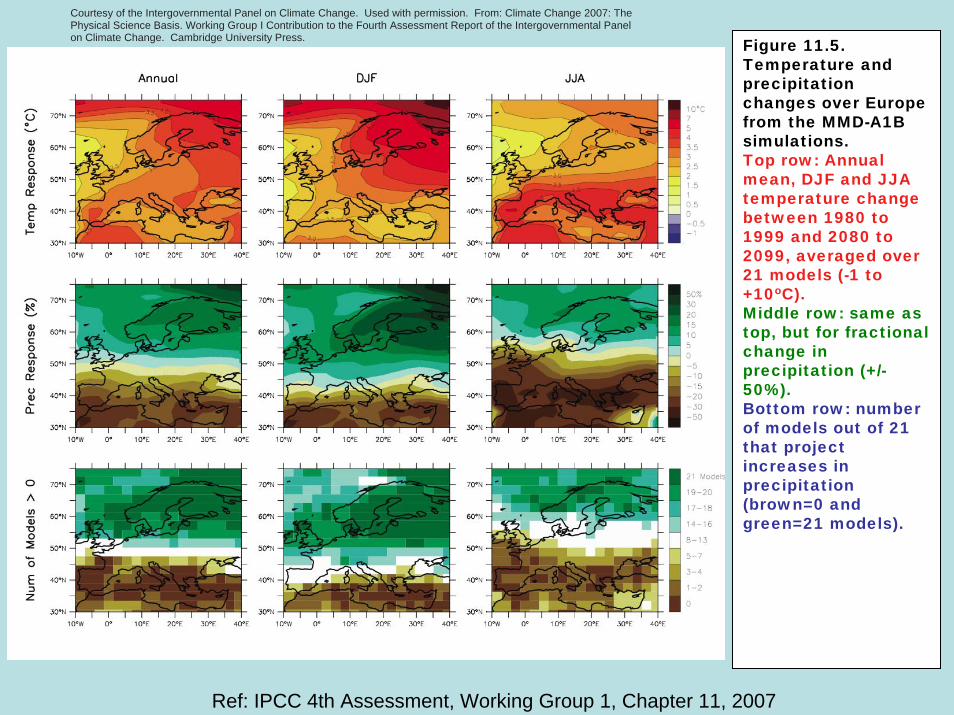
Figure 11.5. Temperature and precipitation changes over Europe from the MMD-A1B simulations. Top row: Annual mean, DJF and JJA temperature change between 1980 to 1999 and 2080 to2099, averaged over 21 models (-1 to +10oC).Middle row: same as top, but for fractional change in precipitation (+/-50%).Bottom row: number of models out of 21 that project increases in precipitation (brown=0 and green=21 models).
Courtesy of the Intergovernmental Panel on Climate Change. Used with permission. From: Climate Change 2007: The Physical Science Basis. Working Group I Contribution to the Fourth Assessment Report of the Intergovernmental Panel on Climate Change. Cambridge University Press.
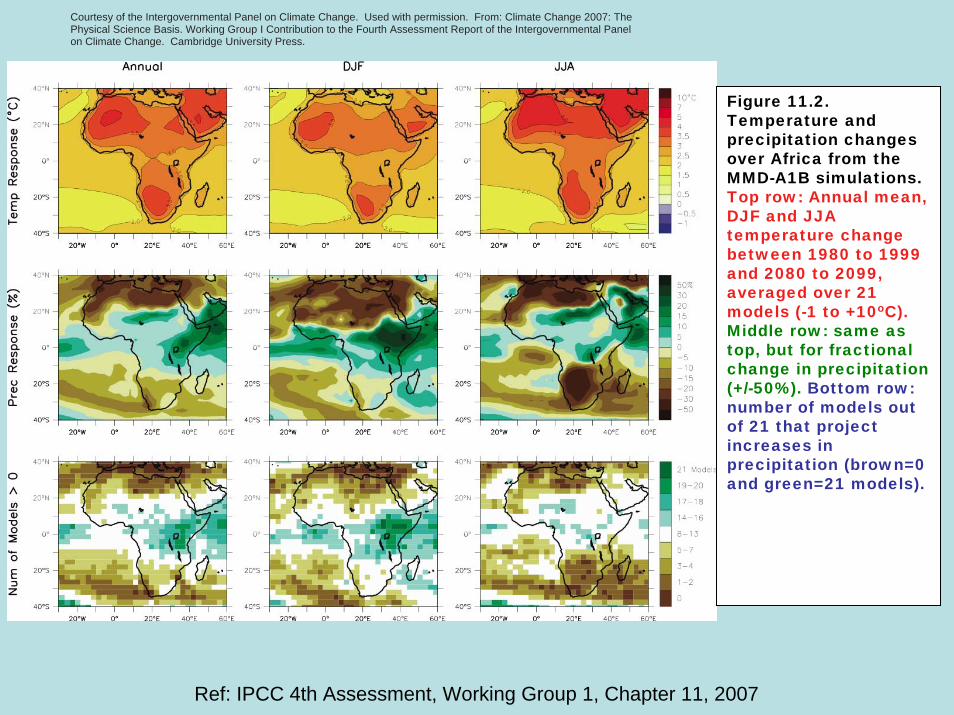
Figure 11.2. Temperature and precipitation changes over Africa from the MMD-A1B simulations. Top row: Annual mean, DJF and JJA temperature change between 1980 to 1999 and 2080 to 2099, averaged over 21 models (-1 to +10oC).Middle row: same as top, but for fractional change in precipitation (+/-50%). Bottom row: number of models out of 21 that project increases in precipitation (brown=0 and green=21 models).
Ref: IPCC 4th Assessment, Working Group 1, Chapter 11, 2007
Courtesy of the Intergovernmental Panel on Climate Change. Used with permission. From: Climate Change 2007: The Physical Science Basis. Working Group I Contribution to the Fourth Assessment Report of the Intergovernmental Panel on Climate Change. Cambridge University Press.
Ref: IPCC 4th Assessment, Working Group 1, Chapter 11, 2007
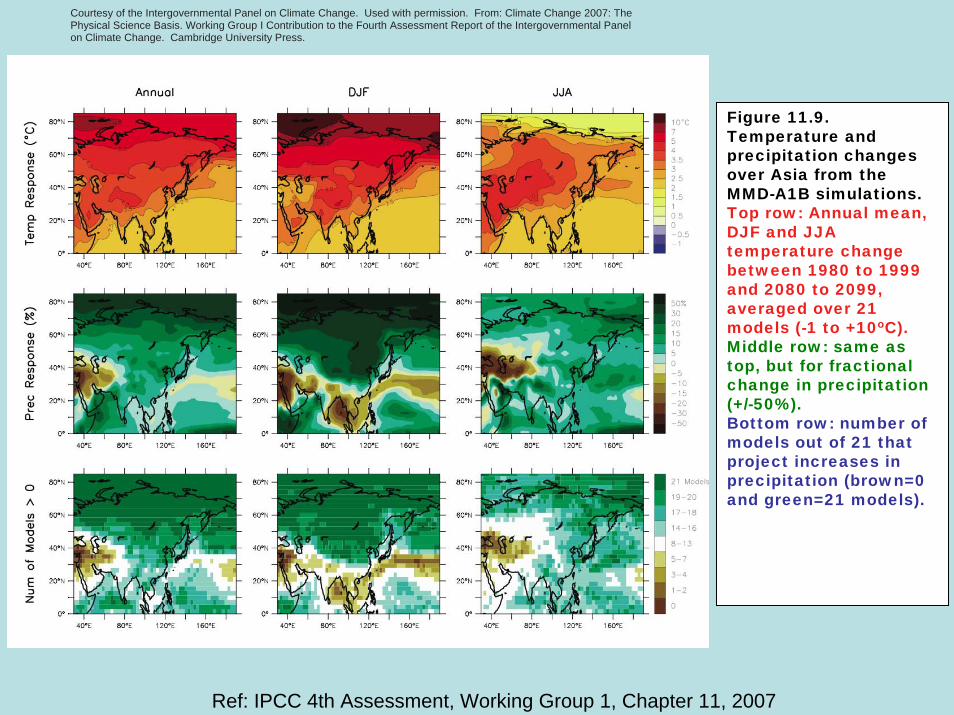
Figure 11.9. Temperature and precipitation changes over Asia from the MMD-A1B simulations. Top row: Annual mean, DJF and JJA temperature change between 1980 to 1999 and 2080 to 2099, averaged over 21 models (-1 to +10oC).Middle row: same as top, but for fractional change in precipitation (+/-50%).Bottom row: number of models out of 21 that project increases in precipitation (brown=0 and green=21 models).
Courtesy of the Intergovernmental Panel on Climate Change. Used with permission. From: Climate Change 2007: The Physical Science Basis. Working Group I Contribution to the Fourth Assessment Report of the Intergovernmental Panel on Climate Change. Cambridge University Press.

Ref: IPCC 4th Assessment, Working Group 1, Chapter 11, 2007
Figure 11.17. Temperature and precipitation changes over Australia & New Zealand from the MMD-A1B simulations. Top row: Annual mean, DJF and JJA temperature change between 1980 to 1999 and 2080 to2099, averaged over 21 models (-1 to +10oC).Middle row: same as top, but for fractional change in precipitation (+/-50%).Bottom row: number of models out of 21 that project increases in precipitation (brown=0 and green=21 models).
Courtesy of the Intergovernmental Panel on Climate Change. Used with permission. From: Climate Change 2007: The Physical Science Basis. Working Group I Contribution to the Fourth Assessment Report of the Intergovernmental Panel on Climate Change. Cambridge University Press.

Ref: IPCC 4th Assessment, Working Group 1, Chapter 11, 2007
Figure 11.21. Annual surface temperature change between 1980 to1999 and 2080 to 2099 in the Arctic and Antarctic from the MMD-A1B projections.
Figure 11.19. Annual cycle of arctic area mean temperature and percentage precipitation changes (averaged over the area north of 60°N) for 2080 to 2099 minus 1980 to 1999, under the A1B scenario. Thick lines represent the ensemble median of the 21 MMD models. The dark grey area represents the 25 and 75% quartile values among the 21 models, while the light grey area shows the total range of the models.
Courtesy of the Intergovernmental Panel on Climate Change. Used with permission. From: Climate Change 2007: The Physical Science Basis. Working Group I Contribution to the Fourth Assessment Report of the Intergovernmental Panel on Climate Change. Cambridge University Press.

Ref: IPCC 4th Assessment, Working Group 1, Chapter 11, 2007
Figure 10.32. Local sea level change (m) due to ocean density and circulation change relative to the global average (i.e., positive values indicate greater local sea level change than global) during the 21st century, calculated as the difference between averages for 2080 to 2099 and 1980 to 1999, as an ensemble mean over 16 AOGCMs forced with the SRES A1B scenario. Stippling denotes regions where the magnitude of the multi-model ensemble mean divided by the multi-model standard deviation exceeds 1.0. Courtesy of the Intergovernmental Panel on Climate Change. Used with permission. From: Climate Change 2007: The Physical Science
Basis. Working Group I Contribution to the Fourth Assessment Report of the Intergovernmental Panel on Climate Change. Cambridge University Press.

CONCLUDING REMARKS(1) IPCC AR4 MULTI-(3D) MODEL ENSEMBLES
HAVE PROVIDED OBJECTIVE KNOWLEDGEOF UNCERTAINTY IN REGIONAL CLIMATEPREDICTIONS (GIVEN “CERTAIN” EMISSIONSCENARIOS) THAT ARE USEFUL IN POLICYDISCUSSIONS.
(2) BUT THE PROBABILITY AND UNDERLYINGECONOMIC, TECHNOLOGICAL, AND POLICYASSUMPTIONS IN THESE (SRES) EMISSION SCENARIOS ARE TOO OBSCURE TO INCORPORATE EMISSIONS UNCERTAINTY INTO CLIMATE PREDICTIONS.
(3) THE IPCC HAS YET TO CONNECT THE 3 WORKING GROUPS IN A WAY THAT FACILITATES AN EFFECTIVE INTEGRATEDASSESSMENT.