1565 japan annual report april 2017...
TRANSCRIPT

We present the Annual Report of Japan SmallerCapitalization Fund, Inc. (the “Fund”) for the fiscalyear ended February 28, 2017.
The net asset value per share (“NAV”) of theFund increased by 24.8% and the closing marketprice of the Fund (on the New York Stock Ex-change) increased by 29.4% after giving effect tothe reinvestment of income dividends, ordinary in-come distributions, and long-term capital gaindistributions for the fiscal year ended February 28,2017. The closing market price of the Fund on Feb-ruary 28, 2017 was $10.60, representing a discountof 12.3% to the NAV of $12.09. The net assets ofthe Fund totaled $342,513,124 on February 28,2017.
The Russell/Nomura Small Cap™ Index, theFund’s benchmark (“Benchmark”), increased by26.7% in United States (“U.S.”) dollar terms. Duringthe fiscal year ended February 28, 2017, the Fundunderperformed the Benchmark by 1.9% on a NAVbasis. The Tokyo Price Index (the “TOPIX”), a capi-talization-weighted index of all companies listed onthe First Section of the Tokyo Stock Exchange (the“TSE”), increased by 19.2% and the Nikkei StockAverage Index (“Nikkei”), a price-weighted index ofthe 225 leading stocks on the TSE, increased by20.2% in U.S. dollar terms for the year ended Feb-ruary 28, 2017. The Japanese yen (“Yen”)appreciated by 0.8% against the U.S. dollar duringthe fiscal year ended February 28, 2017.
For the quarter ended February 28, 2017, theBenchmark increased by 9.4%, the TOPIX in-creased by 6.6%, and the Nikkei increased by6.5% in U.S. dollar terms. The NAV of the Fund in-creased by 9.9% and outperformed theBenchmark by 0.5%. The Fund’s share price in-creased by 11.2% during the quarter. The Yenappreciated by 2.0% against the U.S. dollar dur-
ing the quarter.
Investment Strategy
The Fund invests in undervalued stocks that of-fer fundamental strength and potential forimprovement. The Fund performs extensive fun-damental research to identify stocks that cancreate shareholder value. The Fund focuses oncompanies that are leaders in certain niche mar-kets, companies with large or expanding marketshares, stocks with superior shareholder distribu-tion policies, and stocks that offer good growthprospects. In the Japanese small cap equity mar-ket, valuation anomalies do exist and can beexploited through active management. There are anumber of factors that the Fund considers whenselling an investment, including a stock which ap-pears fully valued, unexpected deterioration inearnings or a substantial loss that impairs thecompany’s net assets, and a stock’s diminishingpotential given declining competitiveness due to achange of business environment or failure of busi-ness strategy.
Performance
In terms of the sector allocation strategy, over-weight positions in the Metal Products andChemicals sectors and an underweight position inthe Services sector produced positive contribu-tors. Sector returns were eroded by anunderweight position in the Nonferrous Metal sec-tor and an overweight position in the Warehousingsector.
Relative performance was positively impactedby Start Today Co., Ltd. in the Retail Trade sector,Mory Industries Inc. in the Iron and Steel sector,and Sakai Chemical Industry Co., Ltd. in the
JAPAN SMALLER CAPITALIZATION FUND, INC.
April 21, 2017
To Our Shareholders:

Chemicals sector. Conversely, relative perfor-mance was negatively impacted by ToenecCorporation in the Construction sector, NishikawaRubber Co., Ltd. in the Other Products sector, andKitagawa Industries Co., Ltd. in the Electric Appli-ances sector.
Market Review
The Benchmark increased by 25.8% and out-performed the TOPIX index, which increased by18.3% in local currency terms, for the fiscal yearended February 28, 2017. Excluding stocks thatplummeted following the United Kingdom (“U.K”)Brexit referendum in June 2016, the Japanese eq-uity market continued to trade within a relativelynarrow range until September 2016, yet equityprices rose dramatically following the election ofDonald Trump in the November 2016 U.S. presi-dential election.
After the sell-off in global equities markets thatbegan in December 2015, Japanese equities re-covered somewhat in March 2016. Investorsentiment improved as crude oil prices bottomedin February 2016 and other global equity marketsstarted to rebound.
During the second quarter of 2016, Japaneseequities remained within a relatively narrow rangeuntil a major sell-off in June 2016. The outcome ofthe U.K.’s Brexit referendum to exit the EuropeanUnion (“EU”) prompted risk aversion among in-vestors globally and triggered a global marketsell-off. While the direct impact of the U.K. Brexitreferendum vote on the Japanese economy ap-pears limited, the rapid equity market sell-offresulting from the exchange rate volatility is ex-pected to have a negative impact on theprofitability of exporters.
The ruling coalition parties’ victory in Japan’supper house election fueled expectations forlarge-scale economic stimulus measures resultingin a market rebound in mid-July 2016 that was fur-
ther reinforced when concerns about a slowdownin the U.S. economy were eased by stronger thanexpected employment data. From the end of Julythrough September 2016, Japanese equities weretrading within a thin volume range.
Japanese equities rose during the fourth quar-ter of 2016 given expectations of new fiscalstimulus policies from the incoming U.S. adminis-tration and improved earnings from thesubstantial strengthening of the U.S. dollaragainst the Yen. There is growing optimism of in-creased fiscal spending and future tax cuts in theU.S. causing long-term U.S. interest rates and theU.S. dollar to increase since mid-November 2016.As expected, the Federal Reserve Board raisedthe federal funds rate following its final policymeeting of the 2016 year end. Relatively hawkishstatements from the Federal Reserve Boardraised expectations for additional federal fundsrate increases in 2017, which suggests a wideninginterest rate gap between the U.S. and Japan.Since the beginning of 2017, Japanese equitiesare again trading within a relatively narrow rangedue to concerns over comments from the incom-ing U.S. President.
Outlook and Future Strategy
The progression of the global cyclical recoverytrend is evidenced by indicators such as the sixthconsecutive month above the growth threshold of50 for the U.S. ISM Manufacturing Production In-dex. Although the recovery in Japan’s domesticconsumption is still struggling to gain traction, theFund believes that production output trends areimproving in response to stronger external de-mand. Falling inventory levels as well asexpansionary fiscal policies in the U.S. and Chinashould also continue to support the fundamentaloutlook for Japanese equities.
President Trump’s first speech to the U.S. Con-gress in February 2017 offered no surprises and
market attention quickly shifted to the possibilityof a U.S. interest rate hike in March 2017. Sincethe long-term interest rate in Japan is controlledby the Bank of Japan, a potential hike in U.S. in-terest rates could put upward pressure on theU.S. dollar against the Yen causing a wider inter-est rate gap. Along with the global cyclicalrecovery trend, the Fund is currently more bullishabout cyclical sectors in the Japanese stock mar-ket.
Nonetheless, there are potential risks to whichthe Japanese markets remain vulnerable. The Of-fice of the U.S. Trade Representative issued atrade policy agenda in March 2017 which poten-tially could harm the outlook for Japaneseexporters, especially in the automaker industry.The policy faces a lengthy and contentious debatein the U.S. Congress. Delays or scaling down ofpolicy implementation could lower market expec-tations, which would have a negative impact onmarket sentiment in the U.S. as well as Japan. Aseries of national elections in the EU over the nextmonths could also lead to turbulent investor sen-timent. France in particular is a source of risk,given the popularity of far-right National Frontleader Marine Le Pen in polls ahead of the May2017 presidential election. In February 2017, shestated her intention to hold a referendum on EUmembership, promote “smart protectionism” andimpose additional taxes on foreign workers. A LePen victory could trigger a short-term marketshock similar to that following the UK’s Brexit ref-erendum in June 2016.
Currently, the Fund expects these politicalshocks to have a relatively short lived impact onthe equity markets based on the resilient globaleconomy and the likelihood of policy responses tominimize the real impact of such shocks. Recentupward earnings revisions have kept the forwardprice to earnings ratio of the Japanese corporatesector at around 15, which the Fund believes isreasonable from a global comparison.
The Fund appreciates your continuing support.
Sincerely,
Yutaka ItabashiPresident

DISCLOSURESSources: Nomura Asset Management U.S.A. Inc., Nomura Asset Management Co., Ltd., and Bloomberg L.P. Past per-formance is not indicative of future results. There is a risk of loss.The NAV price is adjusted for reinvestment of income dividends, ordinary income distributions, and long-term capitalgain distributions. The New York Stock Exchange’s closing market price is adjusted for reinvestment of income divi-dends, ordinary income distributions, and long-term capital gain distributions. The Fund’s performance does not reflectsales commissions.This material contains the current opinions of the Fund’s manager, which are subject to change without notice. This ma-terial should not be considered investment advice. Statements concerning financial market trends are based on currentmarket conditions, which will fluctuate. There is no guarantee that these investment strategies will work under all marketconditions, and each investor should evaluate their ability to invest for the long term.Comparisons between changes in the Fund’s net asset value or market price per share and changes in the Fund’sbenchmark should be considered in light of the Fund’s investment policy and objective, the characteristics and qualityof the Fund’s investments, the size of the Fund, and variations in the Yen/U.S. dollar exchange rate. This report is for in-formational purposes only. Investment products offered are not FDIC insured, may lose value, and are not bankguaranteed.Indices are unmanaged and cannot be invested into directly.Certain information discussed in this report may constitute foward-looking statements within the meaning of the U.S.federal securities laws. The Fund believes that the expectations reflected in such forward-looking statements are basedon reasonable assumptions and can give no assurance that the Fund’s expectations will be achieved. Foward-lookinginformation is subject to certain risks, trends and uncertainties that could cause actual results to differ materially fromthose projected.The Russell/Nomura Small Cap™ Index represents approximately 15% of the total market capitalization of theRussell/Nomura Total Market™ Index. It measures the performance of the smallest Japanese equity securities in theRussell/Nomura Total Market™ Index. As of February 28, 2017, there are 1,148 securities in the Russell/Nomura SmallCap™ Index.
SHAREHOLDERS ACCOUNT INFORMATIONShareholders whose accounts are held in their own name may contact the Fund’s registrar Computershare Trust
Company, N.A., at (800) 426-5523 for information concerning their accounts.
PROXY VOTINGA description of the policies and procedures that the Fund uses to vote proxies relating to portfolio securities is avail-
able (1) without charge, upon request, by calling toll-free 1-800-833-0018; and (2) on the website of the Securities andExchange Commission (“SEC”) at http://www.sec.gov. Information about how the Fund voted proxies relating to secu-rities held in the Fund’s portfolio during the most recent 12-month period ended June 30 is available (1) without charge,upon request, by calling toll-free 1-800-833-0018; and (2) on the SEC’s web site at http://www.sec.gov.
Additional information about the Fund’s Board of Directors is available (1) without charge, upon request, by callingtoll-free 1-800-833-0018; and (2) on the website of the SEC at http://www.sec.gov in the Fund’s most recent proxy state-ment filing.
AVAILABILITY OF QUARTERLY SCHEDULE OF INVESTMENTSThe Fund files a schedule of portfolio holdings with the SEC for the first and third quarters of each fiscal year on Form
N-Q. The Fund’s Forms N-Q are available on the SEC’s web site at http://www.sec.gov. The Fund’s Forms N-Q may alsobe reviewed and copied at the SEC’s Public Reference Room in Washington, D.C. Information on the operation of thePublic Reference Room may be obtained by calling 1-800-SEC-0330.
SHARE REPURCHASESNotice is hereby given in accordance with Section 23(c) of the Investment Company Act of 1940 that from time to time
the Fund may repurchase shares of its common stock in the open market.
FUND CERTIFICATIONIn December 2016, the Fund filed its Principal Executive Officer Certification with the New York Stock Exchange pur-
suant to Section 303A.12(a) of the New York Stock Exchange Corporate Governance Listing Standards.
The Fund’s Principal Executive Officer and Principal Financial Officer Certifications pursuant to Section 302 of the Sar-banes-Oxley Act of 2002 were filed with the Fund’s Form N-CSR and are available on the SEC’s web site athttp://www.sec.gov.
INTERNET WEBSITENomura Asset Management U.S.A. Inc. has established an Internet website which highlights its history, investment
philosophy and process and products, which include the Fund.
The Internet web address is http://funds.nomura-asset.com.

JAPAN SMALLER CAPITALIZATION FUND, INC.
FUND HIGHLIGHTS—FEBRUARY 28, 2017 (Unaudited)
KEY STATISTICSNet Assets . . . . . . . . . . . . . . . . . . . . . . . . . . . . . . . . . . . . . . . . . . . . . . . . . . . . . $342,513,124Net Asset Value per Share . . . . . . . . . . . . . . . . . . . . . . . . . . . . . . . . . . . . . . . . . $12.09Closing Market Price . . . . . . . . . . . . . . . . . . . . . . . . . . . . . . . . . . . . . . . . . . . . . $10.60Percentage Change in Net Asset Value per Share*+ . . . . . . . . . . . . . . . . . . . . . 24.8%Percentage Change in Market Price*+ . . . . . . . . . . . . . . . . . . . . . . . . . . . . . . . . 29.4%
MARKET INDICES
Percentage change in market indices:* YEN U.S.$
Russell/Nomura Small Cap™ Index . . . . . . . . . . . . . . . . . . . . . . . . . . . . . . . . . 25.8% 26.7%Tokyo Price Index . . . . . . . . . . . . . . . . . . . . . . . . . . . . . . . . . . . . . . . . . . . . . . . 18.3% 19.2%Nikkei Stock Average Index . . . . . . . . . . . . . . . . . . . . . . . . . . . . . . . . . . . . . . . . 19.3% 20.2%
*From March 1, 2016 through February 28, 2017.+Reflects the percentage change in share price adjusted for reinvestment of income dividends, ordinary income distributions, and long-term capital gain distributions.
INDUSTRY DIVERSIFICATION % of % of Net Assets Net Assets
TEN LARGEST EQUITY HOLDINGS BY FAIR VALUE Fair % ofSecurity Value Net Assets
Sakai Chemical Industry Co., Ltd. . . . . . . . . . . . . . . . . . . . . . . . . . . . . . . . . . . . . . . . . . . . $9,676,277 2.8Ryoden Trading Company, Ltd. . . . . . . . . . . . . . . . . . . . . . . . . . . . . . . . . . . . . . . . . . . . . . 8,203,204 2.4Toenec Corporation . . . . . . . . . . . . . . . . . . . . . . . . . . . . . . . . . . . . . . . . . . . . . . . . . . . . . . 7,877,821 2.3Japan Transcity Corporation . . . . . . . . . . . . . . . . . . . . . . . . . . . . . . . . . . . . . . . . . . . . . . . 7,618,579 2.2Oiles Corporation . . . . . . . . . . . . . . . . . . . . . . . . . . . . . . . . . . . . . . . . . . . . . . . . . . . . . . . . 7,315,639 2.1SIIX Corporation . . . . . . . . . . . . . . . . . . . . . . . . . . . . . . . . . . . . . . . . . . . . . . . . . . . . . . . . . 7,270,031 2.1C. Uyemura & Co., Ltd. . . . . . . . . . . . . . . . . . . . . . . . . . . . . . . . . . . . . . . . . . . . . . . . . . . . 7,101,237 2.1Osaka Steel Co., Ltd. . . . . . . . . . . . . . . . . . . . . . . . . . . . . . . . . . . . . . . . . . . . . . . . . . . . . . 7,060,380 2.1Matsuda Sangyo Co., Ltd. . . . . . . . . . . . . . . . . . . . . . . . . . . . . . . . . . . . . . . . . . . . . . . . . . 6,974,207 2.0Hisaka Works, Ltd. . . . . . . . . . . . . . . . . . . . . . . . . . . . . . . . . . . . . . . . . . . . . . . . . . . . . . . . 6,816,292 2.0
Wholesale Trade . . . . . . . . . . . . . . . . . . . . . . 14.0Chemicals . . . . . . . . . . . . . . . . . . . . . . . . . . . 12.8Retail Trade . . . . . . . . . . . . . . . . . . . . . . . . . . 10.9Machinery . . . . . . . . . . . . . . . . . . . . . . . . . . . 7.2Transportation and Warehousing . . . . . . . . . 6.3Iron and Steel . . . . . . . . . . . . . . . . . . . . . . . . 6.3Electric Appliances . . . . . . . . . . . . . . . . . . . . 5.4Construction . . . . . . . . . . . . . . . . . . . . . . . . . 5.4Metal Products . . . . . . . . . . . . . . . . . . . . . . . 4.7Services . . . . . . . . . . . . . . . . . . . . . . . . . . . . . 4.4
Information and Communication . . . . . . . . . 3.9Real Estate . . . . . . . . . . . . . . . . . . . . . . . . . . 3.7Other Products . . . . . . . . . . . . . . . . . . . . . . . 3.3Banks . . . . . . . . . . . . . . . . . . . . . . . . . . . . . . 2.7Textiles and Apparel . . . . . . . . . . . . . . . . . . . 2.7Financing Business . . . . . . . . . . . . . . . . . . . . 1.7Transportation Equipment . . . . . . . . . . . . . . . 1.6Utilities . . . . . . . . . . . . . . . . . . . . . . . . . . . . . . 1.4Precision Instruments . . . . . . . . . . . . . . . . . . 0.6Food . . . . . . . . . . . . . . . . . . . . . . . . . . . . . . . 0.1

REPORT OF INDEPENDENT REGISTERED PUBLIC ACCOUNTING FIRM
To the Board of Directors and Shareholders of Japan Smaller Capitalization Fund, Inc.
We have audited the accompanying statement of assets and liabilities, including the schedule of investments, ofJapan Smaller Capitalization Fund, Inc. (the “Fund”) as of February 28, 2017, the related statement of operations forthe year then ended, the statement of changes in net assets for each of the two years in the period then ended, andthe financial highlights for each of the three years in the period then ended. These financial statements and financialhighlights are the responsibility of the Fund’s management. Our responsibility is to express an opinion on these finan-cial statements and financial highlights based on our audits. The financial highlights for the years ended February 28,2014 and 2013 were audited by other auditors. Those auditors expressed an unqualified opinion on those financialstatements and financial highlights in their reported dated April 24, 2014.
We conducted our audits in accordance with the standards of the Public Company Accounting Oversight Board(United States). Those standards require that we plan and perform the audit to obtain reasonable assurance aboutwhether the financial statements and financial highlights are free of material misstatement. The Fund is not required tohave, nor were we engaged to perform, an audit of its internal control over financial reporting. Our audits includedconsideration of internal control over financial reporting as a basis for designing audit procedures that are appropriatein the circumstances, but not for the purpose of expressing an opinion on the effectiveness of the Fund’s internal con-trol over financial reporting. Accordingly, we express no such opinion. An audit also includes examining, on a testbasis, evidence supporting the amounts and disclosures in the financial statements. Our procedures included confir-mation of securities owned as of February 28, 2017, by correspondence with the custodian and brokers. An audit alsoincludes assessing the accounting principles used and significant estimates made by management, as well as evalu-ating the overall financial statement presentation. We believe that our audits provide a reasonable basis for ouropinion.
In our opinion, the financial statements and financial highlights referred to above present fairly, in all material respects,the financial position of Japan Smaller Capitalization Fund, Inc. as of February 28, 2017 and the results of its opera-tions, the changes in net assets, and the financial highlights for each of the respective periods referred to inconformity with accounting principles generally accepted in the United States of America.
/s/ RSM US LLP
Boston, MassachusettsApril 21, 2017
JAPAN SMALLER CAPITALIZATION FUND, INC.

See notes to financial statements
JAPANESE EQUITY SECURITIESBanksThe Akita Bank, Ltd. . . . . . . . . . . . . . . . . . . . . . . . . . . . . . . . . 1,044,000 $ 2,904,915 $ 3,335,136 1.0
General banking servicesThe Bank of Saga Ltd. . . . . . . . . . . . . . . . . . . . . . . . . . . . . . . 449,000 998,529 1,262,080 0.3
General banking servicesThe Taiko Bank, Ltd. . . . . . . . . . . . . . . . . . . . . . . . . . . . . . . . . 1,092,000 2,167,022 2,367,876 0.7
General banking servicesThe Yamanashi Chuo Bank, Ltd. . . . . . . . . . . . . . . . . . . . . . . 504,000 2,233,283 2,392,611 0.7
General banking servicesTotal Banks . . . . . . . . . . . . . . . . . . . . . . . . . . . . . . . . . . . . . . . 8,303,749 9,357,703 2.7
ChemicalsC. Uyemura & Co., Ltd. . . . . . . . . . . . . . . . . . . . . . . . . . . . . . 138,400 6,292,584 7,101,237 2.1
Plating chemicalsFujikura Kasei Co., Ltd. . . . . . . . . . . . . . . . . . . . . . . . . . . . . . . 731,800 3,487,323 4,388,253 1.3
Specialty coating materials and fine chemicalsFuso Chemical Co., Ltd. . . . . . . . . . . . . . . . . . . . . . . . . . . . . . 10,500 131,460 293,736 0.1
Manufactures fruit acids, electronic and functional chemical productsKoatsu Gas Kogyo Co., Ltd. . . . . . . . . . . . . . . . . . . . . . . . . . . 460,900 2,612,150 3,047,579 0.9
High-pressured gases and chemicalsSakai Chemical Industry Co., Ltd. . . . . . . . . . . . . . . . . . . . . . . 2,588,000 8,043,185 9,676,277 2.8
Manufactures components for cosmetics and pharmaceuticalsSekisui Jushi Corporation . . . . . . . . . . . . . . . . . . . . . . . . . . . . 249,700 3,390,258 4,119,888 1.2
Manufactures plastics and other resin materialsShikoku Chemicals Corporation . . . . . . . . . . . . . . . . . . . . . . . 68,000 548,966 714,193 0.2
Manufactures chemical productsSoken Chemical & Engineering Co., Ltd. . . . . . . . . . . . . . . . . 103,300 1,045,337 1,437,987 0.4
Manufactures chemical productsTakiron Co., Ltd. . . . . . . . . . . . . . . . . . . . . . . . . . . . . . . . . . . . 472,000 2,036,360 2,299,665 0.7
Manufactures resin and composite productsTenma Corporation . . . . . . . . . . . . . . . . . . . . . . . . . . . . . . . . . 230,700 3,158,606 4,339,585 1.3
Manufactures synthetic resin productsTeraoka Seisakusho Co., Ltd. . . . . . . . . . . . . . . . . . . . . . . . . . 395,700 1,601,071 1,458,297 0.4
Manufactures various adhesive tapesT&K Toka Co., Ltd. . . . . . . . . . . . . . . . . . . . . . . . . . . . . . . . . . 132,600 1,223,410 1,289,734 0.4
Manufactures specialized inks for printing applicationsYushiro Chemical Industry Co., Ltd. . . . . . . . . . . . . . . . . . . . . 140,800 1,645,149 1,816,774 0.5
Manufactures metalworking fluidsZeon Corporation . . . . . . . . . . . . . . . . . . . . . . . . . . . . . . . . . . 161,000 1,406,135 1,772,846 0.5
Manufactures synthetic resin productsTotal Chemicals . . . . . . . . . . . . . . . . . . . . . . . . . . . . . . . . . . . . 36,621,994 43,756,051 12.8
JAPAN SMALLER CAPITALIZATION FUND, INC.
SCHEDULE OF INVESTMENTS*
FEBRUARY 28, 2017
% of Fair Net Shares Cost Value Assets

See notes to financial statements
JAPAN SMALLER CAPITALIZATION FUND, INC.
SCHEDULE OF INVESTMENTS*—(Continued)
FEBRUARY 28, 2017
% of Fair Net Shares Cost Value Assets
ConstructionDaiichi Kensetsu Corporation . . . . . . . . . . . . . . . . . . . . . . . . . 21,600 $ 230,297 $ 243,245 0.1
Construction and real estate businessesMirai Industry Co., Ltd. . . . . . . . . . . . . . . . . . . . . . . . . . . . . . . 35,700 499,333 500,147 0.1
Manufactures electrical installation materialsMIRAIT Holdings Corporation . . . . . . . . . . . . . . . . . . . . . . . . . 650,800 5,643,788 6,480,996 1.9
Construction of electrical and telecommunication facilitiesTaihei Dengyo Kaisha, Ltd. . . . . . . . . . . . . . . . . . . . . . . . . . . . 230,000 1,862,802 2,237,095 0.7
Construction of thermal and nuclear plant facilitiesToenec Corporation . . . . . . . . . . . . . . . . . . . . . . . . . . . . . . . . . 1,644,000 9,119,263 7,877,821 2.3
Construction of comprehensive building facilitiesYondenko Corporation . . . . . . . . . . . . . . . . . . . . . . . . . . . . . . . 266,000 947,583 1,034,899 0.3
Construction of electrical distribution systemsTotal Construction . . . . . . . . . . . . . . . . . . . . . . . . . . . . . . . . . . 18,303,066 18,374,203 5.4
Electric AppliancesEspec Corp. . . . . . . . . . . . . . . . . . . . . . . . . . . . . . . . . . . . . . . . 278,100 2,377,962 3,506,494 1.0
Manufactures environmental testing productsHitachi Maxell, Ltd. . . . . . . . . . . . . . . . . . . . . . . . . . . . . . . . . . 82,300 1,352,764 1,611,263 0.5
Manufactures media devices, batteries and electrical appliancesKitagawa Industries Co., Ltd. . . . . . . . . . . . . . . . . . . . . . . . . . 353,500 3,731,705 3,391,001 1.0
Manufactures various industrial and consumer productsKoito Manufacturing Co., Ltd. . . . . . . . . . . . . . . . . . . . . . . . . . 61,500 1,532,679 3,177,486 0.9
Manufactures lighting equipmentKyowa Electronic Instruments Co., Ltd. . . . . . . . . . . . . . . . . . 3,200 10,654 12,650 0.0
Manufactures electrical measuring instrumentsNichicon Corporation . . . . . . . . . . . . . . . . . . . . . . . . . . . . . . . 403,600 3,106,633 3,893,201 1.1
Manufactures capacitors and transformersNihon Kohden Corporation . . . . . . . . . . . . . . . . . . . . . . . . . . . 82,600 1,713,182 1,812,461 0.5
Manufactures medical electronic equipmentShindengen Electric Manufacturing Co., Ltd. . . . . . . . . . . . . . 273,000 1,037,429 1,152,269 0.4
Manufactures semiconductor products, electrical components, and power suppliesTotal Electric Appliances . . . . . . . . . . . . . . . . . . . . . . . . . . . . . 14,863,008 18,556,825 5.4
Financing BusinessHitachi Capital Corporation . . . . . . . . . . . . . . . . . . . . . . . . . . . 85,000 1,847,054 2,202,650 0.6
General financial servicesRicoh Leasing Company, Ltd. . . . . . . . . . . . . . . . . . . . . . . . . . 114,400 3,070,079 3,766,885 1.1
Leasing and financial servicesTotal Financing Business . . . . . . . . . . . . . . . . . . . . . . . . . . . . . 4,917,133 5,969,535 1.7
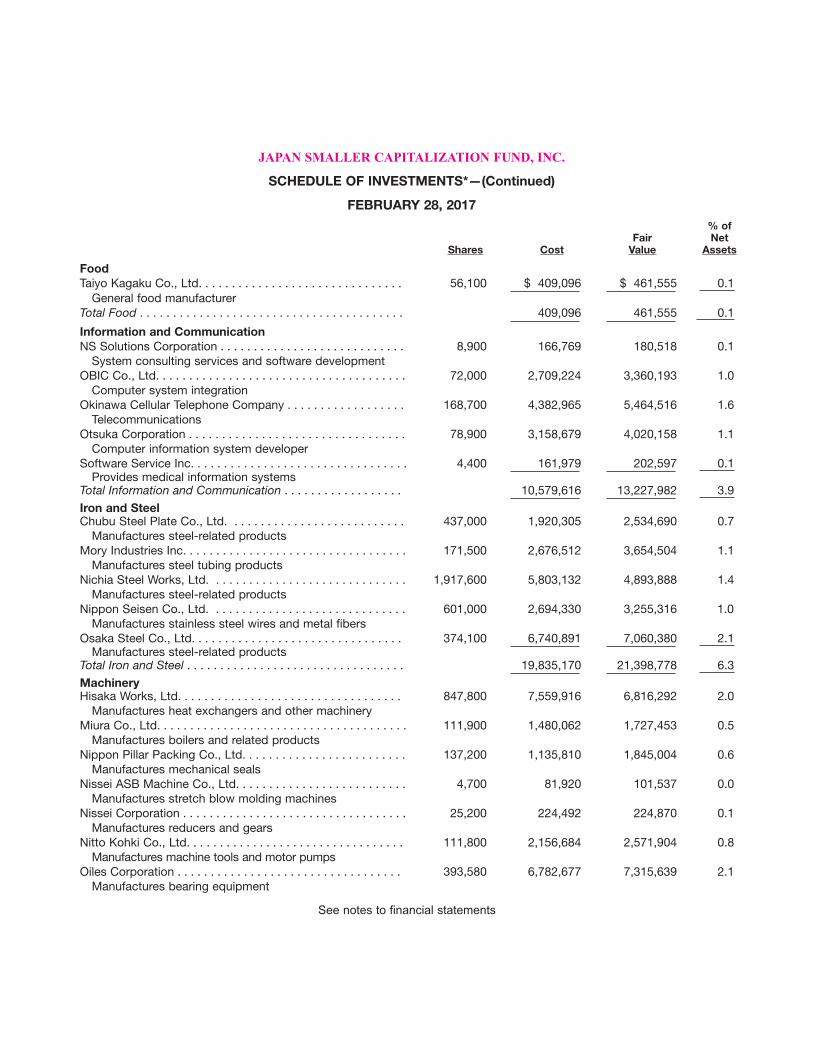
FoodTaiyo Kagaku Co., Ltd. . . . . . . . . . . . . . . . . . . . . . . . . . . . . . . 56,100 $ 409,096 $ 461,555 0.1
General food manufacturerTotal Food . . . . . . . . . . . . . . . . . . . . . . . . . . . . . . . . . . . . . . . . 409,096 461,555 0.1
Information and CommunicationNS Solutions Corporation . . . . . . . . . . . . . . . . . . . . . . . . . . . . 8,900 166,769 180,518 0.1
System consulting services and software developmentOBIC Co., Ltd. . . . . . . . . . . . . . . . . . . . . . . . . . . . . . . . . . . . . . 72,000 2,709,224 3,360,193 1.0
Computer system integrationOkinawa Cellular Telephone Company . . . . . . . . . . . . . . . . . . 168,700 4,382,965 5,464,516 1.6
Telecommunications Otsuka Corporation . . . . . . . . . . . . . . . . . . . . . . . . . . . . . . . . . 78,900 3,158,679 4,020,158 1.1
Computer information system developerSoftware Service Inc. . . . . . . . . . . . . . . . . . . . . . . . . . . . . . . . . 4,400 161,979 202,597 0.1
Provides medical information systemsTotal Information and Communication . . . . . . . . . . . . . . . . . . 10,579,616 13,227,982 3.9
Iron and SteelChubu Steel Plate Co., Ltd. . . . . . . . . . . . . . . . . . . . . . . . . . . 437,000 1,920,305 2,534,690 0.7
Manufactures steel-related productsMory Industries Inc. . . . . . . . . . . . . . . . . . . . . . . . . . . . . . . . . . 171,500 2,676,512 3,654,504 1.1
Manufactures steel tubing productsNichia Steel Works, Ltd. . . . . . . . . . . . . . . . . . . . . . . . . . . . . . 1,917,600 5,803,132 4,893,888 1.4
Manufactures steel-related productsNippon Seisen Co., Ltd. . . . . . . . . . . . . . . . . . . . . . . . . . . . . . 601,000 2,694,330 3,255,316 1.0
Manufactures stainless steel wires and metal fibersOsaka Steel Co., Ltd. . . . . . . . . . . . . . . . . . . . . . . . . . . . . . . . 374,100 6,740,891 7,060,380 2.1
Manufactures steel-related productsTotal Iron and Steel . . . . . . . . . . . . . . . . . . . . . . . . . . . . . . . . . 19,835,170 21,398,778 6.3
MachineryHisaka Works, Ltd. . . . . . . . . . . . . . . . . . . . . . . . . . . . . . . . . . 847,800 7,559,916 6,816,292 2.0
Manufactures heat exchangers and other machineryMiura Co., Ltd. . . . . . . . . . . . . . . . . . . . . . . . . . . . . . . . . . . . . . 111,900 1,480,062 1,727,453 0.5
Manufactures boilers and related productsNippon Pillar Packing Co., Ltd. . . . . . . . . . . . . . . . . . . . . . . . . 137,200 1,135,810 1,845,004 0.6
Manufactures mechanical seals Nissei ASB Machine Co., Ltd. . . . . . . . . . . . . . . . . . . . . . . . . . 4,700 81,920 101,537 0.0
Manufactures stretch blow molding machinesNissei Corporation . . . . . . . . . . . . . . . . . . . . . . . . . . . . . . . . . . 25,200 224,492 224,870 0.1
Manufactures reducers and gearsNitto Kohki Co., Ltd. . . . . . . . . . . . . . . . . . . . . . . . . . . . . . . . . 111,800 2,156,684 2,571,904 0.8
Manufactures machine tools and motor pumpsOiles Corporation . . . . . . . . . . . . . . . . . . . . . . . . . . . . . . . . . . 393,580 6,782,677 7,315,639 2.1
Manufactures bearing equipment
See notes to financial statements
JAPAN SMALLER CAPITALIZATION FUND, INC.
SCHEDULE OF INVESTMENTS*—(Continued)
FEBRUARY 28, 2017
% of Fair Net Shares Cost Value Assets
See notes to financial statements
JAPAN SMALLER CAPITALIZATION FUND, INC.
SCHEDULE OF INVESTMENTS*—(Continued)
FEBRUARY 28, 2017
% of Fair Net Shares Cost Value Assets
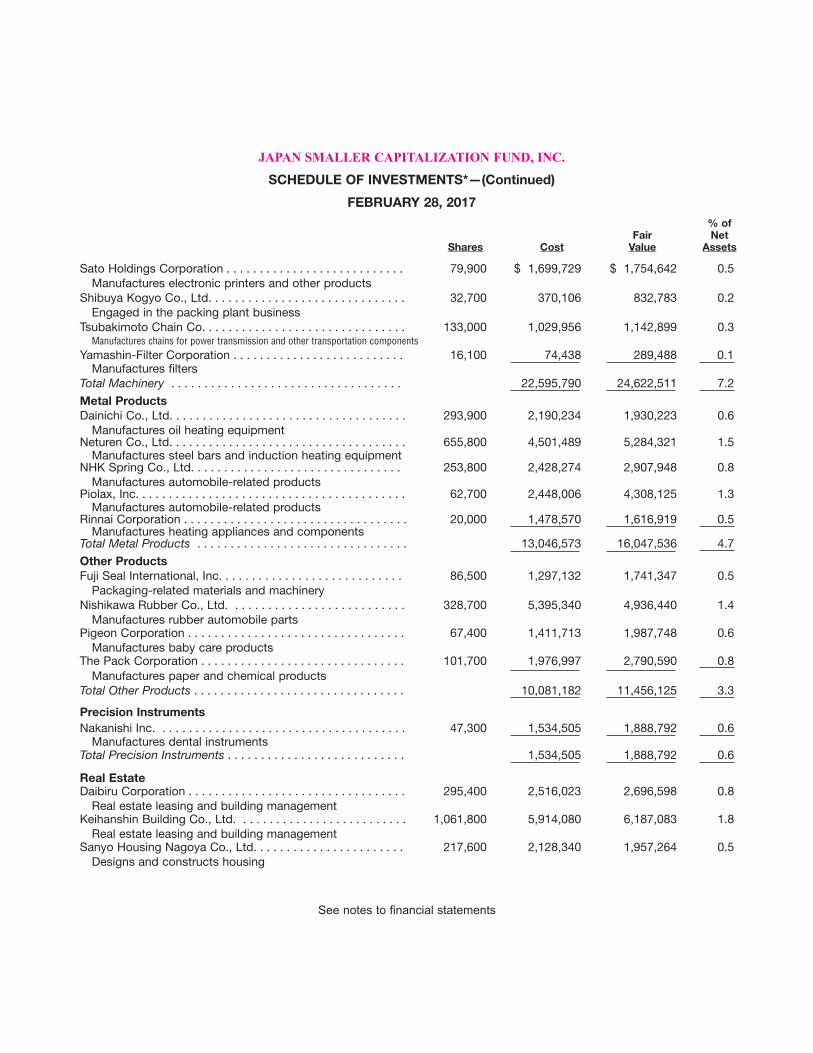
Sato Holdings Corporation . . . . . . . . . . . . . . . . . . . . . . . . . . . 79,900 $ 1,699,729 $ 1,754,642 0.5Manufactures electronic printers and other products
Shibuya Kogyo Co., Ltd. . . . . . . . . . . . . . . . . . . . . . . . . . . . . . 32,700 370,106 832,783 0.2Engaged in the packing plant business
Tsubakimoto Chain Co. . . . . . . . . . . . . . . . . . . . . . . . . . . . . . . 133,000 1,029,956 1,142,899 0.3Manufactures chains for power transmission and other transportation components
Yamashin-Filter Corporation . . . . . . . . . . . . . . . . . . . . . . . . . . 16,100 74,438 289,488 0.1 Manufactures filters
Total Machinery . . . . . . . . . . . . . . . . . . . . . . . . . . . . . . . . . . . 22,595,790 24,622,511 7.2
Metal ProductsDainichi Co., Ltd. . . . . . . . . . . . . . . . . . . . . . . . . . . . . . . . . . . . 293,900 2,190,234 1,930,223 0.6
Manufactures oil heating equipmentNeturen Co., Ltd. . . . . . . . . . . . . . . . . . . . . . . . . . . . . . . . . . . . 655,800 4,501,489 5,284,321 1.5
Manufactures steel bars and induction heating equipmentNHK Spring Co., Ltd. . . . . . . . . . . . . . . . . . . . . . . . . . . . . . . . 253,800 2,428,274 2,907,948 0.8
Manufactures automobile-related productsPiolax, Inc. . . . . . . . . . . . . . . . . . . . . . . . . . . . . . . . . . . . . . . . . 62,700 2,448,006 4,308,125 1.3
Manufactures automobile-related productsRinnai Corporation . . . . . . . . . . . . . . . . . . . . . . . . . . . . . . . . . . 20,000 1,478,570 1,616,919 0.5
Manufactures heating appliances and componentsTotal Metal Products . . . . . . . . . . . . . . . . . . . . . . . . . . . . . . . . 13,046,573 16,047,536 4.7
Other ProductsFuji Seal International, Inc. . . . . . . . . . . . . . . . . . . . . . . . . . . . 86,500 1,297,132 1,741,347 0.5
Packaging-related materials and machineryNishikawa Rubber Co., Ltd. . . . . . . . . . . . . . . . . . . . . . . . . . . 328,700 5,395,340 4,936,440 1.4
Manufactures rubber automobile partsPigeon Corporation . . . . . . . . . . . . . . . . . . . . . . . . . . . . . . . . . 67,400 1,411,713 1,987,748 0.6
Manufactures baby care productsThe Pack Corporation . . . . . . . . . . . . . . . . . . . . . . . . . . . . . . . 101,700 1,976,997 2,790,590 0.8
Manufactures paper and chemical productsTotal Other Products . . . . . . . . . . . . . . . . . . . . . . . . . . . . . . . . 10,081,182 11,456,125 3.3
Precision InstrumentsNakanishi Inc. . . . . . . . . . . . . . . . . . . . . . . . . . . . . . . . . . . . . . 47,300 1,534,505 1,888,792 0.6
Manufactures dental instrumentsTotal Precision Instruments . . . . . . . . . . . . . . . . . . . . . . . . . . . 1,534,505 1,888,792 0.6
Real Estate Daibiru Corporation . . . . . . . . . . . . . . . . . . . . . . . . . . . . . . . . . 295,400 2,516,023 2,696,598 0.8
Real estate leasing and building managementKeihanshin Building Co., Ltd. . . . . . . . . . . . . . . . . . . . . . . . . . 1,061,800 5,914,080 6,187,083 1.8
Real estate leasing and building managementSanyo Housing Nagoya Co., Ltd. . . . . . . . . . . . . . . . . . . . . . . 217,600 2,128,340 1,957,264 0.5
Designs and constructs housing

See notes to financial statements
JAPAN SMALLER CAPITALIZATION FUND, INC.
SCHEDULE OF INVESTMENTS*—(Continued)
FEBRUARY 28, 2017 % of Fair Net Shares Cost Value Assets
Starts Corporation Inc. . . . . . . . . . . . . . . . . . . . . . . . . . . . . . . 91,000 $ 1,654,333 $ 1,961,049 0.6Construction, leasing and management of real estate
Total Real Estate . . . . . . . . . . . . . . . . . . . . . . . . . . . . . . . . . . . 12,212,776 12,801,994 3.7
Retail TradeABC-Mart, Inc. . . . . . . . . . . . . . . . . . . . . . . . . . . . . . . . . . . . . . 53,600 2,622,812 3,238,049 1.0
Retail sales of shoesAIN Holdings Inc. . . . . . . . . . . . . . . . . . . . . . . . . . . . . . . . . . . . 2,400 60,409 172,828 0.1
Operates pharmacies and drug store chainsAmiyaki Tei Co., Ltd. . . . . . . . . . . . . . . . . . . . . . . . . . . . . . . . . 171,000 5,915,642 6,202,784 1.8
Operates barbecue restaurant chainsArc Land Sakamoto Co., Ltd. . . . . . . . . . . . . . . . . . . . . . . . . . 455,300 4,197,697 5,972,346 1.7
Retail sales, wholesale, food and real estateBelc Co., Ltd. . . . . . . . . . . . . . . . . . . . . . . . . . . . . . . . . . . . . . . 5,200 199,084 210,663 0.1
Operates retail food store chainsCreate SD Holdings Co., Ltd. . . . . . . . . . . . . . . . . . . . . . . . . . 70,800 910,086 1,632,510 0.5
Operates pharmacies and drug store chainsDaikokutenbussan Co., Ltd. . . . . . . . . . . . . . . . . . . . . . . . . . . 72,200 2,156,339 3,272,886 1.0
Operates supermarketsHeiwado Co., Ltd. . . . . . . . . . . . . . . . . . . . . . . . . . . . . . . . . . . 2,800 60,406 67,336 0.0
Operates supermarketsHiday Hidaka Corp. . . . . . . . . . . . . . . . . . . . . . . . . . . . . . . . . . 98,811 1,272,963 2,076,473 0.6
Operates restaurant chainsJin Co., Ltd. . . . . . . . . . . . . . . . . . . . . . . . . . . . . . . . . . . . . . . . 51,100 1,660,010 2,735,912 0.8
Retail sales of eyewear and fashion accessoriesSaint Marc Holdings Co., Ltd. . . . . . . . . . . . . . . . . . . . . . . . . . 55,300 1,385,329 1,702,449 0.5
Operates restaurant chainsSan-A Co., Ltd. . . . . . . . . . . . . . . . . . . . . . . . . . . . . . . . . . . . . 25,600 1,168,001 1,176,460 0.3
Retail sales of home goodsSeria Co., Ltd. . . . . . . . . . . . . . . . . . . . . . . . . . . . . . . . . . . . . . 33,400 1,053,968 2,634,685 0.8
Discount retail salesStart Today Co., Ltd. . . . . . . . . . . . . . . . . . . . . . . . . . . . . . . . . 155,200 1,297,653 3,251,770 0.9
Operates retail E-commerce websitesSundrug Co., Ltd. . . . . . . . . . . . . . . . . . . . . . . . . . . . . . . . . . . 4,000 207,981 263,775 0.1
Operates pharmacies and drug store chainsYaoko Co., Ltd. . . . . . . . . . . . . . . . . . . . . . . . . . . . . . . . . . . . . 46,000 1,814,808 1,875,876 0.5
Operates and manages groceries and supermarketsYossix Co., Ltd. . . . . . . . . . . . . . . . . . . . . . . . . . . . . . . . . . . . . 69,300 1,059,691 828,026 0.2
Operates restaurant chainsTotal Retail Trade . . . . . . . . . . . . . . . . . . . . . . . . . . . . . . . . . . . 27,042,879 37,314,828 10.9
JAPAN SMALLER CAPITALIZATION FUND, INC.
SCHEDULE OF INVESTMENTS*—(Continued)
FEBRUARY 28, 2017
% of Fair Net Shares Cost Value Assets
See notes to financial statements
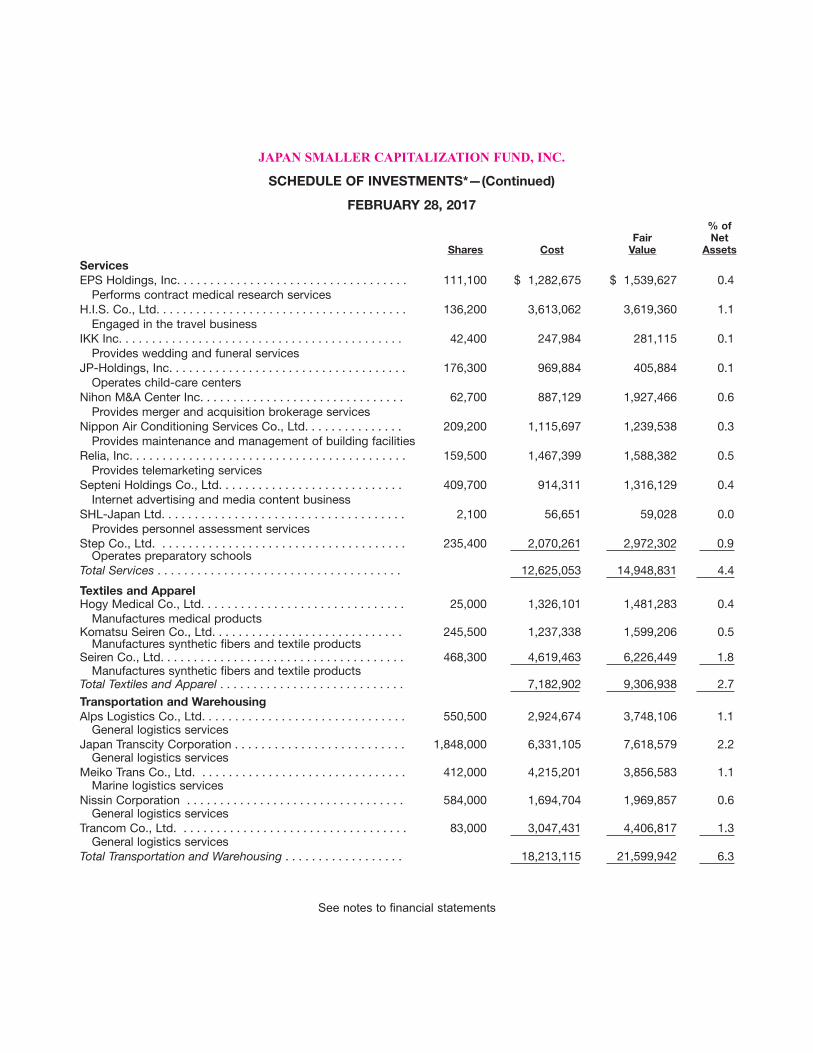
ServicesEPS Holdings, Inc. . . . . . . . . . . . . . . . . . . . . . . . . . . . . . . . . . . 111,100 $ 1,282,675 $ 1,539,627 0.4
Performs contract medical research servicesH.I.S. Co., Ltd. . . . . . . . . . . . . . . . . . . . . . . . . . . . . . . . . . . . . . 136,200 3,613,062 3,619,360 1.1
Engaged in the travel businessIKK Inc. . . . . . . . . . . . . . . . . . . . . . . . . . . . . . . . . . . . . . . . . . . 42,400 247,984 281,115 0.1
Provides wedding and funeral servicesJP-Holdings, Inc. . . . . . . . . . . . . . . . . . . . . . . . . . . . . . . . . . . . 176,300 969,884 405,884 0.1
Operates child-care centersNihon M&A Center Inc. . . . . . . . . . . . . . . . . . . . . . . . . . . . . . . 62,700 887,129 1,927,466 0.6
Provides merger and acquisition brokerage servicesNippon Air Conditioning Services Co., Ltd. . . . . . . . . . . . . . . 209,200 1,115,697 1,239,538 0.3
Provides maintenance and management of building facilitiesRelia, Inc. . . . . . . . . . . . . . . . . . . . . . . . . . . . . . . . . . . . . . . . . . 159,500 1,467,399 1,588,382 0.5
Provides telemarketing servicesSepteni Holdings Co., Ltd. . . . . . . . . . . . . . . . . . . . . . . . . . . . 409,700 914,311 1,316,129 0.4
Internet advertising and media content businessSHL-Japan Ltd. . . . . . . . . . . . . . . . . . . . . . . . . . . . . . . . . . . . . 2,100 56,651 59,028 0.0
Provides personnel assessment servicesStep Co., Ltd. . . . . . . . . . . . . . . . . . . . . . . . . . . . . . . . . . . . . . 235,400 2,070,261 2,972,302 0.9
Operates preparatory schoolsTotal Services . . . . . . . . . . . . . . . . . . . . . . . . . . . . . . . . . . . . . 12,625,053 14,948,831 4.4
Textiles and ApparelHogy Medical Co., Ltd. . . . . . . . . . . . . . . . . . . . . . . . . . . . . . . 25,000 1,326,101 1,481,283 0.4
Manufactures medical productsKomatsu Seiren Co., Ltd. . . . . . . . . . . . . . . . . . . . . . . . . . . . . 245,500 1,237,338 1,599,206 0.5
Manufactures synthetic fibers and textile productsSeiren Co., Ltd. . . . . . . . . . . . . . . . . . . . . . . . . . . . . . . . . . . . . 468,300 4,619,463 6,226,449 1.8
Manufactures synthetic fibers and textile productsTotal Textiles and Apparel . . . . . . . . . . . . . . . . . . . . . . . . . . . . 7,182,902 9,306,938 2.7
Transportation and WarehousingAlps Logistics Co., Ltd. . . . . . . . . . . . . . . . . . . . . . . . . . . . . . . 550,500 2,924,674 3,748,106 1.1
General logistics servicesJapan Transcity Corporation . . . . . . . . . . . . . . . . . . . . . . . . . . 1,848,000 6,331,105 7,618,579 2.2
General logistics servicesMeiko Trans Co., Ltd. . . . . . . . . . . . . . . . . . . . . . . . . . . . . . . . 412,000 4,215,201 3,856,583 1.1
Marine logistics servicesNissin Corporation . . . . . . . . . . . . . . . . . . . . . . . . . . . . . . . . . 584,000 1,694,704 1,969,857 0.6
General logistics servicesTrancom Co., Ltd. . . . . . . . . . . . . . . . . . . . . . . . . . . . . . . . . . . 83,000 3,047,431 4,406,817 1.3
General logistics servicesTotal Transportation and Warehousing . . . . . . . . . . . . . . . . . . 18,213,115 21,599,942 6.3
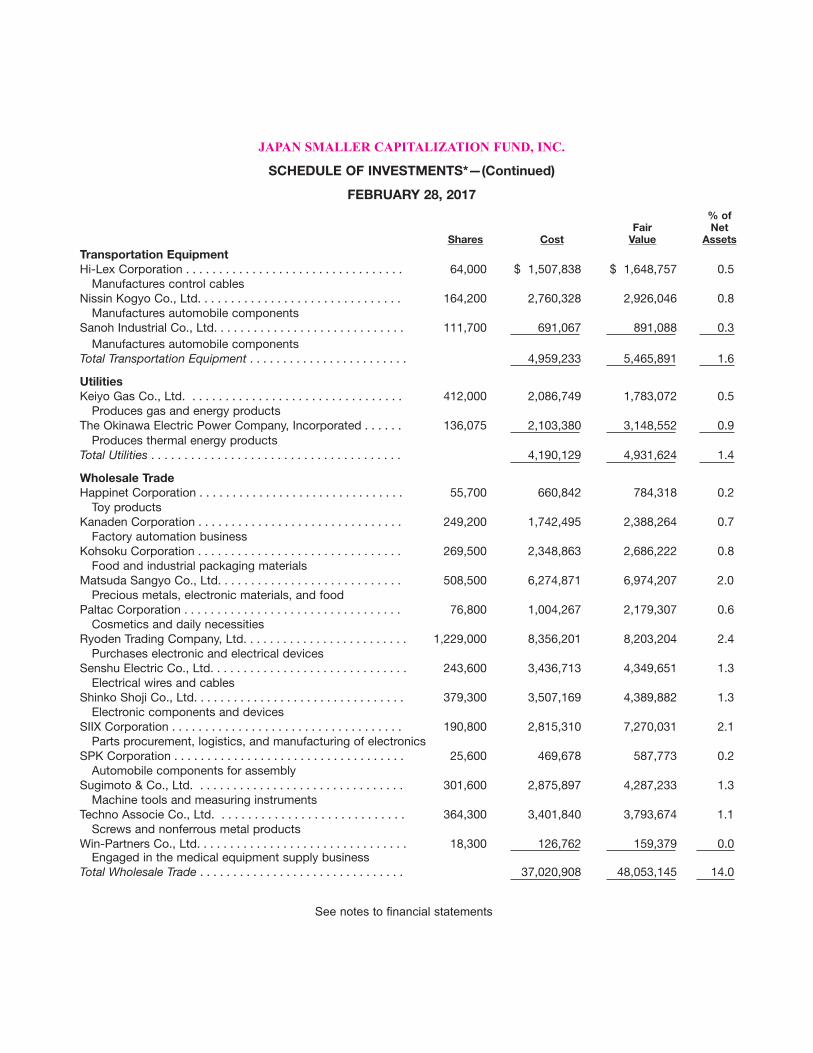
Transportation EquipmentHi-Lex Corporation . . . . . . . . . . . . . . . . . . . . . . . . . . . . . . . . . 64,000 $ 1,507,838 $ 1,648,757 0.5
Manufactures control cablesNissin Kogyo Co., Ltd. . . . . . . . . . . . . . . . . . . . . . . . . . . . . . . 164,200 2,760,328 2,926,046 0.8
Manufactures automobile componentsSanoh Industrial Co., Ltd. . . . . . . . . . . . . . . . . . . . . . . . . . . . . 111,700 691,067 891,088 0.3
Manufactures automobile componentsTotal Transportation Equipment . . . . . . . . . . . . . . . . . . . . . . . . 4,959,233 5,465,891 1.6
UtilitiesKeiyo Gas Co., Ltd. . . . . . . . . . . . . . . . . . . . . . . . . . . . . . . . . 412,000 2,086,749 1,783,072 0.5
Produces gas and energy productsThe Okinawa Electric Power Company, Incorporated . . . . . . 136,075 2,103,380 3,148,552 0.9
Produces thermal energy productsTotal Utilities . . . . . . . . . . . . . . . . . . . . . . . . . . . . . . . . . . . . . . 4,190,129 4,931,624 1.4
Wholesale TradeHappinet Corporation . . . . . . . . . . . . . . . . . . . . . . . . . . . . . . . 55,700 660,842 784,318 0.2
Toy productsKanaden Corporation . . . . . . . . . . . . . . . . . . . . . . . . . . . . . . . 249,200 1,742,495 2,388,264 0.7
Factory automation businessKohsoku Corporation . . . . . . . . . . . . . . . . . . . . . . . . . . . . . . . 269,500 2,348,863 2,686,222 0.8
Food and industrial packaging materialsMatsuda Sangyo Co., Ltd. . . . . . . . . . . . . . . . . . . . . . . . . . . . 508,500 6,274,871 6,974,207 2.0
Precious metals, electronic materials, and foodPaltac Corporation . . . . . . . . . . . . . . . . . . . . . . . . . . . . . . . . . 76,800 1,004,267 2,179,307 0.6
Cosmetics and daily necessitiesRyoden Trading Company, Ltd. . . . . . . . . . . . . . . . . . . . . . . . . 1,229,000 8,356,201 8,203,204 2.4
Purchases electronic and electrical devicesSenshu Electric Co., Ltd. . . . . . . . . . . . . . . . . . . . . . . . . . . . . . 243,600 3,436,713 4,349,651 1.3
Electrical wires and cablesShinko Shoji Co., Ltd. . . . . . . . . . . . . . . . . . . . . . . . . . . . . . . . 379,300 3,507,169 4,389,882 1.3
Electronic components and devicesSIIX Corporation . . . . . . . . . . . . . . . . . . . . . . . . . . . . . . . . . . . 190,800 2,815,310 7,270,031 2.1
Parts procurement, logistics, and manufacturing of electronicsSPK Corporation . . . . . . . . . . . . . . . . . . . . . . . . . . . . . . . . . . . 25,600 469,678 587,773 0.2
Automobile components for assemblySugimoto & Co., Ltd. . . . . . . . . . . . . . . . . . . . . . . . . . . . . . . . 301,600 2,875,897 4,287,233 1.3
Machine tools and measuring instrumentsTechno Associe Co., Ltd. . . . . . . . . . . . . . . . . . . . . . . . . . . . . 364,300 3,401,840 3,793,674 1.1
Screws and nonferrous metal productsWin-Partners Co., Ltd. . . . . . . . . . . . . . . . . . . . . . . . . . . . . . . . 18,300 126,762 159,379 0.0
Engaged in the medical equipment supply businessTotal Wholesale Trade . . . . . . . . . . . . . . . . . . . . . . . . . . . . . . . 37,020,908 48,053,145 14.0 . . . . . . . . . . . . . . .
JAPAN SMALLER CAPITALIZATION FUND, INC.
SCHEDULE OF INVESTMENTS*—(Continued)
FEBRUARY 28, 2017
% of Fair Net Shares Cost Value Assets
See notes to financial statements

TOTAL JAPANESE EQUITY SECURITIES . . . . . . . . . . . . . . . . $284,537,877 $339,540,789 99.1 . . . . . . . . . . . . . . . . . . . . . . . . . . . . . . . . . . . . . . . . . . . . . . . . . . . . . . . . . . . . . . . . . . . . . _________________ _________________ _________
FOREIGN CURRENCYJapanese Yen
Interest bearing account . . . . . . . . . . . . . . . . . . . . . . . . . . $ 411,642 $ 416,709 0.1
TOTAL FOREIGN CURRENCY . . . . . . . . . . . . . . . . . . . . . 411,642 416,709 0.1
TOTAL INVESTMENTS AND FOREIGN CURRENCY . $284,949,519 $339,957,498 99.2 __________________ . . . . . . . . . . . . . . . . . . . . . . . . . . . . . . . . . . . . . . . . . . . . . . . . . . . . . . . . . . . . . . . . . . . . . . . . . __________________
OTHER ASSETS LESS LIABILITIES, NET . . . . . . . . . . . 2,555,626 0.8
NET ASSETS . . . . . . . . . . . . . . . . . . . . . . . . . . . . . . . . . . . . $342,513,124 100.0
*The description following each investment is unaudited and not covered by the Report of Independent Registered PublicAccounting Firm.
Portfolio securities and foreign currency holdings were translatedat the following exchange rate as of February 28, 2017.
Japanese Yen JPY ¥ 112.065 = USD $1.00
JAPAN SMALLER CAPITALIZATION FUND, INC.
SCHEDULE OF INVESTMENTS*—(Continued)
FEBRUARY 28, 2017
% of Fair Net Shares Cost Value Assets
See notes to financial statements
JAPAN SMALLER CAPITALIZATION FUND, INC.
STATEMENT OF ASSETS AND LIABILITIES
FEBRUARY 28, 2017
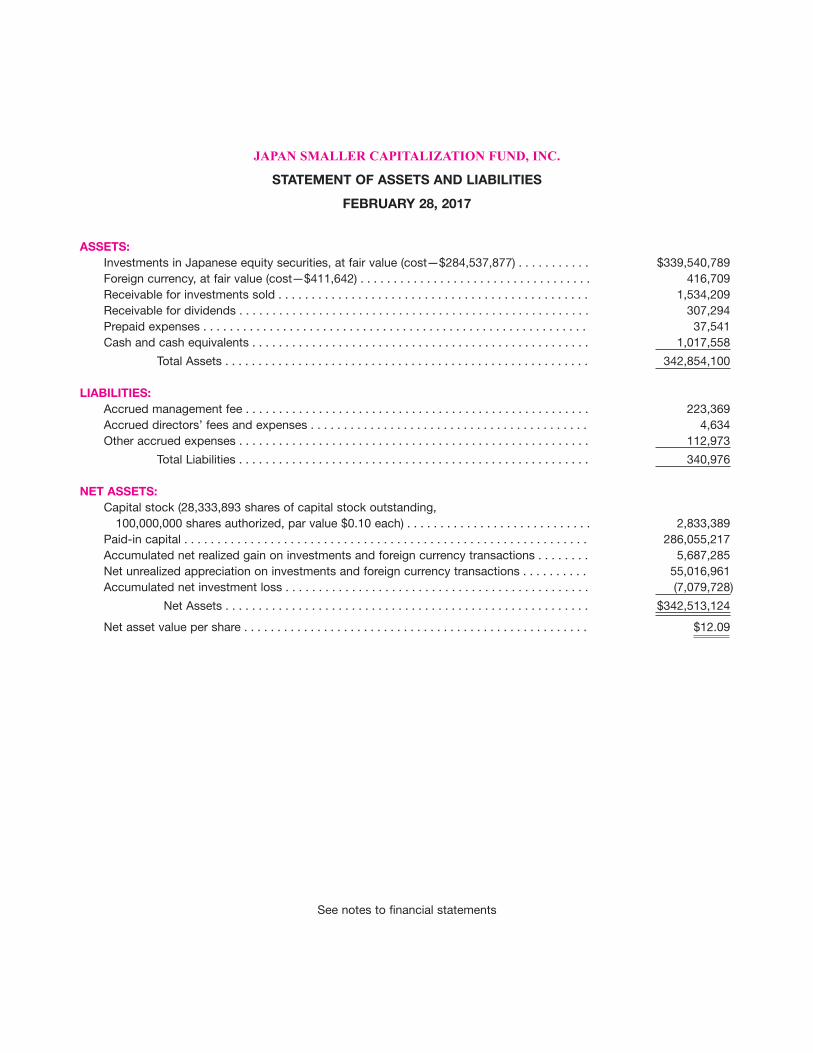
ASSETS:Investments in Japanese equity securities, at fair value (cost—$284,537,877) . . . . . . . . . . . $339,540,789Foreign currency, at fair value (cost—$411,642) . . . . . . . . . . . . . . . . . . . . . . . . . . . . . . . . . . . 416,709Receivable for investments sold . . . . . . . . . . . . . . . . . . . . . . . . . . . . . . . . . . . . . . . . . . . . . . . 1,534,209Receivable for dividends . . . . . . . . . . . . . . . . . . . . . . . . . . . . . . . . . . . . . . . . . . . . . . . . . . . . . 307,294Prepaid expenses . . . . . . . . . . . . . . . . . . . . . . . . . . . . . . . . . . . . . . . . . . . . . . . . . . . . . . . . . . 37,541Cash and cash equivalents . . . . . . . . . . . . . . . . . . . . . . . . . . . . . . . . . . . . . . . . . . . . . . . . . . . 1,017,558
Total Assets . . . . . . . . . . . . . . . . . . . . . . . . . . . . . . . . . . . . . . . . . . . . . . . . . . . . . . . 342,854,100
LIABILITIES:Accrued management fee . . . . . . . . . . . . . . . . . . . . . . . . . . . . . . . . . . . . . . . . . . . . . . . . . . . . 223,369Accrued directors’ fees and expenses . . . . . . . . . . . . . . . . . . . . . . . . . . . . . . . . . . . . . . . . . . 4,634Other accrued expenses . . . . . . . . . . . . . . . . . . . . . . . . . . . . . . . . . . . . . . . . . . . . . . . . . . . . . 112,973
Total Liabilities . . . . . . . . . . . . . . . . . . . . . . . . . . . . . . . . . . . . . . . . . . . . . . . . . . . . . 340,976
NET ASSETS:Capital stock (28,333,893 shares of capital stock outstanding,
100,000,000 shares authorized, par value $0.10 each) . . . . . . . . . . . . . . . . . . . . . . . . . . . . 2,833,389Paid-in capital . . . . . . . . . . . . . . . . . . . . . . . . . . . . . . . . . . . . . . . . . . . . . . . . . . . . . . . . . . . . . 286,055,217Accumulated net realized gain on investments and foreign currency transactions . . . . . . . . 5,687,285Net unrealized appreciation on investments and foreign currency transactions . . . . . . . . . . 55,016,961Accumulated net investment loss . . . . . . . . . . . . . . . . . . . . . . . . . . . . . . . . . . . . . . . . . . . . . . (7,079,728)
Net Assets . . . . . . . . . . . . . . . . . . . . . . . . . . . . . . . . . . . . . . . . . . . . . . . . . . . . . . . $342,513,124
Net asset value per share . . . . . . . . . . . . . . . . . . . . . . . . . . . . . . . . . . . . . . . . . . . . . . . . . . . . $12.09
See notes to financial statements

JAPAN SMALLER CAPITALIZATION FUND, INC.
STATEMENT OF OPERATIONS
FOR THE YEAR ENDED FEBRUARY 28, 2017
INCOME:
Dividend income (net of $757,422 withholding taxes) . . . . . . . . . . . . . . . . . . . . . . . . . . . $6,816,799 Interest income . . . . . . . . . . . . . . . . . . . . . . . . . . . . . . . . . . . . . . . . . . . . . . . . . . . . . . . . . 2,232
Total Income . . . . . . . . . . . . . . . . . . . . . . . . . . . . . . . . . . . . . . . . . . . . . . . . . . . $6,819,031
EXPENSES:Management fee . . . . . . . . . . . . . . . . . . . . . . . . . . . . . . . . . . . . . . . . . . . . . . . . . . . . . . . . 2,864,575Custodian fee . . . . . . . . . . . . . . . . . . . . . . . . . . . . . . . . . . . . . . . . . . . . . . . . . . . . . . . . . . 228,679Directors’ fees and expenses . . . . . . . . . . . . . . . . . . . . . . . . . . . . . . . . . . . . . . . . . . . . . . 140,503Legal fees . . . . . . . . . . . . . . . . . . . . . . . . . . . . . . . . . . . . . . . . . . . . . . . . . . . . . . . . . . . . . 130,922Other expenses . . . . . . . . . . . . . . . . . . . . . . . . . . . . . . . . . . . . . . . . . . . . . . . . . . . . . . . . . 203,701
Total Expenses . . . . . . . . . . . . . . . . . . . . . . . . . . . . . . . . . . . . . . . . . . . . . . . . . 3,568,380
INVESTMENT INCOME—NET . . . . . . . . . . . . . . . . . . . . . . . . . . . . . . . . . . . . . . . . . . . . 3,250,651
REALIZED AND UNREALIZED GAIN (LOSS) ON INVESTMENTS AND FOREIGN CURRENCY:Realized gain (loss) on investments and foreign currency transactions:Net realized gain on investments . . . . . . . . . . . . . . . . . . . . . . . . . . . . . . . . . . . . . . . . . . . 14,027,703Net realized loss on foreign currency transactions . . . . . . . . . . . . . . . . . . . . . . . . . . . . . (116,869)
Net realized gain on investments and foreign currency transactions . . . . . . . . . . . . . . . 13,910,834Net change in unrealized appreciation on investments . . . . . . . . . . . . . . . . . . . . . . . . . . 50,344,095Net change in unrealized appreciation on foreign currency transactions and translation 3,981,045
Net realized and unrealized gain on investments and foreign currency transactions and translation . . . . . . . . . . . . . . . . . . . . . . . . . . . . . . . . . . . . . . . . . . . . . . . . . . . . . . . 68,235,974
NET INCREASE IN NET ASSETS RESULTING FROM OPERATIONS . . . . . . . . . . . . . $71,486,625
See notes to financial statements
JAPAN SMALLER CAPITALIZATION FUND, INC.
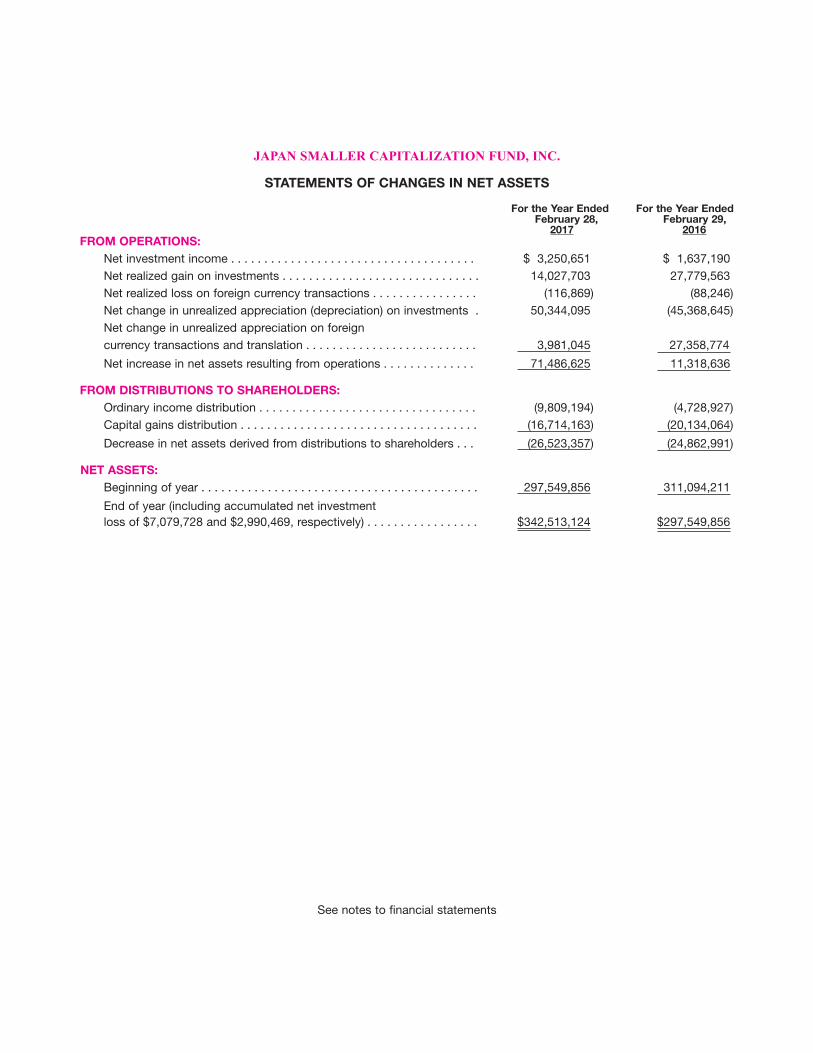
STATEMENTS OF CHANGES IN NET ASSETS
For the Year Ended For the Year EndedFebruary 28, February 29,
2017 2016FROM OPERATIONS:
Net investment income . . . . . . . . . . . . . . . . . . . . . . . . . . . . . . . . . . . . . $ 3,250,651 $ 1,637,190Net realized gain on investments . . . . . . . . . . . . . . . . . . . . . . . . . . . . . . 14,027,703 27,779,563Net realized loss on foreign currency transactions . . . . . . . . . . . . . . . . (116,869) (88,246)Net change in unrealized appreciation (depreciation) on investments . 50,344,095 (45,368,645)Net change in unrealized appreciation on foreigncurrency transactions and translation . . . . . . . . . . . . . . . . . . . . . . . . . . 3,981,045 27,358,774
Net increase in net assets resulting from operations . . . . . . . . . . . . . . 71,486,625 11,318,636
FROM DISTRIBUTIONS TO SHAREHOLDERS:Ordinary income distribution . . . . . . . . . . . . . . . . . . . . . . . . . . . . . . . . . (9,809,194) (4,728,927)Capital gains distribution . . . . . . . . . . . . . . . . . . . . . . . . . . . . . . . . . . . . (16,714,163) (20,134,064)
Decrease in net assets derived from distributions to shareholders . . . (26,523,357) (24,862,991)
NET ASSETS:Beginning of year . . . . . . . . . . . . . . . . . . . . . . . . . . . . . . . . . . . . . . . . . . 297,549,856 311,094,211
End of year (including accumulated net investmentloss of $7,079,728 and $2,990,469, respectively) . . . . . . . . . . . . . . . . . $342,513,124 $297,549,856
See notes to financial statements

1. Significant Accounting Policies
Japan Smaller Capitalization Fund, Inc. (the“Fund”) is registered under the InvestmentCompany Act of 1940, as amended (the “In-vestment Company Act”), as a non-diversified,closed-end management investment com-pany. The Fund was incorporated in Marylandon January 25, 1990 and investment opera-tions commenced on March 21, 1990. TheFund’s investment objective is to seek long-term capital appreciation through investmentsprimarily in smaller capitalization Japanese eq-uity securities.
The accompanying financial statementshave been prepared in accordance withUnited States (“U.S.”) generally accepted ac-counting principles (“GAAP”) and are stated inUnited States dollars. The Fund is an invest-ment company that follows the accountingand reporting guidance in accordance withFASB Accounting Standards CodificationTopic 946. The following is a summary of thesignificant accounting and reporting policiesused in preparing the financial statements.
(a) Valuation of Securities—Investmentstraded in the over-the-counter market are fairvalued at the last reported sales price as ofthe close of business on the day the securitiesare being valued or, if none is available, at themean of the bid and offer price at the close ofbusiness on such day or, if none is available,the last reported sales price. Portfolio securi-ties which are traded on stock exchanges arefair valued at the last sales price on the prin-cipal market on which securities are traded or,lacking any sales, at the last available bidprice. Securities and other assets, including
futures contracts and related options, thatcannot be fair valued using one of the previ-ously mentioned methods are stated at fairvalue as determined in good faith by or underthe direction of the Board of Directors of theFund.
(b) Foreign Currency Transactions—Trans-actions denominated in Japanese Yen (“Yen”)are recorded in the Fund’s records at the pre-vailing exchange rate at the time of thetransaction. Asset and liability accounts thatare denominated in Yen are adjusted to reflectthe current exchange rate at the end of the pe-riod. Transaction gains or losses resulting fromchanges in the exchange rate during the re-porting period or upon settlement of foreigncurrency transactions are included in the re-sults of operations for the current period.
The net assets of the Fund are presented atthe exchange rates and fair values on Febru-ary 28, 2017. The Fund does isolate thatportion of the results of operations arising asa result of changes in the foreign exchangerates on investments from the fluctuationsarising from changes in the market prices ofsecurities held at February 28, 2017. Net real-ized gains or losses on investments includegains or losses arising from sales of portfoliosecurities and sales and maturities of short-term securities. Net realized gains or losseson foreign currency transactions arise fromsales of foreign currencies, currency gains orlosses realized on securities transactions be-tween trade and settlement date, and thedifference between the amounts of dividends,interest, and foreign withholding taxesrecorded on the Fund’s books and the U.S.
JAPAN SMALLER CAPITALIZATION FUND, INC.
NOTES TO FINANCIAL STATEMENTS

dollar equivalent of the amounts actually re-ceived or paid.
(c) Security Transactions, Investment Incomeand Distributions to Shareholders—Securitytransactions are accounted for on the tradedate. Dividend income and distributions arerecorded on the ex-dividend dates and interestincome is recorded on the accrual basis. Real-ized gains and losses on the sale of investmentsare calculated on the first in, first out basis.
Distributions from net investment incomeand net realized capital gains are determinedin accordance with Federal income tax regu-lations, which may differ from U.S. GAAP. Tothe extent these “book/tax” differences arepermanent in nature (i.e., that they result fromother than timing of recognition—“tempo-rary”), such accounts are reclassified withinthe capital accounts based on their Federaltax-basis treatment; temporary differences donot require reclassification. Dividends anddistributions which exceed net realized capi-tal gains for financial reporting purposes, butnot for tax purposes, are reported as distribu-tions in excess of net realized capital gains.
Pursuant to a securities lending agreementwith Brown Brothers Harriman & Co., theFund may lend securities to qualified institu-tions. It is the Fund’s policy that, atorigination, all loans shall be secured by col-lateral of at least 102% of the value of U.S.securities loaned and 105% of the value offoreign securities loaned. It is the Fund’s pol-icy that collateral equivalent to at least 100%of the fair value of securities on loan must bemaintained at all times (when applicable). Col-
lateral is provided in the form of cash, whichwould be invested in certain money marketfunds. The Fund is entitled to receive all in-come on securities loaned, in addition to aportion of the income earned as a result of thelending transaction. Although each securityloan is fully collateralized, there are certainrisks. On November 21, 2008, the Fund sus-pended its participation in the securitieslending program. The Fund may resume itsparticipation in the future. During the fiscalyear ended February 28, 2017, the Fund didnot earn any fees from lending fund portfoliosecurities, pursuant to the securities lendingagreement.
(d) Capital Account Reclassification—Forthe fiscal year ended February 28, 2017, theFund’s accumulated net investment loss wasdecreased by $2,469,284 and the accumu-lated net realized gain on investments andforeign currency transactions was decreasedby $2,469,284. These adjustments were pri-marily due to the result of the reclassificationof foreign currency losses and the tax treat-ment of passive foreign investmentcompanies. These adjustments had no impacton net assets.
(e) Income Taxes—A provision for U.S. in-come taxes has not been made since it is theintention of the Fund to continue to qualify asa regulated investment company under theInternal Revenue Code and to distributewithin the allowable time limit all taxable in-come to its shareholders.
Under Japanese tax laws, a withholding taxis imposed on dividends at a rate of 15.315%
JAPAN SMALLER CAPITALIZATION FUND, INC.
NOTES TO FINANCIAL STATEMENTS—Continued

and such withholding taxes are reflected as areduction of the related revenue. The with-holding tax rate of 15.315% was reduced to10% upon the submission of Form 17 - Limi-tation on Benefits Article. There is nowithholding tax on realized gains.
In accordance with U.S. GAAP require-ments regarding accounting for uncertaintiesin income taxes, management has analyzedthe Fund's tax positions taken or expected tobe taken on federal and state income tax re-turns for all open tax years (the current and theprior three tax years), and has concluded thatno provision for income tax is required in theFund's financial statements. The Fund recog-nizes interest and penalties, if any, related touncertain tax positions as income tax expensein the statement of operations. During the cur-rent year and for the prior three tax years, theFund did not incur any interest or penalties.
(f) Use of Estimates in Financial StatementPreparation—The preparation of financialstatements in accordance with U.S. GAAP re-quires management to make estimates andassumptions that affect the reported amountsand disclosures in the financial statements.Actual results could differ from these esti-mates.
(g) Concentration of Risk—A significantportion of the Fund’s net assets consists ofJapanese securities which involve certainconsiderations and risks not typically associ-ated with investments in the U.S. In additionto the smaller size, and greater volatility, thereis often substantially less publicly available in-formation about Japanese issuers than there
is about U.S. issuers. Future economic andpolitical developments in Japan could ad-versely affect the value of securities in whichthe Fund is invested. Further, the Fund maybe exposed to currency devaluation and otherexchange rate fluctuations.
(h) Indemnifications—Under the Fund’s or-ganizational documents, its officers anddirectors are indemnified against certain lia-bilities arising from the performance of theirduties to the Fund. Additionally, in the normalcourse of business, the Fund enters into con-tracts that contain a variety of representationswhich provide general indemnifications. TheFund’s maximum exposure under theseagreements is unknown as this would involvefuture claims that may be made against theFund that have not yet occurred. However,based on experience, the Fund expects therisk of loss to be remote and as such no ad-ditional accruals were recorded on theStatement of Assets and Liabilities.
2. Management Agreement and Transactions With Affiliated Persons
Nomura Asset Management U.S.A. Inc.(“NAM-USA” or the “Manager”) acts as theManager of the Fund pursuant to a manage-ment agreement. Under the managementagreement, the Manager provides all officespace, facilities and personnel necessary toperform its duties. Pursuant to such manage-ment agreement, the Manager has retained itsparent company, Nomura Asset ManagementCo., Ltd. (“NAM”), as Investment Adviser tothe Fund.
JAPAN SMALLER CAPITALIZATION FUND, INC.
NOTES TO FINANCIAL STATEMENTS—Continued

As compensation for its services to theFund, the Manager receives a monthly fee atthe annual rate of 1.10% of the value of theFund’s average weekly net assets not in ex-cess of $50 million, 1.00% of the Fund’saverage weekly net assets in excess of $50million but not exceeding $100 million, 0.90%of the Fund’s average weekly net assets in ex-cess of $100 million but not exceeding $175million, 0.80% of the Fund’s average weeklynet assets in excess of $175 million but notexceeding $250 million, 0.70% of the Fund’saverage weekly net assets in excess of $250million but not exceeding $325 million, 0.60%of the Fund’s average weekly net assets in ex-cess of $325 million but not exceeding $425million and 0.50% of the Fund’s averageweekly net assets in excess of $425 million.Under the management agreement, the Fundincurred fees to the Manager of $2,864,575for the fiscal year ended February 28, 2017.Under the investment advisory agreement,NAM earned investment advisory fees of$1,268,253 from the Manager, not the Fund,for the fiscal year ended February 28, 2017.At February 28, 2017, the management feepayable to the Manager by the Fund was$223,369.
Certain officers and/or directors of theFund are officers and/or directors of the Man-ager. Affiliates of Nomura Holdings, Inc. (theManager’s indirect parent) did not earn anyfees in commissions on the execution of port-folio security transactions for the year endedFebruary 28, 2017. The Fund pays each Di-rector not affiliated with the Manager anannual fee of $17,000 plus $2,000 per meet-ing attended. In addition, the Fund pays each
Director not affiliated with the Manager$1,000 per telephone meeting attended to-gether with actual expenses related toattendance at meetings. The Chairman of theBoard, presently Rodney A. Buck, is paid anadditional annual fee of $5,000. The Chairmanof the Audit Committee, presently David B.Chemidlin, is paid an additional annual fee of$2,000. Such fees and expenses for unaffili-ated Directors aggregated $140,503 for thefiscal year ended February 28, 2017.
3. Purchases and Sales of Investments
Purchases and sales of investments, exclu-sive of foreign currency and investments inshort-term securities, for the fiscal year endedFebruary 28, 2017 were $63,937,842 and$88,023,498, respectively.
4. Federal Income Tax
As of February 28, 2017, net unrealized ap-preciation on investments, exclusive of foreigncurrency, for federal income tax purposes was$46,803,331, of which $52,682,063 related toappreciated securities and $5,878,732 related todepreciated securities. The cost of investments,exclusive of foreign currency of $411,642, atFebruary 28, 2017 for federal income tax pur-poses was $292,737,458.
JAPAN SMALLER CAPITALIZATION FUND, INC.
NOTES TO FINANCIAL STATEMENTS—Continued

At February 28, 2017, the components ofaccumulated earnings on a tax basis were asfollows:
Unrealized appreciation on investments andforeign currency transactions 46,817,380(a)
Undistributed long-term capital gains 5,500,899Undistributed ordinary income 1,306,239Total accumulated earnings $53,624,518
(a) The differences between book basis and tax basisunrealized depreciation is attributable to the tax de-ferral of losses on wash sales and the tax treatmentof passive foreign investment companies.
The Fund paid an ordinary income distribu-tion of $11,418,559, which represents$0.4030 per share and a long-term capitalgains distributions of $15,104,798, which rep-resents $0.5331 per share to shareholders ofrecord as of December 19, 2016. The distrib-ution was paid on December 23, 2016.
The Fund paid an ordinary income distribu-tion of $8,777,840, which represents $0.3098per share and a long-term capital gains distri-bution of $16,085,151, which represents$0.5677 per share to shareholders of recordas of December 21, 2015. The distributionwas paid on December 28, 2015.
The tax character of distributions paid dur-ing the fiscal years ended February 28, 2017and February 29, 2016 were as follows:
February-17 February-16Ordinary Income $11,418,559 $8,777,840Capital Gains $15,104,798 $16,085,151
5. Fair Value Measurements
In accordance with U.S. GAAP, fair value isdefined as the price that the Fund would re-ceive to sell an asset or pay to transfer aliability in an orderly transaction between mar-ket participants at the measurement date. U.S.GAAP also establishes a framework for mea-suring fair value, and a three-level hierarchy forfair value measurements based upon thetransparency of inputs to the valuation of anasset or liability. Inputs may be observable orunobservable and refer broadly to the as-sumptions that market participants would usein pricing the asset or liability. Observable in-puts reflect the assumptions marketparticipants would use in pricing the asset orliability based on market data obtained fromsources independent of the Fund. Unobserv-able inputs reflect the Fund’s ownassumptions about the assumptions that mar-ket participants would use in pricing the assetor liability developed based on the best infor-mation available in the circumstances. Eachinvestment is assigned a level based upon theobservability of the inputs which are signifi-cant to the overall valuation. The three-tierhierarchy of inputs is summarized below.
• Level 1—quoted prices in active marketsfor identical investments
• Level 2—other significant observable in-puts (including quoted prices for similarinvestments, interest rates, prepaymentspeeds, credit risk, etc.)
• Level 3—significant unobservable inputs(including the Fund’s own assumptions indetermining the fair value of investments)
JAPAN SMALLER CAPITALIZATION FUND, INC.
NOTES TO FINANCIAL STATEMENTS—Continued

The following table summarizes the valua-tion of the Fund’s investments by the abovefair value hierarchy levels as of February 28,2017.
Investments in Level Securities Level 1
Equity Securities*. . $339,540,789 Level 2. . . . . . . . . . . -0- Level 3. . . . . . . . . . . -0- Total. . . . . . . . . . . . . $339,540,789
*Please refer to the Schedule of Investments for abreakdown of the valuation by industry type.
During the fiscal year ended February 28,2017, there were no transfers between Level 1,Level 2, or Level 3 securities.
During the fiscal year ended February 28,2017, the Fund did not hold any instrumentwhich used significant unobservable inputs(Level 3) in determining fair value.
7. Recent Accounting PronouncementsIn December 2011, FASB issued Accounting
Standards Update No. 2011-11 “Disclosuresabout Offsetting Assets and Liabilities” (“ASU2011-11”). These disclosures are intended to helpinvestors and other financial statement users tobetter assess the effect or potential effect of off-setting arrangements on a company’s financialposition. They also improve transparency in thereporting of how companies mitigate credit risk,including disclosure of related collateral pledgedor received. In addition, ASU 2011-11 facilitatescomparison between those entities that preparetheir financial statements on the basis of GAAPand those entities that prepare their financialstatements on the basis of IFRS. ASU 2011-11 re-
quires entities to: disclose both gross and net in-formation about both instruments andtransactions eligible for offset in the financialstatements; and disclose instruments and trans-actions subject to an agreement similar to amaster netting agreement. ASU 2011-11 is effec-tive for fiscal years beginning on or after January1, 2013, and interim periods within those annualperiods. In January 2013, FASB issued ASU 2013-01, “Clarifying the Scope of Disclosures aboutOffsetting Assets and Liabilities” (“ASU 2013-01”)that provides clarification about which instru-ments and transactions are subject to ASU2011-11. The adoption of ASU 2011-11 and ASU2013-01 was not material to the financial state-ments.
JAPAN SMALLER CAPITALIZATION FUND, INC.
NOTES TO FINANCIAL STATEMENTS—Continued

JAPAN SMALLER CAPITALIZATION FUND, INC.
FINANCIAL HIGHLIGHTS
For a share of common stock outstanding throughout each year:
For the Year Ended February 28, February 29, February 28, 2017 2016 2015 2014 2013
Net asset value, beginning of year $10.50 $10.98 $9.85 $8.83 $8.85 _
Investment operations:Net investment income* . . . . . . . . . . . . . . . 0.12 0.06 0.06 0.05 0.07Net realized and unrealized gain (loss)
on investments and foreign currency . . . 2.41 0.34 1.20 1.17 (0.01) Total from investment operations . . . . . . . . . . 2.53 0.40 1.26 1.22 0.06
Less Distributions:Distributions from ordinary income . . . . . . . (0.35) (0.17) (0.12) (0.20) (0.08)Distributions from capital gains . . . . . . . . . . (0.59) (0.71) (0.01) — —
Total from distributions . . . . . . . . . . . . . . . . . . (0.94) (0.88) (0.13) (0.20) (0.08)
Net asset value, end of year . . . . . . . . . . . . . . $12.09 $10.50 $10.98 $9.85 $8.83 . . . . . . . . . . . . . . . . . . . . . . . . . . . . . . . . . . . . . _______ ______ ______ _______ ______
Market value, end of year . . . . . . . . . . . . . . . . $10.60 $8.98 $9.69 $8.84 $8.00Total investment return** . . . . . . . . . . . . . . . . . 29.4% 0.7% 11.2% 13.0% 3.4%
Ratio/Supplemental Data:Net assets, end of year (000) . . . . . . . . . . . . $342,513 $297,550 $311,094 $278,994 $250,273Ratio of expenses to average net assets . . 1.09% 1.11% 1.13% 1.19% 1.19%Ratio of net income to average net assets . 0.99% 0.50% 0.62% 0.53% 0.86%Portfolio turnover rate . . . . . . . . . . . . . . . . . 20% 24% 41% 101% 37%
_______________________* Based on average shares outstanding.** Based on market value per share, adjusted for reinvestment of income dividends, ordinary income distributions, long-
term capital gain distributions, and capital share transactions. Total return does not reflect sales commissions.
See notes to financial statements

*In addition to the Fund, the “Fund Complex” includes Korea Equity Fund, Inc.
Name and Age
Position(s)Held with the Fund
Term of Office andLength of
Time Served
Principal Occupation(s)During Past Five Years
Number ofFunds in the
Fund ComplexOverseen by
Director*
OtherPublic
DirectorshipsHeld by Director
Rodney A. Buck (69)
E. Han Kim (70)
David B. Chemidlin (60)
Marcia L. MacHarg (68)
Class III Director andChairman ofthe Board
Class I Director
Class III Director andChairman ofthe AuditCommittee
Class I Director
Director since2006; Chairman ofthe Boardsince 2010.
Director since2010.
Director andChairman ofthe AuditCommitteesince 2006.
Director since2013.
Two registered investmentcompanies consisting oftwo portfolios
Two registered investmentcompanies consisting oftwo portfolios
Two registered investmentcompanies consisting oftwo portfolios
Two registeredinvestmentcompaniesconsisting oftwo portfolios
None
None
None
None
JAPAN SMALLER CAPITALIZATION FUND, INC.
SUPPLEMENTAL SHAREHOLDER INFORMATION (Unaudited)
The 2016 Annual Meeting of the Shareholders of the Fund was held at the offices of NAM-USA at World-wide Plaza, 309 West 49th Street, New York, New York on November 17, 2016. The purpose of the meetingwas (1) to elect two Class I Directors to serve for a term to expire in 2019 and (2) to transact such other businessas may properly come before the meeting or any adjournment or postponement thereof.
At the meeting, E. Han Kim and Marcia L. MacHarg were re-elected to serve as directors of the Fund fora term expiring in 2019 and until their successors are duly elected and qualify. The results of the voting at theAnnual Meeting were as follows:
1. To elect two Class I Directors:
Shares VotedFor
% ofOutstanding
Shares
Shares Voted Withhold Authority
% ofOutstanding
Shares
E. Han KimMarcia L. MacHarg
25,228,59225,249,875
89.04%89.12%
998,832977,549
3.53%3.45%
INDEPENDENT DIRECTORS
Biographical and other information relating to the non-interested Directors of the Fund is set out below.
Owner, Buck Capital Management(private investment managementfirm) since 2005; Chairman of theDartmouth-Hitchcock Health CareInvestment Committee since 2011.
Everett E. Berg Professor of BusinessAdministration and Director of MitsuiFinancial Research Center at RossBusiness School, University of Michi-gan since 1980; Advisor to CEO ofTaubman Asia since 2009 to July2016; Non-executive Chair of theBoard of Korea Telecom (KT) from2009-2014.
Owner of AbidesWorks LLC sinceNovember 2016; Corporate Con-troller, Advance Magazine Publishers,Inc. (d/b/a Conde Nast) from 1995 toOctober 2016.
Partner, Debevoise & Plimpton LLP,1987-2012; Of Counsel, Debevoise &Plimpton LLP since 2013; Trustee,Board of Trustees of Smith Collegesince 2014 and Chair of the AuditCommittee since July 2016; Memberof the Executive Committee of theFriends of Smith College Libraries from2013 to 2015.
SharesAbstained
--
BrokerNon-Vote
--
Name and Age
Position(s)Held with the Fund
Term of Office andLength of
Time Served
Principal Occupation(s)During Past Five Years
Number ofFunds in the Fund Complex*
Overseen bythe Director **
OtherPublic
DirectorshipsHeld by Director
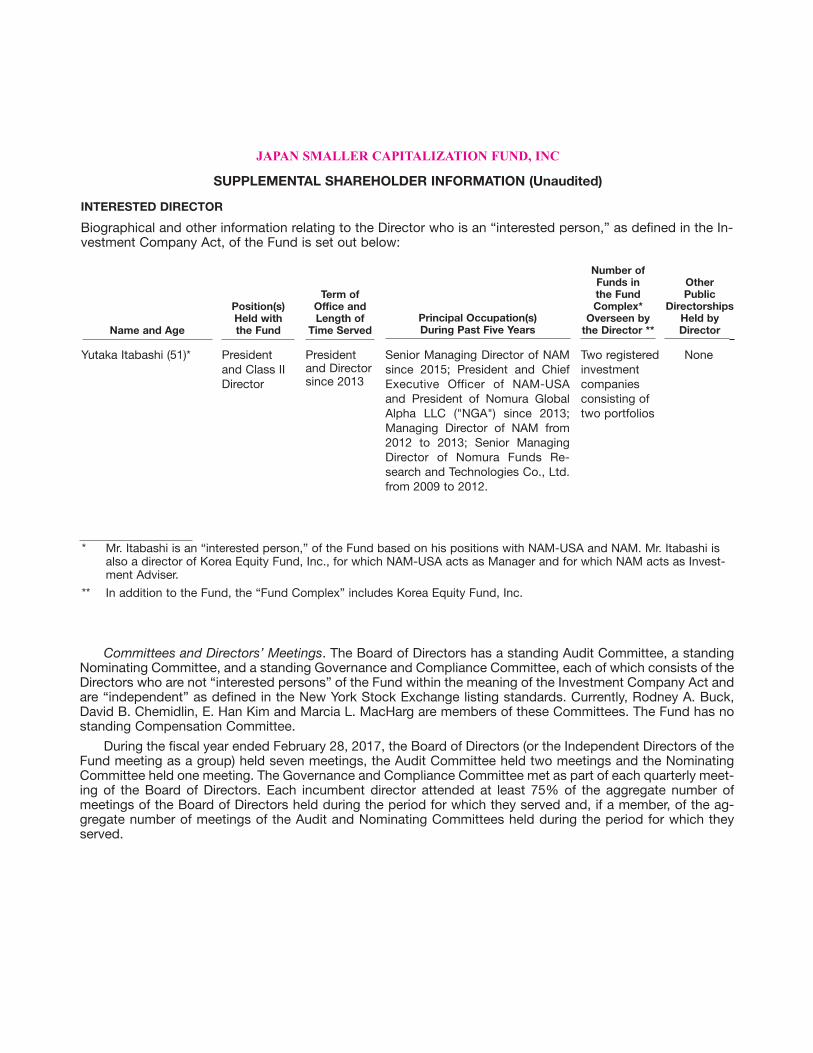
Yutaka Itabashi (51)* Presidentand Class IIDirector
Presidentand Directorsince 2013
Senior Managing Director of NAMsince 2015; President and ChiefExecutive Officer of NAM-USAand President of Nomura GlobalAlpha LLC ("NGA") since 2013;Managing Director of NAM from2012 to 2013; Senior ManagingDirector of Nomura Funds Re-search and Technologies Co., Ltd.from 2009 to 2012.
Two registeredinvestmentcompaniesconsisting oftwo portfolios
None
JAPAN SMALLER CAPITALIZATION FUND, INC
SUPPLEMENTAL SHAREHOLDER INFORMATION (Unaudited)
INTERESTED DIRECTOR
Biographical and other information relating to the Director who is an “interested person,” as defined in the In-vestment Company Act, of the Fund is set out below:
* Mr. Itabashi is an “interested person,” of the Fund based on his positions with NAM-USA and NAM. Mr. Itabashi is
also a director of Korea Equity Fund, Inc., for which NAM-USA acts as Manager and for which NAM acts as Invest-ment Adviser.
** In addition to the Fund, the “Fund Complex” includes Korea Equity Fund, Inc.
Committees and Directors’ Meetings. The Board of Directors has a standing Audit Committee, a standingNominating Committee, and a standing Governance and Compliance Committee, each of which consists of theDirectors who are not “interested persons” of the Fund within the meaning of the Investment Company Act andare “independent” as defined in the New York Stock Exchange listing standards. Currently, Rodney A. Buck,David B. Chemidlin, E. Han Kim and Marcia L. MacHarg are members of these Committees. The Fund has nostanding Compensation Committee.
During the fiscal year ended February 28, 2017, the Board of Directors (or the Independent Directors of theFund meeting as a group) held seven meetings, the Audit Committee held two meetings and the NominatingCommittee held one meeting. The Governance and Compliance Committee met as part of each quarterly meet-ing of the Board of Directors. Each incumbent director attended at least 75% of the aggregate number ofmeetings of the Board of Directors held during the period for which they served and, if a member, of the ag-gregate number of meetings of the Audit and Nominating Committees held during the period for which theyserved.

Officers of the Fund. Officers of the Fund are elected and appointed by the Directors and hold office untilthey resign, are removed or are otherwise disqualified to serve. Certain biographical and other information re-lating to the officers of the Fund is set out below:
** The address of each officer listed above is Worldwide Plaza, 309 West 49th Street, New York, New York 10019.** Elected by and serves at the pleasure of the Board of Directors.
Name, Address* and Age of Officers
Yutaka Itabashi (51)
Takeshi Toyoshima (50)
Maria R. Premole (54)
Neil Daniele (56)
Amy J. Marose (39)
Kelly S. Lee (34)
Position(s) Held with the Fund
President andDirector
Vice President
Vice President
Secretary and Chief Compliance Officer
Treasurer
Assistant Treasurer
Term of Office** and Length of Time Served
President and Directorsince 2013
Vice President since Au-gust 2016
Vice President since 2013
Secretary since 2002;Chief Compliance Officersince 2005
Treasurer since 2013; As-sistant Treasurer from2011 to 2013
Assistant Treasurer since2015
Principal Occupation(s) orEmployment During Past Five Years
Senior Managing Director of NAM since 2015;President and Chief Executive Officer of NAM-USAand President of NGA since 2013; Managing Direc-tor of NAM from 2012 to 2013; Senior ManagingDirector of Nomura Funds Research and Technolo-gies Co., Ltd. from 2009 to 2012.
Chief Administrative Officer of NAM-USA since Au-gust 2016; Head of Client Services and Marketingof NAM-USA from 2015 to August 2016; SeniorPortfolio Manager of NAM from 2008 to 2015.
Vice President and Head of Retail Product Man-agement of NAM-USA since 2013; Associate ofNAM-USA from 2008 to 2013.
Chief Compliance Officer of NAM-USA since 2005and Managing Director of NAM-USA since 2007;Chief Compliance Officer of NGA since 2008; ChiefCompliance Officer of Nomura Corporate Researchand Asset Management Inc. and Nomura FundsResearch and Technologies America, Inc. since2009; Corporate Secretary of NAM-USA and NGAsince 2013.
Executive Director of NAM-USA since 2015; Con-troller and Treasurer of NAM-USA and Treasurer ofNGA since 2013; Vice President of NAM-USA from2009 to 2015.
Vice President of NAM-USA since 2015; Fund Con-troller at JP Morgan Chase & Co. from 2014 to2015; Financial Services Senior at Ernst & YoungLLP from 2010 to 2014.
JAPAN SMALLER CAPITALIZATION FUND, INC
SUPPLEMENTAL SHAREHOLDER INFORMATION (Unaudited)
JAPAN SMALLER CAPITALIZATION FUND, INC.
TAX INFORMATION (Unaudited)
We are required by subchapter M of the Internal Revenue Code of 1986, as amended, to adviseyou within 60 days of the Fund’s fiscal year ended February 28, 2017 as to the federal tax status ofdistributions received by shareholders during such fiscal year. Accordingly, the Fund designates$757,422 as foreign tax credit with the associated foreign gross income of $7,574,221.
Shareholders should not use the above information to prepare their tax returns. The informationnecessary to complete your income tax returns will be included with your Form 1099 DIV which wassent to you separately in January 2017.
REVIEW OF THE FUND’S MARKET PRICE COMPARED TO NET ASSET VALUE (Unaudited)
Shares of closed-end investment companies, including funds focusing on a single country, haveat various times traded at both premiums and discounts to their net asset value (‘‘NAV’’). Althoughthe shares of the Fund have traded at such a premium, they also have traded at a discount from NAV.
Since the Fund was established, the Board of Directors on a quarterly basis has reviewed themarket price of the Fund’s shares. The purpose of such review has been to determine whether a discount exists and, if so, whether it would be in the shareholders’ overall best interests for the Fundto conduct share repurchases, make an issuer tender offer for shares or consider another means of possibly reducing the discount. For example, the Board of Directors has also considered whether itwould be in the best interests of the Fund to convert to an open-end fund or to an interval fund, whichis a form of investment company that makes periodic share repurchases at prices based on NAV.
In addition, on May 26, 2016, the Board of Directors approved a Discount Management Plan.Under the plan, the Fund is authorized to make open-market share repurchases on the New YorkStock Exchange. Such repurchases may be made from time to time as authorized by the Board ofDirectors.
To date, the Board of Directors has not authorized open-market share repurchases or a tenderoffer for shares of the Fund. The Board of Directors also has not felt that it would be in the best interests of the Fund or its shareholders to convert to an open-end fund or an interval fund. As a“country fund” emphasizing a smaller capitalization segment of the market, the Fund’s NAV is morevolatile than might be the case for a fund with a broader investment focus. The Board of Directorsbelieves that converting the Fund to either an open-end or interval fund would subject the Fund to redemptions or repurchases at times when liquidation of portfolio securities could disadvantage remaining shareholders, and the Directors believe that the recent volatility of the financial markets inJapan supports their view. Additionally, since an open-end fund has a limited ability to invest in illiquid securities, such a conversion could hinder the Fund’s ability to pursue its investment objec-tives. The Board of Directors intends to continue to review, on a quarterly basis, the trading marketfor the Fund’s shares.
The Dividend Reinvestment Plan (the “Plan”) isavailable automatically for any holder of CommonStock with shares registered in his/her own namewho wishes to purchase additional shares with in-come dividends or long-term capital gaindistributions received on shares owned, unlesssuch shareholder elects to receive all dividends andcapital gain distributions in cash, paid by check andmailed to the shareholder. If a shareholder holdsshares in his/her own name, communications re-garding the Plan should be addressed toComputershare Trust Company, N.A., (the “PlanAgent”), P.O. Box 505000 Louisville, KY 40233. Un-der the Plan, shareholders appoint the Plan Agentto reinvest dividends and distributions in shares ofthe Fund. Such shares will be acquired by the PlanAgent for shareholders either through open marketpurchases if the Fund is trading at a discount orthrough the issuance of authorized but unissuedshares if the Fund is trading at net asset value or apremium. If the market price of a share on thepayable date of a dividend or distribution is at orabove the Fund’s net asset value per share on suchdate, the number of shares to be issued by theFund to each shareholder receiving shares in lieu ofcash dividends or distributions will be determinedby dividing the amount of the cash dividends or dis-tributions to which such shareholder would beentitled by the greater of the net asset value pershare on such date or 95% of the market price of ashare on such date. If the market price of a share onsuch distribution date is below the net asset valueper share, the number of shares to be issued tosuch shareholders will be determined by dividingsuch amount, less brokerage commission, by theper share market price.
Purchases will be made by the Plan Agentfrom time to time on the New York Stock Exchange(the “Exchange”) or elsewhere to satisfy dividend
and distribution investment requirements under thePlan. Purchases will be suspended on any daywhen the closing price (or the mean between theclosing bid and ask prices if there were no sales) ofthe shares on the Exchange on the preceding trad-ing day was higher than the net asset value pershare. If on the dividend payable date, purchasesby the Fund are insufficient to satisfy dividend ordistribution investments and on the last trading dayimmediately preceding the dividend payable datethe closing price or the mean between the closingbid and ask prices of the shares is lower than or thesame as the net asset value per share, the PlanAgent will continue to purchase shares until all in-vestments by shareholders have been completedor the closing price or the mean between the bidand ask prices of the shares becomes higher thanthe net asset value, in which case the Fund will is-sue the necessary additional shares fromauthorized but unissued shares. If on the last trad-ing day immediately preceding the dividendpayable date, the closing price or the mean be-tween the bid and ask prices of the shares is higherthan the net asset value per share and if the numberof shares previously purchased on the Exchange orelsewhere is insufficient to satisfy dividend invest-ments, the Fund will issue the necessary additionalshares from authorized but unissued shares. Therewill be no brokerage charges with respect to sharesissued directly by the Fund to satisfy the dividendinvestment requirements. However, each partici-pant will pay a pro rata share of brokeragecommissions incurred with respect to the Fund’sopen market purchases of shares. In each case, thecost per share of shares purchased for each share-holder’s account will be the average cost, includingbrokerage commissions, of any shares purchasedin the open market plus the cost of any shares is-sued by the Fund. For the fiscal year endedFebruary 28, 2017, the Fund issued no new shares
JAPAN SMALLER CAPITALIZATION FUND, INC.
DIVIDEND REINVESTMENT PLAN (Unaudited)
for dividend reinvestment purposes.
Shareholders who elect to hold their shares inthe name of a broker or other nominee should con-tact such broker or other nominee to determinewhether they may participate in the Plan. To the ex-tent such participation is permitted, the Plan Agentwill administer the Plan on the basis of the numberof shares certified from time to time by the brokeras representing the total amount registered in theshareholder’s name and held for the account ofbeneficial owners who are participating in suchPlan. Shareholders that participate in the Plan hold-ing shares in a brokerage account may not be ableto transfer the shares to another broker and con-tinue to participate in the Plan. Shareholders whoare participating in the Plan may withdraw from thePlan at any time.
There will be no penalty for withdrawal fromthe Plan, and shareholders who have previouslywithdrawn from the Plan may rejoin it at any time.Changes in participation in the Plan should bemade by contacting the Plan Agent if the shares areheld in the shareholder’s own name and must be inwriting and should include the shareholder’s nameand address as they appear on the account regis-tration. If the shares are held in the name of abroker or other nominee, such person should becontacted regarding changes in participation in thePlan. Upon withdrawal from the Plan, the appropri-ate number of full shares will be reflected in theFund records and a cash payment for any fractionalshares will be issued. The shareholder may also re-quest the Plan Agent to sell part or all of the shareholder’s shares at the market priceand remit the proceeds to the shareholder, net ofany brokerage commissions. A $2.50 fee plus $0.15per share sold will be charged by the Plan Agentupon any cash withdrawal or termination. An elec-tion to withdraw from the Plan will, until suchelection is changed, be deemed to be an electionby a shareholder to take all subsequent distribu-tions in cash. An election will be effective only for a
dividend or distribution if it is received by the PlanAgent not less than 10 days prior to such recorddate.
The Plan Agent will maintain all shareholders’accounts in the Plan, and furnish written confirma-tion of all transactions in such account, includinginformation needed by shareholders for taxrecords. Shares in the account of each Plan participant may be held by the Plan Agent in non-certificated form in the name of the participant, andeach shareholder’s proxy will include those sharespurchased or received pursuant to the Plan.
The automatic reinvestment of dividends willnot relieve participants of any income taxes thatmay be payable (or required to be withheld) on suchdividends. Shareholders receiving dividends or dis-tributions in the form of additional shares pursuantto the Plan should be treated for Federal income taxpurposes as receiving a distribution in an amountequal to the amount of money that the shareholdersreceiving cash dividends or distributions will re-ceive and should have a cost basis in the sharesreceived equal to such amount.
The Fund reserves the right to amend or terminate the Plan as applied to any dividend paidsubsequent to written notice of the change sent to participants in the Plan at least 90 days beforethe record date for such dividend. There is no ser-vice charge to participants in the Plan; however, theFund reserves the right to amend the Plan to in-clude a service charge payable by the participants.All correspondence concerning the Plan, includingrequests for additional information about the Plan,should be directed to the Trust Company, at Com-putershare Trust Company, N.A. P.O. Box 505000Louisville, KY 40233.

BOARD OF DIRECTORS
Rodney A. BuckDavid B. ChemidlinYutaka ItabashiE. Han KimMarcia L. MacHarg
OFFICERS
Yutaka Itabashi, PresidentTakeshi Toyoshima, Vice PresidentMaria R. Premole, Vice PresidentNeil A. Daniele, Secretary and Chief Compliance OfficerAmy J. Marose, TreasurerKelly S. Lee, Assistant Treasurer
MANAGER
Nomura Asset Management U.S.A. Inc.Worldwide Plaza309 West 49th StreetNew York, New York 10019-7316Internet Addresshttp://funds.nomura-asset.com
INVESTMENT ADVISER
Nomura Asset Management Co., Ltd.1-12-1, Nihonbashi, Chuo-ku,Tokyo 103-8260, Japan
DIVIDEND PAYING AGENT, TRANSFER AGENTAND REGISTRAR
Computershare Trust Company, N.A. P. O. Box 505000Louisville, KY 40233
CUSTODIAN
Brown Brothers Harriman & Co.50 Post Office SquareBoston, Massachusetts 02110-1548
COUNSEL
Sidley Austin LLP787 Seventh AvenueNew York, New York 10019
INDEPENDENT REGISTERED PUBLIC ACCOUNTING FIRM
RSM US LLP 80 City SquareBoston, Massachusetts 02129
JAPAN SMALLER CAPITALIZATION FUND, INC.WORLDWIDE PLAZA309 WEST 49TH STREETNEW YORK, NEW YORK 10019-7316This Report, including the Financial Statements, is transmitted to theShareholders of Japan Smaller Capitalization Fund, Inc. for their infor-mation. This is not a prospectus, circular or representation intended foruse in the purchase of shares of the Fund or any securities mentioned inthe Report.
JAPANSmaller Capitalization
Fund, Inc.
ANNUAL REPORT
FEBRUARY 28, 2017