16 cardiac
TRANSCRIPT

Chapter 16
Cardiac System
378
Many cardiac diagnostic studies are available to the cardi-ologist, including electrocardiography (ECG), echocar-diography, computed tomography (CT), CT angiography (CTA), and magnetic resonance imaging (MRI). The continuing value of cardiac nuclear studies stems from their noninvasiveness and accurate portrayal of a wide range of functional and metabolic parameters that predict prognosis and risk.
MYOCARDIAL PERFUSION SCINTIGRAPHY
The instrumentation, radiopharmaceuticals, and methodol-ogy used for myocardial perfusion scintigraphy have evolved over the years. Multiview planar imaging was followed by single-photon emission tomography (SPECT), gated SPECT, SPECT/CT, positron emission tomography (PET), and PET/CT. The underlying physiological principles that make myocardial perfusion imaging an important diagnostic tool remain unchanged.
Myocardial perfusion scintigraphy depicts sequential physiological events. First, the radiopharmaceutical must be delivered to the myocardium. Second, a viable metabolically active myocardial cell must be present to extract the radiotracer. Finally, a significant amount of the radiopharmaceutical must remain within the cell to allow for imaging. The scintigraphic images are a map of regional myocardial perfusion. If a patient has reduced regional perfusion as a result of hemodynamically signifi-cant coronary artery disease (CAD) or a loss of cell viabil-ity as a result of myocardial infarction, a perfusion defect or cold region is seen on the images. All diagnostic pat-terns in the many diverse applications follow from these observations.
Single-Photon Radiopharmaceuticals
Technetium-99m sestamibi and Tc-99m tetrafosmin have supplanted thallium-201 chloride as the most commonly used single-photon myocardial imaging agents, because of their superior image quality and the lower effective radia-tion dose to the patient.
Technetium-99m SestamibiTc-99m sestamibi (Cardiolite) was the first technetium-labeled cardiac perfusion agent to be approved by the U.S. Food and Drug Administration (FDA) for clinical use in 1990. Generic Tc-99m sestamibi became available late September 2008.
ChemistrySestamibi is a lipophilic cation and member of the chemical isonitrile family. The radiopharmaceutical is composed of six isonitrile ligands (chemical name: hexakis 2- methoxyisobutyl isonitrile) surrounding the Tc-99m
radionuclide. The radiopharmaceutical is prepared for the patient from a manufacturer-provided kit.
Mechanism of Localization and UptakeBecause it is lipid soluble, Tc-99m sestamibi diffuses from the blood into the myocardial cell. It is retained intracel-lularly in the region of mitochondria because of its nega-tive transmembrane potential. First-pass extraction fraction is 60% (Table 16-1). Extraction is proportional to coronary blood flow, underestimated at high flow rates and overestimated at low flow (Fig. 16-1).
PharmacokineticsAfter the agent rapidly clears from the blood, myocardial uptake is prompt, surrounded by high lung and liver uptake. The radiopharmceutical remains fixed within the myocardium. This allows for an imaging time window of several hours after administration, based on the radio-tracer half-life. Because of renal and biliary excretion, the liver and lungs progressively clear, improving the myo-cardium-to-background activity ratios with time. Imaging acquisition begins 45 to 60 minutes after tracer adminis-tration for resting studies and at 30 minutes for exercise stress studies because of more rapid background clearance.
DosimetryThe colon is the critical radiation target organ, receiving 5.4 rems/30 mCi (5.4 cGy/1110 MBq) (Table 16-2). The radiation effective whole body dose is 0.9 rem/30 mCi or 0.9 cGy/1110MBq.
Technetium-99m TetrofosminTc-99m tetrofosmin (Myoview) was approved by the FDA in 1996. It is similar to Tc-99m sestamibi, although not identical. An advantage over Tc-99m sestamibi is its more rapid liver clearance.
ChemistryTetrofosmin is a member of the diphosphine chemical class (chemical name: 6,9-bis [2-ethoxyethyl]-3,12-dioxa-6,9 diphosphatetradecane). It is prepared from a commercial kit.
Mechanism of Localization and UptakeSimilar to sestamibi, Tc-99m tetrofosmin is a lipophilic cat-ion that localizes near mitochondria in the myocardial cell and remains fixed at that site.
PharmacokineticsAfter intravenous injection, Tc-99m tetrofosmin is cleared rapidly from the blood and myocardial uptake is prompt. First-pass extraction is slightly less than that of sestamibi (50% vs. 60%), with 1.2% of the injected dose taken up in the myocardium by 5 minutes after injection (Table 16-1).

CardiaC SyStem 379
table 16-1 Physiology and Pharmacokinetics of Thallium-201, Sestamibi, and Technetium-99m Tetrofosmin
Physiology Thallium-201 Tc-99m sestamibi Tc-99m tetrofosmin
Chemical class/charge Elemental cation Isonitrile cation Diphosphine cation
Mechanism of uptake Active transport Na/K ATPase pump
Passive diffusion, negative electrical potential
Passive diffusion, negative electrical potential
Myocyte localization Cytosol Mitochondria Mitochondria
Intracellular state Free Bound Bound
Preparation Cyclotron Generator/kit Generator/kit
First-pass extraction fraction (%) 85 60 50
Percent cardiac uptake (%) 3 1.5 1.2
Myocardial clearance 4-hr T½ Minimal Minimal
Body clearance Renal Hepatic Hepatic
Imaging time after injection
Stress 10 min 15-30 min 5-15 min
Rest 3-4 hr 30-90 min 30 min
Extraction is proportional to blood flow, but underesti-mated at high flow rates (Fig. 16-1).
Heart-to-lung and heart-to-liver ratios improve with time because of physiological clearance through the liver and kidneys. Heart-to-liver ratios are higher for Tc-99m tetrofosmin than sestamibi because of faster hepatic clear-ance, allowing for earlier imaging. After exercise stress, imaging at 15 minutes is feasible. Rest studies can be started 30 minutes after injection.
DosimetryThe radiation absorbed dose is similar to that of Tc-99m sestamibi (Table 16-2), although the package insert states
Figure 16-1. Myocardial perfusion radiopharmaceutical uptake relative to coronary blood flow. An ideal myocardial perfusion tracer would show a linear relationship to blood flow over a wide range of flow rates (straight diagonal dark dashed line). Tc-99m sestamibi and Tc-99m tetrofosmin all have extraction that is proportional to blood flow but underestimate flow at high flow rates. At rest, the normal myocardial coronary low rate is 1 mL/g/min. With exercise, it can increase to 2 mL/g/min. With pharma-cological vasodilation, flow may exceed 2 mL/g/min. Tl-201, Tc-99m ses-tamibi, and Tc-99m tetrofosmin all have extraction that is proportional to blood flow but underestimate flow at high flow rates.
that the gallbladder receives the highest dose (5.4 rems/20mCi [5.4 cGy/1110 MBq]), rather than the colon for sesta-mibi. The reason for the difference may be due to whether the studied subjects ate and had gallbladder contraction. The whole-body radiation effective dose is 0.8 rem/30 mCi (0.8 cGy/1110 MBq).
Thallium-201 ChlorideRadiolabeled potassium (K+) was considered for possible use for myocardial perfusion imaging because it is the major intracellular cation. Sodium (Na+)/K+ homeostasis is maintained via an energy-dependent process involving the Na+/K+ ATPase (adenosine triphosphatase) pump in the myocardial cell membrane. However, neither K+ nor its analogs, cesium and rubidium, were found suitable for
table 16-2 Patient Radiation Dose from Thallium-201, Technetium-99m Sestamibi, Technetium-99m Tetrofosmin
Tl-201+Tc-99m sestamibi
Tc-99m tetrofosmin
Doserems/3 mCi(cGy/111 MBq)
rems/30 mCi(cGy/1110 MBq)
rems/30 mCi(cGy/1110 MBq)
Heart wall 0.3 0.5 0.5
Liver 1.1 0.8 0.5
Kidneys 5.1 2.0 1.4
Gallbladder 0.9 2.8 5.4
Urinary bladder
0.6 2.0 2.1
Colon 0.8 5.4 3.4
Thyroid 30.0 0.7 0.6
Testes 0.9 0.3 0.4
Ovaries 1.1 1.5 1.1
Total effective dose
1.8 0.9 0.8
Target organ (highest radiation absorbed dose) in boldface type.

380 Nuclear Medicine: The Requisites
single-photon imaging because of their high-energy pho-tons. Rubidium-82 is used today for dual-photon imaging with PET.
Tl-201 chloride behaves physiologically similar to K+, although it is not a true K+ analog in a chemical sense. First used for myocardial scintigraphy in the mid-1970s, it was the only perfusion agent available until the 1990s, when Tc-99m–labeled radiotracers were introduced. Tl-201 is less commonly used today because of its poorer image quality, although at some imaging clinics it is used for the rest study in dual-isotope studies or for viability studies.
ChemistryThallium is a metallic element in the IIIA series of the Periodic Table of the Elements (Fig. 1-1). In pharmaco-logical doses, thallium is a poison, but is nontoxic in the subpharmacological tracer doses used. It is administered to the patient in the chemical form of thallium chloride.
PhysicsThe radionuclide Tl-201 is cyclotron produced. It decays by electron capture to its stable mercury-201 daughter, with a physical half-life of 73 hours. The photons available for imaging are mercury K-characteristic x-rays ranging from 69 to 83 keV (95% abundant) and gamma rays of 167 keV (10%) and 135 keV (3%) (Table 16-3). For gamma-camera imaging, a 20% to 30% window is centered at 69 to 83 keV and a 20% window at 167 keV.
Mechanism of Localization and PharmacokineticsAfter intravenous injection, Tl-201 blood clearance is rapid (Fig. 16-2). It is transported across the myocardial cell membrane via the Na+/K+ ATPase pump. More than 85% is extracted by the myocardial cell on first pass through the coronary capillary circulation (Table 16-1). Peak myocar-dial uptake occurs by 10 minutes. Approximately 3% of the administered dose localizes in the myocardium. Extraction is proportional to relative regional perfusion over a range of flow rates. At high flow rates, extraction efficiency decreases; at low rates, it increases. It can only be extracted by viable myocardium, but not in regions of infarction or scar.
Scintigraphy obtained after Tl-201 uptake reflects capil-lary myocardial blood flow. It then undergoes redistribu-tion, a continual dynamic exchange between the myocardial cell and the vascular blood pool. As it leaves
tttepb
Ti1ioidbi
DTm2
bimnt
Fnpptpdutirfr
table 16-3 Physical Characteristics of Thallium-201 and Technetium-99m
Physical characteristic Tl-201 Tc-99m
Mode of decay Electron capture Isomeric transition
Physical half-life 73 hours 6 hours
Principal emissions (abundance)*
Mercury x-rays
69-83 keV
Gamma rays
167 keV (10%) 135 keV (2.5%)
Gamma rays
140 keV (89%)
*Abundance is the percent likelihood of an emission type occurring with each decay
he myocardial cell, it is replaced by Tl-201 circulating in he systemic blood pool, which also undergoes redistribu-ion. Several hours after injection, the images depict an quilibrium reflecting regional blood volume. With normal erfusion, initial capillary blood flow and delayed regional lood volume images are similar.These unique pharmacokinetic characteristics of l-201 are the basis for the “stress-redistribution” Tl-201
maging strategy used for the detection of CAD (Fig. 6-2). Regions of decreased perfusion on early poststress mages are due to either decreased blood flow (ischemia) r lack of viable cells to fix the tracer (infarction). If an nitial perfusion defect persists on delayed images, it epicts infarction. Defects showing “fill-in” of Tl-201 etween stress and rest are viable myocardium rendered
schemic during stress.
osimetryhe kidneys receive the highest radiation dose at 5.1 rem/3 Ci (5.1 cGy/111 MBq). The whole-body effective dose is
.4 rem/4 mCi (2.4 cGy/1480 MBq) (Table 16-2).Tl-201 has relatively high-radiation absorbed dose
ecause of its long biological and physical half-life, limit-ng the maximum allowable administered dose to 3.5–4.0
Ci (130-150 MBq). Myocardial image quality of Tl-201 is ot as good as with Tc-99m–labeled radiopharmaceuticals o a large extent because of the low administered dose.
igure 16-2. Tl-201 pharmacokinetics: redistribution. After intrave-ous injection, Tl-201 clears rapidly from the blood pool. Normal stress eak myocardial uptake occurs by 10 minutes. Redistribution begins romptly after initial uptake. This is a constant dynamic exchange of hallium between the myocytes and blood pool. Normal myocardium rogressively clears over 3 hours. In the presence of ischemia, uptake is elayed and reduced and clearance is slow. With infarction, there is little ptake and very little change over time. The schematic diagram relates hallium pharmacokinetics (below) to scintigraphic findings (above). The schemic region, although initially hypoperfused compared to the normal egion equalizes scintigraphically at 3 hours. (Modified with permission rom Dilsizian V, Narula J. Atlas of Nuclear Cardiology. Philadelphia: Cur-ent Medicine; 2003.)
CardiaC SyStem 381
ANT LAO RAO
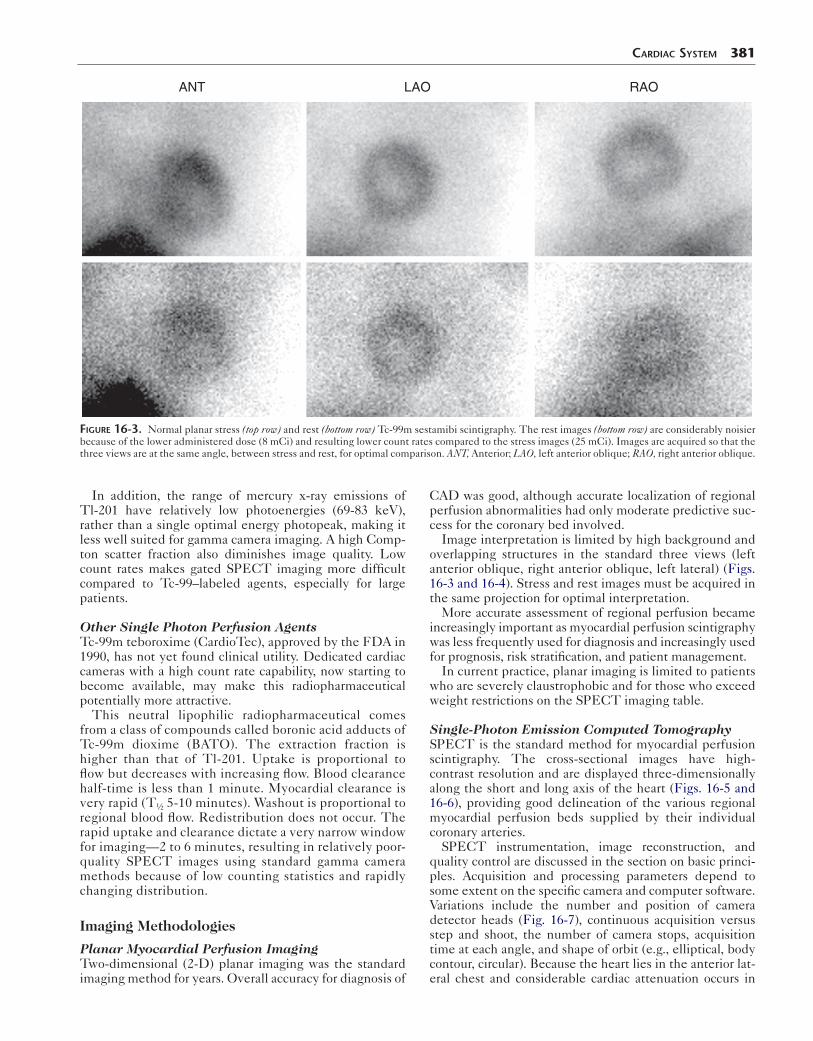
Figure 16-3. Normal planar stress (top row) and rest (bottom row) Tc-99m sestamibi scintigraphy. The rest images (bottom row) are considerably noisier because of the lower administered dose (8 mCi) and resulting lower count rates compared to the stress images (25 mCi). Images are acquired so that the three views are at the same angle, between stress and rest, for optimal comparison. ANT, Anterior; LAO, left anterior oblique; RAO, right anterior oblique.
In addition, the range of mercury x-ray emissions of Tl-201 have relatively low photoenergies (69-83 keV), rather than a single optimal energy photopeak, making it less well suited for gamma camera imaging. A high Comp-ton scatter fraction also diminishes image quality. Low count rates makes gated SPECT imaging more difficult compared to Tc-99–labeled agents, especially for large patients.
Other Single Photon Perfusion AgentsTc-99m teboroxime (CardioTec), approved by the FDA in 1990, has not yet found clinical utility. Dedicated cardiac cameras with a high count rate capability, now starting to become available, may make this radiopharmaceutical potentially more attractive.
This neutral lipophilic radiopharmaceutical comes from a class of compounds called boronic acid adducts of Tc-99m dioxime (BATO). The extraction fraction is higher than that of Tl-201. Uptake is proportional to flow but decreases with increasing flow. Blood clearance half-time is less than 1 minute. Myocardial clearance is very rapid (T½ 5-10 minutes). Washout is proportional to regional blood flow. Redistribution does not occur. The rapid uptake and clearance dictate a very narrow window for imaging—2 to 6 minutes, resulting in relatively poor-quality SPECT images using standard gamma camera methods because of low counting statistics and rapidly changing distribution.
Imaging Methodologies
Planar Myocardial Perfusion ImagingTwo-dimensional (2-D) planar imaging was the standard imaging method for years. Overall accuracy for diagnosis of
CAD was good, although accurate localization of regional perfusion abnormalities had only moderate predictive suc-cess for the coronary bed involved.
Image interpretation is limited by high background and overlapping structures in the standard three views (left anterior oblique, right anterior oblique, left lateral) (Figs. 16-3 and 16-4). Stress and rest images must be acquired in the same projection for optimal interpretation.
More accurate assessment of regional perfusion became increasingly important as myocardial perfusion scintigraphy was less frequently used for diagnosis and increasingly used for prognosis, risk stratification, and patient management.
In current practice, planar imaging is limited to patients who are severely claustrophobic and for those who exceed weight restrictions on the SPECT imaging table.
Single-Photon Emission Computed TomographySPECT is the standard method for myocardial perfusion scintigraphy. The cross-sectional images have high- contrast resolution and are displayed three-dimensionally along the short and long axis of the heart (Figs. 16-5 and 16-6), providing good delineation of the various regional myocardial perfusion beds supplied by their individual coronary arteries.
SPECT instrumentation, image reconstruction, and quality control are discussed in the section on basic princi-ples. Acquisition and processing parameters depend to some extent on the specific camera and computer software. Variations include the number and position of camera detector heads (Fig. 16-7), continuous acquisition versus step and shoot, the number of camera stops, acquisition time at each angle, and shape of orbit (e.g., elliptical, body contour, circular). Because the heart lies in the anterior lat-eral chest and considerable cardiac attenuation occurs in
382 Nuclear Medicine: The Requisites
Anteriorwall
Inferiorwall
Anteriorwall
Inferiorwall
Apex
Septum
LADand/orRCA
LAD
RCA
LAD
ApexRCA
LAD
LADand/orRCA
LCx
Lateralwall
Apex
LADand/orRCA
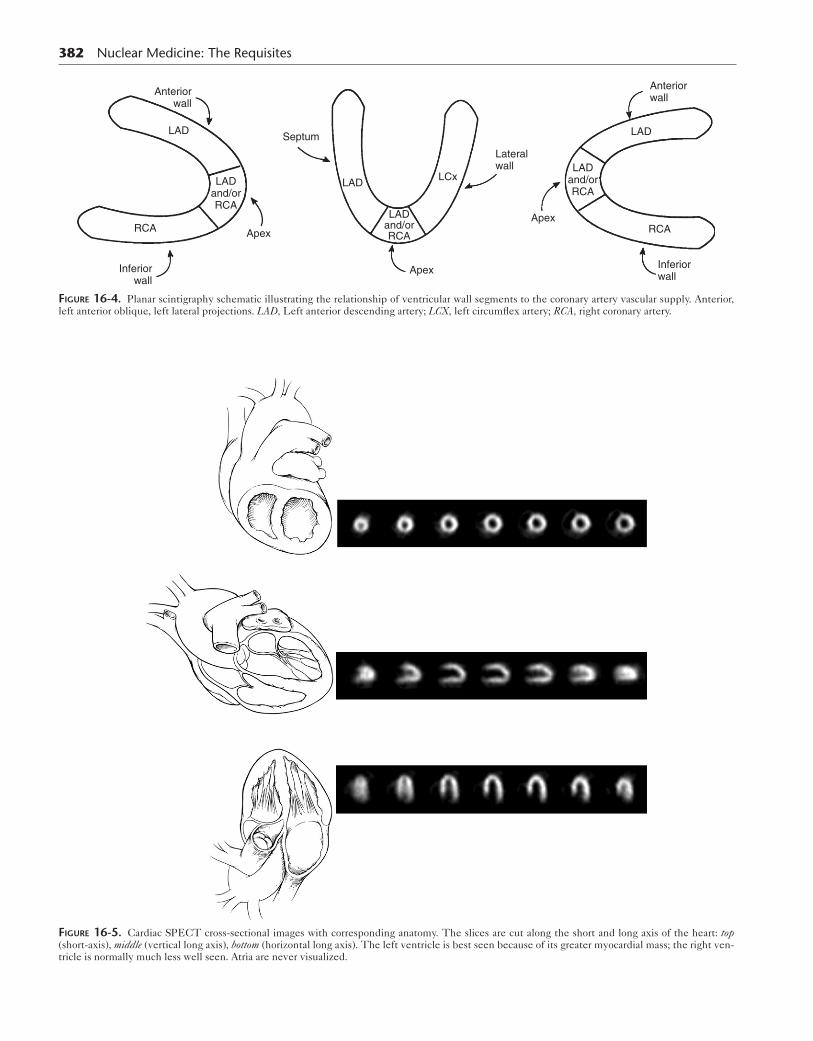
Figure 16-4. Planar scintigraphy schematic illustrating the relationship of ventricular wall segments to the coronary artery vascular supply. Anterior, left anterior oblique, left lateral projections. LAD, Left anterior descending artery; LCX, left circumflex artery; RCA, right coronary artery.
Figure 16-5. Cardiac SPECT cross-sectional images with corresponding anatomy. The slices are cut along the short and long axis of the heart: top (short-axis), middle (vertical long axis), bottom (horizontal long axis). The left ventricle is best seen because of its greater myocardial mass; the right ven-tricle is normally much less well seen. Atria are never visualized.

the posterior projections, SPECT is often acquired over a 180-degree arc from the left posterior oblique to the right anterior oblique projection. The left arm is positioned above the head to minimize attenuation.
Using a two-head camera with the detectors at 90 degrees is a common approach that maximizes sensitivity and minimizes acquisition time. Three-head detectors have added value but are costly and not widely available. High-resolution collimators are used to take advantage of the higher counts obtained from multiple detectors. Good image quality requires the acquisition time be as short as possible while acquiring sufficient counts. Image acquisi-tion with standard SPECT systems requires 20 to 30 min-utes. New dedicated cardiac cameras can acquire adequate counts with good image resolution in a shorter period.
Filtered backprojection was the standard method used for cross-sectional image reconstruction; however, with faster computers today, iterative reconstruction techniques are often used, particularly with CT attenuation correction. Software filters are chosen to optimize the trade-off between
Anterior
Apex
Inferior
LADorRCA
LAD
RCA
Anterior
Inferior
Septum LAD LCx
LAD
RCA
Lateral
Apex
Septum
LAD or RCA
LCxLADLateral
Figure 16-6. SPECT processed to obtain cross-sectional slices cut along the short and long axis of the heart.
CardiaC SyStem 383
high-frequency noise and low-frequency oversmoothing. Attenuation correction uses an attenuation map generated by a rotating gamma source or CT.
Cardiac SPECT software reconstructs cross-sectional cardiac images along the short and long axes of the heart—that is, transaxial (short axis), coronal (horizontal long axis), and sagittal (vertical long axis) (Figs. 16-5 and 16-6). This also has become the standard for CT, MRI, and echocar-diography. The SPECT cross-sectional images depict the regional perfusion of the myocardium as it relates to the coronary artery supplying blood to that region (Table 16-4) and permits visual estimation of the degree and extent of the perfusion abnormality (Figs. 16-8 and 16-9).
Gated Single-Photon Emission Computed TomographyThe high count rate available from 20 to 30 mCi (740–1110 MBq) of Tc-99m sestamibi or tetrofosmin and two detec-tors makes ECG gating feasible and common practice today. ECG gated SPECT provides a cinematic three-dimensional display of contracting myocardial slices from summed beats over the acquisition time. Data collection is
Figure 16-7. Two-head and three-head detector gamma camera con-figurations for cardiac imaging. A common configuration with the two-head systems is with the heads at right angles to each other (lower). Thus maximal count rate is achieved over a 180-degree rotation. Three-heads are typically acquired over a 270- to 360-degree rotation.
table 16-4 Scintigraphic Patterns by Vascular Distribution: Stenosis and Obstruction
Coronary arteries Scintigraphic perfusion defects
Left anterior descending Septum, anterior wall, apex
Left circumflex Lateral wall, posterior wall, posterior inferior wall, apex
Right coronary Inferior wall, posterior inferior wall, right ventricular wall
Left main coronary Anterior wall, septum, posterolateral wall
Multivessel disease Multiple vascular bed perfusion defects
Poststress ventricular dilation, increased Tl-201 lung uptake

Vertical
Short AxisApical
13
14
15
16
10
9
8
72
1
6
5
17
3
4
12
11
Mid MidBasal
Long Axis
RCA
LAD
LCX
Figure 16-8. Standardization of SPECT myocardial segments. This method divides the myocardium into 17 regions and has been recommended for all cardiac imaging. The diagram also correlates coronary artery anatomy with regional perfusion. Some computer software systems use a different num-ber of regions. LAD, Left anterior descending artery; LCX, left circumflex artery; RCA, right coronary artery. (Modified with permission from Cerqueira MD, Weissman J, Dilsizian V, et al. Standardized myocardial segmentation and nomenclature for tomographic imaging of the heart: a statement for healthcare professionals from the Cardiac Imaging Committee of the Council on Clinical Cardiology of the American Heart Association. J Nucl Cardiol. 2002;2[2]:240–245.)
Figure 16-9. Normal myocardial SPECT perfusion study. Top four rows display the short-axis transaxial images (stress above, rest below), fifth and sixth rows display the horizontal long-axis (sagittal) stress and rest views, and the seventh and eighth rows display the vertical long-axis (coronal) views.
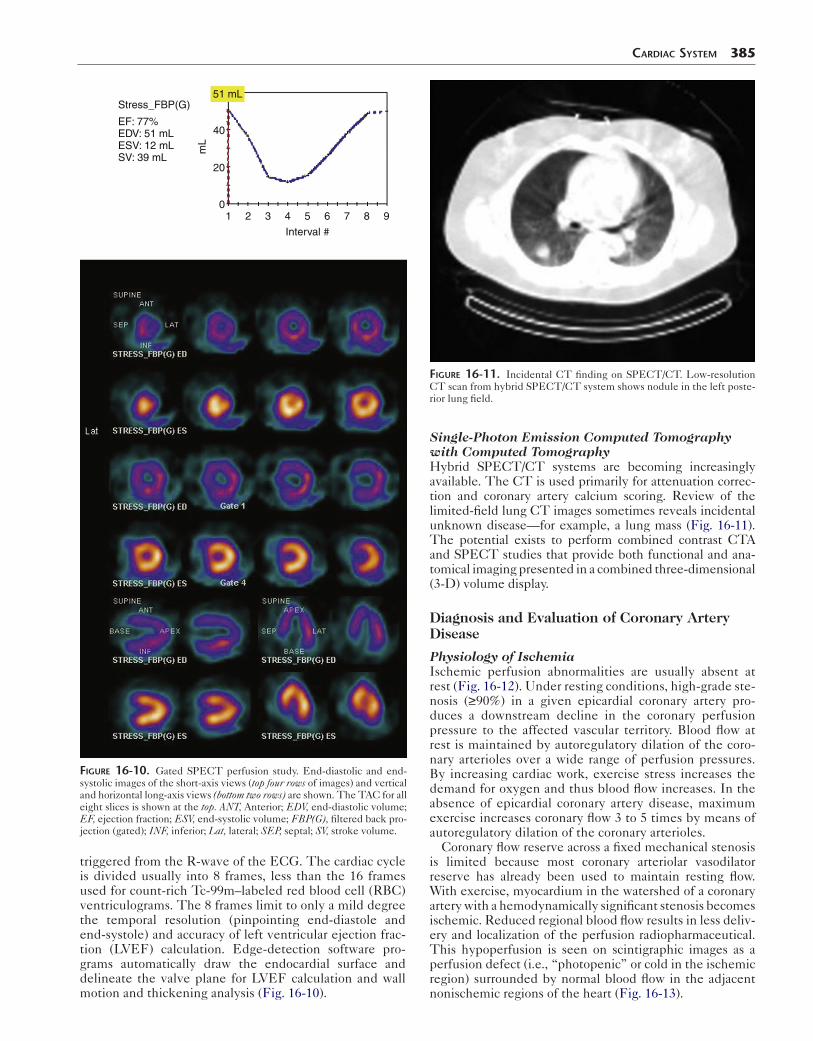
triggered from the R-wave of the ECG. The cardiac cycle is divided usually into 8 frames, less than the 16 frames used for count-rich Tc-99m–labeled red blood cell (RBC) ventriculograms. The 8 frames limit to only a mild degree the temporal resolution (pinpointing end-diastole and end-systole) and accuracy of left ventricular ejection frac-tion (LVEF) calculation. Edge-detection software pro-grams automatically draw the endocardial surface and delineate the valve plane for LVEF calculation and wall motion and thickening analysis (Fig. 16-10).
1
Stress_FBP(G)
EF: 77%EDV: 51 mLESV: 12 mLSV: 39 mL
51 mL
mL
40
20
02 3 4 5
Interval #
6 7 8 9
Figure 16-10. Gated SPECT perfusion study. End-diastolic and end-systolic images of the short-axis views (top four rows of images) and vertical and horizontal long-axis views (bottom two rows) are shown. The TAC for all eight slices is shown at the top. ANT, Anterior; EDV, end-diastolic volume; EF, ejection fraction; ESV, end-systolic volume; FBP(G), filtered back pro-jection (gated); INF, inferior; Lat, lateral; SEP, septal; SV, stroke volume.
CardiaC SyStem 385
Single-Photon Emission Computed Tomography with Computed TomographyHybrid SPECT/CT systems are becoming increasingly available. The CT is used primarily for attenuation correc-tion and coronary artery calcium scoring. Review of the limited-field lung CT images sometimes reveals incidental unknown disease—for example, a lung mass (Fig. 16-11). The potential exists to perform combined contrast CTA and SPECT studies that provide both functional and ana-tomical imaging presented in a combined three-dimensional (3-D) volume display.
Diagnosis and Evaluation of Coronary Artery Disease
Physiology of IschemiaIschemic perfusion abnormalities are usually absent at rest (Fig. 16-12). Under resting conditions, high-grade ste-nosis (≥90%) in a given epicardial coronary artery pro-duces a downstream decline in the coronary perfusion pressure to the affected vascular territory. Blood flow at rest is maintained by autoregulatory dilation of the coro-nary arterioles over a wide range of perfusion pressures. By increasing cardiac work, exercise stress increases the demand for oxygen and thus blood flow increases. In the absence of epicardial coronary artery disease, maximum exercise increases coronary flow 3 to 5 times by means of autoregulatory dilation of the coronary arterioles.
Coronary flow reserve across a fixed mechanical stenosis is limited because most coronary arteriolar vasodilator reserve has already been used to maintain resting flow. With exercise, myocardium in the watershed of a coronary artery with a hemodynamically significant stenosis becomes ischemic. Reduced regional blood flow results in less deliv-ery and localization of the perfusion radiopharmaceutical. This hypoperfusion is seen on scintigraphic images as a perfusion defect (i.e., “photopenic” or cold in the ischemic region) surrounded by normal blood flow in the adjacent nonischemic regions of the heart (Fig. 16-13).
Figure 16-11. Incidental CT finding on SPECT/CT. Low-resolution CT scan from hybrid SPECT/CT system shows nodule in the left poste-rior lung field.
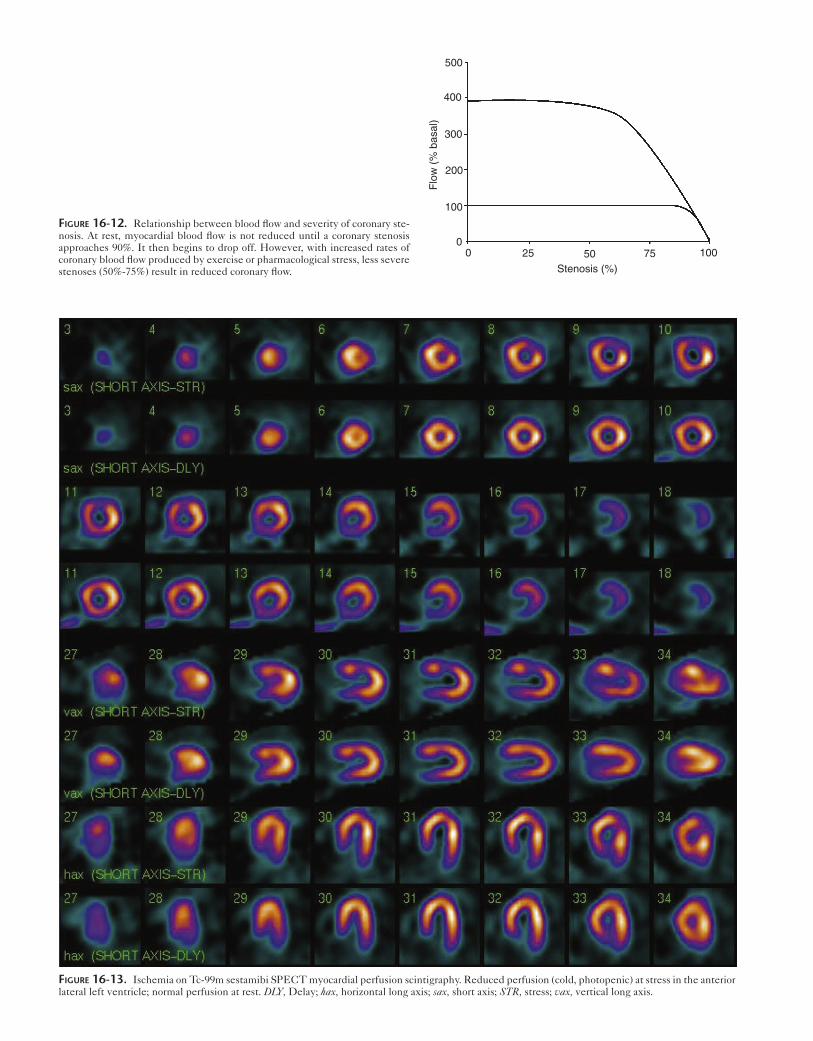
Figure 16-13. Ischemia on Tc-99m sestamibi SPECT myocardial perfusion scintigraphy. Reduced perfusion (cold, photopenic) at stress in the anterior lateral left ventricle; normal perfusion at rest. DLY, Delay; hax, horizontal long axis; sax, short axis; STR, stress; vax, vertical long axis.
Figure 16-12. Relationship between blood flow and severity of coronary ste-nosis. At rest, myocardial blood flow is not reduced until a coronary stenosis approaches 90%. It then begins to drop off. However, with increased rates of coronary blood flow produced by exercise or pharmacological stress, less severe stenoses (50%-75%) result in reduced coronary flow.
500
400
300
200
100
00 25 50 75 100
Stenosis (%)
Flo
w (
% b
asal
)
Coronary artery stenoses of more than 70% are generally considered clinically significant based on the rapid fall-off in flow reserve augmentation above this level (Fig. 16-12). However, the anatomical degree of stenosis has a poor cor-relation with flow reserve and the degree of ischemia. Fac-tors that may affect the functional significance of an anatomical circumferential narrowing include the length, shape, and location of a stenotic lesion. Functional imag-ing with myocardial perfusion scintigraphy is often needed to evaluate the clinical significance of a known stenosis, particularly in the range of 50% of 70%.
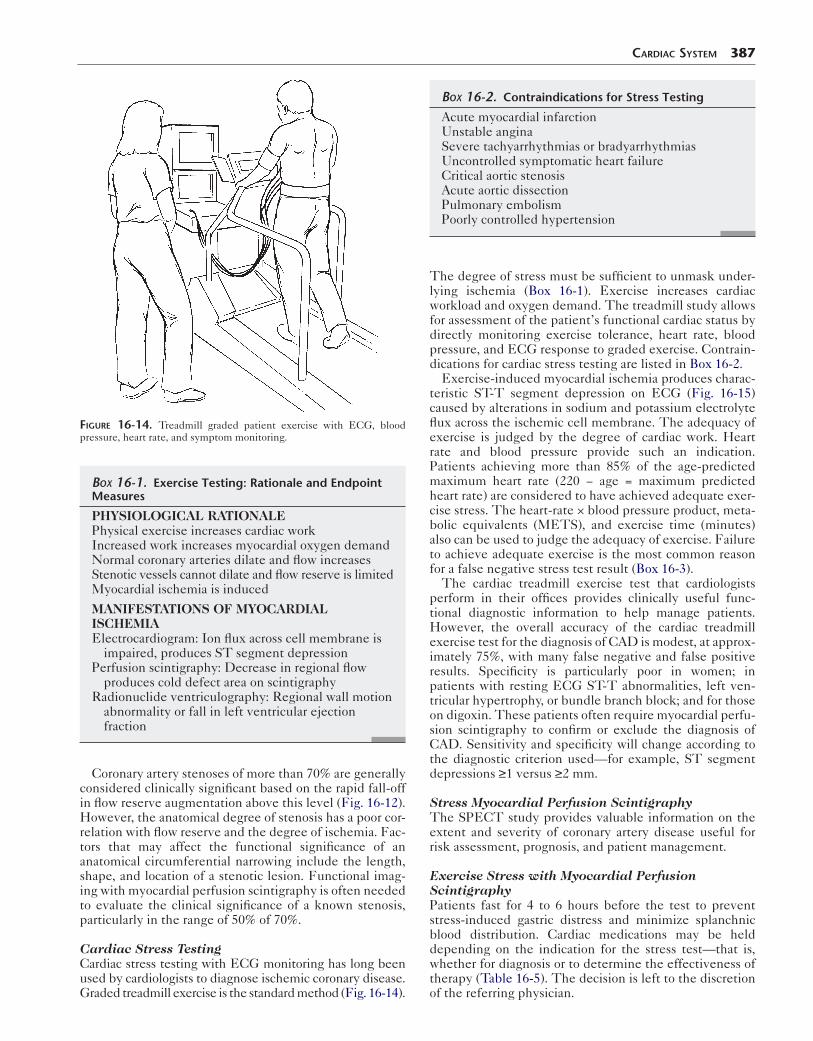
Cardiac Stress TestingCardiac stress testing with ECG monitoring has long been used by cardiologists to diagnose ischemic coronary disease. Graded treadmill exercise is the standard method (Fig. 16-14).
Figure 16-14. Treadmill graded patient exercise with ECG, blood pressure, heart rate, and symptom monitoring.
Box 16-1. Exercise Testing: Rationale and Endpoint Measures
PHYSIOLOGICAL RATIONALEPhysical exercise increases cardiac workIncreased work increases myocardial oxygen demandNormal coronary arteries dilate and flow increasesStenotic vessels cannot dilate and flow reserve is limitedMyocardial ischemia is induced
MANIFESTATIONS OF MYOCARDIAL ISCHEMIAElectrocardiogram: Ion flux across cell membrane is
impaired, produces ST segment depressionPerfusion scintigraphy: Decrease in regional flow
produces cold defect area on scintigraphyRadionuclide ventriculography: Regional wall motion
abnormality or fall in left ventricular ejection fraction
CardiaC SyStem 387
The degree of stress must be sufficient to unmask under-lying ischemia (Box 16-1). Exercise increases cardiac workload and oxygen demand. The treadmill study allows for assessment of the patient’s functional cardiac status by directly monitoring exercise tolerance, heart rate, blood pressure, and ECG response to graded exercise. Contrain-dications for cardiac stress testing are listed in Box 16-2.
Exercise-induced myocardial ischemia produces charac-teristic ST-T segment depression on ECG (Fig. 16-15) caused by alterations in sodium and potassium electrolyte flux across the ischemic cell membrane. The adequacy of exercise is judged by the degree of cardiac work. Heart rate and blood pressure provide such an indication. Patients achieving more than 85% of the age-predicted maximum heart rate (220 − age = maximum predicted heart rate) are considered to have achieved adequate exer-cise stress. The heart-rate × blood pressure product, meta-bolic equivalents (METS), and exercise time (minutes) also can be used to judge the adequacy of exercise. Failure to achieve adequate exercise is the most common reason for a false negative stress test result (Box 16-3).
The cardiac treadmill exercise test that cardiologists perform in their offices provides clinically useful func-tional diagnostic information to help manage patients. However, the overall accuracy of the cardiac treadmill exercise test for the diagnosis of CAD is modest, at approx-imately 75%, with many false negative and false positive results. Specificity is particularly poor in women; in patients with resting ECG ST-T abnormalities, left ven-tricular hypertrophy, or bundle branch block; and for those on digoxin. These patients often require myocardial perfu-sion scintigraphy to confirm or exclude the diagnosis of CAD. Sensitivity and specificity will change according to the diagnostic criterion used—for example, ST segment depressions ≥1 versus ≥2 mm.
Stress Myocardial Perfusion ScintigraphyThe SPECT study provides valuable information on the extent and severity of coronary artery disease useful for risk assessment, prognosis, and patient management.
Exercise Stress with Myocardial Perfusion ScintigraphyPatients fast for 4 to 6 hours before the test to prevent stress-induced gastric distress and minimize splanchnic blood distribution. Cardiac medications may be held depending on the indication for the stress test—that is, whether for diagnosis or to determine the effectiveness of therapy (Table 16-5). The decision is left to the discretion of the referring physician.
Box 16-2. Contraindications for Stress Testing
Acute myocardial infarctionUnstable anginaSevere tachyarrhythmias or bradyarrhythmiasUncontrolled symptomatic heart failureCritical aortic stenosisAcute aortic dissectionPulmonary embolismPoorly controlled hypertension

388 Nuclear Medicine: The Requisites
Figure 16-15. Treadmill ECG ischemia. Baseline (left) and maximal stress (right) 12-lead ECG demonstrates ST-T wave depression in II, III, aVF, and V6, consistent with stress induced ischemia.
Beta blockers may prevent achievement of maximum heart rate and nitrates, and calcium channel blockers may mask or prevent cardiac ischemia, limiting the test’s diag-nostic value. Assessment of drug therapy effectiveness requires the patient to remain on medication.
In addition to a standard 12-lead baseline ECG, an intra-venous line is kept open. The patient is continuously moni-tored during the study. Graded treadmill exercise is performed according to a standardized protocol (e.g., the Bruce protocol) (Table 16-6). When the patient has achieved maximal exercise or peak patient tolerance, the radiophar-maceutical is injected. Exercise is continued for another minute to ensure adequate uptake. Early discontinuation of exercise may result in tracer distribution reflecting perfu-sion at submaximal exercise levels. Indications for termi-nating exercise are listed in Box 16-4. Many of these are
Box 16-3. Reasons for Failing to Achieve Adequate Exercise
Poor general conditioning, low exercise tolerancePoor motivationArthritis, other musculoskeletal problemsLung diseasePeripheral vascular diseaseMedications (beta blockers)AnginaArrhythmiaCardiac insufficiency
table 16-5 Drugs That Interfere with Stress Testing: Recommended Withdrawal Interval
Drugs Withdrawal Interval
EXERCISE
Beta blockers 48-96 hr
Calcium channel blockers 48-72 hr
Nitrates (long acting) 12 hr
PHARMACOLOGICAL
Theophylline derivatives 48 hr
Caffeine 24 hr
manifestations of ischemia; others are due to underlying medical, cardiac, or pulmonary conditions.Pharmacological Stress with Myocardial Perfusion ScintigraphyApproximately 50% of patients receive pharmacological stress because it is anticipated that they will not be able to achieve adequate exercise due to concurrent medical problems—for example, pulmonary disease or lower extremity musculoskeletal problems.Coronary Vasodilating DrugsDipyridamole, Adenosine, and Regadenoson. Dipyr-idamole (Persantine) and adenosine (Adenoscan) are coro-nary vasodilating drugs that have long been used for stress myocardial perfusion imaging. Regadenoson (Lexiscan) was approved by the FDA in 2009. The vasodilators increase coronary blood flow in normal vessels 3 to 5 times. Because coronary arteries with significant stenoses cannot
table 16-6 Treadmill Graded Exercise Stress Test
Stage (min) Total time (min) Speed (mile/h) Grade (%)
STANDARD BRUCE PROTOCOL
1 (3) 3 1.7 10
2 (3) 6 2.5 12
3 (3) 9 3.4 14
4 (3) 12 4.2 16
5 (3) 15 5.0 18
6 (3) 18 6.0 20
MODIFIED BRUCE PROTOCOL
1 (3) 3 1.7 0
2 (3) 6 1.7 5
3 (3) 9 1.7 10
4 (3) 12 2.5 12
5 (3) 15 3.4 14
6 (3) 18 4.2 16
7 (3) 21 5.0 18
The modified Bruce starts with the same speed as the standard Bruce, but with no slope, followed by slight increase in slope, and then in speed. This protocol is suited for elderly patients or when one anticipates difficulties with physical performance.

increase blood flow to the same degree as normal vessels, vasodilator stress results in vascular regions of relative hypoperfusion on myocardial perfusion scintigraphy simi-lar to that seen with exercise-induced ischemia.
This is not a test of ischemia, because cardiac work is not involved, but rather a test of coronary flow reserve (maxi-mum increase in blood flow through the coronary arteries above normal resting flow). Comparative studies have shown similar scintigraphic patterns and overall diagnostic accuracy for exercise and pharmacological stress.Mechanism of Pharmacological Effect. When endoge-nously released by the coronary endothelial cells, adenosine activates four coronary receptor subtypes, A1, A2A, A2B, and A3. Only A2A activation produces coronary vasodilation. Activation of the other receptors is responsible for the drug’s side effects. The adenosine analog used for stress testing has similar effect. Dipyridamole exerts its pharmacological
Box 16-4. Indications for Terminating a Stress Test
Patient requestInability to continue because of fatigue, dyspnea, or
faintnessModerate to severe chest painDizziness, near syncopePallor, diaphoresisAtaxiaClaudicationVentricular tachycardiaAtrial tachycardia or fibrillationOnset of second- or third-degree heart blockST-segment depression greater than 3 mmDecrease in systolic blood pressure from baselineIncrease in systolic blood pressure above 240 mm Hg
or diastolic above 120 mm Hg
CardiaC SyStem 389
effect by blocking the reuptake mechanism of adenosine and raising endogenous adenosine blood levels. Regadeno-son is a selective A2A receptor agonist.Patient Preparation. Because vasodilators are antagonized by drugs and food containing chemically related methylxan-thines (e.g., theophylline, caffeine) (Fig. 16-16), the drugs must be discontinued before the study because they will counteract vasodilator effectiveness (Table 16-5). Adenos-ine and dipyridamole may cause bronchospasm in patients with asthma and chronic obstructive pulmonary disease. This is less of a problem with regadenoson, which is now widely used in these patients.Methodology. The technical details for dipyridamole, ade-nosine, and regadenoson infusion protocols differ (Fig. 16-17)
Adenosine Dipyridamole
Theophylline Caffeine
Figure 16-16. Close chemical relationship between adenosine and dipyridamole to theophylline and caffeine.
Legend
Protocol
Minutes
Dipyridamole0.56 mg/kg
Adenosine0.14 mg/kg/min
Regadenoson400 µg 20 sec bolus
Vasodilator infusion length
Radiopharmaceutical injection
ECG and blood pressure at baseline and at 1-minute intervals
1 2 3 4 5 6 7 8 9 10 11 12 13 14 15 16 17 18 19 20
Gamma camera imaging
TcOptional
Tc
Tc
Tc
Figure 16-17. Coronary vasodilation stress protocol.
390 Nuclear Medicine: The Requisites
because of their different pharmacokinetics (Table 16-7). Unlike adenosine and dipyridamole, which are given as constant infusions, regadenoson is given as an intravenous bolus in a fixed dose. A mild to moderate increase in heart rate and reduction in blood pressure confirm the drug’s pharmacological effect.Side Effects. Nausea, dizziness, headache, and flush-ing are not uncommon. Approximately 20% to 30% of patients experience chest pain; however, it is not usu-ally caused by ischemia. Rarely, a coronary steal syn-drome may produce true ischemia. If ECG ST-T depression occurs during infusion, it is highly sugges-tive of significant coronary disease. Dyspnea and atrio-ventricular conduction blocks occur predominantly with adenosine.
Regadenoson is relatively safer to use in patients with mild to moderate reactive airway disease and may have fewer other side effects. Because of adenosine’s short half-life (<10 seconds), side effects resolve promptly when the infusion is stopped. Because the effect of dipyridamole and regadenoson is prolonged after stopping the infusion (long serum half-lives), aminophylline may be required to reverse the side effects.Accuracy. Comparative studies have reported similar accuracy for detection of significant coronary disease for adenosine, dipyridamole, and regadenoson compared to exercise-stress SPECT myocardial perfusion scintigraphy. The disadvantage of vasodilator stress is the lack of func-tional cardiac information provided by exercise.Dobutamine. For patients unable to exercise but with contraindications for vasodilator therapy (e.g., active symp-tomatic asthma), dobutamine can be used as an alternative.Mechanism of Action. Dobutamine is a synthetic cate-cholamine that acts on alpha- and beta-adrenergic recep-tors producing inotropic and chronotropic effects that increase cardiac work. In normal coronary arteries, increased blood flow results. In the face of significant ste-nosis, regional flow does not increase, producing scinti-graphic patterns similar to that seen with exercise and pharmacological stress.Methodology. Initial infusion rate is 5 μg/kg/min over 3 minutes, then increased to 10 μg/kg/min for another 3 minutes and further increased by that amount every 10 minutes until a maximum of 40 μg/kg/min is achieved. The radiopharmaceutical is injected 1 minute after the maximal tolerable dose and the dobutamine infusion is continued for 1 minute.Accuracy. Dobutamine perfusion imaging has accu-racy similar to that of exercise or pharmacological stress. The major limitation is the frequent occurrence of side effects, including chest pain and arrhythmias and inability of many patients to tolerate the maximum required dose.
Imaging ProtocolsVarious stress and rest perfusion imaging protocols are used, depending on the logistics of the clinic, radiophar-maceutical, patient size, and individual physician prefer-ence (Table 16-8). Tc-99m radiopharmaceuticals are usually preferred for myocardial perfusion scintigraphy. Advantages and disadvantages of Tc-99m sestamibi or tet-rofosmin over Tl-201 are listed in Box 16-5.
Technetium-99m Sestamibi and Technetium-99m TetrofosminSeparate injections are required for the rest and stress studies. It is usually performed as a 1-day protocol, but 2-day protocols are sometimes used (Table 16-8 and Box 16-6).Single-Day Protocol. The patient receives a lower administered dose of the Tc-99m radiopharmaceutical for the initial study (8-10 mCi [266-370 MBq]) and a several-fold higher dose (25-30 mCi [925-1110 MBq]) for the second study. The second study commences approxi-mately 1.5 hours later to allow time for background
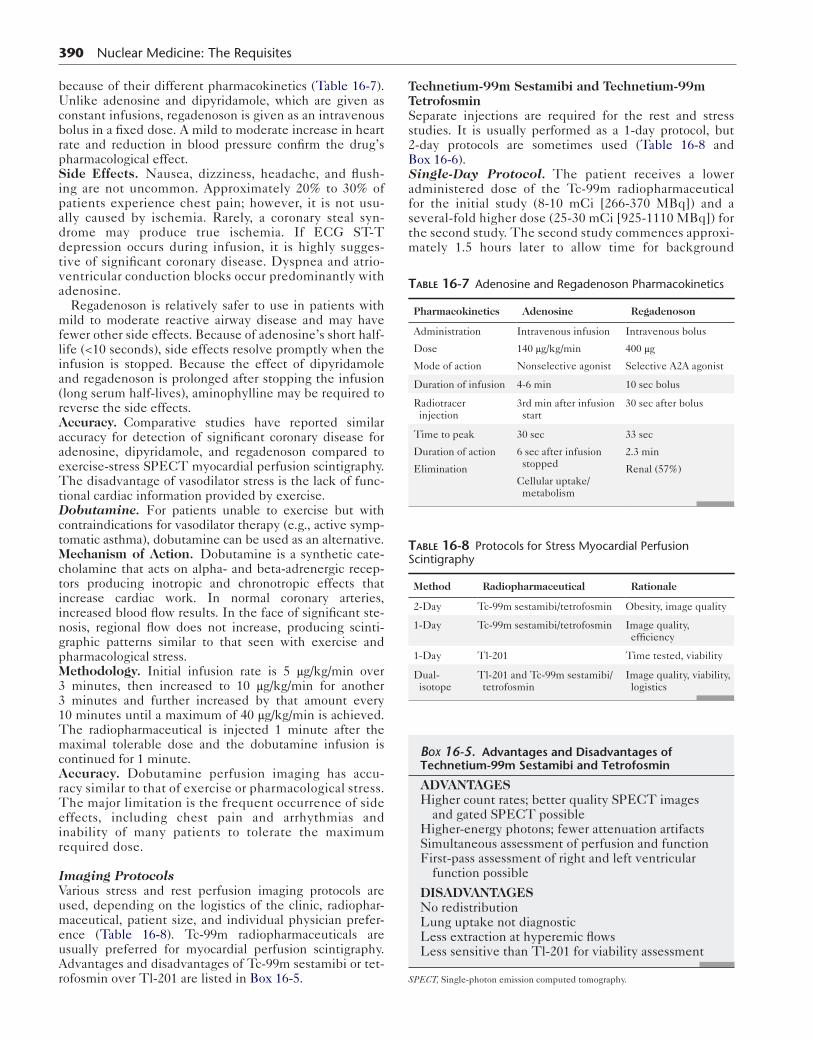
table 16-7 Adenosine and Regadenoson Pharmacokinetics
Pharmacokinetics Adenosine Regadenoson
Administration
Dose
Mode of action
Intravenous infusion
140 μg/kg/min
Nonselective agonist
Intravenous bolus
400 μg
Selective A2A agonist
Duration of infusion 4-6 min 10 sec bolus
Radiotracer injection
3rd min after infusion start
30 sec after bolus
Time to peak
Duration of action
Elimination
30 sec
6 sec after infusion stopped
Cellular uptake/metabolism
33 sec
2.3 min
Renal (57%)
Box 16-5. Advantages and Disadvantages of Technetium-99m Sestamibi and Tetrofosmin
ADVANTAGESHigher count rates; better quality SPECT images
and gated SPECT possibleHigher-energy photons; fewer attenuation artifactsSimultaneous assessment of perfusion and functionFirst-pass assessment of right and left ventricular
function possible
DISADVANTAGESNo redistributionLung uptake not diagnosticLess extraction at hyperemic flowsLess sensitive than Tl-201 for viability assessment
SPECT, Single-photon emission computed tomography.
table 16-8 Protocols for Stress Myocardial Perfusion Scintigraphy
Method Radiopharmaceutical Rationale
2-Day Tc-99m sestamibi/tetrofosmin Obesity, image quality
1-Day Tc-99m sestamibi/tetrofosmin Image quality, efficiency
1-Day Tl-201 Time tested, viability
Dual-isotope
Tl-201 and Tc-99m sestamibi/tetrofosmin
Image quality, viability, logistics

activity biological clearance and decay. The usual approach is to do the rest study first, followed by the stress study.Two-Day Protocol. Tissue attenuation can be marked in large patients and result in poor image quality and inter-pretative difficulties, particularly with the lower dose rest study. A 2-day approach reduces this problem by allowing
Box 16-6. Technetium-99m Sestamibi and Tetrofosmin Myocardial Perfusion Imaging: Summary Protocol
PATIENT PREPARATIONPatient should fast for 4 hours
RADIOPHARMACEUTICAL10 to 30 mCi (370-1110 MBq) intravenously; see
individual protocols below
SPECT IMAGING PROTOCOL1-Day rest/stress imagingRest: 10 mCi (370 MBq); imaging at 30 to 90 minutesStress: 30 mCi (1110 MBq); imaging at 15 to 30
minutes2-Day rest/stress or stress/rest imaging: 30 mCi
(1110 MBq)
SPECT ACQUISITION PARAMETERSPatient position: supine, left arm raised
(180-degree arc)Rotation: counterclockwiseMatrix: 128 × 128 word modeImage/arc: 64 views (180-degree, 45-degree right
anterior oblique, 135-degree left posterior oblique)
SPECT RECONSTRUCTION PARAMETERS*Ramp filterConvolution filter: ButterworthAttenuation correction: Review images with and
without correctionOblique angle reformatting: Short-axis, vertical
long-axis, and horizontal long-axis gated SPECTElectrocardiogram synchronized data collection: R
wave trigger, 8 frames/cardiac cycle
PLANAR IMAGING PROTOCOLCollimator: High resolutionWindow: 20% centered at 140 keVFor 1-day rest and stress studies give 10 mCi (370
MBq) at rest and image at 30 to 60 minutesRest studies: Begin imaging at 60 to 90 minutes after
tracer injectionObtain anterior, 45-degree left anterior oblique, and
left lateral imagesObtain 750,000 to 1 million counts per viewWait 4 hours and give 30 mCi (1110 MBq) with
repeat imaging at 15 to 30 minutesStress studies: Begin imaging at 15 to 30 minutes
after tracer injectionObtain stress and rest images in identical projection
SPECT, Single-photon emission computed tomography.
*Choice of SPECT acquisition and reconstruction parameters is highly influenced by the equipment used. Protocols should be established in each nuclear medi-cine unit for available cameras and computers.
CardiaC SyStem 391
administration of the maximum dose (25-30 mCi) for both studies on separate days. This approach is most commonly used in obese patients.
Thallium-201Although a 2-day protocol with separate rest and stress injections has been used in the past, Tl-201 redistribution allows for assessment of both stress and rest perfusion after a single injection on the same day. After stress, initial images are obtained at 10 to 15 minutes and delayed images acquired at 3 hours (Box 16-7 and Fig. 16-18).Dual Isotope. This approach takes advantage of the different photopeaks of Tc-99m (140 keV) and Tl-201 (69-83 keV). Simultaneous acquisition (rest Tl-201 and stress Tc-99m sestamibi and tetrofosmin) is desirable for efficiency reasons; however, it is not practical because downscatter of Tc-99m into the Tl-201 window is signifi-cant. Thus the Tl-201 rest study is performed first with 3 to 3.5 mCi (110-130 MBq), followed by the stress study, using 20 to 30 mCi (740-1110 MBq) of the Tc-99m
Box 16-7. Thallium-201 Myocardial Perfusion Imaging Protocol
PATIENT PREPARATION AND FOLLOW-UPFasting for 4 hours
RADIOPHARMACEUTICALTl-201 chloride 3 to 3.5 mCi (111-120 MBq) intrave-
nously
TIME OF IMAGING10 minutes after radiopharmaceutical administration
and 3 hours later
INSTRUMENTATIONCollimator: Low energy, parallel holePhotopeak: 30% window centered at 80 keV and 20%
at 167 keV Arc and framing: 64 views, 180 degrees (45 degrees right anterior oblique, 135 degrees left posterior oblique), 20 seconds per view
PATIENT POSITIONPosition patient supine, with left arm raised.
SPECT RECONSTRUCTION PARAMETERS*Reconstruction technique: Filtered backprojection or
iterative reconstructionAttenuation correction: Rotating transmission source
or computed tomographyImage format: Transaxial short axis, horizontal, and
vertical long axis
Planar ImagingCollimator: Low-energy, general purpose, parallel
hole collimatorPhotopeak: 20% window centered at 80 and 167 keVImage acquisition: Anterior, 45 degrees, left anterior
oblique (LAO), and left lateral for 10 min each Acquire rest and stress images in identical projections
SPECT, Single-photon emission computed tomography.*Choice of SPECT acquisition and reconstruction parameters is influenced by the equipment used.
392 Nuclear Medicine: The Requisites
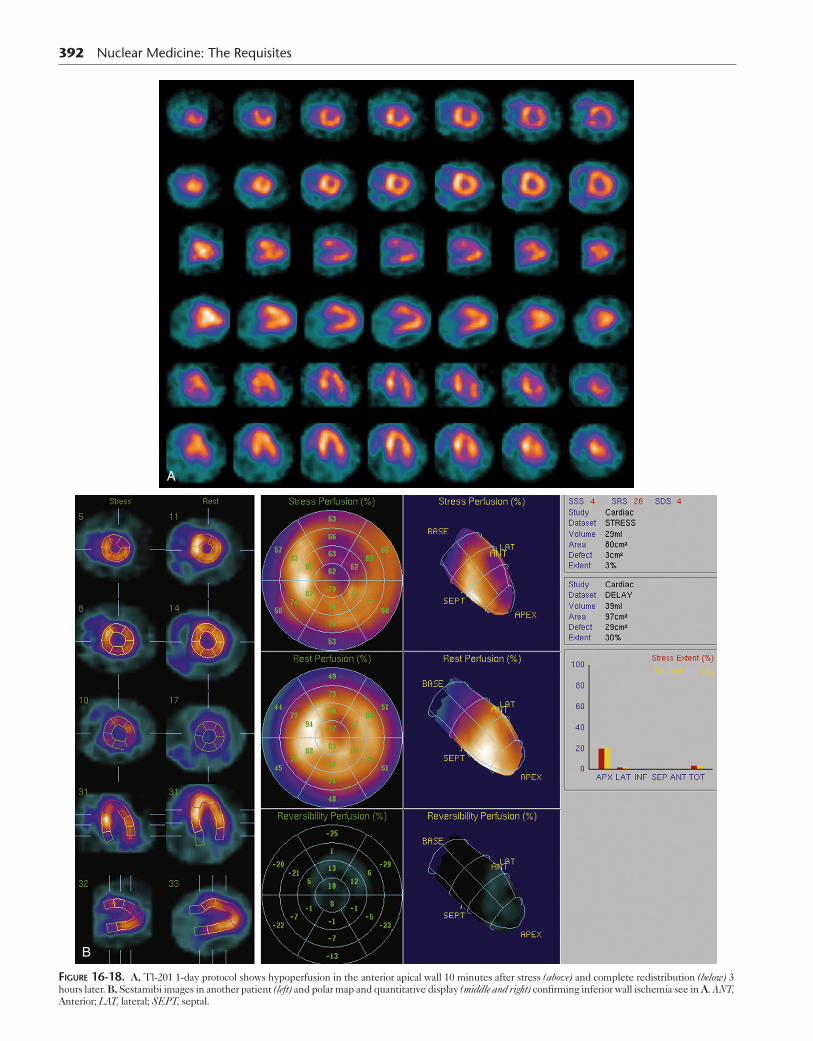
A
B
Figure 16-18. A, Tl-201 1-day protocol shows hypoperfusion in the anterior apical wall 10 minutes after stress (above) and complete redistribution (below) 3 hours later. B, Sestamibi images in another patient (left) and polar map and quantitative display (middle and right) confirming inferior wall ischemia see in A. ANT, Anterior; LAT, lateral; SEPT, septal.
radiopharmaceutical. Upscatter of the higher energy Tl-201 photons (167 keV) is minimal because of their low abundance (10%).
The dual-isotope protocol has advantages. It can be completed more rapidly than Tc-99m protocols because imaging begins earlier, 10 minutes after the stress study and immediately after the rest study. Also Tl-201 provides information on viability (hibernating myocardium). The downside is the poor image quality of Tl-201.
Quality ControlCamera quality control is mandatory for obtaining good-quality images and is discussed in detail in the instru-mentation chapters. Image quality may be poor because of insufficient counts in the myocardium, either caused by a low administered dose (e.g., inadvertent subcutane-ous injection) or the result of soft tissue attenuation. The latter will be discussed in detail later. Image quality also can be degraded by scatter from activity in the liver or bowel.Patient Motion. Patient motion during acquisition degrades image quality. Review of the acquisition data before processing should be routine. The projection 2-D planar images acquired every few degrees as the camera moves around the patient should be reviewed by display-ing in an endless loop rotating cine display.
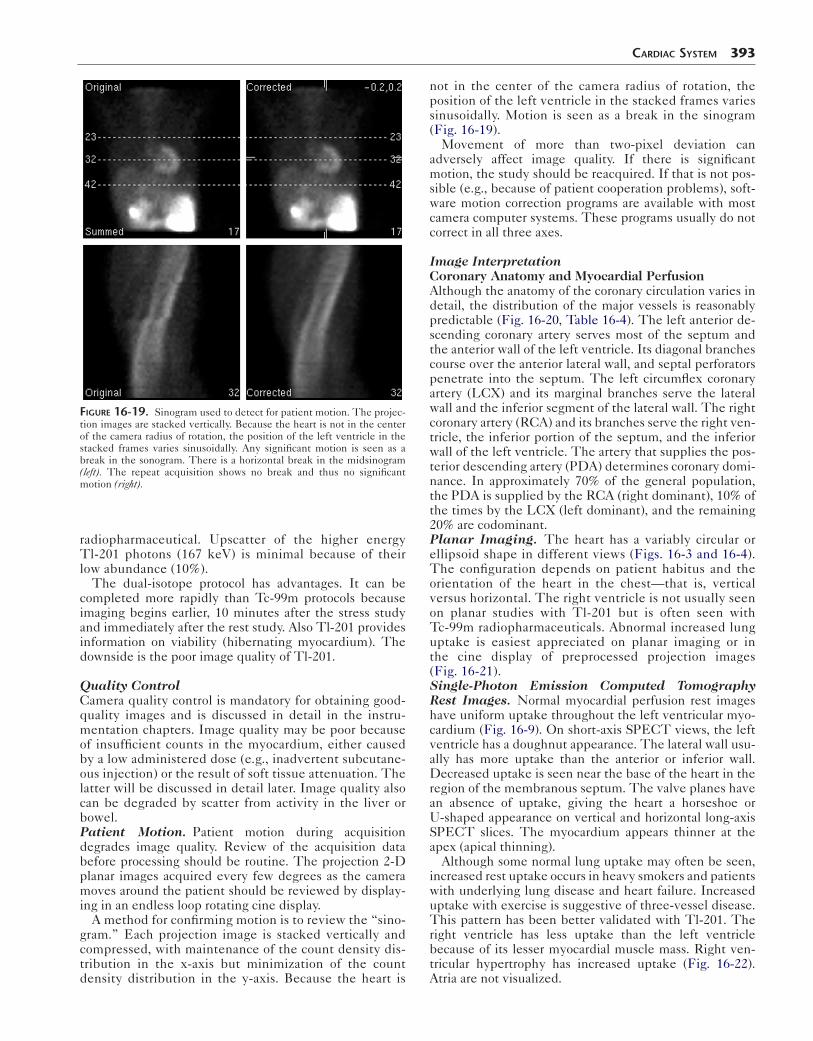
A method for confirming motion is to review the “sino-gram.” Each projection image is stacked vertically and compressed, with maintenance of the count density dis-tribution in the x-axis but minimization of the count density distribution in the y-axis. Because the heart is
Figure 16-19. Sinogram used to detect for patient motion. The projec-tion images are stacked vertically. Because the heart is not in the center of the camera radius of rotation, the position of the left ventricle in the stacked frames varies sinusoidally. Any significant motion is seen as a break in the sonogram. There is a horizontal break in the midsinogram (left). The repeat acquisition shows no break and thus no significant motion (right).
CardiaC SyStem 393
not in the center of the camera radius of rotation, the position of the left ventricle in the stacked frames varies sinusoidally. Motion is seen as a break in the sinogram (Fig. 16-19).
Movement of more than two-pixel deviation can adversely affect image quality. If there is significant motion, the study should be reacquired. If that is not pos-sible (e.g., because of patient cooperation problems), soft-ware motion correction programs are available with most camera computer systems. These programs usually do not correct in all three axes.
Image InterpretationCoronary Anatomy and Myocardial PerfusionAlthough the anatomy of the coronary circulation varies in detail, the distribution of the major vessels is reasonably predictable (Fig. 16-20, Table 16-4). The left anterior de -scending coronary artery serves most of the septum and the anterior wall of the left ventricle. Its diagonal branches course over the anterior lateral wall, and septal perforators penetrate into the septum. The left circumflex coronary artery (LCX) and its marginal branches serve the lateral wall and the inferior segment of the lateral wall. The right coronary artery (RCA) and its branches serve the right ven-tricle, the inferior portion of the septum, and the inferior wall of the left ventricle. The artery that supplies the pos-terior descending artery (PDA) determines coronary domi-nance. In approximately 70% of the general population, the PDA is supplied by the RCA (right dominant), 10% of the times by the LCX (left dominant), and the remaining 20% are codominant.Planar Imaging. The heart has a variably circular or ellipsoid shape in different views (Figs. 16-3 and 16-4). The configuration depends on patient habitus and the orientation of the heart in the chest—that is, vertical versus horizontal. The right ventricle is not usually seen on planar studies with Tl-201 but is often seen with Tc-99m radiopharmaceuticals. Abnormal increased lung uptake is easiest appreciated on planar imaging or in the cine display of preprocessed projection images (Fig. 16-21).Single-Photon Emission Computed Tomography Rest Images. Normal myocardial perfusion rest images have uniform uptake throughout the left ventricular myo-cardium (Fig. 16-9). On short-axis SPECT views, the left ventricle has a doughnut appearance. The lateral wall usu-ally has more uptake than the anterior or inferior wall. Decreased uptake is seen near the base of the heart in the region of the membranous septum. The valve planes have an absence of uptake, giving the heart a horseshoe or U-shaped appearance on vertical and horizontal long-axis SPECT slices. The myocardium appears thinner at the apex (apical thinning).
Although some normal lung uptake may often be seen, increased rest uptake occurs in heavy smokers and patients with underlying lung disease and heart failure. Increased uptake with exercise is suggestive of three-vessel disease. This pattern has been better validated with Tl-201. The right ventricle has less uptake than the left ventricle because of its lesser myocardial muscle mass. Right ven-tricular hypertrophy has increased uptake (Fig. 16-22). Atria are not visualized.

394 Nuclear Medicine: The Requisites
SVC
AO
RA
PA
LCA
LCX
L Desc
L Diag
LV
RV
RMA
IVC
AV
TV
RPD
PV
RCA MV
Figure 16-20. Normal coronary anatomy and cardiac perfusion beds. The left main coronary artery is only 0 to 15 mm in length before dividing into the left anterior descending and left circumflex arteries. Major branches of the left anterior descending artery are the diagonal and septal branches. The left circumflex artery (LCX) has obtuse marginal branches. The right coronary artery (RCA) originates separately and has important branches that include the posterior right ventricular branches, the poste-rior descending artery. “Dominance” refers to which coronary artery (RCA or LCFx) supplies the diaphragmatic surface of the left ventricle and posterior septum by giving rise to the posterior descending and pos-terior left ventricular branches. Right posterior descending (RPD), right marginal branch artery (RMA). The apex may be perfused by branches from any of the three main vessels. AO, Aorta; AV, aortic valve; IVC, infe-rior vena cava; LCA, left coronary artery; LCX, left circumflex; L Desc, left anterior descending; L Diag, left diagonal; LV, left ventricle; MV, mitral valve; PA, pulmonary artery; PV, pulmonary valve; RA, right atrium; RMA, right mesenteric artery; RV, right ventricle; SVC, superior vena cava; TV, tricuspid valve.
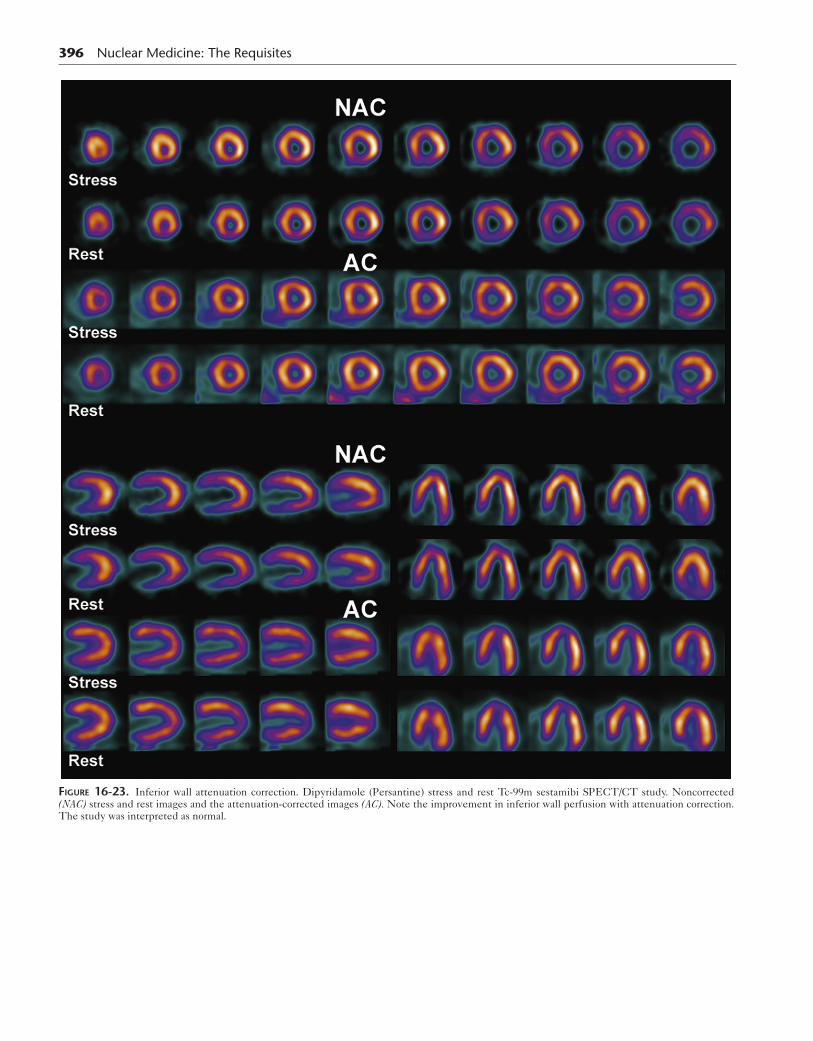
Single-Photon Emission Computed Tomography Stress Images. Normal myocardial perfusion images after exercise or pharmacological stress are not strikingly different in distribution from those at rest, although there are differences. The stress image cardiac-to-background ratio is higher because of the increased myocardial blood flow and thus radiotracer uptake. Right ventricular uptake is often increased, but still considerably less than the left ventricle. With good treadmill exercise, reduced activity is seen in the liver because of diversion of blood flow from the splanchnic bed to leg muscles. Pharmacological stress with any vasodilator results in considerable liver activity.Attenuation Artifacts. The effects of soft tissue attenu-ation can be seen on most cardiac images and are worse with large patients. Males typically have decreased activ-ity in the inferior wall (Fig. 16-23). This is called diaphrag-matic attenuation, meaning attenuation by subdiaphragmatic organs interpositioned between the heart and gamma camera. The amount of attenuation effect is dependent on patient size, shape, and internal anatomy.
Women often have relatively decreased activity in the anterior wall, apex, or anterior lateral portion of the heart, secondary to breast attenuation, depending on the size and position of the breasts (Fig. 16-24). Women also may have subdiaphragmatic attenuation, but breast attenuation is dominant and most commonly noted. Anterior and lateral wall attenuation can be seen occa-sionally in large males with excessive adipose tissue or muscle hypertrophy. Attenuation will also be seen in patients who are not able to elevate their arms during imaging
The cinematic rotating raw data should be reviewed for the presence of attenuation and motion. Regions of reduced myocardial activity from breast or subdiaphrag-matic attenuation at both stress and rest could potentially be misinterpreted as myocardial infarction. If attenuation is noted on the cine display, this might suggest an alterna-tive cause for the finding. If the breasts are in different positions for the two studies, this could be misinterpreted as ischemia (Fig. 16-24).Attenuation Correction. Many SPECT/computer sys-tems have attenuation correction capability. A transmission map is acquired by rotating a gadolinium-153 gamma source around the patient. Hybrid SPECT/CT systems use the CT data for this purpose (Figs. 16-23 and 16-25).
Figure 16-21. Stress-induced Tl-201 lung uptake. This is most commonly seen in patients with three-vessel coronary artery disease. Stress (left), rest (right).

CardiaC SyStem 395
Figure 16-22. Right ventricular hypertrophy. Patient has severe pulmonary hypertension secondary to interstitial pulmonary fibrosis. Stress and rest Tc-99 sestamibi show prominent uptake in the hypertrophied right ventricle.
Both non–attenuation-corrected and attenuation-corrected images should always be reviewed. Misregistration of the emission and transmission images can potentially result in artifacts. This is a particular problem for hybrid SPECT/CT systems. The SPECT images are acquired during tidal volume breathing, whereas a rapid CT acquisition is acquired during a very limited phase of respiration. Check-ing for image fusion should be part of image quality control.
Gated SPECT has become routine (Fig. 16-10) and is usually performed after the stress test. In addition to ana-lyzing global and regional myocardial wall motion, it can help differentiate the decreased fixed activity of an attenuation artifact from myocardial infarction. Good wall motion and myocardial thickening suggest that the decreased counts are due to attenuation and not infarction.
Extracardiac UptakeMyocardial perfusion radiopharmaceuticals are taken up in all metabolically active tissues in the body except for the brain. They do not cross the normal blood–brain bar-rier. Structures accumulating Tc-99m–labeled cardiac radiopharmaceuticals that are often in the field of view are
the thyroid, salivary glands, skeletal muscle, and kidneys. Prominent liver uptake is seen with rest and pharmaco-logical stress studies. Gallbladder and intestinal activity are routinely seen.
Activity from the liver and bowel adjacent to the heart may cause scatter of counts into the inferior wall and adja-cent walls of the heart, increasing apparent uptake, which can complicate interpretation. Focal intense subdiaphrag-matic radioactivity adjacent to the heart can sometimes produce cold defects caused by reconstruction artifacts. All cardiac radiopharmaceuticals are taken up by many benign and malignant tumors—for example, parathyroid adenoma and lung cancer. This incidental finding must not be missed (Fig. 16-26).Diagnostic Patterns in Coronary Artery DiseaseDiagnosis of Ischemia and Infarction. Terms used to characterize the status of myocardium (e.g., ischemia, infarction, hibernating, stunning) are defined in Table 16-9. A diagnostic schema (Table 16-10) uses the appear-ance of the scans on the stress and rest studies for scan interpretation. After initial assessment of the presence or absence of perfusion defects, a complete evaluation of the stress study includes assessment of the location, size, severity, and likely vascular distribution of the visualized
396 Nuclear Medicine: The Requisites
Figure 16-23. Inferior wall attenuation correction. Dipyridamole (Persantine) stress and rest Tc-99m sestamibi SPECT/CT study. Noncorrected (NAC) stress and rest images and the attenuation-corrected images (AC). Note the improvement in inferior wall perfusion with attenuation correction. The study was interpreted as normal.

CardiaC SyStem 397
A
B
Figure 16-24. Breast attenuation. A, Single projection image from a cinematic display at stress (left) and rest (right) illustrates breast attenuation artifacts. Note the decreased activity in the upper portion of the heart. B, The patient’s SPECT cross-sectional slices show moderately reduced activity in the anterior wall, best seen in the short axis and sagittal views and likely due to attenuation.

398 Nuclear Medicine: The Requisites
Figure 16-25. Attenuation correction for inferior wall defect in infarction. Uncorrected images shown reduced activity in the inferior wall. Corrected images continue to show reduced uptake. The patient had a history of inferior wall infarction. AC, Attenuation-corrected images; NAC, noncorrected images.

Figure 16-26. Incidental tumor diagnosed on myocardial perfusion scintigraphy. This midline mass was diagnosed as a thymoma.
table 16-9 Definitions Describing the Status of the Myocardium
Term Definition and scan appearance
Myocardial ischemia
Oxygen supply below metabolic requirements because of inadequate blood circulation caused by coronary stenosis
Hypoperfusion (cold defect) on stress perfusion scintigrams
Myocardial infarction
Necrosis of myocardial tissue, as a result of coronary occlusion
Hypoperfusion on rest–stress perfusion and decreased uptake with metabolic imaging
Transmural infarction
Necrosis involves all layers from endocardium to epicardium
High sensitivity for detection by perfusion imaging
Subendocardial infarction
Necrosis involves only muscle adjacent to endocardium
Lower sensitivity for detection on perfusion imaging
Myocardial scar Late result of infarction; hypoperfusion on scintigraphy
Hibernating myocardium
Chronic ischemia with decreased blood flow and down regulation of contractility; reversible with restoration of blood flow
No perfusion on rest imaging, poor ventricular contraction
Improved perfusion given a long recovery between rest–rest imaging or delayed reinjection Tl-201
Increased uptake by FDG metabolic imaging mismatched to reduced uptake on perfusion scan
Stunned myocardium
Myocardium with persistent contractile dysfunction despite restoration of perfusion after a period of ischemia; usually improves with time
Normal by perfusion imaging, poor ventricular contraction
Uptake by FDG metabolic imaging
FDG, Fluorodeoxyglucose.
CardiaC SyStem 399
abnormalities. Computer quantitative methods are rou-tinely used in conjunction with image analysis (Fig. 16-27). Perfusion defects caused by CAD are more commonly dis-tal, rather than at the base of the heart. A true perfusion defect should be seen on more than one cross-sectional slice and in other cross-section planes. Certainty increases with lesion size and the degree or severity of photon deficiency.Left Bundle Branch Block. Exercise-induced reversible hypoperfusion of the septum can be seen in patients with left bundle branch block (LBBB) in the absence of coro-nary disease. Typically, the apex and anterior wall are not involved, as would be expected with left anterior descend-ing (LAD) coronary artery disease. The stress-induced decreased septal blood flow is thought to be caused by asynchronous relaxation of the septum, which is out of phase with diastolic filling of the remainder of the ventri-cle when coronary perfusion is maximal. This scan abnor-mality is not seen with pharmacological stress, and thus the latter is indicated in patients with LBBB or ventricular pacemakers.Poor Prognostic Findings on Perfusion ScintigraphyMultiple Perfusion Defects. Perfusion defects in more than one coronary artery distribution area indicate multi-ple vessel disease. Prognosis worsens with increasing num-ber and size of perfusion defects (Fig. 16-28). Not all significant coronary artery stenoses are always seen on stress perfusion scans. Stress-induced ischemia of the most severe stenotic lesion limits further exercise, and thus other stenoses may not be seen and multiple vessel dis-ease may be underestimated. Three-vessel balanced dis-ease may not be seen at all.Transient Ischemic Dilation. The normal cardiac response is to dilate during stress and return to normal size promptly with cessation of exercise. Poststress ventricular dilation is abnormal and suggests multivessel disease. One explanation for this finding is myocardial stunning during stress (Fig. 16-29, Table 16-10). Another is widespread subendocardial ischemia.Thallium-201 Lung Uptake. Exercise-induced Tl-201 lung uptake is a poor prognostic sign caused by stress-induced ventricular dysfunction, elevated left ventricu-lar end-diastolic pressure, and pulmonary capillary wedge pressure (Fig. 16-21). Lung-to-myocardial activ-ity ratios greater than 0.5 are abnormal. Lung uptake
table 16-10 Diagnostic Patterns: Stress Myocardial Perfusion
Stress Rest Diagnosis
Normal Normal Normal
Defect Normal Ischemia
Defect Defect (unchanged) Infarction
Defect Some normalization with areasof persistent defect
Ischemia and scar
Normal Defect Reverse redistribution*
*The term reverse redistribution was first described with Tl-201 and thus the reason for the terminology. It signifies a larger defect at rest than stress.
400 Nuclear Medicine: The Requisites
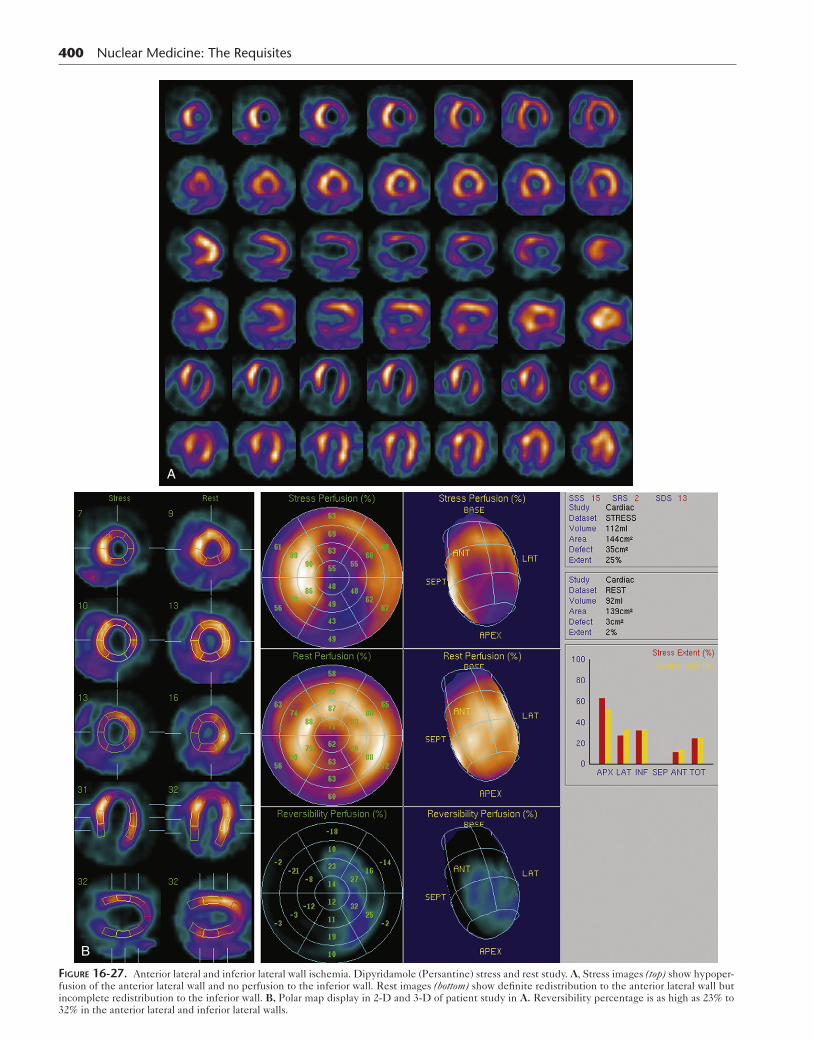
A
B
Figure 16-27. Anterior lateral and inferior lateral wall ischemia. Dipyridamole (Persantine) stress and rest study. A, Stress images (top) show hypoper-fusion of the anterior lateral wall and no perfusion to the inferior wall. Rest images (bottom) show definite redistribution to the anterior lateral wall but incomplete redistribution to the inferior wall. B, Polar map display in 2-D and 3-D of patient study in A. Reversibility percentage is as high as 23% to 32% in the anterior lateral and inferior lateral walls.
CardiaC SyStem 401
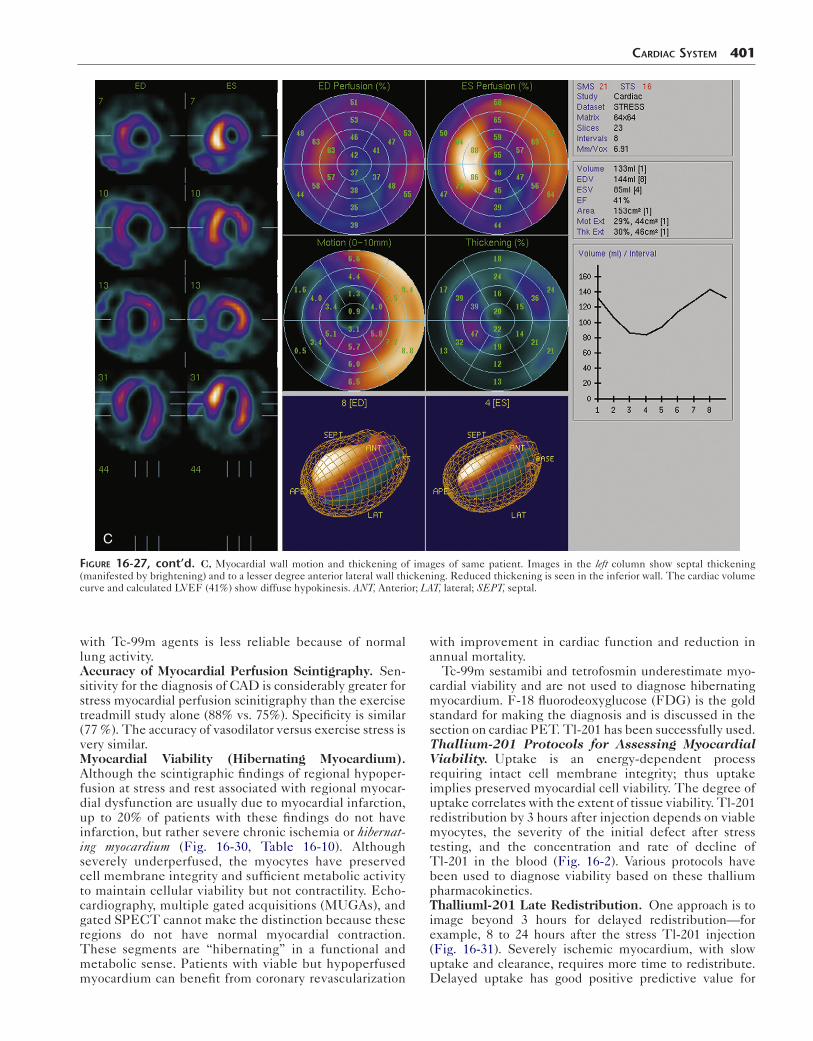
C
Figure 16-27, cont’d. C, Myocardial wall motion and thickening of images of same patient. Images in the left column show septal thickening (manifested by brightening) and to a lesser degree anterior lateral wall thickening. Reduced thickening is seen in the inferior wall. The cardiac volume curve and calculated LVEF (41%) show diffuse hypokinesis. ANT, Anterior; LAT, lateral; SEPT, septal.
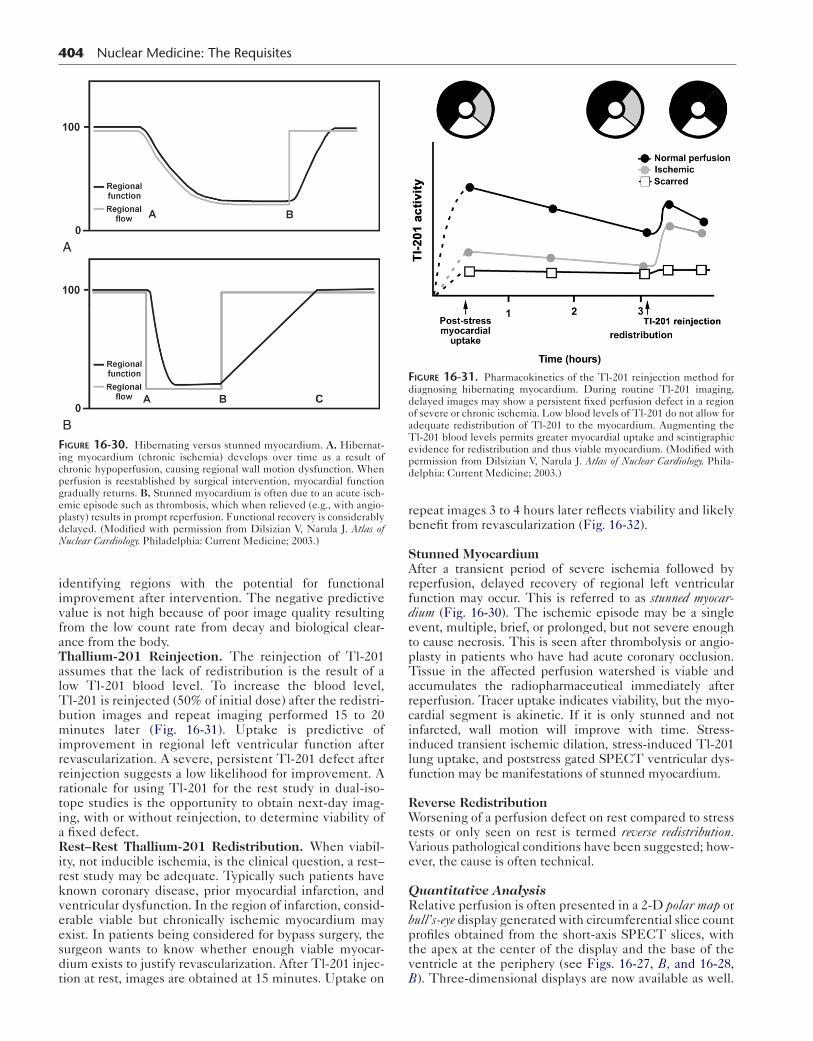
with Tc-99m agents is less reliable because of normal lung activity.Accuracy of Myocardial Perfusion Scintigraphy. Sen-sitivity for the diagnosis of CAD is considerably greater for stress myocardial perfusion scinitigraphy than the exercise treadmill study alone (88% vs. 75%). Specificity is similar (77 %). The accuracy of vasodilator versus exercise stress is very similar.Myocardial Viability (Hibernating Myocardium). Although the scintigraphic findings of regional hypoper-fusion at stress and rest associated with regional myocar-dial dysfunction are usually due to myocardial infarction, up to 20% of patients with these findings do not have infarction, but rather severe chronic ischemia or hibernat-ing myocardium (Fig. 16-30, Table 16-10). Although severely underperfused, the myocytes have preserved cell membrane integrity and sufficient metabolic activity to maintain cellular viability but not contractility. Echo-cardiography, multiple gated acquisitions (MUGAs), and gated SPECT cannot make the distinction because these regions do not have normal myocardial contraction. These segments are “hibernating” in a functional and metabolic sense. Patients with viable but hypoperfused myocardium can benefit from coronary revascularization
with improvement in cardiac function and reduction in annual mortality.
Tc-99m sestamibi and tetrofosmin underestimate myo-cardial viability and are not used to diagnose hibernating myocardium. F-18 fluorodeoxyglucose (FDG) is the gold standard for making the diagnosis and is discussed in the section on cardiac PET. Tl-201 has been successfully used.Thallium-201 Protocols for Assessing Myocardial Viability. Uptake is an energy-dependent process requiring intact cell membrane integrity; thus uptake implies preserved myocardial cell viability. The degree of uptake correlates with the extent of tissue viability. Tl-201 redistribution by 3 hours after injection depends on viable myocytes, the severity of the initial defect after stress testing, and the concentration and rate of decline of Tl-201 in the blood (Fig. 16-2). Various protocols have been used to diagnose viability based on these thallium pharmacokinetics.Thalliuml-201 Late Redistribution. One approach is to image beyond 3 hours for delayed redistribution—for example, 8 to 24 hours after the stress Tl-201 injection (Fig. 16-31). Severely ischemic myocardium, with slow uptake and clearance, requires more time to redistribute. Delayed uptake has good positive predictive value for
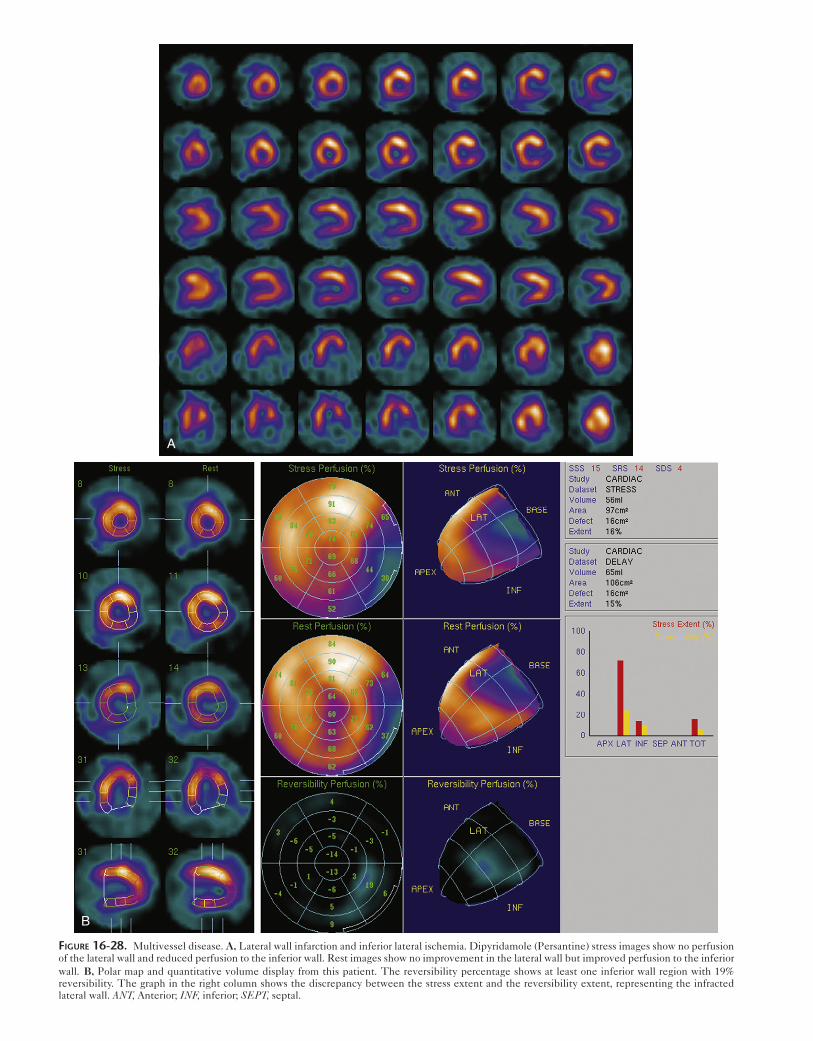
A
B
Figure 16-28. Multivessel disease. A, Lateral wall infarction and inferior lateral ischemia. Dipyridamole (Persantine) stress images show no perfusion of the lateral wall and reduced perfusion to the inferior wall. Rest images show no improvement in the lateral wall but improved perfusion to the inferior wall. B, Polar map and quantitative volume display from this patient. The reversibility percentage shows at least one inferior wall region with 19% reversibility. The graph in the right column shows the discrepancy between the stress extent and the reversibility extent, representing the infracted lateral wall. ANT, Anterior; INF, inferior; SEPT, septal.

CardiaC SyStem 403
A
B
Figure 16-29. Multivessel ischemia. A, Exercise stress Tl-201 (top) and reinjection rest Tl-201 (bottom) studies. With stress, there is reduced perfusion to the anterior, septal, and inferior walls. On delayed imaging, there is redistribution to these regions. There is stress induced dilation (TID). B, Quantita-tive polar 2-D and 3-D displays of the patient study in A show reperfusion primarily to the apex, inferior-septal and septal regions of 11% to 17%. This likely underestimates the degree of ischemia, when interpreted in light of submaximal exercise and post-stress dilatation.
404 Nuclear Medicine: The Requisites
identifying regions with the potential for functional improvement after intervention. The negative predictive value is not high because of poor image quality resulting from the low count rate from decay and biological clear-ance from the body.Thallium-201 Reinjection. The reinjection of Tl-201 assumes that the lack of redistribution is the result of a low Tl-201 blood level. To increase the blood level, Tl-201 is reinjected (50% of initial dose) after the redistri-bution images and repeat imaging performed 15 to 20 minutes later (Fig. 16-31). Uptake is predictive of improvement in regional left ventricular function after revascularization. A severe, persistent Tl-201 defect after reinjection suggests a low likelihood for improvement. A rationale for using Tl-201 for the rest study in dual-iso-tope studies is the opportunity to obtain next-day imag-ing, with or without reinjection, to determine viability of a fixed defect.Rest–Rest Thallium-201 Redistribution. When viabil-ity, not inducible ischemia, is the clinical question, a rest–rest study may be adequate. Typically such patients have known coronary disease, prior myocardial infarction, and ventricular dysfunction. In the region of infarction, consid-erable viable but chronically ischemic myocardium may exist. In patients being considered for bypass surgery, the surgeon wants to know whether enough viable myocar-dium exists to justify revascularization. After Tl-201 injec-tion at rest, images are obtained at 15 minutes. Uptake on
A
BFigure 16-30. Hibernating versus stunned myocardium. A, Hibernat-ing myocardium (chronic ischemia) develops over time as a result of chronic hypoperfusion, causing regional wall motion dysfunction. When perfusion is reestablished by surgical intervention, myocardial function gradually returns. B, Stunned myocardium is often due to an acute isch-emic episode such as thrombosis, which when relieved (e.g., with angio-plasty) results in prompt reperfusion. Functional recovery is considerably delayed. (Modified with permission from Dilsizian V, Narula J. Atlas of Nuclear Cardiology. Philadelphia: Current Medicine; 2003.)
repeat images 3 to 4 hours later reflects viability and likely benefit from revascularization (Fig. 16-32).
Stunned MyocardiumAfter a transient period of severe ischemia followed by reperfusion, delayed recovery of regional left ventricular function may occur. This is referred to as stunned myocar-dium (Fig. 16-30). The ischemic episode may be a single event, multiple, brief, or prolonged, but not severe enough to cause necrosis. This is seen after thrombolysis or angio-plasty in patients who have had acute coronary occlusion. Tissue in the affected perfusion watershed is viable and accumulates the radiopharmaceutical immediately after reperfusion. Tracer uptake indicates viability, but the myo-cardial segment is akinetic. If it is only stunned and not infarcted, wall motion will improve with time. Stress-induced transient ischemic dilation, stress-induced Tl-201 lung uptake, and poststress gated SPECT ventricular dys-function may be manifestations of stunned myocardium.
Reverse RedistributionWorsening of a perfusion defect on rest compared to stress tests or only seen on rest is termed reverse redistribution. Various pathological conditions have been suggested; how-ever, the cause is often technical.
Quantitative AnalysisRelative perfusion is often presented in a 2-D polar map or bull’s-eye display generated with circumferential slice count profiles obtained from the short-axis SPECT slices, with the apex at the center of the display and the base of the ventricle at the periphery (see Figs. 16-27, B, and 16-28, B). Three-dimensional displays are now available as well.
Figure 16-31. Pharmacokinetics of the Tl-201 reinjection method for diagnosing hibernating myocardium. During routine Tl-201 imaging, delayed images may show a persistent fixed perfusion defect in a region of severe or chronic ischemia. Low blood levels of Tl-201 do not allow for adequate redistribution of Tl-201 to the myocardium. Augmenting the Tl-201 blood levels permits greater myocardial uptake and scintigraphic evidence for redistribution and thus viable myocardium. (Modified with permission from Dilsizian V, Narula J. Atlas of Nuclear Cardiology. Phila-delphia: Current Medicine; 2003.)

CardiaC SyStem 405
Figure 16-32. Rest–rest Tl-201 redistribution. The patient has a history of a previous myocardial infarction and a low LVEF and is being considered for revascularization. The initial rest study shows hypoperfusion of the inferior and anterior septal wall at rest; however, 5-hour delayed images show evidence of viability in the septum and adjacent anterior wall. POST, Posterior.
Stress–rest difference polar maps are commonly used to analyze for reversible ischemia.
Gated SPECT analysis of wall motion and thickening is standard (Fig. 16-27, C). Calculation of a LVEF is obtained by measuring the change in size of the ventricular cavity during the cardiac cycle using edge detection algorithms.
Sensitivity and Specificity of Myocardial Perfusion Single-Photon Emission Computed TomographyCoronary angiography has been used as the gold standard for establishing myocardial perfusion scintigraphy accuracy. The angiographic estimated percent coronary stenoses often do not correlate well with their functional severity deter-mined by coronary flow reserve. The amount and degree of coronary disease is often underestimated by angiography.
A true physiological decrease in blood flow may some-times be seen in the absence of a fixed coronary stenosis because of small vessel disease or metabolic abnormalities.
The reported sensitivity of stress myocardial perfusion imaging has ranged from 70% to 95% and the specificity from 50% to 90%. This wide range is due in part to differ-ences in study populations. Results of studies over the years suggest that myocardial perfusion scintigraphy has an approximate sensitivity of 87% and specificity of 80%.
Because true specificity often cannot be easily determined due to referral bias, the concept of “normalcy rate” has been
proposed. The normalcy rate is defined as the frequency of normal test results in patients with a low likelihood of CAD, based on Bayesian analysis using age, sex, symptom classifica-tion, cholesterol, and results of noninvasive stress testing. Normalcy rates of 90% or greater have been reported for SPECT myocardial perfusion scintigraphy.
An important observation is that persons with normal stress perfusion scans have a better prognosis than those with scintigraphic evidence of ischemia.
Prognosis and Risk StratificationDiagnosis is an important indication for SPECT myocar-dial perfusion imaging; however, risk stratification and prognosis have become its primary role (Box 16-8).
Box 16-8. Indicators of Adverse Outcome and Prognosis: Single-Photon Emission Computed Tomography Perfusion Imaging
Increased lung-to-heart ratio after stressTransient left ventricular cavity dilatation after
exerciseMultiple and large reversible defectsMultiple and large irreversible defectsReversible perfusion defects at low level exercise
406 Nuclear Medicine: The Requisites
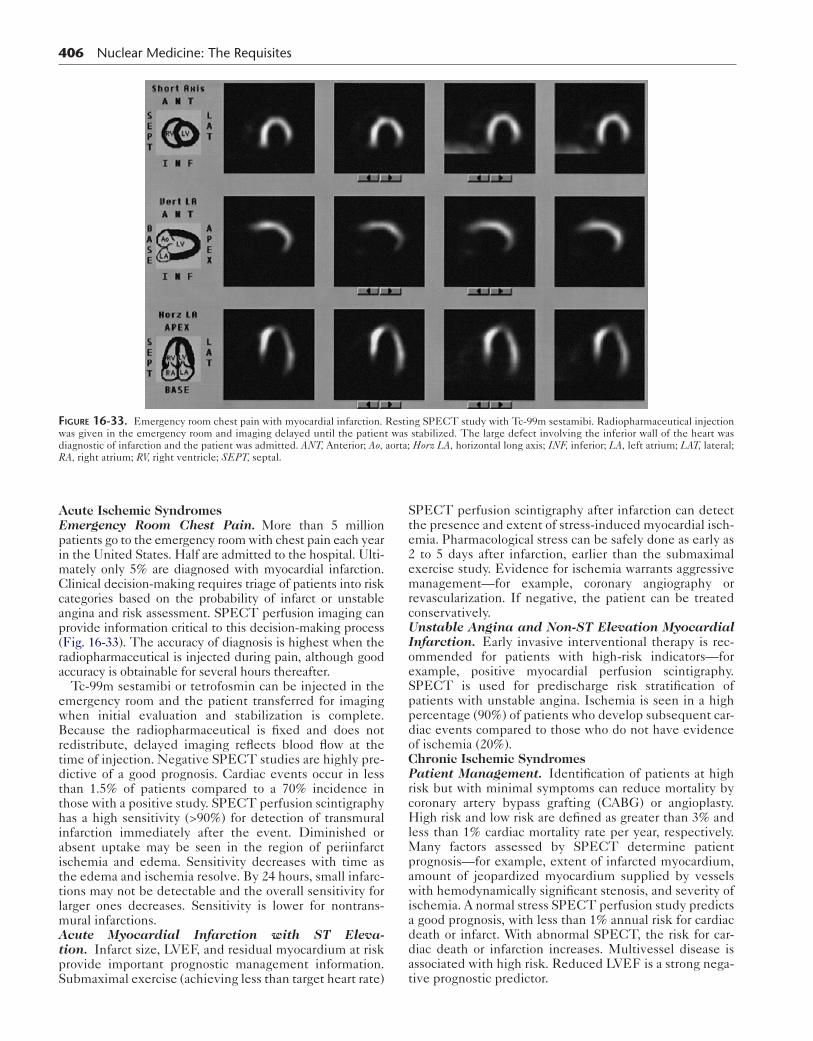
Figure 16-33. Emergency room chest pain with myocardial infarction. Resting SPECT study with Tc-99m sestamibi. Radiopharmaceutical injection was given in the emergency room and imaging delayed until the patient was stabilized. The large defect involving the inferior wall of the heart was diagnostic of infarction and the patient was admitted. ANT, Anterior; Ao, aorta; Horz LA, horizontal long axis; INF, inferior; LA, left atrium; LAT, lateral; RA, right atrium; RV, right ventricle; SEPT, septal.
Acute Ischemic SyndromesEmergency Room Chest Pain. More than 5 million patients go to the emergency room with chest pain each year in the United States. Half are admitted to the hospital. Ulti-mately only 5% are diagnosed with myocardial infarction. Clinical decision-making requires triage of patients into risk categories based on the probability of infarct or unstable angina and risk assessment. SPECT perfusion imaging can provide information critical to this decision-making process (Fig. 16-33). The accuracy of diagnosis is highest when the radiopharmaceutical is injected during pain, although good accuracy is obtainable for several hours thereafter.
Tc-99m sestamibi or tetrofosmin can be injected in the emergency room and the patient transferred for imaging when initial evaluation and stabilization is complete. Because the radiopharmaceutical is fixed and does not redistribute, delayed imaging reflects blood flow at the time of injection. Negative SPECT studies are highly pre-dictive of a good prognosis. Cardiac events occur in less than 1.5% of patients compared to a 70% incidence in those with a positive study. SPECT perfusion scintigraphy has a high sensitivity (>90%) for detection of transmural infarction immediately after the event. Diminished or absent uptake may be seen in the region of periinfarct ischemia and edema. Sensitivity decreases with time as the edema and ischemia resolve. By 24 hours, small infarc-tions may not be detectable and the overall sensitivity for larger ones decreases. Sensitivity is lower for nontrans-mural infarctions.Acute Myocardial Infarction with ST Eleva-tion. Infarct size, LVEF, and residual myocardium at risk provide important prognostic management information. Submaximal exercise (achieving less than target heart rate)
SPECT perfusion scintigraphy after infarction can detect the presence and extent of stress-induced myocardial isch-emia. Pharmacological stress can be safely done as early as 2 to 5 days after infarction, earlier than the submaximal exercise study. Evidence for ischemia warrants aggressive management—for example, coronary angiography or revascularization. If negative, the patient can be treated conservatively.Unstable Angina and Non-ST Elevation Myocardial Infarction. Early invasive interventional therapy is rec-ommended for patients with high-risk indicators—for example, positive myocardial perfusion scintigraphy. SPECT is used for predischarge risk stratification of patients with unstable angina. Ischemia is seen in a high percentage (90%) of patients who develop subsequent car-diac events compared to those who do not have evidence of ischemia (20%).Chronic Ischemic SyndromesPatient Management. Identification of patients at high risk but with minimal symptoms can reduce mortality by coronary artery bypass grafting (CABG) or angioplasty. High risk and low risk are defined as greater than 3% and less than 1% cardiac mortality rate per year, respectively. Many factors assessed by SPECT determine patient prognosis—for example, extent of infarcted myocardium, amount of jeopardized myocardium supplied by vessels with hemodynamically significant stenosis, and severity of ischemia. A normal stress SPECT perfusion study predicts a good prognosis, with less than 1% annual risk for cardiac death or infarct. With abnormal SPECT, the risk for car-diac death or infarction increases. Multivessel disease is associated with high risk. Reduced LVEF is a strong nega-tive prognostic predictor.
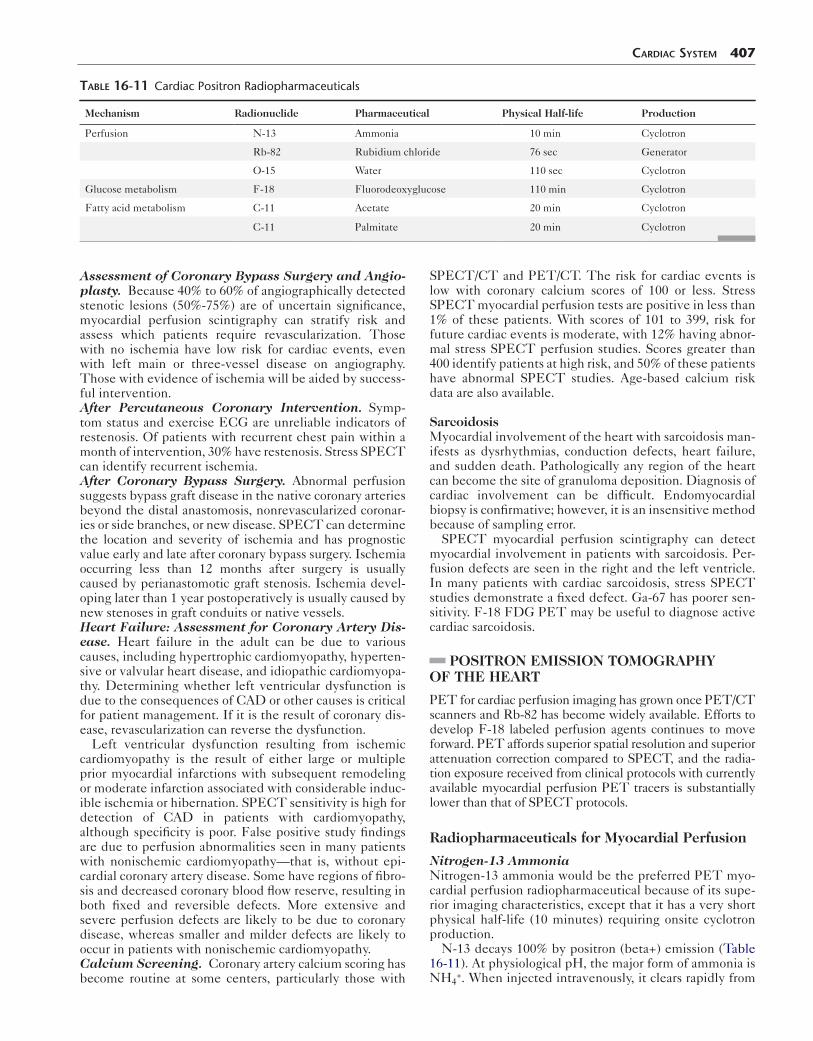
CardiaC SyStem 407
table 16-11 Cardiac Positron Radiopharmaceuticals
Mechanism Radionuclide Pharmaceutical Physical Half-life Production
Perfusion N-13 Ammonia 10 min Cyclotron
Rb-82 Rubidium chloride 76 sec Generator
O-15 Water 110 sec Cyclotron
Glucose metabolism F-18 Fluorodeoxyglucose 110 min Cyclotron
Fatty acid metabolism C-11 Acetate 20 min Cyclotron
C-11 Palmitate 20 min Cyclotron
Assessment of Coronary Bypass Surgery and Angio-plasty. Because 40% to 60% of angiographically detected stenotic lesions (50%-75%) are of uncertain significance, myocardial perfusion scintigraphy can stratify risk and assess which patients require revascularization. Those with no ischemia have low risk for cardiac events, even with left main or three-vessel disease on angiography. Those with evidence of ischemia will be aided by success-ful intervention.After Percutaneous Coronary Intervention. Symp-tom status and exercise ECG are unreliable indicators of restenosis. Of patients with recurrent chest pain within a month of intervention, 30% have restenosis. Stress SPECT can identify recurrent ischemia.After Coronary Bypass Surgery. Abnormal perfusion suggests bypass graft disease in the native coronary arteries beyond the distal anastomosis, nonrevascularized coronar-ies or side branches, or new disease. SPECT can determine the location and severity of ischemia and has prognostic value early and late after coronary bypass surgery. Ischemia occurring less than 12 months after surgery is usually caused by perianastomotic graft stenosis. Ischemia devel-oping later than 1 year postoperatively is usually caused by new stenoses in graft conduits or native vessels.Heart Failure: Assessment for Coronary Artery Dis-ease. Heart failure in the adult can be due to various causes, including hypertrophic cardiomyopathy, hyperten-sive or valvular heart disease, and idiopathic cardiomyopa-thy. Determining whether left ventricular dysfunction is due to the consequences of CAD or other causes is critical for patient management. If it is the result of coronary dis-ease, revascularization can reverse the dysfunction.
Left ventricular dysfunction resulting from ischemic cardiomyopathy is the result of either large or multiple prior myocardial infarctions with subsequent remodeling or moderate infarction associated with considerable induc-ible ischemia or hibernation. SPECT sensitivity is high for detection of CAD in patients with cardiomyopathy, although specificity is poor. False positive study findings are due to perfusion abnormalities seen in many patients with nonischemic cardiomyopathy—that is, without epi-cardial coronary artery disease. Some have regions of fibro-sis and decreased coronary blood flow reserve, resulting in both fixed and reversible defects. More extensive and severe perfusion defects are likely to be due to coronary disease, whereas smaller and milder defects are likely to occur in patients with nonischemic cardiomyopathy.Calcium Screening. Coronary artery calcium scoring has become routine at some centers, particularly those with
SPECT/CT and PET/CT. The risk for cardiac events is low with coronary calcium scores of 100 or less. Stress SPECT myocardial perfusion tests are positive in less than 1% of these patients. With scores of 101 to 399, risk for future cardiac events is moderate, with 12% having abnor-mal stress SPECT perfusion studies. Scores greater than 400 identify patients at high risk, and 50% of these patients have abnormal SPECT studies. Age-based calcium risk data are also available.
SarcoidosisMyocardial involvement of the heart with sarcoidosis man-ifests as dysrhythmias, conduction defects, heart failure, and sudden death. Pathologically any region of the heart can become the site of granuloma deposition. Diagnosis of cardiac involvement can be difficult. Endomyocardial biopsy is confirmative; however, it is an insensitive method because of sampling error.
SPECT myocardial perfusion scintigraphy can detect myocardial involvement in patients with sarcoidosis. Per-fusion defects are seen in the right and the left ventricle. In many patients with cardiac sarcoidosis, stress SPECT studies demonstrate a fixed defect. Ga-67 has poorer sen-sitivity. F-18 FDG PET may be useful to diagnose active cardiac sarcoidosis.
POSITRON EMISSION TOMOGRAPHY OF THE HEART
PET for cardiac perfusion imaging has grown once PET/CT scanners and Rb-82 has become widely available. Efforts to develop F-18 labeled perfusion agents continues to move forward. PET affords superior spatial resolution and superior attenuation correction compared to SPECT, and the radia-tion exposure received from clinical protocols with currently available myocardial perfusion PET tracers is substantially lower than that of SPECT protocols.
Radiopharmaceuticals for Myocardial Perfusion
Nitrogen-13 AmmoniaNitrogen-13 ammonia would be the preferred PET myo-cardial perfusion radiopharmaceutical because of its supe-rior imaging characteristics, except that it has a very short physical half-life (10 minutes) requiring onsite cyclotron production.
N-13 decays 100% by positron (beta+) emission (Table 16-11). At physiological pH, the major form of ammonia is NH4
+. When injected intravenously, it clears rapidly from
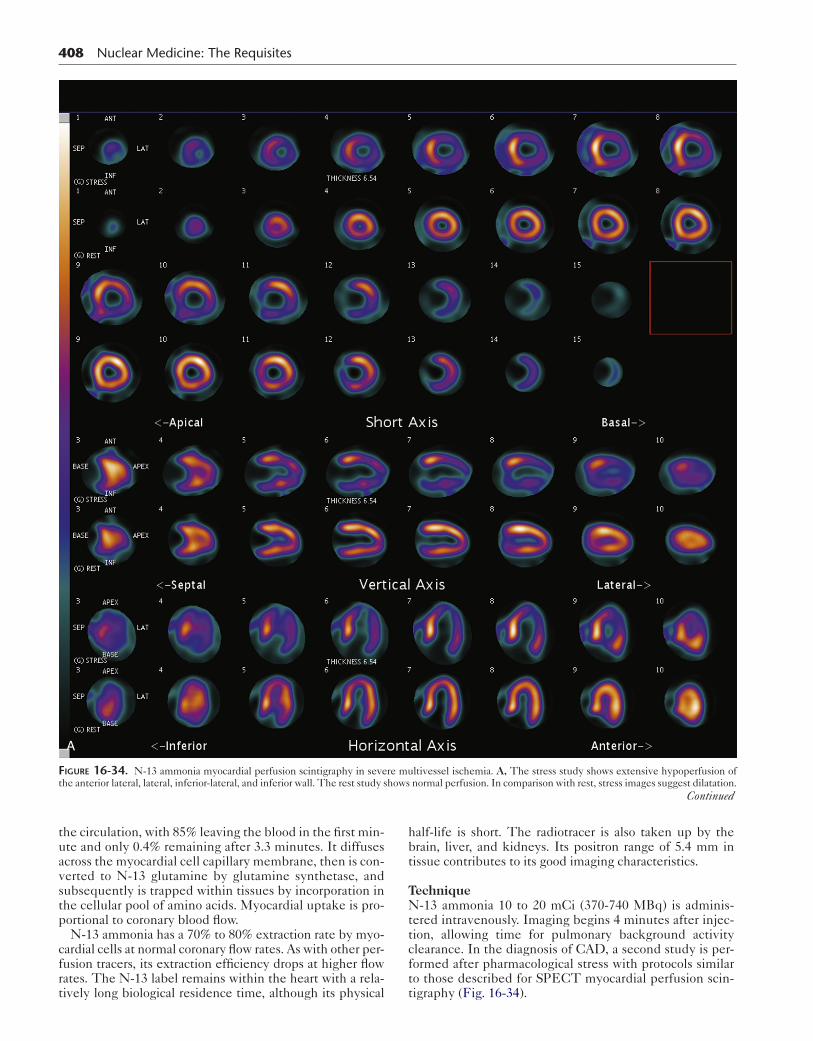
408 Nuclear Medicine: The Requisites
A
Figure 16-34. N-13 ammonia myocardial perfusion scintigraphy in severe multivessel ischemia. A, The stress study shows extensive hypoperfusion of the anterior lateral, lateral, inferior-lateral, and inferior wall. The rest study shows normal perfusion. In comparison with rest, stress images suggest dilatation.
Continued
the circulation, with 85% leaving the blood in the first min-ute and only 0.4% remaining after 3.3 minutes. It diffuses across the myocardial cell capillary membrane, then is con-verted to N-13 glutamine by glutamine synthetase, and subsequently is trapped within tissues by incorporation in the cellular pool of amino acids. Myocardial uptake is pro-portional to coronary blood flow.
N-13 ammonia has a 70% to 80% extraction rate by myo-cardial cells at normal coronary flow rates. As with other per-fusion tracers, its extraction efficiency drops at higher flow rates. The N-13 label remains within the heart with a rela-tively long biological residence time, although its physical
half-life is short. The radiotracer is also taken up by the brain, liver, and kidneys. Its positron range of 5.4 mm in tissue contributes to its good imaging characteristics.
TechniqueN-13 ammonia 10 to 20 mCi (370-740 MBq) is adminis-tered intravenously. Imaging begins 4 minutes after injec-tion, allowing time for pulmonary background activity clearance. In the diagnosis of CAD, a second study is per-formed after pharmacological stress with protocols similar to those described for SPECT myocardial perfusion scin-tigraphy (Fig. 16-34).
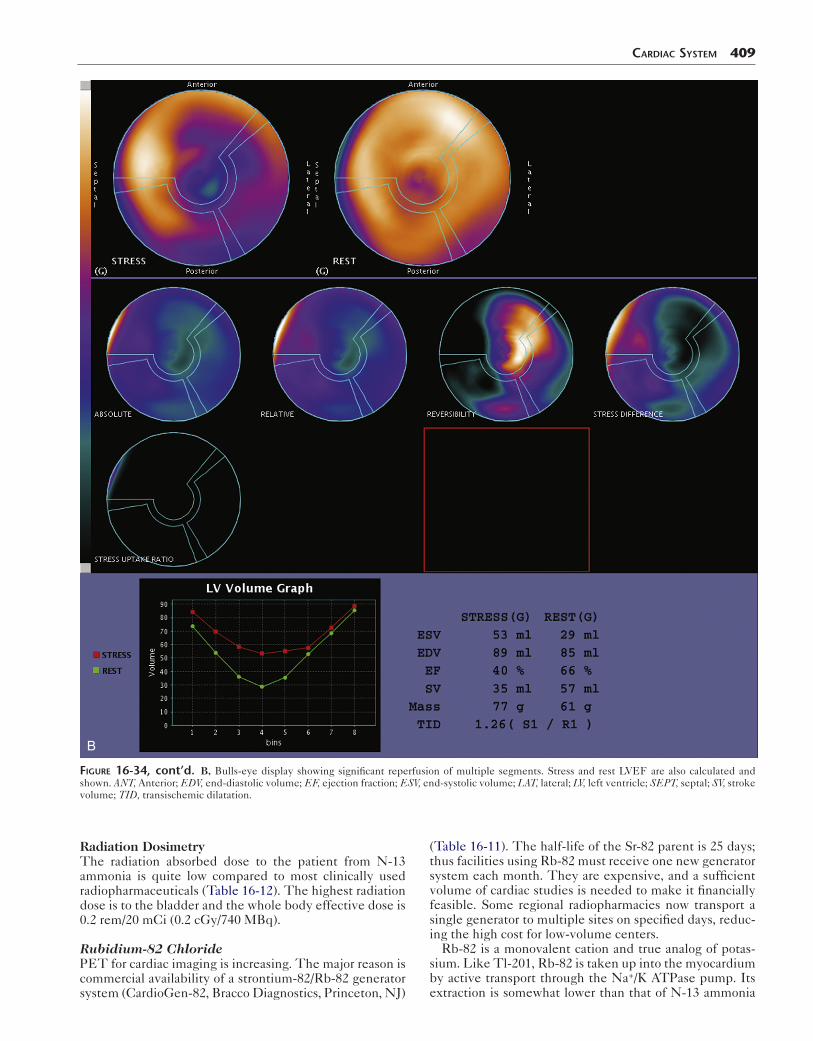
CardiaC SyStem 409
B
Figure 16-34, cont’d. B, Bulls-eye display showing significant reperfusion of multiple segments. Stress and rest LVEF are also calculated and shown. ANT, Anterior; EDV, end-diastolic volume; EF, ejection fraction; ESV, end-systolic volume; LAT, lateral; LV, left ventricle; SEPT, septal; SV, stroke volume; TID, transischemic dilatation.
Radiation DosimetryThe radiation absorbed dose to the patient from N-13 ammonia is quite low compared to most clinically used radiopharmaceuticals (Table 16-12). The highest radiation dose is to the bladder and the whole body effective dose is 0.2 rem/20 mCi (0.2 cGy/740 MBq).
Rubidium-82 ChloridePET for cardiac imaging is increasing. The major reason is commercial availability of a strontium-82/Rb-82 generator system (CardioGen-82, Bracco Diagnostics, Princeton, NJ)
(Table 16-11). The half-life of the Sr-82 parent is 25 days; thus facilities using Rb-82 must receive one new generator system each month. They are expensive, and a sufficient volume of cardiac studies is needed to make it financially feasible. Some regional radiopharmacies now transport a single generator to multiple sites on specified days, reduc-ing the high cost for low-volume centers.
Rb-82 is a monovalent cation and true analog of potas-sium. Like Tl-201, Rb-82 is taken up into the myocardium by active transport through the Na+/K ATPase pump. Its extraction is somewhat lower than that of N-13 ammonia
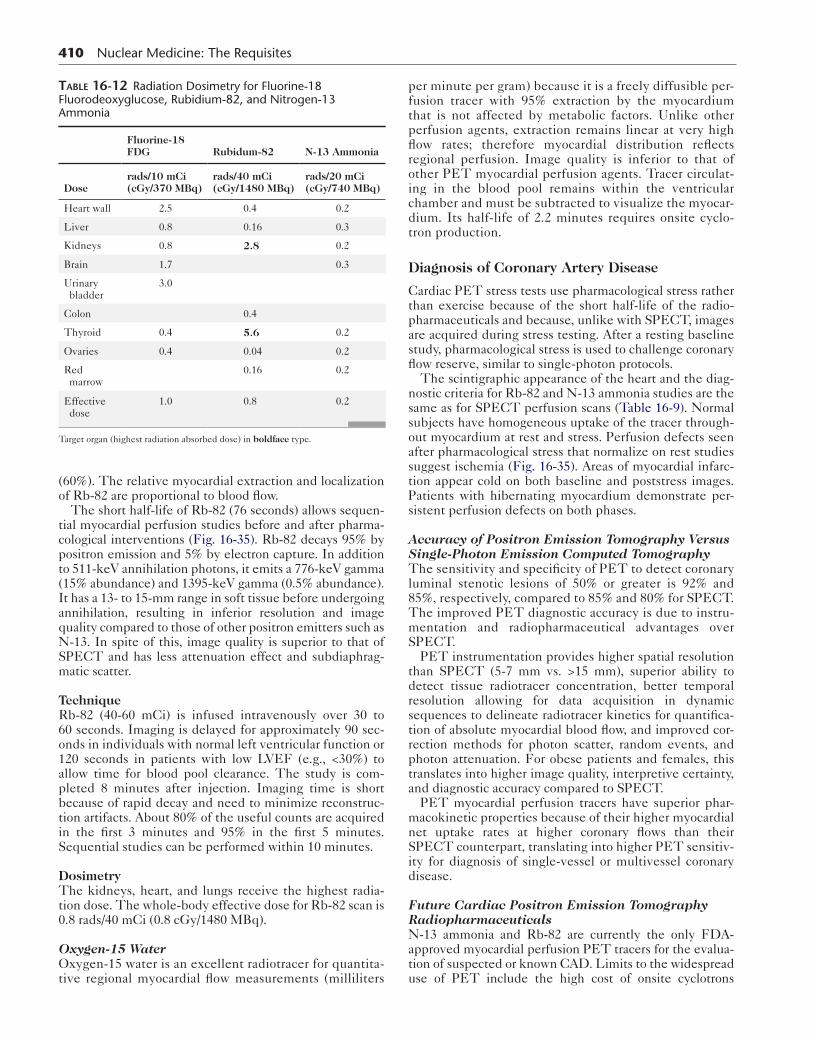
410 Nuclear Medicine: The Requisites
(60%). The relative myocardial extraction and localization of Rb-82 are proportional to blood flow.
The short half-life of Rb-82 (76 seconds) allows sequen-tial myocardial perfusion studies before and after pharma-cological interventions (Fig. 16-35). Rb-82 decays 95% by positron emission and 5% by electron capture. In addition to 511-keV annihilation photons, it emits a 776-keV gamma (15% abundance) and 1395-keV gamma (0.5% abundance). It has a 13- to 15-mm range in soft tissue before undergoing annihilation, resulting in inferior resolution and image quality compared to those of other positron emitters such as N-13. In spite of this, image quality is superior to that of SPECT and has less attenuation effect and subdiaphrag-matic scatter.
TechniqueRb-82 (40-60 mCi) is infused intravenously over 30 to 60 seconds. Imaging is delayed for approximately 90 sec-onds in individuals with normal left ventricular function or 120 seconds in patients with low LVEF (e.g., <30%) to allow time for blood pool clearance. The study is com-pleted 8 minutes after injection. Imaging time is short because of rapid decay and need to minimize reconstruc-tion artifacts. About 80% of the useful counts are acquired in the first 3 minutes and 95% in the first 5 minutes. Sequential studies can be performed within 10 minutes.
DosimetryThe kidneys, heart, and lungs receive the highest radia-tion dose. The whole-body effective dose for Rb-82 scan is 0.8 rads/40 mCi (0.8 cGy/1480 MBq).
Oxygen-15 WaterOxygen-15 water is an excellent radiotracer for quantita-tive regional myocardial flow measurements (milliliters
table 16-12 Radiation Dosimetry for Fluorine-18 Fluorodeoxyglucose, Rubidium-82, and Nitrogen-13 Ammonia
Fluorine-18 FDG Rubidum-82 N-13 Ammonia
Doserads/10 mCi(cGy/370 MBq)
rads/40 mCi(cGy/1480 MBq)
rads/20 mCi (cGy/740 MBq)
Heart wall 2.5 0.4 0.2
Liver 0.8 0.16 0.3
Kidneys 0.8 2.8 0.2
Brain 1.7 0.3
Urinary bladder
3.0
Colon 0.4
Thyroid 0.4 5.6 0.2
Ovaries 0.4 0.04 0.2
Red marrow
0.16 0.2
Effective dose
1.0 0.8 0.2
Target organ (highest radiation absorbed dose) in boldface type.
per minute per gram) because it is a freely diffusible per-fusion tracer with 95% extraction by the myocardium that is not affected by metabolic factors. Unlike other perfusion agents, extraction remains linear at very high flow rates; therefore myocardial distribution reflects regional perfusion. Image quality is inferior to that of other PET myocardial perfusion agents. Tracer circulat-ing in the blood pool remains within the ventricular chamber and must be subtracted to visualize the myocar-dium. Its half-life of 2.2 minutes requires onsite cyclo-tron production.
Diagnosis of Coronary Artery Disease
Cardiac PET stress tests use pharmacological stress rather than exercise because of the short half-life of the radio-pharmaceuticals and because, unlike with SPECT, images are acquired during stress testing. After a resting baseline study, pharmacological stress is used to challenge coronary flow reserve, similar to single-photon protocols.
The scintigraphic appearance of the heart and the diag-nostic criteria for Rb-82 and N-13 ammonia studies are the same as for SPECT perfusion scans (Table 16-9). Normal subjects have homogeneous uptake of the tracer through-out myocardium at rest and stress. Perfusion defects seen after pharmacological stress that normalize on rest studies suggest ischemia (Fig. 16-35). Areas of myocardial infarc-tion appear cold on both baseline and poststress images. Patients with hibernating myocardium demonstrate per-sistent perfusion defects on both phases.
Accuracy of Positron Emission Tomography Versus Single-Photon Emission Computed TomographyThe sensitivity and specificity of PET to detect coronary luminal stenotic lesions of 50% or greater is 92% and 85%, respectively, compared to 85% and 80% for SPECT. The improved PET diagnostic accuracy is due to instru-mentation and radiopharmaceutical advantages over SPECT.
PET instrumentation provides higher spatial resolution than SPECT (5-7 mm vs. >15 mm), superior ability to detect tissue radiotracer concentration, better temporal resolution allowing for data acquisition in dynamic sequences to delineate radiotracer kinetics for quantifica-tion of absolute myocardial blood flow, and improved cor-rection methods for photon scatter, random events, and photon attenuation. For obese patients and females, this translates into higher image quality, interpretive certainty, and diagnostic accuracy compared to SPECT.
PET myocardial perfusion tracers have superior phar-macokinetic properties because of their higher myocardial net uptake rates at higher coronary flows than their SPECT counterpart, translating into higher PET sensitiv-ity for diagnosis of single-vessel or multivessel coronary disease.
Future Cardiac Positron Emission Tomography RadiopharmaceuticalsN-13 ammonia and Rb-82 are currently the only FDA-approved myocardial perfusion PET tracers for the evalua-tion of suspected or known CAD. Limits to the widespread use of PET include the high cost of onsite cyclotrons

CardiaC SyStem 411
Figure 16-35. Rb-82 stress myocardial perfusion study. Reversible ischemia is seen in the anterior lateral and apical myocardium. HLA, horizontal long axis; SA, short axis; VLA, vertical long axis.
required for N-13 ammonia and of generators for Rb-82 and their short half-lives, which impose logistical difficulties.
These issues may be overcome in the future with the development of cyclotron-produced fluorinated perfusion tracers. Their longer half-life (110 min) will allow imaging clinics to have these radiopharmaceuticals shipped from off-site cyclotron facilities, similar to F-18 FDG, and will also make possible exercise stress protocols.
Absolute Myocardial Blood Flow QuantificationIn addition to qualitative assessment of the regional dis-tribution, PET allows in vivo dynamic quantitative
measurement of radiotracer distribution in the heart so that estimation of absolute myocardial blood flow at baseline and during vasodilator-induced hyperemia is possible.
Evidence suggests that a low coronary flow reserve (ratio of the hyperemic and resting myocardial blood flow) may be an independent predictor of adverse cardiovascular events, even in the presence of normal regional myocardial perfu-sion imaging. Patients with severe triple-vessel coronary dis-ease may occasionally demonstrate no perfusion abnormalities on rest–stress PET imaging because of balanced three-ves-sel ischemia; however, if measured by PET, coronary flow reserve will be depressed or blunted in these patients,

412 Nuclear Medicine: The Requisites
Figure 16-36. Importance of glucose loading for FDG cardiac imaging. N-13 ammonia images (top row) and two sets of F-18 FDG images of a patient with diabetes. The N-13 ammonia images show a large perfusion defect at the cardiac apex. The initial F-18 FDG images show uptake in blood pool but essentially no myocardial uptake (middle row). After insulin (I) administration (bottom row), FDG accumulates in the myocardium and reveals a matched defect at the apex.
table 16-13 Diagnostic Patterns: Positron Emission Tomography Metabolic and Perfusion Imaging
Diagnosis Perfusion (N-13 ammonia, Rb-82) Glucose metabolism (FDG)
Normal myocardium Present Present
Ischemic myocardium Absent or decreased Present
Myocardial infarction Absent Absent
FDG, Fluorodeoxyglucose.
providing the opportunity to detect this high-risk population missed by standard myocardial perfusion imaging.
Positron Emission Tomography Metabolic Radiopharmaceutical
Fluorine-18 FluorodeoxyglucoseF-18 FDG is a marker of myocardial glucose metabolism. It has a physical half-life of 1.8 hours (110 minutes). Only 1% to 4% of the injected dose is trapped in the myocar-dium; however, the target-to-background ratio is high. Blood clearance of FDG is multicompartmental and takes considerably longer than the perfusion agents. Imaging begins 45 to 60 minutes after tracer injection (10-15 mCi [370-555 MBq]), allowing for maximal myocardial uptake and blood and soft tissue background clearance. F-18 has the highest resolution of clinically used positron emitters, approximately 2 mm, because the emitted positrons travel only 1.2 mm before annihilation.
DosimetryThe organ receiving the highest radiation absorbed dose is the urinary bladder (3.0 rads/40 mCi [3.0 cGy/1480 MBq]) (Table 16-12). The whole body effective dose is 1.1 rem/15 mCi [1.1 cGy/575 MBq].
Clinical IndicationUnder normal conditions, most of the energy needs of the heart are met through fatty acid metabolism. How-ever, areas of ischemia switch preferentially to glucose
metabolism and have increased uptake of F-18 FDG rel-ative to perfusion. Regional myocardial uptake of F-18 FDG reflects regional rates of glucose usage. In the myo-cardial cell, after F-18 FDG is phosphorylated to FDG-6-phosphate, no further metabolism takes place and it is trapped.
The state of glucose metabolism in the body highly influ-ences the amount of FDG taken up in the heart. Myocar-dial glucose uptake is increased by administering glucose to stimulate insulin secretion, which increases cardiac glu-cose metabolism. High serum glucose and insulin levels and low free fatty acids promote uptake (Fig. 16-36).
Detection of Myocardial ViabilityThe combination of perfusion imaging and metabolic imaging with FDG can be of great benefit for correctly diagnosing and assessing the potential therapeutic out-come in patients with severely ischemic or hibernating myocardium (Table 16-13).
Hibernating myocardium refers to a state of persistent left ventricular dysfunction secondary to chronically com-promised resting myocardial blood flow in patients with obstructive CAD, in whom a revascularization procedure may result in partial or complete recovery of cardiac func-tion. If flow is not restored, the jeopardized myocardium eventually dies.
The rationale for using FDG is that severely ischemic, dysfunctional, but viable myocardium switches from fatty acid metabolism to glucose metabolism. FDG uptake can be greater in severely hypoperfused hypokinetic or

akinetic myocardial segment(s) than in the remainder of the heart, a phenomenon referred to as metabolic-perfusion mismatch, considered the landmark for hibernating myo-cardium (Fig. 16-37) In contrast, the combination of matched markedly reduced or absent perfusion and FDG uptake is indicative of scar formation (Fig. 16-38).
For evaluation of myocardial viability with FDG, the substrate and hormonal levels in the blood need to favor utilization of glucose over fatty acids by the myocardium. This is usually done by loading the patient with glucose after a fasting period of at least 6 hours to induce an endog-enous insulin response. The temporary increase in plasma glucose levels stimulates insulin production, which in turn reduces fatty acid levels and normalizes glucose levels.
A common method of glucose loading is an oral load of 25 g to 100 g, but intravenous loading also used. The intra-venous route avoids potential problems due to variable gastrointestinal absorption times or inability to tolerate oral administration. Most clinics use the the oral glucose-loading approach, with supplemental insulin administered as needed.
Diabetic patients pose a challenge, either because they have limited ability to produce endogenous insulin or because their cells are less able to respond to insulin stimu-lation. Thus the fasting/oral glucose-loading method is often not effective. Use of insulin along with close monitor-ing of blood glucose yields satisfactory results (Box 16-9.)
FDG in the presence of a metabolic-perfusion mismatch is accurate in predicting improvement of regional wall motion and global left ventricular ejection fraction after revascularization. Sensitivity and specificity predicting improvement of regional function after revascularization is approximately 92% and 63%, respectively.
RADIONUCLIDE VENTRICULOGRAPHY
Tc-99m–labeled red blood cell (RBC) radionuclide ven-triculography (RVG), alternatively called multigated acqui-sition (MUGA) study, has been used since the 1970s to analyze global and regional ventricular function. Two methods have been used, the first-pass method, in which all data collection occurs during the initial transit of a tracer bolus through the central circulation, and the equilibrium method, in which data are collected over many cardiac cycles using ECG gating and a tracer that remains in the blood pool. The gated equilibrium study has become the standard method at most centers.
A major advantage of the radionuclide method is that calculation of LVEF is not dependent on mathematical assumptions of ventricular shape. Emitted counts in the ventricle are proportional to its volume.
Radiopharmaceuticals
Equilibrium Blood Pool RadiopharmaceuticalRadiolabeled human serum albumin was originally used; however, radiolabeled RBCs have been the standard tech-nique for decades. Labeling of RBCs can be performed by any of three approaches: in vivo, modified in vivo, or in vitro, described in the Chapter 13 (Box 13-11). The modified in vivo or the in vitro method (Ultra-Tag RBC,
CardiaC SyStem 413
Mallinckrodt, St. Louis, MO) are preferred because of their higher binding efficiency, 85% to 90% and greater than 97%, respectively. Causes for poor RBC labeling are listed in Table 16-14, although these are uncommon using the in vitro method.
DosimetryThe spleen receives the highest radiation absorbed dose, 2.2 rads/20 mCi (2.2 cGy/740 mBq), followed by the heart wall, 2.0 rads/20 mCi (2.0 cGy/740 mBq). The whole-body effective dose is 0.777 rem/30 mCi (0.777 cGy/1110 MBq).
Box 16-9. Fluorine-18 Fluorodeoxyglucose Positron Emission Tomography Cardiac Viability: Summary Protocol
PATIENT PREPARATIONPatient should fast after midnightObtain rest myocardial perfusion scanSerum fasting blood sugar (BS)
NondiabeticIf BS ≤150 mg/dL: 50 g oral glucose solution +
regular insulin 3 units intravenouslyIf BS 151 to 300 mg/dL: 25 g oral glucose solution +
regular insulin 3 units intravenouslyIf BS 301 to 400 mg/dL: 25 g oral glucose solution +
regular insulin 5 units intravenouslyIf BS >400 mg/dL: 25 g oral glucose solution +
regular insulin 7 units intravenouslyAt least 45 minutes after glucose loading and when
BS <150 mg/dL, inject F-18 FDG
DiabeticIf BS <150 mg/dL: 25 g oral glucose solutionIf BS 151-200 mg/dL: Regular insulin 3 units intrave-
nouslyIf BS 201-300 mg/dL: Regular insulin 5 units intrave-
nouslyIf BS 301-400 mg/dL: Regular insulin 7 units intrave-
nouslyIf BS 401 mg/dL or greater: Regular insulin 10 units
intravenouslyObtain BS every 15 minutes for 60 minutes. If BS
elevated, administer additional insulin per scale. At least 45 minutes after glucose loading and when BS ≤150 mg/dL, inject F-18 FDG.
RADIOPHARMACEUTICALF-18 FDG 0.22 mCi/kg (100 μCi/lb)
TIME OF IMAGINGAfter 60-minute uptake phase
PROCEDUREPET acquisition: Cardiac field of view
PROCESSINGReconstruct along the short and long axis of the heart
similar to the perfusion study.
FDG, Fluorodeoxyglucose; IV, Intravenously; NPO, nil per os; PET, positron emis-sion tomography; SPECT, single-photon emission computed tomography.
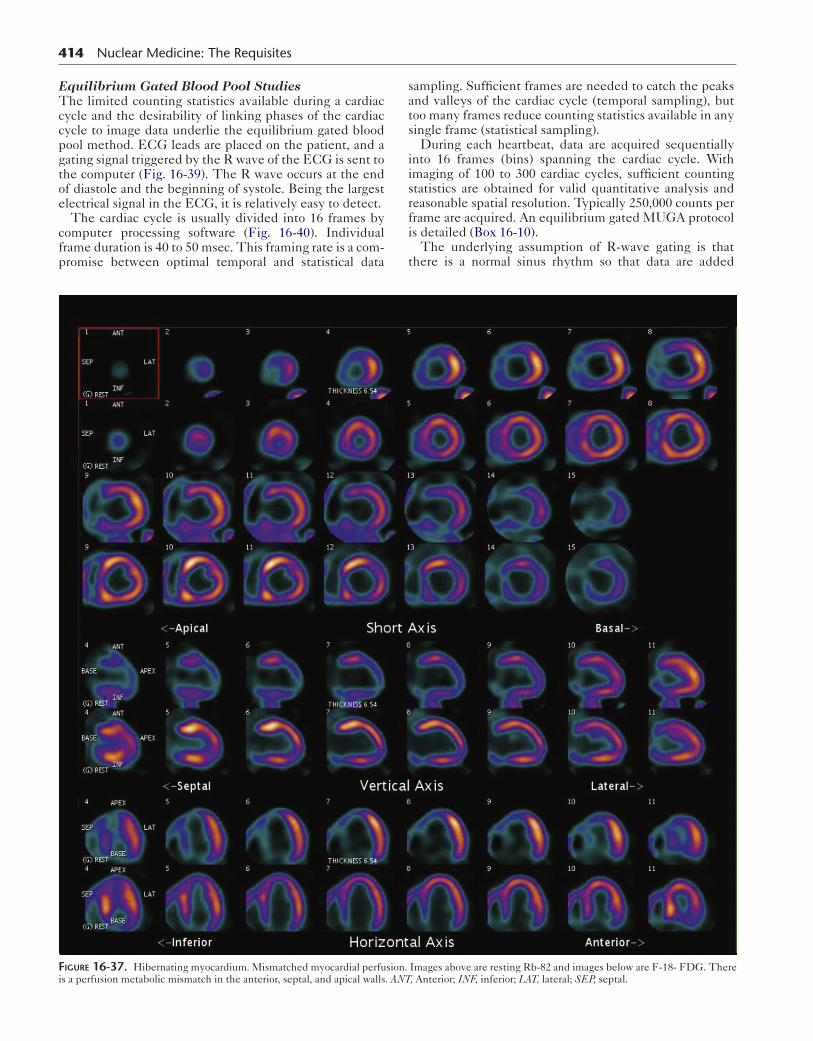
414 Nuclear Medicine: The Requisites
Equilibrium Gated Blood Pool StudiesThe limited counting statistics available during a cardiac cycle and the desirability of linking phases of the cardiac cycle to image data underlie the equilibrium gated blood pool method. ECG leads are placed on the patient, and a gating signal triggered by the R wave of the ECG is sent to the computer (Fig. 16-39). The R wave occurs at the end of diastole and the beginning of systole. Being the largest electrical signal in the ECG, it is relatively easy to detect.
The cardiac cycle is usually divided into 16 frames by computer processing software (Fig. 16-40). Individual frame duration is 40 to 50 msec. This framing rate is a com-promise between optimal temporal and statistical data
sampling. Sufficient frames are needed to catch the peaks and valleys of the cardiac cycle (temporal sampling), but too many frames reduce counting statistics available in any single frame (statistical sampling).
During each heartbeat, data are acquired sequentially into 16 frames (bins) spanning the cardiac cycle. With imaging of 100 to 300 cardiac cycles, sufficient counting statistics are obtained for valid quantitative analysis and reasonable spatial resolution. Typically 250,000 counts per frame are acquired. An equilibrium gated MUGA protocol is detailed (Box 16-10).
The underlying assumption of R-wave gating is that there is a normal sinus rhythm so that data are added
Figure 16-37. Hibernating myocardium. Mismatched myocardial perfusion. Images above are resting Rb-82 and images below are F-18- FDG. There is a perfusion metabolic mismatch in the anterior, septal, and apical walls. ANT, Anterior; INF, inferior; LAT, lateral; SEP, septal.
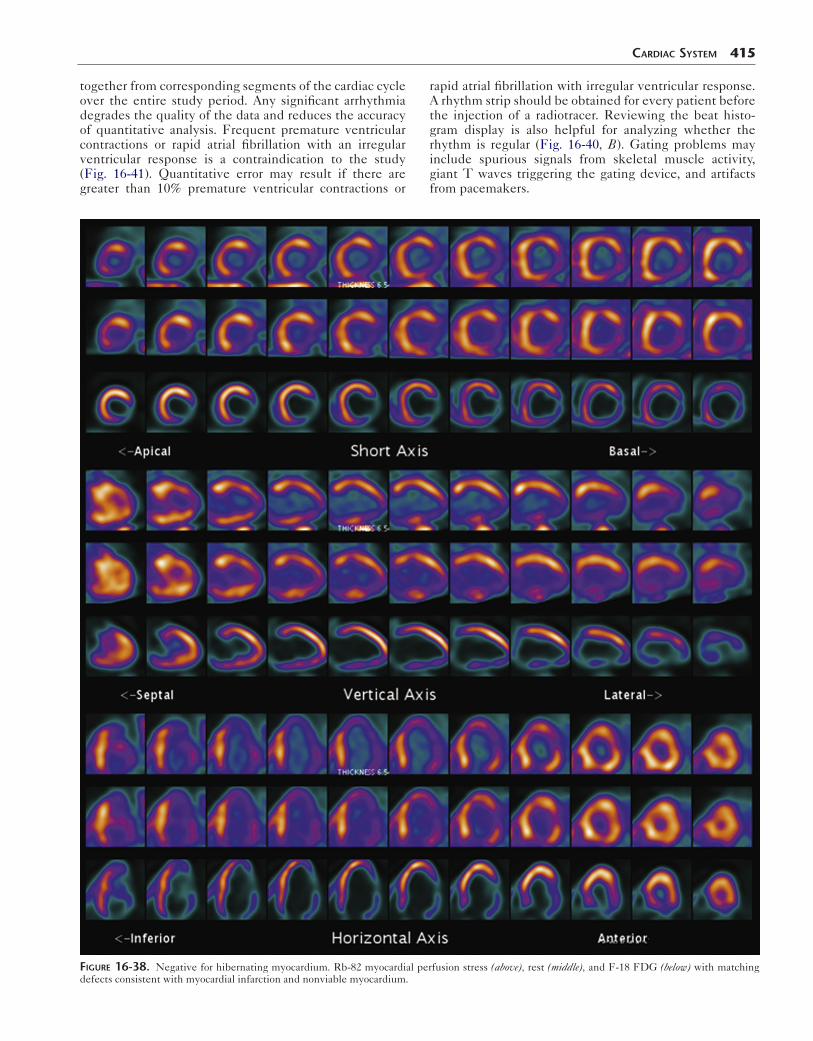
together from corresponding segments of the cardiac cycle over the entire study period. Any significant arrhythmia degrades the quality of the data and reduces the accuracy of quantitative analysis. Frequent premature ventricular contractions or rapid atrial fibrillation with an irregular ventricular response is a contraindication to the study (Fig. 16-41). Quantitative error may result if there are greater than 10% premature ventricular contractions or
CardiaC SyStem 415
rapid atrial fibrillation with irregular ventricular response. A rhythm strip should be obtained for every patient before the injection of a radiotracer. Reviewing the beat histo-gram display is also helpful for analyzing whether the rhythm is regular (Fig. 16-40, B). Gating problems may include spurious signals from skeletal muscle activity, giant T waves triggering the gating device, and artifacts from pacemakers.
Figure 16-38. Negative for hibernating myocardium. Rb-82 myocardial perfusion stress (above), rest (middle), and F-18 FDG (below) with matching defects consistent with myocardial infarction and nonviable myocardium.
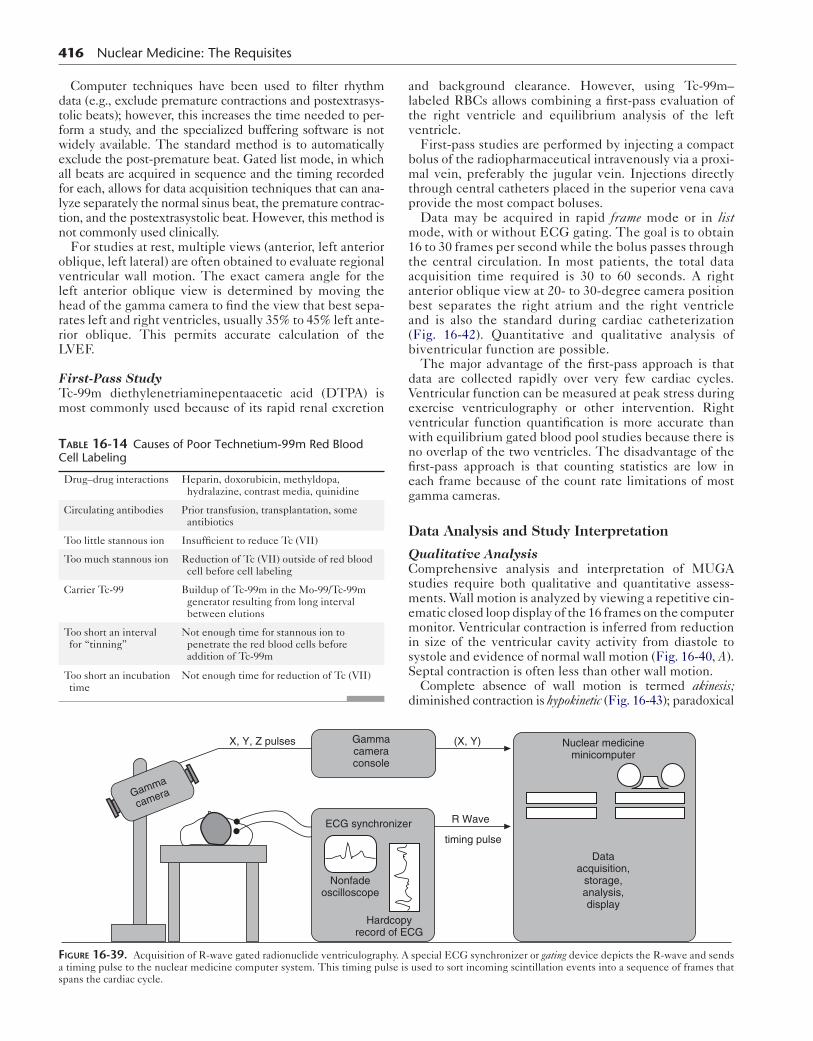
416 Nuclear Medicine: The Requisites
Computer techniques have been used to filter rhythm data (e.g., exclude premature contractions and postextrasys-tolic beats); however, this increases the time needed to per-form a study, and the specialized buffering software is not widely available. The standard method is to automatically exclude the post-premature beat. Gated list mode, in which all beats are acquired in sequence and the timing recorded for each, allows for data acquisition techniques that can ana-lyze separately the normal sinus beat, the premature contrac-tion, and the postextrasystolic beat. However, this method is not commonly used clinically.
For studies at rest, multiple views (anterior, left anterior oblique, left lateral) are often obtained to evaluate regional ventricular wall motion. The exact camera angle for the left anterior oblique view is determined by moving the head of the gamma camera to find the view that best sepa-rates left and right ventricles, usually 35% to 45% left ante-rior oblique. This permits accurate calculation of the LVEF.
First-Pass StudyTc-99m diethylenetriaminepentaacetic acid (DTPA) is most commonly used because of its rapid renal excretion
altv
bmtp
m1taaba(b
dVevwnfieg
D
QCsmemisS
d
table 16-14 Causes of Poor Technetium-99m Red Blood Cell Labeling
Drug–drug interactions Heparin, doxorubicin, methyldopa, hydralazine, contrast media, quinidine
Circulating antibodies Prior transfusion, transplantation, some antibiotics
Too little stannous ion Insufficient to reduce Tc (VII)
Too much stannous ion Reduction of Tc (VII) outside of red blood cell before cell labeling
Carrier Tc-99 Buildup of Tc-99m in the Mo-99/Tc-99m generator resulting from long interval between elutions
Too short an interval for “tinning”
Not enough time for stannous ion to penetrate the red blood cells before addition of Tc-99m
Too short an incubation time
Not enough time for reduction of Tc (VII)
nd background clearance. However, using Tc-99m– abeled RBCs allows combining a first-pass evaluation of he right ventricle and equilibrium analysis of the left entricle.First-pass studies are performed by injecting a compact
olus of the radiopharmaceutical intravenously via a proxi-al vein, preferably the jugular vein. Injections directly
hrough central catheters placed in the superior vena cava rovide the most compact boluses.Data may be acquired in rapid frame mode or in list ode, with or without ECG gating. The goal is to obtain
6 to 30 frames per second while the bolus passes through he central circulation. In most patients, the total data cquisition time required is 30 to 60 seconds. A right nterior oblique view at 20- to 30-degree camera position est separates the right atrium and the right ventricle nd is also the standard during cardiac catheterization Fig. 16-42). Quantitative and qualitative analysis of iventricular function are possible.The major advantage of the first-pass approach is that
ata are collected rapidly over very few cardiac cycles. entricular function can be measured at peak stress during xercise ventriculography or other intervention. Right entricular function quantification is more accurate than ith equilibrium gated blood pool studies because there is o overlap of the two ventricles. The disadvantage of the rst-pass approach is that counting statistics are low in ach frame because of the count rate limitations of most amma cameras.
ata Analysis and Study Interpretation
ualitative Analysisomprehensive analysis and interpretation of MUGA
tudies require both qualitative and quantitative assess-ents. Wall motion is analyzed by viewing a repetitive cin-
matic closed loop display of the 16 frames on the computer onitor. Ventricular contraction is inferred from reduction
n size of the ventricular cavity activity from diastole to ystole and evidence of normal wall motion (Fig. 16-40, A). eptal contraction is often less than other wall motion.Complete absence of wall motion is termed akinesis;
iminished contraction is hypokinetic (Fig. 16-43); paradoxical
Gammacameraconsole
Gamma
camera
Nuclear medicineminicomputer
Dataacquisition,
storage,analysis,display
ECG synchronizer
Nonfadeoscilloscope
Hardcopyrecord of ECG
(X, Y)X, Y, Z pulses
R Wave
timing pulse
Figure 16-39. Acquisition of R-wave gated radionuclide ventriculography. A special ECG synchronizer or gating device depicts the R-wave and sends a timing pulse to the nuclear medicine computer system. This timing pulse is used to sort incoming scintillation events into a sequence of frames that spans the cardiac cycle.
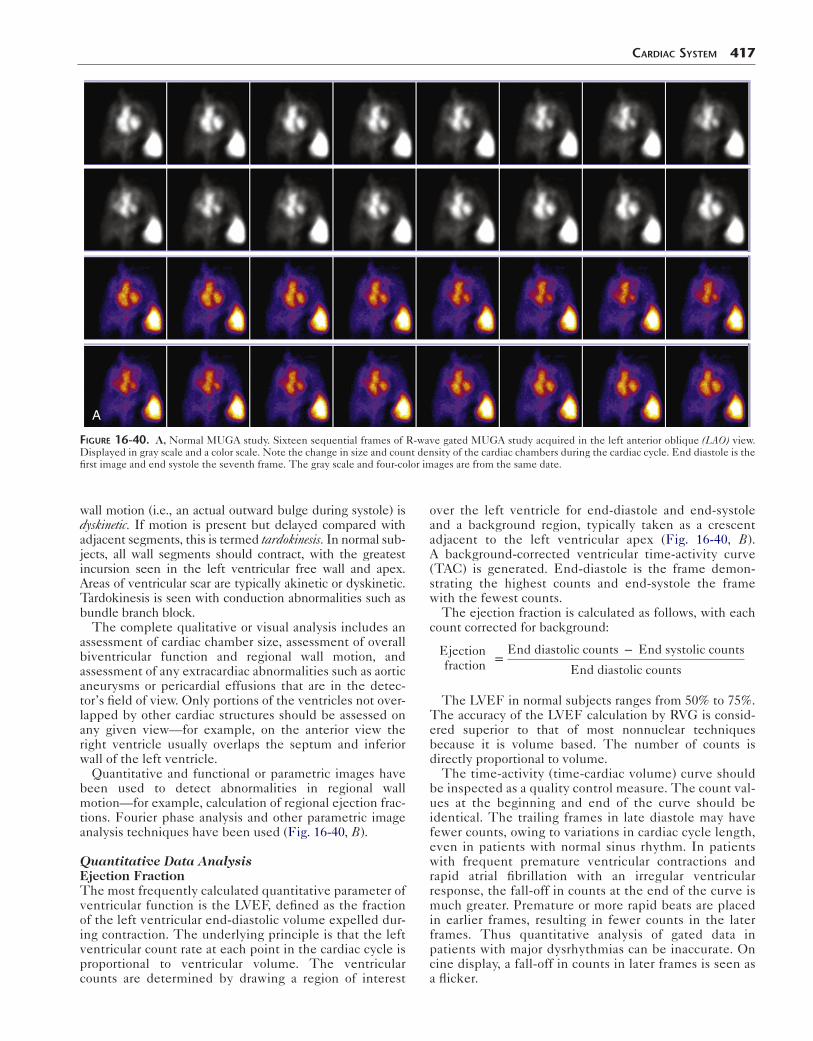
CardiaC SyStem 417
A
Figure 16-40. A, Normal MUGA study. Sixteen sequential frames of R-wave gated MUGA study acquired in the left anterior oblique (LAO) view. Displayed in gray scale and a color scale. Note the change in size and count density of the cardiac chambers during the cardiac cycle. End diastole is the first image and end systole the seventh frame. The gray scale and four-color images are from the same date.
wall motion (i.e., an actual outward bulge during systole) is dyskinetic. If motion is present but delayed compared with adjacent segments, this is termed tardokinesis. In normal sub-jects, all wall segments should contract, with the greatest incursion seen in the left ventricular free wall and apex. Areas of ventricular scar are typically akinetic or dyskinetic. Tardokinesis is seen with conduction abnormalities such as bundle branch block.
The complete qualitative or visual analysis includes an assessment of cardiac chamber size, assessment of overall biventricular function and regional wall motion, and assessment of any extracardiac abnormalities such as aortic aneurysms or pericardial effusions that are in the detec-tor’s field of view. Only portions of the ventricles not over-lapped by other cardiac structures should be assessed on any given view—for example, on the anterior view the right ventricle usually overlaps the septum and inferior wall of the left ventricle.
Quantitative and functional or parametric images have been used to detect abnormalities in regional wall motion—for example, calculation of regional ejection frac-tions. Fourier phase analysis and other parametric image analysis techniques have been used (Fig. 16-40, B).
Quantitative Data AnalysisEjection FractionThe most frequently calculated quantitative parameter of ventricular function is the LVEF, defined as the fraction of the left ventricular end-diastolic volume expelled dur-ing contraction. The underlying principle is that the left ventricular count rate at each point in the cardiac cycle is proportional to ventricular volume. The ventricular counts are determined by drawing a region of interest
over the left ventricle for end-diastole and end-systole and a background region, typically taken as a crescent adjacent to the left ventricular apex (Fig. 16-40, B). A background-corrected ventricular time-activity curve (TAC) is generated. End-diastole is the frame demon-strating the highest counts and end-systole the frame with the fewest counts.
The ejection fraction is calculated as follows, with each count corrected for background:
Ejectionfraction =
End diastolic counts − End systolic counts
End diastolic counts
The LVEF in normal subjects ranges from 50% to 75%. The accuracy of the LVEF calculation by RVG is consid-ered superior to that of most nonnuclear techniques because it is volume based. The number of counts is directly proportional to volume.
The time-activity (time-cardiac volume) curve should be inspected as a quality control measure. The count val-ues at the beginning and end of the curve should be identical. The trailing frames in late diastole may have fewer counts, owing to variations in cardiac cycle length, even in patients with normal sinus rhythm. In patients with frequent premature ventricular contractions and rapid atrial fibrillation with an irregular ventricular response, the fall-off in counts at the end of the curve is much greater. Premature or more rapid beats are placed in earlier frames, resulting in fewer counts in the later frames. Thus quantitative analysis of gated data in patients with major dysrhythmias can be inaccurate. On cine display, a fall-off in counts in later frames is seen as a flicker.
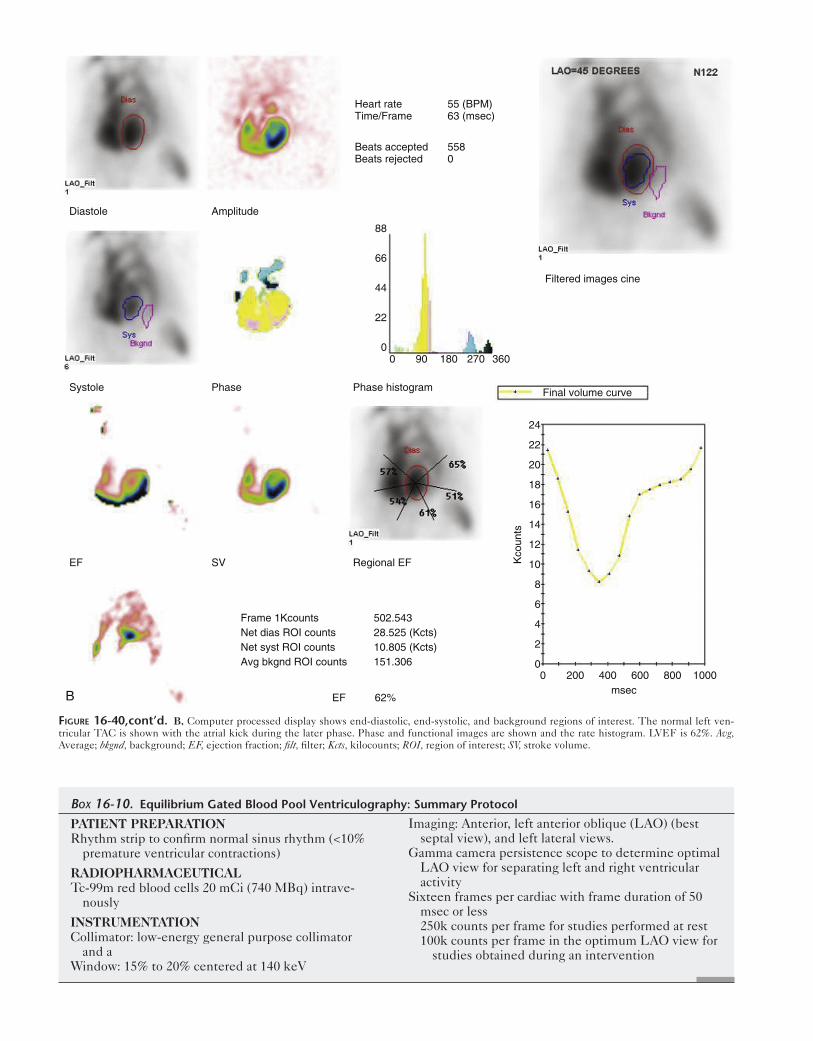
B
Diastole Amplitude
Systole Phase Phase histogram
EF Regional EF
EF 62%
Frame 1Kcounts 502.543Net dias ROI counts 28.525 (Kcts)Net syst ROI counts 10.805 (Kcts)Avg bkgnd ROI counts 151.306
SV
Heart rate 55 (BPM)Time/Frame 63 (msec)
Beats accepted 558Beats rejected 0
Filtered images cine
Final volume curve
Kco
unts
msec0
0
2
4
6
8
10
12
14
16
18
20
22
24
88
66
44
22
00 90 180 270 360
200 400 600 800 1000
Figure 16-40,cont’d. B, Computer processed display shows end-diastolic, end-systolic, and background regions of interest. The normal left ven-tricular TAC is shown with the atrial kick during the later phase. Phase and functional images are shown and the rate histogram. LVEF is 62%. Avg, Average; bkgnd, background; EF, ejection fraction; filt, filter; Kcts, kilocounts; ROI, region of interest; SV, stroke volume.
PATIENT PREPARATIONRhythm strip to confirm normal sinus rhythm (<10%
premature ventricular contractions)
RADIOPHARMACEUTICALTc-99m red blood cells 20 mCi (740 MBq) intrave-
nously
INSTRUMENTATIONCollimator: low-energy general purpose collimator
and aWindow: 15% to 20% centered at 140 keV
Imaging: Anterior, left anterior oblique (LAO) (best septal view), and left lateral views.
Gamma camera persistence scope to determine optimal LAO view for separating left and right ventricular activity
Sixteen frames per cardiac with frame duration of 50 msec or less250k counts per frame for studies performed at rest100k counts per frame in the optimum LAO view for
studies obtained during an intervention
Box 16-10. Equilibrium Gated Blood Pool Ventriculography: Summary Protocol
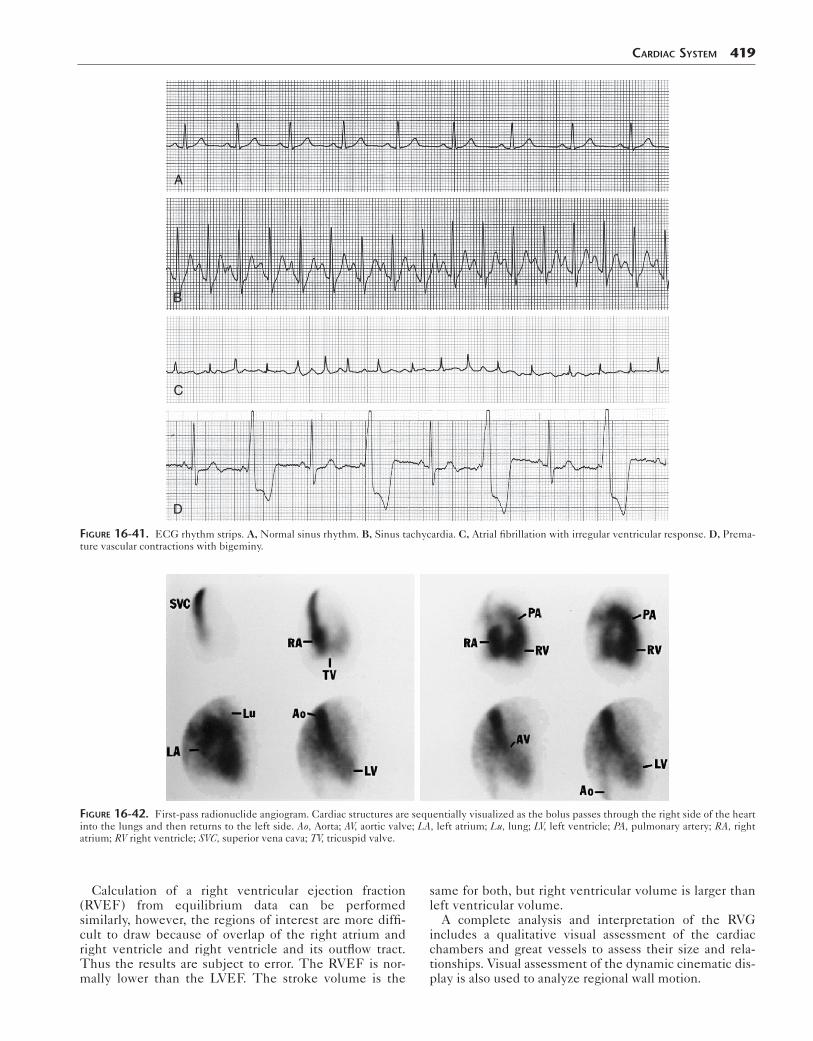
CardiaC SyStem 419
D
C
B
A
Figure 16-41. ECG rhythm strips. A, Normal sinus rhythm. B, Sinus tachycardia. C, Atrial fibrillation with irregular ventricular response. D, Prema-ture vascular contractions with bigeminy.
Figure 16-42. First-pass radionuclide angiogram. Cardiac structures are sequentially visualized as the bolus passes through the right side of the heart into the lungs and then returns to the left side. Ao, Aorta; AV, aortic valve; LA, left atrium; Lu, lung; LV, left ventricle; PA, pulmonary artery; RA, right atrium; RV right ventricle; SVC, superior vena cava; TV, tricuspid valve.
Calculation of a right ventricular ejection fraction (RVEF) from equilibrium data can be performed similarly, however, the regions of interest are more diffi-cult to draw because of overlap of the right atrium and right ventricle and right ventricle and its outflow tract. Thus the results are subject to error. The RVEF is nor-mally lower than the LVEF. The stroke volume is the
same for both, but right ventricular volume is larger than left ventricular volume.
A complete analysis and interpretation of the RVG includes a qualitative visual assessment of the cardiac chambers and great vessels to assess their size and rela-tionships. Visual assessment of the dynamic cinematic dis-play is also used to analyze regional wall motion.
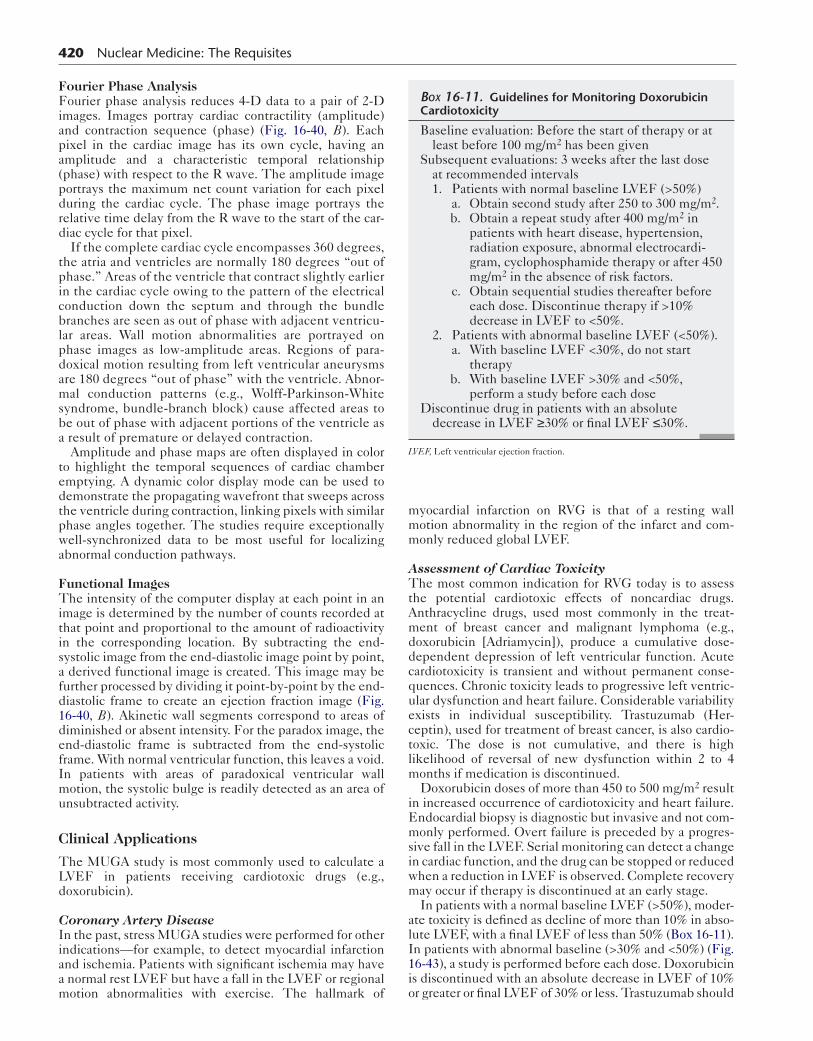
420 Nuclear Medicine: The Requisites
Fourier Phase AnalysisFourier phase analysis reduces 4-D data to a pair of 2-Dimages. Images portray cardiac contractility (amplitude)and contraction sequence (phase) (Fig. 16-40, B). Eachpixel in the cardiac image has its own cycle, having anamplitude and a characteristic temporal relationship(phase) with respect to the R wave. The amplitude imageportrays the maximum net count variation for each pixelduring the cardiac cycle. The phase image portrays therelative time delay from the R wave to the start of the car-diac cycle for that pixel.
If the complete cardiac cycle encompasses 360 degrees,the atria and ventricles are normally 180 degrees “out ofphase.” Areas of the ventricle that contract slightly earlierin the cardiac cycle owing to the pattern of the electricalconduction down the septum and through the bundlebranches are seen as out of phase with adjacent ventricu-lar areas. Wall motion abnormalities are portrayed onphase images as low-amplitude areas. Regions of para-doxical motion resulting from left ventricular aneurysmsare 180 degrees “out of phase” with the ventricle. Abnor-mal conduction patterns (e.g., Wolff-Parkinson-Whitesyndrome, bundle-branch block) cause affected areas tobe out of phase with adjacent portions of the ventricle asa result of premature or delayed contraction.
Amplitude and phase maps are often displayed in colorto highlight the temporal sequences of cardiac chamberemptying. A dynamic color display mode can be used todemonstrate the propagating wavefront that sweeps acrossthe ventricle during contraction, linking pixels with similarphase angles together. The studies require exceptionallywell-synchronized data to be most useful for localizingabnormal conduction pathways.
Functional ImagesThe intensity of the computer display at each point in animage is determined by the number of counts recorded atthat point and proportional to the amount of radioactivityin the corresponding location. By subtracting the end-systolic image from the end-diastolic image point by point,a derived functional image is created. This image may befurther processed by dividing it point-by-point by the end-diastolic frame to create an ejection fraction image (Fig.16-40, B). Akinetic wall segments correspond to areas ofdiminished or absent intensity. For the paradox image, theend-diastolic frame is subtracted from the end-systolicframe. With normal ventricular function, this leaves a void.In patients with areas of paradoxical ventricular wallmotion, the systolic bulge is readily detected as an area ofunsubtracted activity.
Clinical Applications
The MUGA study is most commonly used to calculate aLVEF in patients receiving cardiotoxic drugs (e.g.,doxorubicin).
Coronary Artery DiseaseIn the past, stress MUGA studies were performed for otherindications—for example, to detect myocardial infarctionand ischemia. Patients with significant ischemia may havea normal rest LVEF but have a fall in the LVEF or regionalmotion abnormalities with exercise. The hallmark of
myocardial infarction on RVG is that of a resting wall motion abnormality in the region of the infarct and com-monly reduced global LVEF.
Assessment of Cardiac ToxicityThe most common indication for RVG today is to assess the potential cardiotoxic effects of noncardiac drugs. Anthracycline drugs, used most commonly in the treat-ment of breast cancer and malignant lymphoma (e.g., doxorubicin [Adriamycin]), produce a cumulative dose-dependent depression of left ventricular function. Acute cardiotoxicity is transient and without permanent conse-quences. Chronic toxicity leads to progressive left ventric-ular dysfunction and heart failure. Considerable variability exists in individual susceptibility. Trastuzumab (Her-ceptin), used for treatment of breast cancer, is also cardio-toxic. The dose is not cumulative, and there is high likelihood of reversal of new dysfunction within 2 to 4 months if medication is discontinued.
Doxorubicin doses of more than 450 to 500 mg/m2 result in increased occurrence of cardiotoxicity and heart failure. Endocardial biopsy is diagnostic but invasive and not com-monly performed. Overt failure is preceded by a progres-sive fall in the LVEF. Serial monitoring can detect a change in cardiac function, and the drug can be stopped or reduced when a reduction in LVEF is observed. Complete recovery may occur if therapy is discontinued at an early stage.
In patients with a normal baseline LVEF (>50%), moder-ate toxicity is defined as decline of more than 10% in abso-lute LVEF, with a final LVEF of less than 50% (Box 16-11). In patients with abnormal baseline (>30% and <50%) (Fig. 16-43), a study is performed before each dose. Doxorubicin is discontinued with an absolute decrease in LVEF of 10% or greater or final LVEF of 30% or less. Trastuzumab should
Box 16-11. Guidelines for Monitoring Doxorubicin Cardiotoxicity
Baseline evaluation: Before the start of therapy or at least before 100 mg/m2 has been given
Subsequent evaluations: 3 weeks after the last dose at recommended intervals
1. Patients with normal baseline LVEF (>50%) a. Obtain second study after 250 to 300 mg/m2. b. Obtain a repeat study after 400 mg/m2 in
patients with heart disease, hypertension, radiation exposure, abnormal electrocardi-gram, cyclophosphamide therapy or after 450 mg/m2 in the absence of risk factors.
c. Obtain sequential studies thereafter before each dose. Discontinue therapy if >10% decrease in LVEF to <50%.
2. Patients with abnormal baseline LVEF (<50%). a. With baseline LVEF <30%, do not start
therapy b. With baseline LVEF >30% and <50%,
perform a study before each doseDiscontinue drug in patients with an absolute
decrease in LVEF ≥30% or final LVEF ≤30%.
LVEF, Left ventricular ejection fraction.

CardiaC SyStem 421
Figure 16-43. Abnormal MUGA scan. Sixteen sequential frames shows diffuse hypokinesis of both the right and left ventricle. LVEF was 25%. LAO, Left anterior oblique.
be discontinued at least temporarily if LVEF falls by more than 10% to a level of less than 50%.
Pulmonary DiseaseRight ventricular enlargement can be seen with RVG. In patients with a new onset of dyspnea, the RVG can help differentiate left ventricular from pulmonary dysfunction. Normal wall motion, LVEF, and chamber size strongly suggests a pulmonary cause.
Congenital Heart DiseaseRight-to-left shunts result from a variety of congenital car-diac diseases. They can be confirmed and quantified with Tc-99m–labeled macroaggregated albumin (MAA). With right-to-left shunts, images show uptake with the cerebral cortex and other organs (Fig. 16-44, A). However, uptake in other organs (e.g., kidneys) can be due to free Tc-99m pertechnetate. Cerebral cortex uptake is diagnostic. Quantification is best done with whole-body imaging. Regions of interest can be drawn for the lungs and total body (Fig. 16-44, B). The calculated percent shunt does not accurately reflect the real percent shunt but correlates with its severity. Greater than 10% is usually abnormal. Right-to-left shunts are a relative contraindication to the use of Tc-99m MAA, because of the theoretical risk for embolizing the capillary bed of the brain. In practice, this
is not a problem, although it is recommended that the number of particles be reduced.
MYOCARDIAL INFARCT AND AMYLOIDOSIS IMAGING
Tc-99m bone scan radiopharmaceuticals are taken up by the heart in the region of a recent myocardial infarction (Fig. 16-45). Tc-99m pyrophosphate has been used to diagnose infarction because it had higher soft tissue uptake. This test is no longer required by cardiologists to confirm the diagnosis. Several other conditions result in diffusely increased myocardial uptake of bone tracers. The most dramatic is amyloidosis. Myocarditis, postradiation injury, and doxorubicin cardiotoxicity may also have dif-fusely increased uptake.
Mechanism of Localization
After cell death in acute myocardial infarction, an influx of calcium occurs and calcium phosphate complexes are formed. These microcrystalline deposits act as sites for bone tracer uptake. Some binding also may occur on denatured macromolecules. Some residual blood flow is necessary to deliver the tracer to the infarct area and surrounding tissue. The tracer then diffuses into the necrotic tissue and is

422 Nuclear Medicine: The Requisites
A B
Figure 16-44. Right-to-left shunt. A, Brain cortical uptake is seen. B, Whole-body quantification of right-to-left shunt. Regions of interest are drawn for the whole body and lungs.
Figure 16-45. Lateral wall myocardial infarction with Tc-99m pyrophosphate uptake. Anterior (left) and left anterior oblique (right) images. The amount of myocardial uptake is greater than rib uptake but less than sternal uptake.
bound. Highest uptake is at the periphery of infarction. In large infarctions, with neither direct flow nor diffusion to the central area, no tracer is delivered and a characteristic ring or doughnut pattern is seen as a result of uptake around the margin of the infarction.
Uptake is highest for detecting infarction at 24 to 48 hours after the acute event. Significant uptake is seen at 12 hours. Maximum localization occurs at 48 to 72 hours. Thereafter uptake begins to diminish as the infarcted area heals. The scan usually reverts to normal within 14 days.
INVESTIGATIONAL CARDIAC RADIOPHARMACEUTICALS
Iodine-123 Meta-iodo-benzyl-guanidine
Iodine-123 meta-iodo-benzyl-guanidine (MIBG), a nor-epinephrine analog, has been used to study the adrenergic status of the heart. The heart is richly innervated, and MIBG has been used to provide prognostic insights. Uptake of MIBG is blocked in patients taking drugs (e.g., guanethidine, cocaine) that compete for uptake into the
presynaptic storage vesicles of the adrenergic system.Decreased uptake is seen after myocardial infarction andin some patients with cardiomyopathies.
MIBG can be used in risk stratification in patients whohave advanced heart failure. Normal uptake has a highnegative predictive value for cardiac events, especiallydeath and arrhythmias. It may have a role in guiding ther-apy by helping select patients unresponsive to conven-tional medical therapies who might benefit from devicetherapies, such as an implantable cardioverter defibrillator,cardiac resynchronization therapy, left ventricular assistdevices, or cardiac transplantation. It has potential inassessing patients after cardiac transplantation, with pri-mary arrhythmic conditions, coronary artery disease, dia-betes mellitus, and cardiotoxic chemotherapy.
Fatty Acid Radiopharmaceuticals
Fatty acids supply the majority of the heart’s metabolicrequirements under normal aerobic conditions. With isch-emia, energy metabolism shifts to anaerobic metabolismand the main energy substrate changes from free fattyacids to glucose metabolism. Radiolabeled fatty acids canbe used to image myocardial aerobic metabolism.
PET imaging with carbon-11 palmitic acid uptakereflects fatty acid metabolism. C-11 acetate allows for goodimages of the heart. Decreased uptake and delayed clear-ance indicates ischemia. Because of its rapid metabolism,cardiac turnover is inferred from dynamic analysis of itsmyocardial clearance pharmacokinetics. Controversyexists regarding the significance of the metabolic informa-tion provided. An onsite cyclotron is required.
I-123 beta-methyl-p-iodophenyl-pentadecanoic acid(BMIPP) is a single-photon branching free fatty acid radio-pharmaceutical with slow metabolism. Decreased uptakeoccurs with ischemia. The uniqueness of this radiophar-maceutical is that it demonstrates a persistent disturbanceof fatty acid metabolism, even when blood flow has beenreestablished, such as with unstable angina and stunnedmyocardium.
CardiaC SyStem 423
SuggeSted Reading
Allman KC, Shaw LJ, Hachamovitch R, et al. Myocardial viability testing and impact of revascularization on prognosis in patients with coronary artery disease and left ventricular dysfunction: a meta-analysis. J Am Coll Cardiol. 2002;39(7):1151-1158.
Bacharach SL, Bax JJ, Case J, et al. PET myocardial glucose metabolism and perfusion imaging. I. Guidelines for patient preparation and data acquisition. J Nucl Cardiol. 2003;10(5):543-554.
Bateman T, Heller G, McGhie I, et al. Diagnostic accuracy of rest/stress ECG-gated rubidium-82 myocardial perfusion PET: comparison with ECG-gated Tc-99m sestamibi SPECT. J Nucl Cardiol. 2006;13(10):24-33.
Cerqueira MD, Weissman NJ, Disizian V, et al. Standardized myocardial segmentation and nomenclature for tomographic imaging of the heart. Circulation. 2002;105(4):539-549.
Di Carli MF, Asgarzadie F, Schelbert HR, et al. Quantitative relation between myocardial viability and improvement in heart failure symptoms after revascularization in patients with ischemic cardiomyopathy. Circulation. 1995;92(12):3436-3444.
Di Carli MF, Davidson M, Little R, et al. Value of metabolic imaging with positron emission tomography for evaluating prognosis in patients with coronary artery disease and left ventricular dysfunction. J Am Coll Cardiol. 1994;3(8):527-533.
Dilsizian V, Narula J. Atlas of Nuclear Cardiology. 3rd ed. Philadelphia: Current Medicine; 2009.
Eitzman D, Al-Aouar Z, Kanter HL, et al. Clinical outcome of patients with advanced coronary artery disease after viability studies with positron emission tomography. J Am Coll Cardiol. 1992;20(3):559-565.
Hendel RC, Berman DS, Di Carli MF, et al. Appropriate use criteria for cardiac radionuclide imaging. Circulation. 2009;199(22):561-587.
Jaroudi WA, AJ, Iskandrian AE. Regadenoson: a new myocardial stress agent. J Am Coll Cardiol. 2009;54(13):1123-1130.
Ji SY, Travin MI. Radionuclide imaging of cardiac autonomic innervations. J Nucl Cardiol. 2010;17(4):655-666.
Machac J, Bacharach S, Bateman T, et al. ASNC guidelines: positron emission tomography myocardial perfusion and glucose metabolism imaging. J Nucl Cardiol. 2006;13(6):e121-e151.
Nandalur KR, Dwamena BA, Choudhri AF, et al. Diagnostic performance of positron emission tomography in the detection of coronary artery disease: a meta-analysis. Acad Radiol. 2008;15(4):444-451.
Sampson UK, Dorbala S, Limaye A, et al. Diagnostic accuracy of rubidium-82 myocardial perfusion imaging with hybrid positron emission tomography/computed tomography in the detection of coronary artery disease. J Am Coll Cardiol. 2007;49(10):1052-1058.
Shelbert HR, Beanlands RB, Engel F, et al. PET myocardial perfusion and glucose metabolism imaging. II. Guidelines for interpretation and reporting. J Nucl Cardiol. 2000;10(5):557-571.
Underwood SR, Anagnostopoulos C, Cerqueira M, et al. Myocardial perfusion scintigraphy: the evidence. Eur J Nucl Med and Mol Imaging. 2004;31(2):261-291.
Yoshinaga K, Chow BJ, Williams K, et al. What is the prognostic value of myocardial perfusion imaging using Rb-82 positron emission tomography? J Am Coll Cardiol. 2006;48:1029-1039.
Zaret BL, Beller GA. Clinical Nuclear Cardiology. 3rd ed. Philadelphia: Elsevier; 2010.