16/22b relinquishment report - log in · original operator: total with 12 other partners . work...
TRANSCRIPT

16/22B RELINQUISHMENT REPORT
Vn4 28/6/16 (inc partner comments)
1. Licence information
Licence Number: P240 (which covers a number of blocks including 16/22)
Licence Round: 4th round, Awarded 16/3/1972, expires 16/3/2018
Licence Type: Traditional
Block Number: 16/22b (located in Fig. 1)
Current Equity ARCO British (BP) 29.895% (Op), Idemitsu Petroleum 41.1006%, JX NIPPON
Exploration (UK) 21.9203%, Talisman SINOPEC Energy 7.0841%
Note : The JV does not recognise the block known as16/22b ARUN. However if this Block is ours,
then we would like to relinquish this too
All permissions to publish have been obtained from current JV
FIGURE 1 LICENCE MAP – SHOWING 16/22B IN SHADED GREEN
2. 16/22b Sub-Block Synopsis:
Original Operator: Total with 12 other partners

Work Obligations: within first 6 years: carry out seismic survey work and drill not less than 2
exploration wells (on the licence)
Initial Prospectivity No documents remain to hand describing prospectivity, but the subsequent well
targeting indicates a combination of 1) Palaeocene (16/22-1: Burghley) and 2) an extension of the
upper Jurassic Brae trend from the “T-Blocks” to the north (16/22-2,3,5 & 6)
Sub-Block rationale: There is limited 16/22b specific available documentation prior to 2000, when the
Chevron operated 16/23-6 well discovered Arundel in 16/23aS
Much of the subsequent work described the possible extension of Arundel from 16/23as, westwards
into 16/22b, described below. The work was carried out jointly for both block partner groups.
BP took equity and operatorship of this part block from Chevron in 2006, for the potential extension
of the Arundel field discovery (2000, 16/23-6). This small part block is geologically linked with
neighbouring 16/23a (P103) containing the bulk of Arundel, the Kinnoull prospect and small Kidd
Palaeocene discovery. In 2008, Kinnoull was discovered (16/23-7) and Arundel appraised (16/23-8,8z).
In 2014, Kinnoull was put on production with a pipeline tie-in point provided at the suspended 16/23-
8z well to provide a potential for re-use as a producer.
In summary:
- Palaeocene (Arundel) discovery): Analysis of the 16/22-2, 16/23-6,8,8z with the 2012 High
Density Ocean bottom Cable (HDOBC) 3D seismic led the team to conclude that a negligible
proportion of Arundel resides within the P240 licence.
- 16/22-2 Jurassic oil discovery: is a very small 4-way dip closed structure demonstrating a highly
compartmentalised reservoir. Well test and mapping indicates this this is likely to be a
compartment of < 1mmbo recoverable.
- Remaining prospectivity: There is a modest size untested 3-way dip/ stratigraphic closed
Jurassic prospect in the SE of this part block with estimated gross recoverable of 12mmboe of
which ~6mmbo resides in 16/22b.
3 Work Programme & Database
3.1 Seismic Database
The actual work programme on 16/22 block, included various 2D & multiple 3D surveys:
1) Multi-company 1990’s acquisition, BP_Western 2008 reprocessing (Fig. 2)
2) CGGV multi-client long offset “Cornerstone”- licensing limits show rights
3) 2013 HDOBC survey acquired exclusively for the 16/23aS group and
4) Partially covered by 2015 PGS Geostreamer – licensing limits show rights
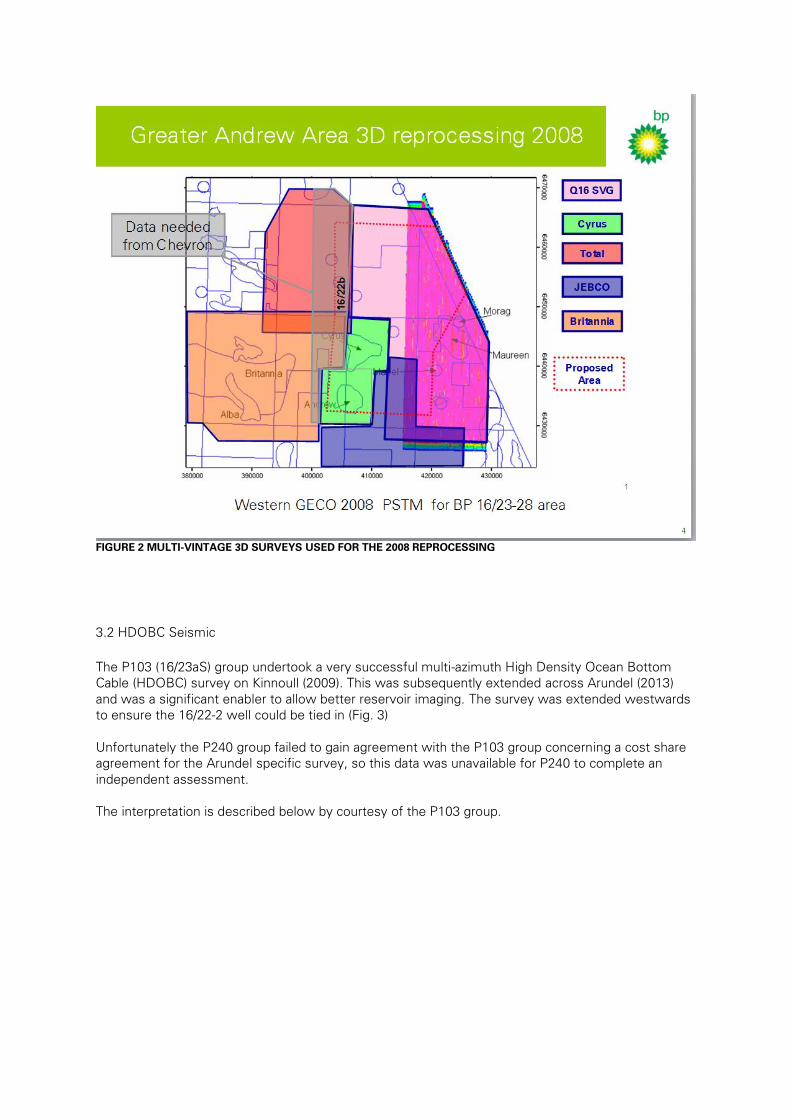
FIGURE 2 MULTI-VINTAGE 3D SURVEYS USED FOR THE 2008 REPROCESSING
3.2 HDOBC Seismic
The P103 (16/23aS) group undertook a very successful multi-azimuth High Density Ocean Bottom
Cable (HDOBC) survey on Kinnoull (2009). This was subsequently extended across Arundel (2013)
and was a significant enabler to allow better reservoir imaging. The survey was extended westwards
to ensure the 16/22-2 well could be tied in (Fig. 3)
Unfortunately the P240 group failed to gain agreement with the P103 group concerning a cost share
agreement for the Arundel specific survey, so this data was unavailable for P240 to complete an
independent assessment.
The interpretation is described below by courtesy of the P103 group.

FIGURE 3 RANGE OF ARUNDEL 2012 INTERPRETATIONS (TOWED STREAMER) AND HDOBC SURVEY LINE PLAN
Figure 4 shows a comparison of the data quality of the 2008 reprocessing vs the HDOBC.
The hard Eocene sands are substantially clearer and consequently the imaging on the regional low
impedance (trough) Sele marker is better and relatively unambiguous compared to the earlier vintage.
It is possible to discern the hard (peak reflector) top reservoir sand and an alternative impedance
based interpretation is shown.
Figure 5 shows a reasonably good 16/22-2 well to seismic tie, although the widely spaced
checkshots and complex overburden does not provide a perfect match. This is particularly obvious on
the zoom-in panel.
The resultant depth of the Arundel OWC ( 2537mtvdss) is projected as a flat line at 2390msTWT is
in Fig. 4.
Note that in this N-S line orientation, none of the reservoir is expected to be in the Arundel oil leg.
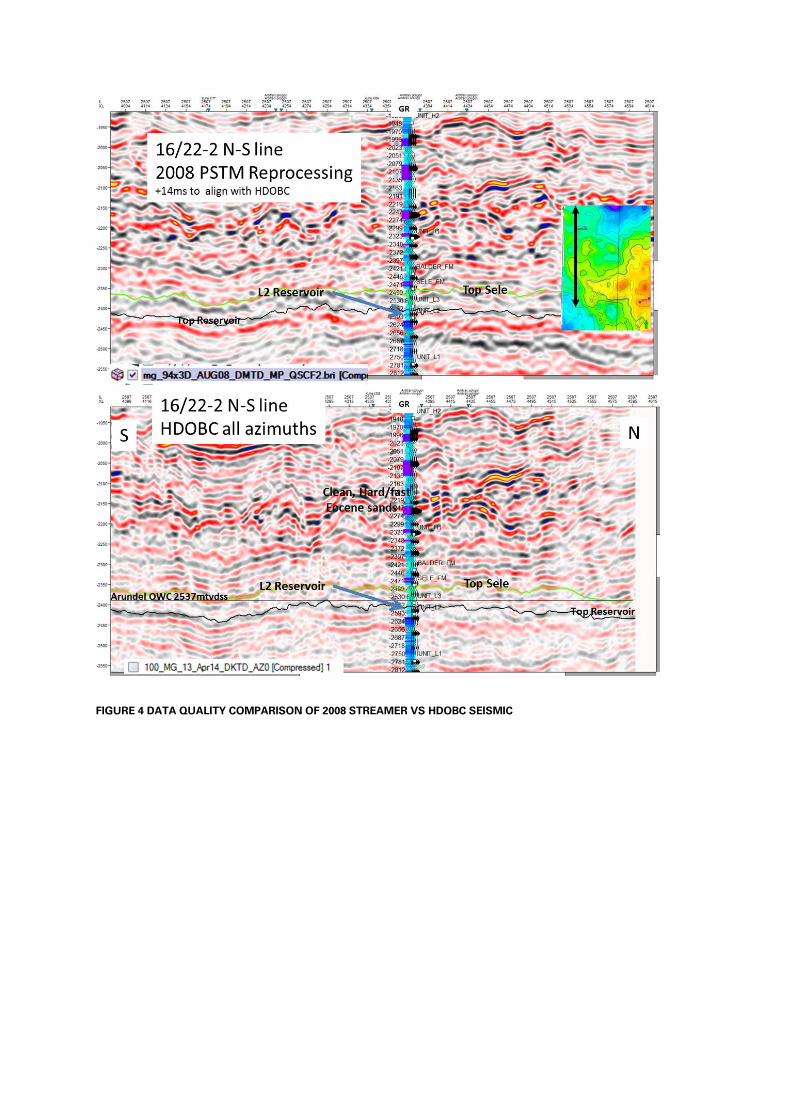
FIGURE 4 DATA QUALITY COMPARISON OF 2008 STREAMER VS HDOBC SEISMIC
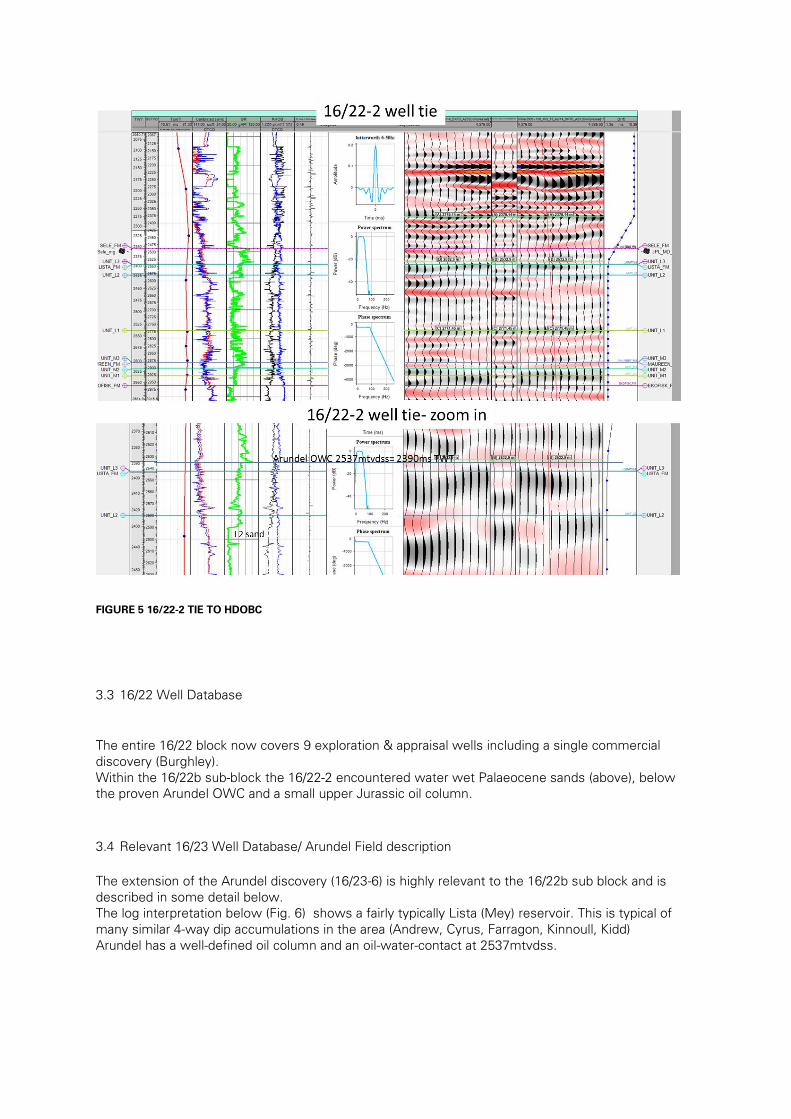
FIGURE 5 16/22-2 TIE TO HDOBC
3.3 16/22 Well Database
The entire 16/22 block now covers 9 exploration & appraisal wells including a single commercial
discovery (Burghley).
Within the 16/22b sub-block the 16/22-2 encountered water wet Palaeocene sands (above), below
the proven Arundel OWC and a small upper Jurassic oil column.
3.4 Relevant 16/23 Well Database/ Arundel Field description
The extension of the Arundel discovery (16/23-6) is highly relevant to the 16/22b sub block and is
described in some detail below.
The log interpretation below (Fig. 6) shows a fairly typically Lista (Mey) reservoir. This is typical of
many similar 4-way dip accumulations in the area (Andrew, Cyrus, Farragon, Kinnoull, Kidd)
Arundel has a well-defined oil column and an oil-water-contact at 2537mtvdss.
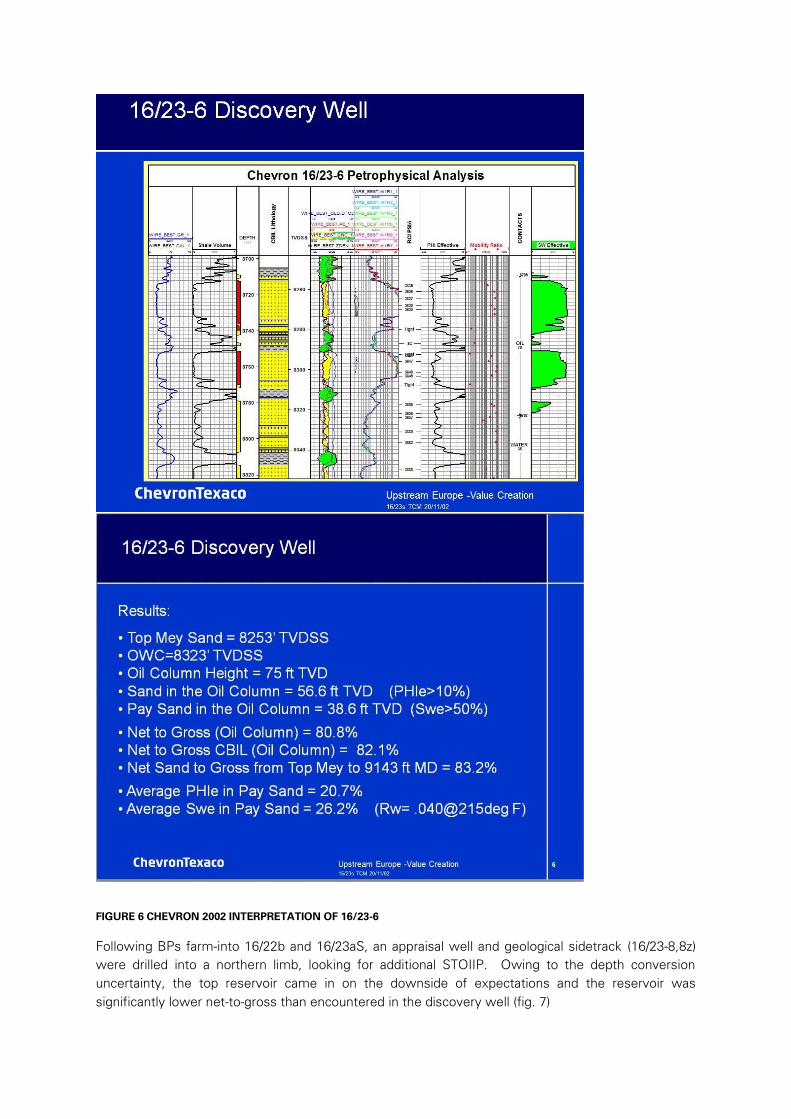
FIGURE 6 CHEVRON 2002 INTERPRETATION OF 16/23-6
Following BPs farm-into 16/22b and 16/23aS, an appraisal well and geological sidetrack (16/23-8,8z)
were drilled into a northern limb, looking for additional STOIIP. Owing to the depth conversion
uncertainty, the top reservoir came in on the downside of expectations and the reservoir was
significantly lower net-to-gross than encountered in the discovery well (fig. 7)

FIGURE 7 FINAL COMPOSITE LOGS FROM ARUNDEL APPRAISAL 16/23-8 & 8Z
The 16/23-8 was suspended at the 13 3/8” casing shoe for future potential re-entry as a producer.
On the back of the 2008 discovery of Kinnoull (16/23-7), the Andrew Area Development Project
(AADP) installed a new production line from the Kinnoull subsea template via the suspended Arundel
appraisal well and tie-in to a new processing plant on the Andrew platform.
The Arundel field development plan is expected to be submitted in 2016 involving a horizontal
producer entirely located in the 16/23a block
4 Top reservoir interpretation and Time-to-depth conversion
Historically the common critical factors in exploring and appraising these low relief Palaeocene fields
are the depth to top reservoir and the variable Net-to-gross within them.
Historically the largest influence on the BRV of Arundels’ low relief closure is the
a) Precise interpretation of the weak reflector that coincides with the precise top reservoir and
b) Method of time-to-depth conversion.

The presence of a complex overburden comprising several stacked Eocene sands results in poor
imaging, signal attenuation, multiples and a complex depth conversion.
Figure 4 shows the improvement in imaging and resultant reliability in top reservoir TWT
interpretation that can be achieved by using HDOBC seismic.
However, the time-to-depth relationship needs to consider the distortion at top reservoir from a
number of contributing overburden layers.
The seismic horizons in time are distorted by
1) push-down below slow-velocity anomalies (Quaternary canyons and gas sands) and
2) pull-up below fast-velocity anomalies (Mio-Pliocene and Eocene channels).
It has been found that the largest impact is derived from the high velocity Eocene sands.
The HDOBC seismic in Fig. 4 shows the Eocene section contains complex architecture involving
multiple turbidite channel sands. These are often cemented, giving them very high velocities seen on
the sonic log in Fig. 5. Arundel has the thickest Eocene sands seen in the area, exceeding 200m in
the 16/22-2 well. This highlights the magnitude and importance of accounting for these sands
correctly.
5 Summarised 2015 HDOBC Interpretation
The western portion of the finalised 2015 HDOBC maps is described below.
Eocene seismic attributed (Fig. 8 left) indicate the gross thickness of the Eocene sands are more
prevalent to the north and west of the area of interest.
Calibration of this attribute map gives rise to the final Top Balmoral reservoir depth map with the oil
water contact outline shown on all the maps in blue.
It is clear from fig 8, that very little volume resides in the 16/22b block and there are no plans to
target a production well into this acreage.
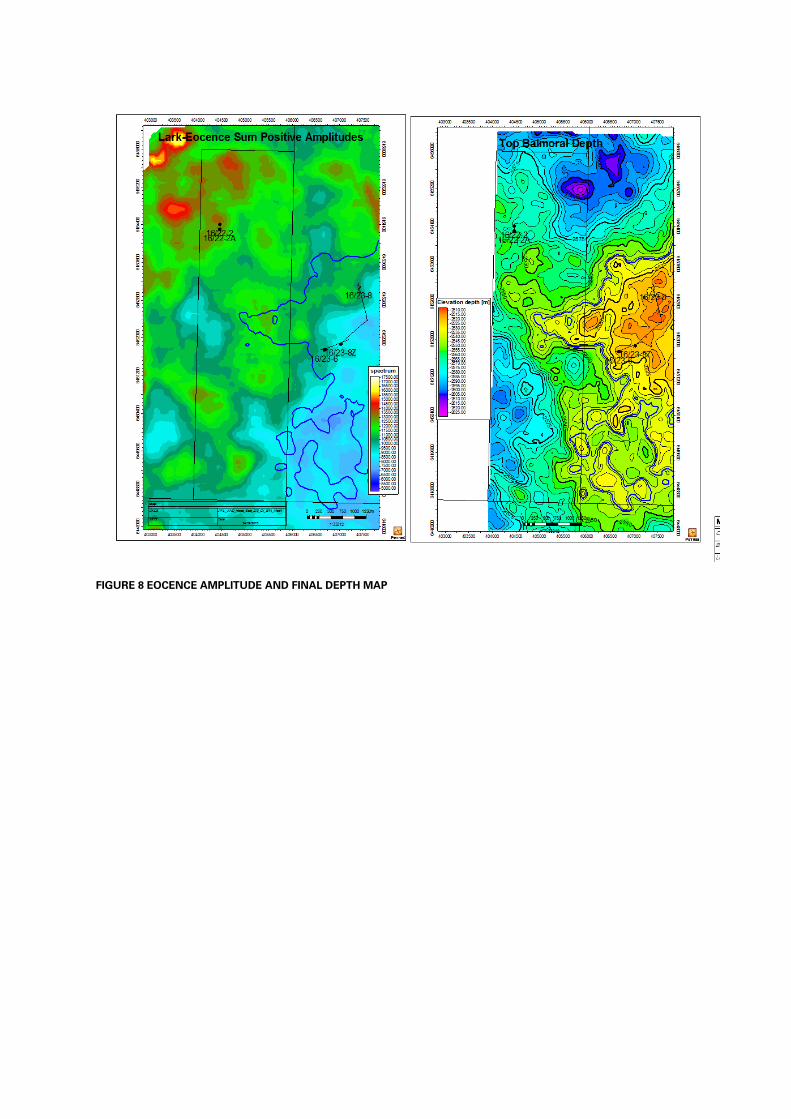
FIGURE 8 EOCENCE AMPLITUDE AND FINAL DEPTH MAP

6 Jurassic Prospectivity
6.1 Brae reservoir Overview
Fig 9 shows the Base Cretaceous unconformity map and the Jurassic well penetrations in the
immediate area. The most prospective interval is the Upper Jurassic Brae reservoirs which enter the
basin from the west and appear to pinchout towards the east (Fig. 10).
FIGURE 0 BASE CRETACEOUS TWT MAP

FIGURE 10 RESERVOIR DISTRIBUTION MAP
The gross pinchout can also be readily seen on seismic in cross section (Fig.11) The Base of the Brae
reservoir is marked by the Mid Jurassic Top Pentland (low impedance ~coal) event. The Brae –
Pentland interval pinches out eastwards onto the bright and chaotic mid Jurassic – Rattray volcanic
sequence.
The imaging of the crucial intra-Brae reservoir package is seriously degraded on these legacy
streamer seismic volumes by a series of Base Cretaceous multiples. The 2008 reprocessing has
partially alleviated this, although the data needs further enhancements (demultiple and pre stack
depth migration) to be fully consistent with modern standards.

FIGURE 11 COMPARATIVE SESIMIC CROSS SECTION TYING KEY WELLS
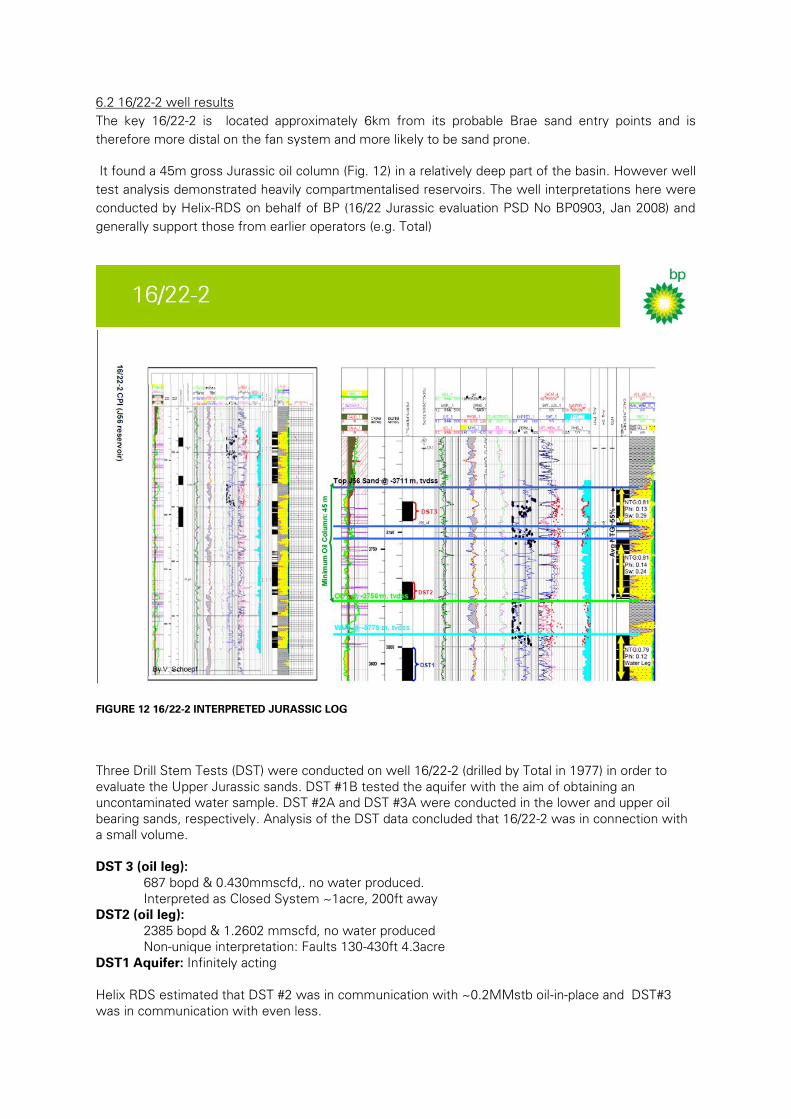
6.2 16/22-2 well results
The key 16/22-2 is located approximately 6km from its probable Brae sand entry points and is
therefore more distal on the fan system and more likely to be sand prone.
It found a 45m gross Jurassic oil column (Fig. 12) in a relatively deep part of the basin. However well
test analysis demonstrated heavily compartmentalised reservoirs. The well interpretations here were
conducted by Helix-RDS on behalf of BP (16/22 Jurassic evaluation PSD No BP0903, Jan 2008) and
generally support those from earlier operators (e.g. Total)
FIGURE 12 16/22-2 INTERPRETED JURASSIC LOG
Three Drill Stem Tests (DST) were conducted on well 16/22-2 (drilled by Total in 1977) in order to
evaluate the Upper Jurassic sands. DST #1B tested the aquifer with the aim of obtaining an
uncontaminated water sample. DST #2A and DST #3A were conducted in the lower and upper oil
bearing sands, respectively. Analysis of the DST data concluded that 16/22-2 was in connection with
a small volume.
DST 3 (oil leg):
687 bopd & 0.430mmscfd,. no water produced.
Interpreted as Closed System ~1acre, 200ft away
DST2 (oil leg):
2385 bopd & 1.2602 mmscfd, no water produced
Non-unique interpretation: Faults 130-430ft 4.3acre
DST1 Aquifer: Infinitely acting
Helix RDS estimated that DST #2 was in communication with ~0.2MMstb oil-in-place and DST#3
was in communication with even less.
6.3 Interpretation of 16/22-2 closure the “small 4-way”
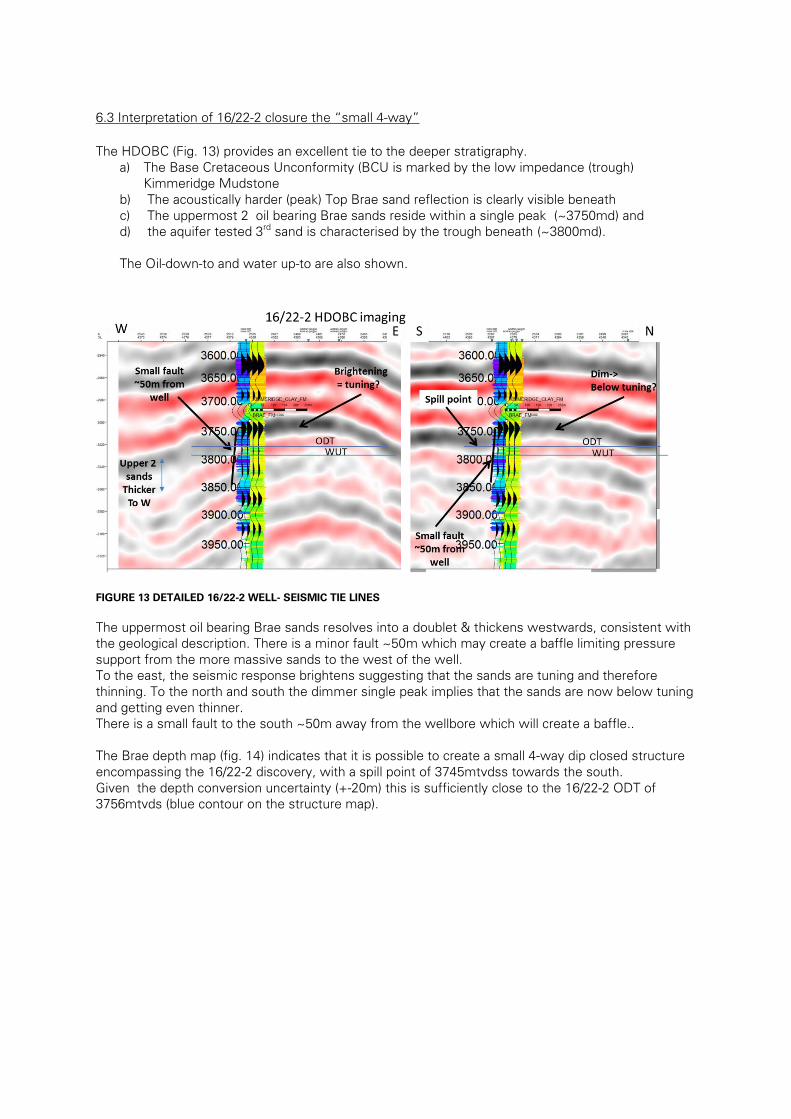
The HDOBC (Fig. 13) provides an excellent tie to the deeper stratigraphy.
a) The Base Cretaceous Unconformity (BCU is marked by the low impedance (trough)
Kimmeridge Mudstone
b) The acoustically harder (peak) Top Brae sand reflection is clearly visible beneath
c) The uppermost 2 oil bearing Brae sands reside within a single peak (~3750md) and
d) the aquifer tested 3rd
sand is characterised by the trough beneath (~3800md).
The Oil-down-to and water up-to are also shown.
FIGURE 13 DETAILED 16/22-2 WELL- SEISMIC TIE LINES
The uppermost oil bearing Brae sands resolves into a doublet & thickens westwards, consistent with
the geological description. There is a minor fault ~50m which may create a baffle limiting pressure
support from the more massive sands to the west of the well.
To the east, the seismic response brightens suggesting that the sands are tuning and therefore
thinning. To the north and south the dimmer single peak implies that the sands are now below tuning
and getting even thinner.
There is a small fault to the south ~50m away from the wellbore which will create a baffle..
The Brae depth map (fig. 14) indicates that it is possible to create a small 4-way dip closed structure
encompassing the 16/22-2 discovery, with a spill point of 3745mtvdss towards the south.
Given the depth conversion uncertainty (+-20m) this is sufficiently close to the 16/22-2 ODT of
3756mtvds (blue contour on the structure map).

FIGURE 14 TOP BRAE MAP
The Monte Carlo volumetric calculation for the “small 4-way” is given below. It should be noted that
it remains difficult to reconcile the calculated STOIIP (~9mmbo) and that observed in the well test
(~0.2mmbstb) without very significant compartmentalisation.
6.4 Interpretation of the“larger 4-way”
The larger “4-way” Base Cretaceous (Fig 9) corresponds with a thinner Brae interval (Fig. 15),
although the Brae peak reflector continues across the western side of the closure (Fig. 16). It is
unlikely that the sands will be present on the eastern side, so the lead is effectively described by a
3-way dip closed structure, with eastern stratigraphic trap.
The Top Brae spills in a westerly direction around 3675mtvdss for this lead, marked as a white line
on depth and isopach maps.
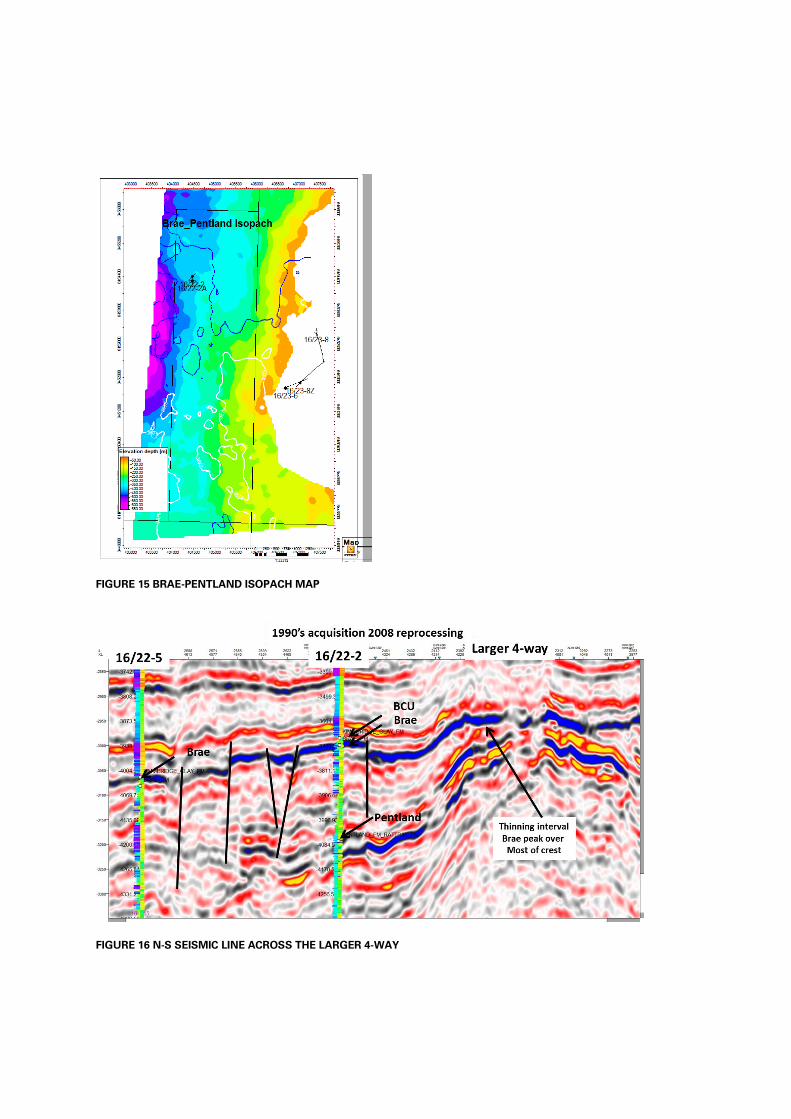
FIGURE 15 BRAE-PENTLAND ISOPACH MAP
FIGURE 16 N-S SEISMIC LINE ACROSS THE LARGER 4-WAY
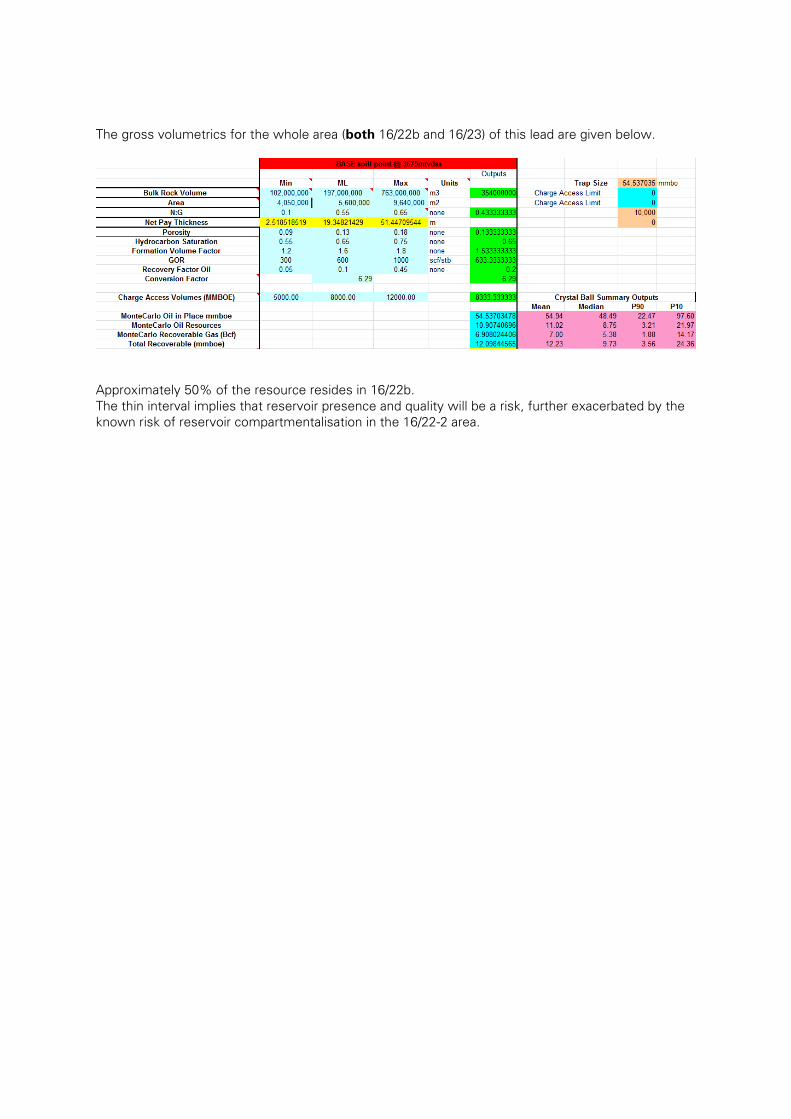
The gross volumetrics for the whole area (both 16/22b and 16/23) of this lead are given below.
Approximately 50% of the resource resides in 16/22b.
The thin interval implies that reservoir presence and quality will be a risk, further exacerbated by the
known risk of reservoir compartmentalisation in the 16/22-2 area.