16.885 aircraft systems engineering cost analysis · aircraft systems engineering cost analysis...
TRANSCRIPT

16.885Aircraft Systems
Engineering
Cost AnalysisKaren Willcox
MITAerospace Computational Design
Laboratory
AEROSPACE COMPUTATIONAL DESIGN LABORATORY

9/19/2002 16.885 AEROSPACE COMPUTATIONAL DESIGN LABORATORY
Outline
• Lifecycle cost• Operating cost• Development cost• Manufacturing cost• Revenue• Valuation techniques

9/19/2002 16.885 AEROSPACE COMPUTATIONAL DESIGN LABORATORY
Lifecycle Cost
Lifecycle :Design - Manufacture - Operation - Disposal
Lifecycle cost :Total cost of program over lifecycle
85% of Total LCC is locked in by the end of preliminary design.

9/19/2002 16.885 AEROSPACE COMPUTATIONAL DESIGN LABORATORY
Lifecycle Cost
0
20
40
60
80
100
65%
Con
cept
ual
desi
gn
Prel
imin
ary
desi
gn,
syst
em in
tegr
atio
n
Det
aile
d de
sign
Man
ufac
turi
ngan
d ac
quis
ition
Ope
ratio
nan
d su
ppor
t
Dis
posa
l
Time
Impa
ct o
n LC
C (%
)
85%
95%
(From Roskam, Figure 2.3)

9/19/2002 16.885 AEROSPACE COMPUTATIONAL DESIGN LABORATORY
Operating Cost
Airplane Related Operating Cost(AROC)
Passenger Related Operating Cost(PROC)
Cargo Related Operating Cost(CROC)
Systems Related Operating Cost(SROC)
AROC70%
PROC18%
CROC2%
SROC10%

9/19/2002 16.885 AEROSPACE COMPUTATIONAL DESIGN LABORATORY
Airplane Related Operating Costs
CASH AIRPLANE RELATEDOPERATING COSTS:
CrewFuel
MaintenanceLanding
Ground HandlingGPE DepreciationGPE Maintenance
Control & Communications
CAROC
60%40%
CapitalCosts
CAPITAL COSTS:FinancingInsurance
Depreciation
CAROC is only 60% - ownership costs are significant!

9/19/2002 16.885 AEROSPACE COMPUTATIONAL DESIGN LABORATORY
CAROC Breakdown per Trip
Landing 6%
GroundHandling
7%
Control& Comm
9%
Other3%
Fuel20%
Crew40%
Maintenance15%
Fuel is roughly 20% of 60% of 70% of Total Operating Costi.e. 8%
typical data for a large commercial jet

9/19/2002 16.885 AEROSPACE COMPUTATIONAL DESIGN LABORATORY
Non-Recurring CostCost incurred one time only:Engineering
- airframe design/analysis- configuration control- systems engineering
Tooling- design of tools and fixtures- fabrication of tools and fixtures
Other- development support- flight testing
Engi
neer
ing
Tool
ing
Oth
er

9/19/2002 16.885 AEROSPACE COMPUTATIONAL DESIGN LABORATORY
Recurring CostCost incurred per unit:Labor
- fabrication- assembly- integration
Material to manufacture- raw material- purchased outside production- purchased equipment
Production support- QA- production tooling support- engineering support
Labo
rM
ater
ial
Supp
ort

9/19/2002 16.885 AEROSPACE COMPUTATIONAL DESIGN LABORATORY
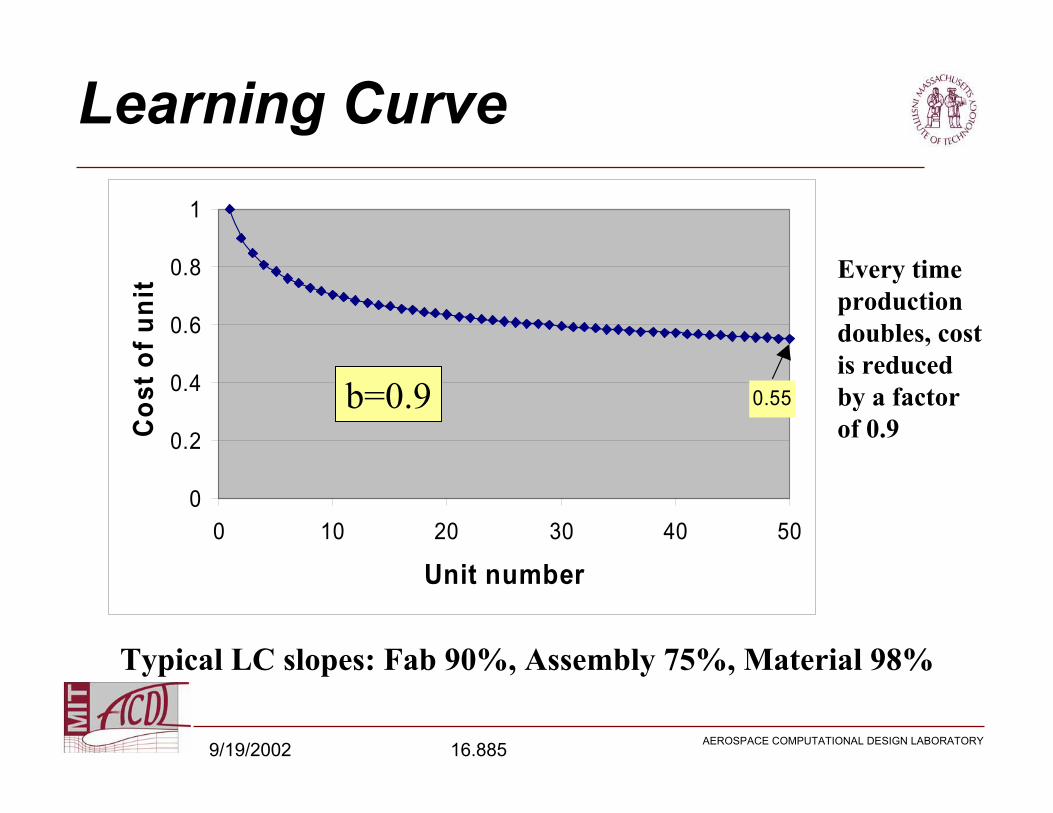
Learning CurveAs more units are made, the recurring cost per unit decreases.
This is the learning curve effect.
e.g. Fabrication is done more quickly, less material is wasted.
nx xYY 0
Yx = number of hours to produce unit xn = log b/log 2b = learning curve factor (~80-100%)
9/19/2002 16.885 AEROSPACE COMPUTATIONAL DESIGN LABORATORY
Learning Curve
0.55
0
0.2
0.4
0.6
0.8
1
0 10 20 30 40 50
Unit number
Cost
of u
nit
b=0.9
Every time productiondoubles, cost is reduced by a factor of 0.9
Typical LC slopes: Fab 90%, Assembly 75%, Material 98%

9/19/2002 16.885 AEROSPACE COMPUTATIONAL DESIGN LABORATORY
Elements of a Cost Model
Non-RecurringCost
RecurringCost
COSTMODEL
0
40
80
120
2000 2010 2020 2030Year
Num
ber o
f pla
nes
Build Schedule
Plane
Wing
Winglet RibsSkin
Fuselage
WeightRC/lb
Subparts/lbNRC/lb
Component Breakdown
0
0.4
0.81
0 10 20 30 40 50Unit number
Cos
t of u
nit
Learning Curve
Engineering Data& Performance
0
1
2
2003 2007 2011 2015Year
NR
C ($
B)
NRC Distribution

9/19/2002 16.885 AEROSPACE COMPUTATIONAL DESIGN LABORATORY
Typical Cost Modeling1. Take empirical data from past programs.2. Perform regression to get variation with selected parameters, e.g. cost vs. weight.3. Apply “judgment factors” for your case. e.g. configuration factors, complexity factors, composite factors.There is widespread belief that aircraft manufacturers do not know what it actually costs to turn out their current products.

9/19/2002 16.885 AEROSPACE COMPUTATIONAL DESIGN LABORATORY
Cost Modeling• Aircraft is broken down into modules
– Inner wing, outer wing, …– Modules are classified by type
• Wing, Empennage, Fuselage, …
• Cost per pound specified for each module type– Calibrated from existing cost models– Modified by other factors
• Learning effects• Commonality effects
• Assembly & Integration: a separate “module”• 2 cost categories: development & manufacturing
Production run: a collection of modules

9/19/2002 16.885 AEROSPACE COMPUTATIONAL DESIGN LABORATORY
Cost Modeling
Plane
Centerbody LandingGear
Propulsion Systems FinalAssembly
Payloads
Winglet OuterWing
InnerWing
Wing
…
WeightIdentifier RC per pound
Subpartsper pound
Area
Labor Material & Equipment
Support
At this level, the degree of detail can range from e.g. “wing” to “rivet”.
NRC per pound
Tooling Engineering Other
NRC time distribution

9/19/2002 16.885 AEROSPACE COMPUTATIONAL DESIGN LABORATORY
Development Cost Data
Baseline Engr.
Baseline M.E.
Baseline Tool Design
Baseline ToolFab.
Baseline Dev. LabsBaseline QA
Baseline QA
Baseline Dev. Labs
Baseline Tool Fab.
Baseline Tool Design
Baseline M.E.
Baseline Engr.
Baseline Engr.
Baseline M.E.
Baseline Tool Design
Baseline ToolFab.
Baseline Dev. LabsBaseline QA
Baseline QA
Baseline Dev. Labs
Baseline Tool Fab
Baseline Tool Design
Baseline M.E.
Baseline Engr..
non-
dim
ensi
onal
labo
r hou
rs
non-dimensional time
Boeing data for large commercial jet

9/19/2002 16.885 AEROSPACE COMPUTATIONAL DESIGN LABORATORY
Development Cost Model• Cashflow profiles based on beta curve:
• Typical development time ~6 years• Learning effects captured – span, cost
11 )1()( tKttc
0
0.01
0.02
0.04
0.05
0.06
1 2 3 4 5 6 7 8 9 10 11 12 13 14 15 16 17 18 19 20 21 22 23 24 25 26 27 28 29 30 31 32 33 34 35 36 37 38 39 40 41 42 43 44 45 46 47 48 49 50 51 52 53normalized time
Support
Tool Fab
Tool Design
ME
Engineering
norm
aliz
ed c
ost
(from Markish)

9/19/2002 16.885 AEROSPACE COMPUTATIONAL DESIGN LABORATORY
Development Cost Model
Wing20%
Empennage9%
Fuselage37%
Landing Gear1%
Installed Engines8%
Systems17%
Payloads8%
Representative non-recurring cost breakdown by parts for large commercial jet (from Markish).

9/19/2002 16.885 AEROSPACE COMPUTATIONAL DESIGN LABORATORY
Development Cost DataFor your reference: $/lb assembled from public domain weight and total cost estimates plus representative NRC breakdown by aircraft part (see Markish).
Engineering METool
Design Tool Fab Support Totals
40.0% 10.0% 10.5% 34.8% 4.7% 100.0%
Wing $7,093 $1,773 $1,862 $6,171 $833 $17,731
Empennage $20,862 $5,216 $5,476 $18,150 $2,451 $52,156
Fuselage $12,837 $3,209 $3,370 $11,169 $1,508 $32,093
Landing Gear $999 $250 $262 $869 $117 $2,499
Installed Engines $3,477 $869 $913 $3,025 $408 $8,691
Systems $13,723 $3,431 $3,602 $11,939 $1,612 $34,307
Payloads $4,305 $1,076 $1,130 $3,746 $506 $10,763

9/19/2002 16.885 AEROSPACE COMPUTATIONAL DESIGN LABORATORY
Manufacturing Cost Model• Aircraft built modules required• Modules database
– Records quantities, marginal costs– Apply learning curve effect by module, not by aircraft
Labor Materials Support85% 95% 95%
time
9/19/2002 16.885 AEROSPACE COMPUTATIONAL DESIGN LABORATORY
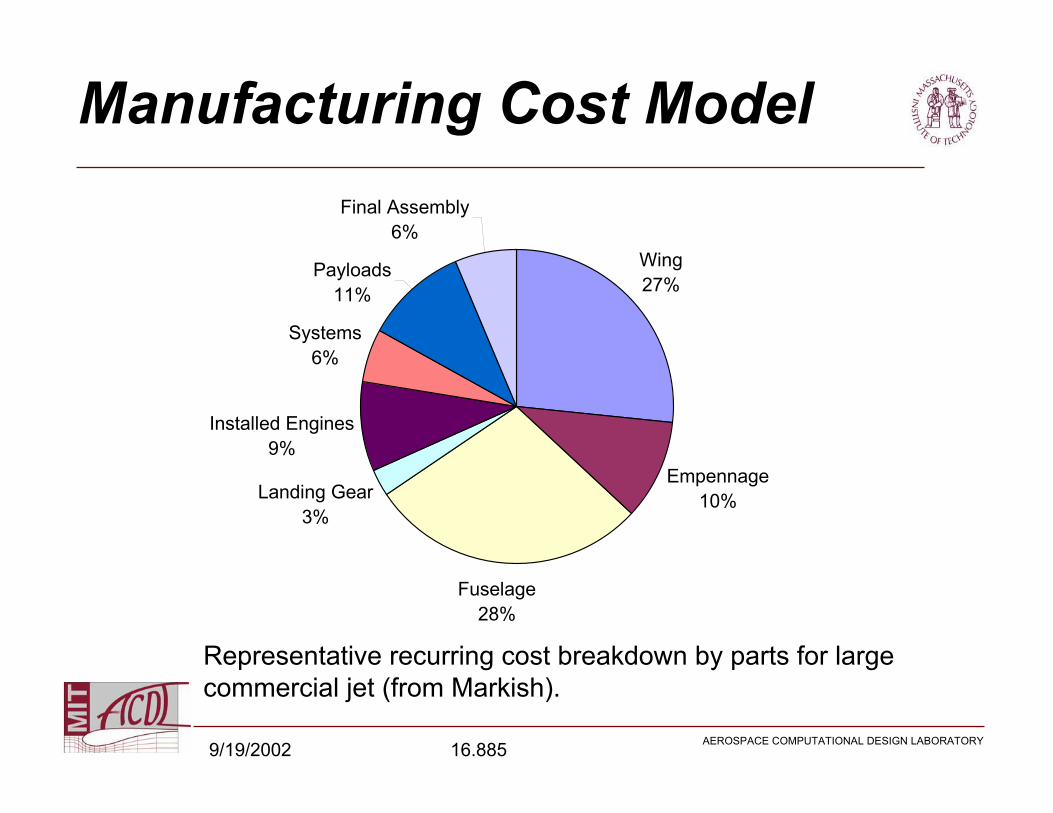
Manufacturing Cost Model
Representative recurring cost breakdown by parts for large commercial jet (from Markish).
Wing27%
Empennage10%
Fuselage28%
Landing Gear3%
Installed Engines9%
Systems6%
Payloads11%
Final Assembly6%

9/19/2002 16.885 AEROSPACE COMPUTATIONAL DESIGN LABORATORY
Manufacturing Cost DataFor your reference: $/lb values assembled from public domain weight and total cost estimates plus representative RC breakdown by aircraft part (see Markish).
Labor Materials Other Total
Wing $609 $204 $88 $900
Empennage $1,614 $484 $233 $2,331
Fuselage $679 $190 $98 $967
Landing Gear $107 $98 $16 $221
Installed Engines $248 $91 $36 $374
Systems $315 $91 $46 $452
Payloads $405 $100 $59 $564
Final Assembly $58 $4 $3 $65

9/19/2002 16.885 AEROSPACE COMPUTATIONAL DESIGN LABORATORY
NASA Cost ModelsOnline cost models available at
http://www.jsc.nasa.gov/bu2/airframe.html
e.g. Airframe Cost Model - simple model for estimating the development and
production costs of aircraft airframes- based on military jet data- correlation with empty weight, max. speed, number of
flight test vehicles, and production quantity
9/19/2002 16.885 AEROSPACE COMPUTATIONAL DESIGN LABORATORY
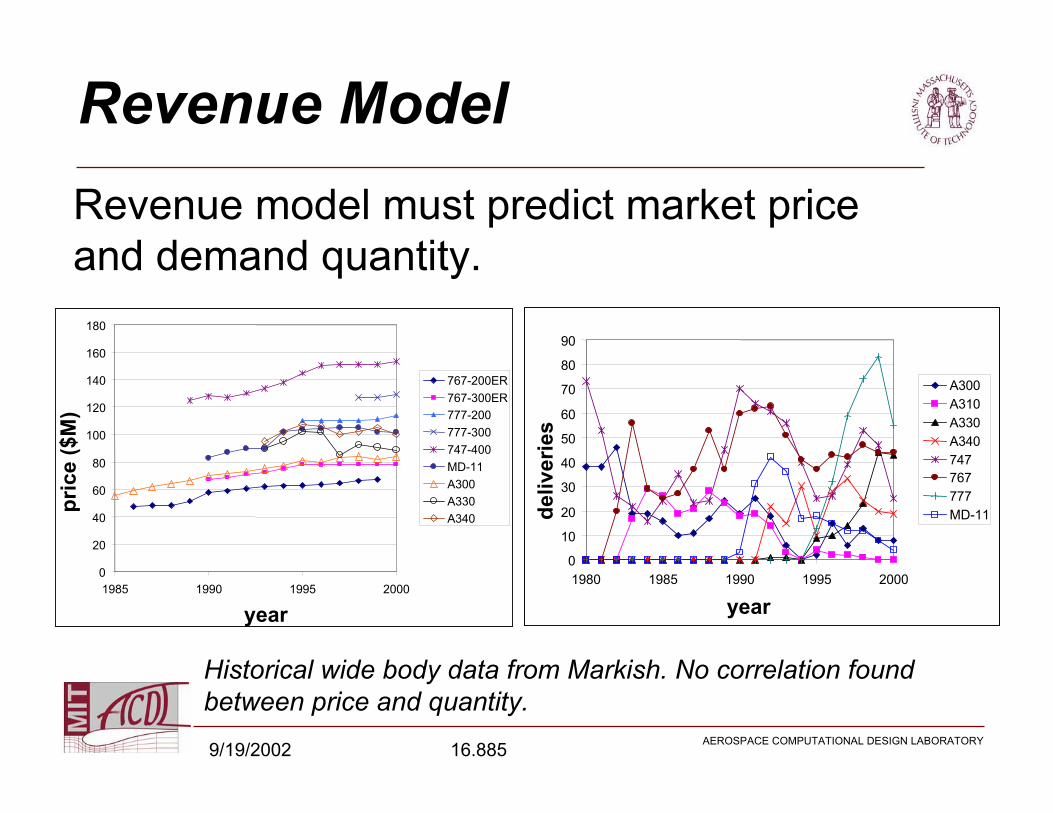
Revenue ModelRevenue model must predict market price and demand quantity.
0
10
20
30
40
50
60
70
80
90
1980 1985 1990 1995 2000
year
deliv
erie
s
A300A310A330A340747767777MD-11
0
20
40
60
80
100
120
140
160
180
1985 1990 1995 2000
year
pric
e ($
M)
767-200ER767-300ER777-200777-300747-400MD-11A300A330A340
Historical wide body data from Markish. No correlation found between price and quantity.
9/19/2002 16.885 AEROSPACE COMPUTATIONAL DESIGN LABORATORY
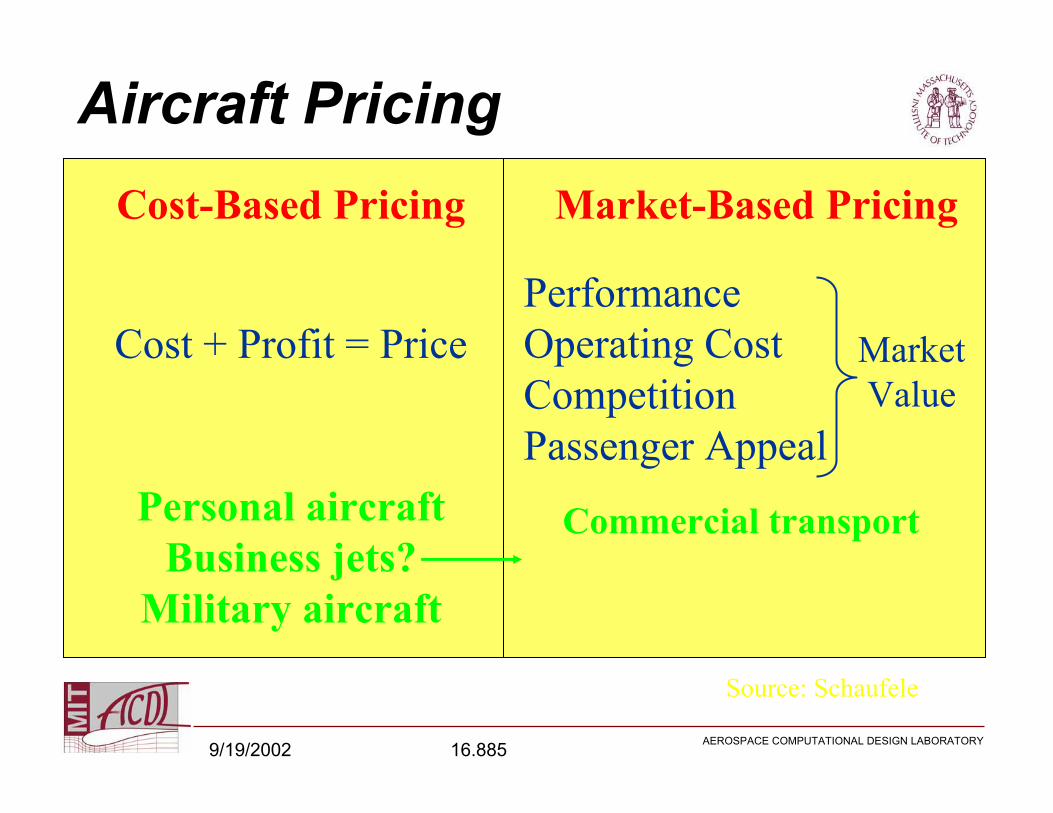
Aircraft Pricing
Personal aircraftBusiness jets?
Military aircraft
Cost-Based Pricing Market-Based Pricing
Cost + Profit = PricePerformanceOperating CostCompetitionPassenger Appeal
Commercial transport
MarketValue
Source: Schaufele

9/19/2002 16.885 AEROSPACE COMPUTATIONAL DESIGN LABORATORY
Commercial Aircraft Pricing
• Total Airplane Related Operating Costs are fairly constant.
• Aircraft price must balance CAROC.
COST/WEIGHTTRADE-OFF
CAROC
PRICE(Capital costs)
Tota
l AR
OC

9/19/2002 16.885 AEROSPACE COMPUTATIONAL DESIGN LABORATORY
Business Jet Empirical DataFigure A7 in Roskam:
AMP1989 = log-1{0.6570 + 1.4133 log WTO}
AMP1989 is predicted airplane market price in 1989 dollarsTake-off weight: 10,000 lb < WTO < 60,000 lb
BUT Gulfstream GIV and 737 BJ versions do not fit the linear trend.

9/19/2002 16.885 AEROSPACE COMPUTATIONAL DESIGN LABORATORY
Commercial Jet Empirical Data
Figure A9 in Roskam:
AMP1989 = log-1{3.3191+ 0.8043 log WTO}
AMP1989 is predicted airplane market price in 1989 dollarsTake-off weight: 60,000 lb < WTO < 1,000,000 lb

9/19/2002 16.885 AEROSPACE COMPUTATIONAL DESIGN LABORATORY
Military Aircraft Empirical Data
Figure A10 in Roskam:
AMP1989 = log-1{2.3341+ 1.0586 log WTO}
AMP1989 is predicted airplane market price in 1989 dollarsTake-off weight: 2,500 lb < WTO < 1,000,000 lb
9/19/2002 16.885 AEROSPACE COMPUTATIONAL DESIGN LABORATORY
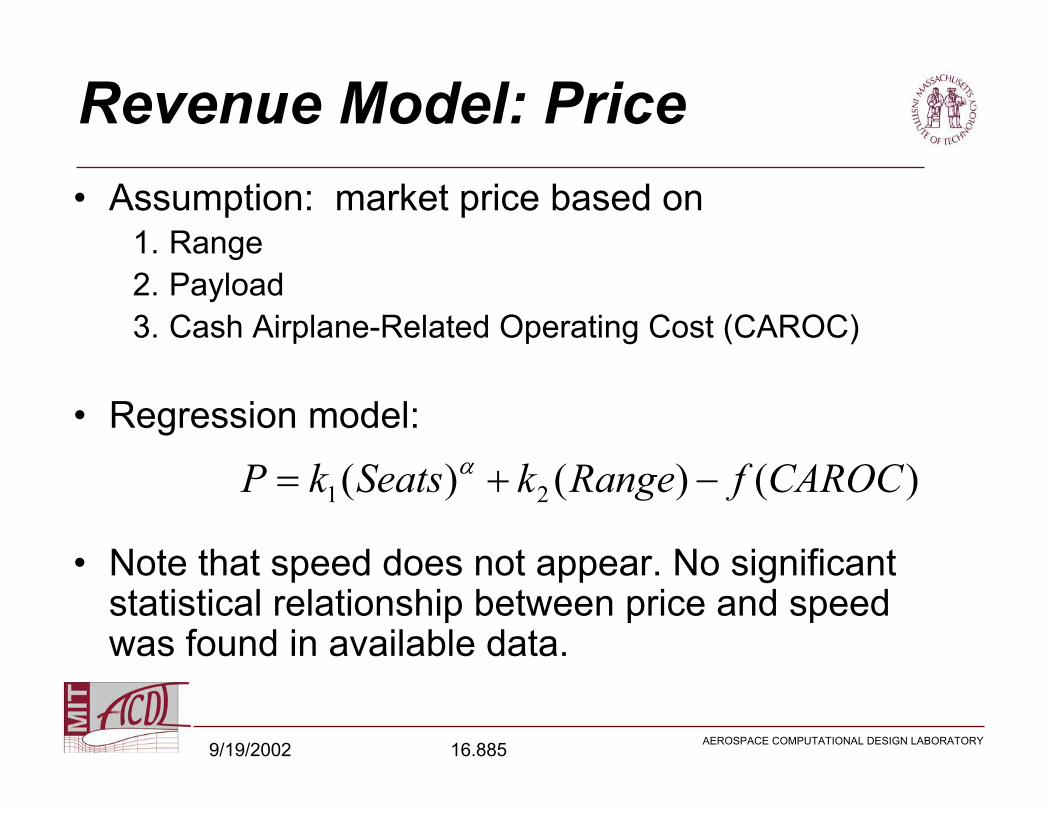
Revenue Model: Price• Assumption: market price based on
1. Range2. Payload3. Cash Airplane-Related Operating Cost (CAROC)
• Regression model:
• Note that speed does not appear. No significant statistical relationship between price and speed was found in available data.
)()()( 21 CAROCfRangekSeatskP

9/19/2002 16.885 AEROSPACE COMPUTATIONAL DESIGN LABORATORY
Revenue Model: Price
0
10
20
30
40
50
60
70
80
0 10 20 30 40 50 60 70 80
Actual price ($M)
Estim
ated
pric
e ($
M)
y=xAirbusBoeing
Narrow bodies
Estim
ated
pric
e ($
M)
Actual price ($M)
Narrow bodies:1.910.735( ) 0.427( ) ( )P Seats Range f CAROC
Model from Markish, price data from Aircraft Value News, The Airline Monitor, 2001.

9/19/2002 16.885 AEROSPACE COMPUTATIONAL DESIGN LABORATORY
Revenue Model: PriceWide bodies:
2.760.508( ) 0.697( ) ( )P Seats Range f CAROC
0
20
40
60
80
100
120
140
160
0 20 40 60 80 100 120 140 160
Actual price ($M)
Estim
ated
pric
e ($
M)
y=xAirbusBoeing
Wide bodiesEs
timat
ed p
rice
($M
)
Actual price ($M)
Model from Markish, price data from Aircraft Value News, The Airline Monitor, 2001.

9/19/2002 16.885 AEROSPACE COMPUTATIONAL DESIGN LABORATORY
Revenue Model: Quantity• Demand forecasts
– 3 sources: Airbus; Boeing; Airline Monitor– Expected deliveries over 20 years– Arranged by airplane seat category
• Given a new aircraft design:– Assign to a
seat category– Assume a
market share– Demand forecast
20-year production potential
0
500
1000
1500
2000
2500
3000
3500
4000
100 125 150 175+ 200 250 300 350 400 500+
Seat Category
Qua
ntity
Airbus
Airline Monitor
Boeing
Seat Category
Qua
ntity
9/19/2002 16.885 AEROSPACE COMPUTATIONAL DESIGN LABORATORY
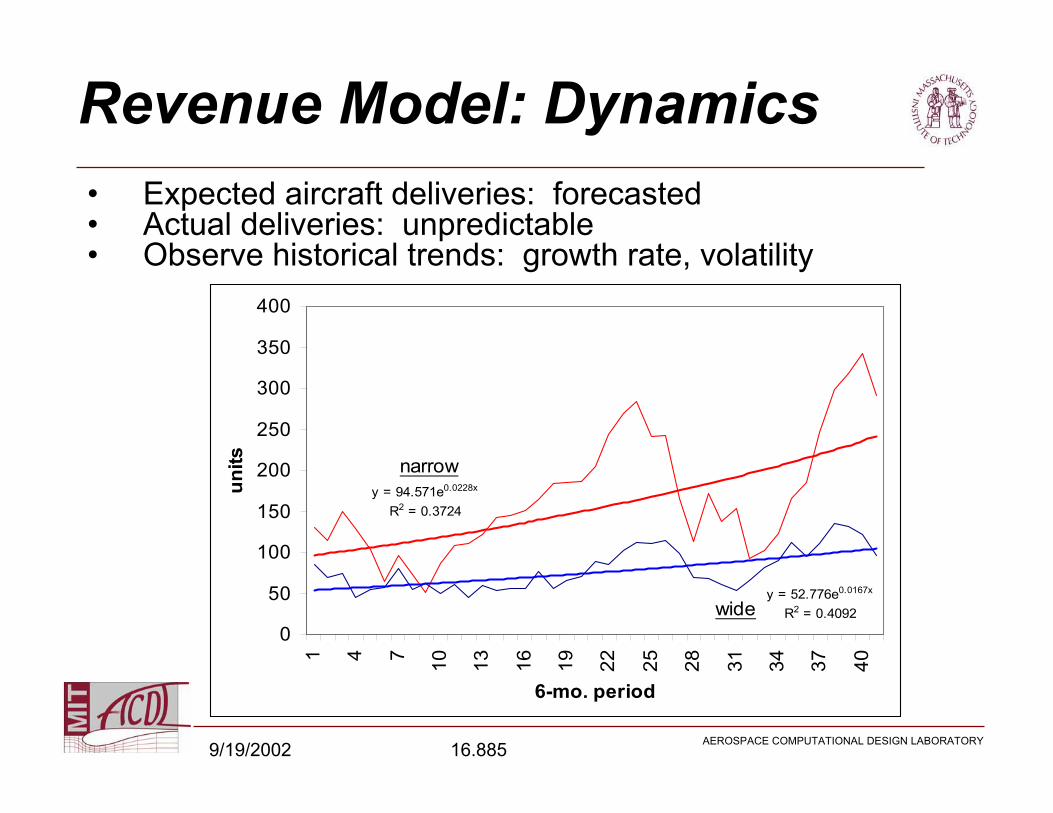
Revenue Model: Dynamics• Expected aircraft deliveries: forecasted• Actual deliveries: unpredictable• Observe historical trends: growth rate, volatility
y = 94.571e0.0228x
R2 = 0.3724
y = 52.776e0.0167x
R2 = 0.4092
0
50
100
150
200
250
300
350
4001 4 7 10 13 16 19 22 25 28 31 34 37 40
6-mo. period
units narrow
wide

9/19/2002 16.885 AEROSPACE COMPUTATIONAL DESIGN LABORATORY
Valuation TechniquesThe top 5 investor questions:• How much will I need to invest?
• How much will I get back?
• When will I get my money back?
• How much is this going to cost me?
• How are you handling risk & uncertainty?
Investment Criteria• Net present value• Payback• Discounted payback• Internal rate of return

9/19/2002 16.885 AEROSPACE COMPUTATIONAL DESIGN LABORATORY
Net Present Value (NPV)• Measure of present value of various cash flows in different
periods in the future• Cash flow in any given period discounted by the value of a
dollar today at that point in the future– “Time is money”– A dollar tomorrow is worth less today since if properly
invested, a dollar today would be worth more tomorrow• Rate at which future cash flows are discounted is
determined by the “discount rate” or “hurdle rate”– Discount rate is equal to the amount of interest the
investor could earn in a single time period (usually a year) if s/he were to invest in a “safer” investment

9/19/2002 16.885 AEROSPACE COMPUTATIONAL DESIGN LABORATORY
Calculating NPV
• Forecast the cash flows of the project over Its economic life– Treat investments as negative cash flow
• Determine the appropriate opportunity cost of capital (i.e. determine the discount rate r)
• Use opportunity cost of capital to discount the future cash flow of the project
• Sum the discounted cash flows to get the net present value (NPV)
NPV C0C1
1 rC2
1 r2
CT
1 rT
9/19/2002 16.885 AEROSPACE COMPUTATIONAL DESIGN LABORATORY
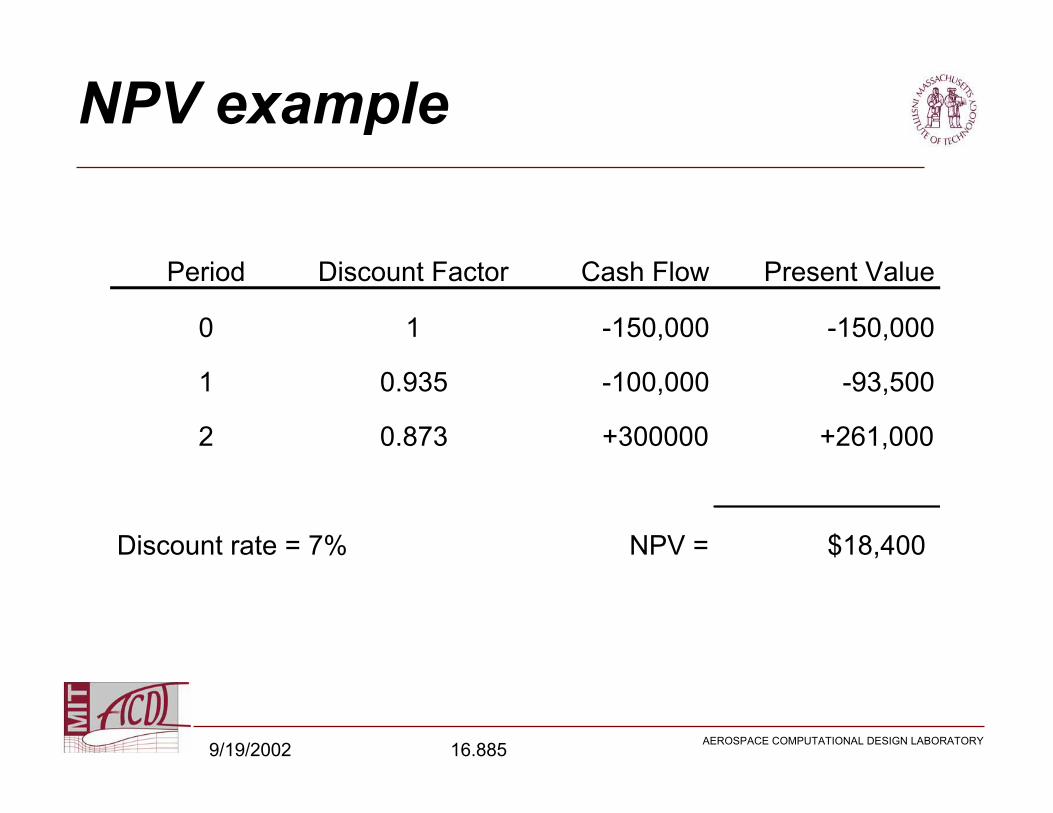
NPV example
Period Discount Factor Cash Flow Present Value
0 1 -150,000 -150,000
1 0.935 -100,000 -93,500
2 0.873 +300000 +261,000
Discount rate = 7% NPV = $18,400

9/19/2002 16.885 AEROSPACE COMPUTATIONAL DESIGN LABORATORY
Discount Rate
• One of the problems with NPV: what discount rate should we use?
• The discount rate is often used to reflect the risk associated with a project:
the riskier the project, use a higher discount rate • Typical discount rates for commercial aircraft programs:
12-20%• The higher the discount rate, the more it does not
matter what you do in the future...

9/19/2002 16.885 AEROSPACE COMPUTATIONAL DESIGN LABORATORY
Payback Period
• How long it takes before entire initial investment is recovered through revenue
• Insensitive to time value of money, i.e. no discounting• Gives equal weight to cash flows before cut-off date & no
weight to cash flows after cut-off date• Cannot distinguish between projects with different NPV• Difficult to decide on appropriate cut-off date

9/19/2002 16.885 AEROSPACE COMPUTATIONAL DESIGN LABORATORY
Discounted payback
• Payback criterion modified to account for the time value of money– Cash flows before cut-off date are discounted
• Surmounts objection that equal weight is given to all flows before cut-off date
• Cash flows after cut-off date still not given any weight

9/19/2002 16.885 AEROSPACE COMPUTATIONAL DESIGN LABORATORY
Internal rate of return (IRR)
• Investment criterion is “rate of return must be greater than the opportunity cost of capital”
• Internal rate of return is equal to the discount rate for which the NPV is equal to zero
• IRR solution is not unique– Multiple rates of return for same project
• IRR doesn’t always correlate with NPV– NPV does not always decrease as discount rate
increases
NPV C0C1
1 IRRC2
1 IRR2
CT
1 IRRT 0
9/19/2002 16.885 AEROSPACE COMPUTATIONAL DESIGN LABORATORY
Decision Tree Analysis
• NPV analysis with different future scenarios
• Weighted by probability of event occurring

9/19/2002 16.885 AEROSPACE COMPUTATIONAL DESIGN LABORATORY
Dynamic Programming• A way of including uncertainty and flexibility in the
program valuation• Key features:
• Certain aspects of the system may be uncertain, e.g. the demand quantity for a given aircraft = UNCERTAINTY
• In reality, the decision-maker (aircraft manufacturer) has the ability to make decisions in real-time according to how the uncertainty evolves = FLEXIBILITY

9/19/2002 16.885 AEROSPACE COMPUTATIONAL DESIGN LABORATORY
Dynamic Programming: Problem Formulation
• The firm:– Portfolio of designs– Sequential development phases– Decision making
• The market:– Sale price is steady– Quantity demanded is unpredictable– Units built = units demanded
• Problem objective:– Which aircraft to design?– Which aircraft to produce?– When?

9/19/2002 16.885 AEROSPACE COMPUTATIONAL DESIGN LABORATORY
Dynamic Programming: Problem Elements
1. State variables st2. Control variables ut3. Randomness
4. Profit function
5. Dynamics
• Solution:
• Solve iteratively.
)(1
1),(max)( 11 ttttttutt sFEr
ussFt
9/19/2002 16.885 AEROSPACE COMPUTATIONAL DESIGN LABORATORY
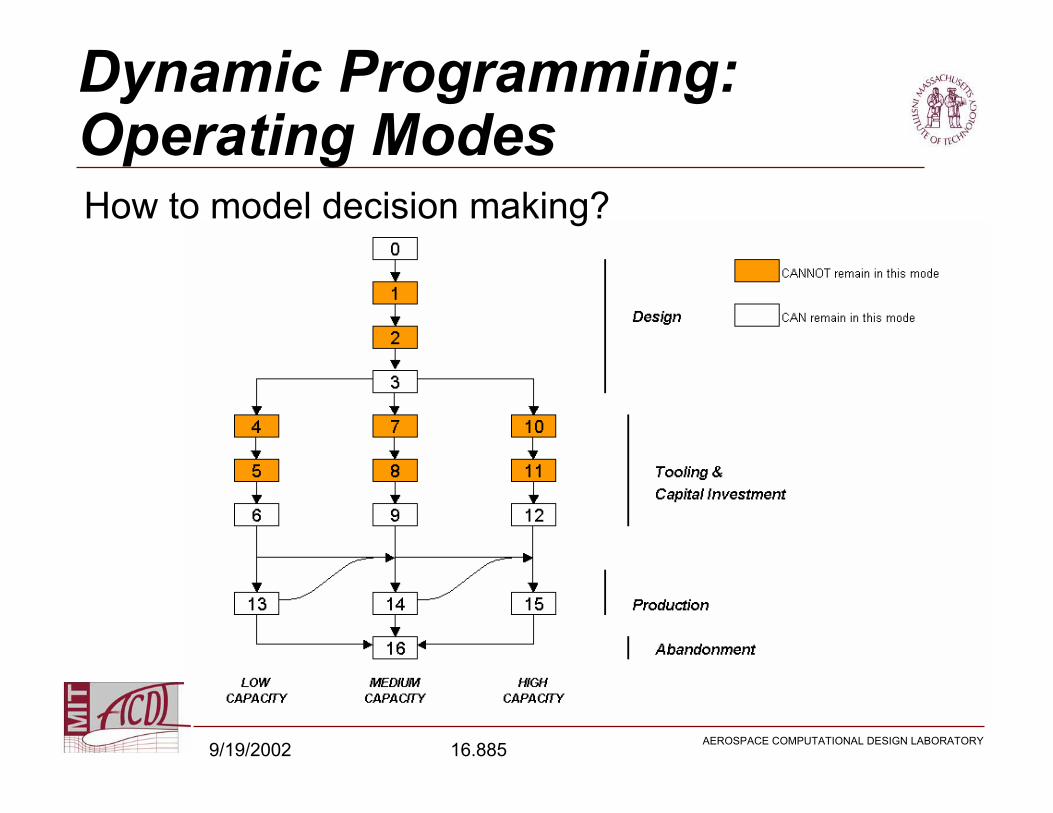
Dynamic Programming: Operating ModesHow to model decision making?

9/19/2002 16.885 AEROSPACE COMPUTATIONAL DESIGN LABORATORY
Example: BWB• Blended-Wing-Body (BWB):
– Proposed new jet transport concept
• 250-seat, long range• Part of a larger family sharing
common centerbody bays, wings, ...
Image taken from NASA's web site: http://www.nasa.gov.
9/19/2002 16.885 AEROSPACE COMPUTATIONAL DESIGN LABORATORY
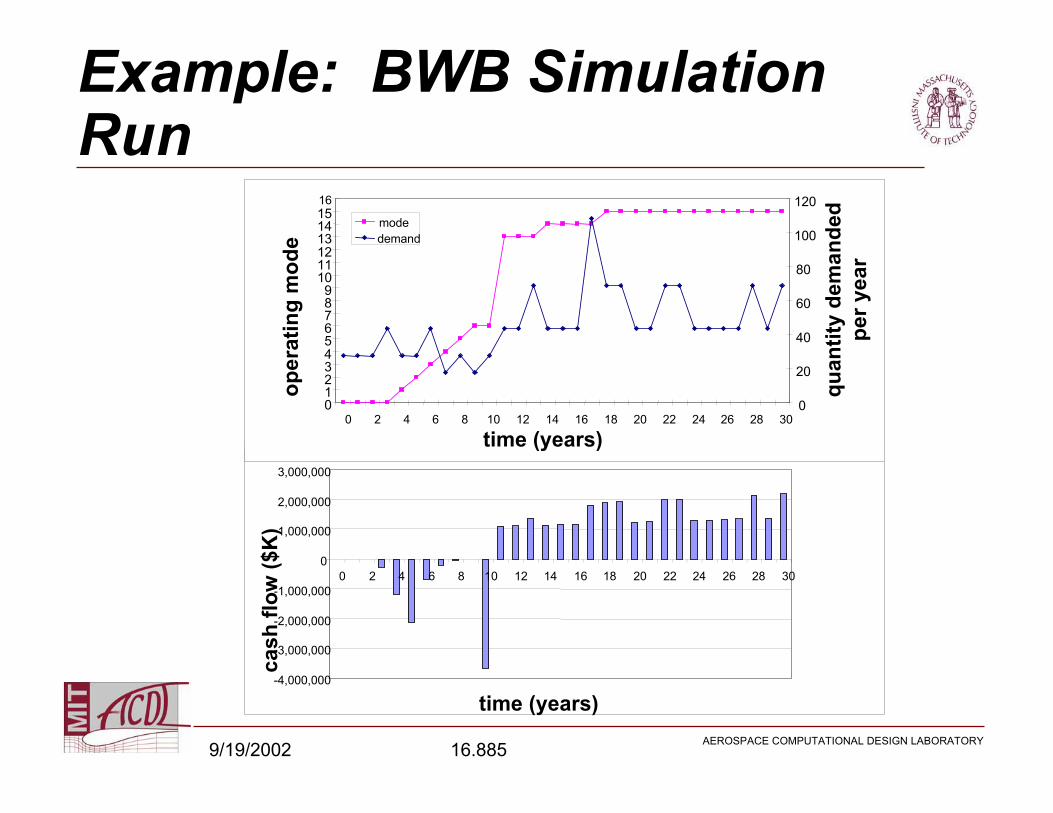
Example: BWB Simulation Run
-4,000,000
-3,000,000
-2,000,000
-1,000,000
0
1,000,000
2,000,000
3,000,000
0 2 4 6 8 10 12 14 16 18 20 22 24 26 28 30
time (years)
cash
flow
($K
)
0123456789
10111213141516
0 2 4 6 8 10 12 14 16 18 20 22 24 26 28 30
time (years)
oper
atin
g m
ode
0
20
40
60
80
100
120
quan
tity
dem
ande
dpe
r yea
r
modedemand

9/19/2002 16.885 AEROSPACE COMPUTATIONAL DESIGN LABORATORY
Example: BWB Importance of Flexibility
-10
-5
0
5
10
15
20
25
3 5 7 11 18 28 44 69 108 171 270
initial annual demand forecast
prog
ram
val
ue ($
B)
dynamic programming
Net Present Value
At baseline of 28 aircraft, DP value is $2.26B versus NPV value of $325M

9/19/2002 16.885 AEROSPACE COMPUTATIONAL DESIGN LABORATORY
ReferencesAirbus Global Market Forecast, 2000-2019. Appendix G, Detailed passenger fleet results, p. 74.Aircraft Value News Aviation Newsletter www.aviationtoday.com/catalog.htmThe Airline Monitor, ESG Aviation Services.Boeing Current Market Outlook, 2000. Appendix B, p. 42. Jane's All the World's Aircraft. London : Sampson Low, Marston & Co., 2001.Markish, J. Valuation Techniques for Commercial Aircraft Program Design, S.M. Thesis, MIT, June 2002.Markish, J. and Willcox, K. “Valuation Techniques for Commercial Aircraft Program Design,” AIAA Paper 2002-5612, presented at 9th Multidisciplinary Analysis and OptimizationSymposium, Atlanta, GA, September 2002.Markish, J. and Willcox, K., “A Value-Based Approach for Commercial Aircraft Conceptual Design,” in Proceedings of the ICAS2002 Congress, Toronto, September 2002.NASA Cost Estimating website, http://www.jsc.nasa.gov/bu2/airframe.htmlRoskam, J., Airplane Design Part VIII, 1990.Raymer, D., Aircraft Design: A Conceptual Approach, 3rd edition, 1999.Schaufele, R., The Elements of Aircraft Preliminary Design, 2000.