17-0v-01. princeton, nj. 60p
TRANSCRIPT

ED 309 178
AUTHORTITLE
INSTITUTION
SPONS AGENCY
REPORT NOPUB DATEGRANTNOTEAVAILABLE FROM
PUB TYPE
EDRS PRICEDESCRIPTORS
IDENTIFIERS
ABSTRACT
DOCUMENT RESUME
TM 013 620
Applebee, Arthur N.; And Others .
Crossroads in American Education: A Summary ofFindings. The Nation's Report Card. Report No.17-0V-01.
National Assessment of Educational Progress,Princeton, NJ.
Office of Educational Research and Improvement (ED),Washington, DC.ISBN-0-88685-085-1Feb 89NIEG-83-001160p.
National Assessment of Educational Progress,Educational Testing Service, Rosedale Road,Princeton, NJ 08541-0001.Reports - Research/Technical (143)
MF01/PC03 Plus Postage.*Academic Achievement; Computer Literacy;*Educational Quality; *Educational Trends; ElementarySchool Students; Elementary Secondary Education;Grade 4; Grade 8; Grade 11; Literature; MathematicsAchievement; Meta Analysis; *National Surveys; NorthAmerican History; Reading Achievement; ScienceEducation; Secondary School Students; *StatisticalData*National Assessment of Educational Progress; WritingAchievement
This summary report from The Nation's Report Cardoffers a synthesis of findings from recent national assessments ofAmerican education for 9-, 13-, and 17-year-old students in a varietyof subject areas. Areas covered include reading, writing,mathematics, science, American history, literature, and computercompetence. Trends in academic achievement, levels of learning, andfactors related to achievement are discussed. Since 1969, theNational Assessment of Educational Progress (NAEP) has conductedregular surveys of student proficiency in a range of subjects, eachinvolving a national sample of students; about 1.4 million studentsfrom a cross-section of grade levels have participated in theassessments to date. Findings from recent NAEP assessments provideevidence of progress in students' academic achievement. Results fromthe 1984 and 1986 assessments indicate that, on the average,students' proficiency in reading has improved; proficiency inwriting, mathematics, and science has improved in recent assessmentsfollowing earlier declines. Equity is being approached betweenminorit17 students and their white peers. Student achievement gainsare associated with time spent on homework, course rigor,participatory teaching, and supportive home environments. Thefindings also indicate a lack of significant advancement in the areaof innovative and thoughtful application of knowledge. Descriptionsof proficiency levels (levels 150, 200, 250, 300, and 350) forreading, mathematics, and science are appended in the form of sampletest items. (TJH)
t*:
U S. DEPARTMENT OF EDUCATOROffice of Educational Research and Improvement
EDUCATIONAL RESOURCES INFORMATIONCENTER (ERIC)
R/This document has been reproduced asreceived from the person or organizationoriginating rt
0 Minor changes have been made to improvereproduction guabty
Pointed view or opinions stated in ilusdocu-mint do not necessarily represent officialOERI position or policy
0
AL TESTI
2

T1,h, report \ 17 (A 01 .an hi it di rid trim tht at1141.11 ot l J11,110,11.11 it F
meting `,i!r%ti. ltoNedalt !?o,id Primt (cm \ tAt Irr err1hiil 111101
1,1hrd;\ it COligrt idtdiq t and \ wither sh it
ISII \ n 881is5 IN") I
Rtr v.rk tiplin 011,11 thiN puhlkati.n h,otd%,t, it h»rha purwent '4, (0,int s,,, \II I. s l 101 I ul !hi I hi," Ii,and 1111prAt rill Ilt II dOt '10 huruut ,ariA 101, t %it %%, thdt
1:dmational 1r ding tir n hr i an r quit ,,ppIttmit% ltirindhvi t tl rl chipl,Ai
L(///t itittMai h'st/r/t/ Sen e 7, 7s and rt tiadi null .,11.i.tdth,,t,11 TrNlinphrr ik
3

I I'.1.,7011.1.sw
ith.
Lirfiliir,71;413-'77:11:
\IT
it.7......nivIms-asuesN
rila
II ill;
ispwrin
polile.1E
06..91-1,-,5,5-0.a.,..,...
.5-
1,........Ir.
..,.....
02......,4elk,.
IE.
,1,4440111EV
iVii
lE""",
irleiMo
mis
II=
vs.r--...abea........
..4
11,11.
MO
UM
M. I
414 :RIM
II
1=11104eiliskinalianin
ink15-r.

This report is based primarily on the following NAEP reports:
The Reading Report Card. Progress Toward Excellence in Our Schools. Trends in Reading OverFour National Assessments, 1971-1984 (Princeton, NJ: National Assessment of EducationalProgress. 1985).
_
Arthur N. Applebee. Judith A. Langer, and Ina V.S. Mullis, Tice Writing Report Card. WritingAchievement in American Schools (Princeton. NJ: National Assessment of Educational Progress.1986).
John A. Dossey, Ina V.S. Mullis, Mary M. Lindquist, and Donald L. Chambers, The MathematicsReport Card: Are We Measuring Up? Tr nds and Achievement Based on the 1986 NationalAssessment (Princeton. NJ: National Assessment of Educational Progress. 1988).
Ina V.S. Mullis and Lynn B. Jenkins, The Science Report Card. Elements of Risk and Recovery(Princeton, N1: National Assessment of Educational Progress. 1988).
The following reports are also referenced:.
Arthur N. Applebee, Judith A. Langer, and Ina V.S. Mullis, Writing Trends Across the Decade(Princeton, NJ: National Assessment of Educational Progress, 1986)
Arthur N. Applebee Judith A. Langer, and Ina V.S. Mullis, Literature and US. History: TheInstructional Experience and Factual Knowledge of High-School Juniors (Princeton. NJ. NationalAssessment of Educational Progress, 1987).
Michael E Martinez and Nancy A. Mead. Computer Competence. The First National .4ssessment(Princeton, NJ: National Assessment of Educational Progress, 1988).
AcknowledgmentsMany individuals tenerouslv contributed their ideas. time and energy to implementing the l981 and 1486
assessments and generating the reports listed above Their diligent work is gratefully acknowledged as laying the
foundation for this reportFor this st. imary report. the authors express their gratitude to Lynn Jenkins. whose thoughtful reviews and
skillful editing helped bring the report to its current foi m Bev Cisnev is acknowledged for her exceptionaldedication and word-processing skills Kent Ashworth, Jan Askew. Paul Barton. Eugene Johnson. Janet Johnson. and
Archie Lapointe are also tnanked for their helpful comments on successive drafts
52 I CROSSROADS IN AMERICAN EDUCATION

ForewordEach biennial assessment for the Nation's Report Card gives us cause to reflect on the
educational progress our country has made and the directions that the results suggest willlead to sustained and even more substantive improvements. Crossroads in AmericanEducation tells us we have brought the nation's young people to a minimum standard ofliteracy they generally have mastered rudimentary reading and writir,g skills and somefundamental knowledge in mathematics and science. But very few of our young people canuse their knowledge and skills for thoughtful or problem-solving purposes, and not manycan reason at higher levels.
How can students be better prepared to apply their skills and knowledge in thoughtfulways, as will be required throughout their lives?
Aristotle made the point that "People become house builders through building houses,harp players through playing the harp." We might add that students can become thinkersand problem solvers through learning experiences that challenge them and stretch theirminds. Crossroads in American Education indicates that the typical school experience canbe strengthened with more learning opportunities that actively involve the student a
time-honored pedagogical fact with new meaning today.
Recent improvements are evident and represent significant national accomplishment.But progress falls short of what the times reqlire. Much more progress is needed for theeconomic development of our nation and the intellectual well-being of the next genera-tion.
Recent findings of the National Assessment of Educational Progress (NAEP) indicatethat:
An estimated 61 percent of 17-year-olds do not demonstrate the reading abilitynecessary to find, understand, and explain relatively complicated information,including material about topics they study in school;
More than one-quarter of 13-year-olds fail to demonstrate an adequate understandingof the content and procedures emphasized in elementary school mathematics;
In science classes, 41 percent of the 11th graders and 60 percent of the 7th gradersreport never being asked to write up a science experiment independently.
Our nation is at an educational crossroads. Education must prove that it is equal to thechallenges of technology and the information age. The success of our economy and,indeed, the survival of our democracy have become more dependent than ever before oneach individual's ability to master increasingly complex knowledge and skills.
The NAEP data presented in this report place the future of educational opportunities inthe hands of the American people: Can we be satisfied with gradual improvements in basicskills, or should we also work to ensure schooling prepares all American children for thechapmges that lie ahead of them? I believe the answer is clear.
Gregory R. AnrigPresident
Educational Testing Service
6CROSSROADS IN AMERICAN EDUCATION 1 3

CONTENTS
Overview 5
Trends in Academic Achievement 7Signs of Progress 7Signs of Equity 11
Levels of Learning 19Reading, Mathematics, and Science 19Writing 23Summary 25
Factors Related to Achievement 27Redefining Our Goals 27Emphasizing Academic Achievement 30Rethinking the Curriculum 33Providing Home Support 34Remodeling Instruction 35Conclusions 40
Appendix 42
4 I CROSSROADS IN AMERICAN EDUCATION

OVERVIEW
HIS SUMMARY report from The Nation's Report Card offers a synthe-sis of findings from recent national assessments in a variety of subjectareas, including reading, writing, mathematics, and science, as well asU.S. history, literature, and computer competence. Since 1969, the
National Assessment of Educational Progress (NAEP) has conducted regularsurveys of student proficiency in a range of subjects, each involving a nationalsample of students; some 1.4 million students from across the grades haveparticipated in the assessments to date)
Findings from recent NAEP assessments provide evidence of progress instudents' academic achievement. Results from the 1984 and 1986 assessmentsindicate that, on the average, students' proficiency in reading has improvedacross time, and proficiency in writing, mathematics, and science has improvedin recent assessments after earlier declines. In addition, there is evidence thatsome strides have been made toward equity: Gaps in average academic perform-ance that have historically existed between Black students and their White peersand between Hispanic students and their White peers have been reduced by aconsiderable margin in some subjects.
Despite these positive signs, the remaining challenges are many. Not allground lost during the 1970s and early 1980s has been regained, and there wasconsiderable concern even at the time of the first assessments about the qualityof student learning. In addition, a closer examination of the NAEP data indicatesthat recent gains in student performance have occurred primarily at the lowerlevels of achievement. For example, students have improved in their ability to dosimple computation, comprehend simple text, and exhibit knowledge of everydayscience facts. However, too few students develop the capacity to use the knowl-edge and skills they acquire in school for thoughtful or innovative purposes. Andtoo few students learn to reason effectively about information from the subjectsthey study.
' Detailed information on sampling. number and types of items. and arivation of sc.iles is presentedin each subject area report (see pag( 2).
8 CROSSROADS IN AMERICAN EDUCATION I 5

The NAEP assessments have pinpointed a number of variables that appear tobe positively related to academic proficiency. Corroborating common wis-
dom, NAEP has found that students who spend more time on homework, takemore rigorous courses, have teachers who use more participatory instructionalactivities, and who have a home environment supportive of learning generallyhave higher proficiency in various subject areas than their peers who lack thesecharacteristics. It should be noted, however, that chicken-and-egg questionscannot be answered by the NAEP data; for example, one cannot know whetherstudents with higher proficiency are more likely to seek out rigorous courses orwhether the courses themselves strengthen proficiency.
Overall, the NAEP data suggest that American education is at a crossroads.While academic achievement appears to be improving after years of decline, thecontinuing lack of growth in higher-level skills suggests that more fundamentalchanges in curriculum and instruction may be needed in order to produce moresubstantive improvements. The educational system in this country needs toextend its focus from the teaching and learning of skills and content to includean emphasis on the purposeful use of skills and knowledge. Fortunately, instruc-tional research and pedagogy point to some promising new directions fordeveloping qualitatively different approaches to teaching and learning.
6 I CROSSROADS IN AMERICAN EDUCATION9

TRENDS IN ACADEMICACHIEVEMENT
Signs of Progress
N EACH subject area it assesses, The Nation's Report Card summa-
1
1rizes trends in average proficiency for 9-, 13-, and 17-year-olds on asubject-area proficiency scale. Using these scales, it is possible to talk
_ . about subject-matter proficiency for particular subpopulations, reporttrends in performance, trace the growth of students' proficiency across age orgrade levels, and estimate the relationship between proficiency and backgroundvariables.'
Trends in the overall academic proficiency of the nation's 9-. 13-, and 17-year olds in reading (from 1971 to 1984), mathematics (from 1973 to 1986), andscience (from 1969-70 to 1986) are summarized in Figure 1. Trends in writingproficiency, which are based on performance on individual items rather thancomposite scales, are discussed later in this section. In general, students' profi-ciency in reading, mathematics, science, and writing appears to have improved inrecent assessments, v,ith gains for certain age groups in various subjects beinggreater than others. Given this common theme, however, a closer study of trendsin achievement reveals variations in the timing of declines and recoveries.
'While the scales for different subject areas are expressed in the same numerical units, they are notcomrarable. Like all other scales developed using Item Response Theory (IRT technology, tineNAEP scales cannot be described in absolute terms; thus, for example, one cannot say hov muchlearning in mathematics equals how much learning in science and reading. It should also be notedthat the terms proficiency and achievement refer specifically to performance on the items on theNAEP assessment.
1 0CROSSROADS IN AMERICAN EDUCATION I 7

Reading: 1971 to 1984
..
00
50
,
,
Age 17
.Age 13
DO
0---
Age!
3
2
2
1971 1975 1980 1984
2072 (1 1)' 209 6(0 71' 213 5 (1 1) 213 2 (0 9) Age 9253 9 (1 1)' 254 8 (0 8) 257 4 (0 9) 257 8 (0 6) Age 13284 3 (12)' 284 5 (0 7)' 284 511 1) 288 2 (0 9) Age 17
HI Extrapolated from previous ^MEP analyses
Statistically significant difference from the most recent assessment at the 05 level Standard ecru's are presented inparentheses
Reading. Students at all three ages were reading significantly better in 1984than in 1971. The reading proficiency of 9- and 13-year-olds improved steadilythrough the 1970s, then was stable from 1980 to 1984. In contrast, 17-year-olds'reading proficiency remained relatively constant across the 1970s. then improvedbetween 1980 and 1984.
8 I CROSSROADS IN AMERICAN EDUCATION T1

Mathematics: 1973 to 1986uu.
300
250
-/.
....
Age 17
.- _ _.
Age 13
..
._ . ..
1 Age 9 1
_
2001
0
.....
Science: 1969-70 to 1986'
uu
00
....
Age 17
!Age 131
50
..
.
/
*
_
Age 9. .
.. . ,.
0
0
..
3
2
1973 1978 1982 1986 1970 1973 1977 1962 1966121911(0 8) 218 6 (0 8) 219 0 (1 1) 221 7 (1 0) Age 9 1224 9 (1 211 1220 3 (1 2)) 219 9 (1 21 220 9 11 8) 224 3 (1 2)1266 01(1 1) 264 1 (11) 2686(1 1) 269 0 (12) Age 13 (254 9 (1 1)) 1249 5 (1 1)) 247 4 it I) 250 2 (1 3) 251 4 (1 4)1304 41(0 9) 300 4 (0 9) 298 5 (0 9) 302 0 (0 91 Age 17 1304 8 (1 0)1 1295 8 (1 0)) 269 6 (1 0) 283 3 (1 1)* 288 5 (1 4)
g3 Estimated population mean proficiency and 95°0 confidence intei yal It can be said with 95 percent certainty that themean proficiency of the population of Interest is within this interval
Note While 9- and 13 year-olds were assessed in the spring of 1970 17-year olds were assessed in the spring of1969
Mathematics. The mathematics proficiency of 9- and 1:3-year-olds washigher in 1986 than in the first NAM' mathematics assessment in 1973. Theperformance of 9-year-olds remained quite stable across the 1970s, then im-proved significantly from 1982 to 1986. In contrast, 13-year-olds' proficiencydeclined slightly in the mid-1970s, improved significantly from 1978 to 1982,
12CROSSROADS IN AMERICAN EDUCATION I 9

then changed little from 1982 to 1986. Seventeen-year-olds' proficiency declinedsteadily from 1973 to 1982, then showed signs of initial recovery by improvingsignificantly between 1982 and 1986.
Science. After declining in the early 1970s and changing little from 1973 to1982, 9-year-olds' science proficiency improved between 1982 and 1986, regain-ing the levels of the 1970 assessment. Trends were similar for 13-year-olds,although their average proficiency declined more and recovered less. For stu-dents at age 17, science proficiency dropped steadily from 1969 to 1982 beforeincreasing significantly from 1982 to 1986. Despite recent gains, 17-year-olds'average proficiency in 1986 remained well below that of 1970, when scienceproficiency was first measured.
Writing. An examination of trends in writing achievement between 1974and 1984 also reveals some recent improvements, although writing proficiencyacross the ages generally appeared to be no better in 1984 than it was 10 yearsearlier. The writing proficiency of 13- and 17-year-olds climbed between 1979 and1984, after declining from 1974 to 1979. Across the same decade, 9-year-olds'writing performance was somewhat more uneven, declining on some writingtasks while improving on ethers.
Astudy of the timing of declines and recoveries for each age group acrosssubject areas reveals some interesting patterns. The NAEP mathematics
results indicate that students born in 1965 declined in performance at ages 13and 17 compared to students born earlier. Further, those students born four yearslater (in 1969) showed gains at ages 13 and 17 compared to students born in1965. Thus, it appears that the recent declines and improvements at age 17 mayreflect declines and improvements made by this group of students when theywere 13, suggesting that the recent improvements at age 17 are not simply theresult of changes currently being made to strengthen high-school graduation re-quirements. Similar patterns of performance by birth-year cohorts were evidentin the science and reading assessments.
10 CROSSROADS IN AMERICAN EDUCATION

The improvements in achievement reflected in the assessment data also mayreflect the positive impact of a variety of recent efforts to reform education.Cumulatively, these efforts seem to have halted earlier declines in each subjectand begun to bring proficiency levels back to where they were in the early 1970s.
Signs of Equity
In the last 20 years, one of the major goals of educational reform has been toimprove the performance of minority populations historically at risk of schoolfailure. A variety of programs have been introduced to accomplish this goal, frompreschool and day-care programs to targeted classes providing additional instruc-tion as part of the regular school day. Given that achievement levels have begunto improve somewhat for the nation as a whole, how well have members of theseminority groups done during this period?
Figures 2A and 2B summarize trends in the performance gap between Blackand Hspanic schoolchildren and their White peers at ages 9, 13, and 17. Ingeneral, it appears that the performance gaps, as measured by differences inaverage proficiency, have narrowed across time, particularly for Black students.Decreases in the disparities in reading and mathematics performance are themost consistent among the subject areas across time, with the gap decreasinggradually, while the gaps in science performance are the least stable. For His-panic and Black students alike, the gap in science achievement relative to Whitestudents increased until 1982, before narrowing between 1982 and 1986.
14CROSSROADS IN AMERICAN EDUCATION I 11
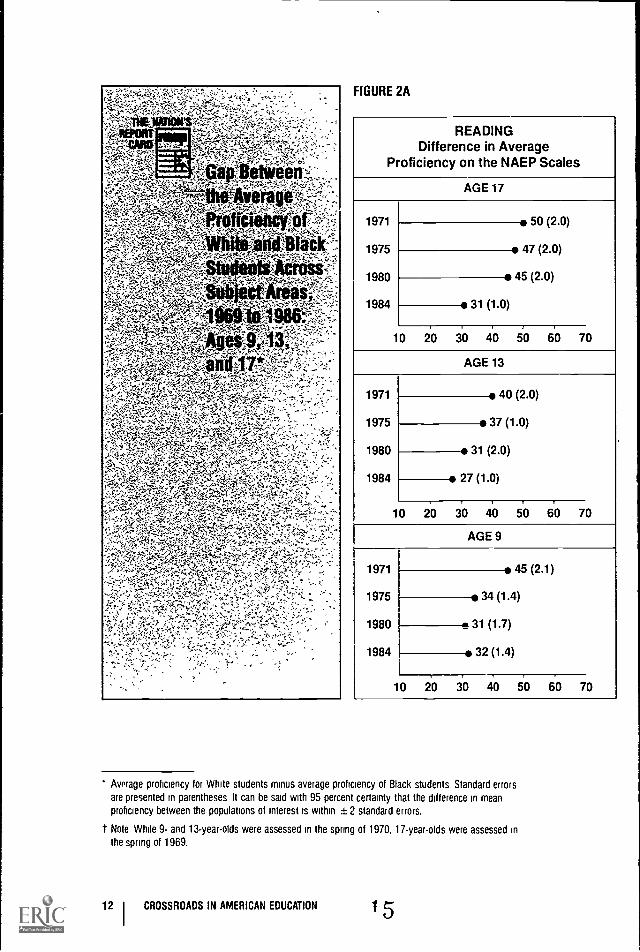
FIGURE 2A
READINGDifference in Average
Proficiency on the NAEP Scales
AGE 17
1971 50 (2.0)
1975 47 (2.0)
1980 45 (2.0)
1984 31 (1.0)
10 20 30 40 50 60 70
AGE 13
1971 40 (2.0)
1975 37 (1.0)
1980 31 (2.0)
1984 27 (1.0)
10 20 30 40 50 60 70
AGE 9
1971 45 (2.1)
1975 (1.4)134
1980 (1.7)311984 32 (1.4)
10 20 30 40 50 60 70
Average proficiency for White students minus average proficiency of Black students Standard errors
are presented in parentheses It can be said with 95 percent certainty that the difference in meanproficiency between the populations of interest is within ±2 standard errors.
t Note While 9- and 13-year-olds were assessed in the spring of 1970, 17-year-olds were assessed inthe spring of 1969.
12 I CROSSROADS IN AMERICAN EDUCATION I 5

MATHEMATICSDifference in Average
Proficiency on the NAEP Scales
AGE 17
1973 40 (1.6)
1978 37 (2.0)
1982 32 (2.0)
1986 29 (2.0)
10 20 30 40 50 60 70
AGE 13
1973 46 (2.1)
1978 42 (2.0)
1982 34 (2.0)
1986 24 (3.0)
10 20 30 40 50 60 70
AGE 9
1973 35 (1.4)
1978 32 (1.4)
1982 (1.9)29
1986 25 (1.9)
10 20 30 40 50 60 70
i
SCIENCE'Difference in Average
PrcAciency on the NAEP Scales
AGE 17
1969 54 (1.7)
1973 53 (1.7)
1977 57 (2.0)
1982 58 (2.0)
1986 45 (3.0)
10 20 30 40 50 60 70
AGE 13
1970 49 (2.5)
1973 53 (2.5)
197,7 48 (3.0)
1982 40 (2.0)
1986 38 (3.0)
10 20 30 40 50 60 70
AGE 9
1970 57 (2.1)--1973 55 (2.1)
1977 55 (2.1)
1982 42 (3.6)
1986 36 (2.2)
10 20 30 40 50 60 70
CROSSROADS IN AMERICAN EDUCATION I 13

THE NATION'SREPORT
CARD
Gap Between
the Average
proficiencyof 'White
and INpanicStudentS4cross
SulOct'Areas,1973 to 1986:
Ages 9, 13,
and 17*
FIGURE 2B
READINGDifference in Average
Proficiency on the NAEP Scales
AGE 17
1975 36 (3.0)
1980 29 (3.0)
1984 _ . 26 (2.0)
10 20 30 40 50 60 70
AGE 13
1975 30 (3.0)
1980 27 (2.0)
1984 24 (2.0)
10 20 30 40 50 60 70
AGE 9
1975 33 (2.0)
1980 31 (2.0)
1984 27 (2.0)
10 20 30 40 50 60 70
Average proficiency for White students minus average proficiency of Hispanic students Standard errorsare presented in parentheses It can be said with 95 percent certainty that the difference in meanproficiency between the populations of interest is within ± 2 standard errors
14 CROSSROAOS IN AMERICAN EOUCATION
I

MATHEMATICSDifference in Average
Proficiency on the NAEP Scales
AGE 17
1973 33 (2.4)
1978 30 (2.0)
1982 27 (2.0)
1986 24 (3.0)
10 20 30 40 50 60 70
AGE 13
1973 35 (2.4)
1978 34 (2.0)
1982 22--o (2.0)
1986 19 (3.0)
10 20 30 40 50 60 70
AGE 9
1973 23 (2.5)
1978 21 (2.0)
1982 20 (2.0)
1986 21-11 (2.0)
10 20 30 40 50 60 70
18
SCIENCEDifference in Average
Proficiency on the NAEP Scales
AGE 17
1977 35 (3.0)
1982 45 (3.0)
1986 38 (4.0)
10 20 30 40 50 60 70
AGE 13
1977 43 (2.0)
1982 32 (4.0)
1986 33 (3.0)
10 20 30 40 50 60 70
AGE 9
1977 38 (3.0)
1982 40 (5.0)
1986 33 (3.0)
1011771
20 30 40 50 60 70
CROSSROADS IN AMERICAN EDUCATION I 15

FigiifO3:Average ReadingiMatheinatictEand Science Proficiency for;White; Black, ,andMispahic Students, 1984 and 1986: Ages 9, 13, and 17*
Age17
Age13
Age9
Age17
Age13
Age9
Age17
Age13
Age9
0 175 200 225 250 275 300 325 350 500
READING
237 (1 1)
239 (1 7) I
imi11.11;kgx =s;PPZ.,..s.-',4"ti',"-fe. 1 220 (0 8)
188 (1 1)
,,:,P.,X4",e,% 193 (1 3) I
MATHEMATICS
263 (1 2)
269 (1 9)
263 (0 5)
295 (0 7)
SCIENCE
227(1 1)
253 (2 9)r is .5.I.9:;t1V4rjeAFO'iiTaia/Z- '` 259 (3 8)
274 (1 3)
4;45SIZ4VP,V$7elt.r.-5,7AC"..*:!..!,:Zlii"-.4, 259 (1 4)
226 (3 1)
222 (2 5)
14ti7317?:',01%.`17.1 232 (1 2 )
196 (1 9)
riA 199 (31)
307 (1 0)
THE NATION'SREPORT
White CARO
MI BlackHispanic
mop
"The reading assessment was conducted in 1984, while the mathematics and science assessments wee conducted in
1986 Standard errors are presented in parentheses It can be said with 95 percent certainty that the mean proficiency ofthe population of interest is within ±2 standard errors
I Standard errors are poorly estimated Interpret with caution
16 CROSSROADS IN AMERICAN EDUCATION
9

Figure 3 compares the actualproficiency levels of these three groupsin the most recent assessments ofreading, mathematics, and science.There are two things to notice fromthese results. First, for all three subjects,the performance of the two minoritygroups is noticeably below that of theirWhite peers at age 9, and the gapremains large (or in the case of sciencemay even increase) by age 17. Second, inall three subjects, the average profi-ciency levels of Black and Hispanic 17-year -olds are close to those of White 13-year -olds. This means that despiteprogress in narrowing the performancegaps, at the end of secondary school, thegaps remain equivalent to three to fouryears of additional schooling.
Although the gradual reduction of these performance gaps since 1970 is amajor accomplishment, the unfortunate truth, however, is that the performancegaps are still unacceptably large.
CROSSROADS IN AMERICAN EDUCATION
2 017

HC

LEVELS OF LEARNING
Reading,Mathematics,and Science
A131-1OUGHCIIANCES in average performance on the NAEP scales orin distributions across years or ages indicate improvements ordeclines in achievement, the numbers on the scales were set to spanthe range of student performance and say nothing themselves about
what students actually know and can do within any particular curriculum area.To give the results meaning and to provide information on what students can andcannot do in each subject. NAEP has attempted to generalize from student per-formance on assessment questions and to describe the accomplishments repre-sented by five anchor points on the scale 150, 200, 250, :300, and 350. (Fewstudents performed at he extreme ends of the scale that is, from 0 to 150 andfrom 350 to 500.) To anchor each of the scales, NAEP began by empiricallyselecting items that discriminated between pairs of adjacent proficiency levels.These items were batched for the five levels, and subject-area exrerts were thenasked to interpret the items and describe what students at each level could dothat students at the lower levels could not.
Table 1 gives a brie; characterization of achievement at each proficiencylevel for reading, mathematics, and science and shows the percentages of stu-dents performing at or above each level in the most recent assessment of thesethree subjects. More detailed descriptions of proficiency at each anchor pointand examples of the items are contained in the appendix.
22CROSSROADS IN AMERICAN EDUCATION
I "

Table 1: Percentages of Students at or Above Proficiency Levelson the NAEP Scales, 1984 and 1986: Ages 9, 13, and 17*
500
350
300
250
200
150
0
READING: 1984
LevelDescription
Can synthesize and learnfrom specialized readingmaterials.
Can find, understand,summarize, and explainrelatively complicatedinformation.
Can search for specificinformation, interrelate ideas,and make generalizations.
Can comprehend specificor sequentially-relatedinformation.
Can carry out simple,discrete reading tasks.
ElementarySchool(Age 9)
MiddleSchool
(Age 13)
HighSchool
(Age 17)
0 (0.0) 0 (0.3) 5 (0.2)
1 (0.1) 11 (0.4) 39 (0.8)
18 (0.6) 60 (0.8) 84 (0.7)
64 (0.9) 95 (0 3) 99 (0.1)
94 (0.4) 100 (0.0) 100 (0.0)
-MATHEMATICS:'-1
esOlption
Can solve,mutti- step:;basic;
Can computeand:percent
reddijnize,godnietdd:figni:eiLand'iolv4 mequations
and diVide.ifsing wholenumbirt,-,
Can add ifid,sniiradt-,!-twck1fgifilglil.lifirnOtl.-recognize platinn#hilitamong
KnOirs some basinadditionand subtractidn fads:
F*4'1
The numerical values on the 0-500 NAEP scales were established on the basis of student performance inthe 1984 reading, 1986 mathematics, and 1986 science assessments to describe relative performance
within those specific subject areas Each scale was set to span the range of student performance in thatsubject-area assessment (e g , about half of the middle-school students will per form above 250 and abouthalf will perform below 250)
20 I CROSSROADS IN AMERICAN EDUCATIONU

73.(1:5)-.., 96 (0A)
01810:2i 100 (0.0 ) 100 (0.0)
SCIENCE: 1986
LevelDescription
Can infer relationships anddraw conclusions usingdetailed scientific knowledge
Has some detailedscientific knowledgeand can evaluate theappropriateness ofscientific procedures.
Understands basicinformation from thelife and physical sciences.
Understands some basicprinciples, for example,simple knowledge aboutplants and animals.
Knows everyday sciencefacts.
ElementarySchool(Age 9)
MiddleSchool
(Age 13)
HighSchool
(Age 17)
0 (01) 0 (0.1) 7 (0.6)
3 (0.4) 9 (0.7) 41 (1.4)
28 (1.0) 53 (1.4) 81 (1.2)
71 (1.0) 92 ;0,9) 97 (0.4)
96 (0.3) 100 (0.1) 100 (0.1)
Therefore, any given numerical level on the reading scale is not equivalent to the same level on the science
scale or mathematics scale However, the desrriptions of student performance at the five dnchur point, oneach scale do provide some basis for discussing the range of student per formanLe d.oss the three
Subjects Standard errors are presented in parentheses
CROSSROADS IN AMERICAN EDUCATION I 21
4
THE NATIONSREPORT

Because it is similar to comparing apples and oranges, One cannot use theNMI' scales to determine how much learning in reading equals the same amountof leaning in mathematics or science: thus, any given numerical level on thereadmf scale is not equivalent to the same level on either the science or themathematics scale. However, the descriptions of student performance at the fiveanchor points do provide some basis for discussing the range of student perform-ance across the three subjects. and they must carry the burden fur determiningthe educational significance of the results.
For example. in reading, 6 percent of the 9-year-olds cannot cam out simplereading tasks: these students would seem to be at particular risk for future
failure in school. Further, the results raise important questions about hmv wellstudents can comprehend the range of academic material they are likely toencounter in school. For example. the failure of 61 percent of the 17-year-olds todemonstrate the ability to find. understand, summarize, and explain relativelycomplicated information, including material about topics they study in school.suggests that most students leaving secondary school do not have the compre-hension skills often needed in the worlds of higher education. business. orgovernment.
In mathematics. one-quarter of the seventh and eighth giadersreprescnt-ing the performance of more than three-quarters of a million studentsmay notpossess the skills in whole-number addition, subtraction, multiplication, anddivision necessary to perform everyday tasks. Similarly, given that many studentsare exposed to decimals, fractions, and percents as well as to basic geometry andalgebra in middle and junior high school, one would expect to see a higher per-centage of students at age 13 and particularly at age 17 demonstrating successwith these kinds of tasks. The fact that nearly half of the 17-year-olds do notappear to have command of these mathematical skills has serious implications.For example. these students nearing graduation are unlikely to he able to matchmathematical tools to the demands of various problem situations that permeatelife and work.
Results for science achievement are equally discouraging, Only about one-half of the 13-year-olds appear to have a grasp of the basic elements ofscience:without, a better foundatior in their middle-school years, these students willlikely be unprepared to take more advanced courses as they progress throughhigh school.
or022 I CROSSROAOS IN AMERICAN EOUCATION

Further, a majority of 17-year-olds faded to demonstrate an ability to analyzescientific procedures and data. This suggests that school science is not helpingthem learn to use what they arc being taught to evaluate the appropriateness ofprocedures or to interpret results. Considering the high demand for skilledtechnological personnel in our nation's work force. these results are particularlytroublesome. While approximately 40 percent of the nation's high school s!ridents have a moderate understanding of stience. only 7 percent have any degreeof sophistitted understanding of the subject.
Writing
Table 2 presents levels of writing proficiency across the grades on thevarious types of writing tasks included in the most recent assessment. In
each case, the table displays the results fur the items on which the students didbest. Unlike the results in reading, science, and mathematks. the writing resultsare provided as the percentage of students performing various types of writingtasks at or above "minimal" and -adequate" levels. Students writing at theminimal level recognized some or all of the elements needed to complete thetask, but did not manage these elements well enough to assure that the purposeof the task would he achieved. Adequate responses included the information andideas critical to accomplishing the underlying task and wet e Lonsidered likely tobe effective in achieving the desired purpose.
At grade 4. most students perfotmed at or above a minimal level on imagina-tive tasks and reporting information. but fewer were able to write even minimalpieces in response to analytic and persuasive (refuting) tasks. Writing profit iencyat the eighth-grade level was somewhat more discouraging. Although more thanthree-quarters of these middle Slhool students wrote ..t or above a minimal levelon all but one persuasive task sivcifically. a task asking students to refute anopposing positionrelatively low percentages of students wr, .e adequate responses to most of the tasks provided.
.1111.1111111.11MINIMI
CROSSROADS IN AMERICAN EDUCATION I 23
6
E NAM

-Table 2:11,1gliest Percentage otpudents-Performingve,the-MinimalandAdegOateLeveleon
iiifltiriting tasks; 1984: Grades 4, 8, and 11*
MINIMAL ADEQUATEType of Task Grade 4 Grade 8 Grade 11 Grade 4 Grade 8 Grade 11
INFORMATIVE
ReportintFrom personal experience
Care for pets 73 (1 1) 89 (0 8) 2 (0 4) 19 (1 2)Job Application 81 (1 1) 65 (1 2)
From given information
Describe Science Project 85 (1 0) 41 (1 4)Order Tshirt 85 (0 9) 67 (1 1)Describe House 87 (1 0) 59 (1 2)
Analytic:From personal information
Explain MusicPreference 53 (1 3) 80 (1 0) 81 (1 0) 2 (0 4) 8 (0 6) 7 (0 7)
From given informationCompare Frontier Food
to Today's Food 40 (1 4) 81 (1 1) 85 (0 6) 2 (0 4) 18 (1 3) 25 (1 2)
PERSUASIVE
Convincing Others:
Capture Spaceship 67 (1 7) 23 (1 3)Dissect Frogs 85 (0 7) 18 (1 0) -Change School Rule - 90 (0 8) 22 (1 1)
Refuting an Opposing View:Travel with Aunt May 49 (1 3) 25 (1 2)Visit Radio Station 71 (1 2) 33 (1 0)Borrow Uncle's Car 74 (1 0) 24 (0 9)
IMAGINATIVE
Ghost Story 81 (1 1) 89 (0 7) 88 (0 6) 8 (u 8) 37 (1 3) 48 (1 0)
`Standard errors are presented in parentheses
24 CROSSROADS IN AMERICAN EDUCATION 2 7

Deficiencies in writing skill that are evident in the eighth-grade resultsappear to worsen at the eleventh-grade level. Most high-school juniors performedat or above a minimal level in response to the types of writing tasks provided:however, the percentages of students able to write at or above an adequate levelfell far short of expectations. More than half of the students at grade 11 wroteadequately in response to informative tasks based either on personal experience(65%) or infcrmation provided (59%).
Slightly less than half wrote adequately in response to imaginative tasks. Yetless than one-third of these high-school students performed adequately on any ofthe other types of tasks provided. The results suggest that a vast number ofstudents nearing high-school graduation do not have a sufficient command ofwritten language to move beyond straightforward explication and communicate areasoned point of view.
Summary
Although most students appear to have learned the basics in core subjectareas, the discrepancy between curricular goals and actual performance in thesesubjects widens as students progress through school. For example, a considerablepercentage of 9-year-olds (approximately one-third) could ,iot yet read simpletexts, and approximately one-quarter did not have beginning skills and under-standings in mathematics (e.g., could not subtract with regrouping), and did notunderstand simple scientific principles (e.g., those pertaining to the structureand function of plants and animals).
Thirteen-year-olds fell even farther behind expected levels of performance.In mathematics, more than one-quarter of these middle-school students failed todemonstrate an adequate understanding of the content and procedures empha-sized in elementary school; moreover, a majority (84 percent) did not display agrasp of mathematics material generally introduced during the seventh and
CROSSROADS IN AMERICAN EDUCATION I 25

eighth grades. In reading. 40 percent of the middle-school students could notread passages at an intermediate level of difficulty. In science. only half of thesestudents displayed an understanding of basic scientific information. Finally, whilemost middle-school students could write a report based on personal experience.only slightly more than half demonstrated that they could use writing in aminimal way to persuade others or analyze information.
Because the achievement of high-school students reflects in part the finalproduct of our K -12 education system. the profile of what America's high-schoolstudents appear to know and are able to do is particularly disturbing. Sixty-onepercent of the 17- year -old students could not read or understand relativelycomplicated material. such as that typically presented at the high-school level.Nearly one-half appear to have limited mathematics skills and abilities that golittle beyond adding, subtracting. and multiplying with whole numbers. Morethan one-half could not evaluate the procedures or results of a scientific study.and few included enough information in their written pieces to communicatetheir ideas effectively. Additionally. assessment results in other curriculum areasindicate that high-school juniors have little sense of historical chronology. havenot read much literature. and tend to be unfamiliar with the uses and potentialapplications of computers.
These cumulative findings provide us with a great deal of food for thought.For example, if so many students are unable to perform relatively difficult
tasks in their academic subjects, why are they not doing equally poorly in theirclasses? One possible reason for the difference between NAEP performance andclassroom grades may be that students regard the assessment as incidental totheir lives, and therefore are less engaged in these tasks than is usual in everydayclass or real world experiences.
Yet other possibilities for the discrepancies may be that evaluation criteriagenerally used in subject classrooms are based on learning objectives differentfroul those of NAEP. that teachers are unsophisticated evaluators of performance.that school performance standards are low, or that institutional goals have tendedto support and reinforce the teaching and learning of less difficult concepts andskills to the neglect of those that are more challenging. Recent reports havetended to support this last contention. and if this is so, the goals. materials. andmethods of instruction may need to be reformulated.
26 CROSSROADS IN AMERICAN EDUCATION2 9

FACTORSRELATED TOACHIEVEMENT
Redefining Our Goals
THESE DATA suggest a remarkable consistency across recent assess-ments of student achievement in various academic subjects. By andlarge, students are learning the basics, and Black and Hispanic stu-dents are closing the historical gap in performance with their White
peers. Yet despite these signs of progress, it remains true that only some of thenation's students can perform moderately difficult tasks and woefully few canperform more difficult ones. As shown in Figure 4, most of the gains in averageproficiency represent improvements in basic skills and knowledge rather thanhigher-level applications. It appears that while students are acquiring basicinformation in core subject areas, they are not learning to use their knowledgeeffectively in thinking and reasoning.
CROSSROADS IN AMERICAN EDUCATION I 27
30

Reading: 1971 to 1984
THE NATION'SREPORT
CARD
Figure
Changes
TimePercentage
Students
Above
Points
NAEP
Ages
and 17*
Across
of
at or
the
LEVEL350-
300-
250-
200-
150-
Can synthesize and learnfrom specialized readingmaterials.
Age 17Age 13Age 9
Can find, understand, sum-marize, and explain relativelycomplicated information
Age 17Age 13
Age 9
Can search for specificinformation, interrelate ideas,and make generalizations
Age 17Age 13
Age 9
Can comprehend specificor sequentially-relatedinformation
Age 17Age 13Age 9
Can carry out simple,discrete reading tasks
Age 17Age 13
Age 9
0(04)0(0 0)0(0.0)
4 (1.1)
6 (1.4)
ijin'T.'
4:
in the
Anchor
on
Scale:
9, 13,
2 (14)
0 (0 1)2 (0.6)
(1 5)(0.8)
3
3
2 (0.3).2(0.6)
0 (0 0)0 (01)
3 (0 6)
1 1 i 1 1
6 5 4 3 2
1
1
1
0 1
I I
2 3I
4
I
5I
6 7 8
LOSS GAIN
Standard errors are presented in parenthesesIt can be said with 95 percent confidence that the percent difference is within ± 2 standard errors
28 CROSSROADS IN AMERICAN EDUCATION

Mathematics: 1973 to 1986
4 4 (0.6)
4(0.4)4 (1.4).
10oivssOnkhasic-aild,ition'"iulitractidrificts"
0(0.0)0(0.0)
1. (0.3)
8 (1.9)
-I IIII 1111111 I6 5 4 3 2 1 0 1 2 3 4 5 6 7 8 6 5 4 3 2 1 0 1 2 3 4 5 6
LOSS GAIN
Science: 1969-70 to 1986
Can infer relationships anddraw conclusions usingdetailed scientific knowledge.
Age 17 1 (0 6)Age 13 1 (0.2)Age 9
Has some detailedscientific knowledge.
Age 17Age 13Age 9
2 (1 2)
Understands basic infor-mation from the lifeand physical sciences
Age 17 1 (1 4)Age 13Age 9
Understands some basicprinciples, for example,simple knowledge aboutplants and animals
Age 17 1 (0 4)Age 13Age 9
Knows everydayscience facts
Age 17Age 13Age 9
0 (0.0)
0 (0.2)
0 (1 6)
1 (1.2)4 (1.8)
6 (1.1)
0 (01)1 (01)
3 (0.6)
3 (1.5)
LOSS
CROSSROADS IN AMERICAN EDUCATION I 29
GAIN

In one sense, schools across the country can be congratulated for havingreversed the negative trends in academic achievement evident during the
1970s. But while schools have been working to right the ills of yesterday, theground rules have been changing. Across grades and subject areas, learning basicfacts and procedures is no longer considered sufficient.' Rather, there are new ex-pectations for successful academic learning at all ages; students are expected tobe capable of using knowledge for purposes that require them to go beyondreciting facts and displaying the routines they have been taught. However, it isin these very areas that students show the least improvement across assessmentsand may even be losing ground. To fulfill these new expectations, students acrossthe grades need to engage in activities that require them to apply, extend, andevaluate what they are learning and to relate new learning to what they alreadyknow.
Even at present, however, schools are not all alike and students are nottaught the same things at the same times. There isa great deal of variation acrossschools in the emphasis on academic achievement and in patterns of coursework, teaching practices, and materialsall of which are likely to have an impacton students' academic proficiency. Thus, in addition to studying achievementpatterns, the NAEP assessments also have gathered information about thecharacteristics of differing learning environments and their associations withstudent achievement. The analyses do not reveal the underlying causes of theseassociations, which may be influenced by a number of different factors. There-fore, the results are most useful when they are considered in the context of otherknowledge about the educational system, such as trends in instruction, changesin the school-age population, and societal demands and expectations.
Emphasizing Academic Achievement
Recent calls for educational reform have stressed the importance of provid-ing students with an environment in which academic achievement is valued andsupported. These proposed reforms have included calls for more homework,higher standards for performance, and more course work in traditional academicsubjects. As part of its recent assessments, NAEP has asked students about thecourses they have taken and about the amount of homework they do for eachcourse. Across all subject areas assessed, there have been clear and consistentrelationships between student reports about homework and coursework and theiroverall levels of subject-area proficiency.
'William J Bennett. American Education ,Vaktng It Worli IlVashington. D C . U S. Department ofEducation. April 1988)
National Commission on Excellence in Education-1 Nation Risk 1Washington. D C. 1983)
30
I
CROSSROADS IN AMERICAN EDUCATION Q3
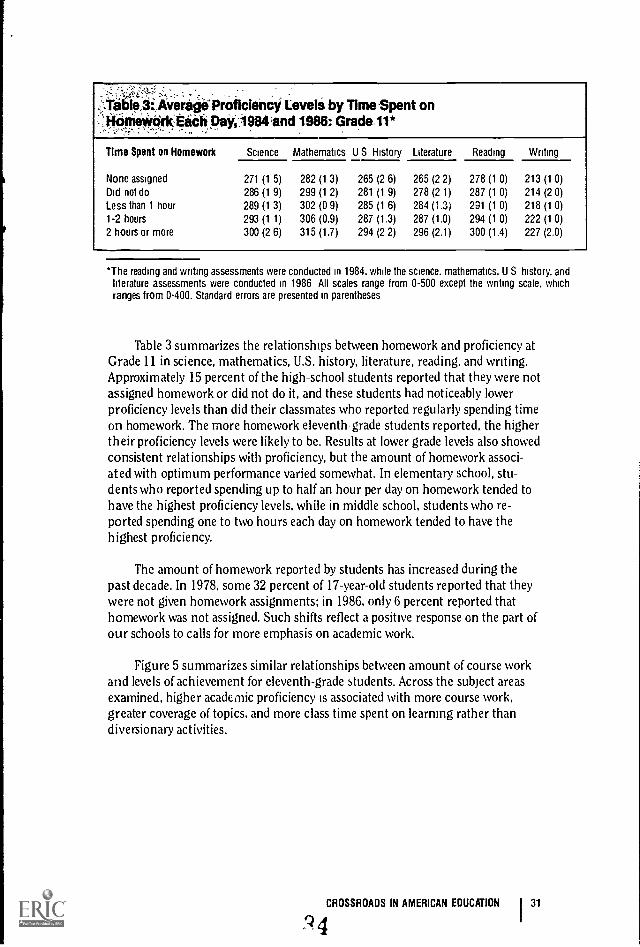
nie*Ork4o1i PaY,1984and 1986; Grade.11*ProficiencY Levels by Timepent on
,.
Time Spent on Homework Science Mathematics U S History Literature Reading Writing
None assigned 271 (1 5) 282 (1 3) 265 (2 6) 265 (2 2) 278 (1 0) 213 (1 0)
Did not do 286 (1 9) 299 (1 2) 281 (1 9) 278 (2 1) 287 (1 0) 214 (2 0)
Less than 1 hour 289 (1 3) 302 (0 9) 285 (1 6) 284 (1.3) 291 (1 0) 218 (1 0)
1-2 hours 293 (1 1) 306 (0.9) 287 (1.3) 287 (1.0) 294 (1 0) 222 (1 0)
2 hours or more 300 (2 6) 315 (1.7) 294 (2 2) 296 (2.1) 300 (1.4) 227 (2.0)
*The reading and writing assessments were conducted in 1984, while the science. mathematics, U S history, andliterature assessments were conducted in 1986 All scales range from 0-500 except the writing scale, whichranges from 0-400. Standard errors are presented in parentheses
Table 3 summarizes the relationships between homework and proficiency atGrade 11 in science, mathematics, U.S. history, literature, reading, and writing.Approximately 15 percent of the high-school students reported that they were notassigned homework or did not do it, and these students had noticeably lowerproficiency levels than did their classmates who reported regularly spending timeon homework. The more homework eleventh-grade students reported, the highertheir proficiency levels were likely to be. Results at lower grade levels also showedconsistent relationships with proficiency, but the amount of homework associ-ated with optimum performance varied somewhat. In elementary school, stu-dents who reported spending up to half an hour per day on homework tended tohave the highest proficiency levels, while in middle school, students who re-ported spending one to two hours each day on homework tended to have thehighest proficiency.
The amount of homework reported by students has increased during thepast decade. In 1978, some 32 percent of 17-year-old students reported that theywere not given homework assignments; in 1986, only 6 percent reported thathomework was not assigned. Such shifts reflect a positive response on the part ofour schools to calls for more emphasis on academic work.
Figure 5 summarizes similar relationships between amount of course workand levels of achievement for eleventh-grade students. Across the subject areasexamined, higher academic proficiency is associated with more course work,greater coverage of topics, and more class time spent on learning rather thandiversionary activities.
CROSSROADS IN AMERICAN EDUCATION
4I 31
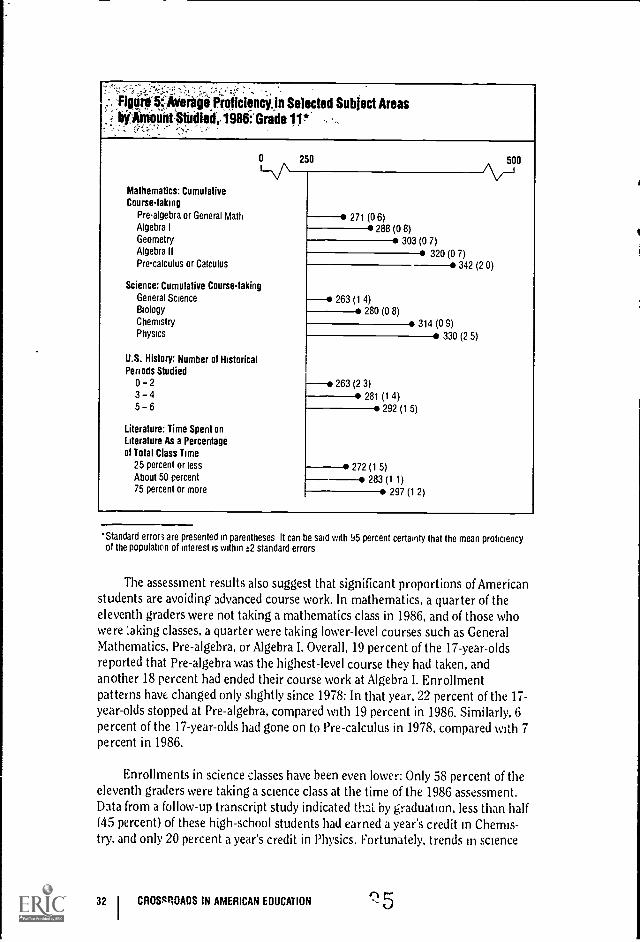
erateProilclencitn Selected Subject Areas'AnidUitt*udlert,. 1S116: Grade 11*
0 250
1\/11130Mathematics: CumulativeCoursetaking
Prealgebra or General Math 271 (0 6)Algebra I 8)288 (0Geometry (0 7)303Algebra II 7)320 (0Precalculus or Calculus 342 (2 0)
Science: Cumulative CoursetakingGeneral Science 263 (1 4)Biology 280 8)(0Chemistry 314 (0 9)Physics (2 5)330
U.S. History: Number of HistoricalPeriods Studied
0 2 263 (2 3)3 4 281 4)(1
292 5)5 6 (1
Literature: Time Spent onLiterature As a Percentageof Total Class Time
25 percent or less 272 (1 5)About 50 percent 283 1)(1
75 percent or more 2)297 (1
'Standard errors are presented in parentheses It can be said with 95 percent certainty that the mean proficiencyof the population of interest is within ±2 standard errors
The assessment results also suggest that significant proportions of Americanstudents are avoiding advanced course work. In mathematics, a quarter of theeleventh graders were not taking a mathematics class in 1986, and of those whowere taking classes, a quarter were taking lower-level courses such as GeneralMathematics, Pre--algebra, or Algebra I. Overall, 19 percent of the 17-year-oldsreported that Pre-algebra was the highest-level course they had taken, andanother 18 percent had ended their course work at Algebra I. Enrollmentpatterns have. changed only slightly since 1978: In that year, 22 percent of the 17-year -olds stopped at Pre-algebra, compared with 19 percent in 1986. Similarly, 6percent of the 17-year-olds had gone on to Pre-calculus in 1978, compared with 7percent in 1986.
Enrollments in science classes have been even lower: Only 58 percent of theeleventh graders were taking a science class at the time of the 1986 assessment.Data from a follow-up transcript study indicated that by graduation, less than half(45 percent) of these high-school students had earned a year's credit in Chemis-try, and only 20 percent a year's credit in Physics. Fortunately, trends in science
32 I CROSRROADS IN AMERICAN EDUCATION r-,.! 5

course-taking appear to be on the rise; the mean number of full-year sciencecourses taken by graduating seniors was 2.6 in 1987. compared to a mean of 2.2in 1982.4
Rethinkingthe Curriculum
Although many educators argue that increased course-taking is essential tostrengthen students' academic proficiency, simply increasing the amount ofcourse work is likely to be insufficient to bring proficiency up to expected levels.There are other aspects of the educational system that must also be addressed.For example, curricular reforms may be warranted. In science, curriculum in theUnited States nas frequently been criticized as a "layer cake" in which studentsstudy different areas in isolation and then leave them behind for the rest of theirschool career. Even if they take science every year, American schoolchildren whopass through this layer-cake curriculum fare relatively poorly compared withtheir peers in other developed nations, where the work of each year builds uponand extends the work of the previous year.' The argument againsta layer-cakecurriculum in science can also be applied to other subject areas. In many cases,the curriculum is treated as a collection of discrete content areas in whichteachers move from one topic to another in lockstep fashion. As a result, lessonsare often developed in isolation from one another and fail to help students relatetheir new learnings to what they already know.
There have been many calls for a more integrated approach to contentlearning in other major subject areas, as well. For example, mathematics
educators propose that mathematics instruction be more highly integrated, withlinkages between areas of study (e.g., geometry and algebra) made more explicitin the classroom. History educators have emphasized the value of teaching
' Westat, inc. Preliminary data from the 1987 High School Transcript Study 119881.
' International Assouation for the Evaluation of Educational Achievement.S( fence Ichlevement inSeventeen Countrze. Prehnnnary Report New York. NY. Teachers College, Columbia Univerqty.19881,
Q 6 CROSSROADS IN AMERICAN EDUCATION I 33

students to think more about the process of historical inquiry rather than simplythe chronology of events. -id reading and writing educators have called for theintegration of reading and writing across the curriculum. Each of these ap-proaches may hold promise for helping more students reach higher levels ofsubject-matter proficiency. And it is only after attaining these higher levels thatstudents will have learned both the content knowledge and skills of their subjectand the ability to use these for a range of purposes.
Providing Home Support
Closely related to high and consistent academic expectations at school is theextent to which expectations at home place a similar emphasis on academicsuccess. NAEP assessments have asked students about levels of parental educa-tion, the availability of books and other reading materials at home, and theamount of attention the family gives to student schoolwork. Responses to thesequestions have shown consistent relationships between home support andacademic achievement: The more encouragement and resources provided athome, the more likely students are to do well in school.
Such findings are predictable, yet they should serve as a reminder thatattempts to improve student achievement may work best if they do not
proceed in isolation but rather involve a working partnership between home andschool. The roots of learning may begin at home, and the influence of the homeon educational achievement cannot be underestimated. Children are more lilyto be successful learners if their parents or care-givers display an interest in whatthey are learning, provide access to learning materials, and serve as role modelsinterested in their learning experiences.
Not all homes can provide this support, however. At times, the languagespoken at home or the educational background or the job demands of parents orother adults mitigate against close involvement in students' learning. Further,the educational goals and practices of schools sometimes conflict with those ofthe communities. When schools and communities \vork together, however, theycan develop support systems that greatly benefit student learning.' For example,
Shirley I3rice Heath. Itims II 1th Words (Cambridge Cambridge rmversity Press. 14831.
34 I CROSSROADS IN AMERICAN EDUCATION 2 7

when students use their mathematical knowledge to count stock and calculateexpenses in a local store, collect social histories of elderly neighbors, conduct asurvey of languages spoken in a neighborhood, or meet in a community-basedcomputer center where adults and students learn new skills together, they puttheir subject-matter learning to use while also strengthening home and commu-nity support for learning. Teachers, schools, and school districts can initiate suchcollaborations with individual community members, as well as with local com-mercial, civic, and religious associations and organizations.
Remodeling Instruction
NAEP has gathered information on instructional approaches in severalsubject areas using a variety of questions addressed to students and their teach-ers. Although students lack the technical vocabulary that their teachers use todiscuss instruction. their perceptions are useful in understanding overall empha-ses. When teacher and student reports are compared. the pattern that emerges isconsistent: Most students' school experiences are dominated by memorization ofcontent presented by teacher or textbook, and by the practicing of skills inworkbook or ditto exercises. Students are given limited opportunities to applyknowledge and procedures for new purposes.'
Across subjects, the most frequently-used instructional approaches thatstudents report are teacher presentations to the class as a whole, textbookreading, and the completion of individual exercises presented in workbooks ordittos (See Table 4). In mathematics classes, particularly at the lower grade levels,these are joined by board work, with teachers or students completing exerciseswhile others watch. Such patterns of inst.- iction most often reflect a classroomcontext in which the goals of instruction rest on discrete facts and isolated shillsrather than on a growing body of reasoned knowledge.
Instructional practices that encourage students to use their knowledgeeffectively are much less frequent. Table 5 summarizes student reports from thewriting, mathematics, science, and U.S. history assessments about activities thatare likely to develop students' ability to use their newly acquired knowledge.
Arthur N Applebee. Judith A Langer. and Edward Ilaertel. Polity and Pratwe in (L. It aL hing ofWriting. Explorations of the NAEP Database' (Palo Alto Stanton! t nivel sth. hint ItSS)Ind VS. MUMS and Lynn R. Jenkins. The Sc lent t' ReP011 Card Elements (a Ri+A and Re( oven,(Princeton, NJ National Asse+Nment of 1:)-cational Pnigre++. 19Stii
' Sn CROSSROADS IN AMERICAN EDUCATION I 35

,
Table 4: Percent Of Students Reporting Daily or WeeklyUse of Traditional Telobing Practices, 1984 and 1986*
Mathematics
Elementary School Middle School High School
Teacher explains a math lesson 95 (1 1) 97 (1 0) 94 (1 4)
Teacher works a board problem 90 (1.8) 96 (1 6) 94 (1 5)
Work a board problem. 61 (1 8) 53 (1 9) 47 (1 6)
Use workbook or ditto 81 (2 1) 61 (2 0) 46 (1 8)
Use math textbook 94 (1 7) 94 (1 9)
Science
Teacher lectures 70 (1 7) 88 (1 5)
Read science textbooks 60 (2 3) 82 (2 2) 70 (1 7)
U.S. History
Use textbook 89 (1 7)
Memorize information 64 (1 1)
Teacher lectures 97 (1 0)
Writing
When reviewing papers. teachercomments on grammar, spelling,
and punctuation at least half of
the time 84 (2 0) 74 (1 6) 67 (1 9)
' The writing assessment was conducted in 1984. while the mathematics, science, and U S history assessments were
conducted in 1986, The mathematics and science data represent students in grades 3, 7, and 11. the LI S history
data represent students in grade 11. and the writing data represeht students in grades 4, 8, and 11 Standard errors
are presented in parentheses
Although the activities (Idler across subject areas. a pattern is nonethelessdisLernible: Relatively small proportions of students are regularly asked by theirteachers to engage in small group work, perform laboratory experiments, preparereports. or engage in projects that provide experience in problem solving. Even inscience classes, where laboratory work is a common instructional activity. 41percent of the eleventh graders and 60 percent of the seventh graders reportedthat they were never asked to write up a science experiment independently.Further. it should be noted that only about half of the seventh-grade scienceteachers and one-third of the eleventh-grade science teachers reported havingaccess to laboratory facilities.
Recent calls for more emphasis on varied and participatory instructionalapproaches assume that students who are given more opportLmities to use their
Q 0
36
I
CROSSROADS IN AMERICAN EDUCATION

;Table,6Percent of Students Reporting Participationin,Classroom Activitles-that Encourage Use ofKno *ledge and Procedures, 1984 and 1986*
MathematicsElementary School Middle School H,nh School
Work problems in small groups 47 (1 6) 35 (1 8) 41 (2 0)Make reports or do projects 19 (1 2) 13 (0 9)Do math lab activities 23 (1 2) 18 (1 2)School has calculators for math 15 (1 1) 21 (1 6) 26 (1 9)Use a computer to practice math 39 (2 4) 22 (1 5)
ScienceDo experiments 67 (2 0)
Do experiments alone 50 (1 5) 54 (1 5)Do experiments with other pupils 69 (2 2) 82 (2 1)
Write up experiment 40 (1 9) 59 (2 2)Do oral or written report 53 (1 6) 54 (2 2) 49 (1 6)Use a computer to do science problems 9 (1 0) 11 (09)
U.S. HistoryWrite long reports 32 (1 1)
Small group work 57 (1 4)Individual protects 59 (1 4)
WritingTalk with classmates about paper 51 (1 7) 64 (1 7) 0 (1 8)
The writing assessment was conducted in 1984, while the mathematics, science, and U S history assessments were
conducted in 1986 The mathematics and science data represent students in grades 3. 7. and 11, the ti S historydata represent grade 11 students only and the writing data represent students in glades 4.8. and 11 Standard errorsare presented in parentheses.
newly acquired technical knowledge and skills will reach higher levels of prof'ciency in their subject. NAM) data do not provide tests of such causal explana-tions. but they do permit examining associations between proficiency and the useof various instructional techniques. Figures 6A and 613 summarize findings fromthe literature and science assessments on the relationship between students'proficiency and the types of instructional activities they reportedly engage in.
The two scales are not identical because different questions were askedabout the teaching of each subject; however, a common pattern is evident.Students who report participatory and varied instructional practices in scienceand literature classes tend to have higher proficiency levels than their peers inless exploratory classrooms. Again however, it must be cautioned that the NMI'data do not permit addressing questions of cause and effect.
4 CROSSRO!.23 IN AMERICAN EDUCATION
I "

Figure 6kRelationshipBetween Litera-
ture Proficiencyand Varied
InstructionalPractices, 1986:
Grade 11*
500
300
250
200
Grade 11
o\LOW MEDIUM HIGH
274 (1 4) 291 (1 4) 292 (12) Grade 11
Students' reports on the number of different approaches and topics of discussion used by their teachers
E Estimated population mean literature proficiency and 95°0 conti, ence interval It can be said with 95 percent certaintythat the mean liteiature proficiency of the population of interest is within this interval
The use of calculators in mathematics instruction has the potential tosubstantially change traditional methods of instruction.' In 1986, NAP:1) askedstudents a number of questions about calculator use at home and at school.Some 97 percent of the eleventh-grade students reported that they or theirfamilies owned a calculator, but only 26 percent indicated that their school had
National Council of Teat tors of ;,1atherm.tics. Inc . 'Cum, ul J Evaluation Standards forSchool Matfmnatics- (Reston. VA National Council of Tea Mathematics. 1987)
38 I CROSSROADS IN AMERICAN EDUCATION 41

c eitc
listicientra*dim
mu
I Gradell I100
250
200
,
1 Cade 7 I
LOW MEDIUM HIGH
244 (1 4) 251 (0 9) 253 (1 7) Grade 7270 (2 8) 291 (1 5) 297 (1 5) Grade 11
Students' reports on how often they solved se'ence problems conducted experiments alone or with other studentswrote up the results of experiments read articles on science and presented oral or written reports
fi3 Estimated population mear science proficiency and 95°,, confidence interval It can be said with 95 percent certaintythat the mean science proficiency of the population of interest is within this interval
calculators available for use in mathematics classes. Between one-half and two-thirds of the students reported that they used calculators in doing homework,checking answers, performing routine calculations, solving problems, or takingtests. As with the use of varied approaches in literature and science, students whoreported more use of calculators showed consistently higher mathematicsprolitiency than did students who reported less use; however, it cannot bedetermined from the data whether calculator use strengthens proficiency orwhether more proficient students simply have greater exposure to instructionthat requires or encourages calculator use.
"9CROSSROADS IN AMERICAN EDUCATION
I "

Conclusions,
In general, this synthesis of students' achievement and the environments inwhich they learn suggests that we are at an educational crossroads, and a com-prehensive change en route can have an extensive impact on the future ofstudent learning. A number of implications that arise from the composite ofreports discussed here can be particularly informative. When school and homevariables support academic achievement, students are more likely to be academi-cally successful. Simply emphasizing academic learning, however, may not beenough to ensure that students develop both subject-area knowledge and theability to use that knowledge effectively. Most classrooms are relatively traditionalin their approaches to instruction, relying heavily on teacher presentations,textbooks, and workbook- or teacher-prepared exercises. Such patterns ofinstruction appear to have been successful in helping large numbers of studentsattain basic levels of proficiency in each subject area, but they do not seem tohaN.'e been successful in helping students to achieve higher levels of performance.
For these qualitatively different gains to occur. the goals of instruction needto be reconsidered. Teaching decisions were once guided by a hierarchy suggest-ing that students must first learn the facts and skills and later learn to applythem. Yet many educators now recognize the limitations of this stepping-stoneview of education. Educational theory and research suggest a different pattern ofgenerative teaching and learning, where learning content and procedures andhow to use this learning for specific purposes occur interactively.' Students learninformation, rules. and routines while learning to think about how these operatein the context of particular goals and challenges in their own lives. When stu-dents engage in activities that require them to use new learning, both theirknowledge of content and skills and their ability to use them develop productivelytogether.
For more thoughtful learning to occur, teachers will need to orchestrate abroader range of instructional experiences than they presently use, providingstudents with opportunities to prepare for. review, and extend their new !eat rung.
Shirley Brice heath. Rays Rith Words (Cambridge. Cambridge rmversity Press. 1983)Judith A. Langer and Arthur N Applehee "Reading and Writing Instruction Toward a Theory ofTeaching and Learning" Review of Research in Education 1311986) pp 171-91Lev Vygotsky. Thought and Language (Cambridge. The MIT Press. 1987)
"40 CROSSROADS IN AMERICAN EDUCATION J

Such activities might include, but not be limited to. the whole class discussions.workbooks, and dittos that prevail today. Discussion teams, :ooperative workgroups, individual learning logs, computer networking, and other activities thatengage students as active learners will need to be added. -Ind may even predomi-nate. Using these new approaches will require teachers to move away fromtraditional authoritarian roles and, at the same time, require students to give upbeing passive recipients of learning. Instead, teachers will need to act more asguides, and students more as doers and thinkers. Some examples of this alterna-tive mode of instruction can be found in current discussions of smal, groupproblem-solving experiences, collaborative learning, activity-based learning, andinstructional scaffolding.'''
Since tests and grades send messages to students about what is valued intheir course work, the focus of tests also will need to shift. Instead of simplydisplaying their knowledge of facts and rules, students will need to show thatthey can think about and use their knowledge. A number of alternative assess-
ment procedures have been suggested. For example, in course work. portfolios ofselected work, simulations. problems, or cases can be used as the basis forassessing students' knowledge and abilities.
In shor, extensive modifications in curriculum and instruction may berequired to expand the range of learn; g experiences available to students atschool. These modifications will undoubtedly be difficult, requiring changes inestablished procedures and traditions in the curriculum and in systems ofevaluation; however. it is apparent that fundamental changes may be needed tonelp American schoolchildren develop both content knowledge and the ability toreason effectively about what they know skills that are essential if they are totake an intelligent part in the worlds of life and work. Such changes will involvereshaping current notio.is of the goals of instruction, the roles of teachers andstudents, the language of instruction, the nature of instructional activities andmaterials, the signposts teachers use to know that they have been successful intheir professior . and the evidence policyrnakers, administrators, parents, and thegeneral public use to know that schools are doing their job and that students artlearning.
Ed; icators eerys.iiere have the opportunity to use the NAEI' results to greatadvantageby reflecting upo,,, the deeply entrenched beliefs. policies, andbehaviors that in- pede the very changes we wish to makeand setting a chartedcourse for change.
I" Elizabeth Collin, De:rgning Group Rork StrGlegtei for the Heterogeneous Claismoni (New York,NY: Teachers College Press, 1986).
Judith A. Langer and ,\rthur N .1nplebee. 'Reading and Writing Instruction Tonar(' Theory ofTeaching and IA rnir4," Review of Research in Education 13 (1986). pp. 171-94Lauren Resnick, Educc, lion and Learning to Think (Washington. 1)C. National Academy Press,1987).
d4 CROSSROADS IN AMERICAN EDUCATION I 41

APPENDIX
Descriptions of ProficiencyLevels for Reading, Mathematics,and Science
This appendix contains descriptions of five levels of proficiencyLevels 150,200, 250, 300, and 350developed on the basis of student performance onNAEP's Reading, Mathematics, and Science scales. For each subject area, alimited number of sample items are also provided to illustrate each level ofproficiency. Readers interested in obtaining more detailed information shouldrefer to the most recent reports, which are listed on page 2.
LEVELS OF. READING/PROFIC
Level 150 Rudimentary Skills and Strategies
Readers who have acquired rudimentary reading skills and strategies canfollow brief written directions. They can also select words, phrases, or sentencesto describe a simple p.cture and can interpret simple written clues to identify acommon object. Performance at this level suggests the ability to carry out simple.discrete reading tasks.
Here is a puzzle See if you can solve it
This is something that usually has four legs and that you cansit on It can be made of wood or metal Most people haveseveral of these in their homes Some are soft, and some arehard You usually sit on one of these when you sit down to eat
What is this?
0 A chairB A horseC A pillowD A mushroom
E I don't know
42 CROSSROADS IN AMERICAN EDUCATION
5

Level 200 Basic Skills and Strategies
Readers who have learned basic comprehension skills and strategies canlocate and identify facts from simple informational paragraphs. stories, and newarticles. In addition, they can combine ideas and make inferences based on short,uncomplicated passages. Performance at this level suggests the ability to under-stand specific or sequentially related information.
Read the following article and answer the questions based on it
What Is Quicksand?Quicksand can swallow a pig, or a human, or even an elephantQuicksand often looks like plain wet sand But it is really a soupy
sand with so much water between the grains that you can't stand on itIf you step into quicksand, you will slowly sink up to your knees If
you thrash and squirm, you will sink deeper and deeper. But if you lieflat on your back with your arms stretched out, you can float on thesand, as you can float in water.
Watch out for quicksand on sand bars, on the bottoms of streams, oralong sandy seacoasts.
You can test for quicksand by poking it with a long stick or pole Ifthe sand shakes and quakes, don't try to walk on it' It may be quicksand
According to the article, how can you test to see if sand is reallyquicksand?
A Stick your hand into itB Step lightly on it
Poke it with a stickD Look at it.E I don't know.
What is quicksand?
A Wet sand you can walk on0 Soupy sand you can't surd enC Sand that forms clouds m the wineD Dry sand which flows quickly through your fingers
E I don't know
©U CROSSROADS IN AMERICAN EDUCATION I 43

Level 250 Intermediate Skills and Strategies
Readers with the ability to use intermediate skills and strategies can searchfor, locate, and organize the information they find in relatively lengthy passagesand can recognize paraphrases of what they have read. They can also makeinferences and reach generalizations about main ideas and author's purpose frompassages dealing with literature, science, and st.cial studies. Performance at thislevel suggests the ability to search for specific information, interrelate ideas, andmake generalizations.
Read the article How and answer the questions based on it
Boxball
Have you ever heard of the National Boxball Association, the LosAngeles boxball team, or Karcem Abdul-Jabbar, the famous boxballplayer? Or have you ever heard of boxball at all? Well, it is the gamethat almost was
Today we call the game basketball, of course, but it almostbecame known as boxball When Dr James A Naismith, a teacherat the International YMCA Training School in Springfield,Massachusetts, first invented the game in 1891, he had no name forit He had simply made up a sport that all his students could emovone that could be played indoors by both boys and girls and w as notas rough as football
Dr Naismith wanted his students to experiment with the newgame, but he first had to find the right kind of ball and two boxesHe decided to have the players use a leather soccer ballabouttwenty-eight inches aroundto toss into the goals He then askedMr Stebbins, the building superintendent, to fine two boxes thathad openings about nine inches acrosswide enough for the soccerball But Mr Stebbins could not find the right-sized wooden boxesanywhere, and as the time for the first game came nea-, there werestill no goals hanging from the gymnasium balcony Dr Naismithfinally decided to use two peach baskets that were handy After all,he reasoned, it was only a trial game, boxes could always be founalater to replace the temporary baskets
When the first game finally began, the players enjoyed thechallenge of shooting the soccer ball at the peach baskets andearning a point each time the ball went into the basket 1 he peachbaskets did present a bit of a problem, however, since each time agoal was made, someone had to climb a ladder and retrieve the ballbefore the grase could continue After a few games, someone finallyrealized that the bottoms of the baskets could be cut out to allow,the ball to fall through
Naismith had simply called his invention "a new game," butnecausc of the peach-basket goals, it soon became known as
44 CROSSROAOS IN AMERICAN EDUCATIONzi 7

basketball Fortunately, those peach baskets were never replacedwith wooden boxes as the inventor had originally planned What adifference it would have made had Mr Stebbins been able to findwooden boxes for that very first game' Instead of basketball, boxballwould be one of the most popular sports of all time
Who invented the game of basketball?
0 A Massachusetts teacherB A YMCA studentC A building superintendentD A Los Angeles player
E I don't know
What is the purpose of the article?
A To explain the rules of basketball
B To describe how much fun boxbail can beTo tell how basketball was invented
D To give a history of outdoor sports
E I don't know
We can tell from the article that which of the followingstatements is true?
A Basketball was invented before football0 Football was invented before basketballC Soccer was invented before footballD Soccer and football were invented at the same time
E I don't know
Why were the bottoms cut out of the peach baskets that werebeing used for goals?
A To make it easier for the players to score pointsB Because the bottoms of baskets were wearing outC Because the baskets were too small
0 To make it easier to continue the game
E I don't know
11 8
CROSSROADS IN AMERICAN EDUCATION
I "

Level 300 Adept Skills and Strategies
Readers with adept reading comprehension skills and strategies can under-stand complicated literary and informational passages, including material abouttopics they study at school. They can also analyze and integrate less familiarmaterial and provide reactions to and explanations of the text as a whole. Per-formance at this level suggests the ability to find, understand, summarize, andexplain relatively complicated information.
Read the story below and answer the questions based on it.
Throwing the javelinThe scent of honeysuckle seemed to linger in the air and joined
itself with the sweet (lir of freshly cut grass. I slipped out of mybright red sweats and flung them to the base of the tree. I picked upthe javelin, stuck point down in the turf. The cross which hungabout my neck swung back and forth as I stretched any arms withthe javelin behind my neck. Out of habit, I stop' and held thejavelin in my left hand, and with the thumb of my right forced smallclumps of dirt from the tip. I searched for a target. Picking a spot ina cloud moving towards me I cocked the javelin above any shoulderand regulated my breathing. My right foot was placed on the firstmark and my left foot rested behind. My eyes were focused on oneabstract point in the sky. Pierce it I built up energy Slowly, mylegs flowed in motion, like pistons waiting for full power and speedI could feel my legs churning faster, the muscles rippling momen-tarily, only to be solidified when foot and turf met like gearsHitting the second mark, I escaped from the shadow of the tree andwas bathed in sunlight. . . Left foot forward . . . javelin back,straight back, ... turn now, five steps . . . three, four stretch,the clouds, the point . . turn back, throw the hips chestout . . . explode through the javelin . . . terminate forward motion,release.
The muscles of my right leg divided in thirds just above myknee, as the full weight of any body in motion was left to itssupport. Skipping, I followed through and watched the quiveringjavelin climb as it floated in the oncoming wind. My cross swung.For a moment, it reflected the sunlight and I lost sight of the javelinThe javelin landed quickly, piercing the grounu. I heaved in exhaus-tion, and perspiration flowed from my face and hinds Before me thefield stretched and I attempted to evaluate my throw I was pleasedThe smell of honeysuckle again drifted into my senses andsomehow, I had a feeling of accomplishment I could just as easilyhave experienced had I thrown poorly
What is the main reason the writer wrote this story
A To express an athlete's feeling of failure
B To provide information about javelin throwingOTo describe how it feels to throw the javelin
D To encourage people to take up javelin throwing
' E I don't know
46 I CROSSROADS IN AMERICAN EDUCATION
A 9

Level 350 Advanced Skills and Strategies
Readers who use advanced reading skills and strategies can extend andrestructure the ideas presented in specialized and complex texts. Examplesinclude scientific materials, literary essays, historical documents, and materialssimilar to those found in professional and technical working environments. Theyare also able to understand the links between ideas even when those links are notexplicitly stated and to make appropriate generalizations even when the texts lackclear introductions or explanations. Performance at this level suggests the abilityto synthesize and learn from specialized reading materials.
Read the passage below and answer the questions based on it
In the years between 1940 and 1960, literature, the arts, andculture in general became increasingly oriented to the many In aneconomy of high productivity, deluging millions of people daily withmovies, magazines, books, and television programs, Americanculture achieved a degree of homogeneity never dreamed of beforeHowever, if such cultural homogeneity spelled loss of individualitywhich it undoubtedly didand if mass culture was often producedprimarily for profit and only secondarily for aesthetic reasons,nevertheless mass production of "art" made available to millions ofpeople what in previous times had been the privilege only of thearistocratic few Good radio and phonograph music was availablewhere there had been no music before, there were more symphonyorchestras and chamber music groups than ever, and toward the endof this period more Americans purchased tickets to classical concertsthan to baseball games Paintings and items of sculpture vere beingturned out en masse in moderately good reproductions he world'sliterature was being distributed in inexpensive paperback editions inevery bookshop, drugstore, and transportation terminal On toalanceit seemed that mass production, while it might not raise nassculture, would not destroy the growth of genuine taste either
What does the passage imply the arts were before 19407
A HomogeneousB Generally enjoyed
°Oriented to an eliteD Oriented to the average person
E I don't know
50CROSSROADS IN AMERICAN EDUCATION I 47

LEVELS OF MATHEMATICS PROFICIENCY
Level 150 Simple Arithmetic Facts
Learners at this level know some basic additional and subtraction facts, andmost can add two digit numbers without regrouping. They recognize situationsin which addition and subtraction apply. They also are developing rudimentaryclassification skilh.
Add
Which of these numbers is closest to 30?
0 20
28
0 34
0 40
3542
ANSWER 77
Level 200 Beginning Skills and Understanding
Learners at this level have considerable understanding of two-digit numbers.They can add two-digit numbers, but are still developing an ability to regroup insubtraction. They know some basic multiplication and division facts, recognizerelations among coins, can read information from charts and graphs, and usesimple measurement instruments. They are developing some reasoning skills.
Which coins are the same amount of money as a quarter?
0 2 dimes
3 nickels and I dime
0 3 dimes
0 4 nickels
0 1 don't know
48 I CROSSROADS IN AMERICAN EDUCATION

Fox
Beaver
Monkey
Sheep
Lion
Alligator
Seal
ANIMAL WEIGHTS
AllJINNI
0 10 20 30 40 50 60 70 80 90100110
Pounds
120130
Which animal is heavier than a lion:
0 Fox
Seal
0 Alligator
0 Sheep
140150160170180190 200
The animals that weigh less than 100 pounds are
0 alligator, sheep, lion
0 monkey, sheep, lion
fox, beaver, monkey
0 fox, lion, seal
Level 250 Basic Operations and Beginning Problem Solving
Learners at this level have an initial understanding of the four basic opera-tions. They are able to apply whole number addition and subtraction skills to one-step word problems and money situations. In multiplication, they can find theproduct of a two-digit and a one-digit number. They can also compare informa-tion from graphs and charts, and are developing an ability to analyze simplelogical relations.
Sam has 68 bas.:ail cards :uamta has 127 Which number sentence couldbe used to tind how many more cards Juanita has than Same
127 68 =
0 127 + = 68
0 68 = 127
0 68 + 127 = El0 1 don't know
5 2 CROSSROADS IN AMERICAN EDUCATION I 49

At the store, the price of a carton of milk is 40c. an apple is 25c, and a boxof crackers is 30e. What as the cost of an apple and a carton of milk:
0 55e
65a
0 70e
0 95e
Level 300 Moderately Complex Procedures and Reasoning
Learners at this level are developing an understanding of number systems.They can compute with decimals, simple fractions, and commonly encounteredpercents. They can identify geometric figures, measure lengths and angles, andcalculate areas of rectangles. These students are also able to interpret simpleinequalities, evaluate formulas, and solve simple linear equations. They can findaverages, make decisions on information drawn from graphs, and use logicalreasoning to solve problems. They are developing the skills it operate with signednumbers, exponents, and square roots.
Refer to the following graph. This graph shows how fara typical car travels after the brrkes are applied.
300
250
200
I 50
100
50
010 20 30 ' 40 50 60
CAR SPEED IN MILES PER HOUR
A car i; traveling 55 miles per hour About how tar will it travel afterapplying the brakes:
0 25 feet
o 200 feet
240 feet
o 350 feet
o , don't know
" ICROSSROADS IN AMERICAN EDUCATION
F-; 3

Which of the follow::!! is true about 8756 of 107
0 It is greater than 10.
It is less than 10.
0 It is equal to 10.
0 Can't tell.
0 I don't know.
Level 350 Multi-step Problem Solving and Algebra
Learners at this level can apply a range of reasoning skills to solve multi-stepproblems. They can solve routine problems involving fractions and percents,recognize properties of basic geometric figures, and work with exponents andsquare roots. They can solve a variety of two-step problems using variables,identify equivalent algebraic expressions, and solve linear equations and inequali-ties. They are developing an understanding of functions and coordinate systems.
Christine borrowed $850 for one year from the Friendly Finance CompanyIf she paid 12% simple interest on the loan, what was the total amount sherepaid
ANSWER S 952
The number of tomato plants 1t1 is twice the number of pepper plants ,piWhich equation Lest describes the sentence above:
t = 2p
0 2t = p
0 t = 2 + p
0 2 + t = p
4--x CROSSROADS IN AMERICAN EDUCATION 151

LEVELS OF SCIENCE PROFICIENCY
Level 156 Knows Everyday Science Facts
Students at this level know some general scientific facts of the type thatcould be learned from everyday experiences. They can read simple graphs, matchthe distinguishing characteristics of animals, and predict the operation offamiliar apparatus that work according to mechanical principles.
Which of the birds pictured below probably lives around ponds and eatssnails and small fish?
Heron Sparrow
OHawk
O
Sue
at the picture above John weighs 90 pounds and Sue weighs 75pounds If Sue wants to make her end of the seesaw go down, should shesit at I, or at 2, or at 3?
0 I0 2
3
52 CROSSROADS IN AMERICAN EDUCATION

Level 200 Understands Simple Scientific Principles
Students at this level are developing some understanding of ale scientificprinciples, particularly in the Life Sciences. For example, they exhibit somerudimentary knowledge of the structure and function of plants and animals.
What is the main function of the heart?
To pump the blood to all parts of the body
0 To keep a person warm m winter by beating fast
0 To store extra blood until it is needed
0 To take waste food out of the blood
Which of the following plants would probably produce flowers?
O O O
6 CROSSROADS IN AMERICAN EDUCATION
153

Level 250 Applies Basic Scier.C.,:, ...f9rmation
Students at this level can interpret data from simple tables and makeinferences about the outcomes of experimental procedures. They exhibit knowl-edge and understanding of the Life Sciences, including a familiarity with somePnects of animal behavior and of ecological relationships. These students alsodemonstrate some knowledge of basic information from the Physical Sciences.
Ten plants were placed in sandy soil and ten others were placed in claysoil. Both groups of plants were kept at room temperature, given the sameamount of water, and placed in a sunny room. This experiment tests theeffect of
0 sunlight on plant growth.
CD temperature on plant growth
different soils on plant growth
0 water on plant gruwth
Blocks A, B, and C are the same size Blocks B and C float on water BlockA sinks to the bottom Which one of the following do you know is TRUE?
Block A weighs more than block B
0 Block B weighs more than block C.
0 Block C weighs more than block A
0 Block B weighs more than block A
0 I don't know
54
I
CROSSROADS IN AMERICAN EDUCATION L7

Level 300 Analyzes Scientific Procedures and Data
Studeas at this level can evaluate the appropriateness of the design of anexperiment. They have more detail 'd scientific knowledge, and the skill to applytheir knowledge in interpreting information from text and graphs. These stu-dents also exhibit a growing understanding of principles from the PhysicalSciences.
The new product Super Plant Food has been advertised. Claims havebeen made that Super Plant Food will cause plants to grow to giant sizesDirections on the label of this new product say: "Simply add 1 teaspoon ofSuper Plant Food powder to each gallon of water used to water your seedsor growing plants Plants watered with Super Plant Food solution will growfaster and become twice as la.ge as noimal plants"
Suppose you wish to test scientifically the claims of the makers of SuperPlant Food Which of the following experiments would best test whetherSuper Plant Food helps the growth of been plants:
0 Place 1 bean seed in each of two identical pots of soil Water each potwith the same amount of Super Plant Food solution each day
O Plant 10 bean seeds in a pot of soil Water with the same amount ofSuper Plant Food solution each day.
Plant 10 bean seeds in each of two identical pots of soil Water one potwith a cup of Str,er Plant Food solution each day, and water the otherpot with a cup o. water each day
0 Place 100 bean seeds on a sponge Keep the sponge moistened withSuper Plant Food solution
III
II
iv
Time
In the population growth curve above, 1.1 which Interval is the populationin equilibrium (the death rate equal to the birth rate):
0 I
0 II
0 III
iv
Sv CROSSROADS IN AMERICAN EDUCATION 155

Level 350 Integrates Specialized Scientific Information
Students at this level can infer relationships and draw conclusions usingdetailed scientific knowledge from the Physical Sciences, particularly Chemistry.They also can apply basic principles of genetics and interpret the societal implica-tions of research in this field.
2Na +S--NalS
The mass of 1 0 mole of sodium, Na, is 23 0 grams The mass of 1 0 moleof sulfur is 32.1 grams Approximately what mass of sodium is required toreact completely with 32 1 grams of sulfur in the reaction above?
0 11 5 grams
0 23 0 grams
0 32 0 grams
46 0 grams
A female white rabbit and a male black rabbit mate and have a large num-ber of baby rabbits About half of the baby rabbits are black, and the otherhalf are white If black fur is the dominant color in rabbits, how can theappearance of white baby rabbits best be explained?
O The female rabbit has one gene for black fur and one gene for white fur
The male rabbit has one gene for black fur and one gene for white fur
O The white baby rabbits received no genes for fur color from the father
O The white baby rabbi, are result of accidental mutations
56 I CROSSROADS IN AMERICAN EDUCATION
9

;
4THE NATION'S
REPORTCARD
me.p
9086105 LL9M25. 249403. Printed in U S A
)t)