174 - green bank - national radio astronomy observatory
TRANSCRIPT

NATIONAL RADIO ASTRONOMY OBSERVATORY
GREEN BANK, WEST VIRGINIA
ELECTRONICS DIVISION INTERNAL REPORT No. 174
PRIME FOCUS EFFICIENCY, BLOCKAGE, SPILLOVER AND
SCATTERING CALCULATIONS ON THE
HP 9825A CALCULATOR
J. RICHARD FISHER
NOVEMBER 1976
NUMBER OF COPIES: 150

PRIME FOCUS EFFICIENCY, BLOCKAGE, SPILLOVERAND SCATTERING CALCULATIONS ON THE
HP 9825A CALCULATOR
J. Richard Fisher
Programs for the calculation of aperture efficiency and spillover have
been in use at NRAO for some time (Weinreb and Jansson, 1970, EDIR #93; Leonard
and Napier, 1973, EDIR #131). EDIR #93 describes a FORTRAN program which as-
sumes a clear aperture and perfect phase and computes aperture and spillover
efficiency and spillover temperature. An HP 9830A BASIC-language program which
extends the calculations to a Cassegrain system is described in EDIR #131. The
HP 9830A program adds phase efficiency, aperture blockage, aperture field dis-
tribution and radiation pattern calculations to the repertoire.
The program outlined in this report incorporates the equations set forth
in the previous reports for efficiencies and spillover but takes a different
approach to the treatment of blockage. The contribution of this program above
what has been done before is an attempt to estimate the amount of ground radia-
tion scattered into the feed by the support legs. The main purpose of this re-
port is to describe the use of the program and the geometry which applied to
blockage and scattering. This program is written in HPL for the HP 9825A com-
puting calculator with the 9862A plotter.
Some typical results for the 140-foot and 300-foot telescope are given at
the end of the report.
Efficiency and Spillover Equations
The following equations were taken from EDIR's 93 and 131 and incorporated
in the 9825A program.

Phase efficiency:
fe 0 2
0 leGT(55 e i4) tan (0/2) de
00
Taper efficiency:2
11 = 32 (F/D)(GO
j
G(0) sin 0 de
Spillover efficiency:
0
f °O
G(0) sin 0 de
G(0) sin 0 dO
2
laTC-5-j tan (0/2) de-10
np = O0 2
VETT) tan (0/2) de0
Spillover temperature:
G(0) sin 0 de
T
S
= T
G
fir G(0) sin 0 de
0
Taper efficiency with blockage:
eoy(e) )167;55 tan (0/2) de
11TB
= 32 (F/D)
J100G(0) sin 0 de
0
3
where 0 = feed look angle from antenna axis.
G(0) = power pattern of feed.
= focal length.
= diameter of dish.
GO
•
semiangle of dish.
feed phase pattern.
TG
•
effective ground temperature (assumed to be 250 K).
y(0) = fraction of aperture annulus in direction 0 not blocked
by feed support.
Linear interpolations are used between input data points and numerical in-
tegrations are performed in one degree steps. Data points should be no father
apart than 100 to minimize interpolation errors.
Feed Support Geometry
Figure 1 gives the details of the antenna structure model and the notation
used herein. This model is somewhat more complicated than is needed for aper-
ture blockage corrections (see EDIR #131), but the detail is needed for scattered
ground radiation computations.
From the principle of reciprocity we can estimate the contribution of scat-
tered ground radiation to the system temperature by assuming that a ray emitted
by the feed is scattered isotropically where it strikes the feed supports. At
the telescope zenith position the fraction of the scattered radiation striking
the ground is the solid angle between the horizon and the dish edge divided by
47 steradians. Ideally, the diffraction pattern of the support structure should
be known, but this would make the problem intractable. An added simplification
is made by assuming that the scattering point is on the telescope axis at

height H so that is not a function of azimuth. For relatively narrow feed
leg angles this will not cause much error in the solid angle calculation.
For blockage and scattering computation the feed radiation pattern is
divided into five sectors. Between 0 = 0 and 0H all of the radiation is blocked
and scattered by the feed support house (or ring). From OH to Oc radiation is
scattered above the rim of the dish. From 0 through 0B to 0
A all of the blocked
energy can only "see" the cold sky so is not included in the ground scatter inte-
gration. Between 0A and 0
0 the scatter points can again see the ground, but here
the supports are between the feed and the dish surface.
A simplified picture of the feed radiation pattern sectors included in the
ground scatter integral is shown in Figure 2. In sector 2 the support leg di-
mension of importance is its vertically projected width. In sector 3 the leg
width as seen from the feed is needed. If the leg is a cylinder these dimensions
are the same, but on the 300-foot telescope the support cross sections are trape-
zoids with the small side inward. From the feed the 4-foot inner side subtends
a larger angle than the 7-foot top side, but the vertically projected width is
7 feet. The program provides for the input of both widths.
The feed house can be any shape, but for this purpose it is assumed to be
circular in cross section. The projected area, A, is input to the program, then
0 = tan-1 (lAhr/F)
where F is the focal length. Taking the house to be at the focal point the
angle subtended by the ground is
= 90° - 00
5
and the ground solid angle divided by 4ff is
cos e0
2
The fraction of energy scattered to the ground by the feed house is then
r ekpH
G(0) sin 0 de
SH
G(0) sin 0 de
In the region between e11 and OA the fraction of energy blocked by the
supports at a given 0 is
Nw' (1 - ye))
( 2 sin 0 )2TIT
1 + cos 0
where w' is the vertically projected leg width, and N is the number of legs.
The fraction of power scattered to the ground from all legs in region 2 of
Figure 2 is then
5
reB
' (1 - 1 t (0)) Ti t G() 0 de
r7
I G(0) sin 0 de
where
sin F
2
tan -1 (2H /D)
Hk
= cg- (x 0/tan (3
2F sin 0 1 + cos 6
k = focus to inside leg horizontal distance.
= (D/2) tan 0 0 = height of focus above the rim,
0 0 = 2 tan-1 (D/4F),
D = dish diameter, and
= angle of the support from the axis.
The portion of the taper efficiency integral between O H and 0B is
Au(OH to 0 /3 ) = y(0) 16-- -) tan (0/2) de
In the sector between 0B and 0 0 the fraction of energy blocked or scattered
by the support is
(1 - 1(0)) = NO360°
where
(1) = 2 tan-1 (w/2d)/sin 0
d = gsin 0 + cos 0/tan (0 - Oh and
effective width of support as seen from the feed.
The fraction of radiation scattered to the ground between 6
A and 0 0 is
reop(0) (1 - y(0)) G(0) sin 0 dO
OA
G(0) sin 0 de

2Au(OH to OB ) + Au(OB to 00
nTB
= 32 (F/D)2jr00
G(0) sin 0 dO
0
where
p (0 ) =sin
2
tan-1 (2H/D), and
7
= ,z- d cos
The portion of the taper efficiency integral between O B and 00
is
oo
Au(e 13 to 0 0 ) = 1(0) iG(0) tan (0/2) dO
The total taper efficiency with blockage is then
and the increment to the system temperature from scattered ground radiation is
Ts = T
G (S
H + S + S)
The printed output of the program separates this quantity into its components
as P[1] = TGSH , P[2] = TG
S
V and P[3] = TS.
The various pertinent angles are calculated as follows:
c = tan-1 [x'/(F — Ex'2)]
x' = tan 13 +
4F 2 D tan 00
0 tan-1 (tan + ,4, AX

An iterative approached is used to get a good approximation to 0B
:
X = F tan +
h = E X2
X
•
X - h tan P.
• E X2
0 -• tan' [/(F - h)].
Using the Program
This program is stored on the NRAO GB#1 tape in files 4 and 5 of track O.
File 4 contains all of the data input code and does the unblocked aperture calcu-
lations. If blockage effects are opted for, file 5 is automatically called and
run. The following steps can be used as a guide in using the program.
1. Insert GB11 cassette after calculator has been turned on.
2. Execute "ldp 4".
3. Displayed will be "F/D?". Type in focal ratio (e.g., .423) and hit
"Continue".
4. Displayed will be "# of Legs?". If i blockage is not of interest type
"0" and "Continue" and go to step 11.
5. Displayed will be "Diam.?". Type in dish diameter and "Continue".
Any units are acceptable, but you must use the same units in the fol-
lowing steps.
6. Displayed will be "Feed House Area?". If the projected dimensions of
the feed house are, say, 10 ft by 20 ft type in "200" "Continue".
7. Displayed will be "Proj. Leg Width: From Feed?". Type apparent width
of support leg as seen from feed, e.g., "4" (ft) "Continue" for the
300-ft. A special fudge for the 300-ft has been coded into the pro-
gram (lines 24-27 of file 5) to account for the fact that the feed
supports on this telescope increase in width near the feed house.
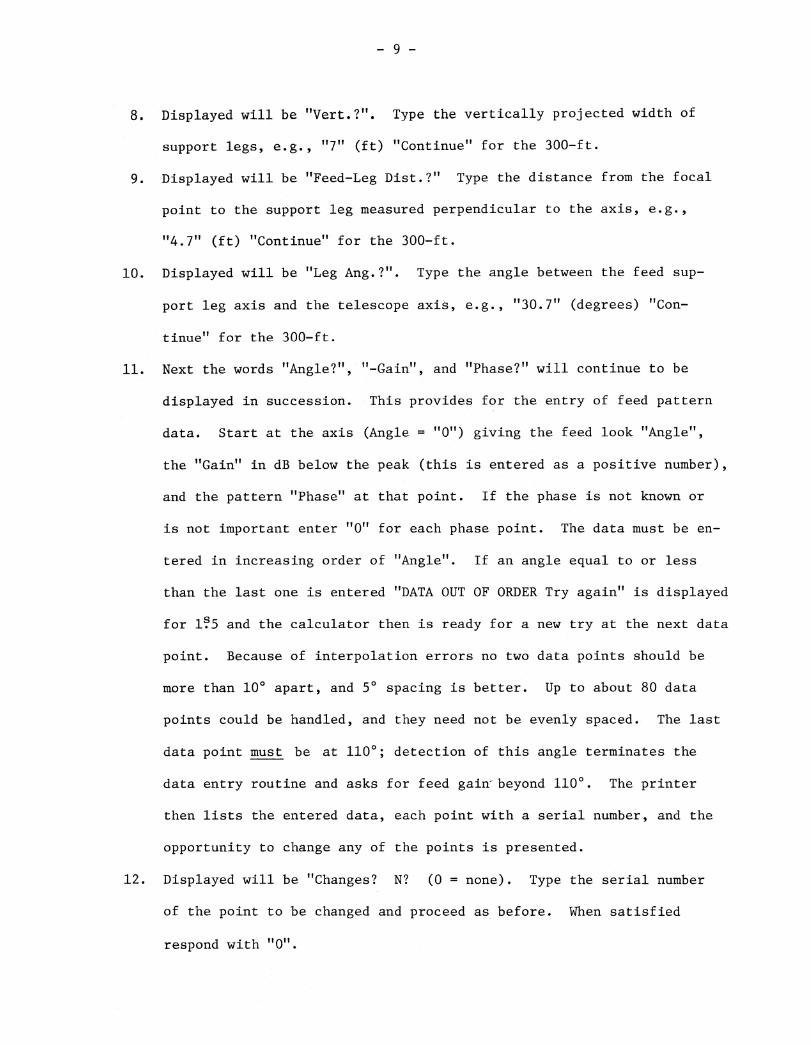
9
. Displayed will be "Vert.?". Type the vertically projected width of
support legs, e.g., 117" (ft) "Continue" for the 300-ft.
9. Displayed will be "Feed-Leg Dist.?" Type the distance from the focal
point to the support leg measured perpendicular to the axis, e.g.,
"4.7" (ft) "Continue" for the 300-ft.
10. Displayed will be "Leg Ang.?". Type the angle between the feed sup-
port leg axis and the telescope axis, e.g., "30.7" (degrees) "Con-
tinue" for the 300-ft.
11. Next the words "Angle?", "-Gain", and "Phase?" will continue to be
displayed in succession. This provides for the entry of feed pattern
data. Start at the axis (Angle = "0") giving the feed look "Angle",
the "Gain" in dB below the peak (this is entered as a positive number),
and the pattern "Phase" at that point. If the phase is not known or
is not important enter "0" for each phase point. The data must be en-
tered in increasing order of "Angle". If an angle equal to or less
than the last one is entered "DATA OUT OF ORDER Try again" is displayed
for 1_5 and the calculator then is ready for a new try at the next data
point. Because of interpolation errors no two data points should be
more than 10° apart, and 5° spacing is better. Up to about 80 data
points could be handled, and they need not be evenly spaced. The last
data point must be at 110°; detection of this angle terminates the
data entry routine and asks for feed gain-beyond 110°. The printer
then lists the entered data, each point with a serial number, and the
opportunity to change any of the points is presented.
12. Displayed will be "Changes? N? (0 = none). Type the serial number
of the point to be changed and proceed as before. When satisfied
respond with "0".

- 10 -
13. Displayed will be "Set up plotter". Turn the plotter on, remove the
pen cap, and align an appropriate piece of paper. Set up the lower
left and upper right points with the plotter buttons and potentiometers.
Hit "Continue". Axes will be drawn and labeled to display the entered
feed pattern, etc. See Figure 3. If no plot is desired type "psc 0",
"Execute" under keyboard mode, and respond with the "stop" key to steps
14-17.
14. Displayed will be "Label, then hit stop". The plotter is then in type-
writer mode and any identification information can be put on one line of
the plot. Steps 15-17 will call for some label information in addition.
To get out of typewriter mode in each case hit the "Stop" key.
15. Displayed will be "Freq.?". Type the pattern measurement frequency and
key "Stop".
16. Displayed will be "Pol.?". Type the pattern polarization and key "Stop".
17. Displayed will be "Plane?". Type the pattern measurement plane, and
key "Stop".
18. After the calculations and plot are completed and blockage effects have
been requested "Which telescope?" will be displayed. The telescope
identification can be typed onto the plot. Hit "Stop" to move the pen
off the plot area and end the program.
The various calculated parameters are recorded on the strip printer as
shown with the program listing, and most are also put on the plot. The phase
efficiency is calculated for five points on a focus curve separated by A/4 in
case the phase pattern was taken with the feed phase center longitudnally off-
set from the rotation axis. Less than about 1% error would be obtained by simply

taking the highest of the five values, provided, of course, that the phase center
was not offset by more than 5X/8.
The spillover temperature with blockage takes into account the fact that
some of the spillover radiation is rescattered or blocked by the feed support
legs. P[1], P[2], and P[3] are the feed house, dish to sky, and feed to dish
scattered ground radiation temperatures, respectively. The total of the three
is the increment to the system temperature due to feed support structure
scattering. Calculation time without blockage is about 20 s and with blockage
is about 30 s total.
300-ft and 140-ft Parameters and Results
Feed support leg dimensions for input to blockage calculations are given
in Table 1.
Table 1: Program Input Dimensions.
140' 300'
F/D .429 .424
Number of legs ................... 4 2
Diameter ......................... 140 ft 300 ft
Feed House Area .................. 80 ft2 162 ft 2
Projected Leg Width: From Feed .. 1.25 ft 4 ft
Vertical ......................... 1.25 ft 7 ft
Feed-Leg Distribution 4.4 ft 4.7 ft
Leg Angle ........................ 34.7° 30.7°
Qualitative differences between the 140-ft and 300-ft are illustrated with a
typical feed pattern at the end of the program listing. Except for a slight
difference due to different focal ratios the unblocked results are the same for
both telescopes.

- 12-
With blockage, however, the 300-ft is about 11% less efficient. One compara-
tive measurement made at 21 cm on the two instruments gave a difference of about
6% at 21 cm. A small reduction of about 1 K in spillover temperature due to
ground shielding by the supports is seen. The largest contribution to scattered
ground radiation is due to the feed house (P[1] = 1.27 K) on the 140-ft, while
the large angle subtended by the feed legs in region 3 (Figure 2) proves the
dominant factor on the 300-ft (P[3] = 3.96 K). The total scattering contribution
is 3.7 K on the 140-ft and 5.6 K on the 300-ft so the difference between the two
telescopes is relatively minor.
The basic assumption of isotropic scattering by the support legs must be
kept in mind when interpreting the latter quantities, but these calculations
probably give a reasonable estimate of the size of the effect. Also, geometrical
dimensions have been used for the support structure. A slight improvement in the
blockage calculations might be made by using the electromagnetic scattering
cross sections.

FOCA
LPO
INT
RAY
PATH , •
%
.11■
••.1
11
••
I
•
41■
1111•01111•1111.
FIG
URE 1
. FEED
SU
PPO
RT L
EG
S

FIG
URE 2
. AREAS O
F IN
TEREST I
N G
RO
UN
D R
AD
IATIO
N S
CATTERIN
G I
NTEG
RALS
.

20HO
EVGO
100
-100 -
BO
-60
-HO
-20
DIS
H E
DG
E' CM
C.F
. TH
RU
PO
RT
-20
FRER. 3.
120
POL.
CIR
C.
PLAN
E: E
-10
14/0
SLO
CKRE
ETAPE
R E
FF.=
0.7
07SP
ILLO
VER
EFF
.= 0
.97B
SPIL
LOVER
TEM
P.=
5.3
-30 W
ITH
&O
CO
EE
TAPE
R E
FF.=
0.5
90SP
ILLO
VER
TEM
P.=
4.3
SCATT
ERED
TEM
P.=
4.4
ON
TH
E 30
0 FT
.
FIGURE 3. EXAMPLE OUTPUT PLOT.
THIS PLOT DOES NOT CORRESPOND TO DATA AT THE END OF THE PROGRAM LISTING.

•••••
4. 0•••• ••
then stop-iiPtyl,....3 El
• PitG 5 1
; o rt o
:3 p jt.5 2
P 1 tnext
:3 5• =
bY -1
.3 Plbl
37: foto 10
38: PiI
next9 :t c,
4: ; +4 1 2 ::•:: 4
...I
,••
(j-1)4r...jflnext
d 1:71 fc rto -40
t :3 . :3 5 ...I 5 1; next jV. c ci
fri
t 5; .
i i.
"er.1":entn Past 110
" 5▪ t "Gain Ph"
f2.0505f5.15f4.0f o r t o
ri
•••••
171.7•••
+
I= a
TABLE 2
20: 2no":1:04r.4
2aTnL.25/(Dr:
"Set UPP.Otter";StP
23 axe:E . 05 405$ 1 0510
2 ..4t! p it -705-205
F::: "Labe.L5then hit StOP";PtYP
Plt -705; 1.) " r e
7 ! " Fre.stor...";ptYp
28 :: . p it .770,-245"Pol. "I
PtYP2 S4 .. "
1=1b1. PIrE
";dsP "Plans/
File 4
d i!.1 F:3-.1 , CE1P1
-.1 5 01.5:5P1:335c:i q... :: 14 E tI: 17 el 5 E 5 5 2.! .1
Er
e n P1: 3"..1 5"# of Le" N
i = 5 t c,nl"
E• fl " Diao.?Feed
e o. " Fi " P r o j.L. E r j dtF1ro•i
eriP " r t ?
i st.?"51_5"Le9" 5 B
"n1":for 1=1`.:.5
snt15 5
[ I :I 5 " P o. " 5
1 7 " h " ; e :**‘:CI
none)"5je = ; t 0
1 9: ent "An.91e?"5 rj5 "-Gain?" 5
GET] "Phase'?" F
0 I: ; .1,: to "oh"
44: F.) I t •-- 0 E.28 p -1151;Ibi"dish ed.ge"
45 : Pit -0 E5 F
C. 5 1 ill Pit -0E5] F
- 1 2 5 24i: : P 1 t [: 5] -
1.2.1 t ULJ] !!J. 2 5
47: = ; 4 4 EC ; 2 4 0 1"...
; .* ; t 0
::1* u 5 0 t n [ 11
:I 4 F E 2 :I; F [ D F E 1
50: atn(F(A/.1.0/F' :I 1 :1
51 ; toni:B TE ::1 + 4
3o. n I: 0 [ E
% 4: n F E:I 13 1
E 11. “I" + L..2 4
O. t X ./ 17: E.1.
• 1 0 1: 3atn(T+L/F:2:
1 0 Fi 5
0tO
1 ./ r1.1 r I)
68: GEI71(1-Y)++ [:
69: next8 9 .* f" r
!j*0-

.1 • f
pr t. "
1 . - i 1 , 1: r
• 1."
[
n:-.;
.1:.
pr
11 .
I: : •:' 1.
UE3
- SP1
1. ..... C19t.. l a e
P
0
n E.
20.7. : •
Z.•::, r.i+
r
04D 1.r.
...111. • .111,
I = 1 tO
1, 11
::... 6
PL.I.
•
**[•
-V)SY
[ L. L
0
• r.
:I+
'D O +, •
**".. >=0[Fi-J1
•••:. :•••:4
E I. :I
Table 2 (continued):File 5
76: ( rj-rfls(r(i
+ r I )
77: CEI]1.1-Y)+
E I +1E I :1 'V :1 + CI C I i
Y 4 Q [
78: next j7" r ; I -
14 I ; t o +: r I :I /1: r I
1) -ri)4Y81: X4rj
: jj
4. 2
8:3: OE I 1. 1 +
Q E I +1.
▪
=D E84: GEI](1-Y)+
1. I +1:::F: -
•
; n86: fr q t 2f7.287 0 =
t - L[ I 3 ; t
89 I:3•1_11 [R [1] Z
90: for 1=1 to0 [5]
91: r + r I. :
r 1: I +1 rj. :01745:7:: 4
9:3: E I E:1
94: U[2]+Ysin(S)
9: t n S
9: 6 : 0 C- S .1 4
97: for K=1 to 598: HEK91]+Yco..... I.
! [I] +1: K -3 ) HK 1]
99 H +I I: K. -3 ) :1 4H E2]
n t
Z..-I- Y4Z;11eXt
for =1 t o
103 H [ I.(91]1'2+HEK!,2".11.2)/Z.t24H[F:

TYPICAL OUTPUT1..to +6
1-..1 4.1-1.mXtan..) 714=j1:1]if
next I32:
O r0E5]) -(2V/0).1-1.1-St2 M4V
L! ID E .3 ::1 +) E 3
34: next35: RE2.-..1 +SYXM4RE2] ;next6 2 " CI E
▪
/ ▪ R [ 2
R E Jr . r: 3-RL2])cos(r-01.5:1
[2138: CUL1:1T2/UE2]
E 1 ]39: 250P1.3]/U1.2,1
P [ 3 7is P c.P t "14 t
Blocka.ge";sPcurt 16.1,
"TaP. Eff.=I
P r t "
▪
i CR.'
r"
rp
t. " T P e r O.
ture = " RE2]45: p rt PE1]PC2] PE311"
46: fnt 1,3f5.2urt 16.1,
PE1],P1.211,PC3]fxd 3i1Pit
20,-30,14 9 b I. "with
0 b " t O. FD t-
P• f = " 10 E :I
F i t. 2 F.1 4 5
flfxd 152: lbi "sPillover tenp.=";IbiR1.2]:3 F it. 1-3 5 *- 3 E
. 5
" scattPreu tei.qp,:="
1 P. : :1 P C 1 J +PE.23A-PE3]
plt 2n,1 L
i " n F-1 e
";ds p "Whichteie c.coPe? thenstop":4Ptyp
- 1 t
.1.7.i 9 Ljq q
dsP
Table 2 (continued):
0?29
# of Les?
Ulan.1 40
80F' roj.Fron Feed?
1.25Vert.?1.25Feed-Le Dist.?
?34.7N AroI ki H
1 0. 0.2 .. O...3 20 1.0 0
5 4.0 6 50 10.0 .0-
1 5.0 08 .10 0....9 80 25.0
1 0 30.0 0001 0 38 . . 0 0,
B
rEff.=0.975
Phase :ff.=
Te p erature = 6.0
With Blocka9e
c;
.1" enPerature = 5.3P 1::
. 1.3 .
300'
D?424
•••
afq.
Feeo HOUSE Area..?1 62
t-Frof . 1 Feed?
14/0 Blockae
Uf. = 0.730
Eff.=0.971;Phase Eff.=
Spill r
"i. 1...! .
p l , rknep . E f.=0.5 5
..........., :1, 1 p erature = 4
::1