1772 ieee transactions on information forensics and
TRANSCRIPT

1772 IEEE TRANSACTIONS ON INFORMATION FORENSICS AND SECURITY, VOL. 12, NO. 8, AUGUST 2017
DAPASA: Detecting Android Piggybacked AppsThrough Sensitive Subgraph Analysis
Ming Fan, Jun Liu, Wei Wang, Haifei Li, Zhenzhou Tian, and Ting Liu
Abstract— With the exponential growth of smartphone adop-tion, malware attacks on smartphones have resulted in seriousthreats to users, especially those on popular platforms, such asAndroid. Most Android malware is generated by piggybackingmalicious payloads into benign applications (apps), which arecalled piggybacked apps. In this paper, we propose DAPASA,an approach to detect Android piggybacked apps throughsensitive subgraph analysis. Two assumptions are established toreflect the different invocation patterns of sensitive APIs in theinjected malicious payloads (rider) of a piggybacked app and inits host app (carrier). With these two assumptions, DAPASA gen-erates a sensitive subgraph (SSG) to profile the most suspiciousbehavior of an app. Five features are constructed from SSG todepict the invocation patterns. The five features are fed into themachine learning algorithms to detect whether the app is piggy-backed or benign. DAPASA is evaluated on a large real-worlddata set consisting of 2551 piggybacked apps and 44 921 popularbenign apps. Extensive evaluation results demonstrate that theproposed approach exhibits an impressive detection performancecompared with that of three baseline approaches even withonly five numeric features. Furthermore, the proposed approachcan complement permission-based approaches and API-basedapproaches with the combination of our five features from anew perspective of the invocation structure.
Index Terms— Piggybacked apps, sensitive API, sensitive sub-graph, malware detection, static analysis.
Manuscript received September 24, 2016; revised February 16, 2017;accepted March 16, 2017. Date of publication March 27, 2017; dateof current version May 8, 2017. This work was supported in part bythe National Key Research and Development Program of China underGrant 2016YFB1000903, in part by the National Natural Science Founda-tion of China under Grant 91418205, Grant 61472318, Grant 61532015,Grant 61532004, Grant 61672419, and Grant 61632015, in part by theFok Ying-Tong Education Foundation under Grant 151067, in part by theMinistry of Education Innovation Research Team under Grant IRT13035,in part by the Fundamental Research Funds for the Central Universities, andin part by the Shenzhen City Science and Technology Research and Devel-opment Fund under Grant JCYJ20150630115257892. The associate editorcoordinating the review of this manuscript and approving it for publication wasProf. Husrev Taha Sencar. (Corresponding author: Ting Liu.)
M. Fan, J. Liu, and T. Liu are with MOEKLINNS, Department of Com-puter Science and Technology, Xi’an Jiaotong University, Xi’an 710049,China (e-mail: [email protected]; [email protected];[email protected]).
W. Wang is with the Beijing Key Laboratory of Security and Privacyin Intelligent Transportation, Beijing Jiaotong University, Beijing 100044,China (e-mail: [email protected]).
H. Li is with the Department of Computer Science, Union University,Jackson, TN 38305 USA (e-mail: [email protected]).
Z. Tian is with the School of Computer Science and Technology, Xi’anUniversity of Posts and Telecommunications, Xi’an 710049, China (e-mail:[email protected]).
Color versions of one or more of the figures in this paper are availableonline at http://ieeexplore.ieee.org.
Digital Object Identifier 10.1109/TIFS.2017.2687880
I. INTRODUCTION
A. Background
ANDROID smartphones have recently gained much pop-ularity. Many Android application (app) markets such as
Google Play1 and Anzhi Market2 have been set up, whereusers can download various apps. The Android platform hasbecome a major target of malware. As reported in a recentstudy conducted by Qihoo,3 about 37,000 Android malwareattacks were detected daily in the first quarter of 2016.
According to Zhou and Jiang [1], piggybacking is one ofthe most common techniques utilized by malware authors topiggyback malicious payloads on popular apps to producemalware. About 86% of their collected 1,260 samples werepiggybacked versions of legitimate apps with malicious pay-loads. The malware created through piggybacking is called apiggybacked app [2], [3]. A piggybacked app has two mainparts, namely, the original benign code and the injected mali-cious payloads. Following the conventions described in [2],we use the term carrier to refer to the former and the termrider to refer to the latter.
Developing new malware from scratch is labor intensive, butmalware authors can easily add a specific rider into variouscarriers through piggybacking techniques to quickly produceand distribute a large number of piggybacked apps [4]–[7]. Forexample, members of the notorious malware family Geinimiusually repackage themselves into various legitimate gameapps, steal personal information and send it to a remoteserver. Typically, malware authors download paid apps fromthe official market, disassemble them, add malicious payloads,reassemble and submit the “new” apps to the official or alter-native Android markets for free. The new piggybacked appswould entice smartphone users to download and install.
With the inclusion of the new rider code, piggybackedapps pose significant security threats, and effective tech-niques to detect them are necessary. Many research proto-types have been implemented to detect malware. The mainchallenge for current approaches is to fight against mal-ware variants and zero-day malware. Current commercialanti-virus systems and signature-based approaches [8]–[11],which look for specific patterns in the bytecode, areeffective in identifying known malware relying on sig-natures. However, they are easily evaded by bytecode-level transformation attacks [12]. Therefore, many other
1http://play.google.com/store2http://www.anzhi.com3http://zt.360.cn/report/
1556-6013 © 2017 IEEE. Personal use is permitted, but republication/redistribution requires IEEE permission.See http://www.ieee.org/publications_standards/publications/rights/index.html for more information.

FAN et al.: DAPASA: DETECTING ANDROID PIGGYBACKED APPS THROUGH SENSITIVE SUBGRAPH ANALYSIS 1773
approaches [13]–[17] based on machine learning have beendeveloped. These approaches extract features from app behav-iors (e.g., permission request and API calls) and apply machinelearning algorithms to perform binary classification. Althoughthese machine learning approaches obtain high detection accu-racy, they extract features solely from external symptoms anddo not seek for an accurate and complete interpretation of appbehavior [18].
B. Overview of the Proposed ApproachIn this work, we detect Android piggybacked apps by uti-
lizing the distinguishable invocation patterns of sensitive APIsbetween the rider and carrier. Sensitive APIs are governedby permissions for apps to access sensitive information (e.g.,the user’s phone number or location) or to perform sensitivetasks (e.g., change the WIFI state, send messages). It is worthnoting that sensitive APIs constitute only a small portion ofthe whole Android APIs and they cannot be easily obfuscatedby existing techniques whereas the names of user-definedfunctions are usually obfuscated as a, b or c.
To further understand the distinguishable invocation pat-terns, we establish two assumptions based on an empiricalanalysis of piggybacked apps.
Assumption 1: To perform its malicious task, the riderinvokes more sensitive APIs than the carrier does.
Assumption 2: Generally, in the rider, the cohesion of sen-sitive APIs, which is measured by calling distances, is higherthan that in the carrier.
By exploiting the two assumptions, we develop DAPASA,an approach to detect Android piggybacked apps throughsensitive subgraph analysis. DAPASA consists of the followingfour steps.
(1) DAPASA starts with the construction of a staticfunction-call graph of a given app. It is a directed graph wherenodes denote the functions invoked by the app and edgesdenote the actual calls among these functions.
(2) To differentiate the maliciousness of different sensitiveAPIs, DAPASA calculates the sensitivity coefficients for eachsensitive API through a term frequency-inverse documentfrequency (TF-IDF)-like measure.
(3) DAPASA divides the static function-call graph into a setof subgraphs heuristically with sensitive API nodes and theirnearby normal nodes. The subgraph with the highest sensitivitycoefficient is selected as the sensitive subgraph to profile themost suspicious behavior of the given app.
(4) Five features are constructed from the sensitive sub-graph. The feature sensitivity coefficient of the sensitive sub-graph (scg) and the feature total sensitive distance of thesensitive subgraph (tsd) are used to measure the maliciousnessand cohesion of sensitive APIs, respectively. In addition, threedifferent types of sensitive motifs are exploited to furtherdepict in a fine-grained manner the local invocation patternsof sensitive APIs. Finally, the five features are fed intomachine learning algorithms to detect whether the app ispiggybacked or benign.
DAPASA is evaluated on a large real-world dataset con-sisting of 2,551 piggybacked apps and 44,921 popular benignapps. The evaluation results show that DAPASA achieves good
performance with a true positive rate of 95% and a falsepositive rate of 0.7%.
C. Contributions and OrganizationThe main contributions of this work are listed below.(i) We propose two assumptions about the different invoca-
tion patterns of sensitive APIs between the rider andcarrier in Android piggybacked apps. By exploitingthese two assumptions, we construct a sensitive subgraphto represent the entire call graph and profile the mostsuspicious behavior of the given app.
(ii) We propose five numeric features from the generatedsensitive subgraph. These features can not only be usedfor independent detection of piggybacked apps, butalso have the ability to complement permission-basedapproaches and API-based approaches in the perfor-mance and explanation of the detection results.
(iii) We propose a TF-IDF-like measure to calculate thesensitivity coefficient of each sensitive API based on theidea of TF-IDF. It can reduce the interference factors ofthe sensitive APIs that frequently occur in both benignand malicious apps.
The remainder of this paper is organized as follows.Section II discusses related work. Section III introducestwo important notations employed in this work. DAPASA isdescribed in Section IV and evaluated in Section V. Section VIpresents in-depth discussions. The conclusions and future workare followed in Section VII.
II. RELATED WORK
With the recent surge in research interest in the area ofAndroid device security, a large number studies focusing onmobile malware detection have been conducted. The currentwork is related to three types of work described below.
A. Piggybacked App Detection
Several studies have provided approaches for piggybackedapp detection; they can be categorized in two main groups,namely, static and dynamic analysis approaches.
Static analysis approaches investigate software properties byinspecting apps and their source code. The study most relatedto ours is the research conducted by Zhou and Jiang [1].In their study, they classified the ways through whichmalware is installed in smartphones into three main cate-gories: piggybacking, update attack, and drive-by download;piggybacking is the most common one. Zhou et al. pro-posed a fast and scalable approach called PiggyApp [2].PiggyApp decouples the app code into primary and non-primary modules and extracts certain features, such as per-missions and APIs used in the primary module, to detectpiggybacked apps. Guan et al. [6] proposed a semantic-basedapproach called RepDetector, which first extracts input-outputstates of core functions in the app, and then compares thesimilarities between functions and apps. RepDetector is robustagainst obfuscation attacks relying on the semantic analysis ofeach app instead of syntax characteristics. Zhang et al. [5]proposed ViewDroid, which first designs a new birthmark

1774 IEEE TRANSACTIONS ON INFORMATION FORENSICS AND SECURITY, VOL. 12, NO. 8, AUGUST 2017
(feature view graph) for Android apps based on the usersnavigation behavior across app views, and then calculatesthe similarity of the constructed birthmarks. ViewDroid isalso robust against the obfuscation attacks since its high-level abstracted birthmark is not affected by low-level codeobfuscation techniques. Both RepDetector and ViewDroideffectively detect app clones by finding similar pairs in theapp market based on the proposed robust features.
Unlike static ones, dynamic analysis approaches typicallyextract run-time app information by instrumenting the Androidframework. Lin et al. [19] proposed SCSdroid, which extractsthe system call sequence of an app at run-time and uses thecommon subsequences to detect piggybacked apps in the samefamily. Isohara et al. [20] proposed kernel-based behavioranalysis, which generates a set of regular expression rules fromthe names and parameters of system calls of training malware,and detects the new apps by mapping their system calls andparameters with the rules. However, most dynamic analysisapproaches require a representative set of execution paths andit is difficult to ensure that all the execution paths of the appscan be covered.
Different from these studies, our approach focuses onthe finding of different invocation patterns of sensitiveAPIs between the rider and the carrier instead of pair-wiseapps similarity calculation in the market. The current workhelps improve our understanding of the malicious behaviorsof piggybacked apps.
B. Structure-Based Analysis
The proposed approach is also related to approaches that arebased on structure analysis of function-call graphs [21] or pro-gram dependence graphs [22]–[25].
Given that the identification of similarities in graphs isdifficult, Gascon et al. [21] proposed an approach for malwaredetection based on efficient embedding of function-call graphswith an explicit feature map. Zhang et al. [18] implemented aprototype system called DroidSIFT, which classifies Androidmalware based on a weighted contextual API dependencygraph. Chen et al. [26] proposed MassVet, which modelsthe app’s user interfaces as a directed graph, in which eachnode is a view within an app, and each edge describes thenavigation (triggered by the input events) relations among thenodes. With similar view structures in different apps, MassVetcan effectively identify piggybacked apps.
Several of these approaches analyze the entire graph, whichmight cause high overheads. In our work, only the sensitiveAPI nodes and their nearby normal nodes are analyzed.Moreover, a sensitive subgraph is utilized to represent theentire function-call graph to reduce computational complexity.
C. Measurement of Features
An increasing number of features, such as permissions andAPIs, are proposed for malware detection with machine learn-ing algorithms. Different features have different contributionsto the identification of maliciousness; therefore, measurementof features is significant.
For permission-based features, Moonsamy et al. [27] rankedthe frequency of required and used permissions in mali-cious and benign datasets, respectively, to determine themost popular permission patterns requested by malicious andbenign apps. Wang et al. [13] proposed three approaches,namely, mutual information, CorrCoef, and T-test, to rankpermissions for improved understanding of their risk rele-vance. APIs are another widely used type of features forthe detection of Android malware. Aafer et al. [28] iden-tified the top APIs that invoked in Android malware, andanalyzed the difference in usage between malware and benignapps. Suarez-Tangil et al. [11] proposed an approach tomeasure how important a code block is to a malware familywith TF-IDF.
Unlike these studies, the current work presents aTF-IDF-like approach to measure the sensitivity coefficientof each sensitive API by considering not only its frequencyof occurrence in malicious and benign apps, but also itscorresponding category information.
III. BASIC NOTATIONS
Two basic notations, static function-call graph and sensitivesubgraph, are introduced in this section.
Given that limited resources impede monitoring apps at run-time, DAPASA performs a static analysis. It transforms thegiven app into a graph representation, namely, static function-call graph [21], [29], which contains the necessary structureinformation to profile the behaviors of an app.
Definition 1 (StaticFunction-CallGraph (SFCG)): SFCG isconstructed with the call relations among the functions cap-tured from Android apk files (the format of installation fileof Android apps) with disassembling tools such as apktool.4
It can be represented as a directed graph SFCG = (V , E).• V = {vi |1 ≤ i ≤ n} denotes the set of functions invoked
by a given app, in which each vi ∈ V corresponds to afunction name.
• E ⊆ V × V denotes the set of function-calls, in whichedge (vi , v j ) ∈ E indicates one call exists from callerfunction vi to callee function v j .
Intuitively, we provide the SFCG of a sample (referredto corner23 for short) in the Geinimi family. As illustratedin Fig. 1, SFCG contains thousands of function nodes. To iden-tify malware, we merely focus on the sensitive APIs governedby Android permissions. Sensitive APIs constitute only a smallportion of the total APIs; however, through them, malware canaccess sensitive information or perform sensitive tasks.
To obtain the set of sensitive APIs, we use the tool Pscout5
proposed by Au et al. [30]. A total of 680 sensitive APIsare provided by Pscout and can be presented as S AS ={s1, s2, ..., si , si+1, ..., s680}, where si is the name of a sen-sitive API. Fifteen sensitive APIs are used by corner23.They are denoted by red nodes with function name labelsin Fig. 1. Through these APIs, corner23 obtains many sen-sitive resources. For example, it can access the last knownlocation via getLastKnownLocation() and can send messagesvia sendTextMessage().
4https://ibotpeaches.github.io/Apktool/5http://pscout.csl.toronto.edu/
FAN et al.: DAPASA: DETECTING ANDROID PIGGYBACKED APPS THROUGH SENSITIVE SUBGRAPH ANALYSIS 1775
Fig. 1. The SFCG of corner23.
The contribution of each sensitive API to detecting mali-cious apps should differ. Thus, a sensitivity coefficient iscalculated for each sensitive API in a specific category basedon a TF-IDF-like measure to denote its malware detectionability, as described in Section IV-A.
In our two proposed assumptions, for piggybacked apps,the rider and carrier have different invocation patterns ofsensitive APIs, which can be used as the basis of ourapproach. However, analyzing the entire graph is neithereffective (the malicious part is buried in the app code) norefficient (too many nodes and edges to analyze). Mininga representative invocation structure from SFCG can helpunderstand the most suspicious behavior of the given app. Forpiggybacked apps, the maliciousness and cohesion of sensitiveAPIs in the invocation structures mined from them wouldbe higher than those in benign apps. Therefore, with theidentified sensitive APIs, SFCG can be divided into a setof subgraphs with the sensitive API nodes and their nearbynormal nodes. The process of constructing the subgraphset (SGS) is described in Section IV-B. The subgraph withthe highest sensitivity coefficient is selected as the indicatorof the maliciousness of the app. We call this subgraph thesensitive subgraph.
Definition 2 (Sensitive Subgraph (SSG)): SSG is a sub-graph in SGS, and it has the highest sensitivity coefficientamong all subgraphs in SGS. It can be obtained with Eqs. i (1)and (2).
SSG = argmaxSG j∈SGS
(scg(SG j )), (1)
scg(SG j ) =∑
si∈S NG(SG j )
scs(si ), 1 ≤ j ≤ m. (2)
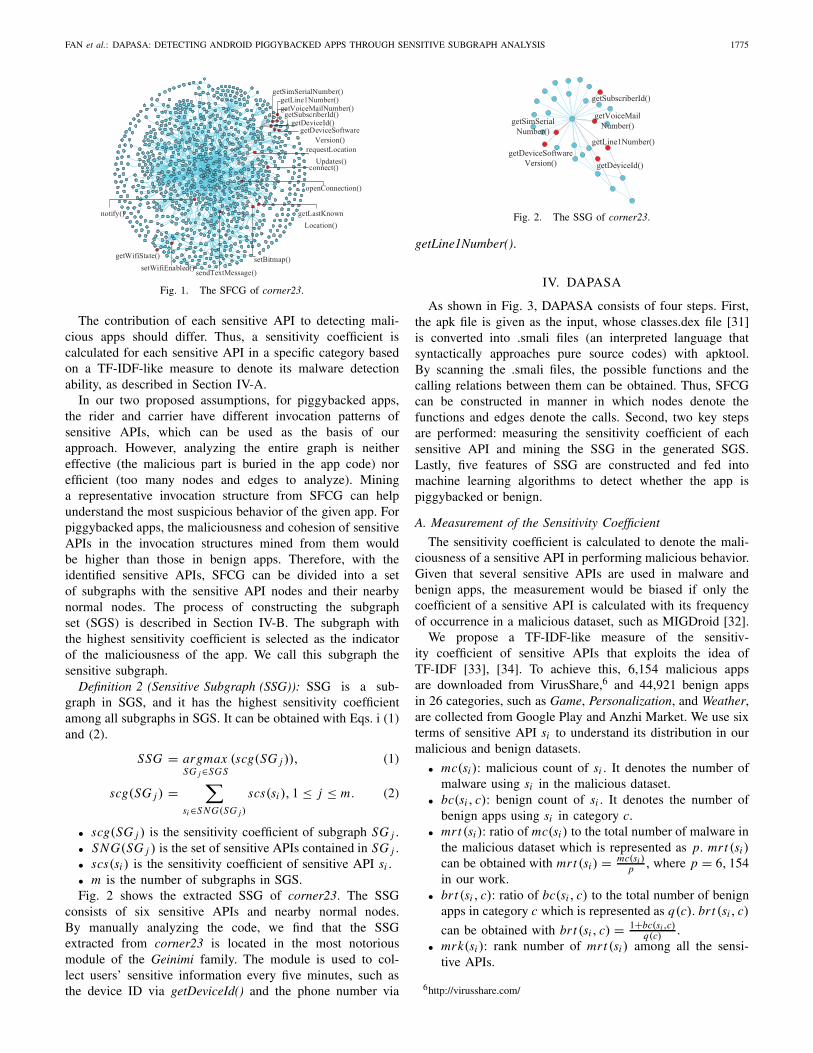
• scg(SG j ) is the sensitivity coefficient of subgraph SG j .• SNG(SG j ) is the set of sensitive APIs contained in SG j .• scs(si ) is the sensitivity coefficient of sensitive API si .• m is the number of subgraphs in SGS.Fig. 2 shows the extracted SSG of corner23. The SSG
consists of six sensitive APIs and nearby normal nodes.By manually analyzing the code, we find that the SSGextracted from corner23 is located in the most notoriousmodule of the Geinimi family. The module is used to col-lect users’ sensitive information every five minutes, such asthe device ID via getDeviceId() and the phone number via
Fig. 2. The SSG of corner23.
getLine1Number().
IV. DAPASA
As shown in Fig. 3, DAPASA consists of four steps. First,the apk file is given as the input, whose classes.dex file [31]is converted into .smali files (an interpreted language thatsyntactically approaches pure source codes) with apktool.By scanning the .smali files, the possible functions and thecalling relations between them can be obtained. Thus, SFCGcan be constructed in manner in which nodes denote thefunctions and edges denote the calls. Second, two key stepsare performed: measuring the sensitivity coefficient of eachsensitive API and mining the SSG in the generated SGS.Lastly, five features of SSG are constructed and fed intomachine learning algorithms to detect whether the app ispiggybacked or benign.
A. Measurement of the Sensitivity Coefficient
The sensitivity coefficient is calculated to denote the mali-ciousness of a sensitive API in performing malicious behavior.Given that several sensitive APIs are used in malware andbenign apps, the measurement would be biased if only thecoefficient of a sensitive API is calculated with its frequencyof occurrence in a malicious dataset, such as MIGDroid [32].
We propose a TF-IDF-like measure of the sensitiv-ity coefficient of sensitive APIs that exploits the idea ofTF-IDF [33], [34]. To achieve this, 6,154 malicious appsare downloaded from VirusShare,6 and 44,921 benign appsin 26 categories, such as Game, Personalization, and Weather,are collected from Google Play and Anzhi Market. We use sixterms of sensitive API si to understand its distribution in ourmalicious and benign datasets.
• mc(si ): malicious count of si . It denotes the number ofmalware using si in the malicious dataset.
• bc(si , c): benign count of si . It denotes the number ofbenign apps using si in category c.
• mrt (si ): ratio of mc(si ) to the total number of malware inthe malicious dataset which is represented as p. mrt (si )can be obtained with mrt (si ) = mc(si )
p , where p = 6, 154in our work.
• brt (si , c): ratio of bc(si , c) to the total number of benignapps in category c which is represented as q(c). brt (si , c)
can be obtained with brt (si , c) = 1+bc(si ,c)q(c) .
• mrk(si ): rank number of mrt (si ) among all the sensi-tive APIs.
6http://virusshare.com/

1776 IEEE TRANSACTIONS ON INFORMATION FORENSICS AND SECURITY, VOL. 12, NO. 8, AUGUST 2017
Fig. 3. Overview of DAPASA.
TABLE I
SEVERAL SENSITIVE APIS’ mrts , mrks , AND THEIR CORRESPONDING brts ,brks , scss ,AND ranks IN Game, Personalization AND Weather CATEGORIES
• brk(si , c): rank number of brt (si , c) among all the sen-sitive APIs in category c.
TABLE I shows several sensitive APIs with high mrts andtheir corresponding brts and brks in Game, Personalization,and Weather categories, respectively. We obtain three obser-vations from TABLE I.
(1) Several sensitive APIs are used frequently in the mali-cious and benign datasets. For example, openConnection() andconnect() are used to connect the Internet. Regardless of thecategory, their brks are very small.
(2) Several sensitive APIs are used more frequently in themalicious dataset than in the benign dataset. An example issendTextMessage(). Its mrk is 2, but its brks in all the threecategories exceed 50.
(3) The brts and brks differ in the different categories.For example, in categories Game and Weather, nearly allsensitive APIs have higher brts than those in the categoryPersonalization, which have lower than 0.3.
With these three observations, we consider the followingquestions to better understand our measurement of the sensi-tivity coefficient.
Q 1: If the mrt of a sensitive API is high, will its sensitivitycoefficient also be high?
As illustrated in TABLE I, the mrts of openConnection()and getSimSerialNumber() (used to obtain the user’s SIMnumber) are 0.479 and 0.285, respectively. Does this meanopenConnection() has a higher sensitivity coefficient thangetSimSerialNumber()?
The answer is no. As noted in the first two observations,openConnection() is widely used in both malicious and benignapps because nowadays, most apps need to connect to theInternet. Meanwhile, getSimSerialNumber() occurs much morefrequently in malicious apps than in benign apps because
benign apps rarely need to have the SIM number. Intuitively,getSimSerialNumber() should have a higher sensitivity coeffi-cient than openConnection().
Q 2: Does an app that obtains location information byusing getLastKnownLocation() appear suspicious?
The answer is also no. As noted in the last observation,the brts in the three categories are different. For apps inthe Personalization category, the API’s brt is only 0.079 andwould reveal the location information of users. In the Weathercategory, the API’s brt is 0.595, and the API is generallyused to obtain weather information in the location of users.According to this discussion, the category information can beexploited in our measurement of sensitivity coefficients. Forthe same sensitive API, its sensitivity coefficients in differentcategories would be different.
In text mining literature, TF-IDF is a numerical statisticintended to reflect how discriminating a term is to a documentin a corpus. By utilizing the idea of TF-IDF for reference,we make the scs of a sensitive API be in positive correlationwith its mrt and in negative correlation with its brt . Forsensitive API si of an app that belongs to a specific category c,its sensitivity coefficient scs(si ) is calculated with Eq. (3).
scs(si ) = mrt (si )× log1
brt (si , c). (3)
For example, the Game category has 3,505 apps, in which2,801 apps use openConnection() and 174 apps use get-SimSerialNumber(). Their scss are 0.047 and 0.371, respec-tively. Apparently, getSimSerialNumber() is more sensitivethan openConnection().
TABLE I also shows the scss and ranks of the sen-sitive APIs. sendTextMessage() has the highest scs in allthe three categories, given that it is frequently used by

FAN et al.: DAPASA: DETECTING ANDROID PIGGYBACKED APPS THROUGH SENSITIVE SUBGRAPH ANALYSIS 1777
malicious apps and rarely used by benign apps. This conditionreflects the common attack of stealthily sending SMS mes-sages to premium numbers, thus allowing the owner ofthese numbers to earn money from the victims. Combinedwith sending SMS messages, the sensitive APIs utilized toobtain the user’s privacy information, such as phone num-ber (getLine1Number()) and SIM number (getSimSerialNum-ber()), would also have high coefficients. Unlike the previousones, sensitive APIs used frequently both in malicious andbenign apps, such as openConnection(), are assigned with lowcoefficients.
The results show that the sensitivity coefficients calculatedby the TF-IDF-like measure can reflect the maliciousness ofsensitive APIs in different categories.
However, there are some apps that have no category infor-mation, especially the malware samples downloaded fromVirusShare. We calculate the sensitivity coefficients of sen-sitive APIs for such apps as:
scs(si ) = mrt (si )× log1
brt (si ). (4)
brt (si ) denotes the percent of apps in all benign apps usingthe sensitive API si and it is obtained with Eq. (5), in whichC denotes the set of all the benign categories.
brt (si ) = 1+∑c∈C bc(si , c)∑c∈C q(c)
(5)
B. Generation of SSGBased on our proposed assumptions, SFCG is divided into
a set of subgraphs, and the subgraph that has the highestsensitivity coefficient is selected as SSG, which can profile thesuspicious behavior of the given app. SSG can be generatedthrough the following steps.
Algorithm 1 Generate SGSInput: SFCG = {V , E}; SSOutput: SGS1: SGS ← ∅;2: for each vi ∈ SS do3: Vi ← ∅;4: for each vk ∈ V do5: if dis(vk, vi ) <= 2 then6: Vi = Vi ∪ {vk};7: end if8: end for9: RemoveLibNodes(Vi);
10: Ei = Vi × Vi ∩ E ;11: SGi ← (Vi , Ei );12: SGS = SGS ∪ {SGi };13: end for14: return SGS
1) Generation of SGS : Algorithm 1 highlights the stepof generating the subgraph set with the input of the SFCGof a given app and its invoked sensitive API node set (SS).For each sensitive API node, a subgraph is constructed withits neighbor nodes in the SFCG. The function dis(vk, vi )
returns the shortest path length from node vk to node vi .When calculating the distance between two nodes, the SFCGis regarded as an undirected graph. In our work, the averageshortest path length of the SFCGs is generally from 3 to 5.When constructing subgraphs, the distances of normal nodesto the sensitive API node are less than or equal to 2.
The function RemoveLibNodes(Vi) in algorithm 1 is uti-lized to remove the nodes invoked by third-party libraries forVi via a library list. In our approach, the potential suspiciouslibraries might cause false positives since such libraries containsimilar invocation patterns of sensitive APIs as the maliciouspayloads do. Therefore, we leverage the result provided bythe tool LibD7 proposed by Li et al. [35], which identified60,729 different third-party libraries with a manually validatedaccuracy rate. More precisely, we first add the package namesof the identified libraries into a list. We then remove themethod nodes that are invoked by such packages accordingto the list from the function call graph. The test resultshows that about 81.8% apps in our dataset contain the third-party libraries such as com/google/ads, com/facebook andcom/umeng. After this procedure, we can effectively filter thepotential suspicious libraries.
Algorithm 2 Select SSG from SGSInput: SGSOutput: SSG1: while ∃SGi , SG j ∈ SGS, i = j and SNG(SGi ) ∩
SNG(SG j ) = ∅ do2: Vj = Vi ∪ Vj , E j = Ei ∪ E j
3: SGS = SGS \ {SGi }4: end while5: SSG = argmax SG j∈SGS (scg(SG j ))6: return SSG
2) Selection of SSG: Algorithm 2 highlights the step ofselecting SSG from the SGS generated by algorithm 1. In SGS,two subgraphs that contain the same sensitive API nodes mayexist. Algorithm 2 merges the subgraphs with the conditionSNG(SGi )∩SNG(SG j ) = ∅ to ensure that one sensitive APInode can only occur in one subgraph. Afterward, the sensitivitycoefficient for each SG j ∈ SGS is calculated with Eq. (2), andthe subgraph with highest coefficient among all the subgraphsin SGS is selected as the SSG with Eq. (1). If no sensitiveAPI call exists in a given app, then it does not have an SSG.
C. Construction of Features
By employing SSG, we construct a set of features from SSGbased on our two proposed assumptions. The features fall intothree fields to distinguish piggybacked apps from benign appsin different aspects. We randomly select 500 piggybacked appsand 500 benign apps, respectively, to determine if our featuresare able to distinguish them.
1) Sensitivity Coefficient of SSG—scg(SSG): scg(SSG) isdefined to denote the maliciousness of SSG. As mentioned inassumption I, to perform its malicious task, the rider would
7https://github.com/IIE-LibD/libd

1778 IEEE TRANSACTIONS ON INFORMATION FORENSICS AND SECURITY, VOL. 12, NO. 8, AUGUST 2017
Fig. 4. scg(SSG) for benign and piggybacked apps.
Fig. 5. tsd(SSG) for benign and piggybacked apps.
make many sensitive API calls; thus, the maliciousness of SSGof piggybacked app is higher than that of benign app.
As illustrated in Fig. 4, the median of the coefficients ofpiggybacked apps is 1.341, which is higher than that of benignapps (0.444) because they have fewer invocations of sensitiveAPIs. This result proves that our assumption I is tenable.Obviously, scg(SSG) can effectively distinguish piggybackedapps from benign ones.
2) Total Sensitive Distance of SSG—tsd(SSG): As men-tioned in assumption II, the cohesion of sensitive APIs inthe rider is generally higher than that in the carrier. We usetsd(SSG) to denote the cohesion of sensitive API nodes inSSG, which is measured by the calling distances betweensensitive API nodes.
tsd(SSG) can be obtained with Eqs. (6) and (7), in whichsd(si ) denotes the average distance of sensitive API node si
to the other sensitive API nodes in SSG.
tsd(SSG) =∑
si∈S NG(SSG)
sd(si ). (6)
sd(si ) = 1
|SNG(SSG)| − 1∗
∑
s j ∈ SNG(SSG)j = i
1
dis(si , s j ).
(7)
As illustrated in Fig. 5, the median of tsd(SSG) of pig-gybacked apps is 1.875, which is even higher than the upperquartile of benign apps. This result indicates that assumption IIis tenable. Thus, the feature tsd(SSG) is effective to distin-guish piggybacked apps from benign ones.
3) Total Number of Sensitive Motif Instances in SSG—tnsm(SSG): We have attempted to obtain a more detailed
Fig. 6. An instance of sensitive motif-2 in SSG.
TABLE II
THREE-NODE MOTIFS AND THEIR CORRESPONDING SENSITIVE MOTIFS
view of the invocation patterns between sensitive API nodesand normal nodes.
An invocation pattern reflects one malicious behaviorof an app, which can be depicted by a motif. Net-work motifs are defined in terms of connectivity-patternsthat appear much more often than expected from purechance [36]–[38]. Specifically, they occur at a higher fre-quency than what is expected from an ensemble of ran-domized graphs with an identical degree structure. Giventhat no mutual edges exist in SSG, four three-node motifsare present. The four three-node motifs and their averageZ-score values in our samples are shown in TABLE II withthe help of gtrieScanner.8 The higher the Z-score is, the moresignificant the three-node pattern is as a motif. The Z-scoreof motif-4 is less than 0, which means that it rarely occurs inSSG. Thus, it is ignored in our computation.
Sensitive motifs are defined in this work as significantmotifs that contain at least one sensitive API node. They areshown in TABLE II. For example, the instance of sensitivemotif-2 in Fig. 6 denotes the malicious behavior of obtainingthe unique subscriber ID number by using an object rally/eand invoking the getSubscriberId() API.
Under assumptions I and II, because of the larger numberand higher cohesion of sensitive APIs in the rider than inthe carrier, more instances of sensitive motif-1 occur in SSG.In addition, in the rider, the sensitive APIs are invoked bymany user-defined threatening functions, which cause manyinstances of sensitive motif-2 and sensitive motif-3. We usetnsmk(SSG), k = 1, 2, 3, to denote the total number of sensi-tive motif-k instances in SSG. Fig. 7 illustrates tnsmk(SSG)for our benign and piggybacked apps, which demonstrates thatfor all the three types of sensitive motifs, the correspondingtnsmk(SSG) for piggybacked apps are higher than those forbenign apps.
8http://www.dcc.fc.up.pt/gtries/

FAN et al.: DAPASA: DETECTING ANDROID PIGGYBACKED APPS THROUGH SENSITIVE SUBGRAPH ANALYSIS 1779
Fig. 7. tnsm(SSG) for benign and piggybacked apps.
The features constructed from the SSGs of piggybackedapps differ significantly from those of benign apps. DAPASAembeds the above five features into a feature space to auto-matically classify novel apps as piggybacked apps or not. Thefeature space is represented as follows:
⎛
⎜⎜⎜⎜⎜⎜⎜⎜⎝
scg(SSG)
tsd(SSG)
tnsm1(SSG)
tnsm2(SSG)
tnsm3(SSG)
⎞
⎟⎟⎟⎟⎟⎟⎟⎟⎠
. (8)
V. EVALUATION
To evaluate the effectiveness of our approach, we first intro-duce the dataset and the metrics (see Section V-A for details).We then evaluate our approach based on the dataset andcompare the result with that of three baseline approaches (seeSection V-B for details). Afterward, we evaluate the run-timeoverhead of our approach and compare it with that of thebaseline approaches (see Section V-C for details). Finally,we analyze the effectiveness of our features and how theycomplement the permission-based approaches and API-basedapproahces (see Section V-D for details).
A. Dataset and Metrics
Our approach is evaluated on a large real-world dataset thatconsists of Android benign apps and piggybacked apps.
The set of piggybacked apps contains 2,551 apps in 15 fam-ilies. All the apps are piggybacked apps according to [1].A total of 1,062 of the apps are downloaded from the AndroidMalware Genome Project,9 which is widely used as a bench-mark dataset for malware detection. We collect 1,489 morepiggybacked apps that belong to the piggybacked families [1]from VirusShare based on our malware familial classificationapproach that classifies each unlabeled malware into its cor-responding family with a 96% classification accuracy [39].An overview of the piggybacked apps in our dataset is givenin TABLE III.
The set of benign apps consists of two parts; one is collectedfrom Google Play and contains 12,001 apps in 16 categories,and the other one is collected from Anzhi Market and contains
9http://www.malgenomeproject.org/
TABLE III
DESCRIPTIONS OF THE PIGGYBACKED APPS
TABLE IV
DESCRIPTIONS OF THE BENIGN APPS
32,920 apps in 10 categories. TABLE IV shows the descrip-tions of apps from Google Play and Anzhi Market. All theapps have been checked by VirusTotal10 to ensure that eachof them is benign. Over 50 anti-virus softwares programs,such as AVG,11 ESET-NOD3212 and Norton,13 are available inVirusTotal; these software programs are based on a signaturedatabase. They are useful for known malware but less effectivefor unknown ones.
The metrics used to measure our detection results are shownin TABLE V. The goal of any malware detection researchis to achieve a high value for TPR and a low value forFPR. We conduct the experiments in over 4,000 lines of
10https://www.virustotal.com/en/11http://free.avg.com/us-en/homepage12https://www.eset.com/us/13http://cn.norton.com/

1780 IEEE TRANSACTIONS ON INFORMATION FORENSICS AND SECURITY, VOL. 12, NO. 8, AUGUST 2017
TABLE V
DESCRIPTIONS OF THE USED METRICS
Fig. 8. Detection performances with four different classifiers
Java code on a quad-core 3.20 GHz PC operating on Ubuntu14.04 (64 bit) with 16 GB RAM and 1 TB hard disk.
B. Piggybacked App Detection
1) Detection Performances With Four Classifiers: Four dif-ferent classifiers are employed to evaluate our approach. Theseclassifiers are Random Forest [40], Decision Tree (C4.5) [41],k-NN(k=1) [42] and PART [43]. All the 49,921 benign appsand 2,551 piggybacked apps are mixed together. After theextraction and analysis of the SSGs with our approach, eachapp is first represented as a feature vector with Eq. (8). Thenthe classification labels of the known piggybacked apps intraining dataset are attached with 1 while the labels of theknown benign apps are attached with -1 so that the classifierscan understand the discrepancy between piggybacked apps andbenign apps. Once the feature vectors with classification labelsfor the training samples are generated, four classifiers canbe trained with the four machine learning algorithms. Afterthat, the feature vector of a new sample without classificationlabel is fed into the classifiers to detect whether it is piggy-backed or benign. Our dataset is evaluated via tenfold crossvalidation.
The detection performances are shown in Fig. 8. TheReceiver Operating Characteristic (ROC) curves indicate thatall four classifiers can achieve a high value for TPR and alow value for FPR. In particular, Random Forest performs
Fig. 9. Detection performances for DAPASA and three baseline approaches
best among four classifiers. With Random Forest, the detectionperformance yields a TPR of 0.950 at an FPR of 0.007, andthe AUC is 0.99.
Two main reasons explain the best performance of RandomForest in the current study’s dataset. First, Random Forestis an ensemble classifier that uses out-of-bag errors as anestimate of the generalization error to improve its performance,whereas the other three classifiers are base classifiers. Second,as introduced in the work of Breiman [40], Random Forestdoes not result in overfitting as more trees are added butproduces a limited value of the generalization error. Therefore,in this work, Random Forest is selected as the classifier insubsequent experiments.
2) Comparison With Three Baseline Approaches: In thissection, DAPASA is compared with three baseline approachesproposed by Wang et al. [13], Aafer et al. [28], andGascon et al. [21]. The descriptions of the three baselineapproaches are shown below.
• Wang et al. [13] proposed an approach for malwaredetection based on requested permissions, which aresecurity-aware features that restrict the access of apps tothe core facilities of devices.
• Aafer et al. [28] proposed an approach for malware detec-tion based on APIs that have more fine-grained featuresthan permissions because each permission governs severalAPIs. Furthermore, API level information conveys moresubstantial semantics about the app than permissions [28].
• Gascon et al. [21] proposed an approach for malwaredetection based on embedded call graphs, which modelthe structural composition of a code and reflect the logicsemantics of the app. The call graph is more robustagainst certain obfuscation strategies than the requestedpermissions and APIs.
The detection performances of our approach and thethree baseline approaches in our dataset are illustratedin Fig. 9. The AUC values of our approach and API-based approach [28] are both 0.99, which indicates that ourapproach has a similar detection performance with API-basedapproach. Moreover, our approach outperforms the other twobaseline approaches [13], [21], of which the AUC valuesare 0.983 and 0.986, respectively. In particular, our approach

FAN et al.: DAPASA: DETECTING ANDROID PIGGYBACKED APPS THROUGH SENSITIVE SUBGRAPH ANALYSIS 1781
Fig. 10. Run-time overhead of DAPASA
contains only five numeric features; the three approaches use88 permission-based features, 680 API-based features, and32,768 graph-based features, respectively.
C. Evaluation of Run-Time Overhead
1) Run-Time Overhead of DAPASA: Our approach consistsof three main procedures when analyzing a new app.
(i) De-compilation. The app file is disassembled to gener-ate the Dalvik code, and SFCG is constructed.
(ii) Graph analysis. The SFCG is divided into a set ofsubgraphs, and the SSG with the highest sensitivitycoefficient is selected.
(iii) Feature construction. Five numeric features are con-structed from the generated SSG.
The run-time overheads of the three main procedures and theirtotal run-time overhead are illustrated in Fig. 10, in which thex-axis shows the sample size (number of nodes) per app inour dataset and the y-axis shows the run-time overhead of thecorresponding procedure.
Four observations are obtained from Fig. 10.(1) The run-time overhead of de-compilation is not related
to the sample size. This result is consistent with the truth thatthe complexity of de-compilation has a positive correlationwith the logic of the source code for a given app rather thanthe sample size [44].
(2) The run-time overhead of graph analysis roughly scaleslinearly with the sample size. As introduced in algorithm 1,the time complexity is O(m×n), where m denotes the numberof invoked sensitive API nodes and n denotes the size of thecall graph.
(3) The run-time overhead of feature construction is notrelated to the sample size. In our approach, SSG is generatedto represent the entire call graph. Therefore, the run-timeoverhead of feature construction scales with the size of SSGrather than the size of the call graph.
(4) The total run-time overhead of analyzing a given app haspositive relation with sample size. It is mainly affected by theprocedure of de-compilation with a relatively small samplesize. With the increase in sample size, the total run-timeoverhead is mainly affected by the graph analysis procedure.On the average, less than 16s is consumed to complete theanalysis for most apps in our dataset.
2) Comparison of Run-Time Overhead: The comparison ofthe run-time overheads of our approach and the three baselineapproaches is illustrated in Fig. 11. DAPASA consumes 1.8s
Fig. 11. Comparison results of run-time overhead.
and 4.6s less time than the approach of Gascon et al. [21]in graph analysis and feature construction, respectively. Thesmaller run-time overhead is due to the following reasons.
First, for the graph analysis procedure, in the approach ofGascon et al. [21], a hash-value is calculated for each node inthe graph. Analyzing all the nodes consumes more time thanour approach does because our approach only focuses on theanalysis of sensitive API nodes.
Second, for the feature construction procedure, in theapproach of Gascon et al. [21], a feature map is inspired bygraph kernels, which allows for embedding call graphs in avector space. However, our approach generates SSG to repre-sent the entire call graph. Hence, computational complexity isreduced effectively.
The approaches of Wang et al. [13] and Aafer et al. [28]do not have the graph analysis procedure. Therefore, they arefaster than DAPASA and the approach of Gascon et al. [21],which are based on the analysis of the call graph. Permission-based and API-based approaches usually produce only a smallrun-time overhead, and they are efficient and scalable. How-ever, the features of permissions and APIs are coarse-grained.For example, malicious apps may request the exact samepermissions that are requested by benign apps. By contrast,our features are more fine-grained and thus provide betterexplanation of the results, as discussed in Section VI-B.
D. Analysis of Features
1) Effectiveness of Each Feature: In this work, we proposethree different types of features, namely, scg, tsd , and tnsm(consisting of tnsm1, tnsm2 and tnsm3) to distinguish the

1782 IEEE TRANSACTIONS ON INFORMATION FORENSICS AND SECURITY, VOL. 12, NO. 8, AUGUST 2017
Fig. 12. Detection performances with different feature combination.
Fig. 13. Detection performances for different feature sets.
SSGs existed in piggybacked apps from those existed in benignapps. As mentioned in Section IV-C, each of them has a fairlygood ability to detect piggybacked apps in different aspects,such as maliciousness and cohesion of sensitive APIs. In thissection, different combinations of features are evaluated in thesame dataset to determine whether each feature is significantfor the detection performance. Only scg is initially used as ourfeature. Afterward, the other two types of features are addedto our feature space successively.
As illustrated in Fig. 12, the ROC curves with differentfeature combinations show that every additional feature effec-tively improves the detection performance. The TPR reachesnearly 0.85 with an 0.01 FPR using only scg, and it isimproved by 0.05 and 0.061 by adding tsd and tnsm. Theimprovements of TPRs demonstrate that each proposed featurehas significant contributions for piggybacked app detection.
2) Complementation of Existing Approaches: Five featuresare constructed from a new perspective of the invocationstructure. We combine five features with the permission-basedfeatures proposed by Wang et al. [13] and API-based featuresproposed by Asfer et al. [28], respectively. The detectionperformances of the four different feature sets are illustratedin Fig. 13, in which P denotes the 88 permissions, S denotesthe 680 APIs, D+P denotes the combination of our fivefeatures with permissions, and D+S denotes the combinationof our five features with APIs.
As illustrated in Fig. 13, after the combination of ourfive features, the detection performances measured with ROCcurves are improved. When the FPR is set to 0.01, the TPRswith feature D+P and with feature D+S are improved by
TABLE VI
FEATURE RANKING OF OUR FEATURES IN THE FEATUREFEATURE D+P AND FEATURE D+S
0.085 and 0.008 compared with those with only feature Pand feature S, respectively. Therefore, our approach cancomplement the permission-based approaches and API-basedapproaches from a new perspective of the invocation structure.
Moreover, the contribution degrees of our five features areevaluated with three different types of metrics, namely, chi-square statistic [45], OneR classifier [46], and informationgain [47], for the two combined feature sets (D+P and D+S)containing 93 and 685 features, respectively. The result inTABLE VI shows that the five features have better contribu-tions to classify piggybacked apps than most permission-basedand API-based features especially scg and tnsm1.
VI. DISCUSSIONS
In this section, we first inspect the reasons of the generationof false positive instances. Then we introduce the explanationsof the detection results for DAPASA. After that, the abilityof DAPASA to fight against obfuscation attacks is discussed.Finally, we present some limitations of our approach.
A. Discussions on TPR and FPR
The experiments show that our approach achieves goodperformance with a TPR of 95% and an FPR of 0.7%. Manualanalysis of the SSGs of our piggybacked apps shows thatDAPASA achieves a 100% detection rate in several families,such as Geinimi. The invocation patterns of sensitive APIs inthe generated SSGs for all the Geinimi samples are exactlythe same as that of the example introduced in Section III.However, the TPRs are lower than 92% in several families,such as DroidKungFu, which is considered one of the mostsophisticated Android malware. DroidKungFu is piggybackedand distributed in the forms of legitimate apps. Severalsamples implement their malicious functionalities in nativecode (instead of the previously Davilk code based on Java).In this work, the native code is ignored, thus resulting in thelower accuracy for such families.
Although the TPR is impressive, the FPR is 0.7% whichmeans that there are still more than 300 benign apps areincorrectly classified as piggybacked apps. Two main reasonsexplain the incorrectly classified samples. First, with the helpof LibD [35] we are able to remove most nodes invokedby third-party libraries with a string matching algorithm.However, covering all third-party libraries is still a challenge.Second, several extreme cases which are repackaged withonly one sensitive API (sendTextMessage) exist. When theseextreme cases are placed in the training dataset, the benign

FAN et al.: DAPASA: DETECTING ANDROID PIGGYBACKED APPS THROUGH SENSITIVE SUBGRAPH ANALYSIS 1783
apps using the same sensitive API as the extreme casesdo might be classified as piggybacked. For example, in theGame category, sending a message to a premium number toraise money is a legitimate payment method for unlockinggame features, and the apps that use this method would beincorrectly classified.
B. Explanations of the Detection ResultsExplanations of the detection results are also important
for malware detection. For permission-based and API-basedapproaches, even if they usually produce only a small run-time overhead and are efficient and scalable, they do notprovide reasonable explanations for their decisions and arethus unclear to the practitioner. However, DAPASA is basedon the analysis of the call graph that contains the neces-sary structure information to depict app behaviors. DAPASAconstructs an SSG to profile the most suspicious behaviorof the given app, thus providing better explanations of thedecisions than permission-based and API-based approaches.For example, in our experiments, all the SSGs constructedfrom the 94 members of the Geinimi family are nearly thesame. More concretely, we introduce the meanings of ourconstructed features for SSG in Fig. 2.
scg = 1.404. Six sensitive APIs are in the subgraph; threeof them (getLine1Number(), getSubscriberId(), and getSim-SerialNumber()) have high scss and low ranks, as shownin TABLE I. Its scg is much higher than the median inbenign apps, which is only 0.444 (illustrated in Fig. 4). Thedescriptions of the six invoked sensitive APIs indicate that themodule in which SSG is located is probably used to collectuser’s sensitive information.
tsd = 3. All the calling distances between sensitive APInodes are 2; this means that they are continually invoked inthe same method to collect user’s sensitive information. Thisconclusion is demonstrated in the corresponding source codeof the app.
Each sensitive motif has its own meaning. For example,the instance of sensitive motif-2 in Fig. 6 denotes the maliciousbehavior of obtaining the unique subscriber ID number byusing an object rally/e and invoking the getSubscriberId() API.In summary, the instances of sensitive motifs illustrate thedetailed invocations of sensitive APIs of an app.
C. Resilience to Obfuscation AttacksIn order to evaluate whether our approach could be robust
against obfuscation attacks mentioned in [48], we conducttwo widely used tools, Proguard14 and SandMarks15 intro-duced in [48], to obfuscate the APK samples. Proguard isable to rename the classes, fields, and methods using shortmeaningless names. SandMarks is a very comprehensive tool,which implements 39 obfuscation algorithms, such as con-stant pool reorder, reorder parameters and method merger.We then calculate the similarities of generated SSGs betweenthe original apps and obfuscated apps. The similarities arestill 1 which demonstrates that our approach is robust against
14https://www.guardsquare.com/en/proguard15http://sandmark.cs.arizona.edu/
the typical obfuscation attacks (e.g., renaming functions). Themain reason is that our approach is based on the analysisof sensitive subgraph, which does not consider the names ofmethods and parameters. However, the advanced obfuscationattacks that change the invocation relations among functionshave side effects for our approach.
D. Limitations of DAPASASimilar to any empirical approach, our approach is subject
to several limitations, which are listed below.1) Encryption and Reflection: By analyzing the call graph
of the app, our approach is resilient to typical local obfuscationtechniques [48], [49], such as renaming of the user-definedfunctions and packages, instruction reordering, and branchinversion. However, it is vulnerable to certain obfuscationtechniques, such as encryption [50], [51] and refection [12].Once the malware code is encrypted, it is difficult to obtain thesource code of the app with decompile tools and construct thecall graph. In addition, the reflection techniques can simplyhide away the edges in the call graph, such as the invokingmethod with the function getMethod(String name) where theargument name denotes the name of the callee method.
2) Sensitive APIs: Our detection of sensitive APIs relieson the mapping by PScout [30], which now, five years later,may be partially outdated. Incorrect or missing entries in themapping would make DAPASA miss or misclassify relevantapp behaviors.
VII. CONCLUSION AND FUTURE WORK
In this work, we proposed DAPASA that focuses on pig-gybacked app detection through sensitive subgraph analysis.First, two assumptions were proposed to better profile thedifferences between the rider and carrier in piggybacked appswith respect to the invocation patterns of sensitive APIs.Second, an SSG was generated for each app to profile its mostsuspicious behavior. Third, five features were constructed fromthe SSG and fed into machine learning approaches to detectpiggybacked apps.
Extensive evaluation results demonstrate that our approachachieves an impressive detection performance with only fivenumeric features which bring three advantages. First, ourapproach outperforms the state-of-the-art approaches with lessfeatures. Second, our approach provides better explanationsof detection results than permission-based approaches andAPI-based approaches. Third, our approach even complementspermission-based approaches and API-based approaches withthe combination of our features from a new perspective of theinvocation structure.
The work presented in this paper can be improved bybuilding a more detailed behavior model than SFCG. Addi-tional information, such as components of the app and type ofinvocations, would be required to help improve the detectionaccuracy of Android piggybacked apps.
REFERENCES
[1] Y. Zhou and X. Jiang, “Dissecting Android malware: Characterizationand evolution,” in Proc. 33rd IEEE Symp. Secur. Privacy (S&P),Oakland, CA, USA, May 2012, pp. 95– 109.

1784 IEEE TRANSACTIONS ON INFORMATION FORENSICS AND SECURITY, VOL. 12, NO. 8, AUGUST 2017
[2] W. Zhou, Y. Zhou, M. Grace, X. Jiang, and S. Zou, “Fast, scalable detec-tion of piggybacked mobile applications,” in Proc. 3rd ACM Conf. DataAppl. Secur. Privacy (CODASPY), San Antonio, TX, USA, Feb. 2013,pp. 185–196.
[3] G. Suarez-Tangil, J. E. Tapiador, F. Lombardi, and R. Di Pietro,“Thwarting obfuscated malware via differential fault analysis,” IEEEComput., vol. 47, no. 6, pp. 24–31, Jun. 2014.
[4] Y. Shao, X. Luo, C. Qian, P. Zhu, and L. Zhang, “Towards a scalableresource-driven approach for detecting repackaged Android applica-tions,” in Proc. 30th Annu. Comput. Secur. Appl. Conf. (ACSAC),New York, NY, USA, Dec. 2014, pp. 56–65.
[5] F. Zhang, H. Huang, S. Zhu, D. Wu, and P. Liu, “View-droid: Towards obfuscation-resilient mobile applicationrepackaging detection,” in Proc. 7th ACM Conf. Secur.Privacy Wireless Mobile Netw. (WiSec), Oxford, U.K., 2014,pp. 25–36.
[6] Q. Guan, H. Huang, W. Luo, and S. Zhu, “Semantics-based repackagingdetection for mobile apps,” in Proc. Int. Symp. Eng. Secure Softw.Syst. (ESoSS), London, U.K., Apr. 2016, pp. 89–105.
[7] H. Wang, Y. Guo, Z. Ma, and X. Chen, “Wukong: A scalable andaccurate two-phase approach to Android app clone detection,” in Proc.15th Int. Symp. Softw. Test. Anal. (ISSTA), Baltimore, MD, USA,Jul. 2015, pp. 71–82.
[8] Y. Zhou, Z. Wang, W. Zhou, and X. Jiang, “Hey, you, get off of mymarket: Detecting malicious apps in official and alternative Androidmarkets,” in Proc. 19th ISOC Netw. Distrib. Syst. Secur. Symp. (NDSS),San Diego, CA, USA, Feb. 2012, pp. 50–52.
[9] M. Grace, Y. Zhou, Q. Zhang, S. Zou, and X. Jiang, “Riskranker:Scalable and accurate zero-day Android malware detection,” in Proc.10th int. Conf. Mobile Syst. Appl. Services (MobiSys), Low Wood Bay,U.K., Jun. 2012, pp. 281–294.
[10] M. Zheng, M. Sun, and J. C. S. Lui, “Droid analytics: A signa-ture based analytic system to collect, extract, analyze and associateAndroid malware,” in Proc. 12th Int. Conf. Trust, Secur. PrivacyComput. Commun. (TrustCom), Melbourne, VIC, Australia, Jul. 2013,pp. 163–171.
[11] G. Suarez-Tangil, J. E. Tapiador, P. Peris-Lopez, and J. Blasco,“Dendroid: A text mining approach to analyzing and classifying codestructures in Android malware families,” Expert Syst. Appl., vol. 41,no. 4, pp. 1104–1117, Mar. 2014.
[12] V. Rastogi, Y. Chen, and X. Jiang, “Catch me if you can: EvaluatingAndroid anti-malware against transformation attacks,” IEEE Trans. Inf.Forensics Security, vol. 9, no. 1, pp. 99–108, Jan. 2014.
[13] W. Wang, X. Wang, D. Feng, J. Liu, Z. Han, and X. Zhang, “Exploringpermission-induced risk in Android applications for malicious appli-cation detection,” IEEE Trans. Inf. Forensics Security, vol. 9, no. 11,pp. 1869–1882, Nov. 2014.
[14] D. Arp, M. Spreitzenbarth, M. Hubner, H. Gascon, K. Rieck, andC. Siemens, “Drebin: Effective and explainable detection of Androidmalware in your pocket,” in Proc. 21st ISOC Netw. Distrib. Syst. Secur.Symp. (NDSS), San Diego, CA, USA, Feb. 2014, pp. 1–15.
[15] S. Rasthofer, S. Arzt, and E. Bodden, “A machine-learning approach forclassifying and categorizing Android sources and sinks,” in Proc. 21stISOC Netw. Distrib. Syst. Secur. Symp. (NDSS), San Diego, CA, USA,Jan. 2014, pp. 1–15.
[16] A. Gorla, I. Tavecchia, F. Gross, and A. Zeller, “Checking app behavioragainst app descriptions,” in Proc. 36th Int. Conf. Softw. Eng. (ICSE),Hyderabad, India, May 2014, pp. 1025–1035.
[17] M. Zhao, F. Ge, T. Zhang, and Z. Yuan, “Antimaldroid: an efficientSVM-based malware detection framework for Android,” in Proc. 2ndInt. Conf. Inf. Comput. Appl. (ICICA), Qinhuangdao, China, Oct. 2011,pp. 158–166.
[18] M. Zhang, Y. Duan, H. Yin, and Z. Zhao, “Semantics-aware Androidmalware classification using weighted contextual api dependencygraphs,” in Proc. 21st ACM Conf. Comput. Commun. Secur. (CCS),Scottsdale, AZ, USA, Nov. 2014, pp. 1105–1116.
[19] Y.-D. Lin, Y.-C. Lai, C.-H. Chen, and H.-C. Tsai, “IdentifyingAndroid malicious repackaged applications by thread-grained systemcall sequences,” Comput. Secur., vol. 39, pp. 340–350, Nov. 2013.
[20] T. Isohara, K. Takemori, and A. Kubota, “Kernel-based behavioranalysis for Android malware detection,” in Proc. CIS, Dec. 2011,pp. 1011–1015.
[21] H. Gascon, F. Yamaguchi, D. Arp, and K. Rieck, “Structural detectionof Android malware using embedded call graphs,” in Proc. 6th ACMWorkshop Artif. Intell. Secur. (AISec), Berlin, Germany, Nov. 2013,pp. 45–54.
[22] C. Yang, Z. Xu, G. Gu, V. Yegneswaran, and P. Porras, “Droidminer:Automated mining and characterization of fine-grained malicious behav-iors in Android applications,” in Proc. 19th Eur. Symp. Res. Comput.Secur. (ESORICS), Wroclaw, Poland, Sep. 2014, pp. 163–182.
[23] X. Sun, Y. Zhongyang, Z. Xin, B. Mao, and L. Xie, “Detecting codereuse in Android applications using component-based control flowgraph,” in Proc. 29th IFIP TC 11 Int. Conf. ICT Syst. Secur. PrivacyProtect. (SEC), Marrakech, Morocco, Jun. 2014, pp. 142–155.
[24] L. Deshotels, V. Notani, and A. Lakhotia, “Droidlegacy: Automatedfamilial classification of Android malware,” in Proc. 3rd ACM SIGPLANProgram Protect. Reverse Eng. Workshop (PPREW), San Diego, CA,USA, Jan. 2014, pp. 1–12.
[25] K. Chen, P. Liu, and Y. Zhang, “Achieving accuracy and scalabilitysimultaneously in detecting application clones on Android markets,” inProc. ICSE, May 2014, pp. 175–186.
[26] K. Chen et al., “Finding unknown malice in 10 seconds: Mass vettingfor new threats at the Google-play scale,” in Proc. 24th USENIX Secur.Symp., Washington, DC, USA, Aug. 2015, pp. 659–674.
[27] V. Moonsamy, J. Rong, and S. Liu, “Mining permission patterns forcontrasting clean and malicious Android applications,” Future Generat.Comput. Syst., vol. 36, pp. 122–132, Jul. 2014.
[28] Y. Aafer, W. Du, and H. Yin, “Droidapiminer: Mining api-level featuresfor robust malware detection in Android,” in Proc. 9th Int. ICST Conf.Secur. Privacy Commun. Netw. (SecureComm), Sydney, NSW, Australia,Sep. 2013, pp. 86–103.
[29] Y. Qu et al., “Exploring community structure of software call graph andits applications in class cohesion measurement,” J. Syst. Softw., vol. 108,pp. 193–210, Oct. 2015.
[30] K. W. Y. Au, Y. F. Zhou, Z. Huang, and D. Lie, “Pscout: Analyzing theAndroid permission specification,” in Proc. 19th ACM Conf. Comput.Commun. Secur. (CCS), Raleigh, NC, USA, Oct. 2012, pp. 217–228.
[31] Y. Zhang, X. Luo, and H. Yin, “Dexhunter: Toward extracting hiddencode from packed Android applications,” in Proc. 20th Eur. Symp. Res.Comput. Secur. (ESORICS), Vienna, Austria, Nov. 2015, pp. 293–311.
[32] W. Hu, J. Tao, X. Ma, W. Zhou, S. Zhao, and T. Han, “Migdroid:Detecting app-repackaging Android malware via method invocationgraph,” in Proc. 23rd Int. Conf. Comput. Commun. Netw. (ICCCN),Shanghai, China, 2014, pp. 1–7.
[33] H. C. Wu, R. W. P. Luk, K. F. Wong, and K. L. Kwok, “InterpretingTF-IDF term weights as making relevance decisions,” ACM Trans. Inf.Syst., vol. 26, no. 3, p. 13, Jun. 2008.
[34] A. Aizawa, “An information-theoretic perspective of TF–IDF measures,”Inf. Process. Manage., vol. 39, no. 1, pp. 45–65, 2003.
[35] M. Li et al., “Libd: Scalable and precise third-party library detectionin Android markets,” in Proc. 39th Int. Conf. Softw. Eng. (ICSE),Buenos Aires, Argentina, 2017.
[36] R. Milo, S. Shen-Orr, S. Itzkovitz, N. Kashtan, D. Chklovskii, andU. Alon, “Network motifs: Simple building blocks of complex net-works,” Science, vol. 298, no. 5594, pp. 824–827, Oct. 2002.
[37] P. Ribeiro and F. Silva, “Querying subgraph sets with g-tries,” in Proc.2nd ACM SIGMOD Workshop Databases Social Netw. (DBSocial),Scottsdale, AZ, USA, 2012, pp. 25–30.
[38] S. Wernicke and F. Rasche, “Fanmod: A tool for fast network motifdetection,” Bioinformatics, vol. 22, no. 9, pp. 1152–1153, Feb. 2006.
[39] M. Fan et al., “Frequent subgraph based familial classification ofAndroid malware,” in Proc. 27th Int. Symp. Softw. Rel. Eng. (ISSRE),Ottawa, ON, Canada, Oct. 2016, pp. 24–35.
[40] L. Breiman, “Random forests,” Mach. Learn., vol. 45, no. 1, pp. 5–32,2001.
[41] S. L. Salzberg, “C4.5: Programs for machine learning,” Mach. Learn.,vol. 16, no. 3, pp. 235–240, Sep. 1994.
[42] D. W. Aha, D. Kibler, and M. K. Albert, “Instance-based learningalgorithms,” Mach. Learn., vol. 6, no. 1, pp. 37-–66, Jan. 1991.
[43] E. Frank and I. H. Witten, “Generating accurate rule sets without globaloptimization,” in Proc. 15th Int. Conf. Mach. Learn. (ICML), Madison,WI, USA, 1998, pp. 144–151.
[44] A. Johnstone, E. Scott, and T. Womack, “What assembly languageprogrammers get up to: Control flow challenges in reverse compilation,”in Proc. 4th Eur. Conf. Softw. Maintenance Reeng. (CSMR), Zürich,Switzerland, Mar. 2000, pp. 83–92.
[45] R. L. Plackett, “Karl pearson and the chi-squared test,” Int. Statist. Rev.,vol. 51, no. 1, pp. 59–72, Apr. 1983.
[46] R. C. Holte, “Very simple classification rules perform well on mostcommonly used datasets,” Mach. Learn., vol. 11, no. 1, pp. 63–90,Apr. 1993.

FAN et al.: DAPASA: DETECTING ANDROID PIGGYBACKED APPS THROUGH SENSITIVE SUBGRAPH ANALYSIS 1785
[47] L. E. Raileanu and K. Stoffel, “Theoretical comparison between the giniindex and information gain criteria,” Ann. Math. Artif. Intell., vol. 41,no. 1, pp. 77–93, May 2004.
[48] H. Huang, S. Zhu, P. Liu, and D. Wu, “A framework for evaluatingmobile app repackaging detection algorithms,” in Proc. Int. Conf. TrustTrustworthy Comput., Jun. 2013, pp. 169–186.
[49] Z. Tian, Q. Zheng, T. Liu, M. Fan, E. Zhuang, and Z. Yang, “Softwareplagiarism detection with birthmarks based on dynamic key instructionsequences,” IEEE Trans. Softw. Eng., vol. 41, no. 12, pp. 1217–1235,Dec. 2015.
[50] L. Xue, C. Qian, and X. Luo, “Androidperf: A cross-layer profilingsystem for Android applications,” in Proc. 23rd Int. Symp. QualityService (IWQoS), Portland, OR, USA, Jun. 2015, pp. 115–124.
[51] L. Xue, X. Luo, L. Yu, S. Wang, and D. Wu, “Adaptive unpack-ing of Android apps,” in Proc. 39th Int. Conf. Softw. Eng. (ICSE),Buenos Aires, Argentina, May 2017.
Ming Fan received the B.S. degree in computer sci-ence and technology from Xi’an Jiaotong University,China, in 2013, where he is currently pursuing thePh.D. degree with the Department of Computer Sci-ence and Technology. His current research interestsinclude trustworthy software and android malwaredetection and classification.
Jun Liu received the B.S. and Ph.D. degrees in com-puter science and technology from Xi’an JiaotongUniversity, China, in 1995 and 2004, respectively.He is currently a Professor with the Department ofComputer Science and Technology, Xi’an JiaotongUniversity. He has authored over 70 research papersin various journals and conference proceedings. Hiscurrent research interests include on data miningand text mining. He was a Guest Editor of manytechnical journals, such as Information Fusion, theIEEE SYSTEMS JOURNAL, and Future Generation
Computer Systems. He also acted as a conference/workshop/track chair atnumerous conferences.
Wei Wang received the Ph.D. degree in controlscience and engineering from Xi’an Jiaotong Uni-versity, China, in 2006. He was a Post-DoctoralResearcher with the University of Trento, Italy, from2005 to 2006. He was a Post-Doctoral Researcherwith TELECOM Bretagne and with INRIA, France,from 2007 to 2008. He visited INRIA, ETH,NTNU, CNR, and New York University Polytechnic.He is currently an Associate Professor with theSchool of Computer and Information Technology,Beijing Jiaotong University, China. He has authored
or coauthored over 50 peer-reviewed papers in various journals and interna-tional conferences. His current research interests include mobile, computer,and network security. He was a European ERCIM Fellow with the NorwegianUniversity of Science and Technology, Norway, and the InterdisciplinaryCentre for Security, Reliability and Trust, University of Luxembourg, from2009 to 2011. He is an Associate Editor of the Frontiers of Computer ScienceJournal.
Haifei Li received the B.S. degree from Xi’anJiaotong University, Xi’an, China, in 1990, andthe M.S. and Ph.D. degrees from the University ofFlorida, Gainesville, FL, USA, in 1998 and 2001,respectively, all in computer science. He was aSoftware Engineer with the GeophysicalResearch Institute from 1990 to 1994.He was a Software Engineer with ChinaResources Information Technology from1994 to 1996. He was a Graduate Studentwith the University of Florida from 1996
to 2001. He was a Post-Doctoral Researcher with the IBMThomas J. Watson Research Center from 2001 to 2003. He was anAssistant Professor of Computer Science with Nyack College from 2003to 2004. He is currently an Associate Professor of Computer Science withUnion University, Jackson, TN, USA. He has balanced academic/industrialexperiences. He has authored over 30 articles in various journals andmagazines. His research interests are e-learning, database, e-commerce,automated business negotiation, and business process management.
Zhenzhou Tian received the B.S. and Ph.D. degreesin computer science and technology from Xi’an Jiao-tong University, China, in 2010 and 2016, respec-tively. He is currently a Lecturer with the Schoolof Computer Science and Technology, Xi’an Uni-versity of Posts and Telecommunications. His cur-rent research interests include trustworthy software,software plagiarism detection, and software behavioranalysis.
Ting Liu received the B.S. degree in informationengineering and the Ph.D. degree in system engi-neering from the School of Electronic and Infor-mation, Xi’an Jiaotong University, Xi’an, China,in 2003 and 2010, respectively. He is currentlyan Associate Professor with the Systems Engineer-ing Institute, Xi’an Jiaotong University. His cur-rent research interests include smart grid, networksecurity, and trustworthy software.